teleseismic p-wave traveltime residuals and deep structure of the aegean region
TRANSCRIPT

Tectonophysics, 31 (1976) 33-57 @ Elsevier Scientific Publishing Company, Amsterdam - Printed in The Netherlands
33
TELESEISMIC P-WAVE TRAVELTIME RESIDUALS AND DEEP STRUCTURE OF THE AEGEAN REGION
N.K. AGARWAL ‘, W.R. JACOBY and H. BERCKHEMER
Institute of Meteorology and Geophysics, University of Frankfurt, Frankfurt a. M. (Germany)
(Submitted August 12,
ABSTRACT
1975; accepted for publication November 3, 1975)
Agarwal, N.K., Jacoby, W.R. and Berckhemer, H., 1976. Teleseismic P-wave traveltime residuals and deep structure of the Aegean region. Tectonophysics, 31: 33-57.
Teleseismic P-wave traveltime residuals have been measured at the Greek seismic sta- tions with respect to the Herrin 68 tables. In spite of the large scatter, some insight into crustal and upper-mantle structure of the Aegean region can be gained. The average absolute residuals (observed minus Herrin traveltimes) are of the order of +2 s. The most plausible interpretation is an efficient low-velocity zone in the upper mantle. Simple estimates of densities and subsequently gravity with the aid of Birch’s law suggest that the Aegean region is underlain by hot expanded upper mantle, perhaps involving partial melting. The relative P residuals (observed minus Herrin traveltime differences between a station and Athens) are generally positive and can be interpreted with lateral variations of the LVZ or of the crust. The latter interpretation is supported in some cases by seismic refraction data. The azimuthal variation of the relative residuals at stations on the non-volcanic arc bears a distinct relation with the arc orientation. At Archangelos (Rhodes) where we “see” through the Benioff zone, the residuals from N to W are between -1 and -2 s and indicate a high-velocity slab sinking below the Aegean sea. At Vamos (Crete), Valsamata (Keph- allenia), and Joanina (Pindus Range) the largest (smallest) residuals are along directions parallel (perpendicular) to the arc. This can be interpreted by crustal thickening under the sedimentary arc and/or by velocity anisotropy with the maximum perpendicular to the arc. On the whole, our study supports the hypothesis that the Aegean region is a trench- island-arc-marginal-sea system.
INTRODUCTION
Teleseismic P-wave traveltime residuals have been determined for the Greek seismic stations with the aim of gaining insight into crustal and upper- mantle structure of the Aegean region and into the geodynamic processes at work. This area is one of the seismo-tectonically most active parts of the Alpine-Himalayan erogenic belt. It resembles the western Pacific trench-
1 Now at: Oil and Natural Gas Commission, 41 Chowringhee Road, Calcutta, India

34
island-arc-marginal-sea systems in several aspects, though it is smaller and more complex.
We have thus searched particularly for such traveltime effects as that of a high-velocity dipping slab and that of overlying low-velocity material. This search has been successful, though the data are but marginally significant. A further problem is that no unambiguous inversion to upper-mantle structure is possible. This situation requires additional constraints by other geophysical and geological data.
Traveltime residuals have been investigated in other island arcs with con- siderable success in delineating dipping high-velocity plates and overlying low-velocity bodies (Utsu and Okada, 1968; Davies and McKenzie, 1969; McKenzie and Julian, 1971; Aggarwal et al., 1972; Jacob, 1972; Solomon and Butler, 1974). It has been found that the dipping plates transmit P-waves with velocities 5-10% higher than normal upper mantle does in the same depth range, while the overlying material is characterized by velocities lower by a similar amount.
Other features which affect the traveltime residuals are: (1) regional devia- tions from standard velocity-depth functions (e.g. Kaila et al., 1969; Kebeasy, 1970; Kulhanek and Brown, 1974); (2) lateral variation of crustal structure (e.g. Press and Biehler, 1964); (3) lateral variation of the upper-mantle low- velocity layer (e.g. Nuttli and Bolt, 1969; Payo, 1972); and (4) lateral inhomo- geneities in the lower mantle (e.g. Julian and Sengupta, 1973).
MORPHOLOGICAL. GEOLOGICAL. AND GEOPHYSICAL DATA
The main morphologic and geologic features of the Aegean region are from south to north (Allen and Morelli, 1971; Lort, 1971; see Fig. 1): (1) the Mediterranean ridge with irregular topography; (2) the Hellenic trough, a series of depressions to 5100 m depth; (3) the sedimentary Aegean (or Hel- lenic) island arc from Peloponnesus through Crete, Karpathos, and Rhodes to Turkey; it consists of Paleozoic to Tertiary rocks folded and faulted in several phases of the Alpine orogeny; it forms a link between the southernDinarides and the Turkish Taurides (ijzgiil and Arpat, 1973); and (4) the Aegean Sea with basins, ridges, and plateaus; it has been tectonically very mobile since the.Miocene; the basin north of Crete is bounded to the north by the inner arc with recent andesitic volcanism at Santorin, Nisyros, Milos and Kos; a rather stable block of folded Paleozoics and granitoid masses follows immedi- ately to the north; in the extreme north a northeast trending trough delineates a rift in the western extension of the Anatolian fault (McKenzie, 1970).
According to a reconstruction attempt by Dewey et al. (1973), generation of oceanic lithosphere was dominant in the region from Late Triassic to Late Jurassic, while subduction was dominant from Early Cretaceous to Present. Although the magnetic anomalies in the Atlantic provide a quantitative frame for the relative motions of the African and Eurasian plates through time, the reconstruction has proved exceedingly difficult, because the closing of the

35
Tethys involved generation, movement, subduction, and collision of many “microplates” and processes perhaps not compatible with the rigid-plate con- cept (Alvarez, 1973). The development of the Hellenic trench is probably quite recent; it was accompanied by the formation and north-south widening of the Aegean Sea and clockwise rotation of Peloponnesus as indicated paleo- magnetically (Pucher et al., 1974).
At present shallow seismicity is concentrated in two diffuse belts along the Hellenic trench and arc and in the northern Aegean (Galanopoulos, 1967, 1972; Caputo et al., 1970; McKenzie, 1970,1972; Papazachos and Comninakis, 1971). Subcrustal earthquakes occur mainly below the trench, the sedimentary, and the volcanic arc. The distribution is not easily repre- sented by a dipping Benioff zone, probably in part because of lack of preci- sion in hypocentre determination (G. Leydecker, personal communication, 1974), but partly reflecting real complexity (Galanopoulos, 1972). Some authors (Papazachos and Comninakis, 1971; Caputo et al., 1970) suggest that the seismic zone has an amphitheatrical shape with a dip of approximately 30” toward the central Aegean. Their view is supported by the efficient trans- mission of seismic energy through the seismic zone, and by the attenuation of waves passing through the region above (compare Baranzangi et al., 1972; Wadati et al., 1969).
Contemporary plate tectonics in this region and its problems are discussed by McKenzie (1970,1972), Lort (1971), Alvarez (1973), Dewey et al. (1973), and others.
Focal-mechanism studies (Constantinescu et al., 1966; Papazachos and Delibasis, 1969; McKenzie, 1970,1972) suggest southerly to westerly thrust- ing of the arc over the eastern Mediterranean. Normal and strike-slip faulting dominate in the north. By definition (McKenzie and Parker, 1967) seismic belts mark the boundaries of stable plates, and focal mechanisms indicate the relative motions of adjacent plates. This way McKenzie (1970,1972) has de- lineated an Aegean plate with a convergent boundary against the African plate and perhaps to a small Adriatic (or Appulian) plate, a relatively diffuse divergent to transform boundary against the Eurasian plate, and a poorly de- fined boundary against the Turkish plate. By the very same above definition, however, it is difficult to talk about truly stable aseismic microplates in the Mediterranean.
A belt of free-air gravity lows down to -200 mGa1 follows the Hellenic trench, and the anomalies are generally positive over the Aegean with maxima of +120 mGa1 north of Crete (Fleischer, 1964; Allen and Morelli, 1971; Makris et al., 1973). Magnetic anomalies may be caused by rifting, volcanism, and by Hercynian granites (Allen and Morelli, 1971). Heat flow is relatively high in the Aegean sea floor (Jongsma, 1974).
Recent seismic refraction experiments (J. Makris, 1973 and personal com- munication, 1975) have indicated that the crust thins from about 50 km be- low Peloponnesus and the Pindus range toward the Aegean (25-30 km) and that Crete is underlain by a sialic crust of 30 km thickness. The nature of the

36
Mediterranean ridge is still debated (Rabinowitz and Ryan, 1970; Ryan et al., 1970; Sancho et al., 1973; Hinz, 1974).
Traveltime residuals of local and regional earthquakes (Ekonomides, 1972) have been interpreted by similar crustal thicknesses and by P-wave anisotropy. Surface-wave dispersion can be interpreted by nearly continent-like crust and a distinct low-velocity layer in the upper mantle below the Aegean (Papazachos 1969) and slightly more ocean-like crust south of Crete.
TRAVELTIME RESIDUALS
The computation of traveltime residuals is straightforward if the following assumptions hold:
(1) Knowledge of the focal parameters of an earthquake (index i), i.e. geo- graphic coordinates Cpi, hi, depth hi and origin time Gi,.
(2) Accurate measurement of the arrival time Glk of the seismic phase of interest at the station (index k) with the coordinates (Pk, hk ; the traveltime of this phase is then:
Tik = Gik - Gi, (1)
(3) Existence of a standard traveltime function t (A, h) of epicentral dis- tance A and focal depth h; Aik = A(pi, Xi, !&, hk) Civil be computed by spheri- cal trigonometry with ellipticity corrections (see e.g. Richter, 1958, p. 317); from Aik fOllOWS til, = t( Aik, hi) and the “absolute” traveltime residual is:
6ik = Tik - tik
For our analysis we have used the following sources: (1) focal parameters from the preliminary determinations of epicenters (PDE) published at the time by the U.S.C.G.S.; (2) P-arrival times from the preliminary bulletins for 1966 to 1970 issued by the Seismological Institute of the National Observatory in Athens, Greece, as well as own readings of the original records; (3) standard traveltime from the P&3 table by Herrin et al. (1968).
The above assumptions themselves, as well as our particular choices are, however, problematic. Beside the possibility of a systematic bias in the arrival-time readings, lateral inhomogeneities in the mantle may have shifted the PDE focal parameters from their true values, e.g. for events in the western Pacific tectonic belts, and may render any particular traveltime table inade- quate for our data set. This is because a traveltime standard is found by mini- mizing the residuals of traveltime and/or focal parameters for a given data set applying certain statistics (Herrin et al., 1988; Lilwal and Douglas, 1970; Jacob, 1972; Julian and Sengupta, 1973; KuWnek and Brown, 1974).
The interpretation of the “absolute” ~traveItime residuals eik, even if they are correct, cannot be unique since they originate along the whole ray path, i.e. in the source region, the intervening mantle and in the sub-receiver region.
To enhance the influence of the sub-receiver reg5cm and to reduce the un- certainties discussed above, we have computed “relative” traveltime residuals

37
rik* with respect to a reference station for which we have chosen Athens (index A) because of its central location at some distance from the island arc:
rikA = eih - eiA = (Tik - TiA) - (tik - tiA)
or:
rik A = (Gik - GiA) - (t&s - tiA) c 6G - aiA ’ (Aik - AiA)
We are now not limited by the uncertainty of the absolute value of the travel- time but only by that of the slope of the traveltime standard. The ray cone reach- ing the seven Greek stations from any distant event is narrow enough to ensure that the relative traveltime residuals 7ik A mainly result from variations in the sub-receiver region.
The stations used (Fig. 1) are Athens (ATH), Archangelos (ARG) on Rhodes, Vamos (VAM) on Crete, Valsamata (VLS) on the Ionian island of Kephallenia, Joannina (JAN) in the Pindus Range, Polygyros (PLG) on Chalkidike peninsula, and Paraskevi (PRK) on the island of Lesbos. The station data pertaining to this study are listed in Table I. The aperture of the network is 5” to over 6”. A search in the bulletins of the Seismological Insti- tute of the National Observatory in Athens issued for the years of 1966 to 1970 yielded close to 1000 events in the epicentral distance range of 30” < A < loo”, each of which was recorded by several of the Greek stations shown in Fig. 1. The lower limit of A = 30” was chosen to keep the influence of re- gional anomalies in the upper mantle along the ray path reasonably small. The upper limit of A = 100” was chosen to avoid identification problems of phases in the PKP range.
In a first run the traveltime residuals were computed according to eqs. 2 and 3 using the PDE focal parameters and the arrival times listed in the bul- letins. Since the large scatter of the residuals found was suspected to be at least partly caused by the difficulties in reading the P-wave onsets, a pilot study was conducted by one of us (N.K.A.) at Athens observatory by re- reading a representative set of about 500 of the 5000 original records. Most of the apparent residuals exceeding 5 s in oik or 3 s in rikA turned out to be reading errors or misprints. Because it was not feasible to check all 5000 records, we eliminated from our original list all events with residuals ex- ceeding the above limits and retained a set of 358 earthquakes for further anal- ysis and interpretation.
It is obvious from a plot of the epicenters of these earthquakes (Fig. 2) that our data set is unevenly distributed and dominated by earthquakes in the western Pacific and Indian Ocean island arcs. The coverage of distance and azimuth is acceptable in the NE quadrant and very poor in the SW quadrant.
To give a general impression of theabsolute traveltime residuals 6, and par- ticularly their scatter, we have plotted them in polar coordinates versus back azimuth (11 (Fig. 3). The absolute residuals plotted for each station against back azimuth as abscissa are given in Fig. 4, together with least-squares sine

LEGEND
@ Seismological station .‘..’ Morphologic or geologic trend
Earthquakes 83 Volcanoes A 605 ht8Okm II .3OC hL_120 " Free olr gravity anomaly Ischematic)
41205 h L 180 " -f?$ AgF) + 100 mgal ~_ li
_- Zg F c -1OOmgal
Fig. 1. Summary map of the Aegean region, showing morphologic and geologic trends to- gether with intermediate-depth seismicity and gravity in a schematic way.
functions of back azimuth. In view of the large scatter and the uneven data distribution, only the constant term may be significant while the amplitude and the phase of the sine term probably are not; however, least-squares fitting with a constrained third-order polynominal rendered similar curves. The con- stant term varies for all stations from about +2 to +3 s and is appruximately 0.6 s greater than the simple arithmetic mean at each station. E+ecause of the uneven data distribution, however, it cannot be decided which of both is more representative.
Another simple way of smoothing the raw data which we have tried was averaging 30”~sectors and drawing even smoother curves through the points (Fig. 5). Like the sine curves of Fig. 4, the sector averages are smallest between

39
TABLE I
Station data of the Greek seismological network -____
Station Coordinates Instruments Foundation
_ elevation
Athens ATH
Archangelos ARG (Rhodes)
Janina JAN (Pindus Range)
Paraskevi PRK (Lesbos)
Polygyros PLG (Chalkidike)
Valsamata VLS (Kephallenia)
Vamos VAM (Crete)
37°58’20” N 23’43’00” E
95 m
Benioff SP (ZNE) Sprengnether LP
(ZNE)
36’12’58” N 28°07’34r’ E
170 m
Sprengnether SP
(ZNE)
39O39’24” N 20°51’03” E
540 m
Sprengnether SP
(ZNE)
39’14’46” N 26’16’18” E --
100 m
Sprengnether SP
(ZNE)
40’22’25” N 23’26’44” E -___
580 m
Sprengnether SP
(ZNE)
38’10’38” N 20’35’23” E
375 m
Sprengnether SP
(ZNE)
35’24’25” N Sprengnether SP 24’11’59” E (ZNE)
225 m
limestone
sandstone
limestone
rhyolite
gneiss
limestone
marl
north and east, but they suggest an additional sin 2a term. Because of the scatter and the ambiguity of interpretation, we did not continue this kind of analysis (of the absolute residuals) beyond this point.
We failed to find significant variation of the absolute traveltime residuals with epicentral distance. There may, however, be a slight indication of more positive residuals in the 30”-70” distance range than in the 70”-100” range (1.8 s versus 1.2 s at ATH). There is a similar trend from smaller residuals in island-arc focal regions toward larger residuals in oceanic and continental rift zones (1.3 s versus 2 s).
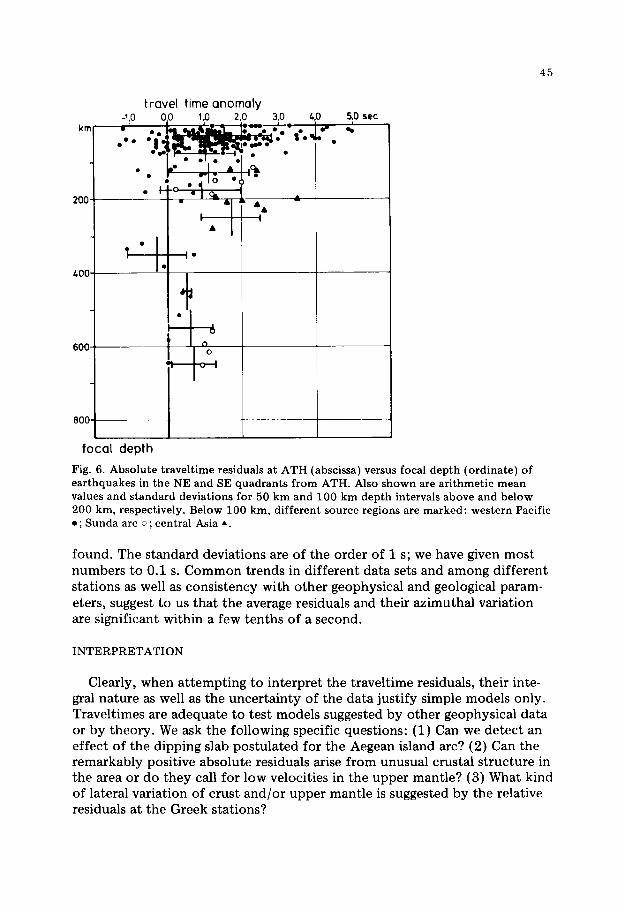
A final look at the absolute traveltime residuals eik is for a possible relation with focal depth hi. Fig. 6 pertains to events in the western Pacific and Sunda

Fig. 2. Epicentres of earthquakes used in this study, plotted in equidistant azimuthal pro- jection centered at ATH.
island arcs recorded at Atiens. The triangular shape of the 8--h field of the figure shows that the seat&r greatly deaieases from shallow to deep foci. Thie is not suxprising and in qtsdk&ive agreement with pesent knowledge about upper-mantle velocity &ruMe of isw ‘atcs (e.g. Jacob, 1972). R.ays leaving from shallow depth have the great& chance of either passing long distances through a h&h-velocity slab or traversing low or ultra-low velocity upper mantl (Aggarwal et al., 1972). A decrease of~the average &values with depth is also indicated, but its interp&a&n is unc&. There is a tentative suggestion of regional variations of the residuals from deep events.

o/ 760~
270°
1600
Fig. 3. Absolute traveltime residuals at ATH plotted versus back azimuth (of approach).
From the above discussion it seems indicated to us that studies like this should perhaps be done with well-documented deep events only. There seems no other way to get around the problems of large scatter. On the other hand, poor coverage of parameters like azimuth and distance has then to be accepted.
The relative traveltime residuals ?ikA are presented in Fig. 7. The scatter is not much reduced from that of the absolute residuals, suggesting that diffi- culties in determination of the onset time play an important role. This was verified by re-reading of original records. The cut-off at +3 s (see above) may not be justified in view of plots as those for ARG or VAM and may have slightly influenced our further analysis. Although it is appropriate to look at the distribution of the residuals on the residual sphere (Davies and McKenzie, 1969), we disregard relationships with the angle of emergence in view of its narrow range and in view of the large scatter of the data.
Least-squares sine functions are fitted to the azimuthal distribution of the relative residuals. Inspection of Fig. 7 as well as comparison with the 30”-sector

42

AldUONtl 3
. I =
.
.
. .

Fig. 5. Smoothed 30”-sector averages of absolute traveltime residuals at Greek stations.
averages (Fig. 8) demonstrates that amplitude and phase of the sine terms are probably not significant; the more surprising is the trend of all maxima, except at PLG, pointing outward, i.e. away from ATH, leading to a consistent inter- pretation if taken at face value (see below and Fig. 11). The constant terms of the least-squares fit at all stations hardly differ from the simple arithmetic means except at ARG (difference 0.7 s); they are all positive (between 0.4 and 0.9 s), i.e. on the average, the P-waves are delayed at all stations more than at ATH. This is true also for all individual 30”~sector averages (Fig. 8), except at ARG on Rhodes where the sector means between WSW (240”) and N (360”) are negative, i.e. the waves arrive early (see below). The polar anom- aly curves (Fig. 8) are more or less elongated parallel to the trend of the is- land arc; at PRK near the Turkish coast the elongation is northerly, and at PLG no simple elongation is apparent. The fact that no obvious common fea- ture is evident makes us believe that ATH introduces little azimuthal bias. The possibility of such a bias cannot, however, be excluded and has to be kept in mind in judging any interpretation. If Fig. 8 represents the variation of the relative residuals with azimuth, then it is evident that simple sine functions cannot describe this behavior. The elongation of the curves would require a sin 2c term, and a sin 301 term would be necessary at least at PRK.
It is difficult to estimate the degree of significance of the relationships
45
travel time anomaly
600
800-p
focal depth
Fig. 6. Absolute traveltime residuals at ATH (abscissa) versus focal depth (ordinate) of earthquakes in the NE and SE quadrants from ATH. Also shown are arithmetic mean values and standard deviations for 50 km and 100 km depth intervals above and below 200 km, respectively. Below 100 km, different source regions are marked: western Pacific l ; Sunda arc 0 ; central Asia A.
found. The standard deviations are of the order of 1 s; we have given most numbers to 0.1 s. Common trends in different data sets and among different stations as well as consistency with other geophysical and geological param- eters, suggest to us that the average residuals and their azimuthal variation are significant within a few tenths of a second.
INTERPRETATION
Clearly, when attempting to interpret the traveltime residuals, their inte- gral nature as well as the uncertainty of the data justify simple models only. Traveltimes are adequate to test models suggested by other geophysical data or by theory. We ask the following specific questions: (1) Can we detect an effect of the dipping slab postulated for the Aegean island arc? (2) Can the remarkably positive absolute residuals arise from unusual crustal structure in the area or do they call for low velocities in the upper mantle? (3) What kind of lateral variation of crust and/or upper mantle is suggested by the relative residuals at the Greek stations?

I I
~0.0
0 ro
.oc
I 1
1 ,c
-cc
ItC.C
C
,‘r”.
OC
X
C
.OC
:iC
.00
:‘Jc
.CP
12
0 .c
c ,,d
ER
CKRZ
IMUT
H RT
RT
HENS
BRCK
RZIW
UTH
RT
ATHE
NS
%
* . --
- s-
==
=-
RT
RTHE
NS
BRCK
OZI
flUTr
17
1 RT
HENS

47
t t

Fig. 8. Smoothed 30”~sector averages of relative traveltime residuals with respect to ATH at Greek stations.
(1) The chances to “see” from the seismic stations the high-velocity plate suggested by seismicity are illustrated by Fig. 9 which is replotted from Papazachos and Comninakis (1971) with the projections of the stations added. While it appears unlikely that ATH, JAN, or VLS can “see” the active plate claerly and the situation at VAM, Crete, is confused by the occurrence of intermediate earthquakes south of the arc, the chance appears good at ARG, Rhodes. This prediction is borne out by our data remarkably well (Fig. 9). The rays which traverse the intermediate seismic zone (Figs. 1 and 9) from north- erly to westerly directions reach VAM on average 1.5 to 2 s earlier than any other rays. Our results agree with a study of traveltime residuals from earth- quakes in the Aegean region recorded at Danish stations to the northwest (S. Gregersen, written communication, 1974/1976). Depending on the as- sumption of the depth of the slab, this corresponds to a velocity within the slab 5-15s higher than outside. Although the upper limit appears high, the velocity contrast estimated agrees with those found for other slabs (e.g. by Jacob, 1972). We cannot offer any convincing model for the late arrivals at VAM, Crete, independent from direction. Our data do, however, suggest that the difference of the focal distribution near Crete from that near Rhodes re- flects real difference in structure.

49
100 200 300 akm
Fig. 9. Projections of intermediate-depth seismicity onto verfical planes crossing the Aegean areE, according to Papazachos and Comninakis (1971). Also projected are the nearest Greek stations with sketches of rays appropriate to the epicentral distance range of this study.
(2) Our simple model consists of three layers: crust (ur, d,), high-velocity mantle lid (~7s~ da), and low-velocity layer (us, d,); the bottom is arbitrarily assumed at 300 km depth. We are mainly interested in how much our model P-wave velocities and{or thicknesses have to be varied from an assumed standard model in order to be compatible with the observed absolute traveltime residuaIs which we take to be 8 = 2 s. The details of the reference model itself are af minor importance for our estimate.
For vertical incidence the traveltime through the model is:
T = -&,/ui (da)
Shifting the boundary between any two layers i and i + 1 can be expressed by:
S(d, + d,,r) = 0 (4b)

50
From a T/au,= -di/U,” follows:
&Vi Z--- (5)
Similarly from aT/adi = (l/Vi) - (l/Ui+i):
(f-5)
Taking the standard crustal thickness dl = 30 km and the standard crustal P-velocity u1 = 6.1 (alternatively 6.6) km/s, weget from eq. 5 6u, = -2.5 (-2.9) km/s. Thus the crustal P-velocity would have to be as low as 3.6 (3.7) km/s. Or, taking the standard velocity of the uppermost mantle u2 = 3.0 (8.3) km/s, we get from eq. 6 6d1 * + 52 (76) km (with u1 = 6.6 km/s: 47 (64) km); this would require crustal thickness in excess of 70 km. There is no evidence for such low crustal velocities or such great thicknesses or any combination of both. In fact, with any reasonable velocity-density relation we would be in conflict with gravity as discussed later on.
If the absolute residual is real, we have to look for an explanation in the upper mantle. For the estimates we let 8 = 2 s; we represent the crust by d, = 30 km, u1 = 6.1 km/s; for the standard upper-mantle model we have chosen rather arbitrarily d 2 = 90 km, ua = 8.2 km/s (lid) and d3 = 180 km, u3 = 8.13 km/s (low-velocity layer). We allow the parameters ds, u2, and u3 to vary within reasonable limits. Figure 10 shows the parameter sets compatible with 8 = 2 s, i.e. the low velocity u3 as function of lid velocity u2 with lid thickness d, as parameter. For instance, a homogeneous upper mantle needs a value of
o IV21 7.L 7.6 7.8 8.0 8.2 0.4 8.6 a.8 km/!
Fig. 10. Plot of the parameter ds thiclcnes ti the upper-mantle lid, in the us ug field (lid and low-velocity layer velocity, kspectively) consistent with a P-wave traveltime delay of 2 6.

51
JAN ATH
6.1 km/s I ,.,.! wz :- .., A.,.... ---we-- .,._,
6.2 km/s PLG I VAM
,y;.,. ,..* a.... .‘./ - ,. ),\, :~, .:., ih.
VLS I PRK I c. ,.. .I... I.... . ..s - 30&m
JAN 0 km
1
ATH ARG I
200 1 I
A
B
ATH PRK
Fig. 11. Simple sections of the Aegean region connecting triplets of Greek stations: (A) crustal sections. (B) upper-mantle sections. each consistent with relative traveltime resid- uals individually.

52
v2 = VQ = 7.64 km/s, or e.g. if d, = 50 km and vq = 8.1 km/s, we would get us = 7.55 km/s.
Although any combination of crustal and upper-mantle thickness and/or velocity anomalies compatible with the observed traveltime anomalies is ac- ceptable, our knowledge of crustal structure from refraction studies suggests the upper mantle to be the dominant source of the residuals.
(3) If the azimuthal variation of the relative residuals is represented cor- rectly by the smooth curves of Fig. 8, the elongation parallel to the trend of the arc at JAN, VLS, VAM, and ARG suggests two possible explanations:
(a) P-velocity anisotropy with the maximum velocity perpendicular to the arc can explain a traveltime variation of +0.3 s if the amount of anisotropy is approximately +11, +6, or +4% for the uppermost 30,60, or 90 km, respec- tively. For these estimates we have assumed the maximum and minimum ve- locities in the horizontal plane and the angle of emergence i = 30”.
(b) Structure, for instance, crustal thickening by 5-10 km (30-60 km laterally across the sedimentary arc axis centered at the stations) can explain +0.3 s of azimuthal traveltime variation as well.
The constant terms of the relative residuals (Fig. 7) or the arithmetic mean values at the individual stations are plausibly explained by thickness deviations from the ATH model consistent with the absolute residuals. If crustal thick- ness variation were the only cause of the relative residuals, the crust would have to be about 20 km thicker at VAM and JAN and about 10 km thicker at VLS, PRK, and PLG than at ATH. At ARG such an estimate is meaning less because of the large influence of the dipping slab (see above). A thinning of the crust from VLS toward ATH is supported by explosion seismology (J. Makris, personal communication, 1973). Alternatively, we may assume that thickness variations of the upper-mantle low-velocity layer cause the relative residuals. An estimate of this kind is shown of Fig. 11 B for three sets of d,, v2, v3 combinations, compatible with the absolute residual at ATH. We have further computed the dip of the interface between the lid and the low-velocity layer from the amplitudes of the sine terms of Fig. 7. As shown in Fig. 11 B for three sections the dips are surprisingly consistent with the thickness variations; it is difficult to believe that this is more than an acciden- tal agreement because of the statistical uncertainty of the sine terms.
We do not present the above models with any particular preference. A combination of these models is likely to occur in nature. The above discus- sion merely shows for particular sets of assumptions how velocities and/or thicknesses have to vary quantitatively to be compatible with the observed residuals.
DISCUSSION AND CONCLUSIONS
The ambiguity of the above models calls for additional constraints. Gravity deserves special attention because of known velocity-density systematics (e.g. Birch, 1960, 1961).

53
The problems of combining P residuals and gravity are illustrated by a pro- file crossing the Aegean arc near Karpathos between Crete and Rhodes (Fig. 12). Simple Bouguer and free-air anomalies as well as bathymetry are taken from Allen and Morelli (1971). The smooth part only of the Bouguer anomaly is considered in two-dimensional modelling. A “possible” model is shown with the corresponding gravity effect, demonstrating that gravity is consis- tent with, though does not prove, the existence of a dipping slab.
We do not intend to present a detailed density model, but we mainly wish to stress the discrepancies between the densities required to fit gravity and the densities based on the seismic P velocities (required by the P residuals) if we assume a density-velocity relation such as Birch’s law:
P Z a*+b**u, (7)
According to laboratory experiments (e.g. Birch, 1960, 1961) and to theory (e.g. Anderson, 1973) b* is about 0.3 (g/cm3)/(km/s). Taking (1) our above- mentioned low-velocity model to be confined below the Aegean in contrast e.g. to the Mediterranean in the south, (2) assuming the geometry of the model of Fig. 12, and (3) taking b* as low as 0.25 and 0.15, we obtain the model gravity effects shown by curves A and C, respectively. The gross dis- crepancy is not the result of oversimplified modelling. To fit gravity better (curves C1, Cs, and C,) we have to add mass below the Aegean beside using the low b*-value of 0.15. The values assumed specifically for the different model parts to compute A, C, Cl, C2, C3 are listed in the figure caption.
The attempt to simply convert the traveltime residuals (+2.0 s) into crustal and/or upper-mantle velocities and further into densities via Birch’s law leads to gravity anomalies of -500 to -1000 mGa1 order and is obviously some- where erroneous. Nowhere do we find such anomalies of gravity, in fact, the free-air anomalies in the region are zero to positive in contrast to the negative anomalies to the south.
There are several possible explanations. (1) The observational errors are systematic, i.e. the readings of the P onsets
are consistently late. A test of this hypothesis on the basis of the large-magni- tude earthquakes was negative.
(2) If correct, the positive absolute residuals may arise in some region out- side the Aegean crust and upper mantle and may thus not bear on structure or gravity in the region.
(3) In contrast to previous models where the P residuals follow entirely from velocity anomalies, uplift of the surface by upper-mantle expansion might have to be considered as an additional cause of the delay. A simple estimate including decreased velocities and increased path length and using Birch’s law yields an uplift of the present surface of at least 3 km above “nor- mal”. The uplift could be achieved by an average temperature excess of -250 K in a 300 km column (with an assumed expansion coefficient (Y = 4 . 10h5 K-l) and/or by some amount of partial melting.

Fig. 12. Upper-mantle density section crossing the Aegean arc near Karpathos. Densities are consistent with observed Bouguer anomalies (B.A.) and free-air anomalies (F.A.) ac- cording to Allen and Morehi (1971). but not consistent with traveltime-based velocity model. Models A and C are cons@ent with vel&cities with Birch coefficients b* = 0.25 and 0.15 gcm-s/kms-l, respectively. IvJass added below Aegean to model C leads to Cl, C2, and C3. The density contrasts assumed are listed below in the order: A, C, Cl, C2. C3: upper crust -0.6 -0.3 -0.3 -0.3 -0.3 lower crust -0.3 -0.2 -0.2 -0.15 -0.15 crustal wedge near trench -0.3 -0.2 -0.2 -0.15 + 0.06 Aegean mantle lid 0 0 + 0.1 + 0.08 + 0.07 Mediterr. lithosphere + 0.09 + 0.06 + 0.06 + 0.06 + 0.06 extension to 300 km depth 0 0 0 0 + 0.06

55
(4) Birch’s law may be inapplicable to the region of the upper mantle studied. This may be so especially if partial melting occurs. The volcanism in the Aegean supports this hypothesis; heat flow, S residual, and Q-measure- ments could strengthen or weaken it in the future.
Our main conclusions from this work are the following: (1) The relative P residuals suggest that the stations on the arc and near the
northern shore of the Aegean are located on thicker crust than Athens and/or are underlain by a more effective upper-mantle low-velocity layer. If real, the absolute P residuals suggest a particularly low mantle velocity with a shallow top typical of arc and marginal-sea situations. Elevated temperatures and per- haps partial melting are plausible explanations supported by gravity data.
(2) Island-arc dynamics is suggested also by the azimuth dependence of the relative residuals at the stations on the sedimentary arc; both anisotropy with maximum velocity perpendicular to the arc and locally thickened crust are consistent with this view.
(3) Our data from Archangelos, Rhodes, support the interpretation of seis- micity indicating the presence of lithospheric slab dipping toward the center of the Aegean Sea.
Our data do not allow us to delineate the shape of the dipping slab in more detail. It appears, however, from seismicity that the slab is curled upward at the sides of the arc, similarly to other lateral edges of slabs (Isacks and Molnar, 1971; Jacoby, 1973). We speculate that a relatively narrow strip of the Mediterranean cold, heavy lithosphere is tearing at the sides and sinking more rapidly than to the east and west, allowing hot mantle material to rise buoyantly and to fill the gap behind the Aegean arc in an expanding Aegean Sea. Our understanding of plate dynamics would be greatly enhanced if we could find clues as to why this is happening just here.
ACKNOWLEDGEMENT
This research was sponsored by Deutsche Forschungsgemeinschaft grant No. Be 299/21. We want to acknowledge the help we received from Prof. Galanopolous and his colleagues at Athens National Observatory. Among those colleagues at Frankfurt who assisted us with programming and discus- sions J. Drisler is mentioned with special gratefulness. B. Akasheh, S. Greger- sen, and G. Leydecker read the manuscript.
REFERENCES
Aggarwal,, Y.P., Barazangi. M. and Isacks, B., 1972. P and S traveltimes in the Tonga-Fiji region: a zone of low velocity in the uppermost mantle behind the Tonga island arc. J. Geophys. Res., 77: 6427-6434.
Allen, T.D. and Morelli, C., 1971. A geophysical study of the Mediterranean sea. Boll. Geofis. Teor. Appl., 13: 99-142.
Alvarez, W.. 1973. The application of plate tectonics to the Mediterranean region. In: Im-

56
plications of Continental Drift to the Earth Sciences, 2. Academic Press, London, pp. 893-908.
Anderson, O.L., 1973. Comments on the power law representation of Birch’s law. J. Geo- phys. Res., 78: 4901-4914.
Barazangi. M.. Isacks. B. and Oliver, J., 1972. Propagation of seismic waves through and beneath the lithosphere that descends under the Tonga island arc. J. Geophys. Res., 77 : 952-958.
Birch, F.. 1960. The velocity of compressional waves in rocks to 10 kilobars, 1. J. Geophys. Res.. 65: 1083-1102.
Birch, F., 1961. The velocity of compressional waves h rocks to 10 kilobars, 2. J. Geo- phys. Res., 66: 2199-2224.
Caputo, M., Panza, G. and Postpischl. D.. 1970. Deep structure of the Mediterranean basin. J. Geophys. Res., 75: 4919-4923.
Constantinescu, L., Ruprechtova. L. and Enescu, D., 1966. Mediterranean-Alpine earth- quake mechanisms and their seismotectonic implications. Geophys. J.R. Astron. Sot., 10: 347-368.
Davies, D. and McKenzie, D.P., 1969. Seismic travel time residuals and plates. Geophys. J.R. Astron. Sot.. 18: 51-63.
Dewey, J.F.. Pitman III, W.C., Ryan, W.B.F. and Bonnin. J., 1973. Plate tectonics and the evolution of the Alpine system. Geol. Sot. Am. Bull.. 84: 3137-3180.
Ekonomides, A., 1972. The Station Residuals of the Greek National Network, Thesis Natl. Obs. Athens, Seismol. Inst. (in Greek with English abstract).
Fleischer. II., 1964. Schwerestorungen im Gstlichen Mittelmeer nach Messungen mit einem Askania-Seegravimeter. Dtsch. Hydrogr. Z., 17: 153-164.
Galanopoulos, A.G., 1967. The seismotectonic regime in Greece, Ann. Geofis., 20: 109- 119.
Galanopoulos, A.G.. 1972. Plate tectonics in the area of Greece as reflected in the deep focus seismicity. Bull. Geol. Sot. Greece, 9: 266-285.
Herrin, E., Arnold, E.P., Bolt, B.A., Clawson, G.E., Engdahl, E.R., Freedman, H.W., Gordon. D. W.. Hales, A.L., Lobdell, J.L., Nuttli, O., Romney, C., Taggart J. and Tucker, W., 1968. 1968 seismological tables for P phases. Bull. Seismol. Sot. Am., 58: 1193-1241.
Hinz, K.. 1974. Results of seismic refraction and seismic reflection measurements in the Ionian sea. Geol. Jb., E2: 33-65.
Isacks, B. and Molnar, P., 1971. Distribution of stresses in the descending lithosphere from a global survey of focal mechanism solutions of mantle earthquakes. Rev. Geophys. Space Phys., 9: 103-174.
Jacob, H.K., 1972. Global tectonic implications of anomalous seismic P travel times from the nuclear explosion Longshot. J. Geophyo. Res.. 77: 2556-2573.
Jacoby, W.R., 1973. Model experiment of plate movements. Nature Phys. Sci., 242: 139- 134.
Jongsma, D., 1974. Heat flow in the Aegean sea. Geophys. J.R. Astron. Sot., 37 : 337-346. Julian, B.R. and Sengupta, M.K., 1973. Seismic travel time evidence for lateral inhomo-
geneity in the deep mantle. Nature, 242: 443-447. Kaila, K.L., Krishna, V.G. and Narain. H.. 1969. Upper mantle velocity structure in the
Hindukush region from travel time studies of deep earthquakes using a new analytical method. Bull. Seismol. Sot. Am., 59: 1949-1967.
Kebeasy, R.M., 1970. P-wave travel time anomaly in the north and the east of circum Pacific region. Bull. Earthquake Res. Inst., 48: 381-397.
Kulhanek, 0. and Brown, R.J., 1974. P-wave velocity anomalies in the earth’s mantle from Uppsala array observations. Pure Appl. Geophys., 112: 597-617.
Lilwall, R.C. and Douglas, A., 1970. Estimation of P-wave travel times using the joint epicentre method. Geophys. J.R. Astron. Sot., 19: 165-181.
Lort, J.M.. 1971. The tectonics of the eastern Mediterranean: a geophysical review. Rev. Geophys. Space Phys., 9: 189-216.

57
Makris, J., 1973. Some geophysical aspects of the evolution of the Hellenides. Bull. Geol. Sot. Greece, 10 (1): 206-213.
Makris, J., Navridis, L.N., Menzel. H., Stavrou, A. and Veis, G., 1973. The gravity field of Attika. the Peleponnese and Kithira, Greece. Z. Geophys., 39: 929-936.
McKenzie, D.P., 1970. Plate tectonics of the Mediterranean region. Nature, 226: 239-243. McKenzie, D.P., 1972. Active tectonics in the Mediterranean region. Geophys. J.R. Astron.
4 , oc.. 30: 109-185. McKenzie, D.P. and Julian, B.R.. 1971. Puget Sound. Washington, earthquake and the
mantle structure beneath the northwestern United States. Geol. Sot. Am. Bull., 82: 3519-3524.
McKenzie, D.P. and Parker. R.L., 1967. The north Pacific: an example of tectonics on a sphere. Nature, 216: 1276-1280.
Nuttli, O.W. and Bolt, B.A., 1969. P wave residuals as function of azimuth. 2. Undulations of the mantle low velocity layer as an explanation. J. Geophys. Res.. 74: 6594-6610.
zizgiil, N. and Arpat, E., 1973. Structural units of the Taurus erogenic belt and their con- tinuation in neighbouring regions. Bull. Geol. Sot. Greece, 10 (1): 156-164.
Papazachos. B.C.. 1969. Phase velocities of Rayleigh waves in southeastern Europe and eastern Mediterranean sea. Pure Appl. Geophys., 75: 47-55.
Papazachos, B.C. and Comninakis, P.E., 1971. Geophysical and tectonic features of the Aegean arc. J. Geophys. Res., 76: 8517-8533.
Papazachos, B.C. and Delibasis, N.D., 1969. Tectonic stress field and seismic faulting in the area of Greece. Tectonophysics, 7: 231-255.
Payo, G.. 1972. P wave residuals at some Iberic stations and deep structure of southwestern Europe. Geophys. J.R. Astron. Sot., 26: 481-497.
Press, F. and Biehler, S., 1964. Inferences on crustal velocities and densities from P wave delays and gravity anomalies. J. Geophys. Res., 69: 2979-2995.
Pucher. R., Bannert, D. and Fromm, K., 1974. Paleomagnetism in Greece indication for relative block movement. Tectonophysics, 22: 31-39.
Rabinowitz, P.D. and Ryan, W.B.F., 1970. Gravity anomalies and crustal shortening in the eastern Mediterranean. Tectonophysics, 10: 585-608.
Richter, C.F.. 1958. Elementary Seismology. Freeman, San Francisco, 768 pp. Ryan, W.B.F., Stanley, D.J., Hersey, J.B., Fahlquist, D.A. and Allen, T.D., 1970.
The tectonics and geology of the Mediterranean sea. In: A.E. Maxwell (Editor), The Sea 4. Wiley-Interscience, New York, pp. 387-492.
Sancho, J., Letouzey, J., Biju-Duval, B., Courrier. P., Montadert, L. and Winnock. E.. 1973. New data on the structure of the eastern Mediterranean basin from seismic re- flection. Earth Planet. Sci. Lett., 18: 189-204.
Solomon. S.C. and Butler. R.G.. 1974. Prospecting for dead slabs. Earth Planet. Sci. Lett.. 21: 421-430.
Utsu, T. and Okada. H.. 1968. Anomalies in seismic wave velocity and attenuation asso- ciated with a deep earthquake zone, 2. J. Fat. Sci. Hokkaido Univ., Ser. VII., 3: 65-84.
Wadati. K., Hirono, T. and Yumura. T.. 1969. On the attenuation of S-waves and the structure of the upper mantle in the region of Japanese islands. Pap. Meteorol. Geo- phys., 20: 49-79.