temperature and magnetic- eld driven dynamics in arti cial...
TRANSCRIPT

Temperature and magnetic-field driven dynamicsin artificial magnetic square ice
Sophie A. Morleya, Aaron Steinb, Mark C. Rosamondc, Diego Alba Venerod, Ales Hrabeca,Philippa M. Shepleya, Mi-Young Ime,f, Peter Fischere,g, Matthew T. Bryanh, Dan A. Allwoodh
, Paul Steadmani, Sean Langridged, and Christopher H. Marrowsa
aSchool of Physics & Astronomy, University of Leeds, Leeds LS2 9JT, United Kingdom;bCenter for Functional Nanomaterials, Brookhaven National Laboratory,
Upton NY 11793, USA;cSchool Electronic and Electrical Engineering, University of Leeds,
Leeds LS2 9JT, United Kingdom;dISIS, STFC Rutherford Appleton Laboratory,Didcot, Oxon. OX11 0QX, United Kingdom;
e Center for X-ray Optics, Lawrence Berkeley National Laboratory,1 Cyclotron Road, Berkeley, CA 94720, USA;
f Daegu Gyeongbuk Institute of Science and Technology, Daegu 711-873, Korea;g Department of Physics, University of California, Santa Cruz, California 94056, USA;
h Department of Materials Science and Engineering, University of Sheffield,Mappin Street, Sheffield S1 3JD, United Kingdom;
iDiamond Light Source, Didcot, Oxon. OX11 0DE, United Kingdom
ABSTRACT
Artificial spin ices are often spoken of as being realisations of some of the celebrated vertex models of statisticalmechanics, where the exact microstate of the system can be imaged using advanced magnetic microscopy methods.The fact that a stable image can be formed means that the system is in fact athermal and not undergoing the usualfinite-temperature fluctuations of a statistical mechanical system. In this paper we report on the preparationof artificial spin ices with islands that are thermally fluctuating due to their very small size. The relaxationrate of these islands was determined using variable frequency focussed magneto-optic Kerr measurements. Weperformed magnetic imaging of artificial spin ice under varied temperature and magnetic field using X-raytransmission microscopy which uses X-ray magnetic circular dichroism to generate magnetic contrast. We havedeveloped an on-membrane heater in order to apply temperatures in excess of 700 K and have shown increaseddynamics due to higher temperature. Due to the ‘photon-in, photon-out’ method employed here, it is the firstreport where it is possible to image the microstates of an ASI system under the simultaneous application oftemperature and magnetic field, enabling the determination of relaxation rates, coercivties, and the analysis ofvertex population during reversal.
Keywords: Artificial spin ice, vertex model, nanomagnetism, magnetic soft X-ray transmission microscopy
1. INTRODUCTION
Recently a new species of magnetic metamaterials has emerged, known as artificial spin ices (ASIs).1–3 Theyconsist of a lithographically patterned nanoscale magnetic islands arranged in a 2-dimensional array such thatthe islands are interacting through their stray fields and thereby exhibit magnetic frustration phenomena. Anearly report of such a system was made by Wang et al.,4 who studied magnetic square ice. A scanning electron
Further author information: (Send correspondence to C.H.M.)C.H.M.: E-mail: [email protected], Telephone: +44 113 3433780M.T.B.Present address: Department of Cardiovascular Science, University of Sheffield, Sheffield, S10 2RX.
Invited Paper
Spintronics VIII, edited by Henri-Jean Drouhin, Jean-Eric Wegrowe, Manijeh Razeghi, Proc. of SPIEVol. 9551, 95511Q · © 2015 SPIE · CCC code: 0277-786X/15/$18 · doi: 10.1117/12.2189320
Proc. of SPIE Vol. 9551 95511Q-1
Downloaded From: http://proceedings.spiedigitallibrary.org/ on 09/15/2015 Terms of Use: http://spiedigitallibrary.org/ss/TermsOfUse.aspx

C= C-11 ci
Date :23 Sep 2014
Aperture Size = 30.00 pet
Figure 1. Scanning electron micrograph of an artificial magnetic square ice array, formed from a pattern of Permalloyislands. The nanomagnets are sized so as to be single domain macrospins and shaped so as to to give Ising-like characterto those macrospins. The islands are arranged along the edges of a square lattice, leading to vertex-level frustration.
micrograph of an example of such a system is shown in Fig. 1. The size of the islands is small enough that theyact as single domain Stoner-Wohlfarth particles,5 and so can be modelled as possessing a macrospin. The shapeof the islands is designed so as to confine that spin to point along one of a pair of easy directions in the arrayplane and so are Ising-like. The name ‘artificial spin ices’ arises from the fact that they were originally designedto provide nanoscale analogs to the “naturally-occurring” 3-dimensional rare earth pyrochlores.6 These in turnare magnetic analogs of the most common form of water ice (Ice Ih), in which a closely related tetrahedral latticestructure leads to geometrical frustration in the position of protons, giving rise to an extensive degeneracy andresidual entropy.7 The pyrochlore spin ices show exactly the same value of residual entropy,8 and their excitationscan be treated as magnetic monopoles connected by Dirac strings of flipped rare earth moments.9
Both Ice Ih and the pyrochlore spin ices adopt a two-in/two-out ice rule at each 3-dimensional tetrahedralvertex. In water ice this is known as the Bernal-Fowler ice rule.10 In the square ices the vertices are of lower,square symmetry due to their 2-dimensional nature, as shown in Fig. 2(a). The magnetostatic coupling betweeneach pair of elements would prefer them to adopt a head-to-tail configuration on energetic grounds. Since this isnot possible for all six pairwise interactions simultaneously, this vertex possesses geometrical frustration. Thereare 24 = 16 possible arrangements of the four Ising-like moments, which are depicted in Fig. 2(b). These can
T1 T2
T3
T4( )a ( )b
y
x
Figure 2. Square ice vertex geometry. (a) The square ice ground state. Each magnetic nano-element possesses an Ising-likemoment, as indicated by arrows. The dashed box indicates a structural unit cell (with lattice constant a) containing asingle vertex, which possesses an area of a2. An example of a pair of 1st nearest neighbour moments is emboldened.Cartesian axes are also defined with reference to the sample frame. (b) The 16 vertex model of square ice. Vertices canbe arranged into four types, labelled Ti, in order of increasing energy, with i = 1 to 4.
Proc. of SPIE Vol. 9551 95511Q-2
Downloaded From: http://proceedings.spiedigitallibrary.org/ on 09/15/2015 Terms of Use: http://spiedigitallibrary.org/ss/TermsOfUse.aspx
be subdivided into four types, which are conventionally labelled Type 1-4 in order of increasing energy. Types1 and 2 obey the two-in/two-out ice rule. The two configurations that form Type 1 have their energy loweredwith respect to Type 2 by the lowered symmetry of the square vertex. These six vertex configurations possessno net magnetic charge: the poles at the centre of the vertex all cancel. The Type 3 configurations are eitherthree-in/one-out or one-in/three-out and possess a net magnetic charge, and so correspond to the monopoles ofCastelnovo et al.,9 although the reduced symmetry of the square lattice means that the monopoles and connectingstrings are of the Nambu type in square ASI systems.11 The two Type 4 configurations are all-in or all-out andare thus very energetic, possessing a double charge.
It has become a commonplace that ASIs are realisations of the “toy” square ice models of statistical mechanicsthat were solved long ago by researchers such as Wu12 and Lieb.13 Nevertheless, temperature T plays a key rolein statistical mechanics, but is irrelevant to most previously studied ASIs. This is because the relevant energyscales for the interisland coupling and island reversal barriers are of the order of 104-105 K for typical islandsizes and spacings, such as those shown in Fig. 1, and so these are athermal systems. Whilst it is possible todescribe these within an effective thermodynamics,14–17 the energy of the system does not extrapolate to theground state.18 Achieving true thermalisation has thus been an important goal of much recent ASI research.
This was achieved by Morgan et al. using a one-shot equilibration method where the islands have a smallenough volume during the early stages of growth to be thermally active, but then the thermalised state is frozenin as the elements continue to grow.19 The macrospin ice system has been shown to melt if it is heated close tothe Curie point of the underlying microspin system.20 Developing this concept, it has also been shown that itis possible to repeatedly thermalise an ASI system by using high temperatures to heat the sample in order toaccess dynamics, cool, then image the arrested state.21,22 Nevertheless, it is desirable to see the dynamics asthey happen in real time. More recently studies have been carried out on very thin samples using x-ray photo-emission electron microscopy (PEEM), and have shown real time thermal spin ice in both the kagome23,24 andsquare ice geometries.25 That work provided the first direct view of thermally active systems. However, sincePEEM requires photoelectrons to be extracted from the sample to form the image, magnetic fields cannot beapplied during imaging, which means that the sample is always in a remanent state. Here we use magnetic X-raytransmission microscopy (M-XTM), which is a method that only relies on photons, to image thermally activateddynamics in a square artificial spin ice under the application of a magnetic field. M-XTM experiments require thesample to be fabricated on an X-ray transparent membrane. We have also developed an on-membrane microheaterand thermometer system so that it was also been possible to explore the effect of both varied temperature andapplied field with direct imaging. In order to achieve thermally activated dynamics it is necessary to prepare ASIsystems with smaller elements than in the past, since the energy barrier that provides thermal stability is givenby KV , where K is the anisotropy constant provided by the island shape and V is the volume of an individualisland. Thus K = 1
2µ0DM2, where M is the magnetization of the material from which the island is fabricated and
D is a suitable demagnetizing factor. It can be seen that small volumes are needed to prevent complete freezingof the macrospin system. When fully melted, the macrospins are superparamagnetic and fluctuate at a rate f0that is typically 1-10 GHz, far too fast for single-shot magnetic imaging techniques. (Such fast processes may beimaged stroboscopically if they are entirely repeatable, the exact opposite of the random thermal fluctuationsthat we study here.) The relaxation rate 1/τ of a particular island is given by the Neel-Arrhenius expression
1
τ= f0 exp
(−∆E
kBT
), (1)
where kB is the Boltzmann constant and ∆E = KV + Ec. Here we define Ec as the modification to the energybarrier arising from the magnetostatic coupling to neighboring islands, which may be positive (stabilizing againstreversal) or negative (destabilizing), depending on the exact configuration of the moments of those islands. Wehave used the magneto-optic Kerr effect (MOKE) to probe the hysteresis of ASI systems at different frequenciesand island sizes in order to show how to tune our ASI systems into a size regime where τ is a few seconds, thetypical image acquisition time in a full-field transmission soft X-ray microscopy experiment. We show that theenergy barrier to reversal may be estimated from measured island flip rates and tuned with field. We report onvertex population statistics during thermally activated reversal of ASI arrays at different temperatures, wherea preference for monopole-antimonopole pair production over Nambu string extension was discovered. Thus weuse two optical methods, involving visible and soft X-ray photons, to study thermal activity in square ASIs.
Proc. of SPIE Vol. 9551 95511Q-3
Downloaded From: http://proceedings.spiedigitallibrary.org/ on 09/15/2015 Terms of Use: http://spiedigitallibrary.org/ss/TermsOfUse.aspx

Figure 3. Optical micrograph of the heater and thermometer design for the on-membrane sample heating. The wiring isinductively counterwound in order to avoid magnetic fields at the sample position.
2. FABRICATION OF ARTIFICIAL SPIN ICES
The ASIs used in these experiments were fabricated by electron beam lithography (EBL) and sputter depositionof magnetic metals. The ASIs used in the MOKE experiments were made using 10 nm thick Permalloy (Ni81Fe19)films with a 3 nm aluminium cap and standard liftoff methods. For the M-XTM experiments, a magnetic filmwas deposited by sputtering using an alloyed Co68Fe22B10 target on to a Si3N4 membrane to form a film that was10 nm thick. EBL was used to expose the ASI array, of nanomagnets with lateral dimensions of 80 × 250 nm, witha lattice spacing of 500 nm. A hard mask was then deposited using electron beam evaporation and lift-off afterwhich a Ar ion-beam milling removed the unpatterned CoFeB and mask, to leave CoFeB nanostructures with10 nm thickness. A microheater and thermometer were then patterned using EBL around the samples in orderto control the temperature, as shown in Fig. 3. Pt was used as the evaporated material for the resistive heatingand thermometry, since its resistivity has a linear dependence on temperature. The thermometer was calibratedby immersing the membrane in a bath of deionised water and measuring the four-point thermometer resistanceas the temperature was raised after the microscopy experiment was completed. The maximum temperature weapplied during the experiment was 705 K, obtained with a heater current, Ih = 5 mA.
3. FOCUSSED MAGNETO-OPTIC KERR EFFECT MEASUREMENTS
The magneto-optic Kerr effect (MOKE) is a convenient way to measure small magnetic structures. Here we usedfocussed MOKE26 (fMOKE) to measure the coercive field Hc of Permalloy ASI arrays as a function of time ttaken to complete a hysteresis loop. The need to focus the the laser spot to ∼ 5 µm diameter was due to themicron scale of the artificial spin ice arrays. The fMOKE setup was similar to that described by Allwood et al.26
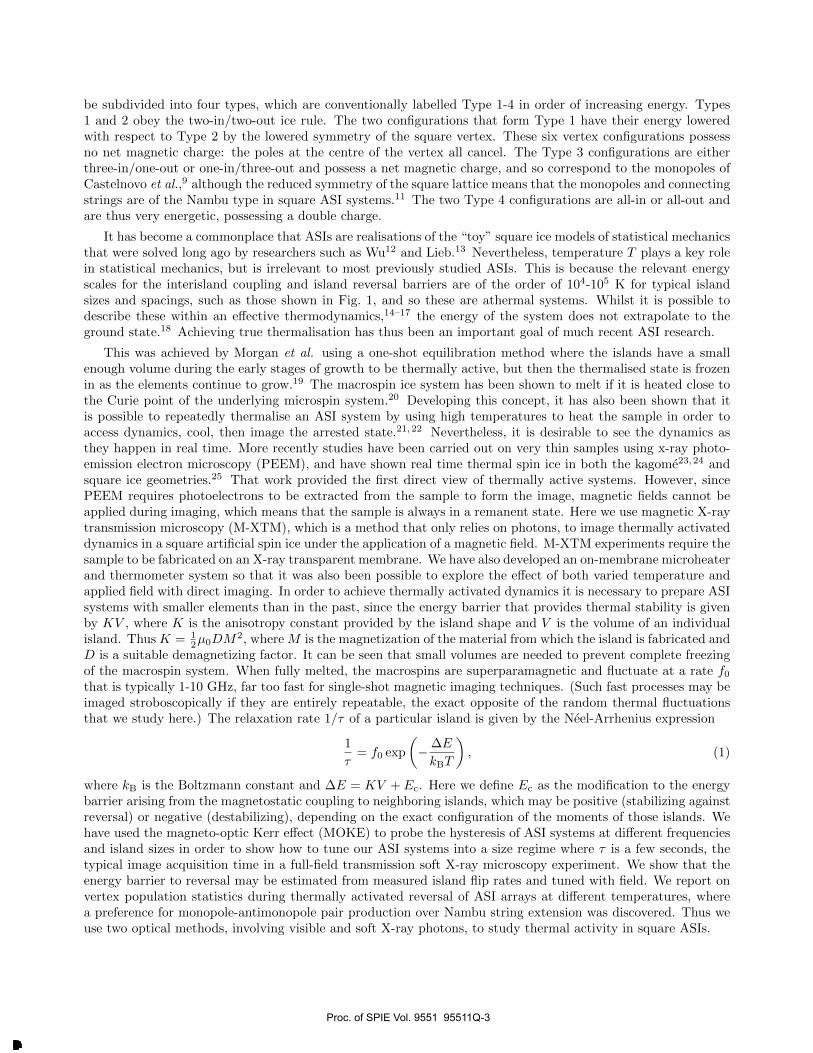
The measurements were made under an applied magnetic field that oscillated in time with a sinusoidal waveprofile. The period of the oscillation is defined as the time period t. Some example hysteresis loops, each theaverage of many loops acquired during the field oscillation, are shown in Fig. 4. In this case the Permalloy islandshave lateral size 18 nm × 56 nm and are 10 nm thick. When cycled at the quickest rate, which in this case is fort = 0.04 s, substantial hysteresis is present. This is gradually lost as the period of the field oscillation is increased.When the hysteresis loop is traversed at a slow rate, so that t = 10.0 s, the coercivity has almost vanished. Thisis because the nanoislands are able to thermally relax over their energy barriers whilst the measurement is takingplace, they are not able to do this when the loop is traversed quickly and so in that case coercivity is maintained.
These measurements were performed for several different islands sizes and the coercive fieldHc was determinedfor each size and field oscillation period t. A summary of the data is shown in Fig. 5. For larger island sizes–viz.
Proc. of SPIE Vol. 9551 95511Q-4
Downloaded From: http://proceedings.spiedigitallibrary.org/ on 09/15/2015 Terms of Use: http://spiedigitallibrary.org/ss/TermsOfUse.aspx
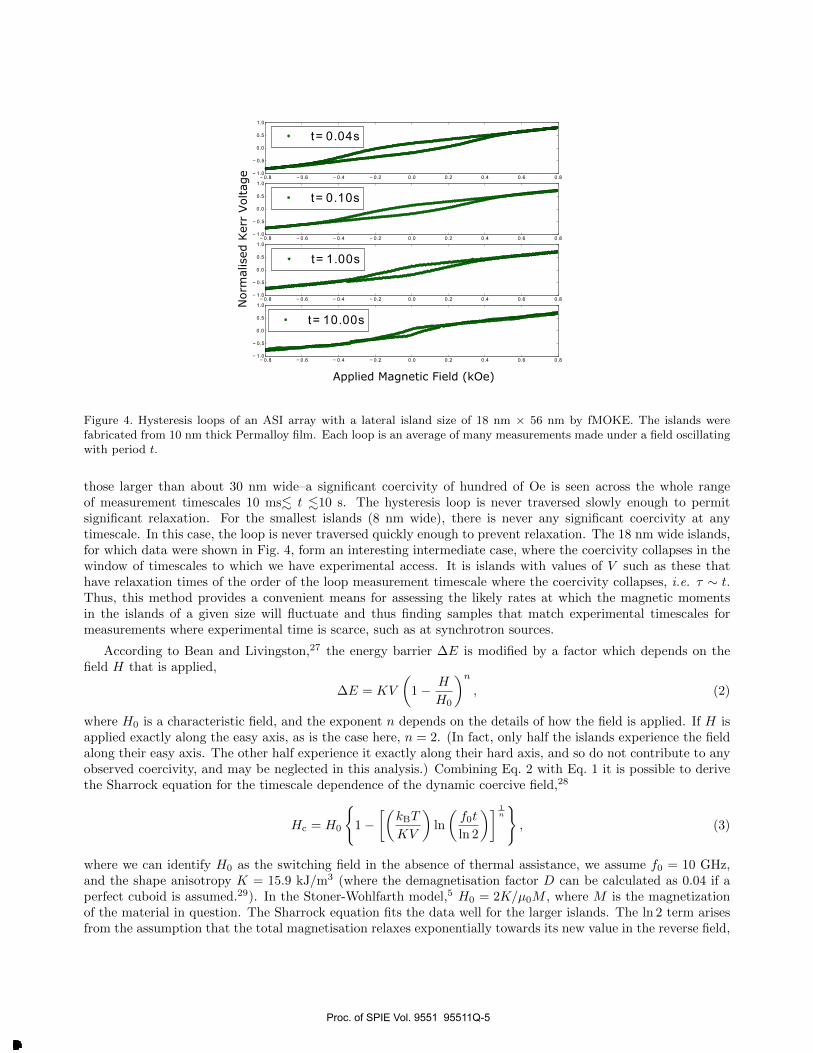
Figure 4. Hysteresis loops of an ASI array with a lateral island size of 18 nm × 56 nm by fMOKE. The islands werefabricated from 10 nm thick Permalloy film. Each loop is an average of many measurements made under a field oscillatingwith period t.
those larger than about 30 nm wide–a significant coercivity of hundred of Oe is seen across the whole rangeof measurement timescales 10 ms. t .10 s. The hysteresis loop is never traversed slowly enough to permitsignificant relaxation. For the smallest islands (8 nm wide), there is never any significant coercivity at anytimescale. In this case, the loop is never traversed quickly enough to prevent relaxation. The 18 nm wide islands,for which data were shown in Fig. 4, form an interesting intermediate case, where the coercivity collapses in thewindow of timescales to which we have experimental access. It is islands with values of V such as these thathave relaxation times of the order of the loop measurement timescale where the coercivity collapses, i.e. τ ∼ t.Thus, this method provides a convenient means for assessing the likely rates at which the magnetic momentsin the islands of a given size will fluctuate and thus finding samples that match experimental timescales formeasurements where experimental time is scarce, such as at synchrotron sources.
According to Bean and Livingston,27 the energy barrier ∆E is modified by a factor which depends on thefield H that is applied,
∆E = KV
(1− H
H0
)n
, (2)
where H0 is a characteristic field, and the exponent n depends on the details of how the field is applied. If H isapplied exactly along the easy axis, as is the case here, n = 2. (In fact, only half the islands experience the fieldalong their easy axis. The other half experience it exactly along their hard axis, and so do not contribute to anyobserved coercivity, and may be neglected in this analysis.) Combining Eq. 2 with Eq. 1 it is possible to derivethe Sharrock equation for the timescale dependence of the dynamic coercive field,28
Hc = H0
{1−
[(kBT
KV
)ln
(f0t
ln 2
)] 1n
}, (3)
where we can identify H0 as the switching field in the absence of thermal assistance, we assume f0 = 10 GHz,and the shape anisotropy K = 15.9 kJ/m3 (where the demagnetisation factor D can be calculated as 0.04 if aperfect cuboid is assumed.29). In the Stoner-Wohlfarth model,5 H0 = 2K/µ0M , where M is the magnetizationof the material in question. The Sharrock equation fits the data well for the larger islands. The ln 2 term arisesfrom the assumption that the total magnetisation relaxes exponentially towards its new value in the reverse field,
Proc. of SPIE Vol. 9551 95511Q-5
Downloaded From: http://proceedings.spiedigitallibrary.org/ on 09/15/2015 Terms of Use: http://spiedigitallibrary.org/ss/TermsOfUse.aspx
0
400
800
1200
0.001 0.1 10 1000
33x10338x11943x13548x15018x5613x418x25
time (s)
Coerc
ive F
ield
, H
c (
Oe)
Figure 5. Coercive field measurements by fMOKE for islands of different sizes. Lateral island size is given in the legend innm and each array was measured using different times to complete the hysteresis loop. The solid lines are fits of Eq. 3.
with exactly half the particles having flipped their moments at Hc. In this simple analysis we have assumed thatKV � Ec.
It can be seen that H0 actually rises in this regime as the islands shrink. This is due to the fact that as theislands get smaller there is less opportunity for that magnetization to be non-uniform at their tips,30 meaningthat their reversal is better described as a coherent rotation of a Stoner-Wohlfarth macrospin.5 This is furthersupported by fact that the the values for the volume returned by the Sharrock fits are actually larger for thesmaller islands, equating to a lateral island area ≈ 5000 nm2 for the 33 and 38 nm islands compared to ≈ 3500nm2 for the 43 and 48 nm islands; suggesting there is a smaller activation area which begins the island reversalfor the larger islands. The Sharrock equation cannot be fitted to the data for smallest islands (< 33 nm) notunexpected, since the assumption that t� f−1
0 , which forms part of the derivation, does not hold in that case.
4. MAGNETIC SOFT X-RAY TRANSMISSION MICROSCOPY
4.1 Microscope characteristics
We now turn to experiments where we have performed real-space imaging of this reversal process as it takesplace. These measurements were done at the full-field soft X-ray microscope, XM-1, located at beamline 6.1.2at the Advanced Light Source. This microscope has a spatial resolution of about 25 nm can be recorded with anexposure time of a few seconds covering a several micrometer large field of view.31 All images were taken at theCo L3 edge (778 eV) with circularly polarised X-rays of a fixed helicity. This provided strong X-ray magneticcircular dichroism (XMCD) contrast arising from the high Co content of the CoFeB alloy used: a nanomagnetwhose moment is oriented parallel to the X-ray propagation vector will have absorption different from one thathas its an anti-parallel, for X-rays at this energy, and this provides the magnetic contrast mechanism. A back-thinned, back-illuminated 2048×2048 pixel CCD camera acts as a detector to form the image, so the absorptionis directly measured. Since this method requires differences in magnetisation along the X-ray beam axis, usuallythe technique is used for samples whose moment lies out-of-the-plane. In order to be sensitive to the in-planemagnetism of our samples it was necessary to tilt the sample 30◦ out of the plane. A sample CCD image is shownin Fig. 6(a). Fig. 6(b) shows the magnetic contrast image after dividing two consecutive images with increasingreversal field, darker contrast indicates those islands that have switched their moment orientation during thefield step. Here the sample is aligned in such a way that the field is applied in the film plane and along a diagonalof the ASI array, so that all islands have their magnetic easy axis, which is defined by their shape, at 45◦ to thefield direction.
Proc. of SPIE Vol. 9551 95511Q-6
Downloaded From: http://proceedings.spiedigitallibrary.org/ on 09/15/2015 Terms of Use: http://spiedigitallibrary.org/ss/TermsOfUse.aspx

1
OA of OS or (z) emit pnitisW
0
Figure 6. (a) An absorption XTM image of the 80 × 250 nm2 ASI, exposure time is 1.3 s with 5 averages. b) Thecorresponding contrast image showing flipped islands as dark contrast, obtained by dividing consecutive raw absorptionimages. The islands that have flipped are highlighted in red in panel (a).
4.2 Thermal behaviour using field-modified barrier height
All nanomagnets have magnetisation which lies in the plane along their long axis, defined by the shape anisotropy.For these 80 nm × 250 nm islands, which are 10 nm thick, the demagnetisation factor D = 0.04. With thesaturation magnetisation of CoFeB measured by SQUID-vibrating sample magnetometry as MS ≈ 1.0 MA/m,we find the shape anisotropy K = 25.1 kJ/m3, yielding an energy barrier to reversal of KV/kB ≈ 3.6 × 10⁵ K.At T = 300 K, the ratio of KV/kBT ≈ 1210. At this ratio, thermal relaxation will be many orders of magnitudetoo slow to observe, according Eq. 1.
Hence, in our first experiment we attempted to observe thermally activated flipping events by adjusting thebarrier height with magnetic field according to Eq. 2. We measured the sample with 0.6 s exposure time and 5averages per image, giving a acquisition time of 3 s. The sample was first saturated in one direction and then anopposite field applied that was 90 % of Hc, we then continued taking images for a further 40 s. Shown in Fig. 7is the cumulative number of flips observed at each waiting time, which grows linearly with time. The slope of a
Figure 7. Number of thermally-assisted flipping events as a function of waiting time, after applying a reversal fieldequivalent to 90% of the coercivity. The solid line is a straight line best fit to the data, the slope of which gives theaverage flipping rate r = 0.12 ± 0.02 s−1.
Proc. of SPIE Vol. 9551 95511Q-7
Downloaded From: http://proceedings.spiedigitallibrary.org/ on 09/15/2015 Terms of Use: http://spiedigitallibrary.org/ss/TermsOfUse.aspx

0
20
40
60
80
100
400 500 600 700 800 900
705625555440390360298
Temperature (K)
Applied Magnetic Field (Oe)
No.
isla
nds r
evers
ed
Figure 8. Number of flipped islands as the field H is increased towards positive saturation for various different elevatedarray temperatures after negative saturation.
straight line fit to these data gives the observed flipping rate under these conditions, which was measured to ber = 0.12± 0.02 s−1. Inserting this rate r = 1/τ into Eq. 1 yields a ratio ∆E/kBT = 25.14± 0.02 at T = 300 Kif we assume f0 = 10 GHz.
Here, the field is at 45◦ to easy axis of all the islands. Under these circumstances, Harrell has shown thatn ∼ 1.45,32 close to the n = 3/2 value of the Victora expansion.33 Assuming that H0 ≈ Hc, inserting H/Hc = 0.9into Eq. 2 yields a an energy barrier ∆E that should be only 3.5 % of the zero field value. This implies a ratio∆E/kBT = 43 in this case. This value agrees reasonably well with the measured value, given the extremesensitivity of the exponential function in Eq. 1 to its argument, although this agreement is to some extentfortuitous given the uncertainty over the true value of quantities such as f0, and the fact that we have againneglected the inter-island coupling energy Ec. Assuming an activation volume smaller than the real islandvolume can also explain the discrepancy: the measured value of ∆E/kBT implies that the activation volume isapproximately half of the true volume.
500
750
1000
1250
400 500 600 700
T (K)
Hc (
Oe)
Figure 9. Coercive field Hc as a function of temperature T , derived from the data in Fig. 8. The line is a fit to the dataas described in the text.
Proc. of SPIE Vol. 9551 95511Q-8
Downloaded From: http://proceedings.spiedigitallibrary.org/ on 09/15/2015 Terms of Use: http://spiedigitallibrary.org/ss/TermsOfUse.aspx

0
0.2
0.4
0.6
0.8
1.0
480 560 640 720 800 880
Field (Oe)
P(v
)
T = 625 K
0
0.2
0.4
0.6
0.8
1.0
480 560 640 720 800 880
P (
v)
T = 390 K
0
0.2
0.4
0.6
0.8
1.0
480 560 640 720 800 880
Field (Oe)
T = 705 K
0
0.2
0.4
0.6
0.8
1.0
480 560 640 720 800 880
T2 initialT3T2T1T4
T = 555 K
Figure 10. The population of different vertex types, P (v), as a function of reversal field and shown for four temperatures;390, 555, 625, and 705 K.
Having established that the barrier height can be tuned using applied field, we then investigated the effectsof raising the temperature of the array. The samples were first saturated in a negative field along the arraydiagonal to set all the vertices into the same Type 2 configuration. The field was reversed to positive saturation,tracing out one branch of a hysteresis loop for the array. Fig. 8 shows the dependence of the hysteresis for thissample at different temperatures. These data show the field value at which the reversal is initiated but also howquickly it propagates as a function of temperature. It can be seen from the curves that there is little changebetween the data at room temperature and 440 K, however, as the temperature was increased further the reversalbegan at lower field values indicating the onset of thermally activated reversal at these measurement timescales,∼ 72 s (from 1.3 s and 5 averages for eleven field steps). There is also an increase in the number of islands whichreversed within the area. This data is plotted as coercivity Hc as a function of temperature T in Fig. 9 for thosetemperatures where a coercivity can be determined. It can be seen that there is a trend in decreasing coercivityof the array with temperature. We fitted this with Eq. 3, assuming f0 = 10 GHz and t = 100 s, and using thesame value of K as in the treatment of the flip rate data above. The Harrell value of n = 1.45 was used. Theresult is shown in Fig. 9 as a line. The fit returned H0 = 2100± 200 Oe and V = (1.9± 0.1)× 105 nm. The factthat V is a little below the actual island volume shows once again that these islands do not reverse through anfully ideal coherent rotation mechanism.
This onset of thermally activated dynamics as the temperature rises is related to the pre-melting behaviorof the macrospin system observed by Kapaklis et al. using a macroscopic magneto-optic measurements.20 Ouruse of a spatially resolving imaging method means that we are able to see exactly how the array begins to ‘melt’and track the different vertex populations as this happens.
4.3 Vertex populations
Since we start with a known state, i.e. a background of Type 2 vertices, when we image the changes in contrastof certain islands we are also able to assign the resulting vertex type. Using this information we can map out thevertices in both field and temperature phase space, as shown in Fig. 10, where we show the fractional populationsof the four different vertex types P (v), where v ∈ 1, 2, 3, 4 or 2initial. Type 2 vertices possess a dipole momentand here we have separated out the particular instance of Type 2 where that moment points along the initialsaturation direction as a distinct vertex type, along the lines of the background Type 2 vertex defined by Nisoli
Proc. of SPIE Vol. 9551 95511Q-9
Downloaded From: http://proceedings.spiedigitallibrary.org/ on 09/15/2015 Terms of Use: http://spiedigitallibrary.org/ss/TermsOfUse.aspx

et al. in their theory of effective temperature in a rotationally demagnetised square ice array.15 This allows usto distinguish between the saturated background and Nambu string defects that are carved in it by the field asit separates a monopole-antimonopole pair.
Our experiment extends the field-driven reversal measurements of Pollard et al.,34 who studied square ices, orMengotti et al., who studied kagome ices,35 from the athermal regime to the onset of thermalization. The dataare shown in Fig. 10 for four different measurement temperatures. At all four temperatures, the system beginswith P (2initial) = 1 and all other populations at zero. As the field is swept, P (2initial) then drops as verticesare converted into other types by individual islands flipping their vertices. The fact that particular populationsrise, indicates that there are preferred ways in which this can happen, due to the interisland coupling. We see alarger population of Type 3 excitations at higher temperatures, indicating an increased preference for nucleatingmonopole-antimonopole pairs over the propagation of strings through the sample. The latter would be signifiedby an increase in the values of P (2), which is less pronounced. There is also an increase of the highest energyvertices, Type 4, at the highest temperature, showing that the thermal energy is becoming sufficient to explorethe whole of phase space. This can be contrasted with the findings of Pollard et al., who found that reversalpredominantly occurs through the mechanism of string extension in the athermal limit.34
5. IN SUMMARY
We have been able to image directly the effect of increased temperature on the reversal of an ASI using a newlydeveloped on-membrane heating device. We have shown increased dynamics and changes to the coercivity inthe temeperature range 298 - 705 K. We have also been able to track the individual vertex populations as afunction of both field and temperature. As it is possible to apply magnetic fields during imaging, unlike electronbased techniques, such as PEEM or Lorentz-TEM, M-TXM offers a unique opportunity to study thermal flippingbehaviour with magnetic field. It also presents the possibility to push these frustrated nanomagnetic systemsout of equilibrium whilst studying the resulting microstates.
ACKNOWLEDGMENTS
This work was supported by the EPSRC (grant numbers EP/J021482/1 and EP/I000933/1), the Science andTechnology Facilities Council, and Diamond Light Source. Research carried out in part at the Center for Func-tional Nanomaterials, Brookhaven National Laboratory, which is supported by the U.S. Department of Energy,Office of Basic Energy Sciences, under Contract No. DE-AC02-98CH10886. X-ray microscopy studies were sup-ported by the Director, Office of Science, Office of Basic Energy Sciences, of the U.S. Department of Energy underContract No. DE-AC02-05CH11231. P. F. and M.-Y.I. acknowledge support by the Leading Foreign ResearchInstitute Recruitment Program (Grant No. 2012K1A4A3053565) through the National Research Foundation ofKorea (NRF) funded by the Ministry of Education, Science and Technology (MEST).
REFERENCES
1. C. Nisoli, R. Moessner, and P. Schiffer, “Colloquium: Artificial spin ice: Designing and imaging magneticfrustration,” Rev. Mod. Phys. 85, p. 1473, 2013.
2. L. J. Heyderman and R. L. Stamps, “Artificial ferroic systems: novel functionality from structure, interac-tions and dynamics,” J. Phys.: Cond. Matt. 25, p. 363201, 2013.
3. J. Cumings, L. J. Heyderman, C. H. Marrows, and R. L. Stamps, “Focus on artificial frustrated systems,”New J. Phys. 16, p. 075016, 2014.
4. R. F. Wang, C. Nisoli, R. S. Freitas, J. Li, W. McConville, B. J. Cooley, M. S. Lund, N. Samarth, C. Leighton,V. H. Crespi, and P. Schiffer, “Artificial ‘spin ice’ in a geometrically frustrated lattice of nanoscale ferro-magnetic islands,” Nature 439, p. 303, 2006.
5. E. C. Stoner and E. P. Wohlfarth, “A mechanism of magnetic hysteresis in heterogeneous alloys,” Phil.Trans. Roy. Soc. London A 240(826), p. 599, 1948.
6. S. T. Bramwell and M. J. P. Gingras, “Spin ice state in frustrated magnetic pyrochlore materials,” Sci-ence 294, p. 1495, 2001.
Proc. of SPIE Vol. 9551 95511Q-10
Downloaded From: http://proceedings.spiedigitallibrary.org/ on 09/15/2015 Terms of Use: http://spiedigitallibrary.org/ss/TermsOfUse.aspx
7. L. Pauling, “The structure and entropy of ice and of other crystals with some randomness of atomic ar-rangement,” J. Am. Chem. Soc. 57, p. 2680, 1935.
8. A. P. Ramirez, A. Hayashi, R. J. Cava, R. Siddharthan, and B. S. Shastry, “Zero-point entropy in ‘spinice’,” Nature 399, p. 333, 1999.
9. C. Castelnovo, R. Moessner, and S. L. Sondhi, “Magnetic monopoles in spin ice,” Nature 451, p. 42, 2008.
10. J. D. Bernal and R. H. Fowler, “A theory of water and ionic solution, with particular reference to hydrogenand hydroxyl ions,” J. Chem. Phys. 1, p. 515, 1933.
11. Y. Nambu, “Strings, monopoles, and gauge fields,” Phys. Rev. D 10, p. 4262, 1974.
12. F. Wu, “Exactly soluble model of the ferroelectric phase transition in two dimensions,” Phys. Rev. Lett. 18,pp. 605–607, 1967.
13. E. Lieb, “Exact solution of the problem of the entropy of two-dimensional ice,” Phys. Rev. Lett. 18, pp. 692–694, 1967.
14. C. Nisoli, R. Wang, J. Li, W. F. McConville, P. E. Lammert, P. Schiffer, and V. H. Crespi, “Ground state lostbut degeneracy found: the effective thermodynamics of ‘artificial spin ice’,” Phys. Rev. Lett. 98, p. 217103,2007.
15. C. Nisoli, J. Li, X. Ke, D. Garand, P. Schiffer, and V. H. Crespi, “Effective temperature in an interactingvertex system: Theory and experiment on artificial spin ice,” Phys. Rev. Lett. 105, p. 047205, 2010.
16. P. E. Lammert, X. Ke, J. Li, C.Nisoli, D. M. Garand, V. H. Crespi, and P. Schiffer, “Direct entropydetermination and application to artificial spin ice,” Nature Physics 6, p. 786, 2010.
17. J. P. Morgan, J. Akerman, A. Stein, C. Phatak, R. M. L. Evans, S. Langridge, and C. H. Marrows, “Realand effective thermal equilibrium in artificial square spin ices,” Phys. Rev. B 87, p. 024405, 2013.
18. X. Ke, J. Li, C. Nisoli, P. E. Lammert, W. McConville, R. F. Wang, V. H. Crespi, and P. Schiffer, “Energyminimization and ac demagnetization in a nanomagnet array,” Phys. Rev. Lett. 101, p. 037205, 2008.
19. J. P. Morgan, A. Stein, S. Langridge, and C. H. Marrows, “Thermal ground-state ordering and elementaryexcitations in artificial magnetic square ice,” Nature Phys. 7, p. 75, 2011.
20. V. Kapaklis, U. B. Arnalds, A. Harman-Clarke, E. T. Papaioannou, M. Karimipour, P. Korelis, A. Taroni,P. C. W. Holdsworth, S. T. Bramwell, and B. Hjorvarsson, “Melting artificial spin ice,” New J. Phys. 14,p. 035009, 2012.
21. J. M. Porro, A.Bedoya-Pinto, A. Berger, and P. Vavassori, “Exploring thermally induced states in squareartificial spin-ice arrays.,” New J. Phys. 15, p. 055012, 2013.
22. S. Zhang, I. Gilbert, C. Nisoli, G.-W. Chern, M. J. Erickson, L. O’Brien, C. Leighton, P. E. Lammert, V. H.Crespi, and P. Schiffer, “Crystallites of magnetic charges in artificial spin ice,” Nature 500, p. 553, 2013.
23. A. Farhan, P. M. Derlet, A. Kleibert, A. Balan, R. V. Chopdekar, M. Wyss, L. Anghinolfi, F. Nolting, andL. J. Heyderman, “Exploring hyper-cubic energy landscapes in thermally active finite spin-ice systems,”Nature Phys. 9, p. 375, 2013.
24. V. Kapaklis, U. B. Arnalds, A. Farhan, R. V. C. A. Balan, A. Scholl, L. J. Heyderman, and B. Hjorvarsson,“Thermal fluctuations in artificial spin ice,” Nature Nanotech. 9, p. 514, 2014.
25. A. Farhan, P. M. Derlet, A. Kleibert, A. Balan, R. V. Chopdekar, M. Wyss, J. Perron, A. Scholl, F. Nolting,and L. J. Heyderman, “Direct observation of thermal relaxation in artificial spin ice,” Phys. Rev. Lett. 111,p. 057204, 2013.
26. D. A. Allwood, G. Xiong, M. D. Cooke, and R. P. Cowburn, “Magneto-optical Kerr effect analysis ofmagnetic nanostructures,” J. Phys. D: Appl. Phys. 36, p. 2175, 2003.
27. C. P. Bean and J. D. Livingston, “Superparamagnetism,” J. Appl. Phys. 30, p. S120, 1959.
28. M. P. Sharrock, “Time dependence of switching fields in magnetic recording media (invited),” J. Appl.Phys. 76, p. 6413, 1994.
29. A. Aharoni, “Demagnetizing factors for rectangular ferromagnetic prisms,” J. Appl. Phys. 83, p. 3442, 1998.
30. C. Phatak, A. K. Petford-Long, O. Heinonen, M. Tanase, and M. De Graef, “Nanoscale structure of magneticinduction at monopole defects in artificial spin-ice lattices,” Phys. Rev. B 83, p. 174431, 2011.
31. P. Fischer, D.-H. Kim, W. Chao, J. A. Liddle, E. H. Anderson, and D. T. Attwood, “Soft X-ray microscopyof nanomagnetism,” Materials Today 9, p. 26, 2006.
Proc. of SPIE Vol. 9551 95511Q-11
Downloaded From: http://proceedings.spiedigitallibrary.org/ on 09/15/2015 Terms of Use: http://spiedigitallibrary.org/ss/TermsOfUse.aspx

32. J. W. Harrell, “Orientation dependence of the dynamic coercivity of Stoner-Wohlfarth particles,” IEEETrans. Magn. 37, p. 533, 2001.
33. R. H. Victora, “Predicted time dependence of the switching field for magnetic materials,” Phys. Rev. Lett. 63,p. 457, 1989.
34. S. D. Pollard, V. Volkov, and Y. Zhu, “Propagation of magnetic charge monopoles and Dirac flux strings inan artificial spin-ice lattice,” Phys. Rev. B 85, p. 180402, 2012.
35. E. Mengotti, L. J. Heyderman, A. F. Rodrıguez, F. Nolting, R. V. Hugli, and H.-B. Braun, “Real-spaceobservation of emergent magnetic monopoles and associated Dirac strings in artificial kagome spin ice,”Nature Phys. 7, p. 68, 2011.
Proc. of SPIE Vol. 9551 95511Q-12
Downloaded From: http://proceedings.spiedigitallibrary.org/ on 09/15/2015 Terms of Use: http://spiedigitallibrary.org/ss/TermsOfUse.aspx