temperature data logger protocols standard operating procedure
TRANSCRIPT

WQPBWQM-006 Rev#: 01
Date:4/11/2005 4/11/2005 Page 1 of 10
Temperature Data Logger Protocols Standard Operating Procedure
Montana Department of Environmental Quality Water Quality Planning Bureau
Approvals: __(Signature on file)____________________________04/11/05____________ Mike Stermitz, , MDEQ/WQB __(Signature on file)____________________________04/11/05____________ Mark Bostrom, QA Officer, MDEQ/WQB __(Signature on file)____________________________04/11/05____________ Rosie Sada, Water Quality Monitoring, MDEQ/WQB

WQPBWQM-006 Rev#: 01 Date: 4/11/2005 Page 2 of 10 Table of Contents
1. Temperature Data loggers ........................................................................................ 3
1.1. Develop a Sampling and Analysis Plan .............................................................. 3 2. Scope and Applicability............................................................................................. 3 3. Summary of Tasks ..................................................................................................... 3 4. Definitions................................................................................................................... 4 5. Cautions ...................................................................................................................... 4 6. Interferences............................................................................................................... 4 7. Personnel Qualifications ........................................................................................... 4 8. Equipment & Supplies .............................................................................................. 4 9. Procedure.................................................................................................................... 5
9.1. Pre and post deployment accuracy check ........................................................... 5 Accuracy Check....................................................................................................................... 6
9.2. Project Deployment and Launch......................................................................... 8 9.3. Data offloading ................................................................................................... 9 9.4. Data Acquisition, Calculation & Data Reduction Requirements........................ 9 9.5. Data Handling for STORET ............................................................................. 10
10. References.................................................................................................................. 10 List of Attachments: Attachment 1 – Continuous Data Logger Field Form Attachment 2 – Temperature Data logger Launch Request Form Attachment 3 – Instructions of Excel Temperature Macro Version 1.1

WQPBWQM-006 Rev#: 01 Date: 4/11/2005 Page 3 of 10 1. Temperature Data loggers This procedure is intended to reduce the variability of temperature logger data due to differences in sampling technique and data handling.
1.1. Develop a Sampling and Analysis Plan A prerequisite to field data collection activities is the development of a DEQ approved Sampling and Analysis Plan (SAP). DEQ will not authorize the use of temperature data loggers owned by the Department without an approved SAP describing the objectives of the study and intended use of the data. SAPs must be submitted to the Monitoring Section Supervisor three weeks prior to the expected project start date. Information required for a SAP can be found in the QA guidance document, Guidance for development of Sampling and Analysis Plans (SAPs), WQPBDMS-004. This document is available either from the DEQ Website or from the DEQ QA Officer, Mark Bostrom (444-2680). Note to Project Officers: Submission of a SAP must include a completed launch request form (Attachment 2) and creation of a folder for project data on the Network at: G:\WQP\WQ_DATA\TempLoggers\Year
2. Scope and Applicability This procedure describes guidelines for the placement, retrieval, and documentation requirements (electronic and field forms) for temperature data loggers at wadeable stream sites. Temperature monitoring typically requires multiple data loggers deployed in a predetermined sampling design to collect information. Describing sampling designs is beyond the scope of this procedure because the objectives of each individual study cannot be known until the problem is identified. This SOP uses the approach of describing the activities required for a single data logger, which will be repeated throughout the applicable sampling design. This procedure does not cover lakes, reservoirs, and large non-wadeable rivers. 3. Summary of Tasks
Develop work plan Pre-deployment logger accuracy check Launch Logger (program or activate) Select site & record information Deploy (place) logger Mid deployment visit Retrieve logger Off load data Post-deployment logger accuracy check Data Validation Primary data use SIM Data Entry

WQPBWQM-006 Rev#: 01 Date: 4/11/2005 Page 4 of 10 4. Definitions Accuracy check – The accuracy check is a pre and post project verification that the data logger is operating correctly. This verification if performed against a NIST thermometer. BoxcarPro – Software used to launch and offload data from data logger. Deploy logger – Deployment is the placement of a data logger at the study site. Launch logger – Launch is the setting of the interval, date, and time of data collection. Logger – Big burly guy in a flannel shirt (just kidding, see optic stowaway below) Optic StowAway – The Optic StowAway is a temperature data logger produced by Onset Corp. Retrieve logger – Retrieval is the collection of the logger from the field. 5. Cautions There are no particular health and safety considerations for handling temperature data loggers. General health and safety precautions for fieldwork in and around swift flowing waters in remote locations must be considered. Be cautious of under cut banks that could collapse, loose or slippery rocks, and wild animals (Grizzly and Black Bears, Mountain Lions, Rattlesnakes, Etc.)
Although the Optic StowAway case can survive some abuse, the electronics inside the case are fragile and should be treated as such by protecting from harsh treatment and environments. 6. Interferences To guarantee instrument specified accuracy, Optic StowAway units should not be used in condensing environments and water temperatures higher than +30°C (+86°F) for more than 8 weeks cumulatively. Prolonged exposure will lead to measurement drift and eventual failure. Flow changes could leave the instrument high and dry, limiting the usefulness of instream temperature readings. Also, data loggers could become buried in sediment invalidating data. Do not deploy in direct sunlight, as the dark case will absorb sunlight, possibly leading to a false positive bias. 7. Personnel Qualifications The person responsible for launch and deployment of the temperature data loggers must be able to read and understand the Boxcar Pro software users guide and operate a computer running MS windows 95/98/NT4 or later operating system. Environmental resource professionals with a Bachelors of Science degree or higher and a thorough understanding of State Water Quality Standards should make data interpretations. 8. Equipment & Supplies For accuracy check (pre & post project): • Thermographs (Optic StowAway)
o Instrument Specifications: http://www.hobohelp.com/Product_Pages/temperature_pages/6512_ostowaway.html
• Thermograph protective cases • NIST Certified Thermometer • Two large (48 Quart) coolers

WQPBWQM-006 Rev#: 01 Date: 4/11/2005 Page 5 of 10 • 10 lbs of cube ice • Field meters (good idea to verify field instruments during temp data logger accuracy check!) • Temperature logger accuracy check forms or computer with electronic versions. • Laptop computer with 9 pin com port • Boxcar Pro software - Users Guide “BCPRO4HELP.HLP” available at:
o G:\WQP\WQ_DATA\TempLoggers\1 - SOP WQPBWQM-006\Supporting Documents
For Launch, deployment and retrieval: - Thermographs (Optic StowAway) - Waders - Securing devices (rebar, large spikes, divers weights, aircraft cable, Zipties, locks, etc.) - Cable cutters and crimping tool - 2 lb. Sledgehammer - Laptop computer with launching software - Tape Measure - Flow meter & rod - GPS receiver - YSI or Horiba field meter - Digital camera - Flagging - Pencil - Continuous Data Logger Field Forms on write in the rain paper (Attachment 1) - First aid kit and State ID For data Offloading: - Retrieved data loggers - Optic shuttle, or Optic Coupler with computer running Boxcar software. 9. Procedure There are a limited number of data loggers available and numerous studies are conducted across the state placing a high demand on the available equipment. Authorization to launch data loggers is given by the monitoring section supervisor. This authorization to use the data loggers requires a Sampling and Analysis Plan (SAP). Projects needing data loggers should plan well in advance and have SAPs submitted to the monitoring section supervisor with sufficient time for them to be reviewed and accepted (at least 3 weeks). Project plans submitted at the last minute may result in an insufficient supply of loggers for the project.
Launch Request Form - With the submission of a SAP, include a launch request for the project. This can be made with the Launch Request Form included as Attachment 2 to this SOP. DEQ Staff will use the launch request to initiate the accuracy check and field forms used for the project and return these with the requested loggers.
9.1. Pre and post deployment accuracy check The accuracy of a temperature recorder needs to be tested before and after field use to verify it operated correctly for the duration of deployment. The number of data loggers required for the project must be included in the SAP and on the Launch Request Form. For this accuracy check, consider that some of the temperature loggers could fail. As a rule of thumb, run an
WQPBWQM-006 Rev#: 01 Date: 4/11/2005 Page 6 of 10
extra 5-10% through the accuracy check to eliminate the need to repeat the entire procedure in the event one or more loggers fail QC.
A MS Excel template for the accuracy check has been developed that automatically verifies the time and temperatures recorded by the instrument against the time and temperatures recorded (manually) for the NIST thermometer. It flags any time discrepancies as well as the first temperature value in the sequence that exceeds +/- 0.5oC difference from the NIST temperature. A copy of the template is available at: G:\WQP\WQ_DATA\TempLoggers\1 - SOP WQPBWQM-006\Supporting Documents Save a copy of this template to the project folder (folder created by the DEQ project officer as required in Section 1.1 of this SOP). This folder will be used as the working directory for all folders and files created for this project. Save this version of the template as: Accuracy_Check_project name.xls.
Accuracy Check This accuracy check will be a two-point calibration (cold and ambient temperature). Caution – launching data loggers clears the memory from the previous data collection activity (downloading does not). If the data presently held in the data logger is not located at G:\WQP\WQ_DATA\TempLoggers, it may be prudent to save a back-up file of the existing temperature data. Prepare Water Baths - prepare two water baths in 48-quart coolers. Note: For the cold-water bath, it is best to have a cooler with a pass through hole for the NIST thermometer so that the lid can remain closed (promoting a more stable temperature). Also, the data loggers will suspend in the water and collect readings from the top. The NIST thermometer must read from the same depth as the logger’s sensor in both coolers. The first bath is filled ½ full with tap water that is as close to the ambient room temperature as reasonably possible. Allow this cooler to sit overnight to equilibrate to with room temperature. The second bath is filled ½ full with cold tap water and 10 lbs of cube ice added. Allow coolers to sit for at least two hours to stabilize, stirring occasionally.
When ready to begin the temperature check, stir both baths to homogenize and distribute temperature stratification. Ice remaining in the cold temperature bath should be removed if any is remaining. Launch accuracy check - Follow launch instructions in the Boxcar Pro 4 Users Guide (see section 8 of this SOP for network location of BCPROHELP.HLP). Launch data logger with a 2-minute interval for the accuracy check. The duration of the accuracy check will be 8 minutes resulting in 5 readings. It is best to program a delayed start for a predetermined time to commence recording after bath & instrument equilibration (see estimated times below) so that the first five temperatures recorded can be simply copied and pasted from the resulting file.
WQPBWQM-006 Rev#: 01 Date: 4/11/2005 Page 7 of 10
Note: For the accuracy check, it is not necessary to export temperature in both Celsius and Fahrenheit because it will be compared against the NIST thermometer, which only uses degrees Celsius. However, temperature for projects should be recorded in both Celsius and Fahrenheit to make direct comparison to state water quality standards (standards expressed as Fahrenheit). After launching loggers, deploy them in the cold-water bath (ice removed) and allow the units to equilibrate for ½ hour. At the end of this period, insert NIST Thermometer in the water bath and allow it to equilibrate for ½ hour. Bath has reached equilibrium when readings from NIST thermometer are within +/- 0.2oC for five minutes. Once bath temperature, loggers and NIST thermometer equilibrate, begin taking NIST temperature readings at the predetermined time for the delayed start and continue at two-minute intervals. Use even numbered minutes as shown from THE COMPUTER RUNNING BOXCAR SOFTWARE. This will assure that the data logger and NIST recordings represent the same time. Take five recordings over eight minutes (at 0, 2, 4, 6, and 8 minutes). Record time and NIST temperature in your accuracy check spreadsheet in the format: 3/18/2005 4:16:00 PM
This sequence should be repeated if the NIST thermometer demonstrates that
temperature bath equilibrium is lost (indicated by >0.5oC increase or decrease over 10 minutes). It is expected that the cold water bath will warm slightly once the ice is removed and during the accuracy check. The goal is to have a relatively stable temperature and any increases recorded off of the NIST thermometer (up to 0.5oC) matched by the data loggers.
Do not stir the bath with the NIST thermometer! Always store NIST thermometer in its case with lid on securely when not in use. Verify that all temperatures are correctly recorded in the accuracy check
template before moving on to the warm water bath. Remove temperature loggers from cold bath and allow them to acclimate to air temperature prior to placing them in the warm bath (estimated time 20 minutes). Place the loggers in the ambient bath. Allow ½ hour for bath temperature to once again stabilize and data recorders to adjust. At the end of this period, insert NIST Thermometer in the water bath and allow it to stabilize for ½ hour. Bath is stabilized when readings from NIST thermometer are within +/- 0.1oC for five minutes. Repeat temperature recording sequence.
Offload Accuracy Check –Before proceeding with the offload verify that all NIST temperature readings and corresponding computer times are recorded correctly in the template.
Follow the downloading instructions in the Boxcar Pro 4 Users Guide. It may be helpful to arrange the data loggers in numerical sequence when downloading. The data logger produces files (serial#.dtf) for each temperature logger. Save these to the “accuracy check project name” folder. Each dtf file produced will have to be exported/converted so that it may be opened in a spreadsheet program.

WQPBWQM-006 Rev#: 01 Date: 4/11/2005 Page 8 of 10
Follow the instructions in the Boxcar Pro 4 users guide for exporting plot data. With the dtf file open in boxcar, export a file using the “export Excel” button. This actually produces a “*.txt” file rather than an “*.xls” file, but their heart was in the right place! It will be easier to keep track of the files you have open if the serial number is included in the data export. Check the box “Include Serial Number in Data Export”. Export all data from loggers and save in accuracy check folder. These basic txt files will have to now be opened in MS Excel. Open your accuracy check template that was used to record the NIST temperatures. Split the excel window. Open all exported data files in MS Excel and copy the data corresponding to the NIST recorded times. Note: When opening these with Excel, a box will be displayed presenting options regarding data delimiters. To accept the defaults, simply press Finish (the txt file downloaded from Boxcar is set to the standard delimiters in this screen).
Review Accuracy Check (Pre-deployment)- Review the results of the pre-deployment accuracy check. Set aside any data loggers that failed to record within +/- 0.5oC of the NIST thermometer reading. These should be kept in a box labeled “failed accuracy check”. They may still be good but failed because of equilibrium problems or some other reason. QA will perform a more rigorous check of these and discard any that fail.
Review accuracy check (Post deployment)- Review the results of the post-deployment accuracy check. Data failing a post-deployment accuracy check must not be used. To note the failure, write, “failed post-deployment accuracy check” under retrieval notes in the continuous data logger field form. Retain the electronic (*.dtf and *.txt files) versions of the data. Make an appropriately named folder under the project folder (e.g., “failed_accuracy”) for retaining the results. Place the logger that failed the post-deployment accuracy check in the box marked “failed accuracy check” for QA to take a look at. These will most likely be discarded.
9.2. Project Deployment and Launch Placement Procedures- Note: This section assumes the SAP addresses site selection. Study objectives, (e.g., temperatures in refugia, point source measures, etc.) could require a different placement procedure. If so, describe in SAP. A list of suggested equipment for placement and retrieval are described in Section 8 of this SOP. Once a site is selected, document the logger serial number on the Continuous Data Logger Field Form accompanying the data loggers. Record Latitude and Longitude from a GPS unit (Datum NAD83) and record on the continuous data logger field form. Judging from the substrate and other physical attributes of the stream, select the appropriate gear to secure the data logger in the channel. Locate a spot that is in a well-mixed portion of the stream, typically in or very near the thalweg. The thalweg is also the portion of the stream that is most likely to remain flowing for the longest period of time. Shaded sites with moderately turbulent flows, such as the tailouts of lateral scour and plunge pools tend to make good logger placement spots.
WQPBWQM-006 Rev#: 01 Date: 4/11/2005 Page 9 of 10
Note: Placements should be shaded from direct sunlight to prevent a positive bias due to the instrument itself absorbing heating from the sun). Other interferences could include localized warm or cool water sources such as ground water and point sources. Verify that the logger is placed in a well-mixed portion of the stream using a hand held thermometer or field meter (No Mercury Allowed!). The site should not be susceptible to excessive scour that could move the logger. Secure the logger by cable to a structure that will not move in the event of a large run-off. This structure may have to be placed, (e.g., drive a piece of rod iron into the substrate). Mark site with identifying tape. Provide a narrative site description and deployment location on the field form. Note prominent landscape features, driving directions, etc. so that site can be relocated for retrieval. On the back of the form, draw a picture (boxes for 9 drawings). As a back up, digital pictures can be taken of the placement. Record the date and time of deployment when finished. Quality Control - This procedure relies on the pre and post accuracy checks to verify that the instrument was recording accurately. To measure precision over the course of a study, two loggers can be placed at a site creating a replicate measures of the sampling point. Replicates measures are typically performed at a 10% frequency. The data quality objectives for the study included in the monitoring plan should indicate QC frequency if different. The values obtained from a replicate deployment should not vary more than +/- 0.5 degrees C for readings taken at the same time. Mid-season visit - Whenever feasible, it is recommended to make a mid-season visit to the site to make any adjustments necessary. These should check to verify that the instrument isn’t high and dry or buried in the substrate. Record the visit on the field form including date, time and any adjustments made. Logger Retrieval - Upon arrival to collect the logger, document the condition of the site and the logger. At a minimum, record if the logger is still in the water or not, signs of vandalism or disturbance. Record the time and date of retrieval on the field form.
9.3. Data offloading The procedure for offloading data is described in the Boxcar Pro Operations manual. Save files in the project folder on the DEQ network folder. Caution, don’t save study data under the accuracy check folder because they will have the same file names as those from the accuracy check. It is best to save these directly to the project folder. Project officers are responsible for managing their data and any data work-up.
9.4. Data Acquisition, Calculation & Data Reduction Requirements Instructions for data work-up with an Excel Temperature Macro are provided in Attachment 3.
WQPBWQM-006 Rev#: 01 Date: 4/11/2005 Page 10 of 10
9.5. Data Handling for STORET A STORET Import Module (SIM) template has been developed in MS Excel for packaging temperature logger data for STORET loading. This file is named “SIMTemplate_Tempdata” and is available in the supporting documents folder of this SOP. The template includes basic instructions regarding required fields for both field metadata and information pertaining to the temperature logger itself. The responsibility for completing the SIM template resides with the party who designed or ordered the project.
10. References Idaho Division of Environmental Quality (Zaroban, D.W.) 2000, Water Quality Monitoring Protocols – Report No. 10, Protocol for Placement and Retrieval of Temperature data Loggers in Idaho Streams. Oregon Department of Environmental Quality 1996, Water Quality Monitoring Guidebook, Chapter 6, Stream Temperature Protocol. Onset Corporation 1999, Boxcar Pro4 Users Guide.

WQPBWQM-006
Attachment 1
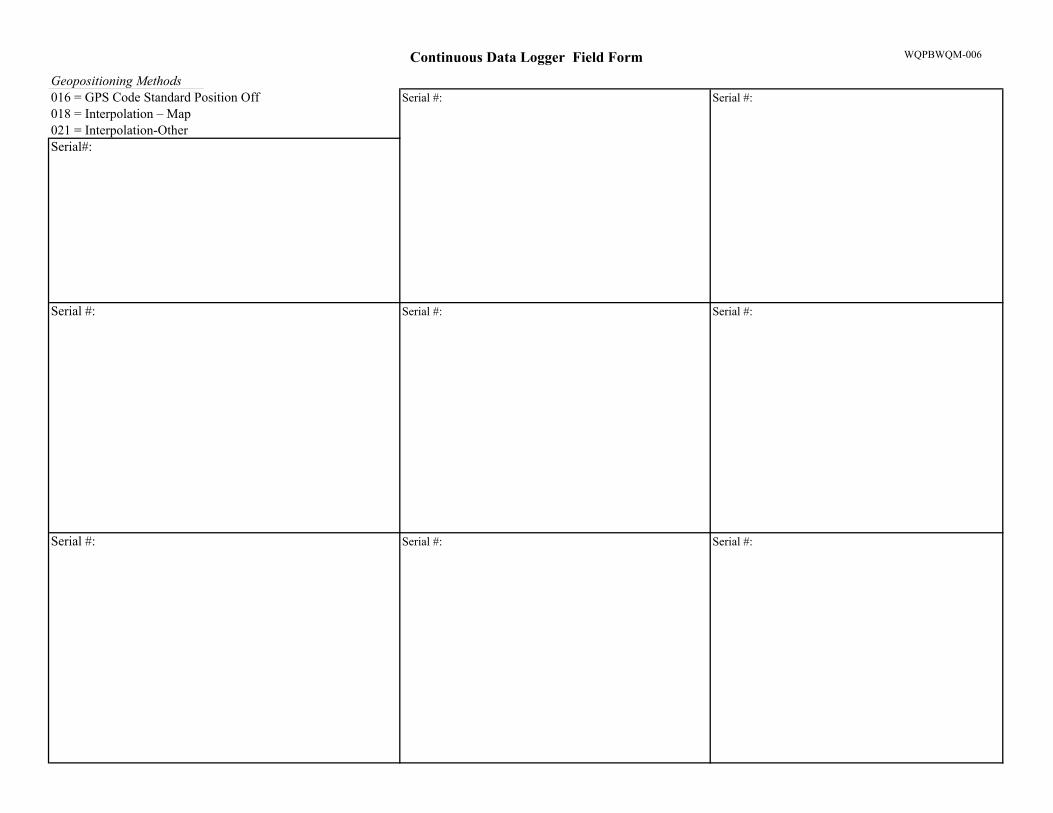
Continuous Data Logger Field Form

Continuous Data Logger Field Form WQPBWQM-006
Waterbody: Medium: Water AirStation Primary & Secondary Type: River/Stream None If other than river/stream describe:_____________________ Interval (hh:mm) :
Geopositioning Method & Datum: NAD83 See back for methods. If datum is not NAD83 describe below Launch date/time:County: Logger Make/Model:HUC: Project:
Serial # Latitude Longitude Date/Time Date/Time
This form has 11 positions (10 sites, 1 replicate) for a 10% QC frequency.
Retrieval InformationDeployment Information (draw map on back of this form if this is not an easily located site)NotesSite description & Deployment Location, Air Temp.
Continuous Data Logger Field Form WQPBWQM-006
Geopositioning Methods016 = GPS Code Standard Position Off Serial #: Serial #:018 = Interpolation – Map021 = Interpolation-OtherSerial#:
Serial #: Serial #: Serial #:
Serial #: Serial #: Serial #:

WQPBWQM-006
Attachment 2
Temperature Data Logger Launch Request
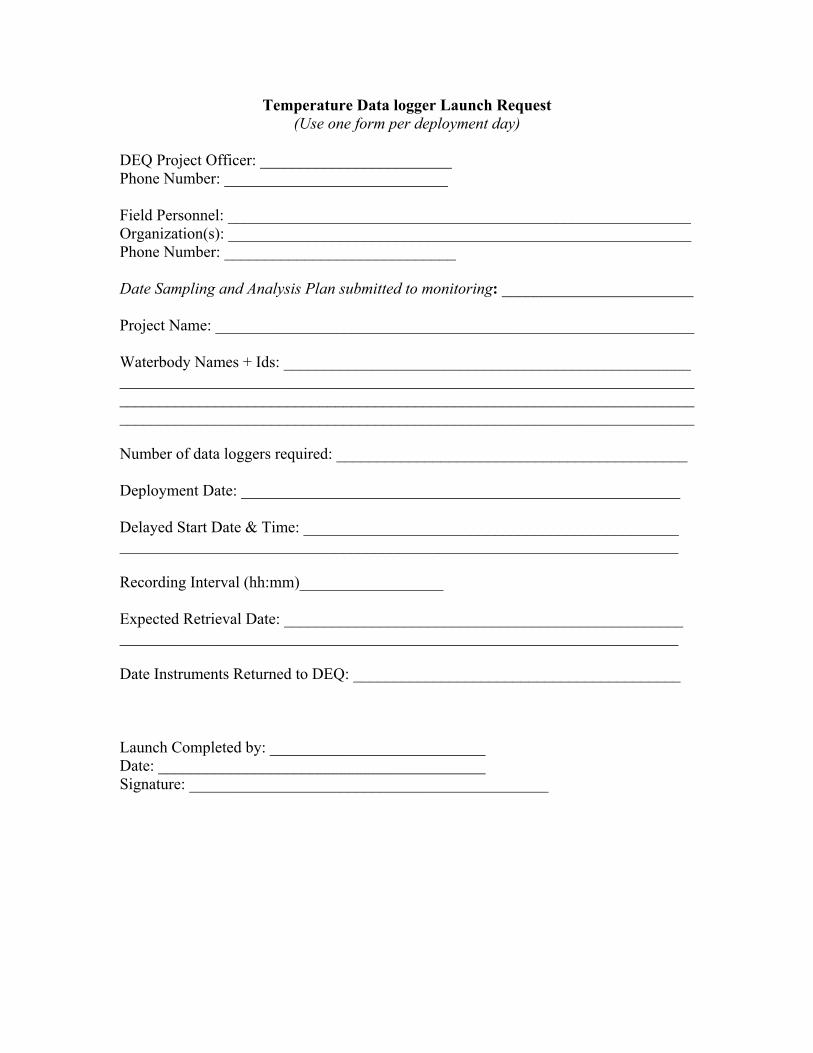
Temperature Data logger Launch Request (Use one form per deployment day)
DEQ Project Officer: ________________________ Phone Number: ____________________________ Field Personnel: __________________________________________________________ Organization(s): __________________________________________________________ Phone Number: _____________________________ Date Sampling and Analysis Plan submitted to monitoring: ________________________ Project Name: ____________________________________________________________ Waterbody Names + Ids: ___________________________________________________ ________________________________________________________________________________________________________________________________________________________________________________________________________________________ Number of data loggers required: ____________________________________________ Deployment Date: _______________________________________________________ Delayed Start Date & Time: _______________________________________________ ______________________________________________________________________ Recording Interval (hh:mm)__________________ Expected Retrieval Date: __________________________________________________ ______________________________________________________________________ Date Instruments Returned to DEQ: _________________________________________ Launch Completed by: ___________________________ Date: _________________________________________ Signature: _____________________________________________
WQPBWQM-006
Attachment 3
Instructions for Excel Temperature Macro Version 1.1

INSTRUCTIONS FOR EXCEL
TEMPERATURE MACRO VERSION 1.1
October 1997

i
TABLE OF CONTENTS PAGE
DISCLAIMER, LIMITATIONS, AND CREDITS ..................................................................................................ii
INTRODUCTION .......................................................................................................................................................1
BACKGROUND ................................................................................................................................................................1 WHAT’S NEW IN THIS RELEASE .....................................................................................................................................1
SYSTEM REQUIREMENTS.....................................................................................................................................2
MINIMUM SYSTEM REQUIREMENTS................................................................................................................................2 OTHER PLATFORMS........................................................................................................................................................2
Excel 4.0 ...................................................................................................................................................................2 Windows 95, Excel 7.0, and Excel 97 .......................................................................................................................2
PROGRAM INSTALLATION ..................................................................................................................................3
DATA PREPARATION .............................................................................................................................................4
DATA PROCESSING.................................................................................................................................................6
OVERVIEW .....................................................................................................................................................................6 MANUAL MODE..............................................................................................................................................................7
Enter Data ................................................................................................................................................................7 Calculated daily min/max .........................................................................................................................................8 7-Day Average Calculations.....................................................................................................................................8 Print Results..............................................................................................................................................................8 Save Worksheets .......................................................................................................................................................9 Exit Macro ................................................................................................................................................................9
AUTOMATIC MODE.......................................................................................................................................................10 Enter data ...............................................................................................................................................................10 Print Results............................................................................................................................................................10 Save Worksheets .....................................................................................................................................................10 Exit Macro ..............................................................................................................................................................11
ii
Disclaimer, Limitations, and Credits
THIS VERSION OF TEMPTURE (VERSION 1.1) SUPERSEDES THE PREVIOUS VERSIONS (PRE-RELEASE VERSION 0.50 AND VERSION 1.0). THESE OLD VERSIONS SHOULD BE REPLACED BY THIS RELEASE.
This software has been tested, and is believed to be stable. However, no testing can cover all machine configurations or input data sets. If a problem is observed, please report it to:
Michael Pipp Montana DEQ Watershed Management Section Resource Planning Prevention Bureau 1520 East Sixth Avenue Helena, Montana 59620-0901
406.444.7424 [email protected]
Please try to record as much detail as possible as to the circumstances surrounding the problem. A copy of the data set being processed when the problem occurred will also be helpful.
NOTE: development and testing of this macro is credited to Pamela Blake, Andy Ullrich, and Andrea Matzke with the Oregon DEQ - Western Region. We extend our appreciation to our colleagues at the Oregon DEQ for making this tool available.
Instructions For Excel Temperature Macro - Version 1.1 October 1997 Page 1
Introduction
Background
Tempture is a program to process the data files produced by automatic temperature loggers. Typically, these loggers are placed in water bodies for periods up to several months, and collect a temperature value every 15 to 30 minutes. Data from the loggers is then downloaded to a file or files on a desktop computer. This program analyzes these data files, and summarises the information in several ways. Output from the program can be saved to a new file for further manipulation by the user.
What’s New In This Release
Version 1.x contains significant changes and improvements over the previous release (0.50). These change include the following:
Version 1.1:
• The reporting of the 7-day average parameters has been revised to conform to the method used by the DEQ Laboratory.
Version 1.0:
• Tempture now reads the input data from external data files. It is no longer necessary to copy the data into a Tempture worksheet.
• Tempture can automatically process all worksheets in a given workbook (data file).
• A check is made of the input data before processing to help ensure correct data formatting.
• The user no longer needs to supply the number of days and the number of samples per day in the data set.
• Status messages have been added to a number of areas to advise the user on Tempture’s progress.
• Tempture is now smaller and runs faster than the previous release.

Instructions For Excel Temperature Macro - Version 1.1 October 1997 Page 2
System Requirements
Minimum System Requirements
Tempture is designed to run on an IBM-compatible computer. The computer must have Win-dows 3.1 and Microsoft Excel 5.0 loaded onto the system. Windows and Excel have their own hardware requirements. Please consult with Microsoft for details.
Other Platforms
Excel 4.0
Tempture was developed on Excel 5.0. It has not been tested on Excel 4.0. In general, however, earlier versions of a package do not run programs developed on a later package very well, if at all. The user is cautioned that this program may crash if it is run on Excel 4.0.
Windows 95, Excel 7.0, and Excel 97
Tempture has had only limited testing on these platforms. Forward compatibility of Microsoft products is usually quite good, however, so there is a reasonable chance that the program will work correctly. The user is cautioned to carefully verify their results until they are sure the program is working correctly.
Instructions For Excel Temperature Macro - Version 1.1 October 1997 Page 3
Program Installation
Tempture requires no special installation procedure. Copy the file TEMPTURE.XLS to your Excel subdirectory or another directory of your choice. It is now ready to use.
Instructions For Excel Temperature Macro - Version 1.1 October 1997 Page 4
Data Preparation
Before Tempture can be used to process the data files, the files must be properly formatted. Use the following steps to format your data:
1. Download your data files to a hard drive or floppy disc using the software supplied by your data logger manufacturer.
2. Start Windows and start Excel as you normally do.
3. Open each data file. Most likely, Excel will use the File Import Wizard to format the raw data file into an Excel format. The Wizard will take you through this process step by step.
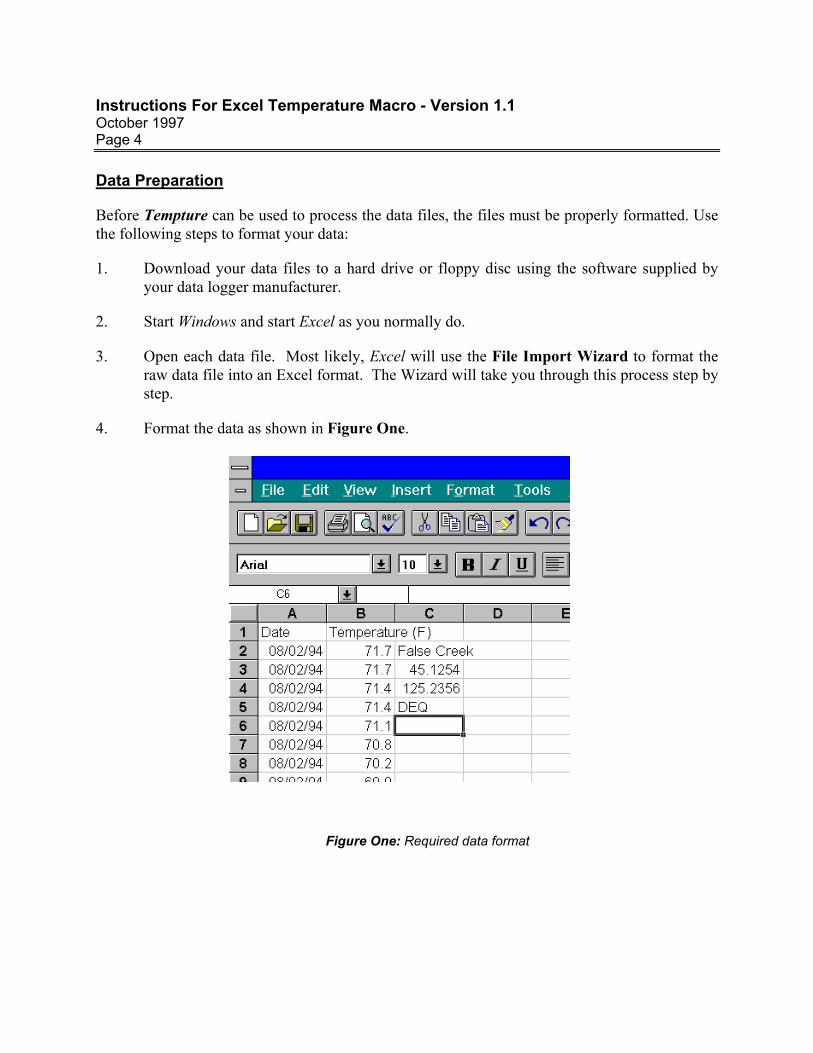
4. Format the data as shown in Figure One.
Figure One: Required data format
Instructions For Excel Temperature Macro - Version 1.1 October 1997 Page 5
Please note the following points:
a) The data must contain data sets for whole days only. If there are partial days (typically at the beginning or end of the data set), those days must be deleted completely. It is also the responsibility of the user to edit out any days that do not contain valid data. Examples of days like this are days that the data logger was activated, but not actually deployed in the stream.
b) Dates must go in Column A. The dates must start on Row 2, and go sequentially down. Cell A1 should contain text identifying the column contents. Cell A1 can-not contain a valid date.
c) Temperature data must go in Column B. The temperatures also must start on Row 2, and be in degrees Fahrenheit (OF). There must be the same number of temperature values as dates. Cell B1 should contain text identifying the column contents. Cell B1 cannot contain a valid numeric value.
d) (Optional, but highly recommended) The name of the site can be put in Cell C2. This name will appear on the summary sheet. Failing to put a site name in Cell C2 will make the summary sheet hard to interpret.
e) (Optional) The latitude of the site can be put in Cell C3. This value will appear on the summary sheet.
f) (Optional) The longitude of the site can be put in Cell C4. This value will appear on the summary sheet.
g) (Optional) The agency collecting the data may be put in Cell C5. This value will appear on the summary sheet.
5. Multiple data sheets can be put in the same workbook. Tempture can work through multiple data sheets in a workbook automatically. See below for more details. It is sug-gested that each data sheet in the workbook be given a descriptive name on the sheet tab. Tempture uses this name to display status messages while it is processing.
NOTE: TEMPTURE WILL NOT ACCEPT MORE THAN THIRTY-FIVE (35) DATA SHEETS IN ONE WORKBOOK.
6. The data file must be saved in the Excel format. It is suggested that File -> Save As ... be used, specifying the Excel format.
Instructions For Excel Temperature Macro - Version 1.1 October 1997 Page 6
Data Processing
Overview
After the data is properly formatted, it is ready to be processed through Tempture. The user can select one of two processing modes. These two modes are:
Manual Mode: This mode allows the greatest control over the data manipulation process. One data sheet in a given workbook is selected at a time. The user has the option of reviewing intermediate calculations before proceeding to the next step.
Automatic Mode: This mode allows large amounts of data to be processed rapidly. Each data sheet in the workbook is processed through the entire series of calcu-lations without input from the user, and the results placed on the summary page. Intermediate calculations are not available for review or manipula-tion.
Instructions For Excel Temperature Macro - Version 1.1 October 1997 Page 7
Manual Mode
Use the following steps to process data in the manual mode:
1. Start Windows and start Excel.
2. Load Tempture by using either File -> Open or by clicking on the “File Open” button on the toolbar.
3. The opening menu appears. There are six (6) options, and these will be described in order.
Enter Data
1. Click on this button to begin the data entry process. The user will be presented with the standard “open file” dialogue box. Select the data file you wish to process.
2. The user will then be asked to select from Manual Mode, Automatic Mode, or Cancel and Return to Main Menu. Select Manual Mode to continue, or select Cancel... to return to the Main Menu to select a different data file. Automatic Mode will be discussed below.
3. The user will then be asked to select which data sheet in the workbook is to be processed. Select the desired sheet name.
4. The selected data sheet will then be loaded and the data checked for proper formatting. If the data checks okay, the user will be returned to the Main Menu for further options. If the data does not check okay, Tempture will not load the data sheet and will indicate which test failed. The user should check the data, fix as necessary and re-run the data set. The various tests are summarised below:
a) Test 1: Checks to make sure Cell A1 and B1 do NOT contain valid data. Data must start on row 2 of the data sheet.
b) Test 2: Checks to make sure each column has the same number of data points, and that there is no non-numeric cells in the data columns. Failure of this test indicates that the data was not properly imported into an Excel workbook.
c) Test 3: Checks to make sure that the number of data points can be evenly divided by the number of days. Failure of this test indicates that the data was not properly truncated from the raw data set.
d) Test 4: Checks to make sure that each day in the data set has the same number of data points. Each day must have the same number of data points to be properly proc-essed.
Instructions For Excel Temperature Macro - Version 1.1 October 1997 Page 8
Calculated daily min/max
1. After the data has passed the data check and has been loaded, click on this button to begin the actual data analysis. This option must be run before calculating the 7-day averages.
2. After the daily min/max calculations are complete, the user is presented with the min/max sheet for review. There is a button at the top of the sheet to return to the Main Menu when the review is complete.
7-Day Average Calculations
1. Clicking this button will begin the 7-day average calculations. Results will be placed on the summary sheet. If this is the first data run, a new summary sheet will be created. If a sum-mary sheet already exists, the user will be given the following options:
a) Delete the existing summary sheet and create a new sheet. The summary data will then be stored on the new sheet.
b) Append the data to the existing sheet. The summary data will be appended to the end of the existing data set. Note that a maximum of 35 data sets can be stored on the summary sheet. Attempting to store more than 35 data sets will result in unpre-dictable results when printing the summary sheet.
c) Cancel and return to the Main Menu. The 7-day calculations will not be made, and no results posted to the summary sheet. Use this option to save the existing summary sheet before either appending new data to the sheet or creating a new sheet.
2. After the 7-day calculations are complete, the user is presented with the summary sheet for review. There is a button at the top of the sheet to return to the Main Menu when the review is complete.
Once the data has been placed on the summary sheet, a new data sheet may be selected using the Enter Data option and repeating the above sequence. An Automatic data run may also be performed. A maximum of 35 data sets may be placed on a given output sheet. If more than 35 data sheets are to be processed, the summary sheet should be saved when it is full and a new sheet started.
Print Results
Clicking on this button will print the current summary sheet. This option may be used between any data runs, or at the end of all the data runs. The output will be split across two pages.
Instructions For Excel Temperature Macro - Version 1.1 October 1997 Page 9
Save Worksheets
1. Clicking on this button presents the user with three options:
a) Save the min/max sheet: This option will save the “min/max” data sheet from the last data run. The program will prompt for a file name.
b) Save the summary sheet: This option will save the summary sheet. The program will prompt for a file name.
c) Cancel and Return: This option will return to the Main Menu without saving any files.
Note: Either save option can be run multiple times if the data is to be saved to a number of different files. This option can also be used between data runs, or at the end of all the data runs. As with all computer applications, it is strongly recommended to save work often.
Exit Macro
Use this button to exit from the macro when processing is complete. You must save any work with Save Worksheets option before exiting the macro. No work is saved with the Exit option.
Instructions For Excel Temperature Macro - Version 1.1 October 1997 Page 10
Automatic Mode
Automatic mode can be used to process multiple data sheets in a data workbook quickly and easily. Use the following steps to process data in the automatic mode:
Enter data
1. Click on this button to begin the data entry process. The user will be presented with the standard “open file” dialogue box. Select the data file you wish to process.
2. The user will then be asked to select from Manual Mode, Automatic Mode, or Cancel and Return to Main Menu. Select Automatic Mode to continue, or select Cancel... to return to the Main Menu to select a different data file. Manual Mode is discussed above.
3. The program will then retrieve each data sheet in the workbook, and perform the following operations:
a) Perform a data check. If errors are found in the data sheet, the user will be alerted, and no further processing of that sheet will occur. The error messages and their pos-sible resolution are discussed in the Manual Mode section, above.
b) Calculate the daily min/max values
c) Calculate the 7-day parameters. If a summary sheet does not exist, a new summary sheet is created. If a summary sheet already exists, the values for all the sheets in the data run may be appended to the existing sheet, or the existing sheet may be deleted and a new summary created.
Note: No more than 35 data sets should be stored on a given summary sheet.
Print Results
Clicking on this button will print the current summary sheet. This option may be used between any data runs, or at the end of all the data runs. The output will be split across two pages.
Save Worksheets
1. Clicking on this button presents the user with three options:
a) Save the min/max sheet: This option will save the “min/max” data sheet from the last data sheet processed. The program will prompt for a file name. If min/max data sheets from other data sheets in the workbook need to be saved, use the manual mode to process one data sheet at a time.
Instructions For Excel Temperature Macro - Version 1.1 October 1997 Page 11
b) Save the summary sheet: This option will save the summary sheet. The program will prompt for a file name.
c) Cancel and Return: This option will return to the Main Menu without saving any files.
Note: Either save option can be run multiple times if the data is to be saved to a number of different files. This option can also be used between data runs, or at the end of all the data runs. As with all computer applications, it is strongly recommended to save work often.
Exit Macro
Use this button to exit from the macro when processing is complete. You must save any work with Save Worksheets option before exiting the macro. No work is saved with the Exit option.