temperature programmed desorption, reduction, oxidation and flow
TRANSCRIPT

1
Temperature programmed desorption, reduction, oxidation and flow chemisorption for the characterisation of heterogeneous catalysts. Theoretical aspects, instrumentation and applications M. Fadonia and L. Lucarellib
aState University of Milan, Chemical Physical Department, via Golgi 19, 20133 Milan, Italy b CE Instruments (ThermoQuest S.p.A.), Strada Rivoltana 20090 Rodano (Milan), Italy
Some aspects related to catalysts characteristic and behaviour will be treated as determination of metal surface area and dispersion, spillover effect and synterisation. A detailed description of the available techniques will follow, taking in consideration some aspects of the gas-solid interactions mechanisms (associative/dissociative adsorption, acid-base interactions, etc.). Every technique taken in consideration will be treated starting from a general description of the related sample pre-treatment, due to the fundamental importance of this step prior to catalysts characterisation. The analytical theories will be described in relation to static and dynamic chemisorption, thermal programmed desorption and reduction/oxidation reactions. Part of the paper will be dedicated to the presentation of the experimental aspects of chemisorption, desorption and surface reaction techniques, and the relevant calculation models to evaluate metal surface area and dispersion, energy distribution of active sites, activation energy and heat of adsorption.
The combination of the described techniques and the integration of the experimental results produce a detailed picture of the investigated catalyst, allowing a better comprehension of the reaction mechanisms in complicated processes and a detailed characterisation of catalyst activity and selectivity. Most of the experimental results shown in the present paper have been obtained in the application lab of CE Instruments (ThermoQuest S.p.A.), Milan – Italy. All the graphs related to static volumetric chemisorption have been obtained by the adsorption apparatus Sorptomatic 1990, while the graphs related to TPD, TPR/O and pulse chemisorption analyses with the dynamic apparatus TPDRO 1000.

2
Summary • 1 - Introduction to heterogeneous catalysts • 2 - Aspects related to heterogeneous catalysts characterisation
2.1 - Selective chemisorption techniques 2.2 - Active surface area and metal dispersion
2.3 - Acid-base sites 2.4 - Spillover effect 2.5 - synterisation 2.6 - Poisoning • 3 - Evaluation of catalysts surface properties
3.1 - Choice of reactive gas 3.2 - Metal surface area calculation 3.3 - Metal dispersion calculation 3.4 - Average size calculation of catalytic aggregate • 4 - Gas-solid interaction: mechanism of chemisorption 4.1 - Energy of adsorption 4.2 - Associative and dissociative chemisorption 4.3 - Acid/base interactions • 5 - Chemisorption techniques 5.1 - Sample preparation and catalyst activation 5.2 - Static adsorption
5.2.1 - Experimental aspects 5.3 - Dynamic adsorption 5.3.1 - Experimental aspects 5.4 - Calculation of monolayer volume of chemisorbed gas
5.4.1 – Langmuir isotherm 5.4.2 – Extrapolation to zero pressure
• 6 - Thermal desorption technique 6.1 - Theory of thermal desorption technique 6.2 - Experimental aspects 6.2.1 - Sample preparation 6.2.2 - Analytical method 6.3 - Calculation of total desorbed gas volume 6.4 - Energy distribution of active sites and isosteric heat of adsorption 6.5 - Analytical examples • 7 - Temperature programmed reduction and oxidation 7.1 - Reduction and oxidation reactions 7.2 - Experimental aspects 7.2.1 - Sample preparation 7.2.2 - Analytical method 7.3 - Quantitative calculation of reduced/oxide sites 7.4 - Evaluation of average metal oxidation degree 7.5 - Analytical examples • 8 - Conclusions

3
1 – INTRODUCTION TO HETEROGENEOUS CATALYSTS
A catalyst can be defined in many ways but generally it is a substance that, when added in the balance of a chemical reaction, accelerates the achievement of the chemical equilibrium between reactants and products without influencing the thermodynamic equilibrium of the process. Usually catalysts are not consumed during the reaction and they could be found unchanged after the reaction. In reality, catalysts are submitted to a slow transformation with the use, causing a general decrease of the activity and/or selectivity. The first main distinction between catalysts depends on the catalyst nature in relation to the reactants. A homogeneous catalyst is in the same physical state of the reactants (liquid, solid or gaseous) while heterogeneous ones are in a different state. In this work paper only the heterogeneous solids catalysts will be taken into consideration. Among solid catalysts, we can identify three main groups: metal supported, acid sites and/or basic sites. The metal supported catalysts are prepared by supporting a metal (usually a noble one) onto a porous material, such as a gamma alumina or silica, featuring a suitable pore size distribution and specific surface area. Examples of acid catalyst are, for instance, zeolites. It is very important to characterise these materials to classify carefully the catalysts in function of the chemical reaction, to improve reactivity, selectivity and/or the production technique in order to better understand the role of the catalyst in a chemical reaction. Furthermore, it is possible to analyse the reasons for a catalyst poisoning or deactivation after use. Catalysts can be characterised by different techniques giving a wide range of information: - Activity is defined as the speed at which a chemical reaction reaches the equilibrium.
From the industrial point of view activity is also defined as the amount of reactant transformed into product per unit of time and unit of reactor volume
- Selectivity is defined as the rate of reactant conversion into the desired products. Selectivity usually depends on reaction parameters as temperature, pressure, reactants composition and also on the catalyst nature
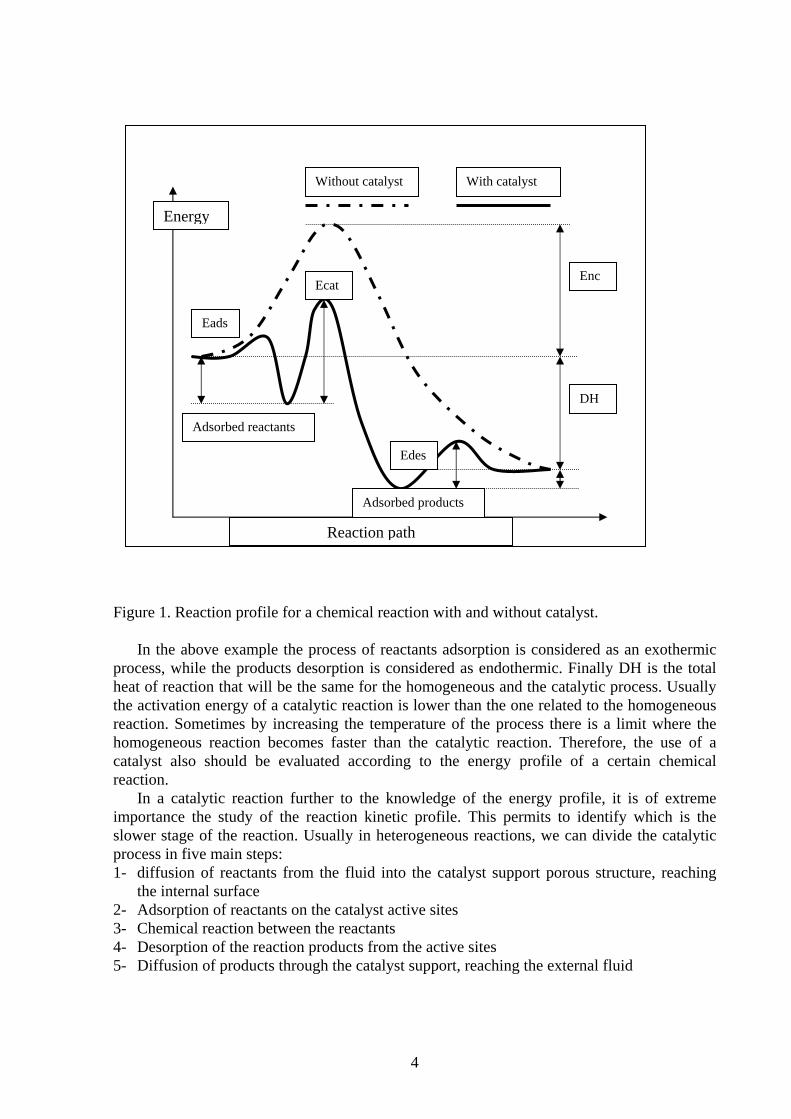
Activity, selectivity and other parameters can be measured by performing the chemical reaction in a pilot reactor but a basic characterisation of the catalyst surface is necessary to correlate the catalyst nature to its performance. Considering as an example a metal supported catalyst, there are two main aspects that should be investigated: the porous nature of the support and the active sites nature/distribution. Considering as an example an homogeneous reaction profile in comparison with the same reaction performed by using a catalyst, in the second process the catalyst action is to decrease substantially the total time to reach the thermodynamic equilibrium, that is to speed up the conversion process. Therefore the main effect of a catalyst is to provide an alternative reaction path that permits to decrease the activation energies of the different reaction steps, reaching therefore the equilibrium in an easier and faster way. The two different reaction paths (without and with catalyst) are represented in figure 1. In figure 1, Enc is the activation energy that is necessary for the reaction without the use of catalyst, Eads is the adsorption energy of reactants on the catalyst surface, Ecat is the energy related to the activation of the chemical reaction between reactants on the catalyst surface, Edes is the desorption energy of the products of reaction.
4
Figure 1. Reaction profile for a chemical reaction with and without catalyst.
In the above example the process of reactants adsorption is considered as an exothermic
process, while the products desorption is considered as endothermic. Finally DH is the total heat of reaction that will be the same for the homogeneous and the catalytic process. Usually the activation energy of a catalytic reaction is lower than the one related to the homogeneous reaction. Sometimes by increasing the temperature of the process there is a limit where the homogeneous reaction becomes faster than the catalytic reaction. Therefore, the use of a catalyst also should be evaluated according to the energy profile of a certain chemical reaction.
In a catalytic reaction further to the knowledge of the energy profile, it is of extreme importance the study of the reaction kinetic profile. This permits to identify which is the slower stage of the reaction. Usually in heterogeneous reactions, we can divide the catalytic process in five main steps: 1- diffusion of reactants from the fluid into the catalyst support porous structure, reaching
the internal surface 2- Adsorption of reactants on the catalyst active sites 3- Chemical reaction between the reactants 4- Desorption of the reaction products from the active sites 5- Diffusion of products through the catalyst support, reaching the external fluid
Enc
DH
Adsorbed products
Adsorbed reactants
Ecat
Reaction path
Energy
Eads
Edes
Without catalyst With catalyst

5
One or more of the above stages could be the rate-determining step, influencing the total speed of reaction. The speed related to the steps 1 and 5 is mainly due to the porous nature of the support and the reactants/products geometrical parameters. In fact, it is necessary that the limiting step of the reaction should not be a diffusion problem. The pore size of the catalyst support should be chosen in relation to the reactant molecule volume and geometry. Steps 2 and 4 are related to the nature of the reactants/products and the active sites deposed on the catalyst surface. If the diffusion is not the limiting effect, the speed of reaction is directly function of the active surface area of the catalyst: the higher is the number of active sites available for the adsorption process of reactants the faster is the speed of reaction. A very high active surface can be achieved by using high surface area supports and optimising the deposition process of the metal. On the contrary, the specific surface area of a solid porous support is inversely proportional to the pore size of the support itself: at parity of pore specific volume, the smaller are the pores the higher is the specific surface. Therefore, the characterisation of the support in terms of pore size distribution and specific surface area is of fundamental importance in the choice of a suitable catalyst. While a very high surface is advisable, a correct pore dimension should fit with the reactants/products geometry. 2 – ASPECTS RELATED TO CATALYSTS CHARACTERISATION
As described above, the basic catalyst characterisation involves two main steps: the investigation on the porous nature of the catalyst support (physical properties) and on the properties of the active sites that are dispersed on the support surface (see table 1). Table 1 General scheme of catalysts characterisation.
Catalyst texture
Physical properties Chemical properties Result Technique Result Technique
Geometry and shape Chemical composition Electron spectroscopy Atomic adsorption
Total specific surface area
Gas physisorption Mercury porosimetry
Active site surface area
Selective chemisorption (static or dynamic)
True density X-ray analysis Neutron diffraction
Degree of dispersion Selective chemisorption X-ray Electron microscopy Magnetisation analysis
Bulk and apparent density
Helium pycnometry Mercury porosimetry Liquid displacement
Surface energy Thermal analysis tests Temperature-programmed desorption and reaction Calorimetry
Pore specific volume Porosity
Mercury porosimetry Gas adsorption
Acid-base sites Selective chemisorption Temp. programmed desorption
6
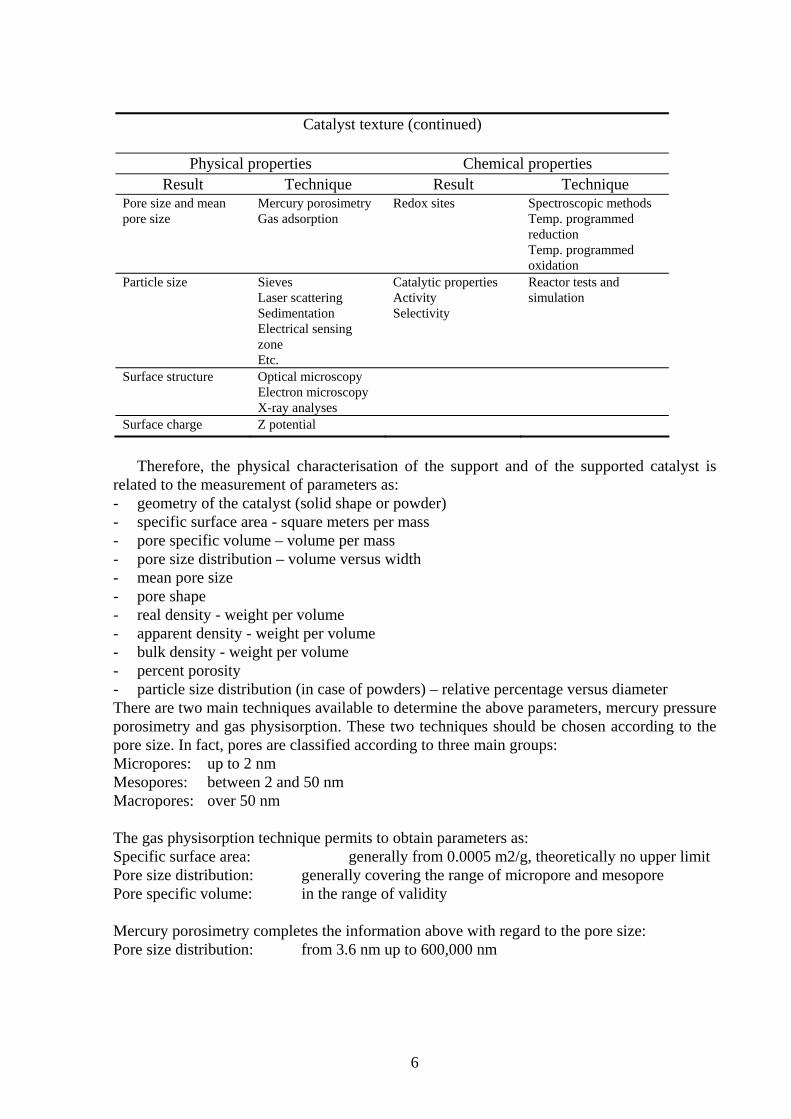
Catalyst texture (continued)
Physical properties Chemical properties Result Technique Result Technique
Pore size and mean pore size
Mercury porosimetry Gas adsorption
Redox sites Spectroscopic methods Temp. programmed reduction Temp. programmed oxidation
Particle size Sieves Laser scattering Sedimentation Electrical sensing zone Etc.
Catalytic properties Activity Selectivity
Reactor tests and simulation
Surface structure Optical microscopy Electron microscopy X-ray analyses
Surface charge Z potential
Therefore, the physical characterisation of the support and of the supported catalyst is
related to the measurement of parameters as: - geometry of the catalyst (solid shape or powder) - specific surface area - square meters per mass - pore specific volume – volume per mass - pore size distribution – volume versus width - mean pore size - pore shape - real density - weight per volume - apparent density - weight per volume - bulk density - weight per volume - percent porosity - particle size distribution (in case of powders) – relative percentage versus diameter There are two main techniques available to determine the above parameters, mercury pressure porosimetry and gas physisorption. These two techniques should be chosen according to the pore size. In fact, pores are classified according to three main groups: Micropores: up to 2 nm Mesopores: between 2 and 50 nm Macropores: over 50 nm The gas physisorption technique permits to obtain parameters as: Specific surface area: generally from 0.0005 m2/g, theoretically no upper limit Pore size distribution: generally covering the range of micropore and mesopore Pore specific volume: in the range of validity Mercury porosimetry completes the information above with regard to the pore size: Pore size distribution: from 3.6 nm up to 600,000 nm
7
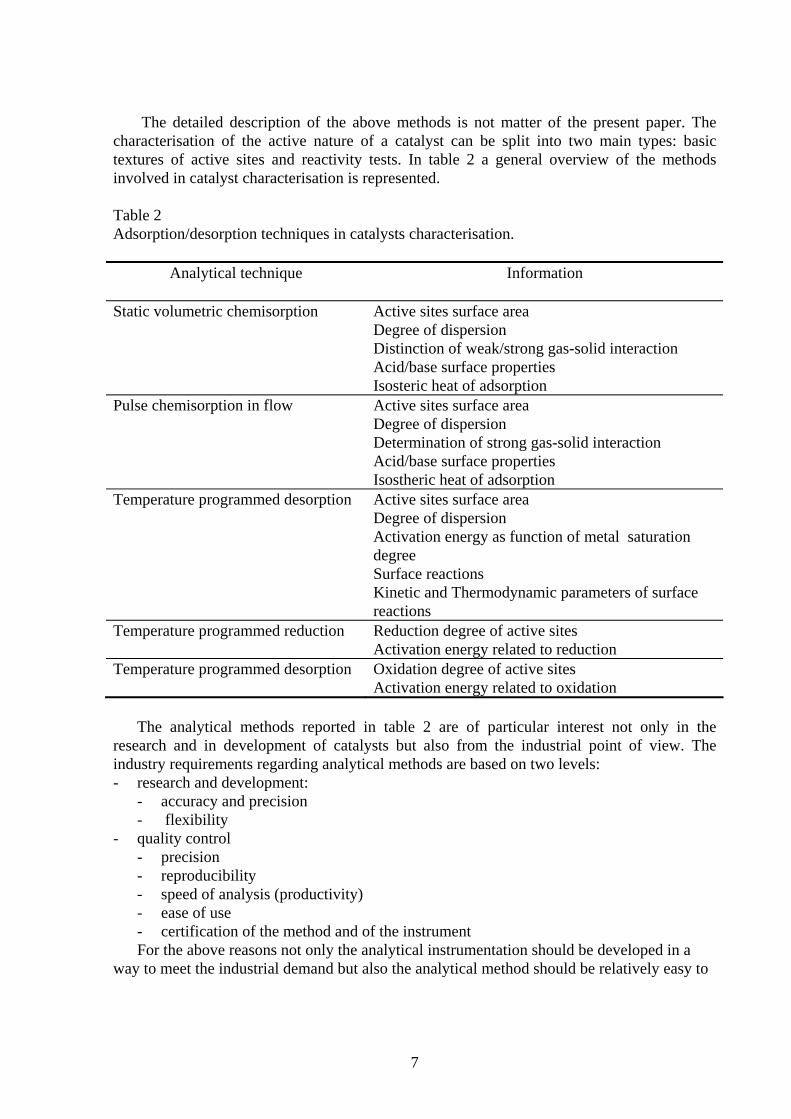
The detailed description of the above methods is not matter of the present paper. The characterisation of the active nature of a catalyst can be split into two main types: basic textures of active sites and reactivity tests. In table 2 a general overview of the methods involved in catalyst characterisation is represented. Table 2 Adsorption/desorption techniques in catalysts characterisation.
Analytical technique Information Static volumetric chemisorption Active sites surface area
Degree of dispersion Distinction of weak/strong gas-solid interaction Acid/base surface properties Isosteric heat of adsorption
Pulse chemisorption in flow Active sites surface area Degree of dispersion Determination of strong gas-solid interaction Acid/base surface properties Isostheric heat of adsorption
Temperature programmed desorption Active sites surface area Degree of dispersion Activation energy as function of metal saturation degree Surface reactions Kinetic and Thermodynamic parameters of surface reactions
Temperature programmed reduction Reduction degree of active sites Activation energy related to reduction
Temperature programmed desorption Oxidation degree of active sites Activation energy related to oxidation
The analytical methods reported in table 2 are of particular interest not only in the
research and in development of catalysts but also from the industrial point of view. The industry requirements regarding analytical methods are based on two levels: - research and development:
- accuracy and precision - flexibility
- quality control - precision - reproducibility - speed of analysis (productivity) - ease of use - certification of the method and of the instrument For the above reasons not only the analytical instrumentation should be developed in a
way to meet the industrial demand but also the analytical method should be relatively easy to

8
handle by different operators and be fast. The techniques described in this paper meet the above requirements, providing essential catalyst parameters with high precision at a limited cost. 2.1 - Selective chemisorption techniques
The chemisorption techniques are very well established analytical methods to evaluate the free metal specific surface area and metal dispersion degree. These methods consist in performing a real chemical reaction between a reactive gas and the catalyst that has been previously prepared in a suitable way. Different types of chemisorption techniques can be used, the main ones are gas chemisorption on metals which are in zero oxidation degree, hydrogen/oxygen titration and acid/base reaction. The pre-treatment procedures must be chosen therefore according to the catalyst nature and to the technique that will be applied. In all the above cases, a common procedure to be performed before the real pre-treatment is to clean the catalyst surface. The cleaning generally consists in degassing the sample at a suitable temperature to remove water or other vapours eventually adsorbed on the surface, even if the catalyst has already been calcinated. The degassing can be done under vacuum or under a flow of inert gas. If the catalyst comes from a reactor it is necessary to remove eventual reaction residual that can block the catalytic surface (i.e. carbon derived by cracking) by a forced oxidation using air or oxygen. After the preliminary cleaning, the pre-treatment procedure should be differentiated according to the required analysis. In the first case the sample preparation has the task to oxidise or reduce the metal deposed on the support surface to zero oxidation state. This procedure activates the catalyst to the chemisorption measurement with a suitable reactive gas. A common sequence is oxidation – reduction – removal of hydrogen chemisorbed by flowing an inert gas. At this point the sample is activated to chemisorb a reactive gas. The second type of pre-treatment should produce an oxidised or reduced status of the metal. Therefore, it will be possible to perform a chemical reaction between hydrogen injected into the sample holder and the oxygen bounded to the metal active sites (or viceversa). In the last case, acid/base reaction, the catalyst surface should be only free from pollutant vapours and the gas used for the analysis must have acid (i.e. carbon dioxide) or base (i.e. dry ammonia) properties to react selectively with the base or acid sites of the sample. It is of extreme importance that the sample after the pre-treatment should not have any contact with the environment otherwise the reliability of the measurement could be seriously compromised. 2.2 - Active surface area and metal dispersion
It is commonly used and convenient to define in a catalyst the surface area of the free active sites. Considering as example a metal supported catalyst, we can define as total surface area the surface of the support that can have contact with the external fluid mass. When an active phase (i.e. noble metal) is deposed on the support, only part of the available support surface can be covered. The chemisorption techniques permit to evaluate selectively the surface area of the active phase that is usually smaller than the total catalyst surface area.
Furthermore, only a small part of the active phase is physically free to react with the measuring gas due to the formation of metal aggregates. The metal atoms that are contained inside the aggregate cannot have contact with external fluids therefore they have no influence on the chemical reaction. In case of metal supported catalysts the total amount of metal fixed on the support can be conveniently determined by techniques as atomic adsorption giving as

9
result the total metal percentage present in the sample. The chemisorption techniques evaluate the free metal surface in square meter per gram by counting the number of surface metal atoms available on the metal aggregates. Finally, the degree of dispersion is defined as the ratio between the free metal atoms and the total number of metal atoms that are fixed on the support surface (in other words, the fraction of metal exposed to an external fluid phase). 2.3 - Acid-base sites
The catalyst surface may contain acid and base sites that can interact together. On given surfaces the acid or base behaviour may prevail even if both sites are always present. In a catalyst characterisation, it is very useful to define the nature (Lewis or Brönsted, see par. 4.3) of these sites, their density, location, distribution and strength. Generally, an acid site is defined as a site that can react with a base and, on the contrary, a base site can react with an acid. The above information (acid-base sites density) can be obtained by performing a chemisorption measurement using an acid (such as CO2, SO2) or base gas (such as dry ammonia) while their strength could be measured by temperature programmed techniques (desorption). 2.4 - Spillover effect
Spillover is a phenomenon that involves the migration of an active chemisorbed species, formed on a first active phase (metal) onto a second phase that usually could not react if present alone in the same conditions. The phenomenon of spillover is not desired in the determination of adsorption stoichiometry because it always involves an increase of the amount of adsorbed gas. In case spillover takes place the free metal surface area and dispersion are always overestimated therefore spillover is not desired in catalyst characterisation but well accepted in a catalytic reaction because the number of active sites greatly increases. In the following picture are reported three cases in which the spillover effects can take place [1].
Figure 2. Different mechanisms of spillover.
10
a- the first active phase is directly supported on the second phase, the acceptor b- the first active phase is supported on an activated support, mixed with a non-activated
support c- the first active phase is fixed on a support that is activated by another active phase
The physical conditions (temperature and pressure) causing the spillover effect are depending on the catalyst (metal and support) and on the reactants. General conditions in which spillover might be avoided are: Temperature: between 5 and 40 °C Pressure: between 0 and 100 torr Higher temperature and pressure values during the experiment could promote the spillover effect therefore influencing negatively the estimation of parameters as metal surface area and dispersion. 2.5 - Synterization
Synterization of a metal catalyst is a process that consists of a migration of the supported metal atoms to form larger metal aggregates. Synterisation is a direct consequence of temperature, time and ageing. During the catalyst activation (pre-treatment) prior to the analysis, there are several phases in which the catalyst should be heated at very high temperatures (i.e. to remove, hydrogen after the reduction process). The catalyst nature and history should be very well known in order not to overtake the maximum conditions of temperature and time used for the catalyst preparation (i.e. calcination). In fact, the metal is finely dispersed on the support in order to maximise the metal surface area in relation to the minimum amount of noble metal. By heating the catalyst during the pre-treatment procedures, the mobility of the metal particles is increased. If the temperature overtakes certain limits, depending on the catalyst nature, the metal particles migrate to form larger aggregates decreasing therefore the metal dispersion. This effect reduces directly the number of active sites exposed to the fluid reactants, dramatically reducing the catalytic activity. Synterisation is a non-reversible phenomenon and the original metal surface area and dispersion cannot be restored. 2.6 - Poisoning
A poison, when referred to catalysts, is an impurity that is present in the fluid phase and that reacts selectively with some active sites, stopping their activity. Usually the poisoning effect should be always avoided but sometimes could be useful to stop the formation of undesired secondary products. Poisoning could occur by chemical reaction (chemical poisoning) or fouling (physical poisoning). An example of chemical poisoning is the reaction between sulphur and some noble metals. The chemical poisoning is non-reversible if the product of reaction is stable while sometimes it is possible to remove the poison by a suitable chemical reaction. For instance, in case of some sulphur compounds, it is possible to remove the poison by hydrogenation to produce H2S. The physical poisoning takes place when an external substance blocks directly the access of the fluid to the active surface. This effect could be caused by encrusting of powders, carbon coke or pitches on the catalyst surface or inside the pores (fouling). In case the physical poisoning is due to carbon coke formation, an oxidation process can remove the poison.
11
3 – EVALUATION OF CATALYST SURFACE PROPERTIES BY CHEMISORPTION
As described above, the main purpose of the chemisorption methods is to evaluate the number of active sites that can be reached or that can interact with a fluid phase. These techniques are based on a chemical reaction between a suitable reactive gas and the surface reactive site. There are different methods to perform the above operation, the static volumetric, the static gravimetric or the flow methods. In the volumetric method, the sample is kept under high vacuum before the analysis. The analytical instrument then introduces known doses of reactive gas into the sample holder, measuring afterwards the equilibrium pressure that will be established between the sample and the gaseous phase. The static volumetric method requires the calibration of the system dead volume, being an absolute method (all the parameters related to the analysis are absolute values: temperature, pressure and dead volumes). The dead volume calibration is usually defined as “blank measurement” and it consists in performing a run in the same analytical conditions but using an inert gas instead of a reactive one. The pressure range should be chosen in order to complete the adsorption isotherm covering a monolayer of reacted molecules over the sample. The pressure range therefore depends on the catalyst/adsorbate nature and the analysis temperature. Most of catalytic systems analysed around room temperature show the monolayer covering below 100 torr equilibrium pressure.
The advantage of the static method is that the system catalyst/adsorbate reaches the real equilibrium conditions. Furthermore, it is possible to distinguish in a quantitative way the amount of gas strongly bounded to the active sites and weakly bounded to the support. On the contrary, the static volumetric method requires high vacuum system, long lasting measurements, and generally higher instrumentation costs. The gravimetric technique is in principle the same as the volumetric one; the difference is that the amount of gas adsorbed is measured by the weight change of the sample during the adsorption process. This technique is very precise but also very expensive due to the high cost of the necessary microbalance. Flow methods are carried out at atmospheric pressure. An inert carrier gas is passing through the sample in a suitable sample holder. A suitable injection system, typically a loop valve, can pulse in the gas stream before the sample, the reactive gas. The detector in this case can be a thermal conductivity detector, a microbalance or a mass spectrometer. Using the thermal conductivity detector the amount of gas adsorbed is calculated by integrating the peaks generated by the detector signal in function of time. This method requires the calibration by injecting the gas by a calibrated loop and measuring afterward the generated peak area. The advantages of this analytical method are based to fast analysis, relative low cost of the apparatus, relatively low risk of leaks. The flow method can be used mainly for systems catalyst/adsorbate that show fast equilibrium time. Furthermore, this method can only evaluate the strong interactions between the gas and the active sites, while the weak interactions cannot be measured as the gas is instantaneously removed by the carrier flow. 3.1 - Choice of reactive gas
The reactive gas used for chemisorption textures should be chosen mainly according to the active phase of the catalyst. The knowledge of the stoichiometric relation between the gas and the metal, therefore the mechanism of chemisorption, is of extreme importance to determine correctly the number of free active sites. In fact the evaluation of the number of
12
free active sites by chemisorption and thermal programmed techniques is based on the accurate measurement of the gas amount that is adsorbed or desorbed during the analytical cycle. The purpose of the chemisorption methods is to evaluate the amount of gas used to cover a monolayer over the free active phase. The monolayer might be expressed in moles or volumes (NTP) of gas referred to sample mass or to the amount of metal present in the catalyst.
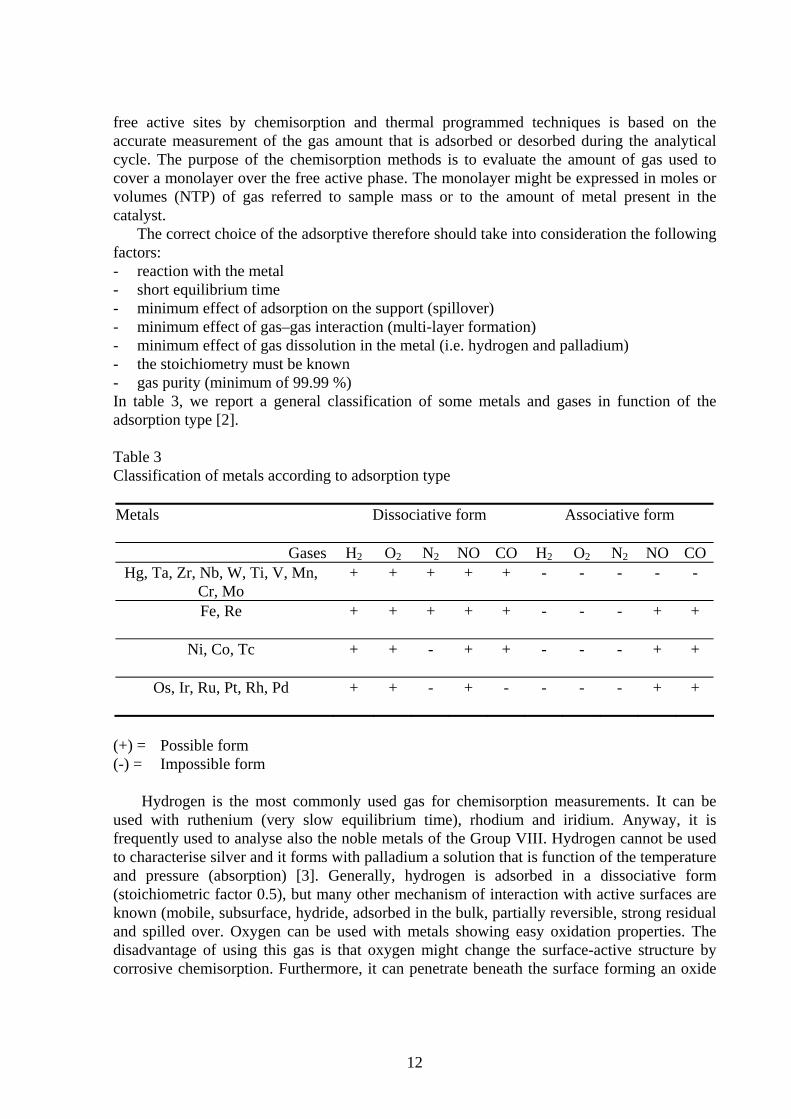
The correct choice of the adsorptive therefore should take into consideration the following factors: - reaction with the metal - short equilibrium time - minimum effect of adsorption on the support (spillover) - minimum effect of gas–gas interaction (multi-layer formation) - minimum effect of gas dissolution in the metal (i.e. hydrogen and palladium) - the stoichiometry must be known - gas purity (minimum of 99.99 %) In table 3, we report a general classification of some metals and gases in function of the adsorption type [2]. Table 3 Classification of metals according to adsorption type Metals Dissociative form Associative form
Gases H2 O2 N2 NO CO H2 O2 N2 NO CO
Hg, Ta, Zr, Nb, W, Ti, V, Mn, Cr, Mo
+ + + + + - - - - -
Fe, Re
+ + + + + - - - + +
Ni, Co, Tc
+ + - + + - - - + +
Os, Ir, Ru, Pt, Rh, Pd
+ + - + - - - - + +
(+) = Possible form (-) = Impossible form
Hydrogen is the most commonly used gas for chemisorption measurements. It can be used with ruthenium (very slow equilibrium time), rhodium and iridium. Anyway, it is frequently used to analyse also the noble metals of the Group VIII. Hydrogen cannot be used to characterise silver and it forms with palladium a solution that is function of the temperature and pressure (absorption) [3]. Generally, hydrogen is adsorbed in a dissociative form (stoichiometric factor 0.5), but many other mechanism of interaction with active surfaces are known (mobile, subsurface, hydride, adsorbed in the bulk, partially reversible, strong residual and spilled over. Oxygen can be used with metals showing easy oxidation properties. The disadvantage of using this gas is that oxygen might change the surface-active structure by corrosive chemisorption. Furthermore, it can penetrate beneath the surface forming an oxide

13
layer. Such effects are undesired for surface area characterisation and they could be minimised by using low temperatures (sub-ambient). Oxygen is the only convenient gas to characterise silver catalysts. Carbon monoxide is a very reactive gas and, in principle, it might be used with most of metals. The problem related to this gas is the proper evaluation of the stoichiometric factor of the chemical reaction. Furthermore, smaller particles of metal can dissociate in presence of this gas to form carbonyl complexes. Although the reacted gas can be removed by evacuation in flow or in vacuum, the metal particles form again, but it is not certain if the structure will be the same. Carbon monoxide can also form volatile carbonyls, especially with iron and nickel. Nitrogen oxide is a very reactive oxidant and can be conveniently used to characterise cobalt and silver catalyst. The main issue in the use of NO is relative to its toxicity. 3.2 - Metal surface area calculation
The calculation of the metal specific surface area is based on the simple following relation: MSS = (Vm Na) / (Sf Sd) (1) MSS = metal surface area (square meters per gram of sample) Vm = gas adsorbed at monolayer (moles per gram of sample) Na = Avogadro number (molecule per mole of gas) Sf = Stoichiometric factor of the reaction (number of molecule of adsorbate per surface metal atom) Sd = Metal surface density (number of metal atoms per square meter)
The stoichiometric factor Sf of a chemical reaction is therefore of fundamental importance in the calculation of the correct specific surface area. Sf should be investigated also by other analytical methods (i.e. for CO with infrared spectroscopy). The most common gases used in chemisorption techniques are hydrogen, carbon monoxide, oxygen and di-nitrogen oxide. In the following table, we report some examples of possible reactions between the above gases and a generic metal M [4]. Table 4 Stoichiometric factors for different types of reaction.
Method Reaction (M = accessible metal atom) Stoichiometry
Hydrogen (or oxygen) chemisorption
M + ½ H2 = M-H 0.5
Carbon monoxide chemisorption
M + CO = M-CO 2 M + CO = M-CO-M
1 0.5
Hydrogen/oxygen titration
M-O + 3/2 H2 = M-H + H2O 1.5
Oxygen/hydrogen titration
M-H + ¾ O2 = M-O + ½ H2O 0.75
Nitrous oxide reaction 2 M + N2O = M-O-M + N2 0.5

14
For carbon monoxide, two adsorption stoichiometries are commonly found (linearly and
bridged bonded) and infrared measurements of adsorbed carbon monoxide can be used to distinguish between the two possibilities. With platinum, it is chiefly the linear species that is formed. Various proportions of the bridged species have also been noted. However, the carbon monoxide to accessible metal atom ratio (CO/M) is generally similar to the H/M ratio. With palladium, larger fractions of the bridged species are usually observed. In the following table, we report some examples of stoichiometric factors and metal atomic densities per unit of polycrystalline surface [5]. The values of stoichiometric factors are expressed in moles of adsorbing gas per metal surface atom. Table 5 Parameters related to some metals and stoichiometric factors with different gases.
Metal (M) H2/M CO/M O2/M Atomic weight
Sd x 1020 (atoms/m2)
Note
Pt 0.5 1
1.15 0.5 195.09 0.125 Spillover
T > 200 C Pd 0.5 0.6 - 106.4 0.127 Absorption with
H2 Ir
D > 1.5 nm
D < 1.5 nm
0.5 1
1 1
0.5 192.22 0.130
Rh D > 2 nm D < 2 nm
0.5
0.5 - 1
1 2
0.5 102.905 0.133
Ru D > 2 nm D < 2 nm
0.5
1
> 1
0.5
> 0.5
101.07 0.163 Spillover with H2 T > 25 C
P > 100 torr Os 0.5 - - 190.2 0.159 Ni 0.5 - - 58.71 0.154 Carbonyl
formation Co 0.5 - - 55.993 0.151 Fe 0.5 0.5 - 55.847 0.163 Ag - - 0.4 107.868 0.115 At 420 K Au - - 0.25
0.5 196.9665 0.115 At 470 K
At 570 K

15
3.3 - Metal dispersion calculation The metal dispersion is another important parameter related to the nature or the status of
a catalyst. The metal dispersion is a non-dimensional number representing the fraction of free metal atoms over the total number of metal atoms in the catalyst. The calculation of metal dispersion does not require the knowledge of the metal surface density. MD = (Vm Aw 104) / (W% Sf) (2) MD = metal dispersion percentage Vm = monolayer volume (moles of gas per gram of sample) Aw = metal atomic weight (gram of metal per mole) W% = metal percentage in the sample Sf = stoichiometric factor (molecule of gas per metal atom) 3.4 - Average size of catalytic aggregate calculation
A further piece of information that can be calculated by chemisorption techniques is the average diameter of the metal aggregates. Da = (104 F) / (MSS Dm) (3) Da = average diameter of metal aggregate (angstrom) MSS = metal surface area (square meters per gram of metal) Dm = metal density (gram per metal volume unit) F = shape factor
The shape factor depends on the geometric shape of the metal aggregate. It is a delicate parameter because requires that we consider the metal aggregate as having a regular shape. The shape factor is defined according to the supposed geometry and it is equal to the ratio between the surface of a solid and its volume. For a generic solid with a non-regular geometry: S / V = F / d (4) where S is the external surface, V is the solid volume, F is the shape factor and d is the average diameter. The equation for the average diameter is calculated using for S the metal specific surface area measured by the chemisorption technique and for V the metal density. The shape factor for regular solids is: - for a cube with all the sides exposed or for a sphere F = 6 - for a cube with one side non-exposed F = 5 (i.e. a metal aggregate deposed on the catalyst
support).
16
4 - GAS SOLID INTERACTION: MECHANISM OF CHEMISORPTION
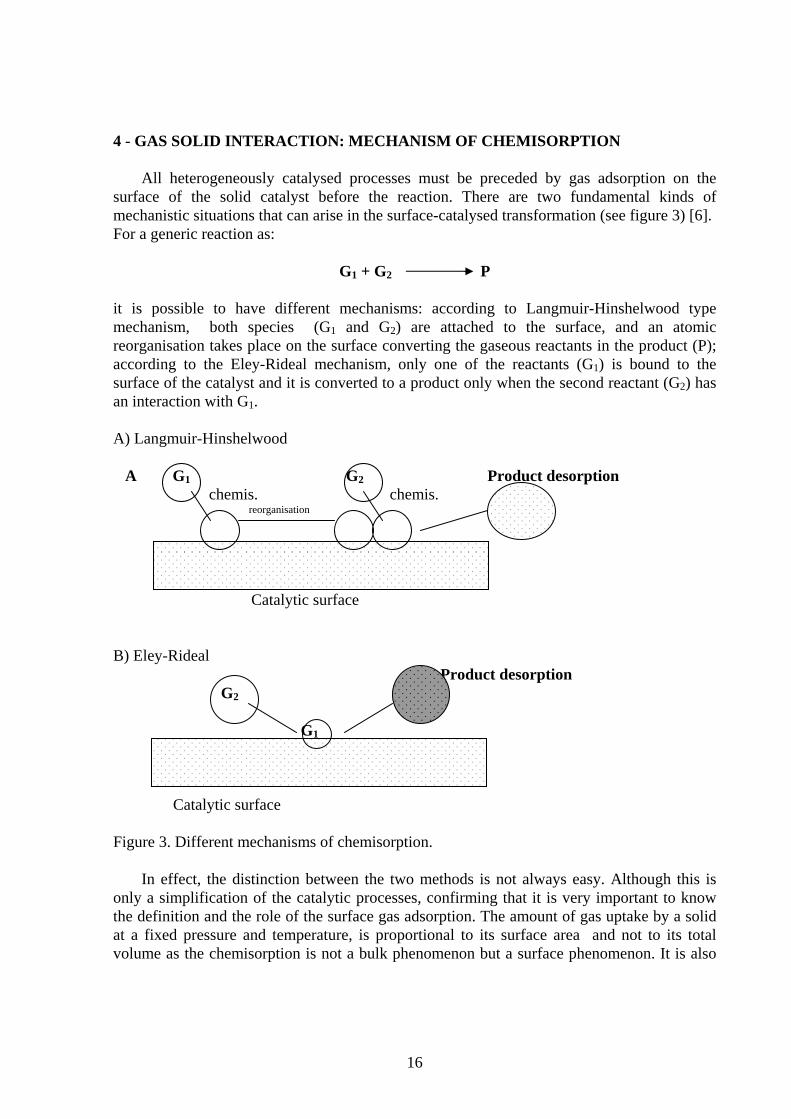
All heterogeneously catalysed processes must be preceded by gas adsorption on the surface of the solid catalyst before the reaction. There are two fundamental kinds of mechanistic situations that can arise in the surface-catalysed transformation (see figure 3) [6]. For a generic reaction as:
G1 + G2 P
it is possible to have different mechanisms: according to Langmuir-Hinshelwood type mechanism, both species (G1 and G2) are attached to the surface, and an atomic reorganisation takes place on the surface converting the gaseous reactants in the product (P); according to the Eley-Rideal mechanism, only one of the reactants (G1) is bound to the surface of the catalyst and it is converted to a product only when the second reactant (G2) has an interaction with G1. A) Langmuir-Hinshelwood A G1 G2 Product desorption chemis. chemis. reorganisation
Catalytic surface
B) Eley-Rideal Product desorption G2 G1 Catalytic surface Figure 3. Different mechanisms of chemisorption.
In effect, the distinction between the two methods is not always easy. Although this is only a simplification of the catalytic processes, confirming that it is very important to know the definition and the role of the surface gas adsorption. The amount of gas uptake by a solid at a fixed pressure and temperature, is proportional to its surface area and not to its total volume as the chemisorption is not a bulk phenomenon but a surface phenomenon. It is also
17
helpful to distinguish physical adsorption from chemical adsorption. The fundamental difference between the two kinds of adsorption, is that the physical adsorption involves a molecular interaction force including permanent dipole, induced dipole and quadrupole attraction (forces of Van der Waals). In chemical adsorption (chemisorption), the forces involved are very strong, with consequential formation and/or rupture of chemical bonds. Physical adsorption is characterised by small enthalpy changes, typically in the range -10 to -40 kJmol-1 with heat of adsorption of 10-40 kJmol-1, whereas chemisorption heat is rarely less than 80 kJmol-1 and often exceeds 400 kJmol-1. Another difference between these two extreme types of adsorption concern the temperatures at which adsorption takes place and its specificity. The physical adsorption occurs, in general, only at low temperature, whereas chemisorption has no restrictions. Finally: chemisorption is a chemical reaction upon the surface of the solid and it is therefore specific. This mechanism is extensively studied because it is strictly related to the catalytic process. 4.1 - Energy of adsorption
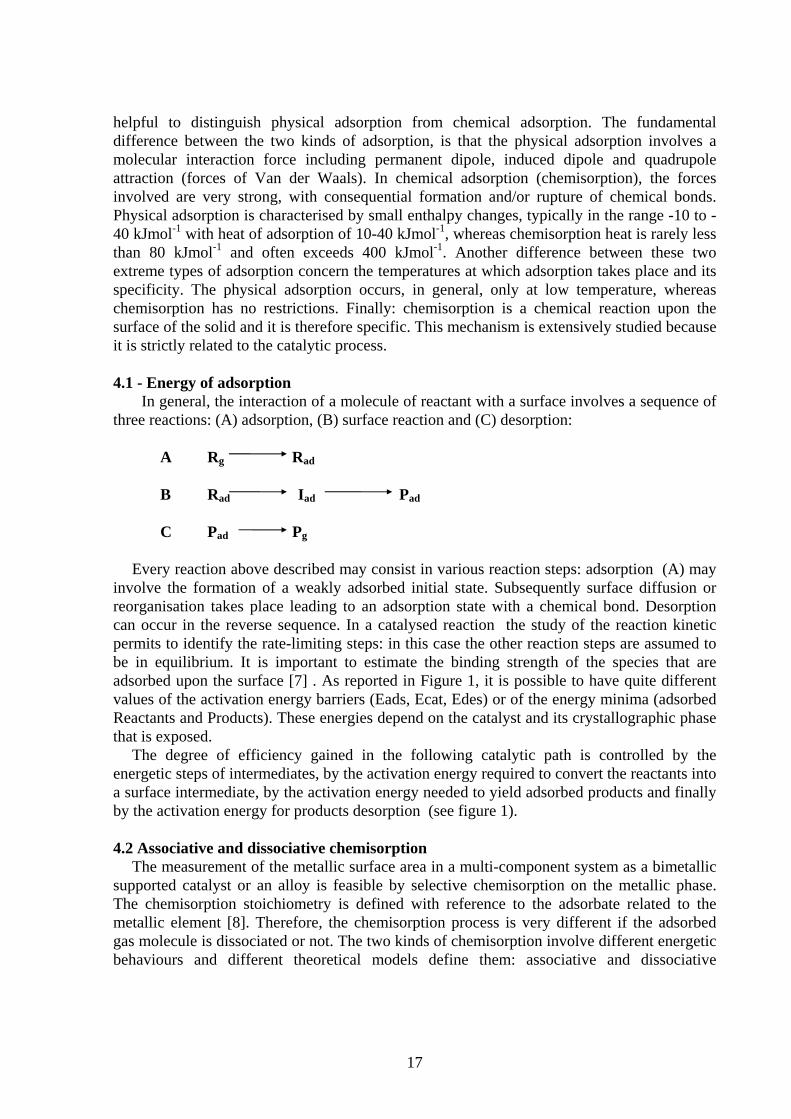
In general, the interaction of a molecule of reactant with a surface involves a sequence of three reactions: (A) adsorption, (B) surface reaction and (C) desorption: A Rg Rad B Rad Iad Pad C Pad Pg
Every reaction above described may consist in various reaction steps: adsorption (A) may involve the formation of a weakly adsorbed initial state. Subsequently surface diffusion or reorganisation takes place leading to an adsorption state with a chemical bond. Desorption can occur in the reverse sequence. In a catalysed reaction the study of the reaction kinetic permits to identify the rate-limiting steps: in this case the other reaction steps are assumed to be in equilibrium. It is important to estimate the binding strength of the species that are adsorbed upon the surface [7] . As reported in Figure 1, it is possible to have quite different values of the activation energy barriers (Eads, Ecat, Edes) or of the energy minima (adsorbed Reactants and Products). These energies depend on the catalyst and its crystallographic phase that is exposed.
The degree of efficiency gained in the following catalytic path is controlled by the energetic steps of intermediates, by the activation energy required to convert the reactants into a surface intermediate, by the activation energy needed to yield adsorbed products and finally by the activation energy for products desorption (see figure 1). 4.2 Associative and dissociative chemisorption
The measurement of the metallic surface area in a multi-component system as a bimetallic supported catalyst or an alloy is feasible by selective chemisorption on the metallic phase. The chemisorption stoichiometry is defined with reference to the adsorbate related to the metallic element [8]. Therefore, the chemisorption process is very different if the adsorbed gas molecule is dissociated or not. The two kinds of chemisorption involve different energetic behaviours and different theoretical models define them: associative and dissociative

18
adsorption. In the first case, the gas is adsorbed without fragmentation; in the second case, the gas molecule is adsorbed after its decomposition in one or more fragments. Hydrogen, for example, is always adsorbed in its dissociated form. H2 2H, whereas N2 is adsorbed in the two forms (see table 3). The gas-metal interaction (see par. 4) involves 3 or 4 steps: 1) Adsorption of molecular gas system 2) Dissociation of gas molecule (if the process is dissociative) 3) Migration of atoms on the surface and into the bulk 4) Formation of gas-metal bond In general, in case of associative mechanism, the chemisorption process follows the first order; in the other case it is of the second order. As already reported (Table 3, par. 3.1), the adsorption mechanism depends upon the energetic of the process and it is different for each pair of metal-gas. The knowledge of the chemisorption mechanism permits to calculate the activation energies. Thermal programmed desorption is commonly used to estimate activation energy: Qad = -∆H = Ed - Ea (5)
where Qad is the heat of adsorption; Ed and Ea are the energy of the desorption and adsorption process respectively. In the case of dissociative chemisorption, the activation energy Ea for the adsorption on metal is zero. Therefore, the heat of adsorption is equal to the activation energy for the desorption process. The binding energies, BE, for the bond M-H are obtained from the equation: EM-H = ½ ( Ediss,H2 - Ea ) (6)
where Ediss,H2 is the dissociation energy of H2.
If the catalyst system is not able to provide enough energy for the gas dissociation, the adsorption process can be activated by a temperature increase. The adsorption of H2 on pure cobalt on Al2O3 is a typical system able to adsorb dissociated H2 only at high temperature (100°C) , while if a second metal is present (i.e. Ru, Pt) [8]. 4.3 – Acid-base interaction
The investigation of the surface acidity is helpful to explain the behaviour of some kind of catalyst. The acid surfaces are known to be able to generate, for example, carbon ions that are useful intermediates in catalytic reforming, cracking and isomerisation. In general, the evaluation of the acidity, or more specifically of the surface acidity, needs the determination of the nature, the strength and the number of acid sites. There are many techniques able to determine some aspects of acidity, to characterise the acid properties of solid surfaces used as catalysts in industrial processes or to find some potential solid candidates for new developments. The characterisation of acid sites can be performed by the chemisorption of a basic gas which, adsorbed by an acid site, is transformed into its conjugated acid form. The Brönsted definition is used to describe an acid or a base: an acid is an electron-pair acceptor and is able to transfer a proton from the solid to the adsorbed molecule. While according to Lewis definition, the acid site is an electron pair acceptor from the adsorbed molecule and a

19
co-ordinated bond with the surface is formed [9]. The surface acid nature depends on the co-ordination of a metal cation with oxygen in the support structure. For example, alumina and alumina-silicates show tetrahedral co-ordinations between the Al-Si cations and oxygen, and negative charges are created. For cations with charges lower than 4 a Brönsted acid site is generated. To create a Lewis type acid site it is necessary to have the formation of co-ordinated unsaturated sites. Generally, the acid properties of a give solid are due to the presence of a wide distribution of acid site type. Sometimes both Brönsted and Lewis sites are simultaneously present on the surface. The investigation on the acid surface properties is therefore of great importance to foresee the catalytic activity and selectivity. In any case it is very important, in the catalyst characterisation, to carry out each determination in analytical conditions closer as possible to the operative conditions of the catalytic reaction. Common methods for surface acidity measurement include: aqueous methods (titration or ion exchange); indicators methods without solvent, with spectroscopic instruments; calorimetric methods by determination of the heat of adsorption, temperature programmed methods (in particular the temperature programmed desorption, TPD) where a sample previously saturated with a reactive gas, as ammonia or an acid molecule in a static or dynamic system, is submitted to a linear ramp of temperature in a flow of inert gas. Finally, other spectroscopic methods are: ultraviolet spectroscopy (UV), nuclear magnetic resonance (NMR), electron spin resonance (ESR) and x-ray photoelectron spectroscopy (XPS). 5 – CHEMISORPTION TECHNIQUES
As mentioned above, the methods to perform chemisorption analyses are mainly two: the static and the dynamic adsorption. In the case of static adsorption, the sample is generally pre-treated in high vacuum, and, after the catalyst activation, known doses of reactive gas are injected in the sample holder. Modern analytical instruments detect the amount of gas adsorbed for each introduction by determining accurately the time necessary to establish the correct equilibrium between the gaseous phase and the adsorbed one. Once equilibrium has been reached, the equilibrium pressure is measured systematically, until the complete chemisorption isotherm is collected and a monolayer of gas molecule is covering the active surface. The dynamic method consists in flowing continuously (constant flow) an inert gas through the sample, then known doses of reactive gas are injected by a loop system into the gas stream. When the reactive gas pulses reach the catalytic surface, the gas molecules react with the sample being adsorbed. In the case of dynamic adsorption, it is not possible to state the correct equilibrium time for the chemical reaction. Therefore, the only parameter that can be adapted to allow sufficient contact time between the gas and the solid is the flow rate. Using the dynamic method the lower is the flow rate longer is the contact time between the gas pulse and the sample. Operative conditions during the chemisorption analysis are of extreme importance. Temperature of analysis, equilibrium time and pressure for static techniques, flow rates for dynamic techniques should be carefully chosen to avoid phenomena as spillover or solutions between the adsorbate and the solid (i.e. absorption of hydrogen in palladium). The static technique allows to perform an analytical procedure called “back sorption”. During a first analytical cycle the reactive gas can interact with the catalytic surface producing gas-solid interactions showing different bounding energies. This leads to different species of gas adsorbed: strong and weak chemisorption. While the gas that is strongly bounded to the surface can be removed only by increasing the temperature and

20
applying vacuum or a flow of inert gas (thermal desorption), the gas molecules weakly bounded can be removed at the same analytical temperature only applying vacuum or inert flow. Therefore the back sorption procedure consists in measuring a first gas adsorption isotherm (strong + weak adsorption) followed by a sample degassing at the same temperature, moving only the weakly adsorbed molecules. Finally, a second run is performed with the same reactive gas now, measuring only the amount of gas adsorbed by the weak interactions. The two collected adsorption isotherms can be now subtracted one from the other providing a third curve related only to the strong interactions. In figure 4 the isotherm labelled as “A” represents the first run of hydrogen chemisorption on 6.3% platinum supported on silica, “B” is the second adsorption analysis and “C” is the curve resulting from the subtraction of the two analyses. Separate calculation of the gas uptake permits the distinction of the hydrogen molecules adsorbed with different energies. The calculation of metal specific surface area and dispersion should be carried out on isotherm “C”.
Figure 4: Chemisorption of hydrogen on 6.3% platinum on silica catalyst at 25 C performed by the Sorptomatic 1990 (CE Instruments).
The dynamic method cannot provide the above information as during the adsorption
process the inert gas flow continuously moves the molecules weakly adsorbed. On the contrary, a complete static analysis takes many hours (typically 6 to 12 hours for the first run and additional 6 –8 hours for the second run) and it is operatively more complicated while the dynamic method is extremely fast and easy to be performed. 5.1 - Sample preparation and catalyst activation
Sample preparation is a fundamental step before any type of chemisorption measurement. This phase has the purpose of activating the catalyst to the chemical reaction that will take place. Therefore, the sample pre-treatment should be carefully studied to obtain later on the most accurate experimental data. A typical procedure for chemisorption measurements consists in the following steps:

21
1. Accurate cleaning of the catalyst surface before the pre-treatment procedure. The surface cleaning consists in removing water vapour or other pollutants adsorbed on
the catalyst. This step should be chosen according to the catalyst nature and catalyst life cycle. For instance, the cleaning conditions should be determined in function of the treatments performed on the catalyst. In case of a new catalyst the promoters of metal deposition should be removed to avoid any kind of interaction with the reactive gas used for the measurement. If the catalyst has been used, it is important to clean the surface, if possible, from pollutants or poisons eventually blocking the active sites. The cleaning phase can be performed under high vacuum degree or flowing an inert gas through the sample at the highest temperature not modifying the catalyst structure (i.e. synterisation). The cleaning time has also a great importance because, even if the selected temperature for a short time is not affecting any sample modification, may be that if the catalyst is kept at this temperature for long periods the metal atoms can migrate, increasing the aggregate size. 2. Choice of proper pre-treatment procedure.
This is a very delicate step; the nature of the catalyst should be carefully investigated by a bibliographic search, if available, to chose the best preparation procedure. Sample pre-treatment usually consists in several steps that must be repeated carefully for successive analyses to assure the best reproducibility in the analytical results. For instance, it is sufficient a small difference in temperature rates, vacuum degree or final temperatures to obtain complete different results on the same catalyst. Pre-treatment is used to activate the catalyst surface to the chemical reaction with the measuring gas, therefore it is difficult to generalise a procedure for it but most of catalytic systems are well studied and a bibliographic search is always advisable. As the most common gas used for chemisorption analyses are hydrogen, oxygen, carbon monoxide or di-nitrogen oxide, a generic pre-treatment procedure can be performed according to the following steps: a. Sample oxidation, by flowing air or, better, pure oxygen over the sample. This step oxides
all the metal atoms on the surface, eventually removing also carbon residual. b. Sample reduction, by flowing pure hydrogen over the catalyst. Hydrogen will react with
the metal oxide forming hydrides and water. c. Hydrogen removal. This step can be carried out in high vacuum or in flow of inert gas
obtaining a surface metal in zero valence state, ready to react with the measuring gas in the analytical cycle. Usually it is better to run first the oxidation and later the reduction because for most metal systems the hydride can be dissociated more easily during the final degassing procedure. Metal oxides are generally very stable. Of course, in the case of oxygen/hydrogen titration analyses, the final step will leave a layer of oxygen or hydrogen bounded to the surface active sites, in order to perform the chemical reaction between the two gases during the analysis (one adsorbed and one in the gaseous phase).
Temperature is one of the main parameters to be carefully chosen. In fact, during the sample reduction by flowing hydrogen, water vapour is produced by the chemical reaction. The formed water is in part carried away by the gas stream but in part can be adsorbed by the porous structure of the support during step b. here above. When performing the hydrogen removal (step c.) sample temperature should usually be a little lower then the previous step. In fact, during the sample reduction, the stream of hydrogen while reducing the metal also removes the formed water on the metal surface and from the porous support, but this happens at the reduction temperature. If in the next phase the temperature is slightly higher, the water adsorbed by the support begins to desorb slowly. When reaching the catalytic aggregates,
22
which are now activated, water reacts again with the supported metal and a non-controlled oxidation takes place. The bad consequence is the non-reproducibility of the adsorbate uptake measurement. It is sufficient to keep the temperature of the last step few degree lower than the reduction step just to be sure that the overshooting or the temperature oscillation of the oven stay below the selected temperature for reduction. 5.2 – Static adsorption
To perform static adsorption the analytical instrument must be equipped as follow: - high vacuum pumping system, able to generate a vacuum degree over the sample of at
least 10-4 torr - Stainless steel plumbing with high vacuum fittings to ensure a correct tightening. Leaks
are the most common problems related to static adsorption. In fact, the experiment is usually carried out below atmospheric pressure and a leak of air coming inside the system will affect the results. Equilibrium pressure will be higher than the real ones and the catalyst may be oxided by the oxygen contained in the air.
- Well calibrated injection system. The injection system could be a fixed calibrated volume, where only the adsorbate loading pressure can be varied, or a moving calibrated piston, where also the volume injection can be changed. The advantage of using this last system is that after the gas injection in the sample holder the piston will fill completely the calibrated volume. In this way the calibrated volume for injection will not increase the dead space over the sample. On the contrary, when using a fixed injection volume, during the equilibrium pressure measurement the calibrated loading volume is added to the system dead space, decreasing the precision in pressure measurement.
- Detection method. Usually two main methods are used to detect the amount of gas adsorbed during the analysis: the volumetric system and the gravimetric one. Anyway the equilibrium pressure is measured by a suitable pressure transducer chosen according to the pressure range that is established during the experiment. Typical pressure range for chemisorption measurement is up to 100 torr (most of catalytic systems show the monolayer formation below this pressure). In a volumetric apparatus the raw experimental data are the equilibrium pressures and the amount of gas adsorbed for each step. The gas uptake is calculated directly from the equilibrium pressures values but a proper dead volume calibration have to be performed before or after the measurement by a “blank run” (that is an analysis by using an inert gas not reacting with the sample). In case of gravimetric systems the dead volume calibration is not necessary because a suitable microbalance directly detects the weight changes of the sample when adsorbing the measuring gas. Static volumetric instruments are very commonly used because they provide a reasonable compromise between degree of precision, ease of use and price, while the gravimetric systems are very precise but also very expensive due to the high cost of the microbalance.
- Suitable manifold dead spaces. The system dead volume in theory should be as small as possible but in reality it should be carefully evaluated, especially for static volumetric systems. The volumes of adsorbed gas are calculated by the pressure difference between the experiment (with a reactive gas) and the blank (dead volume calibration with an inert gas): the smaller is the dead volume, higher is the difference in pressure and more precise is the adsorbed volume calculation. On the contrary, by decreasing the system dead space the gas dose to be injected should be decreased accordingly to avoid the risk of injecting

23
too much gas that might overtake the necessary amount to form a monolayer or, in the best case, to produce an isotherm with few experimental data points. In fact, when the injection volume is too small it is very difficult to calibrate it with the required precision.
- Manifold and sample temperature. The manifold, injection system and pressure transducers temperature should be fixed at a value slightly higher than room temperature (i.e. 35 – 40 °C) for better thermal conditioning (it is very difficult to keep temperature constant about room temperature). On the other hand the temperature should not be too high because this might badly affect the transducers linearity. Sample temperature should be as stable as possible (maximum oscillation +/- 0.1 °C) and should be chosen according to the type of experiment that is required. Typical chemisorption isotherms are performed about room temperature (20 – 25 °C) but for some systems might be necessary higher or lower ones (i.e. analysing palladium with hydrogen, higher temperature shifts to higher pressure the gas dissolution in the metal or measuring ruthenium with hydrogen higher temperature shortens the equilibrium time).
5.2.1 – Experimental aspects A typical scheme of a volumetric apparatus for chemisorption is reported in figure 5.
Figure 5. Typical diagram of a static volumetric apparatus for gas adsorption.
A minimum of two gas inlets is required, one for the inert gas used in the calibration of the dead volume and one for the reactive gas. The reference volume for gas injection might be a fixed volume type or a moving piston. In the second case it is possible to change the injection volume in addition to the loading pressure according to the sample adsorption rate and the required number of experimental points. One or two separate transducers might

24
perform the measure of the loading pressure and the equilibrium one. In case that only one transducer is used, the pressure transducer volume must be added as dead volume in the reference volume. 5.3 - Dynamic adsorption
In chemisorption measurements performed by static volumetric systems, the sample is submitted during the analysis in a vacuum system. In effect, this method has the advantage of separating the contribution of physical and chemical adsorbed gas (weak and strong bounding). On the other side, the analysis conditions are very different from the working conditions of the catalyst during the reaction in the reactor (high temperature and pressure, very long analysis time). When the catalyst characterisation have to be performed in analytical conditions which are very similar to the catalytic process, the flow chemisorption method (dynamic adsorption) might be very useful. In flow technique the sample is placed in a tubular reactor and it is analysed in operative conditions closely as possible to real work conditions, as already cited. There are several advantages using the dynamic method: 1) analysis is very fast 2) during the analysis there is no physical adsorption therefore the second adsorption run is
not necessary, obtaining immediately the data related the strongly chemisorbed gas 3) this technique allows an easier characterisation of samples with a small dispersion or a
very low percentage of active phase 4) manual operations are very easy The sample preparation is similar to the ones already described for static adsorption (see par. 5.1) the catalyst must be cleaned and pre-treated opportunely in order to perform a correct quantification of the active sites. 5.3.1 – Experimental aspects
The chemisorption analysis by flow system is named Pulse Chemisorption. The typical apparatus to perform pulse chemisorption analyses is very similar to the one used for TPD/TPR analyses. In figure 6 is represented the schematic diagram of a typical apparatus performing most of the dynamic analytical techniques. The gas to be adsorbed is introduced as a pulse, by an opportune system as a multi-port loop valve, into the stream of the inert gas used as carrier. The injection system is placed before the sample reactor. The choice of the probe gas and of the carrier gas must assure the best answer of the detector if a TCD is used. In this case the two gases should have different thermal conductivity to have the best sensitivity of the filament. It is important also to use the carrier and reactive gases with the highest purity; both gases should flow through a water trap or a suitable filter to completely retain eventual vapours. The detector calibration should be performed before starting the pulse chemisorption analysis by using the same analytical conditions as temperature, types of gas and flow rate, in order to estimate the answer of the detector when the calibration pulse is introduced. The peak obtained in the chromatogram without adsorption must be then integrated therefore the relation between the peak area and quantity of gas injected can be easily calculated.

25
Figure 6. Diagram of a multipurpose apparatus for pulse chemisorption, TPD, TPR and TPO.
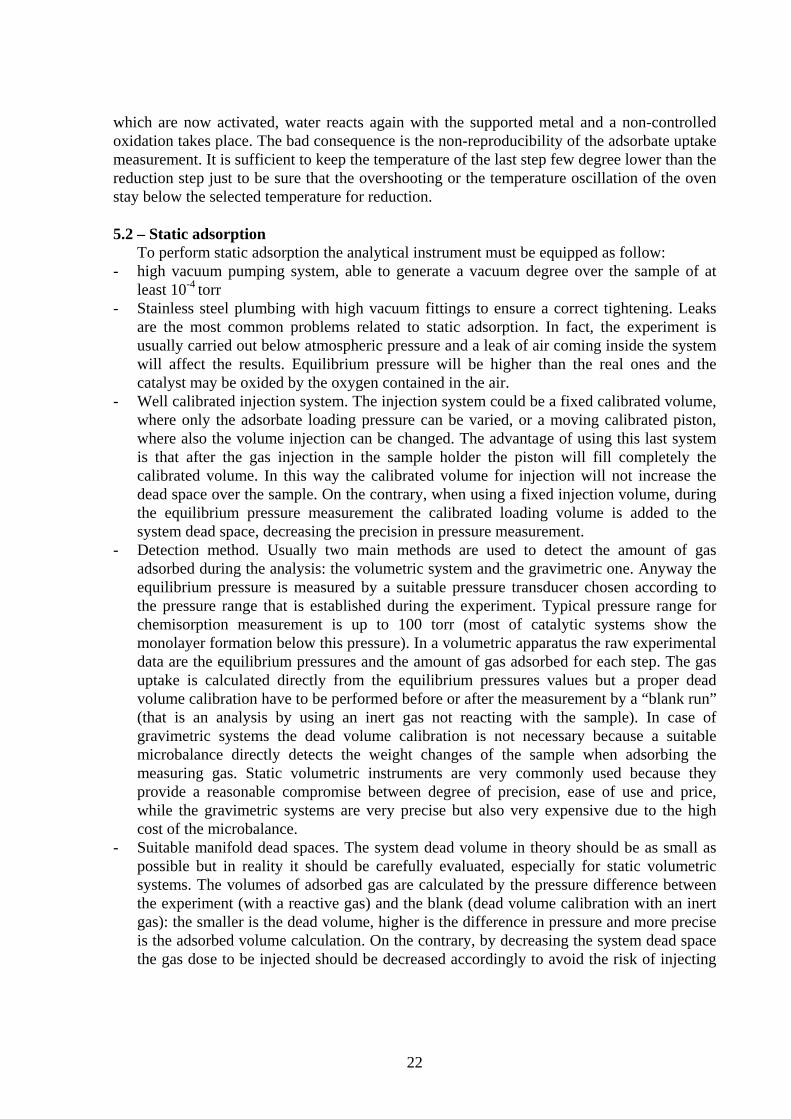
After the quantitative calibration, it is possible to start the analysis by introducing a number N of pulses of gas that now will be adsorbed by the activated catalyst. The amount of gas adsorbed for each pulse is given by the difference between the area of the peak given for the reference pulse and the area under the peak acquired during the adsorption process (see figure 7). In general, the injection loop volume should be chosen to provide an analysis with several experimental points to define better the saturation curve. The total amount of gas adsorbed Vt during the analysis is given by: Vt = ∑N
i=1 Vai (7)
where N is the number of pulses necessary to saturate the active sites and Vai is the volume of gas adsorbed from the pulse i given by the difference: Vref - Vpi where Vpi is the volume of gas non adsorbed from the pulse i. Once the reactive gas saturates the sample, the peaks areas acquired by the TCD (b, figure 7) are equal to the reference calibration peak (a, figure 7) and the analysis is over. In general, as for static adsorption analyses, the dynamic chemisorption is performed at constant temperature conditions (isotherms). The choice of the temperature depends on many factors as type of sample and gas, type of information required, but it is very common to perform chemisorption at room temperature. Also the pre-treatments of the sample are effected in order to obtain a clean surface able to chemisorb the probe gas as described in 5.1.
26
Figure 7. Pulse chemisorption analysis performed by the TPDRO 1100 (CE Instruments). 5.4 – Calculation of monolayer volume of chemisorbed gas
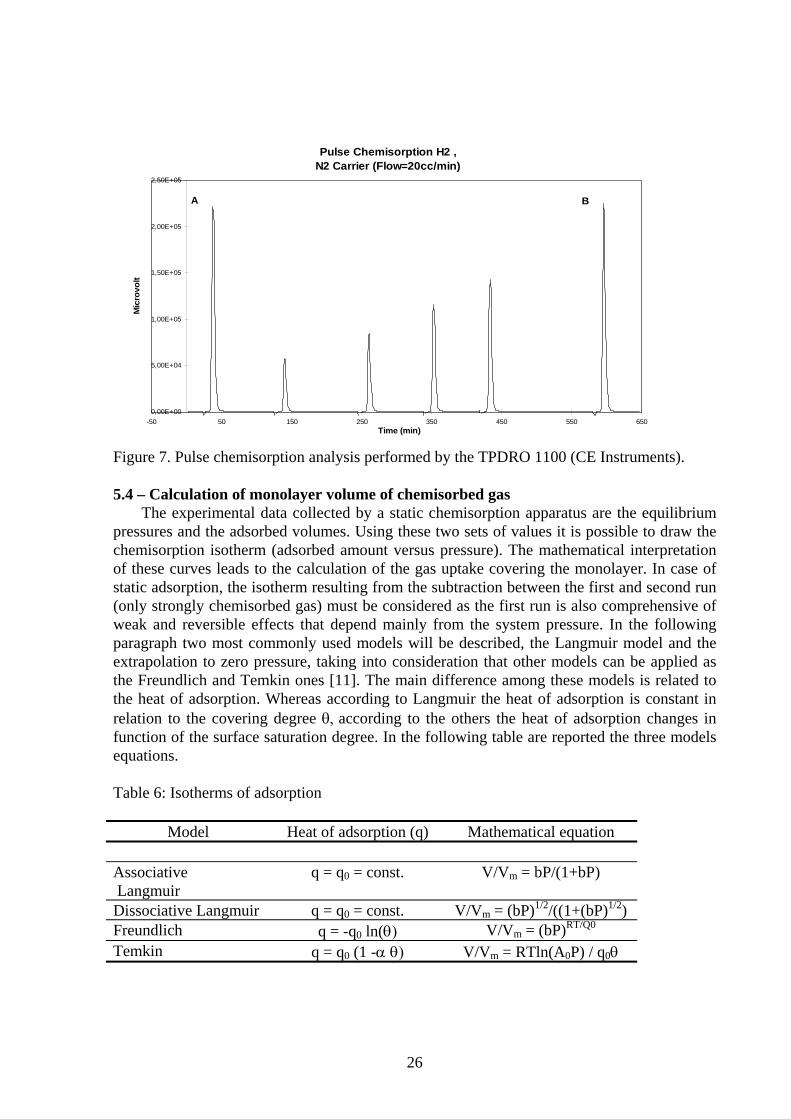
The experimental data collected by a static chemisorption apparatus are the equilibrium pressures and the adsorbed volumes. Using these two sets of values it is possible to draw the chemisorption isotherm (adsorbed amount versus pressure). The mathematical interpretation of these curves leads to the calculation of the gas uptake covering the monolayer. In case of static adsorption, the isotherm resulting from the subtraction between the first and second run (only strongly chemisorbed gas) must be considered as the first run is also comprehensive of weak and reversible effects that depend mainly from the system pressure. In the following paragraph two most commonly used models will be described, the Langmuir model and the extrapolation to zero pressure, taking into consideration that other models can be applied as the Freundlich and Temkin ones [11]. The main difference among these models is related to the heat of adsorption. Whereas according to Langmuir the heat of adsorption is constant in relation to the covering degree θ, according to the others the heat of adsorption changes in function of the surface saturation degree. In the following table are reported the three models equations. Table 6: Isotherms of adsorption
Model Heat of adsorption (q) Mathematical equation Associative Langmuir
q = q0 = const. V/Vm = bP/(1+bP)
Dissociative Langmuir q = q0 = const. V/Vm = (bP)1/2/((1+(bP)1/2) Freundlich q = -q0 ln(θ) V/Vm = (bP)RT/Q0
Temkin q = q0 (1 -α θ) V/Vm = RTln(A0P) / q0θ
Pulse Chemisorption H2 , N2 Carrier (Flow=20cc/min)
0,00E+00
5,00E+04
1,00E+05
1,50E+05
2,00E+05
2,50E+05
-50 50 150 250 350 450 550 650Time (min)
Mic
rovo
lt
A B

27
Where q0 is the heat of adsorption for θ close to zero. In case of pulse chemisorption technique, the best way to evaluate the monolayer volume is to take into account the total volume of gas adsorbed during the experiment. In fact, in this case it is not necessary any volume correction as the carrier flow during the run removes continuously the physisorbed or weak chemisorbed probe gas. 5.4.1 – Langmuir isotherm
The Langmuir model [12] is commonly used to process chemisorption isotherms because it is relatively simple and it can be used in developing several kinetic equations. It is based on two fundamental assumptions: - The adsorption energy is the same for every active site and there are no interactions
between adsorbed molecules - Adsorption is localised From these assumptions derives that every active site has the same probability to interact with an adsorbing gas molecule, independently from the fact to be surrounded by other occupied sites. Furthermore the maximum uptake that can be adsorbed corresponds to a monolayer of molecules (or, better, of gas atoms). The Langmuir model can be conveniently used to describe the associative or dissociative adsorption. Associative adsorption
By indicating as A the adsorbate gas molecule and S the free active site, the associative adsorption follows the following mechanism: S + A = SA. By indicating as θ the covering degree:
θ = (occupied sites / total available sites)
therefore the speed of adsorption during the process is proportional to (1- θ) (free sites) and to the gas pressure P. The speed of adsorption, Uads = [adsorbed moles / time], is calculated as follow: Uads = Kd Pa (1- θ) (8) While the speed of desorption is: Udes = Ki θ (9)
All the experimental points in a chemisorption isotherm are at the equilibrium, therefore for every point the two speeds are equal, Uads = Udes, that is: Kd Pa (1 - θ) = Ki θ (10)
θ = (Kd Pa) / (Ki + Kd Pa) = K Pa / (1 + K Pa) (11) where K = Kd / Ki is the adsorption equilibrium constant that depends on the absolute temperature according to the Van’t Hoff equation:

28
K = a e-dH / R T (12) where -dH is the heat of adsorption. According to the Langmuir model assumptions, the heat of adsorption is independent from the covering degree, but this is true only if the active surface is energetically homogeneous and if there are no interactions between adsorbed molecules. On the other hand, by considering this assumption as true the mistake appears to be minimal. Dissociative adsorption
When the adsorbent molecule covers two or more active sites, it is possible to derive the dissociative Langmuir model in the following way: θ = (K Pa)1/n / (1 + (K Pa)1/n) (13) where “n” corresponds to the stoichiometry of the reaction Sn + nA = n(S A). Defining the covering degree as θ = (Vads / Vm) (14)
where Vads = adsorbed gas volume for each experimental point and Vm = monolayer uptake, we obtain: (Vads / Vm) = (K P)1 / n / (1 + (K P)1 / n) (15) and after several passages: P 1 / n / Vads = (1 / (Vm K)1 / n) (P1 / n / Vm) (16) This is the equation of a straight line whose slope is the inverse of the monolayer uptake and from the intercept, it is possible to calculate the parameter K, better known as “B” parameter of the Langmuir model. The “n” parameter should be optimised according to the correlation coefficient calculated by the least squared method. In case of associative adsorption n = 1. 5.4.2 – Extrapolation to zero pressure
In chemisorption isotherms the value of adsorbed volume of gas is not constant and, even after the monolayer has been formed, the volume of gas continuously increases due to weak adsorption effects that are mainly pressure dependent. Usually to obtain a real horizontal plateau after the monolayer covering it is necessary to perform the back sorption procedure and the consequent isotherm subtraction. Some models (i.e. Freundlich) can be applied also to the first run only but an empirical method is available giving consistency in the monolayer volume calculation in comparison to the Langmuir model when applied to the subtracted isotherm. The method of back extrapolation [13] consists in identifying a linear part in the isotherm, even if the slope is still higher than zero, and, by applying a linearisation method, it is possible to extrapolate from these data a straight line. The intercept value of the resulting line is the monolayer uptake as the theory behind this method supposes that by extrapolating the linear part of the isotherm to a zero pressure, the reversible effects of adsorption can be excluded (see figure 8). An interesting comparison is reported in table 7, where the system palladium supported on carbon has been characterised by oxygen chemisorption.

29
Table 7 Results by different calculation methods of Pd 5% supported on carbon (Sorptomatic 1990). Palladium 5% on activated carbon Vm (Ncc/g
support) Surface area (m2/g metal)
Metal dispersion (%)
Back extrap. (1) 2.089 249.52 56.51 First run isotherm Langmuir (2) 2.877 343.76 77.85
Back extrap. (3) 1.855 221.67 50.20 Isotherm after subtraction Langmuir (4) 2.228 266.17 60.28
The results calculated by the Langmuir model on the first run isotherm (2) are not reliable as the first run is taking into account also reversible adsorption. The Langmuir model is here not applicable. However, a comparison between the other results leads to very similar values. In fact, the results at point (1) and (3) are quite close each other as the back extrapolation theory supposes that at zero pressure the weak effects can have no influence. Therefore the results obtained by the application of this model to both isotherms (first run and subtracted one) should give similar values. The values obtained by the Langmuir model to the corrected isotherm show consistency with previous results.
Figure 8. Extrapolation to zero pressure to a corrected isotherm (Sorptomatic 1990)
30
6 – THERMAL DESORPTION TECHNIQUE
The mechanism of catalytic processes is directly correlated to the surface behaviour of the solid catalyst. The characterisation of catalytic system requires the detailed description of the preparation method, the specification of the catalyst physical properties and the detailed information about its structural and chemical characteristics. A complete description of a catalyst should be comprehensive of information about the rate of chemical change, about the product composition and about the catalyst modification in time, due to poisoning, inhibition, sintering and chemical reactions. The thermal analysis methods are very helpful to know all of these catalytic properties. The thermal analysis methods may be used with different objectives: the reaction or desorption profile may be used qualitatively to fingerprint a given system and then it is possible to make a quantitative considerations about the nature of chemical processes, the amount of gas involved in the chemical reaction and finally to calculate the number of the active sites, the reducibility degree of the sample related to the catalytic activity. All the methods relating some characteristic properties of a catalyst to its temperature during a programmable heating ramp are named commonly in the field of the thermal analysis.
As the thermal change at a given temperature depends on many factors as the nature of the system, the type of gas used, the flow rate, pressure and several kinetics factors, therefore all the experimental aspects should be taken in consideration. The thermal analyses are often used to investigate surface modifications and bulk reactivity by varying the surface composition, the catalyst preparation method, the pre-treatment for catalyst activation and the analytical conditions. The fundamental differences between temperature programmed desorption and temperature programmed reaction (reduction, TPR, and oxidation, TPO), is that the first analysis involves a surface process, while the TPR/O involve a bulk reaction. 6.1 – Theory of thermal desorption
During the Temperature Programmed Desorption analysis (TPD), the sample, opportunely pre-treated, is submitted at an increasing temperature with constant rate and it is swept by an inert gas as helium, argon or nitrogen. The sample surface desorbs the gas that has been previously chemisorbed and a suitable detector monitors the process. Most commonly used detectors are thermal conductivity (as described in 6.2) or a mass spectrometer. In the TPD studies the solid system is previously equilibrated until saturation with a probe gas in isothermal conditions and at a given partial pressure (in general atmospheric pressure if the dynamic method is used). The Langmuir adsorption model may be used as well for the TPD spectra interpretation as it describes both gas adsorption and desorption in the two cases of associative and dissociative adsorption (see 4.2) [14]. The enthalpy of adsorption is considered as independent from the fraction of occupied active sites and the number of the available sites is fixed. Furthermore, both quantities are supposed to be independent from the temperature. The two types of possible mechanism (associative and dissociative), as already mentioned are the following: 1) S + A S-A non dissociative 2) 2S + A2 2S-A dissociative

31
According to the above hypotheses, in case of non dissociative adsorption it is possible to derive the number of occupied sites No at a given time t by: dNo / dt = pka (Ntot - No ) - kdN (17)
where: kaand kd are respectively the kinetic constant of adsorption and desorption process. p is the partial pressure of reactive gas and Ntot is the total number of active sites. In general, the constant ka and kd are depending on the Arrhenius equation: ki = Ai exp (-Ei/RT) i= a, d (18) where Ei is the activation energy of the process. Moreover, as already described in equation (5), ∆Ha = Ea - Ed. In case of dissociative adsorption, the process is of the second order and the adsorbate molecule dissociates in two or more parts. Accordingly, in the equation (17), the terms (Ntot - N0) and N are at the second power (Ntot - N0)2, N2. The TPD analysis profile, in both cases, the process rate is given by the difference between the rate of desorption rd and the rate of adsorption ra. When ra ≅ rd the regime is in dynamic equilibrium, while when rd >> ra the TPD profile depends by the heating rate β (expressed in K/s). The correlation between the energy of desorption and the factor β is given by: ln (Tm
2 / β ) = Ed/RTm + ln (Ed / kd R) (19)
as shown by Anderson et Al. [14]. Equation (19) shows that the activation energy Ed for the desorption process is an experimental quantity, easy to be obtained from the temperature programmed desorption data. The activation energy for desorption can be estimated from the temperature of the maximum desorption rate, Tm, from the heating rate parameter β and from kinetic constant of the desorption reaction kd. 6.2 - Experimental aspects
Suitable characterisation techniques permit to determine the characteristic of the catalyst as the surface area, the metal dispersion, the type of the deactivation or the structural modifications during and after catalysed reactions. Therefore, catalyst characterisation is essential for evaluating and improving the preparation methods or the reaction parameters. The techniques available for this purpose are often not very helpful to characterise catalysts under working conditions. In general, the analytical methods based on a flow system, as thermal programmed desorption, reaction/oxidation, reaction and pulse chemisorption, are the best methods to characterise the adsorption and reaction energetic, the bulk or surface active phase and the site distribution of the supported catalyst. In fact, it is possible to approach the analytical conditions used in these methods to the real reaction conditions. The flow-based techniques (TPD, TPR/O and pulse) use essentially the same equipment. A typical flow system diagram is represented schematically in figure 6. The TPD/R/O analyses are carried

32
out by flowing a suitable reactive gas or gas mixture through the catalyst placed in a tubular sample holder (flow-through or flow-over types). In case of TPD analysis, the sample is previously saturated with the chosen adsorbate by flowing the reactive gas or executing a pulse chemisorption analysis. Gas mixture is typically used to perform TPR and TPO analyses, as a small percentage of hydrogen or oxygen (about 5%) diluted in argon or nitrogen for TPR and helium for TPO. In fact, when the detector is a thermal conductivity one, the thermal conductivities of the carrier gas and the detected gas must be different. If the detector is a quadrupole mass spectrometer, the desorbing gases should present typical and unique mass fragments, to be distinguished from the carrier mass fragments. In temperature programmed techniques the temperature increase must be linear, therefore the oven must be able to perform a wide range of temperature rates (typically from 1 to 20 K/min) in a wide temperature range (from ambient up to 11373 K). Moreover, the best furnace type is the anti-magnetic one, that is the heating coils should not generate any magnetic field on the sample holder to avoid signal oscillation when using carriers with a polar moment (i.e. nitrogen). The real sample temperature must be monitored continuously by a suitable sensor placed inside the catalyst bed to detect possible endo or exothermic reactions. The temperature sensor should be opportunely protected by an inert material sheath (i.e. quartz made) to avoid chemical reactions of the sensor itself (typically a thermocouple) with the reactive gases. It is important, from the experimental point of view, to use gases of the highest available purity and also to remove traces of water impurity by using an opportune cold trap (liquid nitrogen) or molecular sieve trap. The gas flow must be very stable to optimise the detection sensibility (an electronic mass flow controller is the best system for this purpose). The choice of the carrier gas depends on the reactive gas that have to be detected: in table 8 are reported some typical gas coupling when using a thermal conductivity detector. Table 8 Detection of some gases in relation to different carriers by TCD. Gas Main use Thermal
conductivity (*)Detectable reactive gases
He Carrier 3363 O2, CH4, CO, CO2, SO2, H2S,NH3, NO, N2OAr Carrier 406 H2N2 Carrier 580 H2H2 React./Carrier 4130 CO, CO2O2 React. 583 -CH4 React. 720 -CO React. 540 -CO2 React./Carrier 343 H2SO2 React. 195 -H2S React. 327 -NH3 React. 514 -NO React. 555 -N2O React. 374 -
(*) Determined at 273 K, values .107 (cal / cm.s.K).

33
In a TCD detector, two sets of filaments are mounted in a Wheatstone bridge circuit, one set is immersed in the pure carrier gas stream (reference) while the other in the stream exiting from the reactor (measure). The filaments are made of suitable metals (i.e. tungsten or gold) having high temperature coefficient of electrical resistance: R(T) = R0 (1+aT) where T is the filament temperature, R0 is the metal electrical resistivity at 293 K and “a” is the resistance temperature coefficient K-1. When the bridge circuit is power supplied, the filaments temperature changes according to the thermal conductivity of the gas, the flow rate and the environment temperature. It is necessary to have only one variable in the system, that is the change of the gas thermal conductivity between the reference branch and the measure one, therefore all other parameters must be absolutely constant: the flow rate, the environment temperature and the current supply. If the reference and measure filaments are immersed in the same gas type (no gases are adsorbed or desorbed by the sample) the bridge is in equilibrium (same resistance). When the sample, due to temperature increase, begins to adsorb or desorb other species, the bridge is unbalanced, and the detector generates a positive or negative current. Usually the sensitivity by using tungsten filaments is higher, while gold filaments are advisable when the reactive gas is corrosive. The thermal conductivity of the gas flowing over the TCD determines the filaments temperature and consequently also their resistance. It is possible to correlate the measured potential (V) to the change in the gas composition d[C] by V = s d[C], where “s” is the detector sensitivity factor. The thermal conductivity detector is extremely sensitive and it is able to reveal gas quantities in the order of 1 µl. The TCD sensitivity is more efficient when the flow is low (20-50 Ncc/min) and constant. 6.2.1 – Sample preparation
All samples are pre-treated before the analysis by using various procedures in order to obtain a clean surface and to eliminate undesired contaminants. A typical scheme is first to heat the sample at high temperature in flow of inert gas to effect a complete elimination of physisorbed water and/or other pollutants. After the preliminary cleaning, the sample can be saturated with a suitable gas probe (i.e. hydrogen, oxygen, NO, CO, NH3) at a given temperature. Once the saturation is over, the gas in excess is removed by flowing an inert gas at the same temperature of the saturation. In this way the reactive gas weakly chemisorbed and present in the piping can be removed. It is also possible to cool the sample at a room temperature while keeping the flow of the same probe gas. The inert gas used as carrier for the TPD analysis can be introduced once the room temperature has been reached. Sometimes, some substances as carbonaceous residues of calcination or residues of precursors used to prepare the catalyst are present in the catalyst. These “pollutants” can react with the gas probe. In this case, the pre-treatment procedure can be more complex and comprehensive of more steps as pre-oxidation in oxygen, followed by cleaning with an inert gas, reduction with hydrogen and finally another purge of he system. At this point it is possible to saturate the catalyst whit the probe gas. The purpose of the above complex procedure is to assure that the analysis profile takes into consideration only the probe gas desorption that was adsorbed on the investigated active phase.

34
6.2.2 – Analytical method
TPD analyses can be performed by the apparatus described in 5.3.1. As already anticipated, the sample submitted to a linear temperature rate, releases the adsorbed gas in the carrier stream. The thermal conductivity detector will measure the current generated by the bridge unbalance. The data acquired are reported in a TPD profile relating the amount of gas desorbed versus the sample temperature and time (the rate is linear). To assure a precise quantitative calculation of the desorbed gas it is necessary to remove from the stream possible vapours that are produced during the analysis. For this reason is rather common the utilisation of cold trap or a molecular sieve trap placed before the detector. Sometimes a mass detector might be very useful to verify which types of gases are desorbing together with the probe gas (detection of surface reactions). The experimental conditions should be prepared in a standardised manner to obtain reproducible results. Same factors to be considered include the nature of the gas, the analysis pressure and the flow rate in order to avoid possible phenomena of re-adsorption, that should be avoided because otherwise the resulting peaks will be too large. Best condition for TPD analyses is a low temperature rate to separate the peaks related to different active sites. In the case of ammonia desorption from molecular sieves, the rate of 10 K/min assures that there in not significant re-adsorption, while the data obtained a 2K/min show undesired peaks enlargement, giving evidence of free ammonia re-adsorption. 6.3 – Calculation of total desorbed volume
The limitation of the thermal conductivity detector used in dynamic techniques is related to its inability to identify the species desorbed. That is the reason why a mass spectrometer is largely used after the TCD detector. In fact it is not possible (or, anyway, very difficult) to effect a correct quantitative calculation of desorbed gas only using quadrupole system, therefore the combination of the two detection systems is very appreciated. In the dynamic techniques, the amount of desorbed gas (generally expressed in µmol) is directly proportional to the peak area. Modern acquisition software can easily perform the integration of the resulting spectra if a proper system calibration has been previously carried out. It is also very useful to apply de-convolution models to TPD spectra to identify the contribution of different energetic sites that are dispersed on the catalyst surface. The calibration of an apparatus fitted with a TCD detector consists in a “blank”, which is an analysis without sample using the same analytical conditions as flow rate and gas type. Known gas doses are injected by a syringe or by a calibrated loop in the carrier flow stream and the obtained peak is integrated. The resulting area is correlated to the injected gas dose by a linear relationship. Of course, the response of the TCD detector must be linear in a wide range of injected volumes; otherwise, a non-linear correlation must be performed collecting additional data points in the blank. In case of TPR and TPO analyses, another calibration procedure is commonly used. In this case, the reference peak is obtainable effecting a real analysis on cupric oxide (TPR) or metallic cupric (TPO) previously weighed. The redox stoichiometry of the reaction between hydrogen or oxygen with the above materials is well know therefore it is possible to correlate directly the sample weight used in the calibration with the amount of reacted gas.
35
6.4 – Energy distribution of active sites and isosteric heat of adsorption The temperature at which species are desorbed from the catalyst surface reflects the
strength of the surface bond. The higher is the temperature the stronger is the bond. Temperature programmed desorption data permit to estimate the heat of adsorption of a given species or the formed surface by using the equation (5). When different species are adsorbed Na it is interesting to evaluate the energy distribution of the active sites on the surface of the sample. For a desorption process that occurs with a kinetic order x, the relation between the activation desorption energy Ed and the number of adsorbed species Na is given by: -dNa / dt = kNa
x exp (-Ed / RT) (20)
During the TPD analysis the temperature is increased linearly by: Tt = T0 + βt (21)
Where β = dT/dt and T0 is the initial temperature. Thus: (-dNa/dT) β = k Na
x exp (-Ed /RT) (22) Reporting 1/T versus ln(dxNa/dt) β it is possible to estimate the strength of the binding energy put in evidence by the peak presence. The de-convolution and the integration of the peaks in a TPD spectra permits to evaluate the energy distribution of the active sites as each peak is produced by different types of desorbing sites. Note that, in the equation (22), the desorption energy is supposed to be independent from coverage degree. If TM is maximum temperature of a given TPD spectrum, we are able to set: d/dT [ Na
x (k/β) exp (-Ed/RT)]TM = 0 (23)
βEd = RTM2 k exp(-Ed/RTM) (24)
For a first order desorption (x=1) TM is independent from the initial coverage degree, while in the second order desorption (x=2), the maximum of the peak shifts to lower temperatures as the coverage increases. This demonstrates that TPD data are very helpful and valuable source of information on mechanistic features of catalysed reaction. Another important application of TPD analyses is related to the thermal desorption of ammonia to characterise the acid nature of some supports or catalysts as zeolites, alumina and molecular sieve [16]. The isosteric heat of adsorption can be easily calculated by performing various analyses at different saturation temperatures in order to obtain different degrees of coverage. The analytical temperatures should be chosen in a range that will not modify the surface structure. After several measurements the average adsorption enthalpies can be calculated with respect to the isosteric heat of adsorption Qst. Qst should be evaluated at the same surface covering degree θ for the different isotherms. The Clausius-Clapeyron equation permits to calculate the heats of adsorption from the isotherm data. This equation puts in relation the vapour pressure of a condensed compound with the temperature. Considering the gas as ideal and that the liquid molar volume is negligible with respect to the gas molar volume, the Clausius-Clapeyron equation can be written in the following way:

36
dlnp / dT = ∆Hev / RT2 (25) where ∆Hev is the evaporation enthalpy. The relation (25) is applicable to the adsorption/desorption processes of gases and vapours on solid surfaces: (δp / δT)θ = Qst / RT2 (26) where Qst is the isosteric heat of adsorption. For every covering degree, equation (26) must be evaluated. The equilibrium pressure, during the adsorption process, is function of θ according the resulting adsorption isotherm. To evaluate the relation between the pressure and the temperature the adsorption conditions must be related to a constant saturation degree θ. These conditions are named isosteric. The isosteric heat of adsorption coincides with the average adsorption enthalpy (∆H), unless the negative sign according to the heat convention. ∆H is calculated for a close system at constant pressure and temperature, whereas the unique form of labour is the one of the volume. For a given saturation degree θ, by integrating the equation (26), it is possible to obtain: lnp = (Qst/R)(1/T) + cost (27) To apply the equation (27), it is necessary to collect various adsorption isotherms at different temperatures. For a give saturation degree and for each isotherm, we obtain a pair of values of pressure and temperature. The linear regression of lnp versus 1/T permits to calculate the values of Qst/R from the slope of the straight line that is obtained. By drawing more lines of this type for different saturation degrees, it is possible to study the dependence of Qst form θ. This relation is very helpful to investigate the catalyst surface homogeneity. 6.5 – Analytical examples
In figure 9 is reported the TPD profile obtained on a commercial supported catalyst (5% Ru/Al2O3, Engelhard) saturated at 100 °C in a flow of pure hydrogen.
Figure 9. TPD profile of hydrogen adsorbed at 100 °C on 5% Ru on Al2O3 (TPDRO 1100).
TPD H2 Ru 5%/Al2O3 T sat = 100°C, Rate = 10°C/min, Carrier gas N2, Flow= 30cc/min
0,00E+00
5,00E+02
1,00E+03
1,50E+03
2,00E+03
2,50E+03
0 50 100 150 200 250 300
Temperature (°C)
Mic
rovo
lt

37
After saturation at 100 °C, the sample was cooled down to room temperature in flow of N2 to clean the reactor and the piping from the hydrogen in excess. Then a thermal ramp of 10 °C /min was started in flow of nitrogen. The two resulting peaks can be correlated to two different types of active sites. In figure 10 is reported the desorption profile of mordenite saturated with ammonia. The carrier gas in this case is helium at 30cc/min, with a temperature rate of 10 °C/min.
Figure 10. TPD profile of ammonia adsorbed on mordenite (TPDRO 1100). 7 – TEMPERATURE PROGRAMMED REDUCTION AND OXIDATION
The objectives of this technique are essentially the following: 1. To find the most efficient reduction conditions 3. To identify the supported precursor phases and their interactions with the support 4. To characterise complex systems, as bimetallic or doped catalyst, to determine the role of
the second component and to establish alloy formation or promotion effects There are several interesting studies about this technique: Robertson et Al. [17] first reported TPR profile of nickel and nickel-copper catalysts and since then many catalysts have been investigated. In the TPR technique an oxided catalyst precursor is submitted to a programmed temperature rise, while a reducing gas mixture is flowed over it (usually, hydrogen diluted in some inert gas as nitrogen or argon). In the TPO technique, the catalyst is in the reduced form and it is submitted to a programmed temperature increase, but in this case, an oxidising mixture of gas (oxygen in helium) is flowed over the sample. The reduction or oxidation rates are continuously measured by monitoring the change in composition of the reactive mixture of after the reactor. The decrease in H2 or O2 concentration in the effluent gas with respect to the initial percentage monitors the reaction progress. An interesting application of this technique is that the TPR/O analysis may be used to obtain evidence for the interaction between the atoms of two metallic components, in the case of bimetallic system or alloy as already cited. In general, TPR/TPO studies are carried out under low partial pressure of the reactive gas. In this way it is possible to observe the intermediate reactions, depending from
TPD NH3 MordeniteRate = 10°C/min, N2 Flow= 30cc/min
0,00E+00
5,00E+03
1,00E+04
1,50E+04
2,00E+04
2,50E+04
3,00E+04
3,50E+04
4,00E+04
0 100 200 300 400 500 600 700 800 900
Temperature (°C)
Mic
rovo
lt/g

38
analytical conditions as temperature rate, flow rate and concentration of reactive gas. The TPR/TPO methods are used for quantitative and quantitative analysis. In effect, the spectra produced are characteristic of a given solid. TPO is less commonly used then TPR, but the quantitative considerations for this type of analysis are more correct, in particular if the two analyses are performed in succession (hydrogen/oxygen titration). When used in combination, the two techniques can provide useful information in the study of the reactivity and redox behaviour of catalysts. 7.1 – Reduction and oxidation reactions
The reaction between a metal oxide MxOy and hydrogen, reducing the system to produce the pure metal M is represented by the equation: MxOy (solid) + H2 M(solid) + H2O In the thermodynamic point of view, the reduction of a solid oxide is feasible if the standard free energy change ∆G0 is negative. If ∆G0 is positive, the second term of the equation (28) must be sufficiently negative to make also negative ∆G: ∆G = ∆G° + RT log (PH2O / PH2) (28)
The reduction process is a bulk phenomenon and the degree of reduction (α as a function
of time or temperature and hydrogen pressure) is interpreted in terms of mechanism by which the reduction occurs. Two different models can interpret the reduction processes: the nucleation model and the contracting sphere model. In the first case, according to nucleation mechanism, the reduction begins after some time and at a given temperature bringing to the formation of a solid product nucleus. During the nucleation, oxygen ions are removed from the lattice with progressive formation of solid metal and hydrogen and oxygen molecules diffuse at the interface oxide/metal/atmosphere. If the nucleation process is very fast, the real formation of separated and independent nuclei cannot be distinguished and the second mechanism takes place (contracting sphere model). The result during the reduction process, in this case, is a total coverage of the solid oxide particle with a tin layer of metallic product as an eggshell. In effect, the distinction between the two models is not only theory, but it has a consequence in the rate of reduction that is very different. In figure 11 is reported a graphic comparison between the different dependence of the degree of the reduction from the time [18]. The A diagram is relative to metal oxide reduction by a nucleation mechanism, while the diagram B reports the case of contracting sphere model.
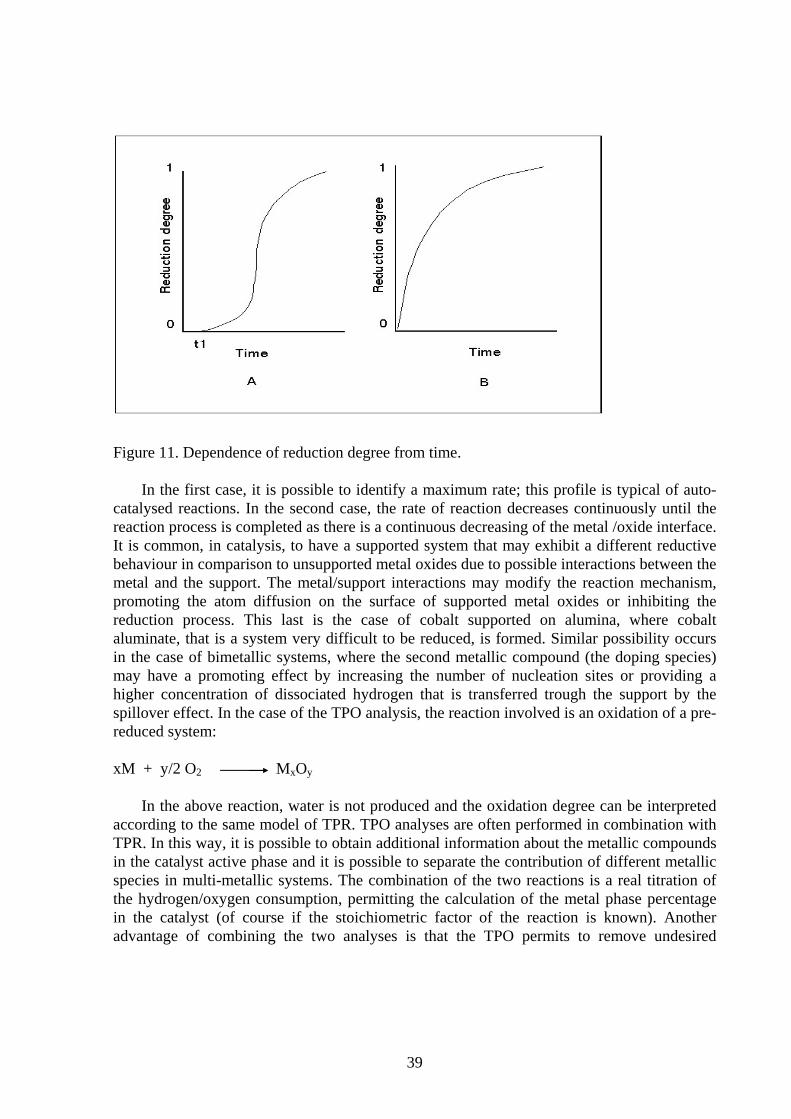
39
Figure 11. Dependence of reduction degree from time.
In the first case, it is possible to identify a maximum rate; this profile is typical of auto-catalysed reactions. In the second case, the rate of reaction decreases continuously until the reaction process is completed as there is a continuous decreasing of the metal /oxide interface. It is common, in catalysis, to have a supported system that may exhibit a different reductive behaviour in comparison to unsupported metal oxides due to possible interactions between the metal and the support. The metal/support interactions may modify the reaction mechanism, promoting the atom diffusion on the surface of supported metal oxides or inhibiting the reduction process. This last is the case of cobalt supported on alumina, where cobalt aluminate, that is a system very difficult to be reduced, is formed. Similar possibility occurs in the case of bimetallic systems, where the second metallic compound (the doping species) may have a promoting effect by increasing the number of nucleation sites or providing a higher concentration of dissociated hydrogen that is transferred trough the support by the spillover effect. In the case of the TPO analysis, the reaction involved is an oxidation of a pre-reduced system:
xM + y/2 O2 MxOy
In the above reaction, water is not produced and the oxidation degree can be interpreted
according to the same model of TPR. TPO analyses are often performed in combination with TPR. In this way, it is possible to obtain additional information about the metallic compounds in the catalyst active phase and it is possible to separate the contribution of different metallic species in multi-metallic systems. The combination of the two reactions is a real titration of the hydrogen/oxygen consumption, permitting the calculation of the metal phase percentage in the catalyst (of course if the stoichiometric factor of the reaction is known). Another advantage of combining the two analyses is that the TPO permits to remove undesired
40
contaminants then to concentrate the attention on the characterisation of the catalyst active phase.
7.2 – Experimental aspects
The experimental apparatus for TPR/TPO analyses is usually the same as the one used for TPD measurement (see 5.3.1). The fundamental difference is the type of carrier gas flowing trough the sample (see par. 6.2) and the pre-treatment procedure. Moreover, it is important to underline again that the TPR/TPO are analyses investigate the bulk system while TPD gives information about the surface behaviour of the catalyst. 7.2.1 – Sample preparation
The procedure to collect the TPR/TPO/TPD data is also comprehensive of the sample pre-treatment. Several types of procedure can be chosen in relation to the sample nature and type of information required. In fact, the diversification of the pre-treatment permits to obtain a wider range of parameters on a given catalyst. Generally, before starting a TPR analysis, the sample should be in its oxide form. The pre-treatment, in this case, consists in oxidising the catalyst in flow of pure oxygen or air, then flowing an inert gas to purge the product formed as water or carbon residues. Both pre-treatments must be effected at a given temperature to assure that the two processes are feasible. In case of TPO analysis, the sample must be preventively reduced to obtain the active metal in zero valence form. The standard pre-treatment is a reducing procedure effected at a given temperature (isothermal or increased by a constant rate). The pre-treatment procedure permits also to remove undesired compounds as residual solvent traces or products resulting from the precursor decomposition. Alternatively, it is possible to remove only the physisorbed water to obtain information on the efficiency of the activation procedure or on the poisoning phenomena of exhaust catalysts. The calcination operation is effected at high or medium temperature in flow of air to decompose the precursor compound. The precursor presence in fact can negatively influence the reducibility of the catalyst. In the case of cobalt supported on alumina, for example, if the calcination temperature necessary to decompose the precursor (generally cobalt nitrate) is too high cobalt aluminate is formed. The consequence is a decrease of the metal active surface. By changing the pre-treatment methods before the TPR or TPO analyses, it is possible to investigate other catalyst behaviours that are related to the temperature. For example, modifications of analytical profiles due to temperature variations in the pre-treatment permit to estimate effects as synterisation or other metal/support interactions. In the example of cobalt/alumina catalyst, this type of studies permitted to state the best pre-treatment procedure to avoid the formation of cobalt aluminate. The best reducibility of this supported metal is achieved by pre-treating the catalyst at temperatures below 375°C and by performing the calcination process in flow of pure hydrogen. 7.2.2 – Analytical method
During the TPR/TPO analyses, several products as water, CO or CO2 are formed. It is important to remove all undesired gas molecules that can interfere in the signal output. A correct pre-treatment and the use suitable traps to stop secondary products are therefore necessary. The choice of the analytical parameters, in particular temperature and flow rates, is fundamental to obtain significant reaction profiles. The problem related to the difficulty in comparing different analyses has received little attention in literature because the conditions

41
of sample preparation, pre-treatment and acquisition of experimental data are often omitted. Delanay G. [19], for example, reported the demonstration that the experimental conditions affect the temperature at which the reduction occurs. In any case, all the experimental parameters as hydrogen or oxygen concentration in the gas mixture, temperature increasing rate, total flow rate, sample weight and contact time can make influence on the analytical profiles. These parameters have effect also on the detector sensitivity (i.e. the flow rate). Monti et Al. [20] proposed a method to standardise the TPR/TPO data defining a number k, given by: k = S0 / (V* C0) (29)
where S0 is the hypothetical amount of initial reducible species in the sample expressed in µmol, V*C0 is the molar flow rate (µmol/s) of the reactive gas. This number should be in the range 55-150 s to have accurate and reliable results from the TPR/TPO analysis and above all to have comparable data. A typical example is the TPR analysis of cupric oxide: changing the temperature and the flow rates of the analysis, two reaction profiles will result: the resolution of the analysis is changed and it is possible or to distinguish the two phases of the reduction process identified by two peaks (CuII CuI Cu 0 ) or to obtain only one peak comprehensive of the total hydrogen consumption that is involved in the two processes. In the second case, the advantage is to calculate more easily the total quantity of reacted gas. In general, when in the sample there is only one component is useful to perform the analysis with a low temperature rate to observe the mechanism of the reaction process. In the case of multi-metallic catalyst higher temperature rate permits to separate the different contribution of the reactive components [21]. 7.3 – Quantitative calculation of reduced/oxided sites
When a reduction process is considered (similarly in the oxidation process), it is possible to express the rate of the reaction by the equation: r = -d [ MxOy ] / dt = -d [ H2] / dt = k [ MxOy]p [ H2 ]q (30) where k is a constant given by the Arrhenius equation k = A e-E/RT and dT = β dt, T is the temperature (K) and t is the time (min). As temperature is increased linearly, for both TPR and TPO, it is possible to correlate the concentration variation of the reactive gas by:
d [ H2] /dt = - β d [ H2] / dT (31)
The possibility to correlate the parameters determining the reaction process (H2
concentration, temperature rate and time) and the kinetic-thermodynamic parameters confirms that the TPR/TPO data are very useful characterisation techniques. Experimental TPR/TPO data offer important information about the change rate of some parameters in function of the temperature. The system can be described as a rector by correlating reduction/oxidation profiles to kinetic/thermodynamic parameters. The consumption rate of the reactive gas r, is correlated to the flow rate φ, to the reactor element dx and the fraction of conversion df by the following expression:

42
r = φ df/dx (32) 7.4 – Evaluation of average metal oxidation degree
Temperature programmed reaction permits to estimate exactly the amount of reactive gas consumed during the reaction. This quantity is correlated to the oxided form of the sample, but it is necessary to follow several conditions: 1. An opportune pre-treatment of the sample must be carefully chosen to avoid secondary
and undesired reactions. 2. The detection system must be correctly calibrated with standard samples or blank analysis
to estimate exactly the amount of gas involved in the reaction. 3. Analytical parameters used during the measurement must guarantee that the reaction is
thermodynamically feasible. If all the above conditions are respected, the average metal oxidation degree can be measured if the metal percentage and the reaction stoichiometry are known. The degree of sample oxidation is given by the ratio: α = nH / ( nm SF ) (33) where nH is the number of detected hydrogen atoms that are proportional to the peak area, Nm is the total number of metal atoms contained in the sample, Sf is the stoichiometric factor depending by the initial oxidation state and by the final product. 7.5 – Analytical examples
In figure 12 is reported the overlay of TPR analyses carried out on four catalysts containing the 5%(wt) of cobalt supported on alumina. They have been prepared by wetness impregnation ad then doped with different percentage of iridium [22]. The pre-treatment procedure is the same for all the samples: the catalysts, pre-calcinated in air at 350°C, have successively been cleaned in N2 flow at 150°C and finally cooled at room temperature. The TPR was carried out with a temperature rate of 10°C/min and a flow rate of 30 cc/min of a mixture of 5%H2/N2. There are two evidences in the TPR profiles: the H2consumption increases when the percentage of doping metal (Ir) is increased while and the maximum temperature, related to the maximum consumption of gas, decreases accordingly. This example is a clear demonstration that the TPR analysis offers information about the reducibility of metallic samples and that it is possible to estimate quantitatively the effect due to the presence of a second metallic species. Multi-metallic systems are known for the difficulty in their characterisation.

43
Figure 12. TPR profiles on 5% cobalt on alumina with different doping percentage of iridium. Gas used 5% hydrogen in nitrogen, flow 30 cc/min, rate 10 C/min (TPDRO 1100).
In figure 13 is reported a typical reduction profile of pure cupric oxide. Cupric oxide can be conveniently used to calibrate the detector signal. Sharp reduction peaks permits a better integration and a correct calculation of the reacted hydrogen. This result can be achieved by using a relatively high temperature rate (15 °C/min) and a small amount of sample (20-30 mg). Figure 13:. TPR profile on CUO using 5% hydrogen in nitrogen (TPDRO 1100).
TPR CuO 5% H2 in N2, Flow=30 cc/min, Rate=15°C/min.
0,00E+00
2,00E+06
4,00E+06
6,00E+06
8,00E+06
1,00E+07
1,20E+07
0 100 200 300 400 500 600 700 800 900
Temperature (°C)
Mic
rovo
lt/g
44
8 – CONCLUSIONS
The analytical methods described in detail in this paper can be considered as the basic texture methods for supported catalysts. The complete investigation on such complex structures and on the role of a given catalyst in an industrial process should take into consideration also tests on the reactivity.
The choice of the most suitable method should takes into consideration the main task of the method itself. Static volumetric chemisorption provides the most reliable data from the scientific point of view. In fact, this is the only technique assuring the correct equilibrium time between the gaseous and adsorbed phases, that is the basic hypothesis to apply most of the thermodynamic equations we described in this paper. On the contrary, the main disadvantage related to static chemisorption consists in the long analysis time that is required. Furthermore, the handling of a static apparatus requires a certain basic knowledge about vacuum systems and their use (long degassing times, risk of leaks, etc.).
Dynamic methods are very fast and relatively easy to handle, even by inexperienced users. The analytical results, especially for pulse chemisorption, can be compared to the static methods ones only taking into consideration the basic differences between the two systems. In fact, in pulse chemisorption, the weak chemisorbed species are removed as they forms and it is not possible to state that there is a real equilibrium between the probe gas phases (gaseous and bounded).
Temperature programmed methods provide very useful results on kinetic and thermodynamic aspects that are related to solid/gaseous interactions. In this case, the method of adsorption used to saturate the catalyst before the analysis (i.e. TPD) might have an influence on the results.
Anyway, an extremely important aspect, common to all the above techniques, is the sample preparation to the analysis. Very often, the pre-treatment procedures are not sufficiently described in scientific publications, making sometimes impossible to reproduce experimental data. It is also important to underline that the analytical reproducibility should be always verified. Analytical reproducibility is influenced not only by the experimental parameters but mainly by the pre-treatment procedures. For this reason, fully automatic equipment performing the catalyst preparation before the analysis is highly recommended, especially when these type of measurements are performed in industrial quality control laboratories.

45
REFERENCES 1. P. A. Sermon, G.C. Bond, Catalysis Rev. 8, 211 (1974) 2. E. Miyazaki, J.Catal. 65, 84 (1980) 3. D.P. Smith “Hydrogen in Metals” Un.of Chicago Press 4. British Standard, BS 4359: Part 4, (1995), p 13 5. Specialist Periodical Report Catalysis Vol.11 Royal Soc. Of Chemistry (1994) 6. J.M. Thomas, W.J. Thomas: “Principle and practice of heterogeneous catalysis”. Weinheim. New York (1997) 7. J.B. Benziger in”Metal-Surface Reaction Energetics” Cap.2, Ed. Evgeny Shustorovich 8. C.H. Bartholomew in “Catalysis”, Vol 11, (1994) Cap.3, Royal Soc. of Chemistry 9. J.M. Zowtiak, C.H. Bartolomew, J.Catal. 83, 107-120 (1983) 10. G.A. Olah, J.K.S. Praksh, J. Sommer, “SUPERACIDS”, J. Wiley, New York (1985) 11. D.O. Hayward, B.M.W. Trapnell in “Chemisorption”, Butterworths, London, (1964) 12. I. Langmuir, J.Chem. Soc., 40, 1361 (1918) 13. J.R. Anderson “Structure of Metallic Catalysts, Academic Press (1975) 14. J.L. Lemaitre, P.G. Menon, F. Delannay in "The measuremente of catalyst Dispersion" Characterisation of Heterogeneous Catakysts, F. Delannai, M.Dekker Inc., New York, Cap. 7, 299-266 (1984) 15. J.R. Anderson, K.C. Pratt “Introduction to characterisation and testing of catalysts” Academic Press, Australia, (1985), Harcourt Brace Jovanovich, Publishers 16. L. Forni, F.P. Vatti, E. Ortoleva Micro.Mat. 3 (1995) 367-375 17. S.D Robertson, B.D. McNicol, J.H. De Baas, S.C. Kloet, J.W. Jenkins, J. Catal. 37 (1975), 424-431 18. N.W. Hurts, S.J. Gentry, A. Jones, B.D. McNicol: Catal. Rev-Sci. Eng. 24, 233 (1982) 19. G. Delahay, Ph.D. Thesis, Université de Toulouse, France 1991 20. D.A.M. Monti, A. Baiker, J. Catal. 83 (1983) 323-335 21. B. Jouguet, A. Gervasini, A. Auroux Chem. Eng. Technol. 18 (1995) 243-247 22. C.L. Bianchi, L.Aina, M.Fadoni, V. Ragaini: J.Catal. subbmitted for publication