temperature-sensitive mechanical properties of gfrp
TRANSCRIPT

Temperature-sensitive mechanical properties of GFRP composites in longitudinal and
transverse directions: A comparative study
Allan Manalo1, Ginghis Maranan1, Sukrant Sharma1, Warna Karunasena1, and Yu Bai2
1Centre for Future Materials (CFM), School of Civil Engineering and Surveying, Faculty of Health, Engineering
and Sciences, University of Southern Queensland, Toowoomba, QLD 4350, Australia
Email: [email protected]; [email protected]; [email protected];
2Department of Civil Engineering, Monash University, Clayton, Victoria, Australia
Email: [email protected]
Abstract
A comparative study was conducted to evaluate the temperature-sensitive mechanical
properties of glass fibre reinforced polymer (GFRP) composites in the longitudinal and
transverse directions. GFRP coupons with different shear span-to-depth ratios were tested
under three-point static bending test at temperatures ranging from room temperature up to
200oC. Timoshenko Beam Theory-based procedure was then adopted to calculate the flexural
and shear moduli of the GFRP laminates under moderate and elevated in-service temperatures.
The results showed that the mechanical properties of the transversely cut specimens is affected
more by the increase in temperature than the longitudinally cut specimens. Similarly, the
interlaminar shear and flexural strengths of GFRP composites were found influenced more by
elevated temperature compared to the stiffness properties. Moreover, the shear modulus
undergone more severe degradation compared to the flexural modulus. Simplified empirical
models were proposed to estimate the mechanical properties of the GFRP pultruded laminates
in both the longitudinal and transverse directions at varying temperatures.
Keywords
Interlaminar shear; flexure; elevated temperature; longitudinal direction; transverse direction;
comparative study.
*Corresponding author, tel. +61 7 4631 2547; fax. +61 7 4631 2110; E-mail addresses: [email protected] (Allan
Manalo)
1. Introduction
Glass fibre reinforced polymer (GFRP) composites have gained wider acceptance as structural
materials for civil infrastructure [1, 2] and building construction [3]. This can be attributed to
the several advantages of these advanced materials such as lightweight, high strength-to-weight
and stiffness-to-weight ratios, corrosion resistance, electromagnetic transparency, ease of
handling, and high durability even in harsh environments [4]. Among the GFRPs, the pultruded
profiles are the most commonly used because they can be produced in a large volume at low
operating costs, high production rate, high fibre content, product reproducibility and
dimensional tolerances [2, 5]. However, the sensitivity of the physical and mechanical
properties of pultruded GFRP structural profiles to elevated temperatures, due to the glass
transition and decomposition processes of the polymer resin, has been one of the major
concerns in civil engineering and construction applications. Hence, a better understanding of
the resistance behaviours of pultruded GFRP composites under moderate and elevated in-
service temperatures must be gained to further advance the adoption and safe use of this
material in the mainstream construction applications.
A number of experimental and modelling works have been conducted to characterise
the mechanical properties of GFRP composites when exposed to elevated temperatures. Based
on these studies, the strength, stiffness and interfacial bonding between the fibres and resin of
a pultruded GFRP section decrease as the temperature increases [6-8]. In particular, the
aforementioned mechanical properties drop rapidly when the temperature approaches and/or
exceeds the glass transition temperature (Tg) of the polymer matrix, typically ranging from 60
oC to 140 oC [9]. The elastic modulus of pultruded GFRP composites cut longitudinally (along
the direction of pultrusion) is different from those cut transversely; however, dynamic
mechanic analysis (DMA) indicated thermal degradation in both directions during the glass
transition stage [8]. The degradation of the tensile strength of pultruded GFRP composites at

elevated temperatures is much lower than that of the shear and compressive strengths because
the former property is mainly governed by the fibres while the latter properties is dominated
by the resin [5]. As a result, various empirical and mechanisms-based models that predict the
temperature-dependent properties of composites have been developed, which are generally
functions of either mass (or density) and/or temperature [7, 10-14]. Nevertheless, Correia et al.
[5] stated that additional experimental data are needed to validate previous results and that
further research works are needed regarding the other important properties of pultruded
composites profiles, particularly the shear modulus, the elastic modulus in the transverse
direction and the interlaminar shear strength (ILSS), which is the limiting design characteristic
for pultruded FRP [15]. In addition to these properties, the flexural/bending behaviour at
elevated temperatures is also of equal importance as input for modelling and design purposes.
These aspects are the key motivation of this undertaking.
In this study, the flexural and interlaminar shear behaviour in both the longitudinal and
transverse directions of GFRP laminates cut from pultruded sections were comparatively
evaluated by subjecting them to temperatures ranging from room temperature (23 °C) to 200
°C. The failure modes, load-deflection curves, load-carrying capacities, and stiffness (linear
elastic portion of the load-deflection curves) of these composites were then evaluated. In
addition, effects of shear span-to-depth ratio on the longitudinal and transverse properties of
the composite laminates were analysed. Thereafter, Timoshenko Beam Theory (TBT)-based
procedure [16] was adopted to determine the flexure and shear moduli of the GFRP laminates
based on all the experimental results. A simplified empirical models were proposed, calibrated
with the test data, to estimate the flexural and shear moduli and strengths of the GFRP pultruded
laminates in both the longitudinal and transverse directions at varying temperatures.
2. Experimental Program
2.1 Material
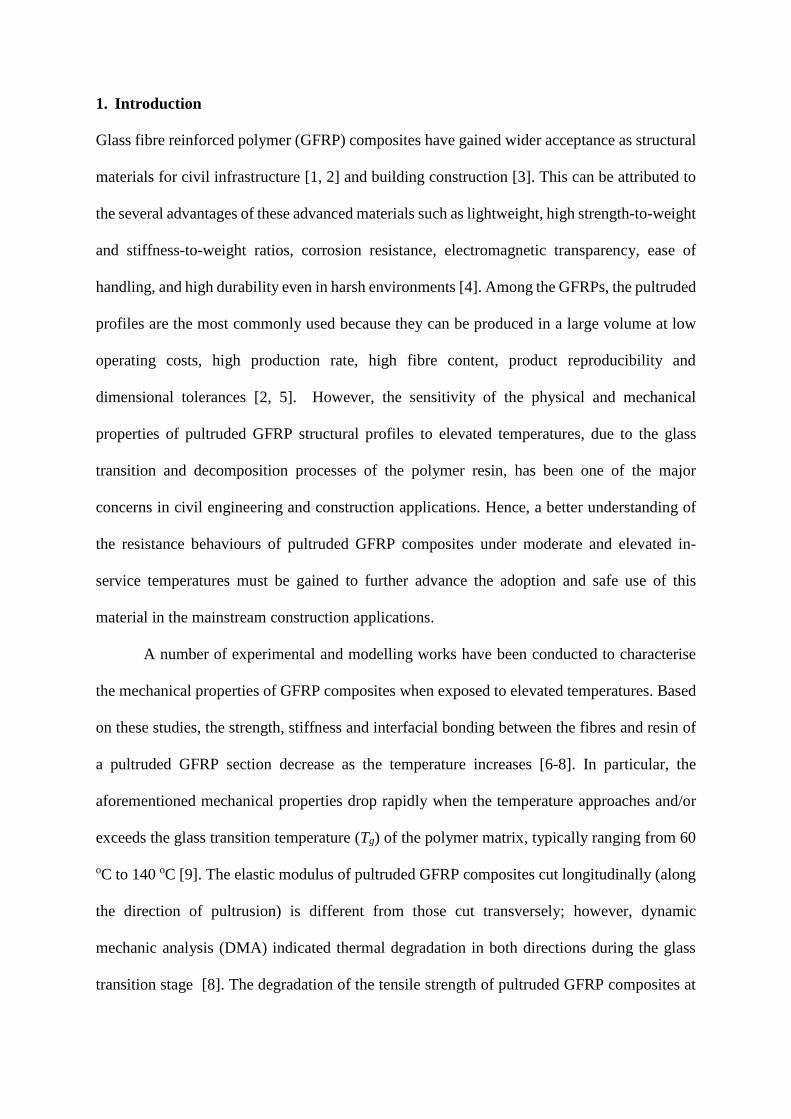
The coupon specimens (Figure 1) considered in this study were prepared from the
commercially available GFRP tubular profiles manufactured by Wagner’s Composite Fibre
Technologies (WCFT) in Toowoomba, Australia. These profiles were made through the
pultrusion process, wherein the E-type glass fibre reinforcement are saturated with the
catalysed vinyl ester resin and are pulled through the heated curing die to harden and then
subsequently cooled. The composite laminates have a stacking sequence in the form
[0°/+45°/0°/-45°/0°/-45°/0°/+45°/0°] with a glass fibre content by weight of around 80 %
determined in accordance with the ISO 1172:1996 [17] standard. Following the ASTM D792-
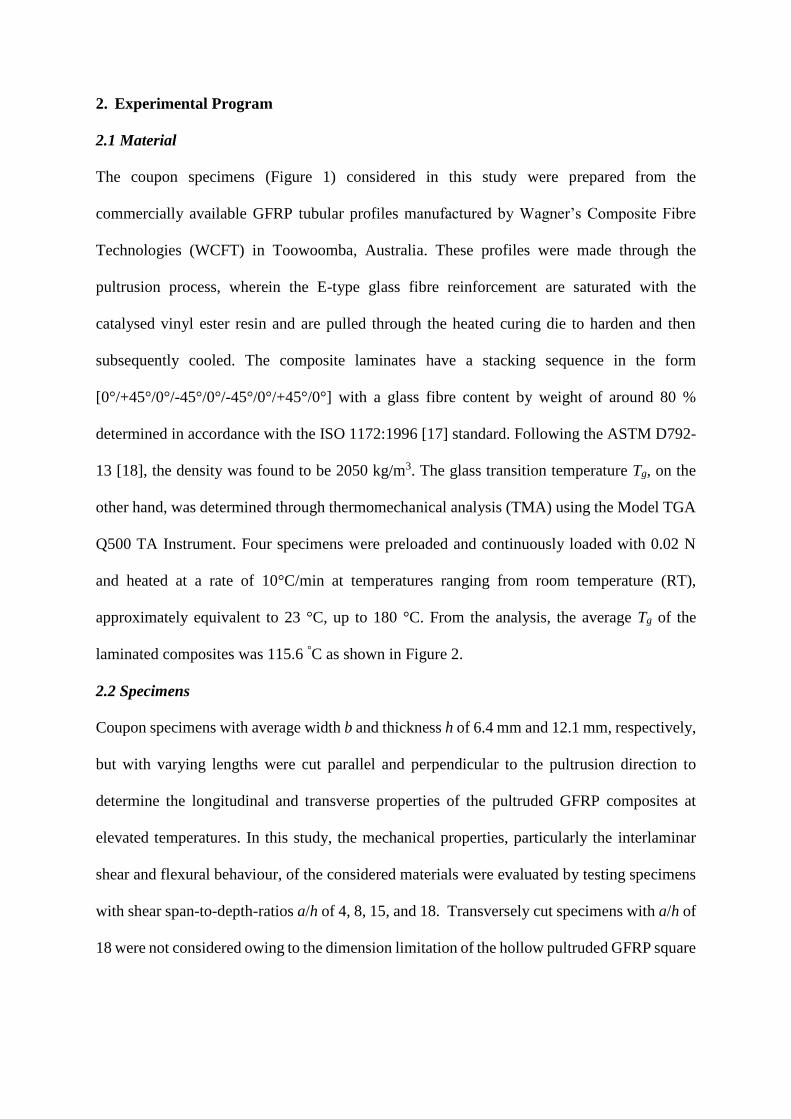
13 [18], the density was found to be 2050 kg/m3. The glass transition temperature Tg, on the
other hand, was determined through thermomechanical analysis (TMA) using the Model TGA
Q500 TA Instrument. Four specimens were preloaded and continuously loaded with 0.02 N
and heated at a rate of 10°C/min at temperatures ranging from room temperature (RT),
approximately equivalent to 23 °C, up to 180 °C. From the analysis, the average Tg of the
laminated composites was 115.6 °C as shown in Figure 2.
2.2 Specimens
Coupon specimens with average width b and thickness h of 6.4 mm and 12.1 mm, respectively,
but with varying lengths were cut parallel and perpendicular to the pultrusion direction to
determine the longitudinal and transverse properties of the pultruded GFRP composites at
elevated temperatures. In this study, the mechanical properties, particularly the interlaminar
shear and flexural behaviour, of the considered materials were evaluated by testing specimens
with shear span-to-depth-ratios a/h of 4, 8, 15, and 18. Transversely cut specimens with a/h of
18 were not considered owing to the dimension limitation of the hollow pultruded GFRP square
sections (125 mm by 125 mm by 6.4 mm thickness) to which the coupon specimens were cut
from.
The specimens were labelled as Lo-a/h-T and Tr-a/h-T where “Lo” and “Tr” stand for
longitudinally and transversely cut specimens, respectively, while a/h and T represent the shear
span-to-depth-ratio of the specimen and the temperature in which the specimen was subjected
to, respectively. For example, the specimen identified as Lo-4-RT means that it is a specimen
cut along the pultrusion direction with an a/h of 4 and was tested at room temperature,
approximately equivalent to 23°C, while Tr-15-100 means that it is a specimen cut
perpendicular to the direction of pultrusion with a a/h of 15 and was tested at temperature of
100 °C. Table 1 summarises all the test specimens considered in this study. Five replicates were
tested for each test condition for laminates with a/h of 4 and 15 while three replicates were
tested for other specimen types resulting in a total of 181 test specimens.
Figure 1. Longitudinally and transversely cut
pultruded GFRP coupons
Figure 2. Typical TMA curve of the tested
pultruded GFRP laminates composites
Table 1. Summary of the number of test specimens
Orientation a/h Number of Specimens
RT 40 °C 70 °C 100 °C 120 °C 150 °C 200 °C
Longitudinal 4 5 5 5 5 -- -- --
8 3 3 3 3 3 3 --
15 5 5 5 5 5 5 5
18 3 3 3 3 3 3 --
Transverse 4 5 5 5 -- -- -- --
8 5 5 5 5 5 5 5
15 5 5 5 5 5 5 5
2.3 Test set-up and instrumentation
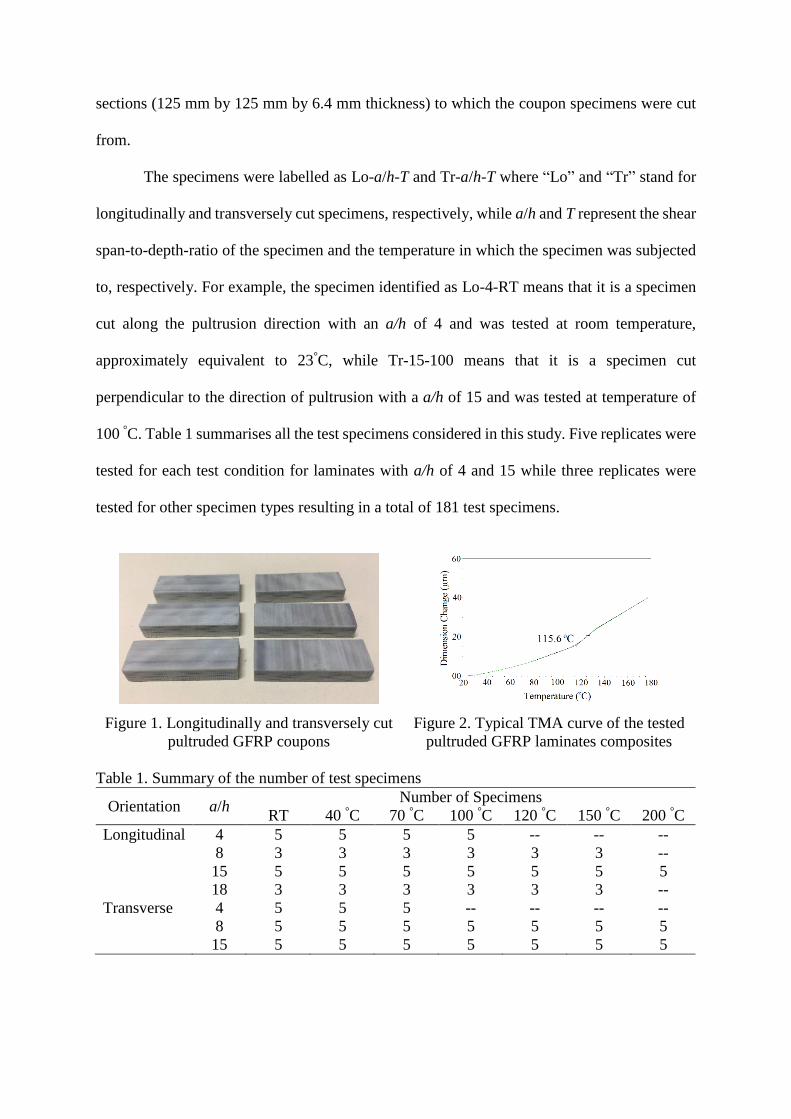
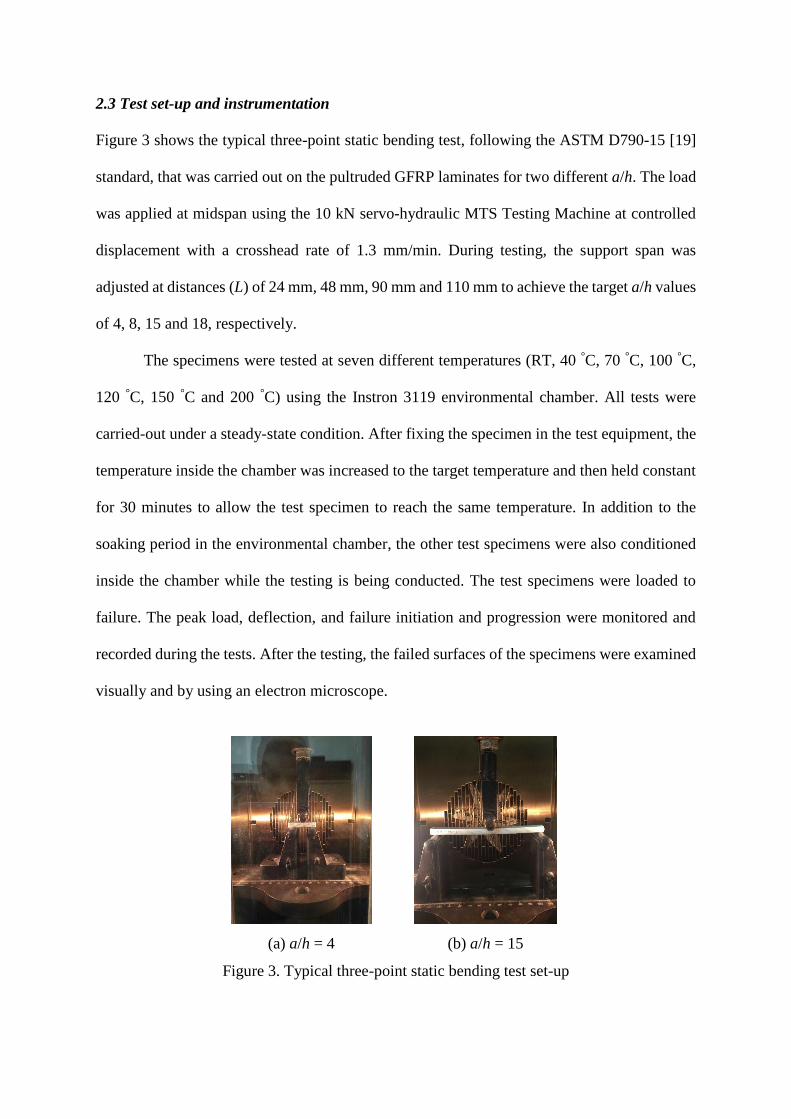
Figure 3 shows the typical three-point static bending test, following the ASTM D790-15 [19]
standard, that was carried out on the pultruded GFRP laminates for two different a/h. The load
was applied at midspan using the 10 kN servo-hydraulic MTS Testing Machine at controlled
displacement with a crosshead rate of 1.3 mm/min. During testing, the support span was
adjusted at distances (L) of 24 mm, 48 mm, 90 mm and 110 mm to achieve the target a/h values
of 4, 8, 15 and 18, respectively.
The specimens were tested at seven different temperatures (RT, 40 °C, 70 °C, 100 °C,
120 °C, 150 °C and 200 °C) using the Instron 3119 environmental chamber. All tests were
carried-out under a steady-state condition. After fixing the specimen in the test equipment, the
temperature inside the chamber was increased to the target temperature and then held constant
for 30 minutes to allow the test specimen to reach the same temperature. In addition to the
soaking period in the environmental chamber, the other test specimens were also conditioned
inside the chamber while the testing is being conducted. The test specimens were loaded to
failure. The peak load, deflection, and failure initiation and progression were monitored and
recorded during the tests. After the testing, the failed surfaces of the specimens were examined
visually and by using an electron microscope.
(a) a/h = 4
(b) a/h = 15
Figure 3. Typical three-point static bending test set-up
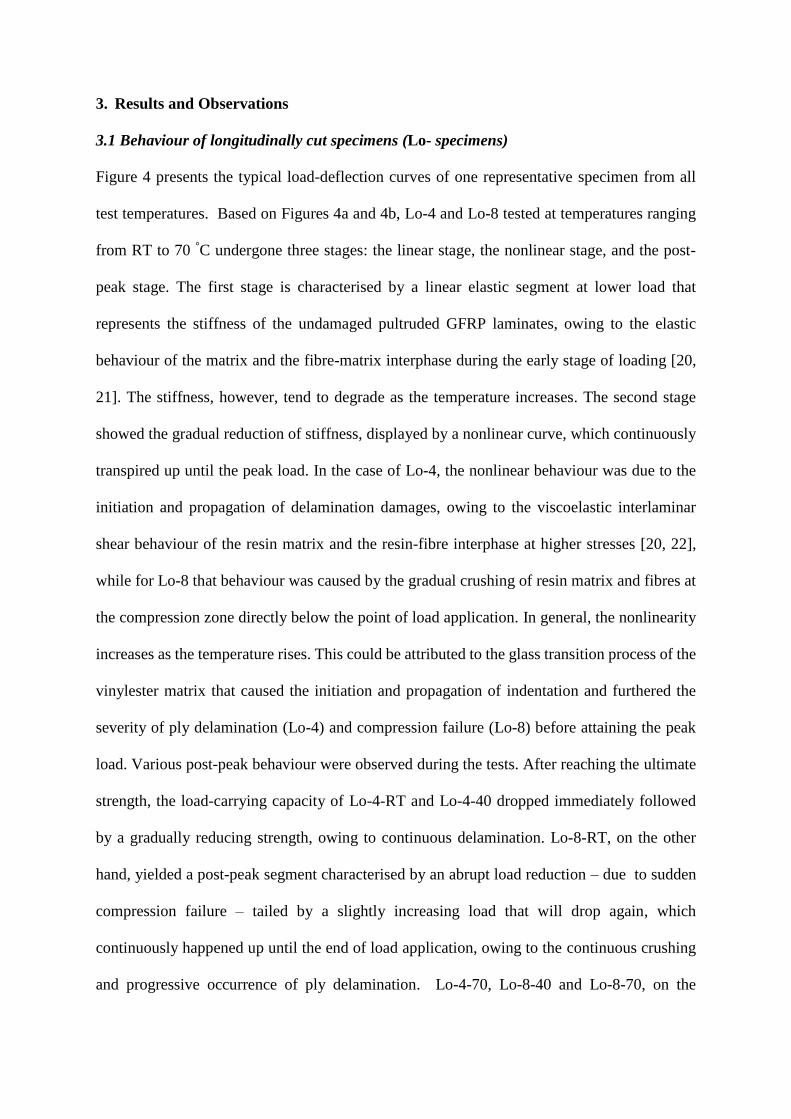
3. Results and Observations
3.1 Behaviour of longitudinally cut specimens (Lo- specimens)
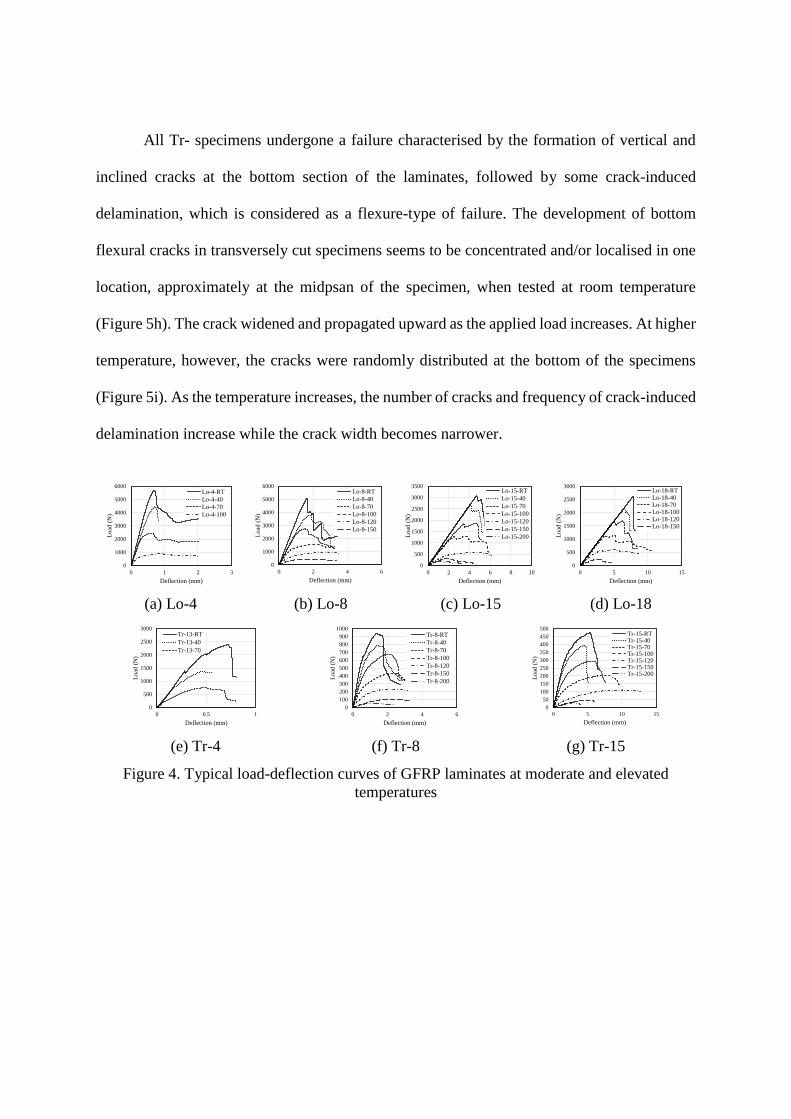
Figure 4 presents the typical load-deflection curves of one representative specimen from all
test temperatures. Based on Figures 4a and 4b, Lo-4 and Lo-8 tested at temperatures ranging
from RT to 70 °C undergone three stages: the linear stage, the nonlinear stage, and the post-
peak stage. The first stage is characterised by a linear elastic segment at lower load that
represents the stiffness of the undamaged pultruded GFRP laminates, owing to the elastic
behaviour of the matrix and the fibre-matrix interphase during the early stage of loading [20,
21]. The stiffness, however, tend to degrade as the temperature increases. The second stage
showed the gradual reduction of stiffness, displayed by a nonlinear curve, which continuously
transpired up until the peak load. In the case of Lo-4, the nonlinear behaviour was due to the
initiation and propagation of delamination damages, owing to the viscoelastic interlaminar
shear behaviour of the resin matrix and the resin-fibre interphase at higher stresses [20, 22],
while for Lo-8 that behaviour was caused by the gradual crushing of resin matrix and fibres at
the compression zone directly below the point of load application. In general, the nonlinearity
increases as the temperature rises. This could be attributed to the glass transition process of the
vinylester matrix that caused the initiation and propagation of indentation and furthered the
severity of ply delamination (Lo-4) and compression failure (Lo-8) before attaining the peak
load. Various post-peak behaviour were observed during the tests. After reaching the ultimate
strength, the load-carrying capacity of Lo-4-RT and Lo-4-40 dropped immediately followed
by a gradually reducing strength, owing to continuous delamination. Lo-8-RT, on the other
hand, yielded a post-peak segment characterised by an abrupt load reduction – due to sudden
compression failure – tailed by a slightly increasing load that will drop again, which
continuously happened up until the end of load application, owing to the continuous crushing
and progressive occurrence of ply delamination. Lo-4-70, Lo-8-40 and Lo-8-70, on the

contrary, exhibited a gradually decreasing capacity due to the combination of indentation,
owing to the matrix softening, and progressive crushing and delamination. The remaining Lo-
4 and Lo-8 tested at higher temperatures (Lo-4-100, Lo-8-100, Lo-8-120 and Lo-8-150), on the
other hand, exhibited a short linear behaviour followed by a more apparent nonlinear behaviour
and then tailed by a plastic response due to the transitioning of the resin from a glassy state to
a leathery state.
The load-deflection curves of Lo-15 and Lo-18 (Figures 5c and 5d, respectively) tested
at temperatures ranging from RT to 70 °C were represented by a two-segment load-deflection
curve. The first segment is essentially linear elastic up to the peak load. The second segment
or the softening segment, on the other hand, starts with a sharp drop in the load-carrying
capacity, due to sudden crushing failure of the fibres and resin matrix. The next segment was
due to further compression crushing coupled with the initiation and proliferation of fibre
rupture, with some delamination, at the bottom. At 100 °C, the curves of Lo-15 and Lo-18
revealed three different phases (linear, nonlinear, and descending phase) that was similar to
that of Lo-4-70 or Lo-8-70. However, the nonlinear and descending phases were governed by
fibre and matrix crushing coupled with minor delamination and more apparent indentation due
to matrix softening. The rest of Lo-15 and Lo-18 tested at higher temperatures exhibited similar
behaviour as Lo-4 and Lo-8 tested from 100 °C to 150 °C.
Figure 5 shows the typical mode of failure of the pultruded GFRP laminates subjected
to elevated temperature. As can be expected, all the tested Lo-4 specimens exhibited
interlaminar shear failure or ply delamination. Compression crushing directly below the
loading point nor fibre rupture at the bottom were neither observed in the tested specimens at
room temperature. These observations tends to show the suitability of the employed SBS test
in determining the interlaminar shear strength of the pultruded GFRP laminates. At RT and 40
°C, the specimens exhibited a pure ILS failure (Figure 5a) that initiated from several locations
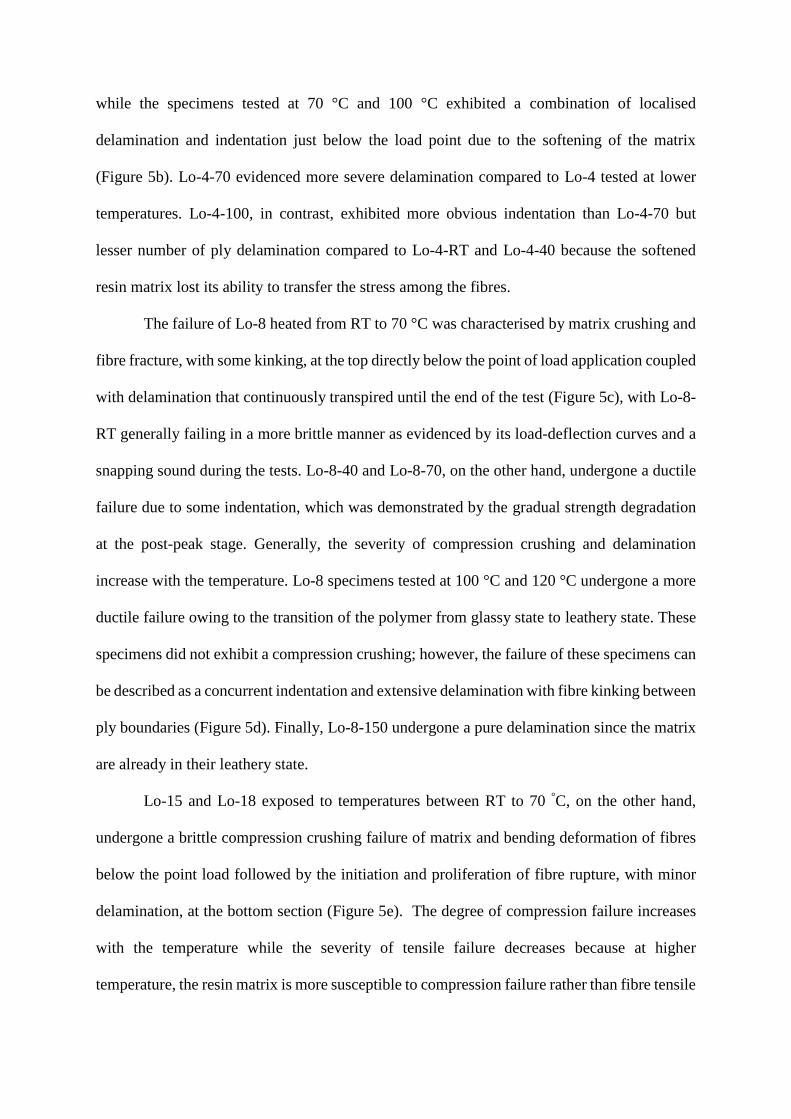
while the specimens tested at 70 °C and 100 °C exhibited a combination of localised
delamination and indentation just below the load point due to the softening of the matrix
(Figure 5b). Lo-4-70 evidenced more severe delamination compared to Lo-4 tested at lower
temperatures. Lo-4-100, in contrast, exhibited more obvious indentation than Lo-4-70 but
lesser number of ply delamination compared to Lo-4-RT and Lo-4-40 because the softened
resin matrix lost its ability to transfer the stress among the fibres.
The failure of Lo-8 heated from RT to 70 °C was characterised by matrix crushing and
fibre fracture, with some kinking, at the top directly below the point of load application coupled
with delamination that continuously transpired until the end of the test (Figure 5c), with Lo-8-
RT generally failing in a more brittle manner as evidenced by its load-deflection curves and a
snapping sound during the tests. Lo-8-40 and Lo-8-70, on the other hand, undergone a ductile
failure due to some indentation, which was demonstrated by the gradual strength degradation
at the post-peak stage. Generally, the severity of compression crushing and delamination
increase with the temperature. Lo-8 specimens tested at 100 °C and 120 °C undergone a more
ductile failure owing to the transition of the polymer from glassy state to leathery state. These
specimens did not exhibit a compression crushing; however, the failure of these specimens can
be described as a concurrent indentation and extensive delamination with fibre kinking between
ply boundaries (Figure 5d). Finally, Lo-8-150 undergone a pure delamination since the matrix
are already in their leathery state.
Lo-15 and Lo-18 exposed to temperatures between RT to 70 °C, on the other hand,
undergone a brittle compression crushing failure of matrix and bending deformation of fibres
below the point load followed by the initiation and proliferation of fibre rupture, with minor
delamination, at the bottom section (Figure 5e). The degree of compression failure increases
with the temperature while the severity of tensile failure decreases because at higher
temperature, the resin matrix is more susceptible to compression failure rather than fibre tensile
rupture. At 100 °C and 120 °C, Lo-15 and Lo-18 failed in a ductile manner, which can be
described as fibre kinking and buckling, because the softened resin can no longer confine the
glass fibres, coupled with resin crushing at the top directly below the point load but without
any fibre rupture (Figure 5f). These observations can be expected since the softened resin
matrix at the compression zone have a lower capability to prevent damages compared to the
temperature-resistant E-glass fibres and flexible matrix at the tensile zone. With further
loading, the damages accumulate gradually in the specimens tested at higher temperatures, as
reflected in their load-deflection curves. The remaining specimens subjected to temperature
150 °C and 200 °C undergone delamination that originated at the free end and then propagated
towards the midspan of the specimens (Figure 5g).
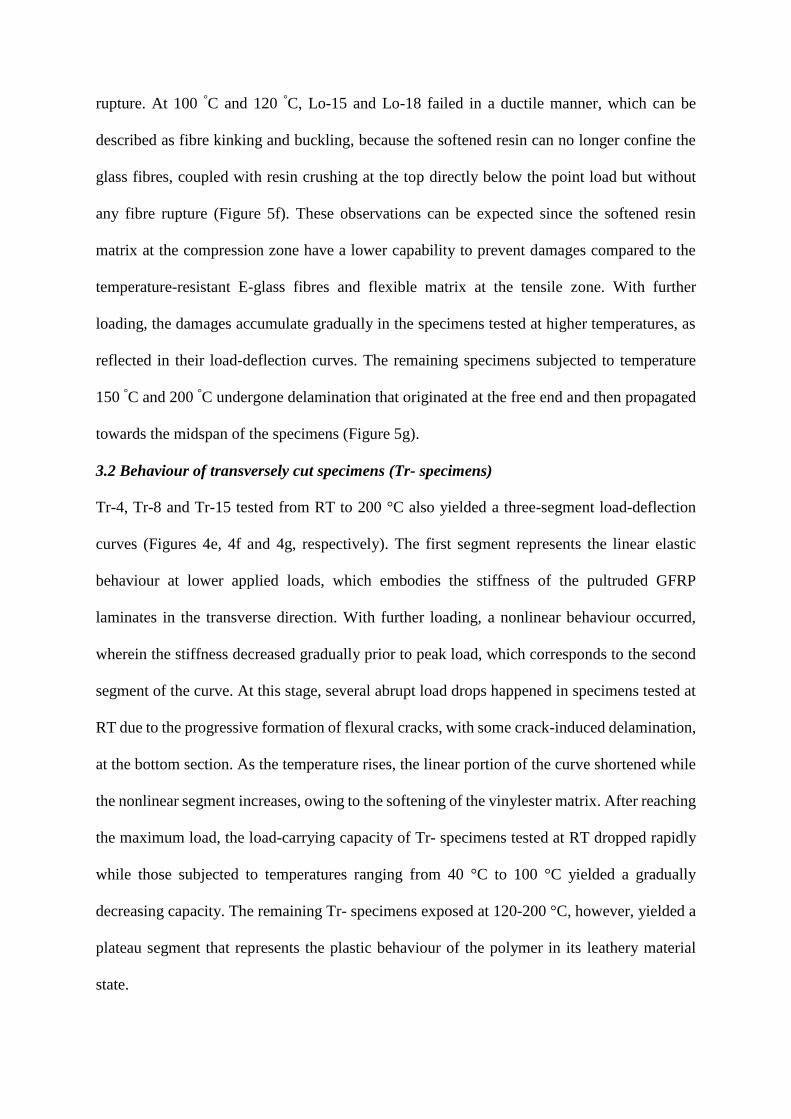
3.2 Behaviour of transversely cut specimens (Tr- specimens)
Tr-4, Tr-8 and Tr-15 tested from RT to 200 °C also yielded a three-segment load-deflection
curves (Figures 4e, 4f and 4g, respectively). The first segment represents the linear elastic
behaviour at lower applied loads, which embodies the stiffness of the pultruded GFRP
laminates in the transverse direction. With further loading, a nonlinear behaviour occurred,
wherein the stiffness decreased gradually prior to peak load, which corresponds to the second
segment of the curve. At this stage, several abrupt load drops happened in specimens tested at
RT due to the progressive formation of flexural cracks, with some crack-induced delamination,
at the bottom section. As the temperature rises, the linear portion of the curve shortened while
the nonlinear segment increases, owing to the softening of the vinylester matrix. After reaching
the maximum load, the load-carrying capacity of Tr- specimens tested at RT dropped rapidly
while those subjected to temperatures ranging from 40 °C to 100 °C yielded a gradually
decreasing capacity. The remaining Tr- specimens exposed at 120-200 °C, however, yielded a
plateau segment that represents the plastic behaviour of the polymer in its leathery material
state.
All Tr- specimens undergone a failure characterised by the formation of vertical and
inclined cracks at the bottom section of the laminates, followed by some crack-induced
delamination, which is considered as a flexure-type of failure. The development of bottom
flexural cracks in transversely cut specimens seems to be concentrated and/or localised in one
location, approximately at the midpsan of the specimen, when tested at room temperature
(Figure 5h). The crack widened and propagated upward as the applied load increases. At higher
temperature, however, the cracks were randomly distributed at the bottom of the specimens
(Figure 5i). As the temperature increases, the number of cracks and frequency of crack-induced
delamination increase while the crack width becomes narrower.
(a) Lo-4
(b) Lo-8
(c) Lo-15
(d) Lo-18
(e) Tr-4
(f) Tr-8
(g) Tr-15
Figure 4. Typical load-deflection curves of GFRP laminates at moderate and elevated
temperatures
0
1000
2000
3000
4000
5000
6000
0 1 2 3
Lo
ad (
N)
Deflection (mm)
Lo-4-RT
Lo-4-40
Lo-4-70
Lo-4-100
0
1000
2000
3000
4000
5000
6000
0 2 4 6
Load
(N
)
Deflection (mm)
Lo-8-RT
Lo-8-40
Lo-8-70
Lo-8-100
Lo-8-120
Lo-8-150
0
500
1000
1500
2000
2500
3000
3500
0 2 4 6 8 10
Lo
ad (
N)
Deflection (mm)
Lo-15-RT
Lo-15-40
Lo-15-70
Lo-15-100
Lo-15-120
Lo-15-150
Lo-15-200
0
500
1000
1500
2000
2500
3000
0 5 10 15
Load
(N
)
Deflection (mm)
Lo-18-RTLo-18-40Lo-18-70Lo-18-100Lo-18-120Lo-18-150
0
500
1000
1500
2000
2500
3000
0 0.5 1
Load
(N
)
Deflection (mm)
Tr-13-RT
Tr-13-40
Tr-13-70
0
100
200
300
400
500
600
700
800
900
1000
0 2 4 6
Load
(N
)
Deflection (mm)
Tr-8-RT
Tr-8-40
Tr-8-70
Tr-8-100
Tr-8-120
Tr-8-150
Tr-8-200
0
50
100
150
200
250
300
350
400
450
500
0 5 10 15
Load
(N
)
Deflection (mm)
Tr-15-RTTr-15-40Tr-15-70Tr-15-100Tr-15-120Tr-15-150Tr-15-200

(a) delamination (Lo-4-23
and Lo-4-40)
(b) delamination with
indentation
(Lo-4-70 and Lo-4-100)
(c) matrix crushing and fibre
fracture followed by some
delamination (Lo-8-RT to
Lo-8-70)
(d) indentation and
delamination with fibre
kinking (Lo-8-100 to Lo-8-
150)
(e) fibre and resin crushing
at the top followed by
delamination and fibre
rupture at the bottom (Lo-15
and Lo-18 tested between
RT and 70 °C)
(f) matrix crushing and fibre
kinking (Lo-15 and Lo-18
tested between 100 °C and
120 °C)
(g) delamination at the free
end of the specimens (Lo-15
and Lo-18 tested between
150 °C and 200 °C)
(h) localised flexural cracks
with crack-induced
delamination
(all Tr- specimens tested at
RT)
(i) distributed flexural
cracks with crack-induced
delamination
(all Tr- specimens tested at
40-200 °C)
Figure 5. Typical failure modes of pultruded GFRP laminates at elevated temperatures
ply
delamination
indentation
delamination with
fibre kinking
fibre & resin
crushing delamination
fibre
rupture
end
delamination
matrix crushing
and fibre kinking
crack-induced
delamination
flexural
cracks
ply
delamination
indentation matrix crushing
and fibre fracture
delamination
flexural
cracks
crack-induced
delamination
4. Discussion
4.1 Interlaminar shear strength
Table 2 summarises the average peak load capacity P and the corresponding average
interlaminar shear strength ILSS of specimens with a/h of 4. Figure 6a, on the other hand,
illustrates the normalised ILSS of the specimens, with respect to their values at room
temperature, as a function of temperature. The ILSS is calculated using the equation below.
3
4
PILSS
w h
Equation 1
Based on the table and figure, the ILSS of longitudinally cut GFRP laminates at room
temperature is around 54.7 MPa. This value was comparable to that reported by Muttashar et
al. [23], equivalent to 51 MPa, for the same pultruded GFRP section. In general, the strength
of Lo-4 tend to decline steadily, at a constant gradient, as the temperature rises. Interestingly,
this linear trend was also observed by Liu et al. [20] for carbon fibre-reinforced epoxy resin
composites tested from ambient temperature to 130 °C. It can be inferred that this strength
degradation at higher temperatures was due to the softening of the resin matrix that resulted in
the reduction of the shear stress resistance and the occurrence of indentation failure. In fact, at
100°C, the load-carrying capacity retention of Lo-4 was just 14%. At this temperature
exposure, the resin drastically losses its ability to hold the fibres together, including the ability
to transfer interfacial shear stress from one portion to another, as evidenced by the localised
ply delamination (in the vicinity of point load application) in these specimens. Beyond 100°C,
the specimens did not sustain further loads, suggesting that the tested vinylester-based GFRP
laminates have negligible ILSS when exposed to temperature just below the Tg of the resin
matrix.
The strength of Tr-4 was also negatively affected by the elevated temperature exposure
as can be noted from Table 2 and Figure 6a. These specimens yielded a negligible strength at
70°C. At higher temperature, several flexural cracks were formed at different locations, instead

of one single major cracks, that lowered the strength capacity of the specimens. The maximum
capacity attained by Tr-4 specimens at room temperature was only approximately 40% of Lo-
4’s ultimate strength. This can be expected since the strength of Lo- specimens was enhanced
by the longitudinally oriented (0°) fibres. Furthermore, the strength degradation of Tr-
specimens was more severe compared to Lo- specimens as the temperature increases. Again,
this is because Tr- specimens have no 0° fibres that can support the softened matrix in resisting
applied loads that resulted in a relatively more strength loss.
4.2 Flexural strength
Table 3 shows the mean peak strength P and the corresponding average maximum bending
strength σ of the flexural specimens with a/h of 8, 15 and 18, tested at varying temperatures
while Figure 6b, 6c and 6d plot the flexural strength of the pultruded GFRP laminates as a
function of temperature normalised to that measured at room temperature. The flexural strength
was calculated from Equation 2.
2
3
2
P L
w h
Equation 2
As shown in Table 3, Lo-15 and Lo-18 yielded load-carrying capacities of 3014 N and 2405
N, respectively, at room temperature. These loads were equivalent to σ of 821 MPa and 801
MPa, respectively, which were almost the same with the results obtained by Guades et al. [24]
for the same materials. Interestingly, the measured strength was more than twice the strength
(325 MPa) reported by Liao et al. [25] for glass fibre-vinyl ester composite. This could be
attributed to the type and configuration of the fibres they adopted in their study, consisting of
alternating layers of unidirectional fibre roving and chopped fibre strand mat, including the
fibre-matrix interphase properties.
The load-carrying capacities of Lo-8, Lo-15 and Lo-18 tested at temperatures 23-100°C
tend to decrease linearly but with different level of strength degradation, with Lo-8 exhibiting
more steep strength decay compared to the other specimens. As the temperature increases,
softening and cracking in the compression zone progressively transpired that reduced the
mechanical properties of the resin, including the resin-fibre bond, making the composite to
progressively act like a bundle of loose fibres instead of a solid composite. The decrease of
bond efficiency impairs the stress transfer within the composites, thereby lowering the overall
load resistance of the material. Substantial strength reduction occurred when the specimens
were tested at temperature 120 °C. This can be expected since this exposure temperature
exceeded the measured Tg (115.6 °C) of the vinylester matrix. During this stage, the softened
vinylester matrix losses the ability to resist compression stresses and to transfer stresses
amongst fibres, including the ability to bind and hold the fibres together to prevent fibre
buckling in the compression zone [26, 27], as evidenced by the severe compression failure of
the tested specimens. At 120 °C, the residual strengths were just 20%, 19%, and 22%,
respectively, of their corresponding strengths at room temperature. The strength continued to
decline at temperature 150 °C, but this time, the degree of reduction from 120 °C to 150 °C
was relatively lower compared to the declination from 100 °C to 120 °C, and even became
lesser from 150 °C to 200 °C. Tr-8 and Tr-15, on the other hand, yielded an almost similar
load-carrying capacity pattern characterised by a steady strength degradation starting from
room temperature up until 120 °C, owing to similar mode of failure (flexural cracking at the
bottom) of these specimens even at higher temperatures. From single major crack at low
temperature, the specimens evidenced several flexural cracks at the bottom at higher
temperature. The strength retention of Tr-8 and Tr-15 at 120 °C was approximately 26%. The
strength reduction, however, tends to stabilise at 150-200 °C.
The flexural strength increases when a/h decreases because the portion of the point
loads that are directly being transferred to the support – through a strut – increases, i.e., the
composite laminate’s behaviour was dominated by the arch action instead of the beam action
when a/h decreases. Lo-15 and Lo-18’s average strength at ambient temperature were 62 %
and 103 %, respectively, lower than Lo-8 while Tr-15 produced an average strength that was
110 % lesser than Tr-8. In general, the longitudinally cut specimens yielded higher strength
compared to transversely cut specimens for similar temperature exposure. At room
temperature, the strength of Lo-8 and Lo-15 were 416 % and 570 %, respectively, greater than
that of Tr-8 and Tr-15, respectively. The degree of strength reduction per defined temperature
rise, however, was larger in the former specimens compared to the latter samples. This is
because at low temperature, the stresses are effectively transferred from fibres to resin matrix
and vice versa; however, at higher temperature, the matrix loss its ability to transfer stresses
that resulted in higher strength degradation. The transversely cut specimens, on the other hand,
was mainly governed by the matrix all throughout the test and hence, a steep strength reduction
was observed as the temperature rises.
4.3 Stiffness
Based on Table 2 and Figure 6a, the stiffness – the slope of the linear elastic portion of the
load-deflection curves P/Δ – of Lo-4 was 87 % higher than that of Tr-4 at room temperature.
In addition, Lo-4 exhibited an excessive stiffness degradation at temperatures between 70 °C
and 100 °C while Tr-4 undergone same phenomenon when tested between 40 °C and 70 °C,
suggesting that the stiffness of transversely cut specimens seems to be more influenced by the
temperature compared to longitudinally cut specimens. This is because of the ability of Lo-4
specimens to transfer the applied load from matrix to 0° and + 45o fibres and vice versa
compared to Tr-4.
In general, all the samples exhibited stiffness degradation with increased temperature
as shown in Table 3 and Figures 6b, 6c and 6d. Lo-8, Lo-15, Lo-18, Tr-8 and Tr-15 undergone
an almost linear stiffness reduction from room temperature up until 100 °C. However, a
significant modulus drop occurred between 100 °C and 120 °C. At 120 °C, the stiffness of Lo-
8, Lo-15 and Lo-18 were 37 %, 51 %, and 57 %, respectively, of their stiffness at room

temperature while that of Tr-8 and Tr-15 were just 23 % and 25 %, respectively. On the other
note, the measured flexural modulus was more than two times greater than that of Liao et al.’s
[25] tested glass fibre-vinyl ester composites. Similar with the strength property, an inverse
relationship was observed between the stiffness and a/h. At room temperature, Lo-8’s mean
stiffness was 405 % and 819 % higher than that of Lo-15 and Lo-18, respectively, while that
of Tr-8 was 486 % more than Tr-15’s stiffness. On a different note, Lo-8 and Lo-15 yielded
stiffness that were 2.8 and 3.2 times, respectively, bigger than that of Tr-8 and Tr-29.
Furthermore, as the temperature increases, stiffness degradation was relatively more severe in
Tr- specimens compared to Lo- specimens.
It was apparent from Figure 6 that for similar elevated temperature exposure, the load-
carrying capacity of the longitudinally cut specimens undergone higher degree of degradation
compared to their stiffness, suggesting that the strength of the longitudinally cut pultruded
GFRP laminates was more influenced by the temperature compared to its stiffness. This is
because the former mechanical property was mainly governed by the resin properties and the
corresponding fibre-matrix interaction while the latter property was predominantly influenced
by the fibre properties [28, 29]. Interestingly, this observation corroborates with that of Correia
et al. [9] who conducted an in-plane shear strength tests, through 10° off-axis tensile tests, on
GFRP composites. From their experiment, they concluded that the relative reduction of shear
strength was significantly larger than that of shear stiffness due to glass fibres that retain
considerable amount of room temperature stiffness. Another reason is that the distribution of
stresses among the glass fibres (in both the compression and tension zones) at higher
temperature became less uniform because the softened resin can no longer confine and hold
the glass fibres inside the matrix, which leads to substantial reduction of the load-carrying
capacity.

Tr-8 and Tr-15 specimens yielded almost similar degree of strength and stiffness
degradation, mainly because the mechanical transverse properties are predominantly governed
by the resin matrix. This result tend to support Lahuerta et al.’s [30] hypothesis wherein they
stated that the transverse strength and moduli are related to resin properties. However, this was
not the case for Tr-4 specimens, the strength falls more sharply than the slope of the load-
deflection curve. This is due to the interlaminar shear strength in the transverse direction is
affected more by the weakening of the interface between the fibres and the matrix while the
+45o fibres are still contributing to the shear modulus of the laminates.
The average stiffness at room temperature of Lo-15 and Lo-18 were approximately
equivalent to 647 N/mm and 355 N/mm, respectively, which translate to flexural moduli E of
37.2 GPa and 37.3 GPa, respectively, wherein E was computed from Equation 3. The computed
flexural moduli were generally comparable to the published flexural moduli of 36.1 GPa [24]
and 39.3 MPa [23] for the same pultruded GFRP coupons.
3
34
P LE
w h
Equation 3
Table 2. Average peak load capacity P, interlaminar shear strength ILSS, and stiffness P/Δ of
the specimens with a/h of 4 at elevated temperatures.
Specimen P, N ILSS, MPa P/Δ, N/mm Specimen P, N ILSS, MPa P/Δ, N/mm
Lo-4-RT 5643 (194) 55 (2) 9799 (366) Tr-4-RT 2147 (198) 21 (2) 5234 (103)
Lo-4-40 4183 (183) 41 (2) 8188 (644) Tr-4-40 1323 (42) 13 (1) 4743 (314)
Lo-4-70 2449 (124) 24 (1) 7783 (333) Tr-4-70 5 (1) 0 (0) 2519 (449)
Lo-4-100 810 (62) 8 (1) 3877 (220) Note: The numbers inside ( ) are the standard deviations.

Table 3. Average peak load capacity P, flexural strength σ, and stiffness P/Δ of the specimens
with a/h of 8, 15 and 18 at elevated temperatures.
Specimen P, N σ, MPa P/Δ, N/mm Specimen P, N σ, MPa P/Δ, N/mm
Lo-8-RT 4873(243) 708 (35) 3267 (153) Tr-8-RT 945 (11) 137 (2) 1172 (51)
Lo-8-40 3742 (71) 544 (10) 2645 (4) Tr-8-40 791 (21) 115 (3) 1015 (73)
Lo-8-70 2847 (117) 414 (17) 2583 (92) Tr-8-70 671 (12) 98 (2) 787 (51)
Lo-8-100 1558 (5) 226 (1) 2055 (22) Tr-8-100 442 (29) 64 (4) 525 (54)
Lo-8-120 965 (8) 140 (1) 1220 (23) Tr-8-120 257 (34) 37 (5) 265 (75)
Lo-8-150 388 (29) 56 (4) 554 (14) Tr-8-150 99 (13) 14 (2) 70 (6)
Tr-8-200 51 (5) 7 (1) 64 (6)
Lo-15-RT 3014 (12) 821 (33) 647 (24) Tr-15-RT 450 (28) 123 (8) 200 (19)
Lo-15-40 2636 (15) 718 (41) 620 (37) Tr-15-40 367 (43) 100 (12) 185 (13)
Lo-15-70 1805 (10) 492 (28) 558 (57) Tr-15-70 309 (17) 84 (5) 148 (11)
Lo-15-100 1269 (60) 346 (16) 547 (12) Tr-15-100 195 (25) 53 (7) 115 (13)
Lo-15-120 568 (33) 155 (9) 327 (25) Tr-15-120 112 (3) 31 (1) 49 (8)
Lo-15-150 298 (18) 81 (5) 191 (29) Tr-15-150 43 (4) 12 (1) 13 (1)
Lo-15-200 181 (27) 49 (7) 185 (30) Tr-15-200 25 (3) 7 (1) 11 (1)
Lo-18-RT 2405 (29) 801 (9) 355 (16) Lo-18-100 1098 (53) 365 (18) 304 (4)
Lo-18-40 2231 (59) 743 (20) 337 (32) Lo-18-120 536 (14) 178 (38) 202 (45)
Lo-18-70 1664 (52) 554 (17) 331 (20) Lo-18-150 236 (8) 78 (3) 111 (1) Note: The numbers inside ( ) are the standard deviations.
(a) a/h = 4 (b) a/h = 8
(c) a/h = 15 (d) a/h = 18
Figure 6. Normalised strength and stiffness as a function of temperature
0%
20%
40%
60%
80%
100%
120%
0 25 50 75 100 125
No
rmal
ised
Val
ues
T, C
Lo-4 (ILSS)Lo-4 (P/Δ)Tr-4 (ILSS)Tr-4 (P/Δ)
0%
20%
40%
60%
80%
100%
120%
0 25 50 75 100 125 150 175 200 225
No
rmal
ised
Val
ues
T, C
Lo-8 (σ)
Lo-8 (P/Δ)
Tr-8 (σ)
Tr-8 (P/Δ)
0%
20%
40%
60%
80%
100%
120%
0 25 50 75 100 125 150 175 200 225
No
rmal
ised
Val
ues
T, C
Lo-15 (σ)
Lo-15 (P/Δ)
Tr-15 (σ)
Tr-15 (P/Δ)
0%
20%
40%
60%
80%
100%
120%
0 25 50 75 100 125 150 175
No
rmal
ised
Val
ues
T, C
Lo-15 (σ)
Lo-15 (P/Δ)
4.4 Flexural and Shear Moduli based on Timoshenko Beam Theory
The low shear modulus of the resin compared to the elastic modulus of the fibres resulted in a
relatively low shear-modulus-to-elastic-modulus ratio of the composites that made the shear
deformation very significant in the overall deformation and hence, must be considered in the
calculation of the total deflection [31, 32]. Therefore, the Timoshenko Beam Theory (TBT)-
based procedure [16] was adopted in this study to determine simultaneously the flexural and
shear moduli of the pultruded GFRP composite laminates using the experimental results.
According to this theory, the total maximum deflection (Δ) can be computed as the sum of the
deflections due to flexural and shear deformations (Δf and Δs, respectively). For composite
beams tested under three-point bending test, the equation is written as follows:
3
48 4f s
PL PL
EI KGA
Equation 4
where P is the vertical load applied at midspan; L is the clear span or distance between the
supports; E and G are the flexural and shear moduli; I and A are the centroidal moment of
inertia and cross-sectional area, respectively; and K is the shear area coefficient (assumed as
1.0 in this study). In order to determine E and G, Equation 4 can be written as follows:
24 1 1
12
A L
PL E r G
Equation 5
This equation can be interpreted as a straight line with quantities 4AΔ/PL and (L/r)2 as the
dependent and independent variables, respectively, while 1/12E and 1/G as the slope (m) and
y-ordinate (c), respectively. Hence, E and G can be computed as follows:
1
12E
m
Equation 6
1G
c
Equation 7

Following Equation 5, new graphs 4AΔ/PL versus (L/r)2 were plotted for each series of
longitudinally and transversely cut specimens as shown in Figures 7 and 8, respectively. A
linear regression was conducted in order to determine m and b, which are shown in the figures.
(a) at RT
(b) at 40 oC
(c) at 70 oC
(d) at 100 oC
(e) at 120 oC
(f) at 150 oC
Figure 7. 4AΔ/PL and (L/r)2 of Lo- specimens at elevated temperatures
(a) at RT
(b) At 40 oC
(c) At 70 oC
(d) At 100 oC
(e) At 120 oC
(f) At 150 oC
(g) Tr-15
Figure 8. 4AΔ/PL and (L/r)2 of Tr- specimens at elevated temperatures
Table 4 summarises the values of E and G of the longitudinally and transversely cut specimens
derived from TBT using Equations 6 and 7. The flexural modulus of Lo- specimens at room
y = 1.94E-06x + 8.09E-04
R² = 9.97E-01
0.000
0.003
0.006
0.009
0.012
0 1000 2000 3000 4000
4AΔ
/PL
, 1
/Pa
(L/r)2
y = 1.98E-06x + 1.12E-03
R² = 9.94E-01
0.000
0.003
0.006
0.009
0.012
0 1000 2000 3000 4000
4AΔ
/PL
, 1
/Pa
(L/r)2
y = 2.02E-06x + 1.24E-03
R² = 9.99E-01
0.000
0.003
0.006
0.009
0.012
0 1000 2000 3000 4000
4AΔ
/PL
, 1
/Pa
(L/r)2
y = 2.07E-06x + 1.61E-03
R² = 9.93E-01
0.000
0.003
0.006
0.009
0.012
0 1000 2000 3000 4000
4AΔ
/PL
, 1
/Pa
(L/r)2
y = 2.96E-06x + 3.32E-03
R² = 1.00E+00
0.000
0.003
0.006
0.009
0.012
0.015
0 1000 2000 3000 4000
4AΔ
/PL
, 1
/Pa
(L/r)2
y = 4.60E-06x + 8.10E-03
R² = 9.80E-01
0.000
0.005
0.010
0.015
0.020
0.025
0.030
0 1000 2000 3000 4000
4AΔ
/PL
, 1
/Pa
(L/r)2
y = 6.65E-06x + 1.20E-03
R² = 1.00E+00
0.000
0.005
0.010
0.015
0.020
0.025
0 1000 2000 3000
4AΔ
/PL
, 1
/Pa
(L/r)2
y = 7.11E-06x + 1.54E-03
R² = 1.00E+00
0.000
0.005
0.010
0.015
0.020
0.025
0 1000 2000 3000
4AΔ
/PL
, 1
/Pa
(L/r)2
y = 8.25E-06x + 3.25E-03
R² = 9.97E-01
0.000
0.005
0.010
0.015
0.020
0.025
0.030
0 1000 2000 3000
4AΔ
/PL
, 1
/Pa
(L/r)2
y = 1.03E-05x + 5.35E-03
R² = 1.00E+00
0.000
0.005
0.010
0.015
0.020
0.025
0.030
0.035
0 1000 2000 3000
4AΔ
/PL
, 1
/Pa
(L/r)2
y = 2.65E-05x + 6.50E-03
R² = 1.00E+000.000
0.010
0.020
0.030
0.040
0.050
0.060
0.070
0.080
0 1000 2000 3000
4AΔ
/PL
, 1
/Pa
(L/r)2
y = 1.05E-04x + 2.17E-02
R² = 1.00E+00
0.000
0.050
0.100
0.150
0.200
0.250
0.300
0 1000 2000 3000
4AΔ
/PL
, 1
/Pa
(L/r)2
y = 1.16E-04x + 2.17E-02
R² = 1.00E+000.000
0.050
0.100
0.150
0.200
0.250
0.300
0.350
0 1000 2000 3000
4AΔ
/PL
, 1
/Pa
(L/r)2
temperature (42.9 GPa) was larger than that obtained from either Lo-15 (37.2 GPa) and Lo-18
(37.3 GPa). This can be expected since the total deflection (deflection due to bending as well
as shear deformations), instead of the deflection due to flexural deformations only, was used
to calculate E of Lo-15 and Lo-18. The longitudinal shear modulus at room temperature, on
the other hand, was approximately equal to 1.2 GPa. It is important to note that this value was
just 22% of the in-plane shear modulus reported by Muttashar et al. [23].
The elastic and shear moduli decrease as the temperature increases, wherein a drastic
moduli degradation occurred when the temperature exposure exceeded the Tg of the vinylester
matrix, specifically at 120 °C. Again, this was due to the transitioning of the resin matrix from
a rigid glassy state to a flexible leathery state, as explained in the previous sections.
Interestingly, for similar temperature exposure, the degree of flexural moduli degradation based
on TBT theory was relatively similar to that Lo-15 and Lo-18, suggesting the suitability of
Bank’s proposed procedure in determining not only the E values but also the G values of the
GFRP laminates at elevated temperatures. By inspecting Table 4, as the temperature increases,
the shear modulus property exhibited more steep degradation compared to flexural modulus
because the former is mainly dependent on the resin properties, which are significantly reduced
at higher temperature.
The moduli of the longitudinally cut specimens were generally higher than those cut
transversely. At RT, Lo- specimens’ E and G were 223 % and 48 %, respectively, higher than
that of Tr- specimens. At higher temperatures, the difference even became higher. In fact, for
similar temperature exposure, the flexural and shear moduli of transversely cut specimens
decreased more drastically in comparison with the longitudinally cut specimens. This
observation tend to suggest that the influence of +45° and -45° fibres to the mechanical
properties in the transverse direction tend to decrease at higher temperatures. This behaviour
was different from that reported by Bai et al. [8] regarding the DMA tests conducted on
pultruded GFRP laminates cut along the two directions wherein they reported that although
different in magnitude, the moduli in the longitudinal and transverse direction undergone
similar trend at elevated temperatures. This could attributed to the fibre composition and
orientation they adopted in their study which is a combination of a chopped strand mat (CSM)
and a woven roving [0°/90°] that resulted to similar properties in both direction.
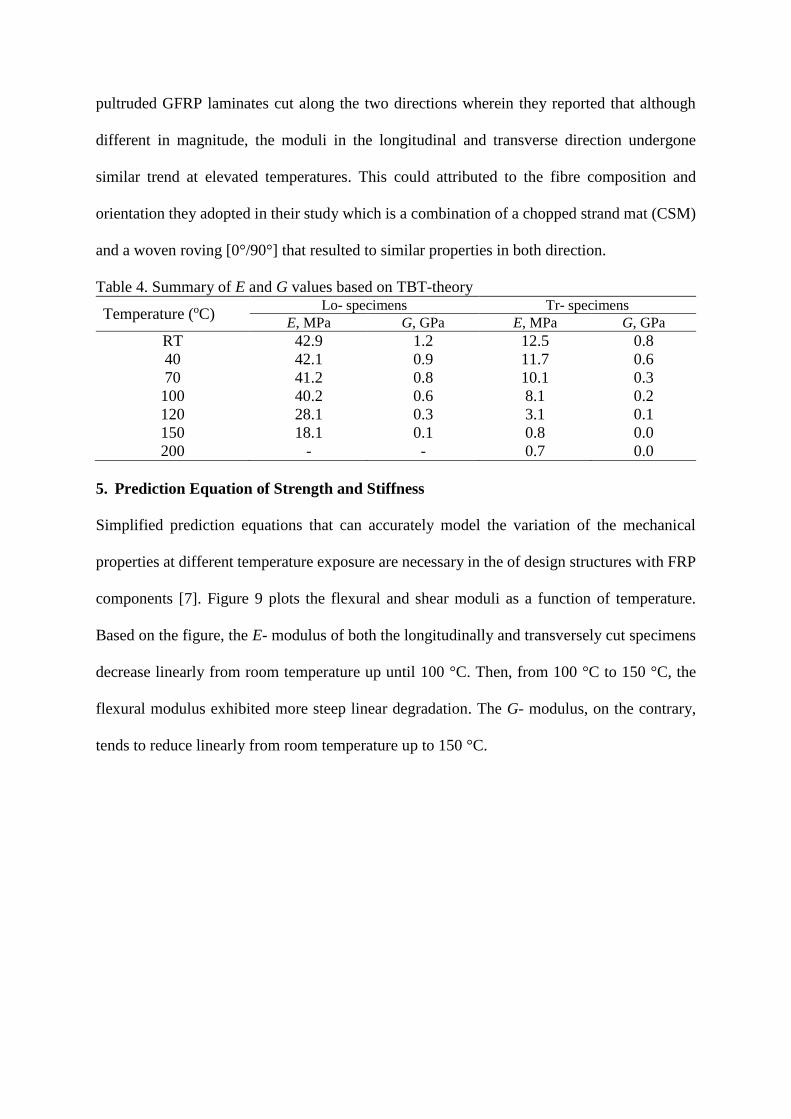
Table 4. Summary of E and G values based on TBT-theory
Temperature (oC) Lo- specimens Tr- specimens
E, MPa G, GPa E, MPa G, GPa
RT 42.9 1.2 12.5 0.8
40 42.1 0.9 11.7 0.6
70 41.2 0.8 10.1 0.3
100 40.2 0.6 8.1 0.2
120 28.1 0.3 3.1 0.1
150 18.1 0.1 0.8 0.0
200 - - 0.7 0.0
5. Prediction Equation of Strength and Stiffness
Simplified prediction equations that can accurately model the variation of the mechanical
properties at different temperature exposure are necessary in the of design structures with FRP
components [7]. Figure 9 plots the flexural and shear moduli as a function of temperature.
Based on the figure, the E- modulus of both the longitudinally and transversely cut specimens
decrease linearly from room temperature up until 100 °C. Then, from 100 °C to 150 °C, the
flexural modulus exhibited more steep linear degradation. The G- modulus, on the contrary,
tends to reduce linearly from room temperature up to 150 °C.

(a) Lo- specimens
(b) Tr- specimens
Figure 10. Flexural and shear moduli as function of temperature
Based on these observations, regression analyses were done to determine the appropriate
empirical models that will best describe the moduli of the GFRP laminates and their
corresponding deflection when subjected to moderate and elevated temperatures. From the
analyses, the following equations were proposed for the studied GFRP laminates:
Along the pultrusion direction:
3
48 4Lo
Lo Lo
PL PL
E I G A
Equation 8
0.0008 1.0152Lo Lo RTE E T when RT < T < 100 oC Equation 8-1
0.0101 1.9184Lo Lo RTE E T when 100 oC < T < 150 oC
Equation 8-2
0.0066 1.0926Lo Lo RTG G T when RT < T < 150 oC Equation 8-3
where ELo and GLo are the flexural and shear moduli along the direction of pultrusion that are
functions of the longitudinal flexural and shear moduli at room temperature (ELo-RT and GLo-RT,
respectively) and temperature T.
Perpendicular to the pultrusion direction:
3
48 4Tr
Tr Tr
PL PL
E I G A
Equation 9
y = -0.0008x + 1.0152
R² = 0.99
y = -0.0066x + 1.0926
R² = 0.96
y = -0.0101x + 1.9184
R² = 0.97
0%
20%
40%
60%
80%
100%
120%
0 50 100 150 200
No
rmal
ised
Val
ues
T, oC
TBT (E)
TBT (G)y = -0.0053x + 1.1262
R² = 0.99
y = -0.0074x + 1.1018
R² = 0.97
y = -0.0105x + 1.6064
R² = 0.92
0%
20%
40%
60%
80%
100%
120%
0 50 100 150 200
No
rmal
ised
val
ues
T, oC
TBT (E)
TBT (G)
0.0053 1.1262Tr Tr RTE E T when RT < T < 100 oC Equation 9-1
0.0105 1.6064Tr Tr RTE E T when 100 oC < T < 150 oC
Equation 9-2
0.0074 1.1018Tr Tr RTG G T when RT < T < 150 oC Equation 9-3
where ETr and GTr are the flexural and shear moduli perpendicular to the direction of pultrusion
that are functions of the transverse flexural and shear moduli at room temperature (ETr-RT and
GTr-RT, respectively) and temperature T.
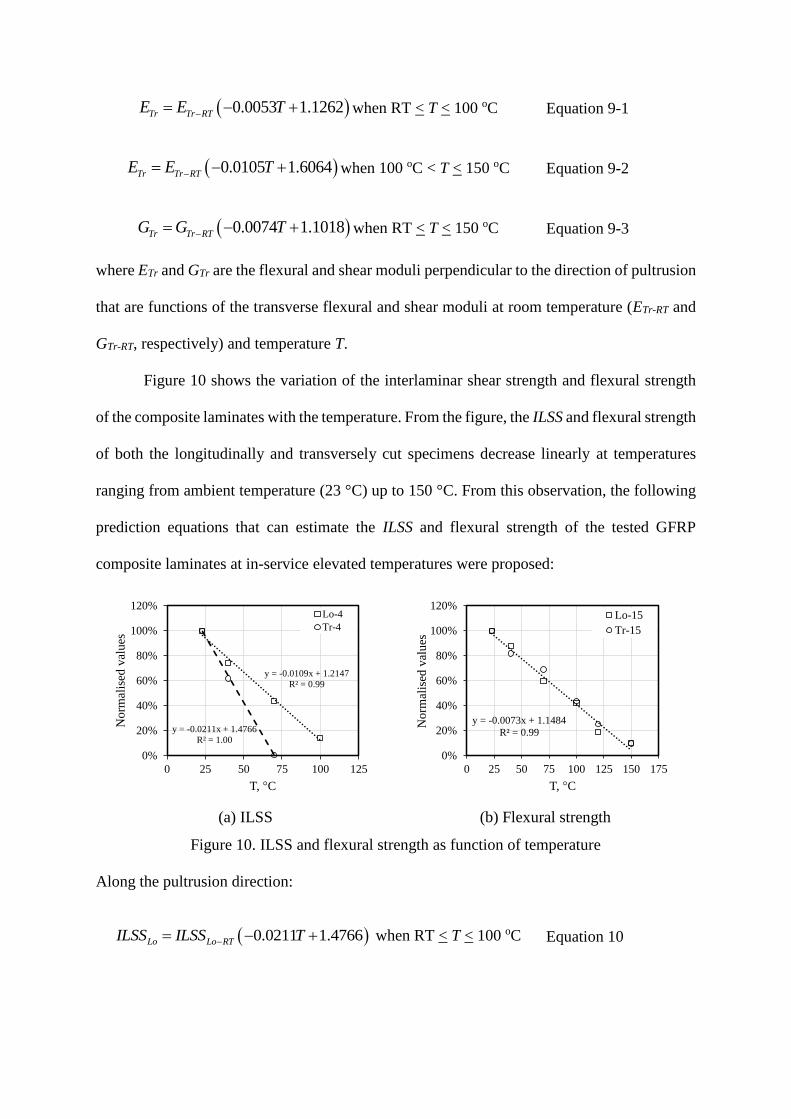
Figure 10 shows the variation of the interlaminar shear strength and flexural strength
of the composite laminates with the temperature. From the figure, the ILSS and flexural strength
of both the longitudinally and transversely cut specimens decrease linearly at temperatures
ranging from ambient temperature (23 °C) up to 150 °C. From this observation, the following
prediction equations that can estimate the ILSS and flexural strength of the tested GFRP
composite laminates at in-service elevated temperatures were proposed:
(a) ILSS
(b) Flexural strength
Figure 10. ILSS and flexural strength as function of temperature
Along the pultrusion direction:
0.0211 1.4766Lo Lo RTILSS ILSS T when RT < T < 100 oC
Equation 10
y = -0.0109x + 1.2147
R² = 0.99
y = -0.0211x + 1.4766
R² = 1.00
0%
20%
40%
60%
80%
100%
120%
0 25 50 75 100 125
Norm
alis
ed v
alues
T, C
Lo-4
Tr-4
y = -0.0073x + 1.1484
R² = 0.99
0%
20%
40%
60%
80%
100%
120%
0 25 50 75 100 125 150 175
No
rmal
ised
val
ues
T, C
Lo-15
Tr-15

0.0073 1.1484Lo Lo RT T when RT < T < 150 oC
Equation 11
Perpendicular to the pultrusion direction:
0.0109 1.2147Tr Tr RTILSS ILSS T when RT < T < 70 oC
Equation 12
0.0073 1.1484Tr Tr RT T when RT < T < 100 oC
Equation 13
where ILSSLo-RT and σLo-RT are the longitudinal interlaminar shear strength and flexural strength
at room temperature, respectively, while ILSSTr-RT and σTr-RT are the transverse interlaminar
shear strength and flexural strength at room temperature, respectively.
6. Conclusions
In this study, longitudinally and transversely cut pultruded GFRP composite laminates were
considered and tested using the three-point bending test to investigate its mechanical properties
when subjected to elevated temperatures. Based on the test, the following conclusions were
derived:
In general, the strength and stiffness of the tested composite laminates decreased when
the temperature increases, with significant reductions occurring between 100°C to
150°C due to the glass transition process undergone by the matrix (vinylester resin).
For the same degree of temperature exposure, the interlaminar shear strength ILSS,
shear modulus, flexural strength, and elastic modulus of transversely cut specimens
undergone more severe degradation compared to that of longitudinally cut specimens.
This could be attributed to the presence of more fibres, oriented along the pultrusion
direction, resisting the applied load which made the longitudinal mechanical properties
of the GFRP composite laminates better than its transverse properties.
As the shear-span-to-depth-ratio a/h decreases, the strength degradation at elevated
temperature became more drastic in both longitudinal and transverse directions. In fact,
the specimens with a/h of 4 were able to carry interlaminar shear stress up to
temperature exposure of 70°C only while those with a/h of 15 and 18 were able to
sustain flexural stresses until 200°C. This is because the stress resistance mechanism of
the former specimens was generally governed by the fibre-resin interphase properties,
which is directly affected by the degradation of polymer resin at elevated temperature,
while that of the latter specimens were predominantly coming from the compressive
strength of the resin and glass fibres and the tensile strength of the fibres.
At elevated temperature, the shear modulus undergone more severe degradation
compared to flexural modulus because the shear modulus of the pultruded GFRP
laminates is mainly dependent on the interaction between the fibre and matrix while the
flexural modulus is predominantly influenced by the fibre properties.
The strength of the longitudinally cut specimens was more influenced by the elevated
temperature compared to its stiffness, mainly because the strength was governed by the
fibre-matrix interaction while the stiffness was affected by the fibre properties. On the
contrary, the strength and stiffness behaviour of transversely cut specimens, undergone
similar trend of degradation in strength and stiffness as both these properties are
predominantly dependent on the resin matrix.
Simplified empirical models to predict the strength and modulus of the GFRP laminates
in both the longitudinal and transverse directions at elevated temperature were
proposed. Further experimental works, however, are needed to enhance the accuracy of
these equations.
The knowledge and gained from this study would be substantial in the development of design
curves that simulate the degradation of the temperature-dependent mechanical performance,

which would be useful in analysing the response of the pultruded GFRP structural profiles and
of various assemblies built out of it under elevated temperature.
Nomenclature:
a = shear span (mm)
A = cross-sectional area of the laminate (mm2)
b = width of the laminate (mm)
c = y-ordinate of the line
E = flexural modulus (MPa, GPa)
ELo = flexural modulus along the pultrusion direction (MPa, GPa)
ELo-RT = flexural modulus along the pultrusion direction at room temperature (MPa,
GPa)
ETr = flexural modulus perpendicular to the pultrusion direction (MPa, GPa)
ETr-RT = flexural modulus perpendicular to the pultrusion direction at room temperature
(MPa, GPa)
G = shear modulus (MPa, GPa)
GLo = shear modulus along the pultrusion direction (MPa, GPa)
GLo-RT = shear modulus along the pultrusion direction at room temperature (MPa, GPa)
GTr = shear modulus perpendicular to the pultrusion direction (MPa, GPa)
GTr = shear modulus perpendicular to the pultrusion direction at room temperature
(MPa, GPa)
h = thickness of the laminate (mm)
I = centroidal moment of inertia of the laminate (mm4)
ILSS = interlaminar shear strength (MPa)
ILSSLo = interlaminar shear strength along the pultrusion direction (MPa)
ILSSLo
-RT
= interlaminar shear strength along the pultrusion direction at room temperature
(MPa)
ILSSTr = interlaminar shear strength perpendicular to the pultrusion direction (MPa)
ILSSTr
-RT
= interlaminar shear strength perpendicular to the pultrusion direction at room
temperature (MPa)
K = shear are coefficient (assumed as 1.0 in this study)
L = span, clear distance between supports (mm)
L/r = slenderness ratio
m = slope of the line
P = vertical load applied at midspan (N, kN)
r = radius of gyration (mm)
RT = room temperature (°C)
T = temperature exposure (°C)
Tg = glass transition temperature of the resin matrix (°C)
σ = flexural strength
σLo = flexural strength along the pultrusion direction (MPa)
σLo-RT = flexural strength along the pultrusion direction at room temperature (MPa)
σTr = flexural strength perpendicular to the pultrusion direction (MPa)
σTr-RT = flexural strength perpendicular to the pultrusion direction at room temperature
(MPa)
Δ = total maximum deflection (mm)
Δf = deflection due to flexural deformation (mm)
ΔLo = total maximum deflection of longitudinally cut specimens (mm)
Δs = deflection due to shear deformation (mm)
ΔTr = total maximum deflection of transversely cut specimens (mm)

Acknowledgement
The authors would like to thank Wagners Composites Fibre Technology (WCFT),
Toowoomba, Australia, for providing the test samples.
References
[1] Keller T, Rothe J, De Castro J, Osei-Antwi M. GFRP-balsa sandwich bridge deck: Concept,
design, and experimental validation. Journal of Composites for Construction.
2013;18:04013043.
[2] Kumar P, Chandrashekhara K, Nanni A. Testing and evaluation of components for a
composite bridge deck. Journal of reinforced plastics and composites. 2003;22:441-61.
[3] Manalo AC, Aravinthan T, Fam A, Benmokrane B. State-of-the-art review on FRP
sandwich systems for lightweight civil infrastructure. Journal of Composites for Construction.
2016a:04016068.
[4] Sousa JM, Correia JR, Cabral-Fonseca S, Diogo AC. Effects of thermal cycles on the
mechanical response of pultruded GFRP profiles used in civil engineering applications.
Composite Structures. 2014;116:720-31.
[5] Correia JR, Bai Y, Keller T. A review of the fire behaviour of pultruded GFRP structural
profiles for civil engineering applications. Composite Structures. 2015;127:267-87.
[6] Wong P, Wang Y. An experimental study of pultruded glass fibre reinforced plastics
channel columns at elevated temperatures. Composite Structures. 2007;81:84-95.
[7] Bai Y, Keller T, Vallée T. Modeling of stiffness of FRP composites under elevated and
high temperatures. Composites Science and Technology. 2008a;68:3099-106.
[8] Bai Y, Post NL, Lesko JJ, Keller T. Experimental investigations on temperature-dependent
thermo-physical and mechanical properties of pultruded GFRP composites. Thermochimica
Acta. 2008b;469:28-35.
[9] Correia JR, Gomes MM, Pires JM, Branco FA. Mechanical behaviour of pultruded glass
fibre reinforced polymer composites at elevated temperature: Experiments and model
assessment. Composite Structures. 2013;98:303-13.
[10] Dao M, Asaro RJ. A study on failure prediction and design criteria for fiber composites
under fire degradation. Composites Part A: Applied science and manufacturing. 1999;30:123-
31.
[11] Dutta PK, Hui D. Creep rupture of a GFRP composite at elevated temperatures. Computers
& Structures. 2000;76:153-61.
[12] Mahieux C, Reifsnider K. Property modeling across transition temperatures in polymers:
a robust stiffness–temperature model. Polymer. 2001;42:3281-91.
[13] Gibson A, Wu Y-S, Evans J, Mouritz A. Laminate theory analysis of composites under
load in fire. Journal of Composite Materials. 2006;40:639-58.
[14] Mahieux C, Reifsnider K, Case S. Property modeling across transition temperatures in
PMC's: Part I. Tensile properties. Applied Composite Materials. 2001;8:217-34.
[15] Fan Z, Santare MH, Advani SG. Interlaminar shear strength of glass fiber reinforced epoxy
composites enhanced with multi-walled carbon nanotubes. Composites Part A: Applied science
and manufacturing. 2008;39:540-54.
[16] Bank LC. Flexural and shear moduli of full-section fiber reinforced plastic (FRP)
pultruded beams. Journal of Testing and Evaluation. 1989;17:40-5.

[17] ISO 1172:1996. Textile-glass-reinforced plastics — prepregs, moulding compounds and
laminates — determination of the textile-glass and mineral-filler content — calcination
methods. International Organization for Standardization. Geneva, Switzerland1996.
[18] ASTM D792. Standard test methods for density and specific gravity (relative density) of
plastics by displacement. ASTM International. West Conshohocken, PA2013.
[19] ASTM D790. Standard test methods for flexural properties of unreinforced and reinforced
plastics and electrical insulating materials. ASTM International. West Conshohocken,
PA2015.
[20] Liu H, Gu Y, Li M, Li Y, Zhang Z. Correlation of temperature dependences of macro-and
micro-interfacial properties in carbon fiber/epoxy resin composite. Journal of reinforced
plastics and composites. 2012:0731684412467842.
[21] Selmy A, Elsesi A, Azab N, El-baky MA. Interlaminar shear behavior of unidirectional
glass fiber (U)/random glass fiber (R)/epoxy hybrid and non-hybrid composite laminates.
Composites Part B: Engineering. 2012;43:1714-9.
[22] Chan A, Chiu W, Liu X. Determining the elastic interlaminar shear modulus of composite
laminates. Composite Structures. 2007;80:396-408.
[23] Muttashar M, Karunasena W, Manalo A, Lokuge W. Behaviour of hollow pultruded GFRP
square beams with different shear span-to-depth ratios. Journal of Composite Materials.
2015:0021998315614993.
[24] Guades E, Aravinthan T, Islam MM. Characterisation of the mechanical properties of
pultruded fibre-reinforced polymer tube. Materials & Design. 2014;63:305-15.
[25] Liao K, Schultheisz CR, Hunston DL. Effects of environmental aging on the properties of
pultruded GFRP. Composites Part B: Engineering. 1999;30:485-93.
[26] Bai Y, Keller T. Delamination and kink-band failure of pultruded GFRP laminates under
elevated temperatures and compression. Composite Structures. 2011;93:843-9.
[27] Manalo AC, Wani E, Zukarnain NA, Karunasena W, Lau K-t. Effects of alkali treatment
and elevated temperature on the mechanical properties of bamboo fibre–polyester composites.
Composites Part B: Engineering. 2015;80:73-83.
[28] Manalo AC, Surendar S, van Erp G, Benmokrane B. Flexural behavior of an FRP
sandwich system with glass-fiber skins and a phenolic core at elevated in-service temperature.
Composite Structures. 2016b;152:96-105.
[29] St John NA, Brown JR. Flexural and interlaminar shear properties of glass-reinforced
phenolic composites. Composites Part A: Applied science and manufacturing. 1998;29:939-
46.
[30] Lahuerta F, Nijssen R, van der Meer F, Sluys L. The influence of curing cycle and through
thickness variability of properties in thick laminates. Journal of Composite Materials.
2016:0021998316648758.
[31] Roberts T, Al-Ubaidi H. Flexural and torsional properties of pultruded fiber reinforced
plastic I-profiles. Journal of Composites for Construction. 2002;6:28-34.
[32] Neto ABdSS, La Rovere HL. Flexural stiffness characterization of fiber reinforced plastic
(FRP) pultruded beams. Composite Structures. 2007;81:274-82.