template br_rec_2005.dot - itu: committed to …!msw-e.docx · web...
TRANSCRIPT

Recommendation ITU-R M.1581-5(02/2014)
Generic unwanted emission characteristics of mobile stations using
the terrestrial radio interfaces of IMT-2000
M SeriesMobile, radiodetermination, amateur
and related satellite services

ii Rec. ITU-R M.1581-5
Foreword
The role of the Radiocommunication Sector is to ensure the rational, equitable, efficient and economical use of the radio-frequency spectrum by all radiocommunication services, including satellite services, and carry out studies without limit of frequency range on the basis of which Recommendations are adopted.
The regulatory and policy functions of the Radiocommunication Sector are performed by World and Regional Radiocommunication Conferences and Radiocommunication Assemblies supported by Study Groups.
Policy on Intellectual Property Right (IPR)
ITU-R policy on IPR is described in the Common Patent Policy for ITU-T/ITU-R/ISO/IEC referenced in Annex 1 of Resolution ITU-R 1. Forms to be used for the submission of patent statements and licensing declarations by patent holders are available from http://www.itu.int/ITU-R/go/patents/en where the Guidelines for Implementation of the Common Patent Policy for ITU-T/ITU-R/ISO/IEC and the ITU-R patent information database can also be found.
Series of ITU-R Recommendations(Also available online at http://www.itu.int/publ/R-REC/en)
Series Title
BO Satellite deliveryBR Recording for production, archival and play-out; film for televisionBS Broadcasting service (sound)BT Broadcasting service (television)F Fixed serviceM Mobile, radiodetermination, amateur and related satellite servicesP Radiowave propagationRA Radio astronomyRS Remote sensing systemsS Fixed-satellite serviceSA Space applications and meteorologySF Frequency sharing and coordination between fixed-satellite and fixed service systemsSM Spectrum managementSNG Satellite news gatheringTF Time signals and frequency standards emissionsV Vocabulary and related subjects
Note: This ITU-R Recommendation was approved in English under the procedure detailed in Resolution ITU-R 1.
Electronic PublicationGeneva, 2014
ITU 2014
All rights reserved. No part of this publication may be reproduced, by any means whatsoever, without written permission of ITU.

RECOMMENDATION ITU-R M.1581-5*
Generic unwanted emission characteristics of mobile stationsusing the terrestrial radio interfaces of IMT-2000
(Question ITU-R 229-2/5)
(2002-2003-2007-2009-2012-2014)
Scope
This Recommendation provides the generic unwanted emission characteristics of mobile stations using the terrestrial radio interfaces of IMT-2000, suitable for establishing the technical basis for global circulation of IMT-2000 terminals. Implementation of characteristics of mobile stations using the terrestrial radio interfaces of IMT-2000 in any of the bands included in this Recommendation is subject to compliance with the Radio Regulations.
The ITU Radiocommunication Assembly,
considering
a) that unwanted emissions consist of both spurious and out-of-band (OoB) emissions according to No. 1.146 of the Radio Regulations (RR) and that spurious and OoB emissions are defined in RR Nos. 1.145 and 1.144, respectively;
b) that limitation of the maximum permitted levels of unwanted emissions of IMT-2000 mobile stations (MSs) is necessary to protect other radio systems and services from interference and to enable coexistence between different technologies;
c) that too stringent limits may lead to an increase in size or in complexity of IMT-2000 radio equipment;
d) that every effort should be made to keep limits for unwanted emissions at the lowest possible values taking account of economic factors and technological limitations;
e) that Recommendation ITU-R SM.329 relates to the effects, measurements and limits to be applied to spurious domain emissions;
f) that the same spurious emission limits apply equally to MSs of all radio interfaces;
g) that Recommendation ITU-R SM.1541 relating to OoB emission specifies generic limits in the OoB domain which generally constitute the least restrictive OoB emission limits and encourages the development of more specific limits for each system;
h) that the levels of spurious emissions of IMT-2000 terminals shall comply with the limits specified in RR Appendix 3;
i) that Recommendation ITU-R M.1579 establishes the technical basis for global circulation of IMT-2000 MSs;
j) that one of the basic requirements of global circulation is that the MS does not cause harmful interference in any country where it is taken;
k) that the harmonization of unwanted emission limits will facilitate global use and access to a global market;
l) that unwanted emission limits are dependent on the transmitter emission characteristics in addition to depending on services operating in other bands;
* This Recommendation should be brought to the attention of Radiocommunication Study Group 1.

2 Rec. ITU-R M.1581-5
m) that the technology used by a system and its conformance with the recommended specifications and standards in Recommendation ITU-R M.1457 defines that system as IMT-2000 regardless of the frequency band of operation;
n) that harmonized frequency arrangements for the bands identified for IMT are addressed in Recommendation ITU-R M.1036, which also indicates that “some administrations may deploy IMT-2000 systems in bands other than those identified in the RR”,
noting
a) the work carried out by standardization bodies to define limits to protect other radio systems and services from interference and to enable coexistence between different technologies;
b) that IMT-2000 mobile stations must comply with local, regional, and international regulations for out-of-band and spurious emissions relevant to their operations, wherever such regulations apply;
c) that the notes and annexes of this recommendation – being based on the ongoing work in standardization bodies – in order to reflect the wide applicability of IMT-2000 technologies and to maintain consistency with the technology specifications, may contain material which reflects information related to the technology applications in bands other than those identified for IMT,
recommends
that the unwanted emission characteristics of IMT-2000 MSs should be based on the limits contained in the technology specific Annexes 1 to 6 which correspond to the radio interface specifications described in § 5.1 to 5.6 of Recommendation ITU-R M.1457.NOTE 1 – Except the cases stated in Notes 2, 3, 4 and 5, the unwanted emission limits are only defined for mobile stations operating according to the following arrangement: frequency division duplex (FDD) uplink in the band 1 920-1 980 MHz, FDD downlink in the band 2 110-2 170 MHz and time division duplex (TDD) in the bands 1 885-1 980 and 2 010-2 025 MHz. Future versions of this Recommendation will include limits applicable to other frequency bands. Subject to further study, it is anticipated that such limits would be similar to those already contained in this Recommendation.NOTE 2 – The unwanted emission limits defined in Annex 1 are for MS operating at least one of the following arrangements:– Frequency division duplex (FDD) uplink in the band 1 920-1 980 MHz, FDD downlink in
the band 2 110-2 170 MHz, in Annex 1 referred to as FDD Band I in universal terrestrial radio access (UTRA) or Band 1 in E-UTRA.
– FDD uplink in the band 1 850-1 910 MHz, FDD downlink in the band 1 930-1 990 MHz, in Annex 1 referred to as FDD Band II in UTRA or Band 2 in E-UTRA.
– FDD uplink in the band 1 710-1 785 MHz, FDD downlink in the band 1 805-1 880 MHz, in Annex 1 referred to as FDD Band III in UTRA or Band 3 in E-UTRA.
– FDD uplink in the band 1 710-1 755 MHz, FDD downlink in the band 2 110-2 155 MHz, in Annex 1 referred to as FDD Band IV in UTRA or Band 4 in E-UTRA.
– FDD uplink in the band 824-849 MHz, FDD downlink in the band 869-894 MHz, in Annex 1 referred to as FDD Band V in UTRA or Band 5 in E-UTRA.
– FDD uplink in the band 830-840 MHz, FDD downlink in the band 875-885 MHz, in Annex 1 referred to as FDD Band VI in UTRA or Band 6 in E-UTRA.
– FDD uplink in the band 2 500-2 570 MHz, FDD downlink in the band 2 620-2 690 MHz, in Annex 1 referred to as FDD Band VII in UTRA or Band 7 in E-UTRA.
– FDD uplink in the band 880-915 MHz, FDD downlink in the band 925-960 MHz, in Annex 1 referred to as FDD Band VIII in UTRA or Band 8 in E-UTRA.

Rec. ITU-R M.1581-5 3
– FDD uplink in the band 1 749.9-1 784.9 MHz, FDD downlink in the band 1 844.9-1 879.9 MHz, in Annex 1 referred to as FDD Band IX in UTRA or Band 9 in E-UTRA.
– FDD uplink in the band 1 710-1 770 MHz, FDD downlink in the band 2 110-2 170 MHz, in Annex 1 referred to as FDD Band X in UTRA or Band 10 in E-UTRA.
– FDD uplink in the band 1 427.9-1 447.9 MHz#, FDD downlink in the band 1 475.9-1 495.9 MHz#, in Annex 1 referred to as FDD Band XI in UTRA or Band 11 in E-UTRA.
– FDD uplink in the band 699-716 MHz, FDD downlink in the band 729-746 MHz, in Annex 1 referred to as FDD Band XII in UTRA or Band 12 in EUTRA.
– FDD uplink in the band 777-787 MHz, FDD downlink in the band 746-756 MHz, in Annex 1 referred to as FDD Band XIII in UTRA or Band 13 in E-UTRA.
– FDD uplink in the band 788-798 MHz, FDD downlink in the band 758-768 MHz, in Annex 1 referred to as FDD Band XIV in UTRA or Band 14 in E-UTRA.
– FDD uplink in the band 704-716 MHz, FDD downlink in the band 734-746 MHz, in Annex 1 referred to as FDD Band 17 in E-UTRA.
– FDD uplink in the band 815-830 MHz, FDD downlink in the band 860-875 MHz, in Annex 1 referred to as FDD Band 18 in E-UTRA.
– FDD uplink in the band 830-845 MHz, FDD downlink in the band 875-890 MHz, in Annex 1 referred to as FDD Band XIX in UTRA or Band 19 in E-UTRA.
– FDD uplink in the band 832-862 MHz, FDD downlink in the band 791-821 MHz, in Annex 1 referred to as FDD Band XX in UTRA or Band 20 in E-UTRA.
– FDD uplink in the band 1 447.9-1 462.9 MHz#, FDD downlink in the band 1 495.9-1 510.9 MHz#, in Annex 1 referred to as FDD Band XXI in UTRA or Band 21 in E-UTRA.
– FDD uplink in the band 3 410-3 490 MHz#, FDD downlink in the band 3 510-3 590 MHz#, in Annex 1 referred to as FDD Band XXII in UTRA or Band 22 in E-UTRA.
– FDD uplink in the band 2 000-2 020 MHz#, FDD downlink in the band 2 180-2 200 MHz#, in Annex 1 referred to as Band 23 in E-UTRA.
– FDD uplink in the band 1 626.5-1 660.5 MHz#, FDD downlink in the band 1 525-1 559 MHz#, in Annex 1 referred to as Band 24 in E-UTRA.
– FDD uplink in the band 1 850-1 915 MHz#, FDD downlink in the band 1 930-1 995 MHz#, in Annex 1 referred to as FDD Band XXV in UTRA or Band 25 in E-UTRA.
NOTE 2A – The unwanted emission limits defined in Annex 1 are for MS operating at least on one of the following combinations:– E-UTRA intra-band contiguous carrier aggregation Band 1.– E-UTRA inter-band carrier aggregation Band 1 and Band 5.– DB-DC-HSDPA configurations with the uplink in Band I and Band VIII and downlink in
Band I or Band VIII.– DB-DC-HSDPA configurations with the uplink in Band II and Band IV and downlink in
Band II or Band IV.– DB-DC-HSDPA configurations with the uplink in Band I and Band V and downlink in
Band I or Band V.– DB-DC-HSDPA configurations with the uplink in Band I and Band XI and downlink in
Band I or Band XI.

4 Rec. ITU-R M.1581-5
– DB-DC-HSDPA configurations with the uplink in Band II and Band V and downlink in Band II or Band V.
Single-band 4C-HSDPA in Band I with 3 downlink carriers.– Dual-band 4C-HSDPA with 2 downlink carriers in Band I and 1 downlink carrier in
Band VIII.– Dual-band 4C-HSDPA with 3 downlink carriers in Band I and 1 downlink carrier in
Band VIII.– Dual-band 4C-HSDPA with 1 downlink carriers in Band II and 2 downlink carriers in
Band IV.– Dual-band 4C-HSDPA with 2 downlink carriers in Band II and 1 downlink carriers in
Band IV.– Dual-band 4C-HSDPA with 2 downlink carriers in Band II and 2 downlink carriers in
Band IV.– Dual-band 4C-HSDPA with 1 downlink carrier in Band I and 2 downlink carriers in
Band V.– Dual-band 4C-HSDPA with 1 downlink carrier in Band I and 2 downlink carriers in
Band V.– Dual-band 4C-HSDPA with 2 downlink carriers in Band I and 1 downlink carrier in
Band V.– Dual-band 4C-HSDPA with 2 downlink carriers in Band I and 2 downlink carriers in
Band V.
Future versions of this Recommendation will include limits applicable to other frequency bands. Subject to further study, it is anticipated that such limits would be similar to those already contained in this Recommendation.NOTE 3 – The unwanted emission limits defined in Annex 2 are for MS operating in the following arrangements (as named by 3GPP2) for either the FDD or TDD components and apply to both cdma2000 and HRPD operating modes except as noted:
Band class NameMS transmit
frequency(MHz)
BS transmit frequency
(MHz)
0 800 MHz band 815-849 860-894
1 1 900 MHz band 1 850-1 910 1 930-1 9902 TACS band 872-915 917-960
3 JTACS band 887-925 832-8704 Korean PCS band 1 750-1 780 1 840-1 870
5 450 MHz band 411-484# 421-494#
6 2 GHz band 1 920-1 980 2 110-2 170
7 Upper 700 MHz band 776-788 746-7588 1 800 MHz band 1 710-1 785 1 805-1 880
9 900 MHz band 880-915 925-96010 Secondary 800 MHz band 806-901 851-940
11 400 MHz European PAMR band 411-484 421-49412 800 MHz PAMR band 870-876 915-921
13 2.5 GHz IMT-2000 extension band 2 500-2 570 2 620-2 690

Rec. ITU-R M.1581-5 5
Band class NameMS transmit
frequency(MHz)
BS transmit frequency
(MHz)
14 US PCS 1.9 GHz band 1 850-1 915 1 930-1 995
15 AWS band 1 710-1 755 2 110-2 15516(1) US 2.5 GHz band 2 502-2 568 2 624-2 690
17(1) US 2.5 GHz forward link only band N/A 2 624-2 69018(1) 700 MHz public safety band 787-799 757-769
19(1) Lower 700 MHz band 698-716 728-746(1) No emissions specifications at this time.
NOTE 4 – The unwanted emission limits defined in Annex 3 are for MS operating at least one of the following arrangements:– Time division duplex (TDD) in the band 1 900-1 920 MHz and 2 010-2 025 MHz referred
to as Band b) in UTRA or Bands 33 and 34, respectively, in E-UTRA. – TDD in the band 1 850-1 910 MHz and 1 930-1 990 MHz referred to as Band b) in UTRA
or Bands 35 and 36, respectively, in E-UTRA.– TDD in the band 1 910-1 930 MHz referred to as Band c) in UTRA or Band 37 in E-UTRA
TDD.– TDD in the band 2 570-2 620 MHz referred to as Band d) in UTRA or Band 38 in E-UTRA
TDD.– TDD in the band 1 880-1 920 MHz referred to as Band f) in UTRA or Band 39 in E-UTRA. – TDD in the band 2 300-2 400 MHz referred to as Band e) in UTRA or Band 40 in
E-UTRA.– TDD in the band 2 496-2 690 MHz referred to as Band 41 in E-UTRA.– TDD in the band 3 400-3 600 MHz referred to as Band 42 in E-UTRA.– TDD in the band 3 600-3 800 MHz referred to as Band 43 in E-UTRA.NOTE 4A – The unwanted emission limits defined in Annex 1 are for MS operating at least on one of the following combinations:– E-UTRA intra-band contiguous carrier aggregation Band 40.
Future versions of this Recommendation will include limits applicable to other frequency bands. Subject to further study, it is anticipated that such limits would be similar to those already contained in this Recommendation.NOTE 5 – The OoB emission limits defined in Annex 6 are for MS operating in the following arrangement:
Band class group
Uplink MS transmit frequency
(MHz)
Downlink MS receive frequency
(MHz)
Channelbandwidth
(MHz)
Duplexmode
1.A 2 300-2 400 2 300-2 400 8.75 TDD1.B 2 300-2 400 2 300-2 400 5 and 10 TDD
2.D 2 305-2 320, 2 345-2 360
2 305-2 320,2 345-2 360 3.5, 5 and 10 TDD
2.E 2 345-2 360 2 305-2 320 2 3.5, 2 5 and 2 10 FDD
2.F 2 345-2 360 2 305-2 320 5 (Uplink), 10 (Downlink) FDD
3.A 2 500-2 690 2 500-2 690 5 and 10 TDD3.B 2 496-2 572# 2 614-2 690# 2 5 and 2 10 FDD

6 Rec. ITU-R M.1581-5
Band class group
Uplink MS transmit frequency
(MHz)
Downlink MS receive frequency
(MHz)
Channelbandwidth
(MHz)
Duplexmode
4.A# 3 300-3 400# 3 300-3 400# 5 TDD4.B# 3 300-3 400# 3 300-3 400# 7 TDD4.C# 3 300-3 400# 3 300-3 400# 10 TDD5L.A 3 400-3 600 3 400-3 600 5 TDD5L.B 3 400-3 600 3 400-3 600 7 TDD5L.C 3 400-3 600 3 400-3 600 10 TDD
5.D 3 400-3 500 3 500-3 600 2 5, 2 7 and 2 10 FDD
5H.A 3 600-3 800# 3 600-3 800# 5 TDD5H.B 3 600-3 800# 3 600-3 800# 7 TDD5H.C 3 600-3 800# 3 600-3 800# 10 TDD6.A 1 710-1 770 2 110-2 170 2 5 and 2 10 FDD6.B 1 920-1 980 2 110-2 170 2 5 and 2 10 FDD6.C 1 710-1 785 1 805-1 880 2 5 and 2 10 FDD7.A 698-862 698-862 5, 7 and 10 TDD7.B 776-787 746-757 2 5 and 2 10 FDD
7.C 788-793,793-798
758-763,763-768 2 5 FDD
7.D 788-798 758-768 2 10 FDD
7.E 698-862 698-8625, 7 and 10 (TDD)2 5, 2 7 and
2 10 (FDD)TDD/FDD
7.G 880-915 925-960 2 5 and 2 10 FDD
8.A
1 785-1 805, 1 880-1 920, 1 910-1 930, 2 010-2 025, 1 900-1 920
1 785-1 805, 1 880-1 920, 1 910-1 930, 2 010-2 025, 1 900-1 920
5 and 10 TDD
NOTE 5A – Frequency bands or parts of the bands referenced in this Recommendation which are marked with “#” are not identified for IMT in the ITU Radio Regulations.NOTE 6 – It should be noted that significant differences can exist between adjacent channel leakage power ratio (ACLR) information calculated from the integration of the envelope of the absolute spectrum masks compared to the specified values. This is because some or all of the spectrum masks are absolute (rather than relative to in-band power level) masks. Indeed, different margins exist between the guaranteed masks (used for compliance tests) and the shape of the actual emissions. If it represented a realistic transmit scenario, the specified ACLR values could not be met.
However, both the specified mask and the specified ACLR figures are to be met in accordance with, and compliance to, local/regional regulations wherever applicable. Caution is therefore advised when considering the emissions envelope mask for frequency sharing studies and when considering the emissions envelope mask for the actual transmission schemes as the ACLR values would not be met, if the transmissions were to fill the mask envelope. Where spectrum emission information is needed for adjacent band sharing studies the relevant specified ACLR data should be preferably used if it is available for the relevant frequency offset and bandwidth.
When the ACLR values are specified but are not applicable (e.g. studying the compatibility involving a system with a bandwidth for which the ACLR values are not applicable, e.g. 8 MHz) or when the ACLR values are not specified in this Recommendation, then ACLR values may be calculated from the spectrum mask and receiver filter characteristics if needed. An estimate derived from this calculation can be seen as a worst case. For the particular case of Europe, the mask used

Rec. ITU-R M.1581-5 7
for deriving the ACLR value is the relevant ETSI mask (e.g. EN 302 544 for OFDMA TDD WMAN in the 2 500-2 690 MHz band).
Annex 1 – IMT-2000 Code division multiple access (CDMA) direct spread ((UTRA) FDD) mobile stations.
Annex 2 – IMT-2000 CDMA Multi-Carrier (CDMA-2000) mobile stations.
Annex 3 – IMT-2000 CDMA TDD (UTRA TDD) mobile stations.
Annex 4 – IMT-2000 TDMA Single-Carrier (UWC-136) mobile stations.
Annex 5 – IMT-2000 FDMA/TDMA (digital enhanced cordless telecommunications (DECT)) mobile stations.
Annex 6 – IMT-2000 OFDMA TDD WMAN mobile stations.
Attachment 1 – Definition of test tolerance.
Annex 1
Code division multiple access (CDMA) direct spread ((UTRA) FDD) mobile stations
1 Measurement uncertainty
Values specified in this Annex differ from those specified in Recommendation ITU-R M.1457 since values in this Annex incorporate test tolerances defined in Recommendation ITU-R M.1545.
2 Spectrum mask
2.1 UTRA spectrum mask
The spectrum emission mask of the MS applies to frequencies, which are between 2.5 MHz and 12.5 MHz away from the MS centre carrier frequency. The out-of-channel emission is specified relative to the root raised cosine (RRC) filtered mean power of the user equipment (UE) carrier, where the RRC filtered mean power is the mean power measured through a root raised cosine filter with a roll-off factor of 0.22 and a bandwidth equal to the chip rate of 3.84 MHz. The power of any UE emission should not exceed the levels specified in Table A1-2.1-a.
The absolute requirement is based on a –48.5 dBm/3.84 MHz minimum power threshold for the UE. This limit is expressed for the narrower measurement bandwidths as –54.3 dBm/1 MHz and

8 Rec. ITU-R M.1581-5
TABLE A1-2.1-a
Spectrum emission mask requirement (UTRA FDD MS)
Δf (MHz)(Note 1)
Minimum requirement (Note 2)Measurement
bandwidth (Note 6)Relative requirementAbsolute requirement
(in measurement bandwidth)
2.5-3.5 {−33 .5−15⋅( ΔfMHz
−2. 5)} dBc –69.6 dBm 30 kHz(Note 4)
3.5-7.5 {−33 .5−1⋅( ΔfMHz
−3. 5)} dBc –54.3 dBm 1 MHz(Note 5)
7.5-8.5 {−37 .5−10⋅( ΔfMHz
−7 .5)} dBc –54.3 dBm 1 MHz(Note 5)
8.5-12.5 –47.5 dBc –54.3 dBm 1 MHz(Note 5)
NOTE 1 – f is the separation between the carrier frequency and the centre of the measurement bandwidth.NOTE 2 – The minimum requirement is calculated from the relative requirement or the absolute requirement, whichever is the higher power.NOTE 3 – The first and last measurement positions with a 30 kHz filter at f equals 2.515 MHz and 3.485 MHz.NOTE 4 – The first and last measurement positions with a 1 MHz filter at f equals 4 MHz and 12 MHz.NOTE 5 – As a general rule, the resolution bandwidth of the measuring equipment should be equal to the measurement bandwidth. However, to improve measurement accuracy, sensitivity and efficiency, the resolution bandwidth may be smaller than the measurement bandwidth. When the resolution bandwidth is smaller than the measurement bandwidth, the result should be integrated over the measurement bandwidth in order to obtain the equivalent noise bandwidth of the measurement bandwidth.
For operation in Bands II, IV, V, X, XII, XIII, XIV and XXV the minimum requirement is calculated from the minimum requirement in Table A1-2.1-a or the applicable additional requirement in Tables A1-2.1-b a), A1-2.1-b b) or A1-2.1-b c), whichever is the tighter requirement.
TABLE A1-2.1-b
a) Additional spectrum emission limits for Bands II, IV, X and XXV
Δf in MHz(Note 1)
Frequency offset of measurement filter centre
frequency, f_offset
Additionalrequirements
Bands II, IV, X
Measurementbandwidth
2.5 MHz f < 3.5 MHz 2.515 MHz f_offset < 3.485 MHz –15 dBm 30 kHz3.5 MHz f 12.5 MHz 4.0 MHz f_offset < 12.0 MHz –13 dBm 1 MHz
NOTE 1 – f is the separation between the carrier frequency and the centre of the measurement bandwidth.

Rec. ITU-R M.1581-5 9
b) Additional spectrum emission limits for Band V
Δf in MHz(Note 1)
Frequency offset ofmeasurement filter centre
frequency, f_offset
Additionalrequirements
Band V
Measurementbandwidth
2.5 MHz f < 3.5 MHz 2.515 MHz f_offset < 3.485 MHz –15 dBm 30 kHz3.5 MHz f 12.5 MHz 3.55 MHz f_offset < 12.45 MHz –13 dBm 100 kHz
NOTE 1 – f is the separation between the carrier frequency and the centre of the measurement bandwidth.
c) Additional spectrum emission limits for Bands XII, XIII, XIV
Δf in MHz(Note 1)
Frequency offset ofmeasurement filter centre
frequency, f_offset
AdditionalrequirementsBands XII, XIII, XIV
Measurementbandwidth
2.5 MHz f < 2.6 MHz 2.515 MHz f_offset < 2.585 MHz –13 dBm 30 kHz2.6 MHz f 12.45 MHz 2.65 MHz f_offset < 12.45 MHz –13 dBm 100 kHz
NOTE 1 – f is the separation between the carrier frequency and the centre of the measurement bandwidth.NOTE – As a general rule, the resolution bandwidth of the measuring equipment should be equal to the measurement bandwidth specified in Tables A1-2.1-b a), A1-2.1-b b) and A1-2.1-b c). However, to improve measurement accuracy, sensitivity and efficiency, the resolution bandwidth may be smaller than the measurement bandwidth. When the resolution bandwidth is smaller than the measurement bandwidth, the result should be integrated over the measurement bandwidth in order to obtain the equivalent noise bandwidth of the measurement bandwidth.
2.1.1 Additional spectrum emission mask for DC-HSUPA
The spectrum emission mask of the UE applies to frequencies, which are between 5 MHz and 20 MHz away from the UE centre frequency of the two assigned channel frequencies. The requirements assume that the UE output power shall be maximum level.
The power of any UE emission shall not exceed the levels specified in Table A1-2.1.1 for the specified channel bandwidth.
TABLE A1-2.1.1
Spectrum emission mask for DC-HSUPA
Δf(MHz)
Spectrum emissionlimit (dBm)
Measurementbandwidth
5-6 –16.5 30 kHz6-10 –8.5 1 MHz10-19 –11.5 1 MHz19-20 –23.5 1 MHz
NOTE – f is the separation between the carrier frequency and the centre of the measurement bandwidth.
2.1.1.1 Additional requirement for bands II, IV, V, X and XXV
The UE shall meet an additional requirement specified in Table A1-2.1.1.1 for Bands II, IV, V, X and XXV.

10 Rec. ITU-R M.1581-5
TABLE A1-2.1.1.1
Additional spectrum emission mask for DC-HSUPA in bands II, IV, V, X and XXV
Δf(MHz)
Spectrum emissionlimit (dBm)
Measurementbandwidth
5-6 –18 30 kHz6-19 –13 1 MHz19-20 –25 1 MHz
NOTE – f is the separation between the carrier frequency and the centre of the measurement bandwidth.
2.2 E-UTRA spectrum mask
The output UE transmitter spectrum consists of the three components; the emission within the occupied bandwidth (channel bandwidth), the OoB emissions and the far-out spurious emission domain (Fig. 1).
The spectrum emission mask of the MS applies to frequencies (ΔfOOB) starting from the ± edges of the assigned E-UTRA channel bandwidth. For frequencies greater than (ΔfOOB) as specified in Table 1a the spurious requirements in § 4 are applicable.
FIGURE 1
2.2.1 E-UTRA spectrum mask
2.2.1.1 General E-UTRA spectrum mask
The power of any MS emission shall not exceed the levels specified in Table A1-2.2.1.1-a or Table A1-2.2.1.1-b for the specified channel bandwidths.

Rec. ITU-R M.1581-5 11
TABLE A1-2.2.1.1-a
E-UTRA spectrum emission mask, E-UTRA bands ≤ 3 GHz
ΔfOOB
(MHz)
Spectrum emission limit (dBm)/channel bandwidth
1.4 MHz 3.0 MHz 5 MHz 10 MHz 15 MHz 20 MHz Measurement bandwidth
0-1 –8.5 –11.5 –13.5 –16.5 –18.5 –19.5 30 kHz1-2.5 –8.5 –8.5 –8.5 –8.5 –8.5 –8.5 1 MHz
2.5-2.8 –23.5 –8.5 –8.5 –8.5 –8.5 –8.5 1 MHz2.8-5 –8.5 –8.5 –8.5 –8.5 –8.5 1 MHz5-6 –23.5 –11.5 –11.5 –11.5 –11.5 1 MHz6-10 –23.5 –11.5 –11.5 –11.5 1 MHz10-15 –23.5 –11.5 –11.5 1 MHz15-20 –23.5 –11.5 1 MHz20-25 –23.5 1 MHz
TABLE A1-2.2.1.1-b
E-UTRA spectrum emission mask, 3 GHz < E-UTRA bands ≤ 4.2 GHz
ΔfOOB
(MHz)
Spectrum emission limit (dBm)/channel bandwidth
1.4 MHz 3.0 MHz 5 MHz 10 MHz 15 MHz 20 MHz Measurement bandwidth
0-1 –8.2 –11.2 –13.2 –16.2 –18.2 –19.2 30 kHz1-2.5 –8.2 –8.2 –8.2 –8.2 –8.2 –8.2 1 MHz
2.5-2.8 –23.2 –8.2 –8.2 –8.2 –8.2 –8.2 1 MHz2.8-5 –8.2 –8.2 –8.2 –8.2 –8.2 1 MHz5-6 –23.2 –11.2 –11.2 –11.2 –11.2 1 MHz6-10 –23.2 –11.2 –11.2 –11.2 1 MHz10-15 –23.2 –11.2 –11.2 1 MHz15-20 –23.2 –11.2 1 MHz20-25 –23.2 1 MHz
NOTE – As a general rule, the resolution bandwidth of the measuring equipment should be equal to the measurement bandwidth. However, to improve measurement accuracy, sensitivity and efficiency, the resolution bandwidth may be smaller than the measurement bandwidth. When the resolution bandwidth is smaller than the measurement bandwidth, the result should be integrated over the measurement bandwidth in order to obtain the equivalent noise bandwidth of the measurement bandwidth.

12 Rec. ITU-R M.1581-5
2.2.1.2 E-UTRA CA spectrum mask
TABLE A1-2.2.1.2-a
General E-UTRA spectrum emission mask for CA, E UTRA bands ≤ 3 GHz
Spectrum emission limit (dBm)/BWChannel_CA
ΔfOOB
(MHz)50RB+100RB
(29.9 MHz)75RB+75RB
(30 MHz)100RB+100RB
(39.8 MHz) Measurement bandwidth
0-1 –22.5+TT –22.5+TT –24+TT 30 kHz
1-5 –10+TT –10+TT –10+TT 1 MHz5-29.9 –13+TT –13+TT –13+TT 1 MHz
29.9-30 –25+TT 1 MHz30-34.9 –25+TT 1 MHz
34.9-35 1 MHz35-39.8 1 MHz
39.8-44.8 –25+TT 1 MHz
TABLE A1-2.2.1.2-b
General E-UTRA spectrum emission mask for CA, 3 GHz < E UTRA bands ≤ 4.2 GHz
Spectrum emission limit (dBm)/BWChannel_CA
ΔfOOB
(MHz)50RB+100RB
(29.9 MHz)75RB+75RB
(30 MHz)100RB+100RB
(39.8 MHz) Measurement bandwidth
0-1 –22.5+TT –22.5+TT –24+TT 30 kHz
1-5 –10+TT –10+TT –10+TT 1 MHz5-29.9 –13+TT –13+TT –13+TT 1 MHz
29.9-30 –25+TT 1 MHz30-34.9 –25+TT 1 MHz
34.9-35 1 MHz35-39.8 1 MHz
39.8-44.8 –25+TT 1 MHz
NOTE 1 − As a general rule, the resolution bandwidth of the measuring equipment should be equal to the measurement bandwidth. However, to improve measurement accuracy, sensitivity and efficiency, the resolution bandwidth may be smaller than the measurement bandwidth. When the resolution bandwidth is smaller than the measurement bandwidth, the result should be integrated over the measurement bandwidth in order to obtain the equivalent noise bandwidth of the measurement bandwidth.NOTE 2 − This value will be developed consequentially from the 3GPP Release 10 Specifications.
2.2.2 Additional E-UTRA spectrum mask
Additional spectrum emission requirements can be signalled by the network to indicate that the UE shall also meet additional requirements in a specific deployment scenario described in Table A1-2.2.2.

Rec. ITU-R M.1581-5 13
TABLE A1-2.2.2
Network signalling for additional spectrum emission requirements
Network signallingvalue
Requirements (subclause) E-UTRA Band Channel bandwidth
(MHz)
NS_01 § 2.2.1.1 (Note 1) All 1.4, 3, 5, 10, 15, 20NS_03 § 2.2.2.1 2, 4, 10, 23, 25, 35, 36 3, 5, 10, 15, 20NS_05 N/A (Note 1) 1 5, 10, 15, 20NS_06 § 2.2.2.3 12, 13, 14, 17 1.4, 3, 5, 10NS_07 § 2.2.2.3 13 10NS_08 N/A (Note 1) 19 10, 15NS_09 N/A (Note 1) 21 10, 15NS_10 20 15, 20NS_11 § 2.2.2.1 23 1.4, 3, 5, 10, 15, 20
– – – –NS_32 – – –
NOTE 1 – The signalling is for purposes other than Additional spectrum mask requirement.NOTE 2 – Applicable E-UTRA band will be addressed at a later stage.NOTE 3 – Applicable channel bandwidths will be addressed at a later stage.
2.2.2.1 Additional E-UTRA spectrum mask with Network Signalled Value of “NS_03”, “NS_11” and “NS_20”
When “NS_03”, “NS_11” or “NS_20” is indicated in the cell, the power of any UE emission shall fulfil requirements in Table A1-2.2.2.1-a or Table A1-2.2.2.1-b.
TABLE A1-2.2.2.1-a
Additional requirements (network signalled value “NS_03”), E-UTRA bands ≤ 3 GHz
Spectrum emission limit (dBm)/Channel bandwidth
ΔfOOB
(MHz) 1.4 MHz 3.0 MHz 5 MHz 10 MHz 15 MHz 20 MHz Measurementbandwidth
0-1 –8.5 –11.5 –13.5 –16.5 –18.5 –19.5 30 kHz1-2.5 –11.5 –11.5 –11.5 –11.5 –11.5 –11.5 1 MHz2.5-5 –23.5 1 MHz5-6 –23.5 1 MHz6-10 –23.5 1 MHz
10-15 –23.5 1 MHz15-20 –23.5 1 MHz20-25 –23.5 1 MHz

14 Rec. ITU-R M.1581-5
TABLE A1-2.2.2.1-b
Additional requirements (network signalled value “NS_03”), 3 GHz < E-UTRA bands ≤ 4.2 GHz
Spectrum emission limit (dBm)/Channel bandwidth
ΔfOOB
(MHz) 1.4 MHz 3.0 MHz 5 MHz 10 MHz 15 MHz 20 MHz Measurementbandwidth
0-1 –8.2 –11.2 –13.2 –16.2 –18.2 –19.2 30 kHz1-2.5 –11.2 –11.2 –11.2 –11.2 –11.2 –11.2 1 MHz2.5-5 –23.2 1 MHz5-6 –23.2 1 MHz6-10 –23.2 1 MHz
10-15 –23.2 1 MHz15-20 –23.2 1 MHz20-25 –23.2 1 MHz
NOTE 1 – The first and last measurement position with a 30 kHz filter is at Δ fOOB equals to 0.015 MHz and 0.985 MHz.NOTE 2 – At the boundary of spectrum emission limit, the first and last measurement position with a 1 MHz filter is the inside of +0.5 MHz and –0.5 MHz, respectively.NOTE 3 – The measurements are to be performed above the upper edge of the channel and below the lower edge of the channel.NOTE 4 – Above SEM requirement applies to bands corresponding to network signalling value NS_03 as defined in Table A1-2.2.2.NOTE 5 – For the 2.5-2.8 MHz offset range with 1.4 MHz channel bandwidth, the measurement position is at ΔfOOB equals to 3 MHz.NOTE – As a general rule, the resolution bandwidth of the measuring equipment should be equal to the measurement bandwidth. However, to improve measurement accuracy, sensitivity and efficiency, the resolution bandwidth may be smaller than the measurement bandwidth. When the resolution bandwidth is smaller than the measurement bandwidth, the result should be integrated over the measurement bandwidth in order to obtain the equivalent noise bandwidth of the measurement bandwidth.
2.2.2.2 Additional E-UTRA spectrum mask with Network Signalled Value of “NS_06” or “NS 07”
When “NS_06” or “NS_07” is indicated in the cell, the power of any UE emission shall fulfil requirements in Table A1-2.2.2.2-a or Table A1-2.2.2.2-b.

Rec. ITU-R M.1581-5 15
TABLE A1-2.2.2.2-a
Additional requirements (network signalled value “NS_06” or “NS_07”), E-UTRA bands ≤ 3 GHz
Spectrum emission limit (dBm)/Channel bandwidth
ΔfOOB
(MHz) 1.4 MHz 3.0 MHz 5 MHz 10 MHz Measurement bandwidth
0-0.1 –11.5 –11.5 –13.5 –16.5 30 kHz0.1-1 –11.5 –11.5 –11.5 –11.5 100 kHz1-2.5 –11.5 –11.5 –11.5 –11.5 1 MHz2.5-5 –23.5 1 MHz5-6 –23.5 1 MHz6-10 –23.5 1 MHz
10-15 –23.5 1 MHz
TABLE A1-2.2.2.2-b
Additional requirements (network signalled value “NS_06” or “NS_07”), 3 GHz < E UTRA bands ≤ 4.2 GHz
Spectrum emission limit (dBm)/Channel bandwidth
ΔfOOB
(MHz) 1.4 MHz 3.0 MHz 5 MHz 10 MHz Measurement bandwidth
0-0.1 –11.2 –11.2 –13.2 –16.2 30 kHz0.1-1 –11.2 –11.2 –11.2 –11.2 100 kHz1-2.5 –11.2 –11.2 –11.2 –11.2 1 MHz2.5-5 –23.2 1 MHz5-6 –23.2 1 MHz6-10 –23.2 1 MHz
10-15 –23.2 1 MHz
NOTE 1 – The first and last measurement position with a 30 kHz filter is at ΔfOOB equals to 0.015 MHz and 0.085 MHz. The first and last measurement position with a 100 kHz filter is at ΔfOOB equals to 0.15 MHz and 0.95 MHz.NOTE 2 – At the boundary of spectrum emission limit, the first and last measurement position with a 1 MHz filter is the inside of +0.5 MHz and –0.5 MHz, respectively.NOTE 3 – The measurements are to be performed above the upper edge of the channel and below the lower edge of the channel.NOTE 4 – Above SEM requirement applies to bands corresponding to network signalling value NS_06 and NS_07 as defined in Table A1-2.2.2.NOTE 5 – For the 2.5-2.8 MHz offset range with 1.4 MHz channel bandwidth, the measurement position is at ΔfOOB equals to 3 MHz.

16 Rec. ITU-R M.1581-5
3 Adjacent channel leakage power ratio (ACLR)
3.1 UTRA ACLR
ACLR is the ratio of the RRC filtered mean power centred on the assigned channel frequency to the RRC filtered mean power centred on an adjacent channel frequency.
The limit for ACLR should be as specified in Table A1-3.1.
TABLE A1-3.1
MS ACLR limits
Power classMS channel offset below the first or above
the last carrier frequency used(MHz)
ACLR limit(dB)
3, 4 5 32.23, 4 10 42.2
NOTE 1 − The requirement shall still be met in the presence of switching transients.NOTE 2 − The ACLR requirements reflect what can be achieved with present state of the art technology.NOTE 3 − Requirement on the UE shall be reconsidered when the state of the art technology progresses.
3.1.1 Additional requirement for DC-HSUPA
If the adjacent channel power is greater than –50 dBm, then the ACLR shall be higher than the value specified in 3GPP TS 25.1011, Table 6.11A. The requirements are applicable for all values of c, hs, ec and ed as specified in 3GPP TS 25.2142. The reference measurement channels for the requirements in 3GPP TS 25.101, subclause 6.6.2.2.1A are provided in subclause A.2.8.
TABLE A1-3.1.1
UE ACLR for DC-HSUPA
Power class Adjacent channel frequency relative to the centre of two assigned channel frequencies ACLR limit
3 +7.5 MHz or –7.5 MHz 32.2 dB3 +12.5 MHz or –12.5 MHz 35.2 dB4 +7.5 MHz or –7.5 MHz 32.2 dB4 +12.5 MHz or –12.5 MHz 35.2 dB
NOTE 1 − The requirement shall still be met in the presence of switching transients.NOTE 2 − The ACLR requirements reflect what can be achieved with present state of the art technology.NOTE 3 − Requirement on the UE shall be reconsidered when the state of the art technology progresses.
1 3GPP TS 25.101: 3rd Generation Partnership Project; Technical Specification Group Radio Access Network; User Equipment (UE) radio transmission and reception (FDD).
2 3GPP TS 25.214: 3rd Generation Partnership Project; Technical Specification Group Radio Access Network; Physical layer procedures (FDD).

Rec. ITU-R M.1581-5 17
3.2 E-UTRA ACLR
ACLR is the ratio of the filtered mean power centred on the assigned channel frequency to the filtered mean power centred on an adjacent channel frequency. The ACLR requirements are specified for two scenarios: for (an) adjacent E-UTRA and/or UTRA channels (see Fig. 2).
FIGURE 2
3.2.1 Limits for E-UTRA
E-UTRA adjacent channel leakage power ratio (E-UTRAACLR) is the ratio of the filtered mean power centred on the assigned channel frequency to the filtered mean power centred on an adjacent channel frequency. The E-UTRA on channel and adjacent channel power is measured with a rectangular measurement bandwidth filter. If the measured adjacent channel power is greater than 50 dBm then the measured E-UTRAACLR shall be higher than the limits in Table A1-3.2.1.
TABLE A1-3.2.1
General requirements for E-UTRAACLR
Channel bandwidth/E-UTRAACLR1/measurement bandwidth
1.4 MHz 3.0 MHz 5 MHz 10 MHz 15 MHz 20 MHz
E-UTRAACLR1 29.2 dB 29.2 dB 29.2 dB 29.2 dB 29.2 dB 29.2 dB
E-UTRA channel measurement bandwidth
1.08 MHz 2.7 MHz 4.5 MHz 9.0 MHz 13.5 MHz 18 MHz
UE channel +1.4 MHz or–1.4 MHz
+3 MHz or–3 MHz
+5 MHz or5 MHz
+10 MHz or 10 MHz
+15 MHz or 15 MHz
+20 MHz or 20 MHz
3.2.2 Limits for E-UTRA for UTRA coexistence in the same geographical area
For adjacent UTRA carriers the limits should be as specified in Table A1-3.2.2.
UTRA adjacent channel leakage power ratio (UTRAACLR) is the ratio of the filtered mean power centred on the assigned E-UTRA channel frequency to the filtered mean power centred on an adjacent(s) UTRA channel frequency.
UTRA adjacent channel leakage power ratio is specified for both the first UTRA 5 MHz adjacent channel (UTRAACLR1) and the 2nd UTRA 5 MHz adjacent channel (UTRAACLR2). The UTRA channel is measured with a 3.84 MHz RRC bandwidth filter with roll-off factor = 0.22. The E-UTRA channel is measured with a rectangular measurement bandwidth filter. If the

18 Rec. ITU-R M.1581-5
measured UTRA channel power is greater than –50 dBm then the measured UTRAACLR1, UTRAACLR2
shall be higher than the limits in Table A1-3.2.2.
TABLE A1-3.2.2
Additional requirements
Channel bandwidth/UTRAACLR1/2/measurement bandwidth
1.4 MHz 3.0 MHz 5 MHz 10 MHz 15 MHz 20 MHz
UTRAACLR1 32.2 dB 32.2 dB 32.2 dB 32.2 dB 32.2 dB 32.2 dB
Adjacent channel centre frequency offset (MHz)
0.7+ BWUTRA/2/
–0.7- BWUTRA/2
1.5+ BWUTRA/2/
1.5- BWUTRA/2
+2.5+BWUTRA/2/–2.5+BWUTRA/2
5+BWUTRA/2/5+ BWUTRA/2
7.5+BWUTRA/2/–7.5+
BWUTRA/2
10+BWUTRA/2/–10+
BWUTRA/2
UTRAACLR2 – – 35.2 dB 35.2 dB 35.2 dB 35.2 dB
Adjacent channel centre frequency offset (MHz)
– –
2.5+3*BWUTRA/2/–2.5+
3*BWUTRA/2
5+3*BWUTRA/2/–5+
3*BWUTRA/2
7.5+3*BWUTRA/2/–7.5+
3*BWUTRA/2
10+3*BWUTRA/
2/10+ 3*BWUTRA/2
E-UTRA channel measurement bandwidth
1.08 MHz 2.7 MHz 4.5 MHz 9.0 MHz 13.5 MHz 18 MHz
UTRA 5 MHz channel measurement bandwidth(1)
3.84 MHz 3.84 MHz 3.84 MHz 3.84 MHz 3.84 MHz 3.84 MHz
UTRA 1.6 MHz channel measurement bandwidth(2)
1.28 MHz 1.28 MHz 1.28 MHz 1.28 MHz 1.28 MHz 1.28 MHz
(1) Applicable for E-UTRA FDD coexistence with UTRA FDD in paired spectrum.(2) Applicable for E-UTRA TDD coexistence with UTRA TDD in unpaired spectrum.
3.2.2.1 Requirement UTRA for CA
For intra-band contiguous carrier aggregation the UTRAACLR is the ratio of the filtered mean power centred on the aggregated channel bandwidth to the filtered mean power centred on an adjacent(s) UTRA channel frequency.
UTRAACLR is specified for both the first UTRA adjacent channel (UTRAACLR1) and the 2nd UTRA adjacent channel (UTRAACLR2). The UTRA channel power is measured with a RRC bandwidth filter with roll-off factor = 0.22. The assigned aggregated channel bandwidth power is measured with a rectangular filter with measurement bandwidth specified in Table A1-3.2.2.1. If the measured UTRA channel power is greater than –50 dBm then the UTRAACLR shall be higher than the value specified in Table A1-3.2.2.1.

Rec. ITU-R M.1581-5 19
TABLE A1-3.2.2.1
Requirements for UTRAACLR1/2
CA bandwidth class/UTRAACLR1/2 / measurement bandwidth
CA bandwidth class C
UTRAACLR1 33 dB
Adjacent channel centre frequency offset (MHz)
+BWChannel_CA /2 + BWUTRA/2/
–BWChannel_CA /2 – BWUTRA/2UTRAACLR2 36 dB
Adjacent channel centre frequency offset (MHz)
+BWChannel_CA /2 + 3*BWUTRA/2/
–BWChannel_CA /2 – 3*BWUTRA/2
CA E-UTRA channel Measurement bandwidth BWChannel_CA – 2* BWGB
UTRA 5 MHz channel Measurement bandwidth (Note 1) 3.84 MHz
UTRA 1.6 MHz channel measurement bandwidth (Note 2) 1.28 MHz
NOTE 1 − Applicable for E-UTRA FDD co-existence with UTRA FDD in paired spectrum.NOTE 2 − Applicable for E-UTRA TDD co-existence with UTRA TDD in unpaired spectrum.
3.2.2.2 Minimum requirements for CA E-UTRA
For intra-band contiguous carrier aggregation the carrier aggregation E-UTRA Adjacent Channel Leakage power Ratio (CA E-UTRAACLR) is the ratio of the filtered mean power centred on the aggregated channel bandwidth to the filtered mean power centred on an adjacent aggregated channel bandwidth at nominal channel spacing. The assigned aggregated channel bandwidth power and adjacent aggregated channel bandwidth power are measured with rectangular filters with measurement bandwidths specified in Table A1-3.2.2.2. If the measured adjacent channel power is greater than –50 dBm then the E-UTRAACLR shall be higher than the value specified in Table A1-3.2.2.2.
TABLE A1-3.2.2.2
General requirements for CA E-UTRAACLR
CA bandwidth class / CA E-UTRAACLR / Measurement bandwidth
CA bandwidth class C
CA E-UTRAACLR 30 dBCA E-UTRA channel
Measurement bandwidth BWChannel_CA – 2* BWGB
Adjacent channel centre frequency offset (MHz)
+ BWChannel_CA
/– BWChannel_CA

20 Rec. ITU-R M.1581-5
3.2.3 Additional ACLR limits for UTRA
In case of DC-HSUPA operation, if the adjacent channel power is greater than –50 dBm then the ACLR shall be higher than the value specified in Table A1-3.2.3.
TABLE A1-3.2.3
UE ACLR for DC-HSUPA
Power classAdjacent channel frequency relative to
the centre of two assigned channel frequencies
ACLR limit
3, 4 +7.5 MHz or –7.5 MHz 32.2 dB3, 4 +12.5 MHz or –12.5 MHz 35.2 dB
NOTE 1 – The requirement shall still be met in the presence of switching transients.NOTE 2 – The ACLR requirements reflect what can be achieved with present state of the art technology.NOTE 3 – Requirement on the UE shall be reconsidered when the state of the art technology progresses.
4 Transmitter spurious emissions (conducted)
4.1 Transmitter spurious emissions for UTRA
For UTRA, the limits shown in Tables A1-4.1-a and A1-4.1-b are only applicable for frequencies which are greater than 12.5 MHz away from the MS centre carrier frequency.
TABLE A1-4.1-a
General spurious emissions requirements
Frequency bandwidth Measurement bandwidth Minimum requirement(dBm) Note
9 kHz f < 150 kHz 1 kHz –36150 kHz f < 30 MHz 10 kHz –36
30 MHz f < 1 000 MHz 100 kHz –361 GHz f < 12.75 GHz 1 MHz –30
12.75 GHz f < 5th harmonic of the upper frequency edge of the UL operating band in GHz
1 MHz –30 Note 1
NOTE 1 − Applies only for Band XXII.

Rec. ITU-R M.1581-5 21
TABLE A1-4.1-b
Additional spurious emissions requirements for UTRA
Operatingband Frequency bandwidth Measurement
bandwidth Minimum requirement
I 791 MHz f 821 MHz 3.84 MHz –60 dBm860 MHz f 894 MHz 3.84 MHz –60 dBm
921 MHz f < 925 MHz 100 kHz –60 dBm (Note 1)925 MHz f 935 MHz 100 kHz
3.84 MHz–67 dBm (Note 1)
–60 dBm935 MHz < f 960 MHz 100 kHz –79 dBm (Note 1)
1 475.9 MHz f 1 510.9 MHz 3.84 MHz –60 dBm1 805 MHz f 1 880 MHz 100 kHz –71 dBm (Note 1)
1 839.9 MHz f 1 879.9 MHz 3.84 MHz –60 dBm1 884.5 MHz < f < 1 915.7 MHz 300 kHz –41 dBm
2 110 MHz f 2 170 MHz 3.84 MHz –60 dBm2 585 MHz f 2 690 MHz 3.84 MHz –60 dBm
3 510 MHz f < 3 590 MHz 3.84 MHz –60 dBm3 400 MHz f < 3 800 MHz 1 MHz –50 dBm
II 729 MHz f 746 MHz 3.84 MHz –60 dBm746 MHz f 758 MHz 3.84 MHz –60 dBm
758 MHz f 768 MHz 3.84 MHz –60 dBm869 MHz f 894 MHz 3.84 MHz –60 dBm
1 525 MHz f 1 559 MHz 1 MHz –50 dBm1 930 MHz f 1 995 MHz 3.84 MHz –60 dBm
2 110 MHz f 2 170 MHz 3.84 MHz –60 dBm2 180 MHz f 2 200 MHz 1 MHz –50 dBm
3 510 MHz f 3 590 MHz 3.84 MHz –60 dBm3 400 MHz f 3 800 MHz 1 MHz –50 dBm (Note 2)
III 791 MHz f 821 MHz 3.84 MHz –60 dBm860 MHz f 890 MHz 3.84 MHz –60 dBm (Note 5)
921 MHz f < 925 MHz 100 kHz –60 dBm (Note 1)925 MHz f 935 MHz 100 kHz
3.84 MHz–67 dBm (Note 1)
–60 dBm935 MHz < f 960 MHz 100 kHz –79 dBm (Note 1)
1 475.9 MHz f 1 510.9 MHz 3.84 MHz –60 dBm (Note 5)1 805 MHz f 1 880 MHz 3.84 MHz –60 dBm
1 884.5 MHz f 1 915.7 MHz 300 kHz –41 dBm (Note 5)2 110 MHz f 2 170 MHz 3.84 MHz –60 dBm
2 585 MHz f 2 690 MHz 3.84 MHz –60 dBm3 510 MHz f 3 590 MHz 3.84 MHz –60 dBm (Note 2)
3 400 MHz f 3 800 MHz 1 MHz –50 dBm (Note 2)

22 Rec. ITU-R M.1581-5
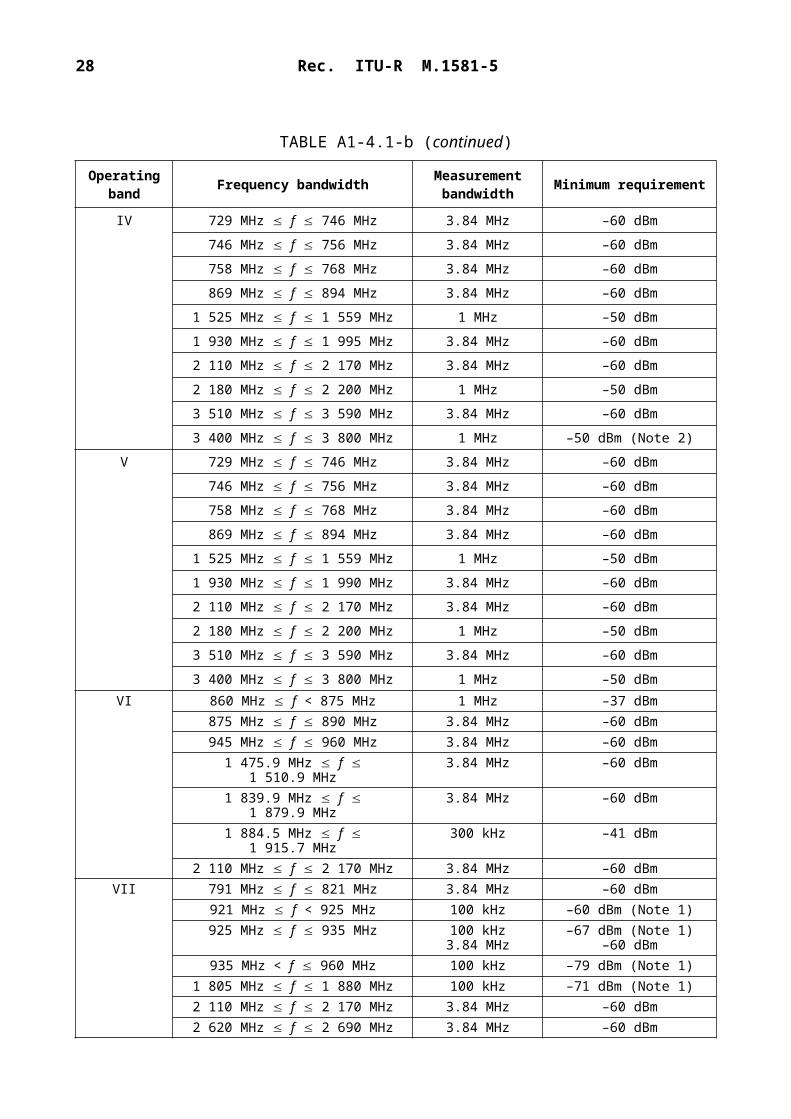
TABLE A1-4.1-b (continued)
Operatingband Frequency bandwidth Measurement
bandwidth Minimum requirement
IV 729 MHz f 746 MHz 3.84 MHz –60 dBm746 MHz f 756 MHz 3.84 MHz –60 dBm
758 MHz f 768 MHz 3.84 MHz –60 dBm869 MHz f 894 MHz 3.84 MHz –60 dBm
1 525 MHz f 1 559 MHz 1 MHz –50 dBm1 930 MHz f 1 995 MHz 3.84 MHz –60 dBm
2 110 MHz f 2 170 MHz 3.84 MHz –60 dBm2 180 MHz f 2 200 MHz 1 MHz –50 dBm
3 510 MHz f 3 590 MHz 3.84 MHz –60 dBm3 400 MHz f 3 800 MHz 1 MHz –50 dBm (Note 2)
V 729 MHz f 746 MHz 3.84 MHz –60 dBm746 MHz f 756 MHz 3.84 MHz –60 dBm
758 MHz f 768 MHz 3.84 MHz –60 dBm869 MHz f 894 MHz 3.84 MHz –60 dBm
1 525 MHz f 1 559 MHz 1 MHz –50 dBm1 930 MHz f 1 990 MHz 3.84 MHz –60 dBm
2 110 MHz f 2 170 MHz 3.84 MHz –60 dBm2 180 MHz f 2 200 MHz 1 MHz –50 dBm
3 510 MHz f 3 590 MHz 3.84 MHz –60 dBm3 400 MHz f 3 800 MHz 1 MHz –50 dBm
VI 860 MHz f < 875 MHz 1 MHz –37 dBm875 MHz f 890 MHz 3.84 MHz –60 dBm945 MHz f 960 MHz 3.84 MHz –60 dBm
1 475.9 MHz f 1 510.9 MHz 3.84 MHz –60 dBm1 839.9 MHz f 1 879.9 MHz 3.84 MHz –60 dBm1 884.5 MHz f 1 915.7 MHz 300 kHz –41 dBm
2 110 MHz f 2 170 MHz 3.84 MHz –60 dBmVII 791 MHz f 821 MHz 3.84 MHz –60 dBm
921 MHz f < 925 MHz 100 kHz –60 dBm (Note 1)925 MHz f 935 MHz 100 kHz
3.84 MHz–67 dBm (Note 1)
–60 dBm935 MHz < f 960 MHz 100 kHz –79 dBm (Note 1)
1 805 MHz f 1 880 MHz 100 kHz –71 dBm (Note 1)2 110 MHz f 2 170 MHz 3.84 MHz –60 dBm2 620 MHz f 2 690 MHz 3.84 MHz –60 dBm2 590 MHz f 2 620 MHz 3.84 MHz –50 dBm3 510 MHz f 3 590 MHz 3.84 MHz –60 dBm3 400 MHz f 3 800 MHz 1 MHz –50 dBm

Rec. ITU-R M.1581-5 23
TABLE A1-4.1-b (continued)
Operatingband Frequency bandwidth Measurement
bandwidth Minimum requirement
VIII 791 MHz f 821 MHz 3.84 MHz –60 dBm860 MHz f 890 MHz 1 MHz –37 dBm (Note 5)925 MHz f 935 MHz 100 kHz
3.84 MHz–67 dBm (Note 1)
–60 dBm935 MHz < f 960 MHz 100 kHz
3.84 MHz–79 dBm (Note 1)
–60 dBm1 475.9 MHz f 1 510.9 MHz 3.84 MHz –60 dBm (Note 4)
1 805 MHz < f 1 830 MHz 100 kHz3.84 MHz
–71 dBm (Notes 1and 2)–60 dBm (Note 2)
1 830 MHz < f 1 880 MHz 100 kHz3.84 MHz
–71 dBm (Note 1)–60 dBm
1 884.5 MH f 1 915.7 MHz 300 kHz –41 dBm (Note 4)2 110 MHz f 2 170 MHz 3.84 MHz –60 dBm2 585 MHz f 2 640 MHz 3.84 MHz –60 dBm2 640 MHz < f 2 690 MHz 3.84 MHz –60 dBm (Note 2)3 510 MHz f 3 590 MHz 3.84 MHz –60 dBm (Note 2)3 400 MHz f 3 800 MHz 1 MHz –50 dBm (Note 2)
IX 860 MHz f 890 MHz 3.84 MHz –60 dBm945 MHz f 960 MHz 3.84 MHz –60 dBm
1 475.9 MHz f 1 510.9 MHz 3.84 MHz –60 dBm1 839.9 MHz f 1 879.9 MHz 3.84 MHz –60 dBm1 884.5 MHz f 1 915.7 MHz 300 kHz –41 dBm
2 110 MHz f 2 170 MHz 3.84 MHz –60 dBm
X 729 MHz f 746 MHz 3.84 MHz –60 dBm746 MHz f 756 MHz 3.84 MHz –60 dBm
758 MHz f 768 MHz 3.84 MHz –60 dBm869 MHz f 894 MHz 3.84 MHz –60 dBm
1 525 MHz f 1 559 MHz 1 MHz –50 dBm1 930 MHz f 1 995 MHz 3.84 MHz –60 dBm
2 110 MHz f 2 170 MHz 3.84 MHz –60 dBm2 180 MHz f 2 200 MHz 1 MHz –50 dBm
3 510 MHz f 3 590 MHz 3.84 MHz –60 dBm (Note 2)3 400 MHz f 3 800 MHz 1 MHz –50 dBm (Note 2)
XI 860 MHz f 890 MHz 3.84 MHz –60 dBm945 MHz f 960 MHz 3.84 MHz –60 dBm
1 475.9 MHz f 1 510.9 MHz 3.84 MHz –60 dBm1 839.9 MHz f 1 879.9 MHz 3.84 MHz –60 dBm
1 884.5 MHz f 1 915.7 MHz 300 kHz –41 dBm2 110 MHz f 2 170 MHz 3.84 MHz –60 dBm

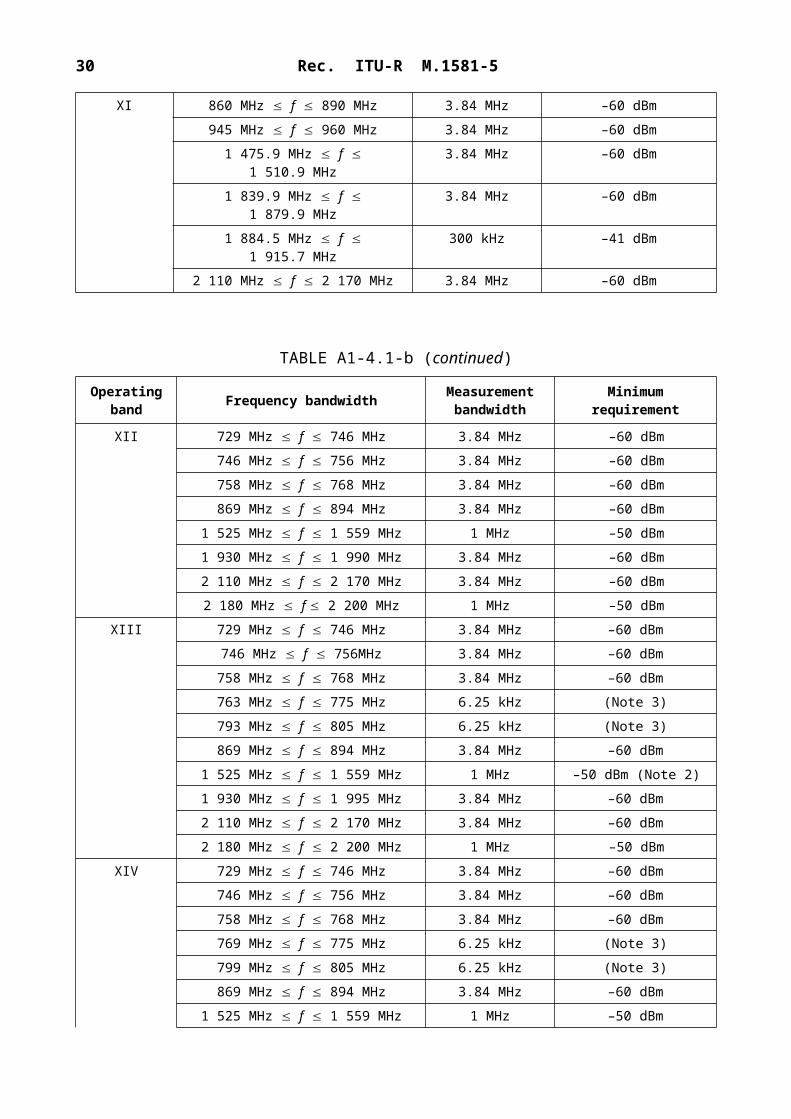
24 Rec. ITU-R M.1581-5
TABLE A1-4.1-b (continued)
Operatingband Frequency bandwidth Measurement
bandwidth Minimum requirement
XII 729 MHz f 746 MHz 3.84 MHz –60 dBm746 MHz f 756 MHz 3.84 MHz –60 dBm
758 MHz f 768 MHz 3.84 MHz –60 dBm869 MHz f 894 MHz 3.84 MHz –60 dBm
1 525 MHz f 1 559 MHz 1 MHz –50 dBm1 930 MHz f 1 990 MHz 3.84 MHz –60 dBm
2 110 MHz f 2 170 MHz 3.84 MHz –60 dBm2 180 MHz f 2 200 MHz 1 MHz –50 dBm
XIII 729 MHz f 746 MHz 3.84 MHz –60 dBm746 MHz f 756MHz 3.84 MHz –60 dBm
758 MHz f 768 MHz 3.84 MHz –60 dBm763 MHz f 775 MHz 6.25 kHz (Note 3)
793 MHz f 805 MHz 6.25 kHz (Note 3)869 MHz f 894 MHz 3.84 MHz –60 dBm
1 525 MHz f 1 559 MHz 1 MHz –50 dBm (Note 2)1 930 MHz f 1 995 MHz 3.84 MHz –60 dBm
2 110 MHz f 2 170 MHz 3.84 MHz –60 dBm2 180 MHz f 2 200 MHz 1 MHz –50 dBm
XIV 729 MHz f 746 MHz 3.84 MHz –60 dBm746 MHz f 756 MHz 3.84 MHz –60 dBm
758 MHz f 768 MHz 3.84 MHz –60 dBm769 MHz f 775 MHz 6.25 kHz (Note 3)
799 MHz f 805 MHz 6.25 kHz (Note 3)869 MHz f 894 MHz 3.84 MHz –60 dBm
1 525 MHz f 1 559 MHz 1 MHz –50 dBm1 930 MHz f 1 995 MHz 3.84 MHz –60 dBm
2 110 MHz f 2 170 MHz 3.84 MHz –60 dBm2 180 MHz f 2 200 MHz 1 MHz –50 dBm
XIX 860 MHz f 875 MHz 1 MHz –37 dBm875 MHz f 890 MHz 3.84 MHz –60 dBm
945 MHz f 960 MHz 3.84 MHz –60 dBm1 475.9 MHz f 1 510.9 MHz 3.84 MHz –60 dBm
1 839.9 MHz f 1 879.9 MHz 3.84 MHz –60 dBm1 884.5 MHz f 1 915.7 MHz 300 kHz –41 dBm
2 110 MHz f 2 170 MHz 3.84 MHz –60 dBm

Rec. ITU-R M.1581-5 25
TABLE A1-4.1-b (continued)
Operatingband Frequency bandwidth Measurement
bandwidth Minimum requirement
XX 791 MHz f 821 MHz 3.84 MHz –60 dBm921 MHz f < 925 MHz 100 kHz –60 dBm (Note 1)
925 MHz f 935 MHz 100 kHz3.84 MHz
–67 dBm (Note 1)–60 dBm
935 MHz < f 960 MHz 100 kHz –79 dBm (Note 1)1 805 MHz f 1 880 MHz 100 kHz –71 dBm (Note 1)
2 110 MHz f 2 170 MHz 3.84 MHz –60 dBm2 620 MHz f 2 690 MHz 3.84 MHz –60 dBm
2 590 MHz f 2 620 MHz 3.84 MHz –50 dBm3 510 MHz f 3 590 MHz 3.84 MHz –60 dBm
3 400 MHz f 3 800 MHz 1 MHz –50 dBm (Note 2)XXI 860 MHz f 890 MHz 3.84 MHz –60 dBm
945 MHz f 960 MHz 3.84 MHz –60 dBm1 475.9 MHz f 1 510.9 MHz 1 MHz –35 dBm
1 839.9 MHz f 1 879.9 MHz 3.84 MHz –60 dBm1 884.5 MHz f 1 915.7 MHz 300 kHz –41 dBm
2 110 MHz f 2 170 MHz 3.84 MHz –60 dBmXXII 791 MHz f 821 MHz 3.84 MHz –60 dBm
921 MHz f < 925 MHz 100 kHz –60 dBm (Note 1)925 MHz f 935 MHz 100 kHz
3.84 MHz–67 dBm (Note 1)
–60 dBm935 MHz < f 960 MHz 100 kHz –79 dBm (Note 1)
1 805 MHz f 1 880 MHz 100 kHz –71 dBm (Note 1)1 880 MHz f 1 920 MHz 3.84 MHz –60 dBm
2 010 MHz f 2 025 MHz 3.84 MHz –60 dBm2 110 MHz f 2 170 MHz 3.84 MHz –60 dBm
2 300 MHz f 2 400 MHz 3.84 MHz –60 dBm2 620 MHz f 2 690 MHz 3.84 MHz –60 dBm
2 590 MHz f 2 620 MHz 3.84 MHz –50 dBm3 510 MHz f 3 525 MHz 1 MHz –40 dBm
3 525 MHz f 3 590 MHz 1 MHz –50 dBm3 600 MHz f 3 800 MHz 3.84 MHz –50 dBm
TABLE A1-4.1-b (end)
Operatingband Frequency bandwidth Measurement
bandwidth Minimum requirement
XXV 729 MHz f 746 MHz 3.84 MHz –60 dBm746 MHz f 756 MHz 3.84 MHz –60 dBm
758 MHz f 768 MHz 3.84 MHz –60 dBm869 MHz f 894 MHz 3.84 MHz –60 dBm

26 Rec. ITU-R M.1581-5
1 525 MHz f 1 559 MHz 3.84 MHz –60 dBm1 930 MHz f 1 995 MHz 3.84 MHz –60 dBm
2 110 MHz f 2 170 MHz 3.84 MHz –60 dBm2 180 MHz f 2 200 MHz 1 MHz –50 dBm
2 496 MHz f 2 690 MHz 1 MHz –50 dBm3 510 MHz f 3 590 MHz 3.84 MHz –60 dBm
3 400 MHz f 3 800 MHz 1 MHz –50 dBm (Note 2)
NOTE 1 – The measurements are made on frequencies which are integer multiples of 200 kHz. As exceptions, up to five measurements with a level up to the applicable requirements defined in Table 3 are permitted for each UARFCN used in the measurement.NOTE 2 – The measurements are made on frequencies which are integer multiples of 200 kHz. As exceptions, measurements with a level up to the applicable requirements defined in Table 3 are permitted for each UARFCN used in the measurement due to 2nd, 3rd and 4th harmonic spurious emissions.NOTE 3 – This requirement is under evaluation and is applicable also for frequencies, which are between 2.5 MHz and 12.5 MHz away from the UE centre carrier frequency.NOTE 4 – This requirement is applicable only when transmission is made between 900 MHz to 915 MHz.NOTE 5 – This requirement is applicable only when transmission is made between 1 744.9 MHz to 1 784.9 MHz.
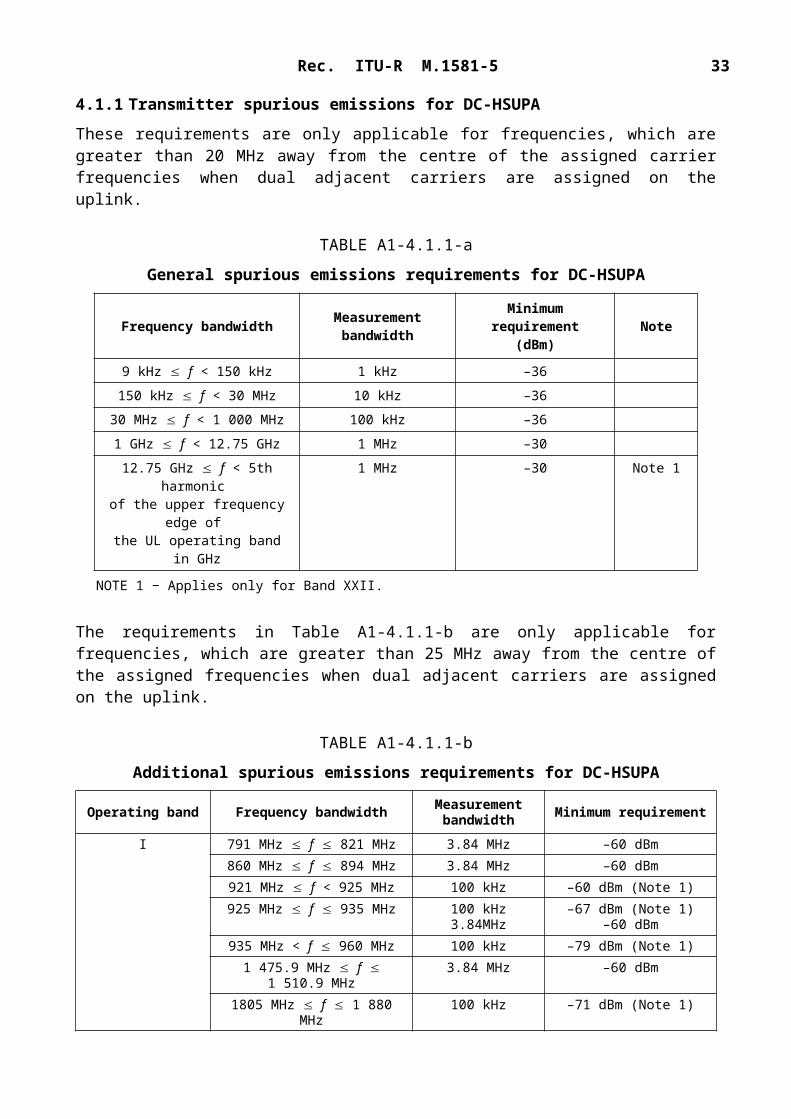
4.1.1 Transmitter spurious emissions for DC-HSUPA
These requirements are only applicable for frequencies, which are greater than 20 MHz away from the centre of the assigned carrier frequencies when dual adjacent carriers are assigned on the uplink.
TABLE A1-4.1.1-a
General spurious emissions requirements for DC-HSUPA
Frequency bandwidth Measurement bandwidth
Minimum requirement(dBm) Note
9 kHz f < 150 kHz 1 kHz –36150 kHz f < 30 MHz 10 kHz –36
30 MHz f < 1 000 MHz 100 kHz –361 GHz f < 12.75 GHz 1 MHz –30
12.75 GHz f < 5th harmonic of the upper frequency edge of the UL operating band in GHz
1 MHz –30 Note 1
NOTE 1 − Applies only for Band XXII.
The requirements in Table A1-4.1.1-b are only applicable for frequencies, which are greater than 25 MHz away from the centre of the assigned frequencies when dual adjacent carriers are assigned on the uplink.
TABLE A1-4.1.1-b
Additional spurious emissions requirements for DC-HSUPA
Operating band Frequency bandwidth Measurement bandwidth Minimum requirement
I 791 MHz f 821 MHz 3.84 MHz –60 dBm
860 MHz f 894 MHz 3.84 MHz –60 dBm

Rec. ITU-R M.1581-5 27
921 MHz f < 925 MHz 100 kHz –60 dBm (Note 1)
925 MHz f 935 MHz 100 kHz3.84MHz
–67 dBm (Note 1)–60 dBm
935 MHz < f 960 MHz 100 kHz –79 dBm (Note 1)
1 475.9 MHz f 1 510.9 MHz 3.84 MHz –60 dBm
1805 MHz f 1 880 MHz 100 kHz –71 dBm (Note 1)
1 844.9 MHz f 1 879.9 MHz 3.84 MHz –55 dBm
1 884.5 MHz < f < 1 915.7 MHz 300 kHz –41 dBm
2 110 MHz f 2 170 MHz 3.84 MHz –60 dBm
2 620 MHz f 2 690 MHz 3.84 MHz –60 dBm
3 510 MHz f 3 590 MHz 3.84 MHz –60 dBm
3 400 MHz f 3 800 MHz 1 MHz –50 dBm
II 729 MHz f 746 MHz 3.84 MHz –60 dBm
746 MHz f 758 MHz 3.84 MHz –60 dBm
758 MHz f 768 MHz 3.84 MHz –60 dBm
869 MHz f 894 MHz 3.84 MHz –60 dBm
1 525 MHz f 1 559 MHz 1 MHz –50 dBm
1 930 MHz f 1 995 MHz 3.84 MHz –60 dBm
2 110 MHz f 2 170 MHz 3.84 MHz –60 dBm
2 180 MHz f 2 200 MHz 1 MHz –50 dBm
III 791 MHz f 821 MHz 3.84 MHz –60 dBm
921 MHz f < 925 MHz 100 kHz –60 dBm (Note 1)
925 MHz f 935 MHz 100 kHz3.84 MHz
–67 dBm (Note 1)–60 dBm
935 MHz < f 960 MHz 100 kHz –79 dBm (Note 1)
1 805 MHz f 1 880 MHz 3.84 MHz –60 dBm
2 110 MHz f 2 170 MHz 3.84 MHz –60 dBm
2 620 MHz f 2 690 MHz 3.84 MHz –60 dBm
3 510 MHz f 3 590 MHz 3.84 MHz –60 dBm (Note 2)
3 400 MHz f 3 800 MHz 1 MHz –50 dBm (Note 2)
IV 729 MHz f 746 MHz 3.84 MHz –60 dBm
746 MHz f 756 MHz 3.84 MHz –60 dBm
758 MHz f 768 MHz 3.84 MHz –60 dBm
869 MHz f 894 MHz 3.84 MHz –60 dBm
1 525 MHz f 1 559 MHz 1 MHz –50 dBm
1 930 MHz f 1 995 MHz 3.84 MHz –60 dBm
2 110 MHz f 2 170 MHz 3.84 MHz –60 dBm
2 180 MHz f 2 200 MHz 1 MHz –50 dBm
TABLE A1-4.1.1-b (continued)
Operating band Frequency bandwidth Measurement bandwidth Minimum requirement
V 729 MHz f 746 MHz 3.84 MHz –60 dBm746 MHz f 756 MHz 3.84 MHz –60 dBm

28 Rec. ITU-R M.1581-5
758 MHz f 768 MHz 3.84 MHz –60 dBm869 MHz f 894 MHz 3.84 MHz –60 dBm
1 525 MHz f 1 559 MHz 1 MHz –50 dBm1 930 MHz f 1 995 MHz 3.84 MHz –60 dBm
2 110 MHz f 2 170 MHz 3.84 MHz –60 dBm2 180 MHz f 2 200 MHz 1 MHz –50 dBm
VI 860 MHz f < 875 MHz 1 MHz –37 dBm875 MHz f 890 MHz 3.84 MHz –60 dBm
1 475.9 MHz f 1 510.9 MHz 3.84 MHz –60 dBm1 844.9 MHz f 1 879.9 MHz 3.84 MHz –60 dBm
1 884.5 MHz f 1 915.7 MHz 300 kHz –41 dBm2 110 MHz f 2 170 MHz 3.84 MHz –60 dBm
VII 791 MHz f 821 MHz 3.84 MHz –60 dBm921 MHz f < 925 MHz 100 kHz –60 dBm (Note 1)
925 MHz f 935 MHz 100 kHz3.84 MHz
–67 dBm (Note 1)–60 dBm
935 MHz < f 960 MHz 100 kHz –79 dBm (Note 1)1 805 MHz f 1 880 MHz 100 kHz –71 dBm (Note 1)
2 110 MHz f 2 170 MHz 3.84 MHz –60 dBm2 620 MHz f 2 690 MHz 3.84 MHz –60 dBm
2 590 MHz f 2 620 MHz 1 MHz –37 dBmVIII 791 MHz f 821 MHz 3.84 MHz –60 dBm
925 MHz f 935 MHz 100 kHz3.84 MHz
–57 dBm (Note 1), (Note 3)–50 dBm
935 MHz < f 960 MHz 100 kHz3.84 MHz
–79 dBm (Note 1)–60 dBm
1805 MHz < f 1830 MHz 100 kHz3.84 MHz
–71 dBm (Note 1), (Note 2)–60 dBm (Note 2)
1 830 MHz < f 1 880 MHz 100 kHz3.84 MHz
–71 dBm (Note 1)–60 dBm
2 110 MHz f 2 170 MHz 3.84 MHz –60 dBm
2 620 MHz f 2 640 MHz 3.84 MHz –60 dBm2 640 MHz < f 2 690 MHz 3.84 MHz –60 dBm (Note 2)
3 510 MHz f 3 590 MHz 3.84 MHz –60 dBm (Note 2)3 400 MHz f 3 800 MHz 1 MHz –50 dBm (Note 2)
TABLE A1-4.1.1-b (continued)
Operating band Frequency bandwidth Measurement bandwidth Minimum requirement
IX 860 MHz f 890 MHz 3.84 MHz –60 dBm1 475.9 MHz f 1 510.9 MHz 3.84 MHz –60 dBm
1 844.9 MHz f 1 879.9 MHz 3.84 MHz –60 dBm1 884.5 MHz f 1 915.7 MHz 300 kHz –41 dBm
2 110 MHz f 2 170 MHz 3.84 MHz –60 dBmX 729 MHz f 746 MHz 3.84 MHz –60 dBm
Rec. ITU-R M.1581-5 29
746 MHz f 756 MHz 3.84 MHz –60 dBm758 MHz f 768 MHz 3.84 MHz –60 dBm
869 MHz f 894 MHz 3.84 MHz –60 dBm1 525 MHz f 1 559 MHz 1 MHz –50 dBm
1 930 MHz f 1 995 MHz 3.84 MHz –60 dBm2 110 MHz f 2 170 MHz 3.84 MHz –60 dBm
2 180 MHz f 2 200 MHz 1 MHz –50 dBmXI 860 MHz f 890 MHz 3.84 MHz –60 dBm
1 475.9 MHz f 1 510.9 MHz 3.84 MHz –60 dBm1 844.9 MHz f 1 879.9 MHz 3.84 MHz –60 dBm
1 884.5 MHz f 1 915.7 MHz 300 kHz –41 dBm2 110 MHz f 2 170 MHz 3.84 MHz –60 dBm
XIX 860 MHz f < 875 MHz 1 MHz –30 dBm875 MHz f 890 MHz 3.84 MHz –60 dBm
1 475.9 MHz f 1 510.9 MHz 3.84 MHz –60 dBm1 844.9 MHz f 1 879.9 MHz 3.84 MHz –60 dBm
1 884.5 MHz f 1 915.7 MHz 300 kHz –41 dBm2 110 MHz f 2 170 MHz 3.84 MHz –60 dBm
XX 811 MHz f 821 MHz 3.84 MHz –50 dBm (Note 3)791 MHz f 811 MHz 3.84 MHz –60 dBm
921 MHz f < 925 MHz 100 kHz –60 dBm (Note 1)925 MHz f 935 MHz 100 kHz
3.84 MHz–67 dBm (Note 1)
–60 dBm935 MHz < f 960 MHz 100 kHz –79 dBm (Note 1)
1 805 MHz f 1 880 MHz 100 kHz –71 dBm (Note 1)2 110 MHz f 2 170 MHz 3.84 MHz –60 dBm
2 620 MHz f 2 690 MHz 3.84 MHz –60 dBm2 590 MHz f 2 620 MHz 1 MHz –37 dBm
3 510 MHz f 3 590 MHz 3.84 MHz –60 dBm3 400 MHz f 3 800 MHz 1 MHz –50 dBm (Note 2)
TABLE A1-4.1.1-b (end)
Operating band Frequency bandwidth Measurement bandwidth Minimum requirement
XXII 791 MHz f 821 MHz 3.84 MHz –60 dBm921 MHz f < 925 MHz 100 kHz –60 dBm (Note 1)
925 MHz f 935 MHz 100 kHz3.84 MHz
–67 dBm (Note 1)–60 dBm
935 MHz < f 960 MHz 100 kHz –79 dBm (Note 1)1 805 MHz f 1 880 MHz 100 kHz –71 dBm (Note 1)
1 880 MHz f 1 920 MHz 3.84 MHz –60 dBm2 010 MHz f 2 025 MHz 3.84 MHz –60 dBm
2 110 MHz f 2 170 MHz 3.84 MHz –60 dBm2 300 MHz f 2 400 MHz 3.84 MHz –60 dBm

30 Rec. ITU-R M.1581-5
2 620 MHz f 2 690 MHz 3.84 MHz –60 dBm2 590 MHz f 2 620 MHz 3.84 MHz –50 dBm
3 510 MHz f 3 525 MHz 1 MHz –40 dBm3 525 MHz f 3 590 MHz 1 MHz –50 dBm
3 600 MHz f 3 800 MHz 3.84 MHz –50 dBmXXV 729 MHz f 746 MHz 3.84 MHz –60 dBm
746 MHz f 756 MHz 3.84 MHz –60 dBm758 MHz f 768 MHz 3.84 MHz –60 dBm
869 MHz f 894 MHz 3.84 MHz –60 dBm1 525 MHz f 1 559 MHz 3.84 MHz –60 dBm
1 930 MHz f 1 995 MHz 3.84 MHz –60 dBm2 110 MHz f 2 170 MHz 3.84 MHz –60 dBm
2 180 MHz f 2 200 MHz 1 MHz –50 dBm2 496 MHz f 2 690 MHz 1 MHz –50 dBm
3 400 MHz f 3 800 MHz 1 MHz –50 dBm
NOTE 1 – The measurements are made on frequencies which are integer multiples of 200 kHz. As exceptions, up to five measurements with a level up to the applicable requirements defined in 3GPP TS 25.101, Table 6.12 are permitted for each UARFCN used in the measurement.NOTE 2 – The measurements are made on frequencies which are integer multiples of 200 kHz. As exceptions, measurements with a level up to the applicable requirements defined in 3GPP TS 25.101, Table 6.12 are permitted for each UARFCN used in the measurement due to 2nd, 3rd and 4th harmonic spurious emissions.NOTE 3 – This requirement is applicable also for frequencies, which are between 5 MHz and 25 MHz away from the UE centre carrier frequency.
4.2 Transmitter spurious emissions for E-UTRA
For E-UTRA, the spurious emission limits apply for frequency ranges that are more than ΔfOOB (MHz) from the edge of the channel bandwidth (Table A1-4.2-a).
TABLE A1-4.2-a
Boundary between E-UTRA ΔfOOB and spurious emission domain
Channel bandwidth 1.4 MHz 3.0 MHz 5 MHz 10 MHz 15 MHz 20 MHz
ΔfOOB (MHz) 2.8 6 10 15 20 25
For intra-band contiguous carrier aggregation the spurious emission limits apply for the frequency ranges that are more than ΔfOOB (MHz) in Table A1-4.2-b from the edge of the aggregated channel bandwidth. For frequencies ΔfOOB greater than FOOB as specified in Table A1-4.2-b the spurious requirements in Table A1-4.2-d are applicable.
TABLE A1-4.2-b
Boundary between E-UTRA ΔfOOB and spurious emission domain for intra-band contiguous carrier aggregation
CA Bandwidth Class OOB boundary FOOB
(MHz)
A Table A1-4.2-aB Under discussion
Rec. ITU-R M.1581-5 31
C BWChannel_CA + 5
Additional spectrum emission requirements can be signalled by the network to indicate that the UE shall also meet additional requirements in a specific deployment scenario described in Table A1-4.2-c.
TABLE A1-4.2-c
Network signallings for additional spectrum emission requirements
Network signallingvalue
Requirements(subclause) E-UTRA Band Channel bandwidth
(MHz)
NS_01 N/A (Note 1) N/A N/A
NS_03 N/A (Note 1) 2, 4, 10, 23, 25, 35, 36 3, 5, 10, 15, 20NS_05 § 4.2.1.1 1 10, 15, 20
NS_06 N/A (Note 1) 12, 13, 14, 17 1.4, 3, 5, 10NS_07 § 4.2.1.2 13 10
NS_08 § 4.2.1.3 19 10, 15NS_09 § 4.2.1.4 21 10, 15
NS_10 20 15, 20NS_11 23 1.4, 3, 5, 10, 15, 20
..NS_32 – – –
NOTE 1 – The signalling is for purposes other than additional spectrum emission requirements.NOTE 2 – Applicable E-UTRA band will be addressed at a later stage.NOTE 3 – Applicable channel bandwidths will be addressed at a later stage.
The spurious emission limits in Table A1-4.2-d apply for all E-UTRA transmitter band configurations and channel bandwidths.
TABLE A1-4.2-d
Spurious emissions limits
Frequency range Measurement bandwidth Maximum level Notes
9 kHz f < 150 kHz 1 kHz –36 dBm
150 kHz f < 30 MHz 10 kHz –36 dBm30 MHz f < 1 000 MHz 100 kHz –36 dBm
1 GHz f < 12.75 GHz 1 MHz –30 dBm12.75 GHz ≤ f < 5th
harmonic of the upper frequency edge of the UL
operating band in GHz
1 MHz –30 dBm Note 1
NOTE 1 − Applies for Band 22.
Table A1-4.2-e specifies the requirements for the specified E-UTRA band.

32 Rec. ITU-R M.1581-5
TABLE A1-4.2-e
Spurious emissions requirements for UE coexistence in E-UTRA bands
E-UTRAband
Spurious emission
Protected band Frequency range (MHz)
Level (dBm)
Bandwidth(MHz) Comment
1 E-UTRA Bands 1, 7, 8, 11, 18, 19, 20, 21, 22, 38, 40, 42, 43
FDL_low – FDL_high –50 1
E-UTRA Bands 3, 34 FDL_low – FDL_high –50 1 Note 15Frequency range 1 880 – 1 895 –40 1 Note 15, Note 19
Frequency range 1 895 – 1 915 –15.5 5 Note 15, Note 19, Note 20
Frequency range 1 915 – 1 920 +1.6 5 Note 15, Note 19, Note 20
1 884.5 – 1 915.7 –41 0.3 Note 6, Note 8, Note 15
Frequency range 1 839.9 – 1 879.9 –50 1 Note 152 E-UTRA Bands 4, 5, 10,
12, 13, 14, 17, 22, 23, 24, 41, 42
FDL_low – FDL_high –50 1
E-UTRA Bands 2, 25 FDL_low – FDL_high –50 1 Note 15E-UTRA Band 43 FDL_low – FDL_high –50 1 Note 2
3 E-UTRA Bands 1, 7, 8, 20, 33, 34, 38, 43
FDL_low – FDL_high –50 1
E-UTRA Band 3 FDL_low – FDL_high –50 1 Note 15E-UTRA Bands 11, 18, 19, 21
FDL_low – FDL_high –50 1 Note 13
E-UTRA Bands 22, 42 FDL_low – FDL_high –50 1 Note 2
Frequency range 1 884.5 – 1 915.7 –41 0.3 Note 13
TABLE A1-4.2-e (continued)
E-UTRAband
Spurious emission
Protected band Frequency range (MHz)
Level (dBm)
Bandwidth(MHz) Comment
4 E-UTRA Bands 2, 4, 5, 10, 12, 13, 14, 17, 22, 23, 24, 25, 41, 43
FDL_low – FDL_high –50 1
E-UTRA Band 42 FDL_low – FDL_high –50 1 Note 2
5 E-UTRA Bands 2, 4, 5, 10, 12, 13, 14, 17, 22, 23, 24, 25, 42, 43
FDL_low – FDL_high –50 1
E-UTRA Band 41 FDL_low – FDL_high –50 1 Note 2
6 E-UTRA Bands 1, 9, 11, 34
FDL_low – FDL_high –50 1
Frequency range 860 – 875 –37 1Frequency range 875 – 895 –50 1
Frequency range 1 884.5 – 1 919.6 –41 0.3 Note 7

Rec. ITU-R M.1581-5 33
1 884.5 – 1 915.7 Note 87 E-UTRA Bands 1, 3,
7, 8, 20, 22, 33, 34, 42, 43
FDL_low – FDL_high –50 1
Frequency range 2 570 2 575 +1.6 5 Note 15, Note 16, Note 20
Frequency range 2 575 2 595 –15.5 5 Note 15, Note 16, Note 20
8 E-UTRA Bands 1, 20, 33, 34, 38, 39, 40
FDL_low – FDL_high –50 1
E-UTRA Band 3 FDL_low – FDL_high –50 1 Note 2E-UTRA Band 7 FDL_low – FDL_high –50 1 Note 2
E-UTRA Band 8 FDL_low – FDL_high –50 1 Note 15E-UTRA Band 22, 42, 43
FDL_low – FDL_high –50 1 Note 2
E-UTRA Bands 11, 21 FDL_low – FDL_high –50 1 Note 18
Frequency range 860 890 –40 1 Note 15, Note 18Frequency range 1 884.5 1 915.7 –41 0.3 Note 8, Note 18
9 E-UTRA Bands 1, 11, 18, 19, 21, 34
FDL_low – FDL_high –50 1
Frequency range 1 884.5 – 1 915.7 –41 0.3 Note 8Frequency range 945 – 960 –50 1
Frequency range 1 839.9 – 1 879.9 –50 110 E-UTRA Bands 2, 4, 5,
10, 12, 13, 14, 17, 23, 24, 25, 41, 43
FDL_low – FDL_high –50 1
E-UTRA Bands 22, 42 FDL_low – FDL_high –50 1 Note 2
TABLE A1-4.2-e (continued)
E-UTRAband
Spurious emission
Protected band Frequency range (MHz)
Level (dBm)
Bandwidth(MHz) Comment
11 E-UTRA Bands 1, 11, 18, 19, 21, 34
FDL_low – FDL_high –50 1
Frequency range 1 884.5 – 1 915.7 –41 0.3 Note 8Frequency range 945 – 960 –50 1
Frequency range 1 839.9 – 1 879.9 –50 112 E-UTRA Bands 2, 5, 13,
14, 17, 23, 24, 25, 41FDL_low – FDL_high –50 1
E-UTRA Bands 4, 10 FDL_low – FDL_high –50 1 Note 2
E-UTRA Band 12 FDL_low – FDL_high –50 1 Note 1513 E-UTRA Bands 2, 4, 5,
10, 12, 13, 17, 23, 25, 41FDL_low – FDL_high –50 1
Frequency range 769 – 775 –35 0.00625 Note 15
Frequency range 799 805 –35 0.00625 Note 11, Note 15E-UTRA Band 14 FDL_low – FDL_high –50 1 Note 15
E-UTRA Band 24 FDL_low – FDL_high –50 1 Note 2
34 Rec. ITU-R M.1581-5
14 E-UTRA Bands 2, 4, 5, 10, 12, 13, 14, 17, 23, 24, 25, 41
FDL_low – FDL_high –50 1
Frequency range 769 – 775 –35 0.00625 Note 12, Note 15
Frequency range 799 805 –35 0.00625 Note 11, Note 12,Note 15
17 E-UTRA Bands 2, 5, 13, 14, 17, 23, 24, 25, 41
FDL_low – FDL_high –50 1
E-UTRA Bands 4, 10 FDL_low – FDL_high –50 1 Note 2E-UTRA Band 12 FDL_low – FDL_high –50 1 Note 15
18 E-UTRA Bands 1, 11, 21, 34
FDL_low – FDL_high –50 1
Frequency range 860 – 890 –40 1Frequency range 945 – 960 –50 1
Frequency range 1 839.9 – 1 879.9 –50 1Frequency range 1 884.5 – 1 915.7 –41 0.3 Note 8
19 E-UTRA Bands 1, 11, 21, 34
FDL_low – FDL_high –50 1
Frequency range 860 – 890 –40 1 Note 9, Note 15Frequency range 1 884.5 – 1 915.7 –41 0.3 Note 8
Frequency range 945 – 960 –50 1Frequency range 1 839.9 – 1 879.9 –50 1
TABLE A1-4.2-e (end)
E-UTRAband
Spurious emission
Protected band Frequency range (MHz)
Level (dBm)
Bandwidth(MHz) Comment
20 E-UTRA Bands 1, 3, 7, 8, 20, 22, 33, 34, 43
FDL_low – FDL_high –50 1
E-UTRA Band 20 FDL_low – FDL_high –50 1 Note 15
E-UTRA Bands 38, 42 FDL_low – FDL_high –50 1 Note 2
21 E-UTRA Bands 11 1 475.9 – 1 510.9 –35 1 Note 10, Note 15E-UTRA Bands 1, 34 FDL_low – FDL_high –50 1
Frequency range 945 – 960 –50 1E-UTRA Band 21 FDL_low – FDL_high –50 1 Note 10
Frequency range 1 839.9 – 1 879.9 –50 1Frequency range 1 884.5 – 1 915.7 –41 0.3 Note 8
22 E-UTRA Bands 1, 3, 7, 8, 20, 33, 34, 38, 39, 40, 43
FDL_low – FDL_high –50 1
Frequency range 3 510 – 3 525 –40 1 Note 15Frequency range 3 525 – 3 590 –50 1
23 E-UTRA Bands 4, 5, 10, 12, 13, 14, 17, 23, 24, 41
FDL_low – FDL_high –50 1
E-UTRA Band 2 FDL_low – FDL_high –50 1 Note 14, Note 15Frequency range 1 998 – 1 999 –21 1 Note 14, Note 15

Rec. ITU-R M.1581-5 35
Frequency range 1 997 – 1 998 –27 1 Note 14, Note 14Frequency range 1 996 – 1 997 –32 1 Note 14
Frequency range 1 995 – 1 996 –37 1 Note 14, Note 15Frequency range 1 990 – 1 995 –40 1 Note 14, Note 15
Frequency range 1 990 – 1 999 –40 1 Note 15, Note 21Frequency range 1 999 – 2 000 –40 Note 22 Note 15, Note 21
24 E-UTRA Bands 2, 4, 5, 10, 12, 13, 14, 17, 23, 24, 25, 41
FDL_low – FDL_high –50 1
25 E-UTRA Bands 4, 5, 10,12, 13, 14, 17, 22, 23, 24, 41, 42
FDL_low – FDL_high –50 1
E-UTRA Band 2 FDL_low – FDL_high –50 1 Note 15
E-UTRA Band 25 FDL_low – FDL_high –50 1 Note 15
E-UTRA Band 43 FDL_low – FDL_high –50 1 Note 2

36 Rec. ITU-R M.1581-5
Notes to Table A1-4.2-e:NOTE 1 – FDL_low and FDL_high refer to each E-UTRA frequency band specified in 3GPP TS 36.1013, Table 5.5-1NOTE 2 – As exceptions, measurements with a level up to the applicable requirements defined in Table A1-4.2-d are permitted for each assigned E-UTRA carrier used in the measurement due to 2nd, 3rd or 4th harmonic spurious emissions. An exception is allowed if there is at least one individual RB within the transmission bandwidth for which the 2nd, 3rd or 4th harmonic totally or partially overlaps the measurement bandwidth (MBW).NOTE 3 – To meet these requirements some restriction will be needed for either the operating band or protected bandNOTE 4 − N/A.NOTE 5 – For non synchronised TDD operation to meet these requirements some restriction will be needed for either the operating band or protected bandNOTE 6 – Applicable when NS_05 in § 2.2.2 is signalled by the network.NOTE 7 – Applicable when co-existence with PHS system operating in 1 884.5-1 919.6 MHz.NOTE 8 – Applicable when co-existence with PHS system operating in 1 884.5-1 915.7 MHz.NOTE 9 – Applicable when NS_08 in § 2.2.2 is signalled by the networkNOTE 10 – Applicable when NS_09 in § 2.2.2 is signalled by the networkNOTE 11 − Whether the applicable frequency range should be 793-805 MHz instead of 799-805 MHz is under evaluation.NOTE 12 − The emissions measurement shall be sufficiently power averaged to ensure a standard deviation < 0.5 dB.NOTE 13 − This requirement applies for 5, 10, 15 and 20 MHz E-UTRA channel bandwidth allocated within 1 744.9 MHz and 1 784.9 MHz.NOTE 14 − To meet this requirement NS_11 value shall be signalled when operating in 2 000-2 020 MHz.NOTE 15 − These requirements also apply for the frequency ranges that are less than FOOB (MHz) in 3GPP TS 36.101, Table 6.6.3.1-1 and Table 6.6.3.1A-1 from the edge of the channel bandwidth.NOTE 16 − This requirement is applicable for an uplink transmission bandwidth less than or equal to 54 RB for carriers of 15 MHz bandwidth when carrier center frequency is within the range 2 560.5-2 562.5 MHz and for carriers of 20 MHz bandwidth when carrier center frequency is within the range 2 552-2 560 MHz. No other restrictions apply for carriers with bandwidths confined in 2 500-2 570 MHz.NOTE 17 − This requirement is applicable for an uplink transmission bandwidth less than or equal to 54 RB for carriers of 15 MHz bandwidth when carrier center frequency is within the range 2 605.5-2 607.5 MHz and for carriers of 20 MHz bandwidth when carrier center frequency is within the range 2 597–2 605 MHz. No other restrictions apply for carriers with bandwidths confined in 2 570-2 615 MHz. For assigned carriers with bandwidths overlapping the frequency range 2 615-2 620 MHz the requirements apply with the maximum output power configured to +20 dBm in the IE P-Max.NOTE 18 − For carriers of 5 MHz channel bandwidth with carrier center frequencies (Fc) in the range 902.5 MHz ≤ Fc < 907.5 MHz, the requirement applies for uplink transmission bandwidths less than or equal to 20 RB. No restrictions apply in the range 907.5 MHz ≤ Fc ≤ 912.5 MHz. For carriers of 10 MHz channel bandwidth, the requirement only applies for Fc = 910 MHz and uplink transmission bandwidths less than or equal to 32 RB with RBstart > 3.NOTE 19 − This requirement is applicable for an uplink transmission bandwidth less than or equal to 54 RB for carriers of 15 MHz bandwidth when carrier center frequency is within the range 1 927.5-1 929.5 MHz and for carriers of 20 MHz bandwidth when carrier center frequency is within the range 1 930-1 938 Hz. This requirement is applicable without any other uplink transmission bandwidth restriction for channel bandwidths within the range 1 920-1 980 MHz.NOTE 20 − For these adjacent bands, the emission limit could imply risk of harmful interference to UE(s) operating in the protected operating band.NOTE 21 − Applicable when NS_20 is signalled by the network.NOTE 22 − The measurement bandwidth is 1% of the applicable E-UTRA channel bandwidth.
3 3GPP TS 36.101: 3rd Generation Partnership Project; Technical Specification Group Radio Access Network; Evolved Universal Terrestrial Radio Access (E-UTRA); User Equipment (UE) radio transmission and reception (FDD).

Rec. ITU-R M.1581-5 37
Table A1-4.2-f specifies the requirements for the specified E-UTRA CA combination.
TABLE A1-4.2-f
E-UTRACA Configuration
Spurious emission
Protected band Frequency range (MHz)
Maximum Level (dBm)
MBW (MHz) Note
CA_1C E-UTRA Bands 1, 3, 7, 8, 9, 11, 18, 19, 20, 21, 22, 38, 40, 42, 43
FDL_low – FDL_high –50 1
E-UTRA Band 34 FDL_low – FDL_high –50 1 Note 4, Note 6, Note 7, Note 8
Frequency range 1 900 1 915 –15.5 5 Note 6, Note 8, Note 9
Frequency range 1 915 1 920 +1.6 5 Note 6, Note 7,
Note 8, Note 9Frequency range 1 880 1 895 –40 1 Note 7, Note 8
Frequency range 1 895 1 915 –15.5 5 Note 7, Note 8Frequency range 1 884.5 – 1 915.7 –41 0.3 Note 4, Note 5
NOTE 1 − FDL_low and FDL_high refer to each E-UTRA frequency band.NOTE 2 − As exceptions, measurements with a level up to the applicable requirements defined in Table A1-4.2-d are permitted for each assigned E-UTRA carrier used in the measurement due to 2nd or 3rd harmonic spurious emissions. An exception is allowed if there is at least one individual RE within the transmission bandwidth for which the 2 nd or 3rd
harmonic, i.e. the frequency equal to two or three times the frequency of that RE, is within the measurement bandwidth (MBW).NOTE 3 − To meet these requirements some restriction will be needed for either the operating band or protected band.
NOTE 4 – Applicable when CA_NS_01 in § 2.2.2 is signalled by the network.NOTE 5 − Applicable when co-existence with PHS system operating in 1 884.5-1 915.7 MHz.
NOTE 6 − Applicable when CA_NS_02 in § 2.2.2 is signalled by the network.
NOTE 7 − Applicable when CA_NS_03 in § 2.2.2 is signalled by the network.NOTE 8 − The requirement also applies for the frequency ranges that are less than FOOB (MHz) from the edge of the channel bandwidth.NOTE 9 − For these adjacent bands, the emission limit could imply risk of harmful interference to UE(s) operating in the protected operating band.
4.2.1 Additional spurious emissions
These requirements are specified in terms of an additional spectrum emission requirement. Additional spurious emission requirements are signalled by the network to indicate that the UE shall meet an additional requirement for a specific deployment scenario as part of the cell handover/broadcast message.
4.2.1.1 Minimum requirement (network signalled value “NS_05”)
When “NS_05” is indicated in the cell, the power of any UE emission shall not exceed the levels specified in Table A1-4.2.1.1. This requirement also applies for the frequency ranges that are less than ΔfOOB (MHz) in Table A1-4.2-a from the edge of the channel bandwidth. This requirement also applies for the frequency ranges that are less than ΔfOOB (MHz) in Table A1-4.2.1.1 from the edge of the channel bandwidth.

38 Rec. ITU-R M.1581-5
TABLE A1-4.2.1.1
Additional requirements (PHS)
Frequency band(MHz)
Channel bandwidth/Spectrumemission limit (dBm)
Measurement bandwidth
5 MHz 10 MHz 15 MHz 20 MHz
1 884.5 f 1 915.7 (Note 1)
–41 –41 –41 –41 300 kHz
NOTE 1 – Applicable when the lower edge of the assigned E-UTRA UL channel bandwidth frequency is larger than or equal to the upper edge of PHS band (1 915.7 MHz) + 4 MHz + the Channel BW assigned, where Channel BW. Operations below this point are for further study.
The requirements in Table A1-4.2.1.1a apply with the additional restrictions specified in 3GPP TS 36.101, Table 6.6.3.3.1-2 when the lower edge of the assigned E-UTRA UL channel bandwidth frequency is less than the upper edge of PHS band (1 915.7 MHz) + 4 MHz + the channel BW assigned.
TABLE A1-4.2.1.1a
RB restrictions for additional requirement (PHS)
15 MHz channel bandwidth with fc = 1 932.5 MHz
RBstart 0-7 8-66 67-74LCRB N/A ≤ MIN(30, 67 – RBstart) N/A
20 MHz channel bandwidth with fc = 1 930 MHz
RBstart 0-23 24-75 76-99LCRB N/A ≤ MIN(24, 76 – RBstart) N/A
For measurement conditions at the edge of each frequency range, the lowest frequency of the measurement position in each frequency range should be set at the lowest boundary of the frequency range plus MBW/2. The highest frequency of the measurement position in each frequency range should be set at the highest boundary of the frequency range minus MBW/2. MBW denotes the measurement bandwidth (300 kHz).
4.2.1.2 Minimum requirement (network signalled value “NS_07”)
When “NS_07” is indicated in the cell, the power of any UE emission shall not exceed the levels specified in Table A1-4.2.1.2. This requirement also applies for the frequency ranges that are less than ΔfOOB (MHz) in Table A1-4.2.1.2 from the edge of the channel bandwidth.
TABLE A1-4.2.1.2
Additional requirements
Frequency band(MHz)
Channel bandwidth/Spectrum emission limit (dBm)10 MHz
Measurementbandwidth
763 ≤ f ≤ 775 –57 6.25 kHz

Rec. ITU-R M.1581-5 39
4.2.1.3 Minimum requirement (network signalled value “NS_08”)
When “NS_08” is indicated in the cell, the power of any UE emission shall not exceed the levels specified in Table A1-4.2.1.3. This requirement also applies for the frequency ranges that are less than ΔfOOB (MHz) in Table A1-4.2.1.3 from the edge of the channel bandwidth.
TABLE A1-4.2.1.3
Additional requirements
Frequency band (MHz)
Channel bandwidth/Spectrum emission limit (dBm) Measurement bandwidth5 MHz 10 MHz 15 MHz
860 ≤ f ≤ 890 –40 –40 –40 1 MHz
For measurement conditions at the edge of each frequency range, the lowest frequency of the measurement position in each frequency range should be set at the lowest boundary of the frequency range plus MBW/2. The highest frequency of the measurement position in each frequency range should be set at the highest boundary of the frequency range minus MBW/2. MBW denotes the measurement bandwidth (1 MHz).
4.2.1.4 Minimum requirement (network signalled value “NS_09”)
When “NS_09” is indicated in the cell, the power of any UE emission shall not exceed the levels specified in Table A1-4.2.1.4. This requirement also applies for the frequency ranges that are less than ΔfOOB (MHz) in Table A1-4.2-a from the edge of the channel bandwidth.
TABLE A1-4.2.1.4
Additional requirements
Frequency band(MHz)
Channel bandwidth/Spectrum emission limit (dBm) Measurement bandwidth5 MHz 10 MHz 15 MHz
1 475.9 ≤ f ≤ 1 510.9 –35 –35 –35 1 MHz
For measurement conditions at the edge of each frequency range, the lowest frequency of the measurement position in each frequency range should be set at the lowest boundary of the frequency range plus MBW/2. The highest frequency of the measurement position in each frequency range should be set at the highest boundary of the frequency range minus MBW/2. MBW denotes the measurement bandwidth (1 MHz).
4.2.2 Additional spurious emissions for CA
These requirements are specified in terms of an additional spectrum emission requirement. Additional spurious emission requirements are signalled by the network to indicate that the UE shall meet an additional requirement for a specific deployment scenario as part of the cell reconfiguration message.
4.2.2.1 Minimum requirement for CA_1C (network signalled value “CA_NS_01”)
When “CA_NS_01” is indicated in the cell, the power of any UE emission shall not exceed the levels specified in Table A1-4.2.2.1. This requirement also applies for the frequency ranges that are less than ΔfOOB (MHz) from the edge of the aggregated channel bandwidth.

40 Rec. ITU-R M.1581-5
TABLE A1-4.2.2.1
Additional requirements (PHS)
Protected band Frequency range (MHz) Maximum level (dBm) MBW (MHz) Note
E-UTRA band 34 FDL_low – FDL_high –50 1Frequency range 1 884.5 – 1 915.7 –41 0.3 1
NOTE 1 − Applicable when the aggregated channel bandwidth is confined within frequency range 1 940-1 980 MHz.
NOTE − For measurement conditions at the edge of each frequency range, the lowest frequency of the measurement position in each frequency range should be set at the lowest boundary of the frequency range plus MBW/2. The highest frequency of the measurement position in each frequency range should be set at the highest boundary of the frequency range minus MBW/2. MBW denotes the measurement bandwidth (300 kHz).
4.2.2.2 Minimum requirement for CA_1C (network signalled value “CA_NS_02”)
When “CA_NS_02” is indicated in the cell, the power of any UE emission shall not exceed the levels specified in Table A1-4.2.2.2. This requirement also applies for the frequency ranges that are less than ΔfOOB (MHz) from the edge of the aggregated channel bandwidth.
TABLE A1-4.2.2.2
Additional requirements
Protected band Frequency range (MHz) Maximum level (dBm) MBW (MHz) Note
E-UTRA band 33 FDL_low – FDL_high –50 1 1
E-UTRA band 34 FDL_low – FDL_high –50 1
NOTE − To meet these requirements some restriction will be needed for either the operating band or protected band.
4.2.2.3 Minimum requirement for CA_1C (network signalled value “CA_NS_03”)
When “CA_NS_03” is indicated in the cell, the power of any UE emission shall not exceed the levels specified in Table A1-4.2.2.3. This requirement also applies for the frequency ranges that are less than ΔfOOB (MHz) from the edge of the aggregated channel bandwidth.
TABLE A1-4.2.2.3
Additional requirements
Protected band Frequency range (MHz) Maximum level (dBm) MBW (MHz) Note
E-UTRA band 34 FDL_low – FDL_high –50 1
E-UTRA band 39 FDL_low – FDL_high –50 1 1
NOTE − To meet these requirements some restriction will be needed for either the operating band or protected band.
5 Receiver spurious emissions (conducted)
The spurious emissions power is the power of emissions generated or amplified in a receiver that appear at the UE antenna connector.

Rec. ITU-R M.1581-5 41
5.1 Receiver spurious emissions for UTRA
For UTRA, the power of any narrow-band continuous wave (CW) spurious emission should not exceed the maximum level specified in Tables A1-5.1-a and A1-5.1-b.
TABLE A1-5.1-a
General receiver spurious emission requirements
Frequency band Measurement bandwidth
Maximum level Note
30 MHz f < 1 GHz 100 kHz –57 dBm1 GHz f 12.75 GHz 1 MHz –47 dBm
12.75 GHz f 5th harmonic of the upper frequency edge of the DL operating band in GHz
1 MHz –47 dBm Note 1
NOTE 1 − Applies only for Band XXII.
For UTRA the following additional spurious emission limits are applicable.
TABLE A1-5.1-b
Additional receiver spurious emission requirements
Band Frequency band Measurement bandwidth Maximum level Note
I 791 MHz f 821 MHz 3.84 MHz –60 dBm860 MHz f 894 MHz 3.84 MHz –60 dBm921 MHz f < 925 MHz 100 kHz –60 dBm Note 1925 MHz f 935 MHz 100 kHz
3.84 MHz–67 dBm–60 dBm
Note 1
935 MHz f 960 MHz 100 kHz –79 dBm Note 11 805 MHz f 1 880 MHz 100 kHz –71 dBm Note 1
1 475.9 MHz f 1 510.9 MHz 3.84 MHz –60 dBm1 839.9 MHz f 1 879.9 MHz 3.84 MHz –60 dBm
1 920 MHz f 1 980 MHz 3.84 MHz –60 dBm UE transmit band in URA_PCH, Cell_PCH and idle state
2 110 MHz f 2 170 MHz 3.84 MHz –60 dBm UE receive band2 585 MHz f 2 690 MHz 3.84 MHz –60 dBm3 510 MHz f 3 590 MHz 3.84 MHz –60 dBm3 400 MHz f 3 800 MHz 1 MHz –50 dBm
II 729 MHz f 746 MHz 3.84 MHz –60 dBm746 MHz f 756 MHz 3.84 MHz –60 dBm758 MHz f 768 MHz 3.84 MHz –60 dBm869 MHz f 894 MHz 3.84 MHz –60 dBm
1 850 MHz f 1 915 MHz 3.84 MHz –60 dBm UE transmit band in URA_PCH, Cell_PCH and idle state
1 930 MHz f 1 990 MHz 3.84 MHz –60 dBm UE receive band1 990 MHz f 1 995 MHz 3.84 MHz –60 dBm2 110 MHz f 2 170 MHz 3.84 MHz –60 dBm

42 Rec. ITU-R M.1581-5
TABLE A1-5.1-b (continued)
Band Frequency band Measurement bandwidth Maximum level Note
III 791 MHz f 821 MHz 3.84 MHz –60 dBm860 MHz f 890 MHz 3.84 MHz –60 dBm
921 MHz f 925 MHz 100 kHz –60 dBm(1) Note 1925 MHz f 935 MHz 100 kHz
3.84 MHz–67 dBm(1)
–60 dBmNote 1
935 MHz f 960 MHz 100 kHz –79 dBm(1) Note 1
1 475.9 MHz f 1 510.9 MHz 3.84 MHz –60 dBm1 710 MHz f 1 785 MHz 3.84 MHz –60 dBm UE transmit band in
URA_PCH, Cell_PCH and idle state
1 805 MHz f 1 880 MHz 3.84 MHz –60 dBm UE receive band1 884.5 MHz f 1 915.7 MHz 300 kHz –41 dBm
2 110 MHz f 2 170 MHz 3.84 MHz –60 dBm2 585 MHz f 2 690 MHz 3.84 MHz –60 dBm
3 510 MHz f 3 590 MHz 3.84 MHz –60 dBm3 400 MHz f 3 800 MHz 1 MHz –50 dBm
IV 729 MHz f 746 MHz 3.84 MHz –60 dBm746 MHz f 756 MHz 3.84 MHz –60 dBm
758 MHz f 768 MHz 3.84 MHz –60 dBm869 MHz f < 894 MHz 3.84 MHz –60 dBm
1 710 MHz f 1 755 MHz 3.84 MHz –60 dBm UE transmit band in URA_PCH, Cell_PCH and idle state
1 930 MHz f 1 995 MHz 3.84 MHz –60 dBm
2 110 MHz f 2 170 MHz 3.84 MHz –60 dBm UE receive bandV 729 MHz f 746 MHz 3.84 MHz –60 dBm
746 MHz f 756 MHz 3.84 MHz –60 dBm758 MHz f 768 MHz 3.84 MHz –60 dBm
824 MHz f 849 MHz 3.84 MHz –60 dBm UE transmit band in URA_PCH, Cell_PCH and idle state
869 MHz f < 894 MHz 3.84 MHz –60 dBm UE receive band
1 930 MHz f 1 995 MHz 3.84 MHz –60 dBm2 110 MHz f 2 170 MHz 3.84 MHz –60 dBm

Rec. ITU-R M.1581-5 43
TABLE A1-5.1-b (continued)
Band Frequency band Measurement bandwidth Maximum level Note
VI 815 MHz f 830 MHz 3.84 MHz –60 dBm830 MHz f 840 MHz 3.84 MHz –60 dBm UE in URA_PCH,
Cell_PCH and idle state840 MHz f 845 MHz 3.84 MHz –60 dBm
860 MHz f 875 MHz 3.84 MHz –60 dBm875 MHz f 885 MHz 3.84 MHz –60 dBm UE receive band
885 MHz f 890 MHz 3.84 MHz –60 dBm945 MHz f 960 MHz 3.84 MHz –60 dBm
1 475.9 MHz f 1 510.9 MHz 3.84 MHz –60 dBm1 839.9 MHz f 1 879.9 MHz 3.84 MHz –60 dBm
2 110 MHz f 2 170 MHz 3.84 MHz –60 dBmVII 791 MHz f < 821 MHz 3.84 MHz –60 dBm
921 MHz f 925 MHz 100 kHz –60 dBm Note 1925 MHz f 935 MHz 100 kHz
3.84 MHz–67 dBm–60 dBm
Note 1
935 MHz f 960 MHz 100 kHz –79 dBm Note 1
1 805 MHz f 1 880 MHz 100 kHz –71 dBm Note 12 110 MHz f 2 170 MHz 3.84 MHz –60 dBm
2 500 MHz f 2 570 MHz 3.84 MHz –60 dBm UE transmit band in URA_PCH, Cell_PCH and idle state
2 620 MHz f 2 690 MHz 3.84 MHz –60 dBm UE receive band
3 510 MHz f 3 590 MHz 3.84 MHz –60 dBm3 400 MHz f 3 800 MHz 1 MHz –50 dBm
VIII 791 MHz f < 821 MHz 3.84 MHz –60 dBm860 MHz f < 890 MHz 3.84 MHz –60 dBm
880 MHz f 915 MHz 3.84 MHz –60 dBm UE in URA_PCH, Cell_PCH and idle state
921 MHz f 925 MHz 100 kHz –60 dBm Note 1925 MHz f 935 MHz 100 kHz
3.84 MHz–67 dBm–60 dBm
UE receive bandNote 1
935 MHz f 960 MHz 100 kHz –79 dBm UE receive bandNote 1
1 475.9 MHz f 1 510.9 MHz 3.84 MHz –60 dBm
1 805 MHz f 1 880 MHz 3.84 MHz –60 dBm2 110 MHz f 2 170 MHz 3.84 MHz –60 dBm
2 585 MHz f 2 690 MHz 3.84 MHz –60 dBm3 510 MHz f 3 590 MHz 3.84 MHz –60 dBm
3 400 MHz f 3 800 MHz 1 MHz –50 dBm

44 Rec. ITU-R M.1581-5
TABLE A1-5.1-b (continued)
Band Frequency band Measurement bandwidth Maximum level Note
IX 860 MHz f 890 MHz 3.84 MHz –60 dBm945 MHz f 960 MHz 3.84 MHz –60 dBm
1 475.9 MHz f 1 510.9 MHz 3.84 MHz –60 dBm1 749.9 MHz f 1 784.9 MHz 3.84 MHz –60 dBm UE transmit band in
URA_PCH, Cell_PCH and idle state
1 839.9 MHz f 1 879.9 MHz 3.84 MHz –60 dBm UE receive band2 110 MHz f 2 170 MHz 3.84 MHz –60 dBm
X 729 MHz f 746 MHz 3.84 MHz –60 dBm746 MHz f 756 MHz 3.84 MHz –60 dBm
758 MHz f 768 MHz 3.84 MHz –60 dBm869 MHz f 894 MHz 3.84 MHz –60 dBm
1 710 MHz f 1 770 MHz 3.84 MHz –60 dBm UE transmit band in URA_PCH, Cell_PCH and idle state
1 930 MHz f 1 995 MHz 3.84 MHz –60 dBm
2 110 MHz f 2 170 MHz 3.84 MHz –60 dBm UE receive bandXI 860 MHz f 890 MHz 3.84 MHz –60 dBm
945 MHz f 960 MHz 3.84 MHz –60 dBm1 427.9 MHz f 1 447.9 MHz 3.84 MHz –60 dBm UE transmit band in
URA_PCH, Cell_PCH and idle state
1 447.9 MHz f 1 462.9 MHz 3.84 MHz –60 dBm1 475.9 MHz f 1 495.9 MHz 3.84 MHz –60 dBm UE receive band
1 495.9 MHz f 1 510.9 MHz 3.84 MHz –60 dBm1 839.9 MHz f 1 879.9 MHz 3.84 MHz –60 dBm
2 110 MHz f 2 170 MHz 3.84 MHz –60 dBmXII 699 MHz f 716 MHz 3.84 MHz –60 dBm UE transmit band in
URA_PCH, Cell_PCH and idle state
728 MHz f 746 MHz 3.84 MHz –60 dBm UE receive band746 MHz f 756 MHz 3.84 MHz –60 dBm
758 MHz f 768 MHz 3.84 MHz –60 dBm869 MHz f 894 MHz 3.84 MHz –60 dBm
1 930 MHz f 1 995 MHz 3.84 MHz –60 dBm2 110 MHz f 2 170 MHz 3.84 MHz –60 dBm
TABLE A1-5.1-b (continued)
Band Frequency band Measurement bandwidth Maximum level Note
XIII 729 MHz f 746 MHz 3.84 MHz –60 dBm
746 MHz f 756 MHz 3.84 MHz –60 dBm UE receive band
758 MHz f 768 MHz 3.84 MHz –60 dBm

Rec. ITU-R M.1581-5 45
776 MHz f 788 MHz 3.84 MHz –60 dBm UE transmit band in URA_PCH, Cell_PCH and idle state
869 MHz f 894 MHz 3.84 MHz –60 dBm
1 930 MHz f 1 995 MHz 3.84 MHz –60 dBm
2 110 MHz f 2 170 MHz 3.84 MHz –60 dBm
XIV 729 MHz f 746 MHz 3.84 MHz –60 dBm
746 MHz f 756 MHz 3.84 MHz –60 dBm
758 MHz f 768 MHz 3.84 MHz –60 dBm UE receive band
788 MHz f 798 MHz 3.84 MHz –60 dBm UE transmit band in URA_PCH, Cell_PCH and idle state
869 MHz f < 894 MHz 3.84 MHz –60 dBm
1 930 MHz f 1 995 MHz 3.84 MHz –60 dBm
2 110 MHz f 2 170 MHz 3.84 MHz –60 dBm
XIX 815 MHz f 830 MHz 3.84 MHz –60 dBm
830 MHz f 845 MHz 3.84 MHz –60 dBm UE in URA_PCH, Cell_PCH and idle state
860 MHz f 875 MHz 3.84 MHz –60 dBm
875 MHz f 890 MHz 3.84 MHz –60 dBm UE receive band
945 MHz f 960 MHz 3.84 MHz –60 dBm
1 475.9 MHz f 1 510.9 MHz 3.84 MHz –60 dBm
1 839.9 MHz f 1 879.9 MHz 3.84 MHz –60 dBm
2 110 MHz f 2 170 MHz 3.84 MHz –60 dBm
XX 791 MHz f < 821 MHz 3.84 MHz –60 dBm UE receive band
832 MHz f 862 MHz 3.84 MHz –60 dBm UE transmit band in URA_PCH, Cell_PCH and idle state
921 MHz f < 925 MHz 100 kHz –60 dBm Note 1
925 MHz f 935 MHz 100 kHz3.84 MHz
–67 dBm–60 dBm
Note 1
935 MHz < f 960 MHz 100 kHz –79 dBm Note 1
1 805 MHz f 1 880 MHz 3.84 MHz –60 dBm
2 110 MHz f 2 170 MHz 3.84 MHz –60 dBm
2 620 MHz f 2 690 MHz 3.84 MHz –60 dBm
3 400 MHz f 3 800 MHz 3.84 MHz –60 dBm
TABLE A1-5.1-b (end)
Band Frequency band Measurement bandwidth Maximum level Note
XXI 860 MHz f 890 MHz 3.84 MHz –60 dBm945 MHz f 960 MHz 3.84 MHz –60 dBm
1 427.9 MHz f 1 447.9 MHz 3.84 MHz –60 dBm1 447.9 MHz f 1 462.9 MHz 3.84 MHz –60 dBm UE transmit band in
URA_PCH, Cell_PCH

46 Rec. ITU-R M.1581-5
and idle state1 475.9 MHz f 1 495.9 MHz 3.84 MHz –60 dBm
1 495.9 MHz f 1 510.9 MHz 3.84 MHz –60 dBm UE receive band1 839.9 MHz f 1 879.9 MHz 3.84 MHz –60 dBm
2 110 MHz f 2 170 MHz 3.84 MHz –60 dBmXXII 791 MHz f < 821 MHz 3.84 MHz –60 dBm
921 MHz f < 925 MHz 100 kHz –60 dBm Note 1925 MHz f 935 MHz 100 kHz
3.84 MHz–67 dBm–60 dBm
Note 1
935 MHz < f 960 MHz 100 kHz –79 dBm Note 1
1 805 MHz f 1 880 MHz 3.84 MHz –60 dBm1 880 MHz f 1 920 MHz 3.84 MHz –60 dBm
2 010 MHz f 2 025 MHz 3.84 MHz –60 dBm2 110 MHz f 2 170 MHz 3.84 MHz –60 dBm
2 300 MHz f 2 400 MHz 3.84 MHz –60 dBm2 590 MHz f 2 620 MHz 3.84 MHz –50 dBm
2 620 MHz f 2 690 MHz 3.84 MHz –60 dBm3 410 MHz f 3 490 MHz 3.84 MHz –60 dBm UE transmit band in
URA_PCH, Cell_PCH and idle state
3 510 MHz f 3 590 MHz 3.84 MHz –60 dBm UE receive band3 600 MHz f 3 800 MHz 3.84 MHz –50 dBm
XXV 729 MHz f 746 MHz 3.84 MHz Under discussion746 MHz f 756 MHz 3.84 MHz Under discussion
758 MHz f 768 MHz 3.84 MHz Under discussion869 MHz f 894 MHz 3.84 MHz Under discussion
1 850 MHz f 1 915 MHz 3.84 MHz Under discussion UE transmit band in URA_PCH, Cell_PCH and idle state
1 930 MHz f 1 995 MHz 3.84 MHz Under discussion UE receive band
2 110 MHz f 2 170 MHz 3.84 MHz Under discussion2 180 MHz f 2 200 MHz 1 MHz Under discussion
2 496 MHz f 2 690 MHz 1 MHz Under discussion3 400 MHz f 3 800 MHz 1 MHz Under discussion
NOTE 1 − The measurements are made on frequencies which are integer multiples of 200 kHz. As exceptions, up to five measurements with a level up to the applicable requirements defined in Table A1-5.1-a are permitted for each UARFCN used in the measurement.
5.2 Receiver spurious emissions for E-UTRA
The power of any narrowband CW spurious emission shall not exceed the maximum level specified in Table A1-5.2.

Rec. ITU-R M.1581-5 47
TABLE A1-5.2
General receiver spurious emission requirements for E-UTRA
Frequency band Measurement bandwidth Maximum level Note
30 MHz f < 1 GHz 100 kHz –57 dBm1 GHz f 12.75 GHz 1 MHz –47 dBm
12.75 GHz f 5th harmonic of the upper frequency edge of the DL operating band in GHz
1 MHz –47 dBm Note 1
NOTE 1 − Applies only for Band 22,NOTE 2 − Unused PDCCH resources are padded with resource element groups with power level given by PDCCH_RA/RB as defined in 3GPP TS 36.101, Annex C, subclause C.3.1.
Annex 2
IMT 2000 CDMA Multi-Carrier (CDMA-2000) mobile stations
PART A
CDMA2000 and CDMA2000 high rate packet data (HRPD)
NOTE – Single carrier HRPD spectrum emission mask or spurious emission limits are only applicable for spreading rate 1.
1 Spectrum mask
The emissions supported by the FDD or TDD MS shall be less than the limits specified below.
1.1 Spreading rate 1
When transmitting with spreading rate 1, the spectrum emissions for Band Classes 0, 2, 5, 7, 9, 10, 11 and 12 shall be less than the limits specified in Table A2-A-1.1-a.
TABLE A2-A-1.1-a
Band Classes 0, 2, 5, 7, 9, 10, 11 and 12 spectrum emission mask for spreading rate 1
For |f | within the range(MHz) Emission limit
885-1.98 Less stringent of –42 dBc/30 kHz or –54 dBm/1.23 MHz1.25 to 4.00
(Band Class 10 only)–13 dBm/30 kHz
1.98-4.00 Less stringent of –54 dBc/30 kHz or –54 dBm/1.23 MHz

48 Rec. ITU-R M.1581-5
2.25-4.00(Band Class 7 only)
–35 dBm/6.25 kHz
NOTE – All frequencies in the measurement bandwidth shall satisfy the restrictions on |f | where f = centre frequency – closer edge frequency, f, of the measurement filter.
When transmitting with spreading rate 1, the spectrum emissions for Band Classes 1, 4, 6, 8, 13, 14 and 15 shall be less than the limits specified in Table A2-A-1.1-b.
TABLE A2-A-1.1-b
Band Classes 1, 4, 6, 8, 13, 14 and 15 spectrum emission mask for spreading rate 1
For |f | within the range(MHz) Emission limit
1.25 to 1.98 Less stringent of –42 dBc/30 kHz or –54 dBm/1.23 MHz1.98 to 4.00 Less stringent of –50 dBc/30 kHz or –54 dBm/1.23 MHz2.25 to 4.00
(Band Classes 6, 8 and 13 only)(13 + 1 (f – 2.25 MHz)) dBm/1 MHz
NOTE – All frequencies in the measurement bandwidth shall satisfy the restrictions on |f | where f = centre frequency – closer edge frequency, f, of the measurement filter.
When transmitting in Band Class 3, the spectrum emissions shall be less than the limits specified in Table A2-A-1.1-c.
TABLE A2-A-1.1-c
Band Class 3 spectrum emission mask for spreading rate 1
Measurement frequency
(MHz)
For |f | withinthe range Emission limit
> 815 and 850,> 887 and 889,> 893 and 901,> 915 and 925
900 kHz and< 1.98 MHz
–42 dBc/30 kHz
1.98 MHz 25 W (–16 dBm)/100 kHz; Pout 30 dBm–54 dBc/100 kHz; Pout > 30 dBm
> 885 and 958,except
> 887 and 889,> 893 and 901,> 915 and 925
< 1.98 MHz 25 W (–16 dBm)/30 kHz; Pout 30 dBmLess stringent of –60 dBc/30 kHz
or 2.5 W (–26 dBm)/30 kHz; Pout > 30 dBm 1.98 MHz 25 W (–16 dBm)/100 kHz; Pout 30 dBm
Less stringent of –60 dBc/100 kHz or 2.5 W (–26 dBm)/100 kHz; Pout > 30 dBm
885 and > 958,except 815-850
< 1.98 MHz 25 W (–16 dBm)/30 kHz; Pout 30 dBmLess stringent of –60 dBc/30 kHz
or 2.5 W (–26 dBm)/30 kHz; Pout > 30 dBm 1.98 MHz 25 W (–16 dBm)/1 MHz; Pout 44 dBm
More stringent of –60 dBc/1 MHz and 20 mW (13 dBm)/1 MHz; Pout > 44 dBm
NOTE – All frequencies in the measurement bandwidth shall satisfy the restrictions on |f | where f = centre frequency – closer measurement edge frequency, f. The lower and upper limits of the frequency measurement are currently 10 MHz and 3 GHz in Japanese radio measurement documents.

Rec. ITU-R M.1581-5 49
When transmitting in Band Class 11 or 12 with spreading rate 1, the spectrum emissions shall also be less than the requirements in Table A2-A-1.1-d for cdma2000 and Table A2-A-1.1-e for HRPD.
TABLE A2-A-1.1-d
Additional cdma2000 Band Classes 11 and 12 spectrum emission mask for spreading rate 1
For |f | within the range Emission limit
885 to 1.125 –47 – 7 (|f | – 885)/240 dBc in 30 kHz1.125 to 1.98 –54 – 13 (|f | – 1 125)/855 dBc in 30 kHz1.98 to 4.00 –67 – 15 (|f | – 1 980)/2 020 dBc in 30 kHz
4.00 to 10.00 –51 dBm in 100 kHz
NOTE – All frequencies in the measurement bandwidth shall satisfy the restrictions on |f | where f = centre frequency – closer measurement edge frequency, f. Δf is positive offset from the highest valid CDMA channel in the band subclass or negative offset from the lowest valid CDMA channel in the band subclass. The emission limits for Band Classes 11 and 12 (European PAMR bands) are designed to allow coexistence with incumbent services in Europe and are tighter than ITU Category B requirements.
TABLE A2-A-1.1-e
Additional HRPD Band Classes 11 and 12 spectrum emission mask
For |f | withinthe range
(MHz)
Emission limit Band Class 11 Subclasses 4, 5; Band Class 12
Subclass 1
Emission limit Band Class 11 Subclasses 0, 1, 2, 3;
Band Class 12 Subclass 0885 to 1.12 –47 – 7 (|f | – 885)/235 dBc in 30 kHz Not specified1.12 to 1.98 –54 – 13 (|f | – 1 120)/860 dBc in 30 kHz Not specified1.98 to 4.00 –67 – 15 (|f| – 1 980)/2 020 dBc in 30 kHz Not specified
NOTE – All frequencies in the measurement bandwidth shall satisfy the restrictions on |f | where f = centre frequency – closer measurement edge frequency, f. f is positive offset from the highest valid CDMA channel in the band subclass or negative offset from the lowest valid CDMA channel in the band subclass. The emission limits for Band Classes 11 and 12 (European PAMR bands) are designed to allow coexistence with incumbent services in Europe and are tighter than ITU Category B requirements.
1.2 Multi-carrier HRPD
When transmitting in Band Classes 0, 2, 3, 5, 7, 9, 10, 11 or 12 for a HRPD Rev B capable terminal configured with two reverse link channels with maximum frequency separation, the spectrum emissions with ten or more averages shall be less than the limits specified in Table A2-A-1.2-a.

50 Rec. ITU-R M.1581-5
TABLE A2-A-1.2-a
Band Classes 0, 2, 3, 5, 7, 9, 10, 11 and 12 spectrum emission mask for multi-carrier HRPD
For |f | within the range(MHz) Emission limit
885 kHz to 1.885 6 dBm/1 MHz> 1.885 –13 dBm/1 MHz
NOTE – All frequencies in the measurement bandwidth shall satisfy the restrictions on |f | where f is measured as the frequency offset from the centre frequency of each reverse CDMA channel.Emission limits shall apply between the reverse CDMA channels when maximum reverse link bandwidth ≥ 4 1.23 MHz.
When transmitting in Band Classes 1, 4, 6 or 8 for a HRPD Rev B capable terminal configured with two reverse link channels with maximum frequency separation, the spectrum emissions with ten or more averages shall be less than the limits specified in Table A2-A-1.2-b.
TABLE A2-A-1.2-b
Band Classes 1, 4, 6 and 8 spectrum emission mask for multi-carrier HRPD
For |f | within the range(MHz) Emission limit
1.25 to 2.25 6 dBm/1 MHz> 2.25 –13 dBm/1 MHz
NOTE – All frequencies in the measurement bandwidth shall satisfy the restrictions on |f | where f where f is measured as the frequency offset from the centre frequency of each channel.Emission limits shall apply between the carriers when maximum reverse link bandwidth ≥ 4 1.25 MHz.
A single exception will be allowed for spurious emission frequencies between the two reverse CDMA channels (for both Tables A2-A-1.2-a and A2-A-1.2-b).
For adjacent reverse CDMA channels, the spectrum emissions with ten or more averages shall be less than the limits specified in Tables A2-A-1.2-c and A2-A-1.2-d.

Rec. ITU-R M.1581-5 51
TABLE A2-A-1.2-c
Adjacent multi-carrier spectrum emission limits for numberof adjacent reverse CDMA channels, N = 3
For |f | within the range(MHz) Emission limit
2.5 to 2.7 –14 dBm/30 kHz2.7 to 3.5 –(14 + 15 (f – 2.7 MHz)) dB/30 kHz
3.08 (Band Class 6 only) –33 dBc/3.84 MHz3.5 to 7.5 –(13 + 1 (f – 3.5 MHz)) dBm/1 MHz7.5 to 8.5 –(17 + 10 (f – 7.5 MHz)) dBm/1 MHz
8.08 (Band Class 6 only) –43 dBc/3.84 MHz8.5 to 12.5 –27 dBm/1 MHz
NOTE – All frequencies in the measurement bandwidth shall satisfy the restrictions on |f | where f = centre frequency of the middle reverse CDMA channel – closer measurement edge frequency ( f). The requirements at offsets of 3.08 and 8.08 MHz are equivalent to ACLR requirements of 33 and 43 dB from a spreading rate 3 mobile station transmitter into a spreading rate 3 or IMT-DS mobile station receiver offset by 5 and 10 MHz respectively. ITU Category B is intended to apply to only Band Classes 6, 8, 9, 11 and 12.
TABLE A2-A-1.2-d
Adjacent multi-carrier spectrum emission limits for number of adjacent reverse CDMA channels, N ≠ 3
For |f | within the range(MHz) Emission limit
2.5 + ∆ to 3.5 + ∆ –13 dBm/(12.5 kHz × N) kHz3.5 + ∆ to 3.125 × (N + 1) –13 dBm/1 MHz
NOTE – All frequencies in the measurement bandwidth shall satisfy the restrictions on |∆ f | where ∆f = centre frequency – closer measurement edge frequency, f. ITU Category B is intended to apply to only Band Classes 6, 8, 9, 11 and 12. ∆ = (N – 3) 625 kHz, where N is the number of carriers (N ≥ 2). Operation outside North America is for future study.
1.3 Spreading rate 3
When transmitting with spreading rate 3, the spectrum emissions shall be less than the limits specified in Table A2-A-1.3.
TABLE A2-A-1.3
Spectrum emission limits for spreading rate 3
For |f | within the range(MHz) Emission limit
2.5-2.7 –14 dBm/30 kHz2.7-3.5 –(14 + 15 (f – 2.7 MHz)) dBm/30 kHz
3.08 (Band Class 6 only) –33 dBc/3.84 MHz

52 Rec. ITU-R M.1581-5
1.4 Simultaneous cdma2000 and cdma2000-HRPD
When transmitting in Band Classes 0, 2, 3, 5, 7, 9, 10, 11 or 12 for a single-band CDMA-HRPD (SB-CDMA-HRPD) capable terminal configured with one 1X reverse link channel and an HRPD reverse link channel with maximum frequency separation claimed to be supported for SB-CDMA-HRPD operation, the spectrum emissions with ten or more averages shall be less than the limits specified in Table A2-A-1.4-a.
TABLE A2-A-1.4-a
Band Classes 0, 2, 3, 5, 7, 9, 10, 11 and 12 spectrum emission mask for SB-CDMA-HRPD
For |f | within the range(MHz) Emission limit
885 kHz to 1.885 6 dBm/1 MHz> 1.885 –13 dBm/1 MHz
NOTE – All frequencies in the measurement bandwidth shall satisfy the restrictions on |f | where f is measured as the frequency offset from the centre frequency of each reverse CDMA channel.Emission limits shall apply between the reverse CDMA channels when maximum reverse link bandwidth ≥ 4 1.23 MHz.
When transmitting in Band Classes 1, 4, 6 or 8 for a SB-CDMA-HRPD capable terminal configured with one 1X reverse link channel and an HRPD reverse link channel with maximum frequency separation claimed to be supported for SB-CDMA-HRPD operation, the spectrum emissions with ten or more averages shall be less than the limits specified in Table A2-A-1.4-b.
TABLE A2-A-1.4-b
Band Classes 1, 4, 6 and 8 spectrum emission mask for SB-CDMA-HRPD
For |f | within the range(MHz) Emission limit
1.25 to 2.25 6 dBm/1 MHz> 2.25 –13 dBm/1 MHz
NOTE – All frequencies in the measurement bandwidth shall satisfy the restrictions on |f | where f where f is measured as the frequency offset from the centre frequency of each channel.Emission limits shall apply between the carriers when maximum reverse link bandwidth ≥ 4 1.25 MHz.
A single exception will be allowed for spurious emission frequencies between the two reverse CDMA channels (for both Tables A2-A-1.4-a and A2-A-1.4-b).
For a SB-CDMA-HRPD capable terminal configured with one 1X reverse link channel and maximum number HRPD reverse link channel, all adjacent to each other, the spectrum emissions with ten or more averages shall be less than the limits specified in Tables A2-A-1.4-c and A2-A-1.4-d.

Rec. ITU-R M.1581-5 53
TABLE A2-A-1.4-c
Adjacent multi-carrier spectrum emission limits for numberof adjacent reverse CDMA channels, N = 3
For |f | within the range(MHz) Emission limit
2.5 to 2.7 –14 dBm/30 kHz2.7 to 3.5 –(14 + 15 (f – 2.7 MHz)) dB/30 kHz
3.08 (Band Class 6 only) –33 dBc/3.84 MHz3.5 to 7.5 –(13 + 1 (f – 3.5 MHz)) dBm/1 MHz7.5 to 8.5 –(17 + 10 (f – 7.5 MHz)) dBm/1 MHz
8.08 (Band Class 6 only) –43 dBc/3.84 MHz8.5 to 12.5 –27 dBm/1 MHz
NOTE – All frequencies in the measurement bandwidth shall satisfy the restrictions on |f | where f = centre frequency of the middle reverse CDMA channel – closer measurement edge frequency ( f). The requirements at offsets of 3.08 and 8.08 MHz are equivalent to ACLR requirements of 33 and 43 dB from a spreading rate 3 mobile station transmitter into a spreading rate 3 or IMT-DS mobile station receiver offset by 5 and 10 MHz respectively. ITU Category B is intended to apply to only Band Classes 6, 8, 9, 11 and 12.
TABLE A2-A-1.4-d
Adjacent multi-carrier spectrum emission limits for number of adjacent reverse CDMA channels, N ≠ 3
For |f | within the range(MHz) Emission limit
2.5 + ∆ to 3.5 + ∆ –13 dBm/(12.5 kHz × N) kHz3.5 + ∆ to 3.125 × (N + 1) –13 dBm/1 MHz
NOTE – All frequencies in the measurement bandwidth shall satisfy the restrictions on |∆ f | where ∆f = centre frequency – closer measurement edge frequency, f. ITU Category B is intended to apply to only Band Classes 6, 8, 9, 11 and 12. ∆ = (N – 3) × 625 kHz, where N is the number of carriers (N ≥ 2). Operation outside North America is for future study.
For a dual-band CDMA-HRPD (DB-CDMA-HRPD) capable terminal configured with • one 1X reverse link channel in band B1 and an HRPD reverse link channel in band B2
(the spectrum emissions below apply to both B1 and B2); or• one 1X reverse link channel in band B1 and two HRPD reverse link channels with the
maximum supported HRPD separation in band B2 (the spectrum emissions below apply to B1 only); or
• one 1X reverse link channel in band B1 and the maximum number of HRPD reverse link channels supportable in band B2, all adjacent to each other, (the spectrum emission below apply to B1 only);
the spectrum emissions with ten or more averages shall be less than:• The limits specified in Table A2-A-1.4-e when transmitting in Band Classes 0, 2, 5, 7, 9,
10, 11 or 12.

54 Rec. ITU-R M.1581-5
• The limits specified in Table A2-A-1.4-f when transmitting in Band Classes 1, 4, 6, 8, and 13.
• The limits specified in Table A2-A-1.4-g when transmitting in Band Class 3.• The limits specified in Table A2-A-1.4-h when transmitting in Band Classes 11 and 12.
TABLE A2-A-1.4-e
Band Classes 0, 2, 5, 7, 9, 10, 11 and 12 spectrum emission mask for DB-CDMA-HRPD
For |f | within the range(MHz) Emission limit
885 kHz to 1.98 MHz Less stringent of –42 dBc/30 kHz or –54 dBm/1.23 MHz1.25 MHz to 4.00 MHz(Band Class 10 only)
–13 dBm/30 kHz
1.98 MHz to 4.00 MHz Less stringent of –54 dBc/30 kHz or –54 dBm/1.23 MHz2.25 MHz to 4.00 MHz
(Band Class 7 only)–35 dBm/6.25 kHz
NOTE – All frequencies in the measurement bandwidth shall satisfy the restrictions on |f | where f is measured as the frequency offset from the centre frequency of each reverse CDMA channel.Emission limits shall apply between the reverse CDMA channels when maximum reverse link bandwidth ≥ 4 1.23 MHz.
TABLE A2-A-1.4-f
Band Classes 1, 4, 6, 8 and 13 spectrum emission mask for DB-CDMA-HRPD
For |f | within the range(MHz) Emission limit
1.25 MHz to 1.98 MHz Less stringent of –42 dBc/30 kHz or –54 dBm/1.23 MHz1.98 MHz to 4 MHz Less stringent of –50 dBc/30 kHz or –54 dBm/1.23 MHz2.25 MHz to 4 MHz
(Band Classes 6, 8, and 13 only)–[13 + 1× (Δf – 2.25 MHz)] dBm / 1 MHz
NOTE – All frequencies in the measurement bandwidth shall satisfy the restrictions on |f | where f where f is measured as the frequency offset from the centre frequency of each channel.Emission limits shall apply between the carriers when maximum reverse link bandwidth ≥ 4 1.25 MHz.
TABLE A2-A-1.4-g
Band Class 3 spectrum emission mask for DB-CDMA-HRPD
Measurement frequency
(MHz)
For |f | withinthe range Emission limit
> 815 and 850,> 887 and 889,> 893 and 901,> 915 and 925
900 kHz and< 1.98 MHz
–42 dBc/30 kHz
1.98 MHz 25 W (–16 dBm)/100 kHz; Pout 30 dBm–54 dBc/100 kHz; Pout > 30 dBm
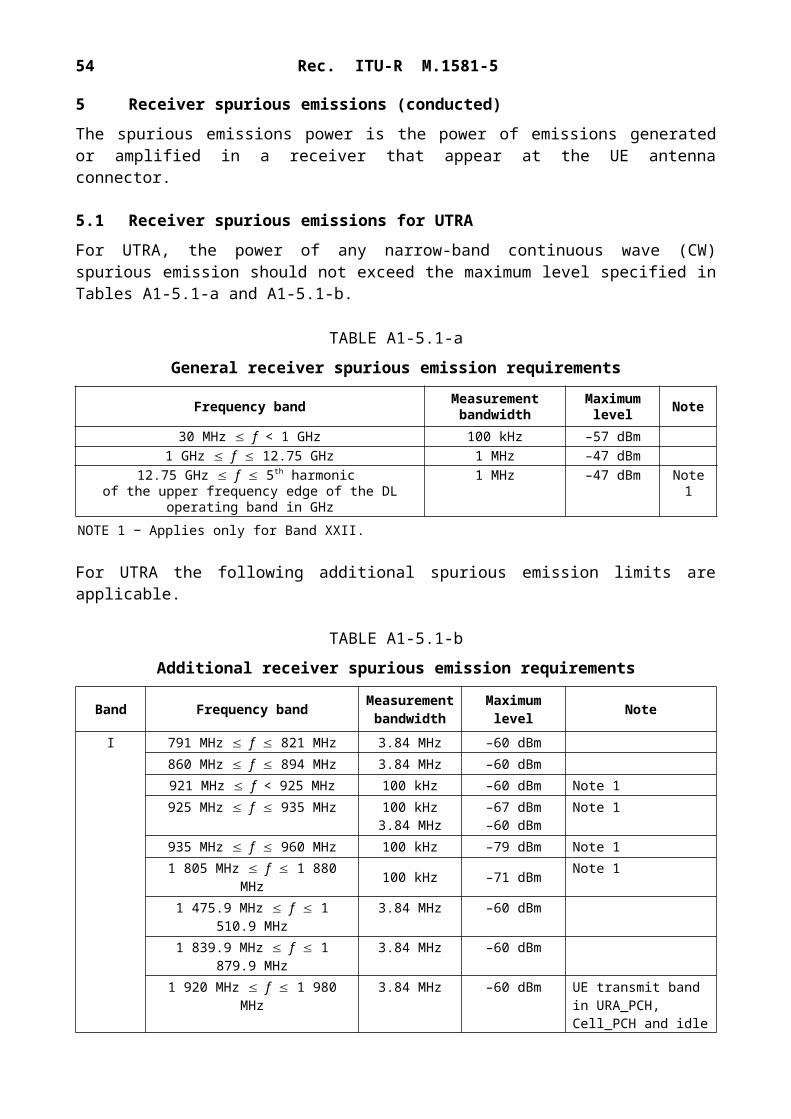
Rec. ITU-R M.1581-5 55
> 885 and 958,except
> 887 and 889,> 893 and 901,> 915 and 925
< 1.98 MHz 25 W (–16 dBm)/30 kHz; Pout 30 dBmLess stringent of –60 dBc/30 kHz
or 2.5 W (–26 dBm)/30 kHz; Pout > 30 dBm 1.98 MHz 25 W (–16 dBm)/100 kHz; Pout 30 dBm
Less stringent of –60 dBc/100 kHz or 2.5 W (–26 dBm)/100 kHz; Pout > 30 dBm
885 and > 958,except 815-850
< 1.98 MHz 25 W (–16 dBm)/30 kHz; Pout 30 dBmLess stringent of –60 dBc/30 kHz
or 2.5 W (–26 dBm)/30 kHz; Pout > 30 dBm 1.98 MHz 25 W (–16 dBm)/1 MHz; Pout 44 dBm
More stringent of –60 dBc/1 MHz and 20 mW (13 dBm)/1 MHz; Pout > 44 dBm
NOTE – All frequencies in the measurement bandwidth shall satisfy the restrictions on |f | where f = centre frequency – closer measurement edge frequency, f. The lower and upper limits of the frequency measurement are currently 10 MHz and 3 GHz in Japanese radio measurement documents.
TABLE A2-A-1.4-h
Additional Band Classes 11 and 12 spectrum emission mask for DB-CDMA-HRPD
For |f | within the range Emission limit
885 to 1.125 –47 – 7 (|f | – 885)/240 dBc in 30 kHz1.125 to 1.98 –54 – 13 (|f | – 1 125)/855 dBc in 30 kHz1.98 to 4.00 –67 – 15 (|f | – 1 980)/2 020 dBc in 30 kHz
4.00 to 10.00 –51 dBm in 100 kHz
NOTE 1 – All frequencies in the measurement bandwidth shall satisfy the restrictions on |f | where f = centre frequency – closer measurement edge frequency, f. Δf is positive offset from the highest valid CDMA channel in the band subclass or negative offset from the lowest valid CDMA channel in the band subclass. The emission limits for Band Classes 11 and 12 (European PAMR bands) are designed to allow coexistence with incumbent services in Europe and are tighter than ITU Category B requirements.NOTE 2 – Applies to Band Class 11 Subclasses 4 and 5 and Band Class 12 Subclass 1. The emission limit for Band Class 11 Subclasses 0, 1, 2, and 3 and Band Class 12 Subclass 0 are not specified.
For a dual-band CDMA-HRPD (DB-CDMA-HRPD) capable terminal configured with one 1X reverse link channel in band B1 and two HRPD reverse link channels with the maximum supported HRPD separation in band B2, the spectrum emissions in B2 with ten or more averages shall be less than the limits specified in Table A2-A-1.4-i when transmitting in Band Classes 0, 2, 3, 5, 7, 9, 10, 11 or 12, and less than the limit specified in Table A2-A-1.4-j when transmitting in Band Classes 1, 4, 6, and 8.
A single exception will be allowed for spurious emission frequencies between the two 2 HRPD reverse CDMA channels (for both Table A2-A-1.4-i and Table A2-A-1.4-j).
TABLE A2-A-1.4-i
Band Classes 0, 2, 3, 5, 7, 9, 10, 11 and 12 spectrum emission mask for DB-CDMA-HRPD
For |f | within the range Emission limit
885 kHz to 1.885 MHz 6 dBm/1 MHz> 1.885 MHz –13 dBm/1 MHz

56 Rec. ITU-R M.1581-5
NOTE – All frequencies in the measurement bandwidth shall satisfy the restrictions on |f | where f is measured as the frequency offset from the centre frequency of each reverse CDMA channel.Emission limits shall apply between the reverse CDMA channels when maximum reverse link bandwidth ≥ 4 1.23 MHz.
TABLE A2-A-1.4-j
Band Classes 1, 4, 6 and 8 spectrum emission mask for DB-CDMA-HRPD
For |f | within the range(MHz) Emission limit
1.25 to 2.25 6 dBm/1 MHz> 2.25 –13 dBm/1 MHz
NOTE – All frequencies in the measurement bandwidth shall satisfy the restrictions on |f | where f where f is measured as the frequency offset from the centre frequency of each channel.Emission limits shall apply between the carriers when maximum reverse link bandwidth ≥ 4 1.25 MHz.
For a dual-band CDMA-HRPD (DB-CDMA-HRPD) capable terminal configured with one 1X reverse link channel in band B1 and maximum number of HRPD reverse link channels supportable in band B2, all adjacent to each other, the spectrum emissions in B2 with ten or more averages shall be less than the limits specified in Tables A2-A-1.4-c and A2-A-1.4-d.
2 Transmitter spurious emissions (conducted)
When transmitting with spreading rate 1 or spreading rate 3, the spurious emissions shall be less than the limits specified in Tables A2-A-2-a and A2-A-2-b.
TABLE A2-A-2-a
Transmitter spurious emission limits for spreading rates 1 and 3, respectively (Category A)
For |f | within the range Frequency bandwidth Measurement bandwidth
Emission limit(dBm)
> 4 MHz for spreading rate 1
> 12.5 MHz for spreading rate 3
9 kHz < f < 150 kHz150 kHz < f < 30 MHz30 MHz < f < 1 GHz
1 GHz < f < 12.75 GHz
1 kHz10 kHz100 kHz1 MHz
–13 –13–13 –13
NOTE – All frequencies in the measurement bandwidth shall satisfy the restrictions on |f | where f = centre frequency – closer edge frequency, f, of the measurement filter.

Rec. ITU-R M.1581-5 57
TABLE A2-A-2-b
Transmitter spurious emission limits for spreading rates 1 and 3, respectively (Category B)
For |f | within the range Frequency bandwidth Measurement bandwidth
Emission limit(dBm)
> 4 MHz for spreading rate 1
> 12.5 MHz for spreading rate 3
9 kHz < f < 150 kHz150 kHz < f < 30 MHz30 MHz < f < 1 GHz
1 GHz < f < 12.75 GHz
1 kHz10 kHz100 kHz1 MHz
–36 –36–36 –30
NOTE – All frequencies in the measurement bandwidth shall satisfy the restrictions on |f | where f = centre frequency – closer edge frequency, f, of the measurement filter.
When transmitting with spreading rate 1 or spreading rate 3 in Band Class 6, the spurious emissions shall be less than the limits specified in Table A2-A-2-c.
TABLE A2-A-2-c
Additional Band Class 6 transmitter spurious emission limits for spreading rates 1 and 3, respectively
Measurement frequency
(MHz)
Measurement bandwidth
(kHz)
Emission limit(dBm) Victim band
1 884.5-1 915.7 300 41 PHS925-935 100 67 GSM 900935-960 100 79 GSM 900
1 805-1 880 100 71 DCS 1800
NOTE – Measurements apply only when the measurement frequency is at least 11.25 MHz (spreading rate 1) or 12.5 MHz (spreading rate 3) from the CDMA centre frequency. The non-PHS system band measurements are made on frequencies which are integer multiples of 200 kHz. As exceptions, up to five measurements with a level up to the spurious emission limits in Table A2-A-2-b are allowed.
When transmitting in Band Class 7, the transmitter spurious emissions with ten or more averages shall also be less than the requirements in Table A2-A-2-d.
TABLE A2-A-2-d
Additional Band Class 7 transmitter spurious emission limits
Transmission frequency
(MHz)
Measurement frequency
(MHz)Emission limit Victim band
776-788 763-775 –35 dBm/6.25 kHz Public safety788-793 769-775 –35 dBm/6.25 kHz Public safety776-788 793-805 –35 dBm/6.25 kHz Public safety788-793 799-805 –35 dBm/6.25 kHz Public safety

58 Rec. ITU-R M.1581-5
When transmitting in Band Classes 11 and 12, the transmitter spurious emissions with ten or more averages shall also be less than the requirements in Table A2-A-2-e.
TABLE A2-A-2-e
Additional Band Classes 11 and 12 transmitter spurious emission limits
For |f | withinthe range
Emission limit Band Class 11 Subclasses 4, 5; Band Class 12
Subclass 1
Emission limit Band Class 11 Subclasses 0, 1, 2, 3; Band
Class 12 Subclass 0
4.00 MHz to 10.0 MHz –51 dBm in 100 kHz Not specified
NOTE – All frequencies in the measurement bandwidth shall satisfy the restrictions on |f | where f = centre frequency – closer measurement edge frequency, f. f is positive offset from the highest valid CDMA channel in the band subclass or negative offset from the lowest valid CDMA channel in the band subclass. The emission limits for Band Classes 11 and 12 (European PAMR bands) are designed to allow coexistence with incumbent services in Europe and are tighter than ITU Category B requirements.
3 Adjacent channel leakage power ratio
For cdma2000 ACLR calculation, both the transmitted power and received power are measured with a rectangular filter. For cdma2000 system, the first adjacent channel offset is 2.5 MHz and the second adjacent channel offset is 3.75 MHz for band classes in 1 900 MHz. For cellular band in 800 or 450 MHz, the first adjacent channel offset is 1.5 MHz (1.515 MHz for Band Class 3) and the second adjacent channel offset is 2.73 MHz (2.745 MHz for Band Class 3). The receiver bandwidth is 1.23 MHz.
The ACLR calculated from the masks are as given in Table A2-A-3-a (assuming 23 dBm as transmit power).
TABLE A2-A-3-a
Mobile station ACLR limits
Band Class ACLR1(dB)
ACLR2(dB)
0 26.34 37.871 32.38 35.372 26.34 37.873 26.09 28.104 32.38 35.375 26.34 37.876 33.13 37.897 26.34 35.298 33.13 37.899 26.34 37.87
10 20.96 19.87
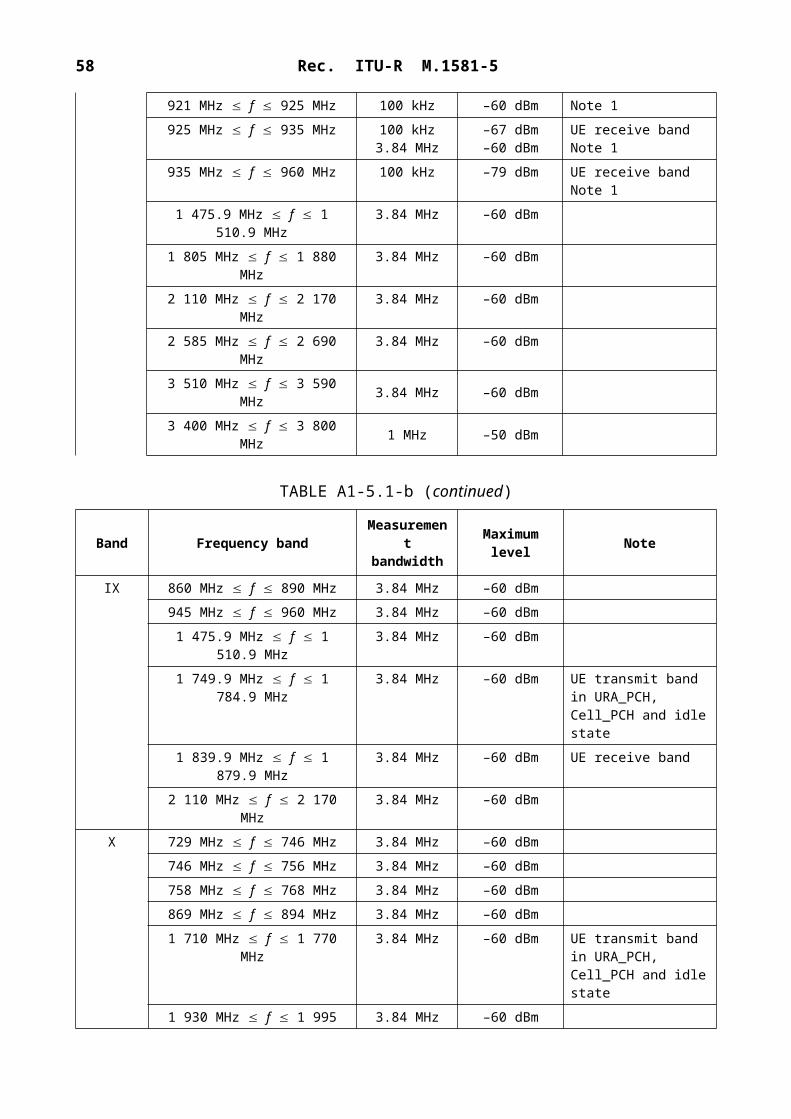
Rec. ITU-R M.1581-5 59
11 26.34 (HRPD)39.31 (cdma2000 1x)
39.41 (HRPD: band subclasses 4 and 5 only)
37.87 (HRPD)55.67 (cdma2000 1x; HRPD:band subclasses 4 and 5 only)
12 26.34 (HRPD)39.31 (cdma20001x)
39.41 (HRPD: band subclass 1 )
37.87 (HRPD)55.67 (cdma2000 1x; HRPD:
band subclass 1 only)13 33.13 37.8914 32.38 35.3715 32.38 35.37
For the cdma2000 system, the first adjacent channel offset is 2.5 MHz (ACLR1) and the second adjacent channel offset is 3.75 MHz for band classes in 1 900 MHz (ACLR2). for cellular band in 800 or 450 MHz, the first adjacent channel offset is 1.5 MHz (1.515 MHz for Band Class 3) (ACLR1) and the second adjacent channel offset is 2.73 MHz (2.745 MHz for Band Class 3) (ACLR2).
4 Receiver spurious emissions (conducted)
The conducted spurious emissions when not transmitting for a MS shall be less than the limits in Table A2-A-4-a.
TABLE A2-A-4-a
General receiver spurious emission requirements
Frequency band Measurement bandwidth
Maximum level(dBm) Note
30 MHz f < 1 GHz 100 kHz 57 Band Class 6 only.
1 GHz f 12.75 GHz 30 kHz –54
With the exception of the frequencies covered by Table 21, for which additional receiver spurious emission requirements apply.Band Class 3 only.
1 GHz f 12.75 GHz 1 MHz 47
With the exception of the frequencies covered by Table 19, for which additional receiver spurious emission requirements apply.
1 GHz f 12.75 GHz 30 kHz –47
With the exception of the frequencies covered by Table 21, for which additional receiver spurious emission requirements apply.All Band Classes except 3 and 6.
For all frequencies within the mobile station receive and transmit bands, the conducted emissions shall be below the limits in Table A2-A-4-b.

60 Rec. ITU-R M.1581-5
TABLE A2-A-4-b
Additional receiver spurious emission requirements
Measurement bandwidth(MHz)
Maximum level(dBm) Note
1 –61 Mobile transmit band
1 –76Mobile receive bandAll Band Classes except Band Class 3
1 –81 Mobile receive bandBand Class 3
PART B
Ultra mobile broadband (UMB)
1 Spectrum mask
TABLE A2-B-1-a
General spectral emission mask for different bandwidths
Offset from channel edge
(MHz)
5 MHzEmissions in dBm/measurement BW
10 MHzEmissions in dBm/measurement BW
20 MHzEmissions in dBm/measurement BW
MeasurementBW
0-1 –15 –18 –21 30 kHz1-5 –10 –10 –10 1 MHz5-6 –13 –13 –13 1 MHz6-10 –25 –13 –13 1 MHz10-15 –25 –13 1 MHz15-20 –13 1 MHz20-25 –25 1 MHz
TABLE A2-B-1-b
Additional spectral emission mask (A-SEM1) for different bandwidths
Offset from channel edge
(MHz)
5 MHzEmissions in dBm/measurement BW
10 MHzEmissions in dBm/measurement BW
20 MHzEmissions in dBm/measurement BW
MeasurementBW
0-1 –15 –18 –21 30 kHz1-5 –13 –13 –13 1 MHz5-6 –13 –13 –13 1 MHz6-10 –13 –13 –13 1 MHz10-15 –13 –13 1 MHz15-20 –13 1 MHz

Rec. ITU-R M.1581-5 61
20-25 –13 1 MHz
TABLE A2-B-1-c
Additional spectral emission mask (A-SEM2) for different bandwidths
Offset from channel edge
(MHz)
5 MHzEmissions in dBm/measurement BW
10 MHzEmissions in dBm/measurement BW
20 MHzEmissions in dBm/measurement BW
MeasurementBW
0-1 –15 –18 –21 30 kHz1-5.5 –15 –13 –13 1 MHz5.5-10 –25 –25 –25 1 MHz10-15 –25 –25 1 MHz15-25 –25 1 MHz
TABLE A2-B-1-d
SEM as a function of the channel BW
Channel bandwidth (MHz) 5 10 20SEM (MHz) 10 15 25
2 Transmitter spurious emission
TABLE A2-B-2-a
Spurious requirements – ITU Category A
Frequency range Maximum Level Measurement BW
9 kHz f < 150 kHz –13 dBm 1 kHz150 kHz f < 30 MHz –13 dBm 10 kHz30 MHz f < 1 GHz –13 dBm 100 kHz1 GHz f < 10 GHz –13 dBm 1 MHz
TABLE A2-B-2-b
Spurious requirements – ITU Category B
Frequency range Maximum Level Measurement BW
9 kHz f < 150 kHz –36 dBm 1 kHz150 kHz f < 30 MHz –36 dBm 10 kHz30 MHz f < 1 GHz –36 dBm 100 kHz1 GHz f < 10 GHz –30 dBm 1 MHz

62 Rec. ITU-R M.1581-5
TABLE A2-B-2-c
PHS coexistence emission requirements
Frequency range Maximum Level Measurement BW
1884.5 MHz f < 1915.7 MHz –41 dBm 300 kHz
3 Adjacent channel leakage power ratio
TABLE A2-B-3
ACLR specifications
Channel bandwidth (MHz) 5 MHz 10 MHz 20 MHz
ACLR1 (dB) 30 30 30ACLR2 (dB) 36 36 36Signal and adjacent channel measurement BW (MHz) 4.61 9.22 18.44
Current region-specific radio regulation rules shall also apply.
Annex 3
CDMA TDD (UTRA TDD) mobile stations
1 Measurement uncertainty
Values specified in this Annex differ from those specified in Recommendation ITU-R M.1457 since values in this Annex incorporate test tolerances defined in Recommendation ITU-R M.1545.
2 Spectrum mask
2.1 Spectrum mask (3.84 Mchip/s UTRA TDD option)
The spectrum emission mask of the MS applies to frequency offsets (f) between 2.5 and 12.5 MHz on both sides of the carrier frequency.
The out-of-channel emission is specified as a power level relative to the MS output power in a frequency band of 3.84 MHz bandwidth.
The power of any MS emission should not exceed –48.5 dBm/3.84 MHz or the levels specified in Table A3-2.1, whichever is higher.

Rec. ITU-R M.1581-5 63
TABLE A3-2.1
Spectrum emission mask requirement (3.84 Mchip/s TDD option)
Δf (Note 1)(MHz) Minimum requirement Measurement bandwidth
2.5-3.5 –33.5 – 15(1) (f/MHz – 2.5) dBc 30 kHz (Note 2)3.5-7.5 –33.5 – 1(1) (f/MHz – 3.5) dBc 1 MHz (Note 3)7.5-8.5 –37.5 – 10(1) (f/MHz – 7.5) dBc 1 MHz (Note 3)
8.5-12.5 –47.5 dBc 1 MHz (Note 3)
NOTE 1 – f is the separation between the carrier frequency and the centre of the measuring filter.NOTE 2 – The first and last measurement positions with a 30 kHz filter at f equals 2.515 MHz and 3.485 MHz.NOTE 3 – The first and last measurement positions with a 1 MHz filter at f equals 4 MHz and 12 MHz. As a general rule, the resolution bandwidth of the measuring equipment should be equal to the measurement bandwidth. To improve measurement accuracy, sensitivity and efficiency, the resolution bandwidth can be different from the measurement bandwidth. When the resolution bandwidth is smaller than the measurement bandwidth, the result should be integrated over the measurement bandwidth in order to obtain the equivalent noise bandwidth of the measurement bandwidth.NOTE – The lower limit should be –48.5 dBm/3.84 MHz or the minimum requirement presented in this Table, whichever is the higher.
2.2 Spectrum mask (1.28 Mchip/s UTRA TDD option)
The spectrum emission mask of the MS applies to frequency offsets between 0.8 and 4.0 MHz on both sides of the carrier frequency.
The out-of-channel emission is specified as a power level relative to the MS output power in a frequency band of 1.6 MHz bandwidth.
TABLE A3-2.2
Spectrum emission mask requirement (1.28 Mchip/s TDD option)
Δf (Note 1)(MHz) Minimum requirement Measurement bandwidth
0.8-1.8 –33.5 – 14(1)(f/MHz – 0.8) dBc(Note 3)
30 kHz (Note 2)
1.8-2.4 –47.5 – 17(1)(f/MHz – 1.8) dBc(Note 3)
30 kHz (Note 2)
2.4-4.0 –42.5 dBc (Note 3) 1 MHz (Note 3)
NOTE 1 − f is the separation between the carrier frequency and the centre of the measuring filter.NOTE 2 − The first and last measurement positions with a 30 kHz filter at f equals to 0.815 MHz and 2.385 MHz.NOTE 3 − The first and last measurement positions with a 1 MHz filter at f equals 2.9 MHz and 3.5 MHz. As a general rule, the resolution bandwidth of the measuring equipment should be equal to the measurement bandwidth. To improve measurement accuracy, sensitivity and efficiency, the resolution bandwidth can be different from the measurement bandwidth. When the resolution bandwidth is smaller than the measurement bandwidth, the result should be integrated over the measurement bandwidth in order to obtain the equivalent noise bandwidth of the measurement bandwidth.NOTE – The lower limit should be –53.5 dBm/1.28 MHz or the minimum requirement presented in this Table, whichever is the higher.

64 Rec. ITU-R M.1581-5
2.3 Spectrum mask (7.68 Mchip/s UTRA TDD option)
The spectrum emission mask of the UE applies to frequencies which are between 5 MHz and 25 MHz from the UE centre carrier frequency. The outofchannel emission is specified relative to the RRC filtered mean power of the UE carrier.
The power of any UE emission should not exceed the levels specified in Table A3-2.3.
TABLE A3-2.3
Spectrum emission mask requirement (7.68 Mchip/s TDD option)
Δf (Note 1)(MHz) Minimum requirement Measurement bandwidth
5.0-5.75 {−36 .5−10 .67⋅( ΔfMHz
−5 .0)} dBc 30 kHz (Note 2)
5.75-7.0 {−44 .5−5. 6⋅( ΔfMHz
−5 .75)} dBc 30 kHz (Note 2)
7.0-15.0 {−36 .5−0 . 5⋅( ΔfMHz
−7 . 0)} dBc 1 MHz (Note 3)
15.0-17.0 {−40 . 5−5 . 0⋅( ΔfMHz
−15 . 0)} dBc 1 MHz (Note 3)
17.0-25.0 –51.5 dBc 1 MHz (Note 3)
NOTE 1 − f is the separation between the carrier frequency and the centre of the measuring filter.NOTE 2 − The first and last measurement positions with a 30 kHz filter at f equals 5.015 MHz and 6.985 MHz.NOTE 3 − The first and last measurement positions with a 1 MHz filter at f equals 7.5 MHz and 24.5 MHz. As a general rule, the resolution bandwidth of the measuring equipment should be equal to the measurement bandwidth. To improve measurement accuracy, sensitivity and efficiency, the resolution bandwidth can be different from the measurement bandwidth. When the resolution bandwidth is smaller than the measurement bandwidth, the result should be integrated over the measurement bandwidth in order to obtain the equivalent noise bandwidth of the measurement bandwidth.NOTE – The lower limit should be –47 dBm/7.68 MHz or the minimum requirement presented in this Table, whichever is the higher.
2.4 E-UTRA spectrum mask
The output UE transmitter spectrum consists of the three components; the emission within the occupied bandwidth (channel bandwidth), the OoB emissions and the far out spurious emission domain (see Fig. 3).
The spectrum emission mask of the MS applies to frequencies (ΔfOOB) starting from the ± edges of the assigned E-UTRA channel bandwidth. For frequencies greater than (ΔfOOB) as specified in Table A3-2.4.1-a the spurious requirements in § 4 are applicable.

Rec. ITU-R M.1581-5 65
FIGURE 3
2.4.1 General E-UTRA spectrum mask
The power of any MS emission shall not exceed the levels specified in Table A3-2.4.1-a for the specified channel bandwidths.
TABLE A3-2.4.1-a
General E-UTRA spectrum emission mask, E-UTRA bands ≤ 3 GHz
ΔfOOB
(MHz)
Spectrum emission limit (dBm)/Channel bandwidth
1.4 MHz 3 MHz 5 MHz 10 MHz 15 MHz 20 MHz Measurement bandwidth
0-1 –8.5 –11.5 –13.5 –16.5 –18.5 –19.5 30 kHz1-2.5 –8.5 –8.5 –8.5 –8.5 –8.5 –8.5 1 MHz
2.5-2.8 –23.5 –8.5 –8.5 –8.5 –8.5 –8.5 1 MHz2.8-5 –8.5 –8.5 –8.5 –8.5 –8.5 1 MHz5-6 –23.5 –11.5 –11.5 –11.5 –11.5 1 MHz6-10 –23.5 –11.5 –11.5 –11.5 1 MHz10-15 –23.5 –11.5 –11.5 1 MHz15-20 –23.5 –11.5 1 MHz20-25 –23.5 1 MHz
NOTE 1 − The first and last measurement position with a 30 kHz filter is at Δ fOOB equals to 0.015 MHz and 0.985 MHz.NOTE 2 − At the boundary of spectrum emission limit, the first and last measurement position with a 1 MHz filter is the inside of +0.5 MHz and –0.5 MHz, respectively.NOTE 3 − The measurements are to be performed above the upper edge of the channel and below the lower edge of the channelNOTE 4 − For the 2.5-2.8 MHz offset range with 1.4 MHz channel bandwidth, the measurement position is at ΔfOOB equals to 3 MHz.
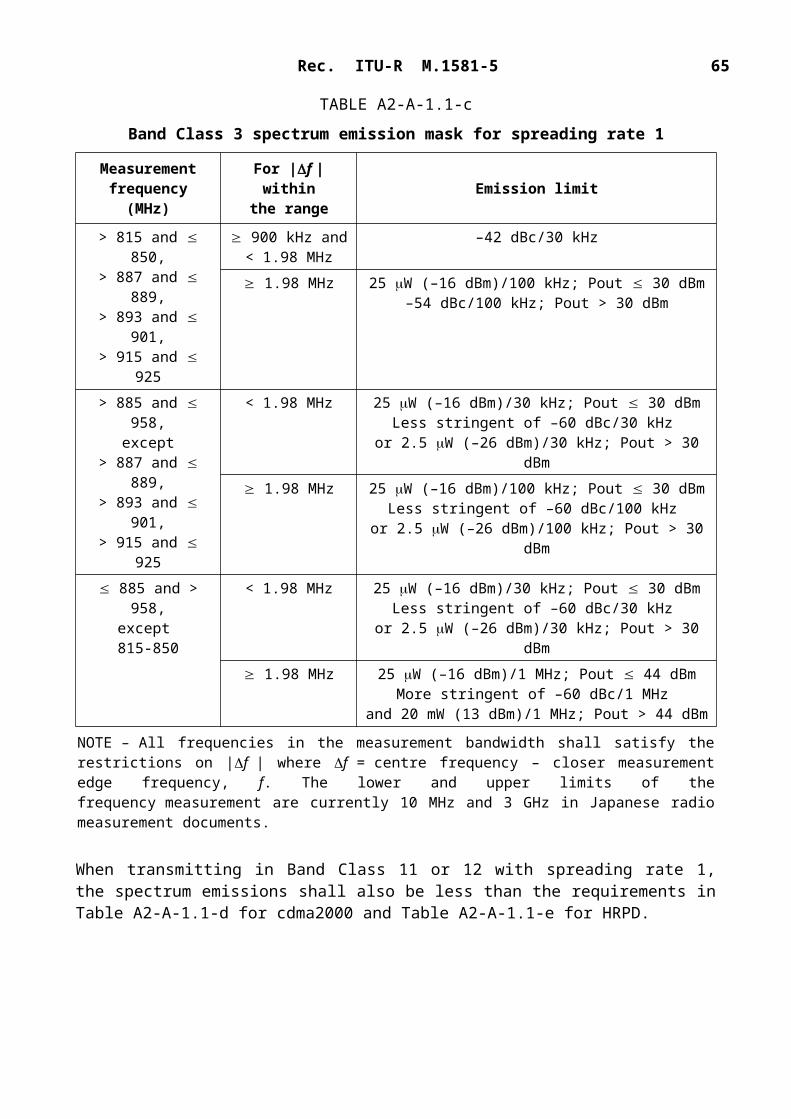
66 Rec. ITU-R M.1581-5
TABLE A3-2.4.1-b
General E-UTRA spectrum emission mask, 3 GHz < E-UTRA bands ≤ 4.2 GHz
Spectrum emission limit (dBm)/Channel bandwidth
ΔfOOB
(MHz) 1.4 MHz 3.0 MHz 5 MHz 10 MHz 15 MHz 20 MHz Measurement bandwidth
0-1 –8.2 –11.2 –13.2 –16.2 –18.2 –19.2 30 kHz1-2.5 –8.2 –8.2 –8.2 –8.2 –8.2 –8.2 1 MHz
2.5-2.8 –23.2 1 MHz2.8-5 1 MHz5-6 –23.2 –11.2 –11.2 –11.2 –11.2 1 MHz
6-10 –23.2 1 MHz10-15 –23.2 1 MHz15-20 –23.2 1 MHz20-25 –23.2 1 MHz
NOTE 1 − The first and last measurement position with a 30 kHz filter is at Δ fOOB equals to 0.015 MHz and 0.985 MHz.NOTE 2 − At the boundary of spectrum emission limit, the first and last measurement position with a 1 MHz filter is the inside of +0.5 MHz and –0.5 MHz, respectively.NOTE 3 − The measurements are to be performed above the upper edge of the channel and below the lower edge of the channel.NOTE 4 − For the 2.5-2.8 MHz offset range with 1.4 MHz channel bandwidth, the measurement position is at ΔfOOB equals to 3 MHz.NOTE – As a general rule, the resolution bandwidth of the measuring equipment should be equal to the measurement bandwidth. However, to improve measurement accuracy, sensitivity and efficiency, the resolution bandwidth may be smaller than the measurement bandwidth. When the resolution bandwidth is smaller than the measurement bandwidth, the result should be integrated over the measurement bandwidth in order to obtain the equivalent noise bandwidth of the measurement bandwidth.
2.4.2 Additional E-UTRA spectrum mask
Additional spectrum emission requirements can be signalled by the network to indicate that the UE shall also meet additional requirements in a specific deployment scenario described in Table A3-2.4.2.
TABLE A3-2.4.2
Network signallings for additional spectrum emission requirements
Network signallingvalue
Requirements(subclause) EUTRA Band Channel bandwidth
(MHz)
NS_01 N/A (Note) N/A N/ANS_03 N/A (Note) 35, 36 3, 5, 10, 15, 20NS_04 § 2.4.2.2 41 5, 10, 15, 20
NOTE – The signalling is for purposes other than additional spectrum mask requirement.

Rec. ITU-R M.1581-5 67
2.4.2.1 Additional E-UTRA spectrum mask with network signalled value of “NS_03”
When “NS_03” is indicated in the cell, the power of any UE emission shall fulfil requirements in Table A3-2.4.2.1-a.
TABLE A3-2.4.2.1-a
Additional requirements (network signalled value “NS_03”), E-UTRA bands ≤ 3 GHz
Spectrum emission limit (dBm)/Channel bandwidth
ΔfOOB
(MHz) 1.4 MHz 3.0 MHz 5 MHz 10 MHz 15 MHz 20 MHz Measurementbandwidth
0-1 –8.5 –11.5 –13.5 –16.5 –18.5 –19.5 30 kHz1-2.5 –11.5 –11.5 –11.5 –11.5 –11.5 –11.5 1 MHz2.5-5 –23.5 1 MHz5-6 –23.5 1 MHz
6-10 –23.5 1 MHz10-15 –23.5 1 MHz15-20 –23.5 1 MHz20-25 –23.5 1 MHz
TABLE A3-2.4.2.1-b
Additional requirements (network signalled value “NS_03”), 3 GHz < E-UTRA bands ≤ 4.2 GHz
Spectrum emission limit (dBm)/Channel bandwidth
ΔfOOB
(MHz) 1.4 MHz 3.0 MHz 5 MHz 10 MHz 15 MHz 20 MHz Measurementbandwidth
0-1 –8.2 –11.2 –13.2 –16.2 –18.2 –19.2 30 kHz1-2.5 –11.2 –11.2 –11.2 –11.2 –11.2 –11.2 1 MHz2.5-5 –23.2 1 MHz5-6 –23.2 1 MHz
6-10 –23.2 1 MHz10-15 –23.2 1 MHz15-20 –23.2 1 MHz20-25 –23.2 1 MHz
NOTE 1 – The first and last measurement position with a 30 kHz filter is at ΔfOOB equals to 0.015 MHz and 0.985 MHz.NOTE 2 – At the boundary of spectrum emission limit, the first and last measurement position with a 1 MHz filter is the inside of +0.5 MHz and –0.5 MHz, respectively.NOTE 3 – The measurements are to be performed above the upper edge of the channel and below the lower edge of the channel.NOTE 4 – Above SEM requirement applies to bands corresponding to network signalling value NS_03 as defined in Table A3-2.4.1-a.NOTE 5 − For the 2.5-2.8 MHz offset range with 1.4 MHz channel bandwidth, the measurement position is at ΔfOOB equals to 3 MHz.

68 Rec. ITU-R M.1581-5
NOTE – As a general rule, the resolution bandwidth of the measuring equipment should be equal to the measurement bandwidth. However, to improve measurement accuracy, sensitivity and efficiency, the resolution bandwidth may be smaller than the measurement bandwidth. When the resolution bandwidth is smaller than the measurement bandwidth, the result should be integrated over the measurement bandwidth in order to obtain the equivalent noise bandwidth of the measurement bandwidth.
2.4.2.2 Additional E-UTRA spectrum mask with Network Signalled Value of “NS_04”
When “NS_04” is indicated in the cell, the power of any UE emission shall fulfil requirements in Table A3-2.4.2.2.
TABLE A3-2.4.2.2
Additional requirements (network signalled value “NS_04”), E-UTRA bands ≤ 3GHz
Spectrum emission limit (dBm)/Channel bandwidth
ΔfOOB
(MHz) 1.4 MHz 3.0 MHz 5 MHz 10 MHz 15 MHz 20 MHz Measurementbandwidth
0-1 –8.5 –11.5 –13.5 –16.5 –18.5 –19.5 30 kHz1-2.5 –11.5 –11.5 –11.5 –11.5 –11.5 –11.5 1 MHz2.5-5 –23.5 1 MHz5-6 –23.5 –23.5 –23.5 –23.5 –23.5 1 MHz6-10 1 MHz
10-15 1 MHz15-20 1 MHz20-25 1 MHz
NOTE 1 – The first and last measurement position with a 30 kHz filter is at ΔfOOB equals to 0.015 MHz and 0.985 MHz.NOTE 2 – At the boundary of spectrum emission limit, the first and last measurement position with a 1 MHz filter is the inside of +0.5 MHz and –0.5 MHz, respectively.NOTE 3 – The measurements are to be performed above the upper edge of the channel and below the lower edge of the channel.NOTE 4 – Above SEM requirement applies to bands corresponding to network signalling value NS_04 as defined in Table A3-2.4.2.NOTE 5 − For the 2.5-2.8 MHz offset range with 1.4 MHz channel bandwidth, the measurement position is at ΔfOOB equals to 3 MHz.NOTE – As a general rule, the resolution bandwidth of the measuring equipment should be equal to the measurement bandwidth. However, to improve measurement accuracy, sensitivity and efficiency, the resolution bandwidth may be smaller than the measurement bandwidth. When the resolution bandwidth is smaller than the measurement bandwidth, the result should be integrated over the measurement bandwidth in order to obtain the equivalent noise bandwidth of the measurement bandwidth.
3 ACLR
3.1 ACLR for UTRA
ACLR is the ratio of the transmitted power to the power measured after a receiver filter in the adjacent channel(s). Both the transmitted power and the received power are measured through a matched filter (root raised cosine and rolloff 0.22) with a noise power bandwidth equal to the chip rate. The requirements should apply whatever the type of transmitter considered (single carrier or

Rec. ITU-R M.1581-5 69
multicarrier). It applies for all transmission modes foreseen by the manufacturer’s specification. The limit for ACLR should be as specified in Table A3-3.1.
TABLE A3-3.1
a) MS ACLR limits for 3.84 Mchip/s TDD option
Power class Adjacent channel ACLR limit(dB)
2, 3 MS channel ± 5 MHz 32.22, 3 MS channel ± 10 MHz 42.2
b) MS ACLR limits for 1.28 Mchip/s TDD option
Power class Adjacent channel ACLR limit(dB)
2, 3 MS channel ± 1.6 MHz 32.22, 3 MS channel ± 3.2 MHz 42.2
c) MS ACLR limits for 7.68 Mchip/s TDD option
Power class Adjacent channelChip rate for RRCmeasurement filter
(MHz)
ACLR limit(dB)
2, 3 MS channel ± 7.5 MHz 3.84 32.82, 3 MS channel ± 12.5 MHz 3.84 42.22, 3 MS channel ± 10.0 MHz 7.68 32.82, 3 MS channel ± 20.0 MHz 7.68 42.2
3.2 ACLR for E-UTRA
ACLR is the ratio of the filtered mean power centred on the assigned channel frequency to the filtered mean power centred on an adjacent channel frequency. The ACLR requirements are specified for two scenarios: for (an) adjacent E-UTRA and/or UTRA channels (see Fig. 4).
FIGURE 4

70 Rec. ITU-R M.1581-5
3.2.1 Limits for E-UTRA
E-UTRA adjacent channel leakage power ratio (E-UTRAACLR) is the ratio of the filtered mean power centred on the assigned channel frequency to the filtered mean power centred on an adjacent channel frequency. The E-UTRA on channel and adjacent channel power is measured with a rectangular measurement bandwidth filter. If the measured adjacent channel power is greater than −50 dBm then the measured E-UTRAACLR shall be higher than the limits in Table A3-3.2.1.
TABLE A3-3.2.1
General requirements for E-UTRAACLR
Channel bandwidth/E-UTRAACLR1/measurement bandwidth
1.4 MHz 3 MHz 5 MHz 10 MHz 15 MHz 20 MHz
E-UTRAACLR1 29.2 dB 29.2 dB 29.2 dB 29.2 dB 29.2 dB 29.2 dBE-UTRA channel measurement bandwidth
1.08 MHz 2.7 MHz 4.5 MHz 9.0 MHz 13.5 MHz 18 MHz
UE channel +1.4 MHz or
–1.4 MHz
+3 MHz or –3 MHz
+5 MHz or–5 MHz
+10 MHz or–10 MHz
+15 MHz or–15 MHz
+20 MHz or–20 MHz
3.2.2 Limits for EUTRA for UTRA coexistence in the same geographical area
For adjacent UTRA carriers the limits should be as specified in Table A3-3.2.2.
UTRA adjacent channel leakage power ratio (UTRAACLR) is the ratio of the filtered mean power centred on the assigned EUTRA channel frequency to the filtered mean power centred on an adjacent(s) UTRA channel frequency.
UTRA adjacent channel leakage power ratio is specified for both the first UTRA 5 MHz adjacent channel (UTRAACLR1) and the 2nd UTRA 5 MHz adjacent channel (UTRAACLR2). The UTRA channel is measured with a 3.84 MHz RRC bandwidth filter with rolloff factor = 0.22. The E-TRA channel is measured with a rectangular measurement bandwidth filter. If the measured UTRA channel power is greater than –50 dBm then the measured UTRAACLR1, UTRAACLR2 shall be higher than the limits in Table A3-3.2.2.
TABLE A3-3.2.2
Additional requirements
Channel bandwidth/UTRAACLR1/2/measurement bandwidth
1.4 MHz 3.0 MHz 5 MHz 10 MHz 15 MHz 20 MHz
UTRAACLR1 32.2 dB 32.2 dB 32.2 dB 32.2 dB 32.2 dB 32.2 dB
Adjacent channel centre frequency offset (MHz)
0.7+ BWUTRA/2/
–0.7- BWUTRA/2
1.5+ BWUTRA/2/
–1.5- BWUTRA/2
2.5+BWUTRA/2
5+BWUTRA/2
7.5+BWUTRA/2
10+BWUTRA/2
UTRAACLR2 – – 35.2 dB 35.2 dB 35.2 dB 35.2 dB
Adjacent channel centre frequency offset (MHz)
– – 2.5+3*BWUTRA/2
5+3*BWUTRA/2
7.5+3*BWUTRA/2
10+3*BWUTRA/2

Rec. ITU-R M.1581-5 71
TABLE A3-3.2.2 (end)
Channel bandwidth/UTRAACLR1/2/measurement bandwidth
1.4 MHz 3.0 MHz 5 MHz 10 MHz 15 MHz 20 MHz
E-UTRA channel measurement bandwidth
1.08 MHz 2.7 MHz 4.5 MHz 9.0 MHz 13.5 MHz 18 MHz
UTRA 5 MHz channel measurement bandwidth(1)
3.84 MHz 3.84 MHz 3.84 MHz 3.84 MHz 3.84 MHz 3.84 MHz
UTRA 1.6 MHz channel measurement bandwidth(2)
1.28 MHz 1.28 MHz 1.28 MHz 1.28 MHz 1.28 MHz 1.28 MHz
(1) Applicable for EUTRA FDD coexistence with UTRA FDD in paired spectrum.(2) Applicable for EUTRA TDD coexistence with UTRA TDD in unpaired spectrum.
4 Transmitter spurious emissions (conducted)
4.1 Transmitter spurious emissions for UTRA
For UTRA, the spurious emissions should be less than the limits specified in Tables A3-4.1-a to A3-4.1-d. The following requirements are only applicable for MS centre carrier frequency offsets greater than 12.5 MHz (3.84 Mchip/s TDD option), 4 MHz (1.28 Mchip/s TDD option) or 25 MHz (7.68 Mchip/s TDD option).
TABLE A3-4.1-a
General spurious emissions requirements for UTRA
Frequency band Measurement bandwidth Minimum requirement(dBm)
9 kHz f < 150 kHz 1 kHz –36150 kHz f < 30 MHz 10 kHz –36
30 MHz f < 1 000 MHz 100 kHz –361 GHz f < 12.75 GHz 1 MHz –30

72 Rec. ITU-R M.1581-5
TABLE A3-4.1-b
Additional spurious emissions requirements (3.84 Mchip/s TDD option)
Frequency bandwidth Measurement bandwidth Minimum requirement (dBm)
921 MHz f < 925 MHz 100 kHz –60 (Note 1)925 MHz f 935 MHz 100 kHz –67 (Note 1)935 MHz < f 960 MHz 100 kHz –79 (Note 1)
1 805 MHz f 1 880 MHz 100 kHz –71 (Note 1)1 884.5 MHz f 1 919.6 MHz 300 kHz –41 (Note 2)
2 620 MHz f 2 690 MHz 3.84 MHz –37 (Note 1)
NOTE 1 – The measurements are made on frequencies which are integer multiples of 200 kHz. As exceptions, up to five measurements with a level up to the applicable requirements defined in Table A3-4.1-a are permitted for each UARFCN used in the measurement.NOTE 2 – Applicable for transmission in 2 010-2 025 MHz.
TABLE A3-4.1-c
Additional spurious emissions requirements (1.28 Mchip/s TDD option)
Operating band Frequency bandwidth Measurement
bandwidthMinimum
requirement
a
921 MHz f < 925 MHz 100 kHz –60 dBm (Note 1)925 MHz f 935 MHz 100 kHz –67 dBm (Note 1)935 MHz < f 960 MHz 100 kHz –79 dBm (Note 1)
1 805 MHz f 1 880 MHz 100 kHz –71 dBm (Note 1)2 010 MHz f 2 025 MHz 1 MHz –65 dBm (Note 2)1 900 MHz f 1 920 MHz 1 MHz –65 dBm (Note 3)
b1 850 MHz f 1 910 MHz 1 MHz –65 dBm (Note 4)1 930 MHz f 1 990 MHz 1 MHz –65 dBm (Note 5)2 010 MHz f 2 025 MHz 1 MHz –65 dBm
c 2 010 MHz f 2 025 MHz 1 MHz –65 dBm
d1 900 MHz f 1 920 MHz 1 MHz –65 dBm2 010 MHz f 2 025 MHz 1 MHz –65 dBm2 620 MHz f 2 690 MHz 3.84 MHz –37 dBm
e
921 MHz f < 925 MHz 100 kHz –60 dBm (Note 1)925 MHz f 935 MHz 100 kHz –67 dBm (Note 1)935 MHz < f 960 MHz 100 kHz –79 dBm (Note 1)
1 805 MHz f 1 880 MHz 100 kHz –71 dBm (Note 1)1 900 MHz f 1 920 MHz 1 MHz –65 dBm2 010 MHz f 2 025 MHz 1 MHz –65 dBm

Rec. ITU-R M.1581-5 73
TABLE A3-4.1-c (end)
Operating band Frequency bandwidth Measurement
bandwidthMinimum
requirement
f
921 MHz f < 925 MHz 100 kHz –60 dBm (Note 1)925 MHz < f < 935 MHz 100 kHz –67 dBm (Note 1)935 MHz < f < 960 MHz 100 kHz –79 dBm (Note 1)
1 805 MHz f 1 850 MHz 100 kHz –71 dBm (Note 1)2 010 MHz f 2 025 MHz 1 MHz –65 dBm2 300 MHz f 2 400 MHz 1 MHz –65 dBm
NOTE 1 – The measurements are made on frequencies which are integer multiples of 200 kHz. As exceptions, up to five measurements with a level up to the applicable requirements defined in Table A2-A-2-a are permitted for each UTRA absolute radio frequency channel number (UARFCN) used in the measurement.NOTE 2 – This requirement is only applicable when UE operating in 1 900-1 920 MHz of band a.NOTE 3 – This requirement is only applicable when UE operating in 2 010-2 025 MHz of band a.NOTE 4 – This requirement is only applicable when UE operating in 1 930-1 990 MHz of band b.NOTE 5 – This requirement is only applicable when UE operating in 1 850-1 910 MHz of band b.
TABLE A3-4.1-d
Additional spurious emissions requirements (7.68 Mchip/s TDD option)
Frequency bandwidth Measurement bandwidth Minimum requirement(dBm)
921 MHz f < 925 MHz 100 kHz –60 (Note 1)925 MHz f 935 MHz 100 kHz –67 (Note 1)935 MHz < f 960 MHz 100 kHz –79 (Note 1)
1 805 MHz f 1 880 MHz 100 kHz –71 (Note 1)2 620 MHz f 2 690 MHz 3.84 MHz –37 (Note 1)
1 884.5 MHz f 1 919.6 MHz 300 kHz –41 (Note 2)
NOTE 1 – The measurements are made on frequencies which are integer multiples of 200 kHz. As exceptions, up to five measurements with a level up to the applicable requirements defined in Table A3-4.1-a are permitted for each absolute RF channel used in the measurement.NOTE 2 – Applicable for transmission in 2 010-2 025 MHz.
4.1.1 Additional requirement for 1.28 Mcps TDD MC-HSUPA4
The spurious emission limits apply for the frequency ranges that are more than ΔfOOB (MHz) in 3GPP TS 25.1025, Table 6.7g from the edge of the channel bandwidth and are only applicable for multi-carrier transmission.
4 Multi-carrier high-speed uplink packet access.5 3GPP TS 25.102: 3rd Generation Partnership Project; Technical Specification Group Radio Access
Network; User Equipment (UE) radio transmission and reception (TDD).
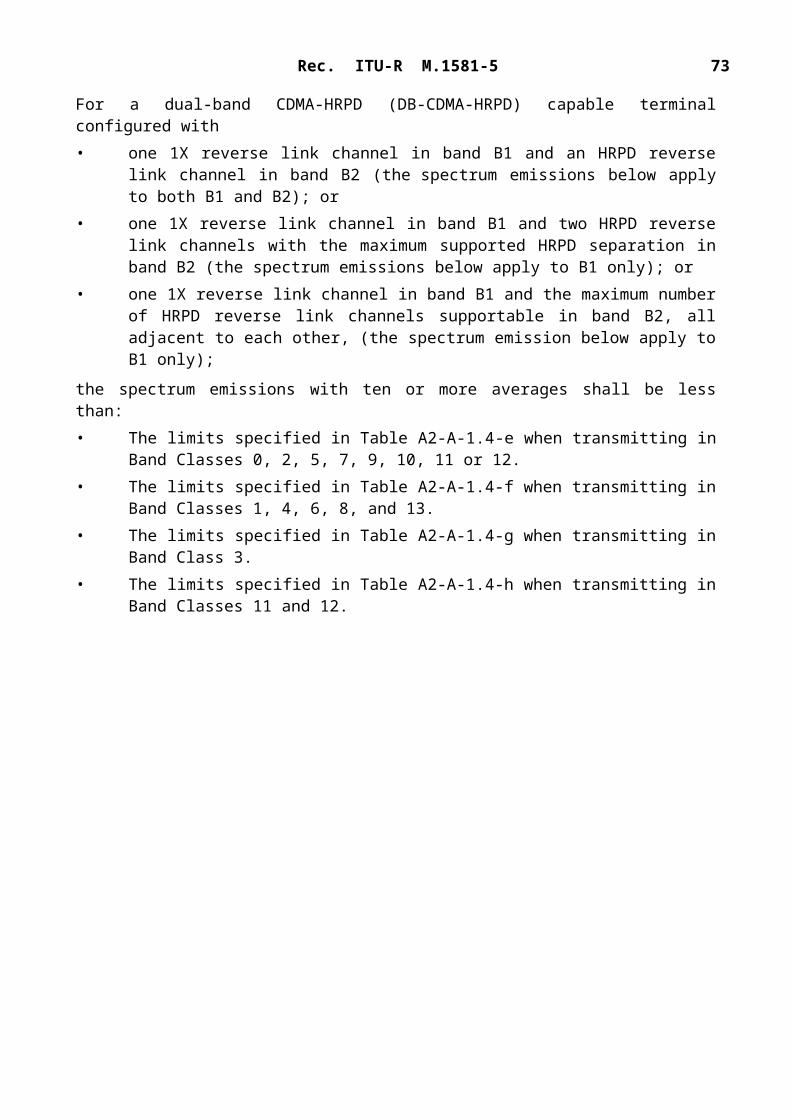
74 Rec. ITU-R M.1581-5
TABLE A3-4.1.1-a
Boundary between ΔfOOB and spurious emission domain
Channel bandwidth Transmission Carrier Number
2 3 6ΔfOOB (MHz) 6 10 15
The spurious emission limits in Table A3-4.1-a and Table A3-4.1-c apply for all transmission carrier number configurations.NOTE − In order that the measurement of spurious emissions falls within the frequency ranges that are more than ΔfOOB (MHz) from the edge of the channel bandwidth, the minimum offset of the measurement frequency from each edge of the channel should be ΔfOOB + 0.8.
4.2 Transmitter spurious emissions for E-UTRA
For E-UTRA, the spurious emission limits apply for frequency ranges that are more than ΔfOOB (MHz) from the edge of the channel bandwidth (Table A3-4.2-a).
TABLE A3-4.2-a
Boundary between E-UTRA ΔfOOB and spurious emission domain
Channel bandwidth 1.4 MHz 3.0 MHz 5 MHz 10 MHz 15 MHz 20 MHz
ΔfOOB (MHz) 2.8 6 10 15 20 25
The spurious emission limits in Table A3-4.2-b apply for all E-UTRA transmitter band configurations and channel bandwidths.
TABLE A3-4.2-b
General spurious emissions requirements for E-UTRA
Frequency band Measurement bandwidth Minimum requirement(dBm)
9 kHz f < 150 kHz 1 kHz –36150 kHz f < 30 MHz 10 kHz –36
30 MHz f < 1 000 MHz 100 kHz –361 GHz f < 12.75 GHz 1 MHz –30
12.75 GHz ≤ f < 5th harmonic of the upper frequency edge
of the UL operating band in GHz
–30 dBm 1 MHz (Note)
NOTE − Applies for Band 42 and Band 43.

Rec. ITU-R M.1581-5 75
TABLE A3-4.2-c
Spurious emissions requirements for UE coexistence in E-UTRA bands
E-UTRAband
Spurious emission
Protected band Frequency range(MHz)
Level(dBm)
Bandwidth(MHz) Comment
33 E-UTRA Bands 1, 7, 8, 20, 22, 34, 38, 39, 40, 42, 43
FDL_low – FDL_high –50 1 Note 5
E-UTRA Band 3 FDL_low – FDL_high –50 1 Note 15
34 E-UTRA Bands 1, 3, 7, 8, 9, 11, 18, 19, 20, 21, 22, 33, 38,39, 40, 42, 43
FDL_low – FDL_high –50 1 Note 5
Frequency range –41 0.3
Frequency range 1 884.5 – 1 915.7 Note 8Frequency range 1 839.9 – 1 879.9 –50 1 Note 5
3536
37 –38 E-UTRA Bands 1,3, 8, 20,
22, 33, 34, 42, 43FDL_low – FDL_high –50 1
Frequency range 2 620 – 2 645 –15.5 5 Note 15, Note 17,Note 20
Frequency range 2 645 – 2 690 –40 1 Note 15, Note 17
39 E-UTRA Bands 22, 34, 40, 42
FDL_low – FDL_high –50 1
E-UTRA Band 43 FDL_low – FDL_high –50 1 Note 240 E-UTRA Bands 1, 3, 22,
33, 34, 39, 42, 43FDL_low – FDL_high –50 1
41 E-UTRA Bands 2, 4, 5, 10, 12, 13, 14, 17, 23, 24, 25
FDL_low – FDL_high –50 1
42 E-UTRA Bands 1, 2, 3, 4, 5, 7, 8, 10, 20, 25, 33, 34, 38, 40
FDL_low – FDL_high –50 1
E-UTRA Band 43 FDL_low – FDL_high –50 1 Note 343 E-UTRA Bands 1, 2, 3, 4,
5, 7, 8, 10, 20, 25, 33, 34, 38, 40
FDL_low – FDL_high –50 1
E-UTRA Band 42 FDL_low – FDL_high –50 1 Note 3E-UTRA Band 22 FDL_low – FDL_high Under
discussionUnder
discussionNote 3
Notes to Table A3-4.2-c:NOTE 1 − N/A.NOTE 2 − As exceptions, measurements with a level up to the applicable requirements defined in 3GPP TS 36.101, Table 6.6.3.1-2 are permitted for each assigned E-UTRA carrier used in the measurement due to 2nd, 3rd or 4th harmonic spurious emissions. An exception is allowed if there is at least one individual RB within the transmission bandwidth (see Fig. 5.6-1) for which the 2nd, 3rd or 4th harmonic totally or partially overlaps the measurement bandwidth (MBW).NOTE 3 − To meet these requirements some restriction will be needed for either the operating band or protected band.NOTE 4 − N/A.NOTE 5 − For non synchronized TDD operation to meet these requirements some restriction will be needed for either

76 Rec. ITU-R M.1581-5
the operating band or protected band.Notes to Table A3-4.2-c (end):NOTE 6 − N/A.NOTE 7 − N/A.NOTE 8 – Applicable when co-existence with PHS system operating in 1 884.5-1 915.7 MHz.NOTE 9 − N/A.NOTE 10 − N/A.NOTE 11 − N/A.NOTE 12 − N/A.NOTE 13 − N/A.NOTE 14 − N/A.NOTE 15 − These requirements also apply for the frequency ranges that are less than FOOB (MHz) in 3GPP TS 36.101, Table 6.6.3.1-1 and Table 6.6.3.1A-1 from the edge of the channel bandwidth.NOTE 16 − N/A.NOTE 17 − This requirement is applicable for an uplink transmission bandwidth less than or equal to 54 RB for carriers of 15 MHz bandwidth when carrier center frequency is within the range 2 605.5-2 607.5 MHz and for carriers of 20 MHz bandwidth when carrier center frequency is within the range 2 597-2 605 MHz. No other restrictions apply for carriers with bandwidths confined in 2 570-2 615 MHz. For assigned carriers with bandwidths overlapping the frequency range 2 615-2 620 MHz the requirements apply with the maximum output power configured to +20 dBm in the IE P-Max.NOTE 18 − N/A.NOTE 19 − N/A.NOTE 20 − For these adjacent bands, the emission limit could imply risk of harmful interference to UE(s) operating in the protected operating band.NOTE 21 − N/A.NOTE 22 − N/A
5 Receiver spurious emissions (conducted)
5.1 Receiver spurious emissions for UTRA
For UTRA, the power of any spurious emissions from the receiver should not exceed the limits given in Table A3-5.1.
TABLE A3-5.1
a) Receiver spurious emission requirements (3.84 Mchip/s UTRA TDD option)
Band Maximum level Measurement bandwidth Note
30 MHz-1 GHz –57 dBm 100 kHz1 GHz-1.9 GHz and
1.92 GHz-2.01 GHz and2.025 GHz-2.11 GHz and
2.17 GHz-2.57 GHz
–47 dBm 1 MHz
1.9 GHz-1.92 GHz and2.01 GHz-2.025 GHz and 2.11 GHz-2.170 GHz and
2.57 GHz-2.69 GHz
–60 dBm 3.84 MHz
2.69 GHz-12.75 GHz –47 dBm 1 MHz
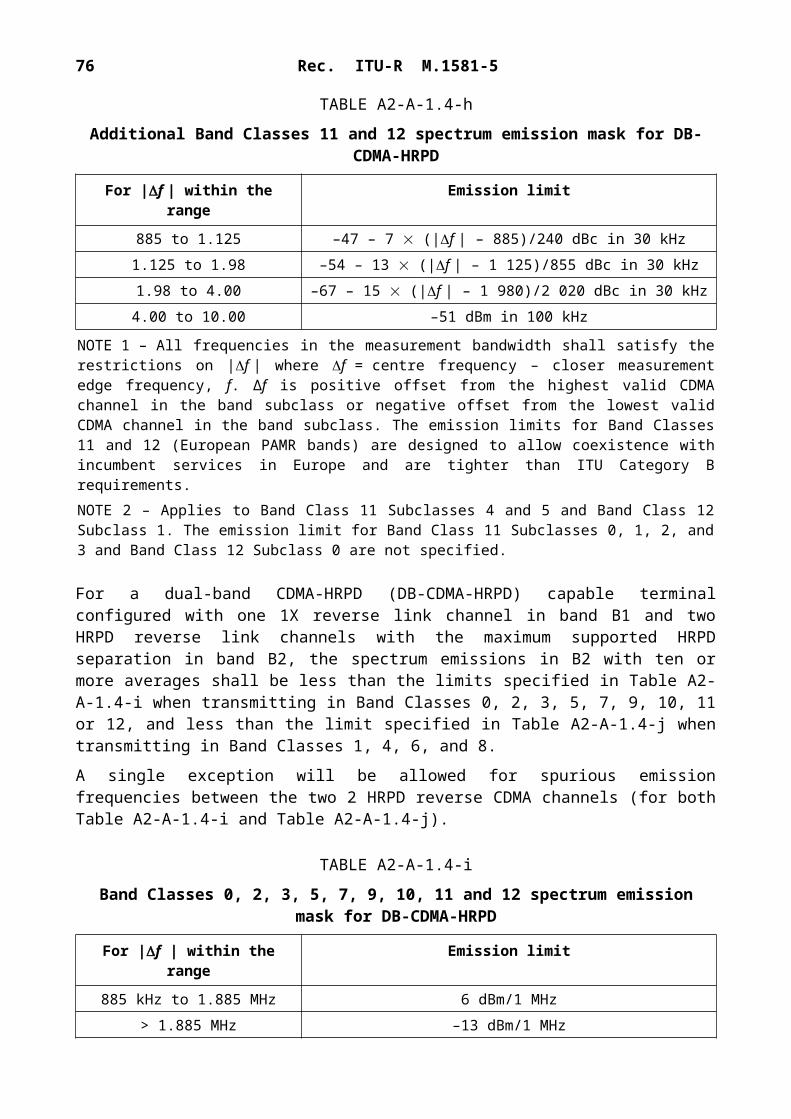
Rec. ITU-R M.1581-5 77
TABLE A3-5.1 (end)
b) Receiver spurious emission requirements (1.28 Mchip/s UTRA TDD option)
Frequency band Measurement bandwidth Maximum level Note
30 MHz f < 1 GHz 100 kHz –57 dBm1 GHz f 12.75 GHz 1 MHz –47 dBm
c) Receiver spurious emission requirements (7.68 Mchip/s UTRA TDD option)
Band Maximum level Measurement bandwidth Note
30 MHz-1 GHz –57 dBm 100 kHz1 GHz-1.9 GHz and
1.92 GHz-2.01 GHz and2.025 GHz-2.11 GHz and
2.17 GHz-2.57 GHz
–47 dBm 1 MHz
1.9 GHz-1.92 GHz and2.01 GHz-2.025 GHz and2.11 GHz-2.170 GHz and
2.57 GHz-2.69 GHz
–57 dBm 7.68 MHz
2.69 GHz-12.75 GHz –47 dBm 1 MHz
d) Additional receiver spurious emission requirements (1.28 Mcps TDD Option)
Band Frequency band Measurement bandwidth Maximum level Note
a
2 010 MHz f 2 025 MHz 1.28 MHz –64 dBm2 570 MHz f 2 620 MHz 1.28 MHz –64 dBm2 300 MHz f 2 400 MHz 1.28 MHz –64 dBm1 880 MHz f 1 920 MHz 1.28 MHz –64 dBm2 110 MHz f 2 170 MHz 3.84 MHz –60 dBm2 620 MHz f 2 690 MHz 3.84 MHz –60 dBm
b1 850 MHz f 1 910 MHz 1.28 MHz –64 dBm1 910 MHz f 1 990 MHz 1.28 MHz –64 dBm
c 1 910 MHz f 1 930 MHz 1.28 MHz –64 dBm
d
2 570 MHz f 2 620 MHz 1.28 MHz –64 dBm2 010 MHz f 2 025 MHz 1.28 MHz –64 dBm2 110 MHz f 2 170 MHz 3.84 MHz –60 dBm2 620 MHz f 2 690 MHz 3.84 MHz –60 dBm
e2 300 MHz f 2 400 MHz 1.28 MHz –64 dBm2 010 MHz f 2 025 MHz 1.28 MHz –64 dBm1 880 MHz f 1 920 MHz 1.28 MHz –64 dBm
f1 880 MHz f 1 920 MHz 1.28 MHz –64 dBm2 010 MHz f 2 025 MHz 1.28 MHz –64 dBm2 300 MHz f 2 400 MHz 1.28 MHz –64 dBm

78 Rec. ITU-R M.1581-5
5.2 Receiver spurious emissions for E-UTRA
The power of any narrowband CW spurious emission shall not exceed the maximum level specified in Table A3-5.2.
TABLE A3-5.2
General receiver spurious emission requirements for E-UTRA
Frequency band Measurement bandwidth Maximum level Note
30 MHz f < 1 GHz 100 kHz –57 dBm1 GHz f 12.75 GHz 1 MHz –47 dBm
12.75 GHz f 5th harmonic of the upper frequency edge of the DL operating band in GHz
1 MHz –47 dBm Note 1
NOTE 1 − Applies only for Band 42 and Band 43.NOTE 2 − Unused PDCCH resources are padded with resource element groups with power level given by PDCCH_RA/RB as defined in 3GPP TS 36.101, Annex C, subclause C.3.1.
Annex 4
TDMA Single-Carrier (UWC-136) mobile stations
PART A
Conformance requirements (30 kHz)
1 Spectrum mask
Spectrum noise suppression is the restraint of sideband energy outside the active transmit channel. This RF spectrum is the result of power ramping, modulation and all sources of noise. The spectrum is primarily the result of events that do not occur at the same time: digital modulation and power ramping (switching transients). The RF spectrum from these two events are specified separately.
Adjacent and first or second alternate channel power is that part of the mean power output of the transmitter resulting from the modulation and noise which falls within a specified passband centred on either of the adjacent or first or second alternate channels.
The emission power should not exceed the limits specified in Table A4-A-1-a.

Rec. ITU-R M.1581-5 79
TABLE A4-A-1-a
Adjacent and alternate channel power requirements
Channel Maximum level
In either adjacent channel, centred 30 kHz from the centre frequency
26 dB below the mean output power
In either alternate channel, centred 60 kHz from the centre frequency
45 dB below the mean output power
In either second alternate channel centred 90 kHz from the centre frequency
45 dB below the mean output power or –13 dBm measured in 30 kHz bandwidth, whichever is the lower power
OoB power arising from switching transients is the peak power of the spectrum, arising from the ramping-on and ramping-off of the transmitter, that fall within defined frequency bands outside the active transmit channel.
The peak emission power should not exceed the limits specified in Table A4-A-1-b.
TABLE A4-A-1-b
Switching transients requirements
Channel Maximum level
In either adjacent channel, centred 30 kHz from the centre frequency
26 dB below the peak output power reference
In either alternate channel, centred 60 kHz from the centre frequency
45 dB below the peak output power reference
In either second alternate channel centred 90 kHz from the centre frequency
45 dB below the peak output power reference or –13 dBm measured in 30 kHz bandwidth, whichever is the lower power
2 Transmitter spurious emissions (conducted)
The power of any spurious emission should not exceed the limits specified in Table A4-A-2.

80 Rec. ITU-R M.1581-5
TABLE A4-A-2
Spurious emission limits
Band (f)(1) Maximum level(dBm)
Measurement bandwidth Note
9 kHz f 150 kHz –36 1 kHz (2)
150 kHz f 30 MHz –36 10 kHz (2)
30 MHz f 1 000 MHz –36 100 kHz (2)
1 000 MHz f 1 920 MHz –30 1 MHz (2)
1 920 MHz f 1 980 MHz –30 30 kHz (3)
1 980 MHz f 2 110 MHz –30 1 MHz (2)
2 110 MHz f 2 170 MHz –70 30 kHz (4)
2 170 MHz f 12.75 GHz –30 1 MHz (2)
(1) f is the frequency of the spurious emission.(2) In accordance with the applicable clauses of Recommendation ITU-R SM.329.(3) MS transmit band.(4) MS receive band.
2.1 Coexistence with services in adjacent frequency bands
This requirement provides for the protection of receivers operating in bands adjacent to the MS transmit frequency band of 1 920 to 1 980 MHz: GSM 900, R-GSM and UTRA TDD.NOTE – UTRA FDD operates in the same frequency band as UWC-136.
The power of any spurious emission should not exceed the limits specified in Table A4-A-2.1.
TABLE A4-A-2.1
Additional spurious emissions requirements
Service Frequency bandMeasurement
bandwidth(kHz)
Limit(dBm)
R-GSM 921 f 925 MHz 100 –60R-GSM 925 < f 935 MHz 100 –67
GSM 900/R-GSM 935 < f 960 MHz 100 –79DCS 1800 1 805 f 1 880 MHz 100 –71
UTRA TDD 1 900 f 1 920 MHz 100 –62UTRA TDD 2 010 f 2 025 MHz 100 –62
NOTE – The measurements are made on frequencies which are integer multiples of 200 kHz. Up to five exceptions of up to –36 dBm are permitted in the GSM 900, DCS 1800 and UTRA bands, and up to three exceptions of up to –36 dBm are permitted in the GSM 400 bands.
3 Receiver spurious emissions (idle mode)
The power of any spurious emissions should not exceed the limits given in Table A4-A-3.

Rec. ITU-R M.1581-5 81
TABLE A4-A-3
General receiver spurious emission requirements
Frequency band Measurementbandwidth
Maximumlevel
(dBm)Note
30 MHz f < 1 GHz 100 kHz –571
GHz f 12.75 GHz1 MHz –47 With the exception of the frequencies covered
by the Table below, for which additional receiver spurious emission requirements apply(1)
(1) Editorial Note – In TFES Harmonized Standard v1.0.2, no additional receiver spurious emission is specified; yet, it is expected that there will be a table added, in the same form as for the other technologies (see Tables A1-5.1-a (Annex 1), A2-A-4-c (Annex 2) and A3-5.1 (Annex 3)).
PART B
Conformance requirements (200 kHz)
The 200 kHz channel provides packet data service and employs 8-level phase shift keying (8-PSK), 16-QAM, 32-QAM as well as Gaussian minimum shift keying (GMSK) modulations.
1 Frequency bands and channel arrangement
i) T-GSM 380 Band:– for T-GSM 380, the system is required to operate in the following band:
– 380.2 MHz to 389.8 MHz: mobile transmit, base receive;– 390.2 MHz to 399.8 MHz: base transmit, mobile receive.
ii) T-GSM 410 Band:– for T-GSM 410, the system is required to operate in the following band:
– 410.2 MHz to 419.8 MHz: mobile transmit, base receive;– 420.2 MHz to 429.8 MHz: base transmit, mobile receive.
iii) GSM 450 Band:– for GSM 450, the system is required to operate in the following band:
– 450.4 MHz to 457.6 MHz: mobile transmit, base receive;– 460.4 MHz to 467.6 MHz: base transmit, mobile receive.
iv) GSM 480 Band:– for GSM 480, the system is required to operate in the following band:
– 478.8 MHz to 486 MHz: mobile transmit, base receive;– 488.8 MHz to 496 MHz: base transmit, mobile receive.

82 Rec. ITU-R M.1581-5
v) GSM 710 Band:– for GSM 710, the system is required to operate in the following band:
– 698 MHz to 716 MHz: mobile transmit, base receive;– 728 MHz to 746 MHz: base transmit, mobile receive.
vi) GSM 750 Band:– for GSM 750, the system is required to operate in the following band:
– 747 MHz to 763 MHz: base transmit, mobile receive;– 777 MHz to 793 MHz: mobile transmit, base receive.
vii) T-GSM 810 Band:– for T-GSM 810, the system is required to operate in the following band:
– 806 MHz to 821 MHz: mobile transmit, base receive;– 851 MHz to 866 MHz: base transmit, mobile receive.
viii) GSM 850 Band:– for GSM 850, the system is required to operate in the following band:
– 824 MHz to 849 MHz: mobile transmit, base receive;– 869 MHz to 894 MHz: base transmit, mobile receive.
ix) Standard or primary GSM 900 Band, P-GSM:– for Standard GSM 900 band, the system is required to operate in the following frequency
band:– 890 MHz to 915 MHz: mobile transmit, base receive;– 935 MHz to 960 MHz: base transmit, mobile receive.
x) Extended GSM 900 Band, E-GSM (includes Standard GSM 900 Band):– for Extended GSM 900 band, the system is required to operate in the following frequency
band:– 880 MHz to 915 MHz: mobile transmit, base receive;– 925 MHz to 960 MHz: base transmit, mobile receive.
xi) Railways GSM 900 Band, R-GSM (includes Standard and Extended GSM 900 Band):– for Railways GSM 900 band, the system is required to operate in the following frequency
band:– 876 MHz to 915 MHz: mobile transmit, base receive;– 921 MHz to 960 MHz: base transmit, mobile receive.
xii) Void:
xiii) DCS 1 800 Band:– for DCS 1 800, the system is required to operate in the following band:
– 1 710 MHz to 1 785 MHz: mobile transmit, base receive;

Rec. ITU-R M.1581-5 83
– 1 805 MHz to 1 880 MHz: base transmit, mobile receive.
xiv) PCS 1 900 Band:– for PCS 1 900, the system is required to operate in the following band:
– 1 850 MHz to 1 910 MHz: mobile transmit, base receive;– 1 930 MHz to 1 990 MHz base transmit, mobile receive.
NOTE 1 − The term GSM 400 is used for any GSM system, which operates in any 400 MHz band, including T-GSM 380.NOTE 2 − The term GSM 700 is used for any GSM system, which operates in any 700 MHz band.NOTE 3 − The term GSM 850 is used for any GSM system which operates in any 850 MHz band but excluding T-GSM 810.NOTE 4 − The term GSM 900 is used for any GSM system, which operates in any 900 MHz band.NOTE 5 − The BTS may cover a complete band, or the BTS capabilities may be restricted to a subset only, depending on the operator needs.
For T-GSM 810 the requirements for GSM 900 shall apply, apart for those parameters for which a separate requirement exists.
Operators may implement networks that operate on a combination of the frequency bands above to support multi band mobile terminals.
The carrier spacing is 200 kHz.
The carrier frequency is designated by the absolute radio frequency channel number (ARFCN). If we call Fl(n) the frequency value of the carrier ARFCN n in the lower band, and Fu(n) the corresponding frequency value in the upper band, we have for the dynamically mapped ARFCNs:
T-GSM 380 Fl(n) = 380.2 + 0.2*(n-x+y) x n x+z Fu(n) = Fl(n) + 10
T-GSM 410 Fl(n) = 410.2 + 0.2*(n-x+y) x n x+z Fu(n) = Fl(n) + 10
T-GSM 810 Fl(n) = 806.2 + 0.2*(n-x+y) x n x+z Fu(n) = Fl(n) + 45
GSM 710 Fl(n) = 698.2 + 0.2*(n-x+y) x n x+z Fu(n) = Fl(n) + 30
GSM 750 Fl(n) = 747.2 + 0.2*(n-x+y) x n x+z Fu(n) = Fl(n) + 30
DCS 1 800 Fl(n) = 1 710.2 + 0.2*(n-x+y) x n x+z Fu(n) = Fl(n) + 95
PCS 1 900 FI(n) = 1 850.2 + 0.2*(n-x+y) x n x+z Fu(n) = FI(n) + 80
where the applicable band is indicated by the GSM_Band parameter, x = ARFCN_FIRST, y = BAND_OFFSET and z = ARFCN_RANGE (See 3GPP TS 44.018). Parameters defining carrier frequencies not belonging to the indicated band shall not be considered erroneous.
Information about dynamic mapping is provided by System Information type 15 or Packet System Information type 8 if PBCCH exists, and optionally by System Information type 14. Dynamic ARFCN mapping shall be valid for the whole PLMN. Dynamic mapping has priority over the fixed designation of carrier frequencies. The support of dynamic ARFCN mapping is optional for all other mobile stations except those supporting GSM 700 and T-GSM.
Fl(n) and Fu(n) for all other ARFCNs:
P-GSM 900 Fl(n) = 890 + 0.2*n 1 n 124 Fu(n) = Fl(n) + 45
E-GSM 900 Fl(n) = 890 + 0.2*n 0 n 124 Fu(n) = Fl(n) + 45Fl(n) = 890 + 0.2*(n-1 024) 975 n 1 023

84 Rec. ITU-R M.1581-5
R-GSM 900 Fl(n) = 890 + 0.2*n 0 n 124 Fu(n) = Fl(n) + 45Fl(n) = 890 + 0.2*(n-1 024) 955 n 1 023
DCS 1 800 Fl(n) = 1710.2 + 0.2*(n-512) 512 n 885 Fu(n) = Fl(n) + 95
PCS 1 900 FI(n) = 1850.2 + 0.2*(n-512) 512 n 810 Fu(n) = FI(n) + 80
GSM 450 Fl(n) = 450.6 + 0.2*(n-259) 259 n 293 Fu(n) = Fl(n) + 10
GSM 480 Fl(n) = 479 + 0.2*(n-306) 306 n 340 Fu(n) = Fl(n) + 10
GSM 850 Fl(n) = 824.2 + 0.2*(n-128) 128 n 251 Fu(n) = Fl(n) + 45
Frequencies are in MHz.
A multi-band MS shall interpret ARFCN numbers 512 to 810 as either DCS 1800 or PCS 1900 frequencies according to the parameter BAND_INDICATOR when received in other than the DCS 1800 or PCS 1900 bands. If received in the DCS 1800 or PCS 1900 bands, those ARFCN numbers shall be interpreted as frequencies in the same band. The BAND_INDICATOR is broadcast on BCCH, PBCCH and SACCH. The most recently received value shall be applied by the mobile station. If the parameter is not broadcast, the default value is DCS 1800 frequencies.
2 Spectrum
Output RF spectrum is the relationship between the frequency offset from the carrier and the power, measured in a specified bandwidth and time, produced by the MS due to the effects of modulation and power ramping.
The specifications contained in the following sections apply in frequency hopping as well as in non-frequency hopping modes.
Due to the bursty nature of the signal, the output RF spectrum results from two effects: themodulation process, and the power ramping up and down (switching transients).
The power emitted should not exceed –71 dBm in frequency band 2 110-2 170 MHz.
3 Spectrum due to the modulation and wideband noise
The output RF modulation spectrum is specified in the following tables. This specification applies for all RF channels supported by the equipment.
The specification applies to the entire of the relevant transmit band and up to 2 MHz either side.
The specification shall be met under the following measurement conditions:– When tests are done in frequency hopping mode, the averaging shall include only bursts
transmitted when the hopping carrier corresponds to the nominal carrier of the measurement. The specifications then apply to the measurement results for any of the hopping frequencies.
The values in the tables below, at the vertically listed power level (dBm) and at the horizontally listed frequency offset from the carrier (kHz), are then the maximum allowed level (dB) relative to a measurement in 30 kHz on the carrier.NOTE − This approach of specification has been chosen for convenience and speed of testing. It does however require careful interpretation if there is a need to convert figures in the following tables into spectral density values, in that only part of the power of the carrier is used as the relative reference, and in addition different measurement bandwidths are applied at different offsets from the carrier. Appropriate conversion factors for this purpose are given in 3GPP TS 45.050.
Two types of requirements are specified, depending on symbol-rate and pulse-shaping filter used:

Rec. ITU-R M.1581-5 85
Case 1: Normal symbol rate using linearized GMSK pulse-shaping filter and higher symbol rate using spectrally narrow pulse shaping filter.
Case 2: Higher symbol rate using spectrally wide pulse shaping filter.
For definition of pulse-shaping filters, see 3GPP TS 45.004.
The spectrally narrow pulse shaping filter in Case 1 and the spectrally wide pulse shaping filter in Case 2 are in this specification referred to as narrow and wide pulse shaping filter respectively.
TABLE A4-B-3a
Spectrum for GSM 400 and GSM 900 and GSM 850 and GSM 700 MS
Power 100 200 250 400 600 1 800
3 000
6 000
level < 1 800 < 3 000 < 6 000
Case 1 39 +0.5 –30 –33 –60 –66 –69 –71 –77
37 +0.5 –30 –33 –60 –64 –67 –69 –75
35 +0.5 –30 –33 –60 –62 –65 –67 –73
33 +0.5 –30 –33 –60* –60 –63 –65 –71
Power 100 200 250 400 600 800 1 800
3 000
6 000
level < 1 800 < 3 000 < 6 000
Case 2 39 +0.5 –12.3 –25** –40*** –55 –60 –63 –65 –7137 +0.5 –12.3 –25** –40*** –55 –60 –63 –65 –71
35 +0.5 –12.3 –25** –40*** –55 –60 –63 –65 –71
33 +0.5 –12.3 –25** –40*** –55 –60 –63 –65 –71
NOTE 1 − * For equipment supporting QPSK, 8-PSK, 16-QAM or 32-QAM, the requirement for these modulations is −54 dB.NOTE 2 − ** The requirement shall be (tbd) when the wideband pulse shaping filter with the tight spectrum mask is indicated (see Pulse Format Information Element in 3GPP TS 44.060).NOTE 3 − *** The requirement shall be (tbd) when the wide pulse shaping filter with the tight spectrum mask is indicated (see Pulse Format Information Element in 3GPP TS 44.060).
NOTE − GSM 700 MS shall also comply to the requirements in the applicable FCC rules FCC Part 27, Subpart C, Section 27.53. This may introduce more stringent requirements in frequency bands defined for public safety services.
TABLE A4-B-3b
Spectrum for DCS 1 800 MS
Power 100 200 250 400 600 1 800 6 000
Level < 1 800 < 6 000
Case 1 36 +0.5 –30 –33 –60 –60 –71 –79
34 +0.5 –30 –33 –60 –60 –69 –77
32 +0.5 –30 –33 –60 –60 –67 –75
30 +0.5 –30 –33 –60* –60 –65 –73
28 +0.5 –30 –33 –60* –60 –63 –71

86 Rec. ITU-R M.1581-5
26 +0.5 –30 –33 –60* –60 –61 –69
24 +0.5 –30 –33 –60* –60 –59 –67
Power 100 200 250 400 600 800 1 800
3 000
6 000
Level < 1 800 < 3 000 < 6 000
Case 2 36 +0.5 –12.3 –25** –40*** –55 –60 –63 –65 –71
34 +0.5 –12.3 –25** –40*** –55 –60 –63 –65 –7132 +0.5 –12.3 –25** –40*** –55 –60 –63 –65 –71
30 +0.5 –12.3 –25** –40*** –55 –60 –63 –65 –7128 +0.5 –12.3 –25** –40*** –55 –60 –63 –65 –71
26 +0.5 –12.3 –25** –40*** –55 –60 –63 –65 –71 24 +0.5 –12.3 –25** –40*** –55 –60 –63 –65 –71
NOTE 1 − * For equipment supporting QPSK, 8-PSK, 16-QAM or 32-QAM, the requirement for these modulations is –54 dB.NOTE 2 − ** The requirement shall be (tbd) when the wideband pulse shaping filter with the tight spectrum mask is indicated (see Pulse Format Information Element in 3GPP TS 44.060).NOTE 3 − *** The requirement shall be (tbd) when the wide pulse shaping filter with the tight spectrum mask is indicated (see Pulse Format Information Element in 3GPP TS 44.060).
TABLE A4-B-3c
Spectrum for PCS 1 900 MS
Power 100 200 250 400 600 1 200
1 800
6 000
level < 1 200 < 1 800 < 6 000
Case 1 ≥ 33 +0.5 –30 –33 –60 –60 –60 –68 –7632 +0.5 –30 –33 –60 –60 –60 –67 –75
30 +0.5 –30 –33 –60* –60 –60 –65 –73
28 +0.5 –30 –33 –60* –60 –60 –63 –71
26 +0.5 –30 –33 –60* –60 –60 –61 –69
≤ 24 +0.5 –30 –33 –60* –60 –60 –59 –67
TABLE A4-B-3c (end)
Power 100 200 250 400 600 800 1 800
3 000 6 000
level < 1 800 < 3 000 < 6 000Case 2 ≥ 33 +0.5 –12.3 –25** –40*** –55 –60 –63 –65 –71
32 +0.5 –12.3 –25** –40*** –55 –60 –63 –65 –71
30 +0.5 –12.3 –25** –40*** –55 –60 –63 –65 –71
28 +0.5 –12.3 –25** –40*** –55 –60 –63 –65 –71
26 +0.5 –12.3 –25** –40*** –55 –60 –63 –65 –71
≤ 24 +0.5 –12.3 –25** –40*** –55 –60 –63 –65 –71

Rec. ITU-R M.1581-5 87
NOTE 1 − * For equipment supporting QPSK, 8-PSK, 16-QAM or 32-QAM, the requirement for these modulations is–54 dB.NOTE 2 − ** The requirement shall be (tbd) when the wideband pulse shaping filter with the tight spectrum mask is indicated (see Pulse Format Information Element in 3GPP TS 44.060).NOTE 3 − *** The requirement shall be (tbd) when the wide pulse shaping filter with the tight spectrum mask is indicated (see Pulse Format Information Element in 3GPP TS 44.060).
The following exceptions shall apply, using the same measurement conditions as specified above.i) In the combined range 600 kHz to 6 MHz above and below the carrier, in up to three bands
of 200 kHz width centred on a frequency which is an integer multiple of 200 kHz, exceptions at up to –36 dBm are allowed.
ii) Above 6 MHz offset from the carrier in up to 12 bands of 200 kHz width centred on a frequency which is an integer multiple of 200 kHz, exceptions at up to –36 dBm are allowed.
Using the same measurement conditions as specified above, if a requirement in tables is tighter than the limit given in the following, the latter shall be applied instead.iii) For MS see Table A4-B-3d.
TABLE A4-B-3d
Frequency offset from the carrier
GSM 400 & GSM 900 & GSM 850 & GSM 700 DCS 1 800 &PCS 1 900
< 600 kHz –36 dBm –36 dBm
600 kHz, < 1 800 kHz –51 dBm –56 dBm
1 800 kHz –46 dBm –51 dBm
4 Spectrum due to switching transients
Those effects are also measured in the time domain and the specifications assume the following measurement conditions: zero frequency scan, filter bandwidth 30 kHz, peak hold, and video bandwidth 100 kHz.
The example of a waveform due to a burst as seen in a 30 kHz filter offset from the carrier is given thereunder (Fig. 5).

88 Rec. ITU-R M.1581-5
FIGURE 5Example of a time waveform due to a burst as seen in a 30 kHz filter offset from the carrier

Rec. ITU-R M.1581-5 89
TABLE A4-B-4a
Maximum switching transients for mobile station
Power level Maximum level measured
400 kHz 600 kHz 1 200 kHz 1 800 kHz
39 dBm –21 dBm –26 dBm –32 dBm –36 dBm 37 dBm –23 dBm –26 dBm –32 dBm –36 dBm
NOTE 1 − The relaxation for power level 39 dBm is in line with the modulated spectra and thus causes negligible additional interference to an analogue system by a GSM signal.NOTE 2 − The near-far dynamics with this specification has been estimated to be approximately 58 dB for MS operating at a power level of 8 W or 49 dB for MS operating at a power level of 1 W. The near-far dynamics then gradually decreases by 2 dB per power level down to 32 dB for MS operating in cells with a maximum allowed output power of 20 mW or 29 dB for MS operating at 10 mW.NOTE 3 − The possible performance degradation due to switching transient leaking into the beginning or the end of a burst, was estimated and found to be acceptable with respect to the BER due to co-channel interference (C/I).
5 Transmitter spurious emissions
The limits specified thereunder are based on a 5-pole synchronously tuned measurement filter.
In addition to the requirements of this section, the PCS 1 900 MS shall also comply with the applicable limits for spurious emissions established by the FCC rules for wideband PCS services FCC Title 47 CFR Part 24.
In addition to the requirements of this section, the GSM 850 MS shall also comply with the applicable limits for spurious emissions established by the FCC rules for public mobile services FCC Part 22, Subpart H.
In addition to the requirements of this section, the GSM 700 MS shall also comply with the applicable limits for spurious emissions established by the FCC FCC Part 27, Subpart C, Section 27.53.NOTE – This may introduce more stringent requirements than specified in this section for frequency bands dedicated for public safety services.
5.1 Principle of the specification
In this section, the spurious transmissions (whether modulated or unmodulated) and the switching transients are specified together by measuring the peak power in a given bandwidth at various frequencies. The bandwidth is increased as the frequency offset between the measurement frequency and, either the carrier, or the edge of the MS transmit band, increases. The effect for spurious signals of widening the measurement bandwidth is to reduce the allowed total spurious energy per MHz. The effect for switching transients is to effectively reduce the allowed level of the switching transients (the peak level of a switching transient increases by 6 dB for each doubling of the measurement bandwidth). The conditions are specified in the following table, a peak-hold measurement being assumed.
The measurement conditions for radiated and conducted spurious are specified separately in 3GPP TS 51.010 and 3GPP TS 51.02x series. The frequency bands where these are actually measured may differ from one type to the other (see 3GPP TS 51.010 and 3GPP TS 51.02x series).

90 Rec. ITU-R M.1581-5
TABLE A4-B-5.1a
In band spurious measurement conditions
Band Frequency offset Measurement bandwidth
(offset from carrier)relevant transmit 1.8 MHz 30 kHz
band 6 MHz 100 kHz
TABLE A4-B-5.1b
Out-of-band spurious measurement conditions
Band Frequency offset Measurement bandwidth
100 kHz to 50 MHz – 10 kHz
50 MHz to 500 MHz andoutside the relevant transmit band
(offset from edge of therelevant transmit band)
2 MHz 30 kHz 5 MHz 100 kHz
500 MHz to 1000 MHz and (offset from edge of theoutside the relevant transmit band relevant transmit band)
2 MHz 30 kHz 5 MHz 100 kHz
10 MHz 300 kHz 20 MHz 1 MHz
30 MHz 3 MHzAbove 1000 MHz and
outside the relevant transmit band(offset from edge of therelevant transmit band)
2 MHz 30 kHz
5 MHz 100 kHz 10 MHz 300 kHz/1 MHz
20 MHz 1 MHz 30 MHz 3 MHz
The measurement settings assumed correspond, for the resolution bandwidth to the value of the measurement bandwidth in the Table, and for the video bandwidth to approximately three times this value.NOTE − For radiated spurious emissions for MS with antenna connectors, and for all spurious emissions for MS with integral antennas, the specifications currently only apply to the frequency band 30 MHz to 4 GHz. The specification and method of measurement outside this band are under consideration.
5.1.1 Relation to definitions and requirements in CEPT/ERC/REC 74-01 and ITU-R SM.329
– In this section for all equipment the term spurious emission out-of-band is used for all spurious transmissions outside the relevant transmit band (whether modulated or unmodulated), comprised of contributions from noise, intermodulation and non-harmonic emissions.
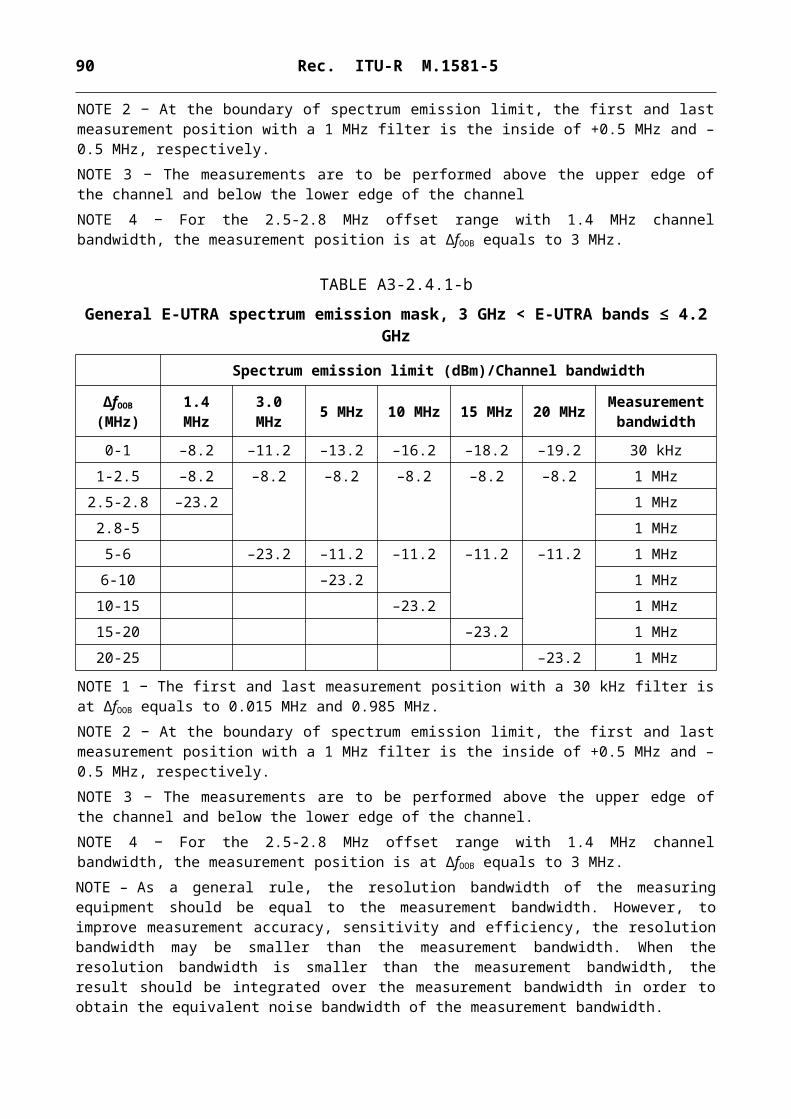
Rec. ITU-R M.1581-5 91
– Spurious emissions according to REC 74-01 definition are specified in 3GPP TS 45.005 from 2*BW = 10 MHz and higher frequency offsets. The 10 MHz spurious domain boundary applies also for larger transmitter bandwidths.
– In addition there is an upper limit for the unwanted emissions from 0 to 10 MHz frequency offset outside the relevant transmit band edge according to 3GPP TS 45.005.
The relevant transmit bands are defined in § 1.
6 Coexistence with services in adjacent frequency bands
This requirement provides for the protection of receivers operating in bands adjacent to the MS transmit frequency band of 1 920 MHz to 1 980 MHz: GSM 900, R-GSM, UTRA TDD.
The power of any spurious emission should not exceed the limits specified in Table A4-B-6.
TABLE A4-B-6
Additional spurious emissions requirements
Service Frequency bandMeasurement
bandwidth(kHz)
Minimum requirement(dBm)
R-GSM 921 f 925 MHz 100 –60R-GSM 925 < f 935 MHz 100 –67
GSM 900/R-GSM 935 < f 960 MHz 100 –79DCS 1800 1 805 f 1 880 MHz 100 –71
UTRA TDD 1 900 f 1 920 MHz 100 –62UTRA TDD 2 010 f 2 025 MHz 100 –62
NOTE – The measurements are made on frequencies which are integer multiples of 200 kHz. Up to five exceptions of up to –36 dBm are permitted in the GSM 900, DCS 1800 and UTRA bands, and up to three exceptions of up to –36 dBm are permitted in the GSM 400 bands.
6.1 Spurious emissions for mobile station GSM 400, T-GSM 810, GSM 900 and DCS 1 800
The power measured in the conditions specified in § 5.1, for a MS when assigned a channel, shall be no more than –36 dBm. For R-GSM 900 MS except small MS the corresponding limit shall be –42 dBm.
The power measured in the conditions specified in § 5.1 for a MS, when assigned a channel, shall be no more than:– 250 nW (–36 dBm) in the frequency band 9 kHz to 1 GHz;– 1 µW (–30 dBm) in the frequency band 1 GHz to 12.75 GHz.
The power measured in a 100 kHz bandwidth for a MS, when not assigned a channel (idle mode), shall be no more than:– 2 nW (–57 dBm) in the frequency band 9 kHz to 1 000 MHz;– 20 nW (–47 dBm) in the frequency band 1-12.75 GHz,
with the following exceptions:– 1.25 nW (–59 dBm) in the frequency band 880 MHz to 915 MHz;

92 Rec. ITU-R M.1581-5
– 5 nW (–53 dBm) in the frequency band 1.71 GHz to 1.785 GHz;– –76 dBm in the frequency bands 1 900-1 920 MHz, 1 920-1 980 MHz, 2 010-2 025 MHz,
2 110-2 170 MHz and 2 300-2 400 MHz;– –76 dBm in the frequency bands 2 500-2 570 MHz, 2 570-2 620 MHz and
2 620-2 690 MHz.NOTE − The idle mode spurious emissions in the receive band are covered by the case for MS assigned a channel (see below).
When assigned a channel, the power emitted by the MS, when measured using the measurement conditions specified in § 3, but with averaging over at least 50 burst measurements, with a filter and video bandwidth of 100 kHz, for measurements centred on 200 kHz multiples shall be no more than:– –62 dBm in the bands 390.2-400 MHz and 420.2-430 MHz for T-GSM 380 and T-GSM
410 MS only;– –67 dBm in the bands 460.4-467.6 MHz and 488.8-496 MHz for GSM400 MS only;– –79 dBm in the band 851-866 MHz for T-GSM 810 MS only;– –60 dBm in the band 921-925 MHz for R-GSM MS only;– –67 dBm in the band 925-935 MHz;– –79 dBm in the band 935-960 MHz;– –71 dBm in the band 1 805-1 880 MHz;– –66 dBm in the bands 1 900-1 920 MHz, 1 920-1 980 MHz, 2 010-2 025 MHz,
2 110-2 170 MHz and 230-2 400 MHz.
As exceptions up to five measurements with a level up to –36 dBm are permitted in each of the bands 851 MHz to 866 MHz, 925 MHz to 960 MHz, 1 805 MHz to 1 880 MHz, 1 900-1 920 MHz, 1 920-1 980 MHz, 2 010-2 025 MHz, and 2 110-2 170 MHz for each ARFCN used in the measurements. For GSM 400 MS, in addition, exceptions up to three measurements with a level up to –36 dBm are permitted in each of the bands 460.4 MHz to 467.6 MHz and 488.8 MHz to 496 MHz for each ARFCN used in the measurements.
When hopping, this applies to each set of measurements, grouped by the hopping frequencies as described in § 3.
6.2 Spurious Emissions for Mobile Station GSM 700, GSM 850 and PCS 1 900
The peak power measured in the conditions specified in § 5.1, for a MS when assigned a channel, shall be no more than –36 dBm.
The peak power measured in the conditions specified in § 5.1 for a MS, when assigned a channel, shall be no more than:– –36 dBm in the frequency band 9 kHz to 1 GHz;– –30 dBm in all other frequency band 1 GHz to 12.75 GHz.
The peak power measured in a 100 kHz bandwidth for a mobile, when not assigned a channel (idle mode), shall be no more than:– –57 dBm in the frequency band 9 kHz to 1 000 MHz;– –53 dBm in the frequency band 1 850 MHz to 1 910 MHz;– –47 dBm in all other frequency bands 1 GHz to 12.75 GHz.
The power emitted by the MS in a 100 kHz bandwidth using the measurement techniques for modulation and wide band noise shall not exceed:

Rec. ITU-R M.1581-5 93
– –73 dBm in the frequency band 728 MHz to 736 MHz;– –79 dBm in the frequency band 736 MHz to 746 MHz;– –79 dBm in the frequency band 747 MHz to 757 MHz;– –73 dBm in the frequency band 757 MHz to 763 MHz;– –79 dBm in the frequency band 869 MHz to 894 MHz;– –71 dBm in the frequency band 1 930 MHz to 1 990 MHz.
A maximum of five exceptions with a level up to –36 dBm are permitted in each of the band 728 MHz to 746 MHz, 747 MHz to 763 MHz, 869 MHz to 894 MHz and 1 930 MHz to 1 990 MHz for each ARFCN used in the measurements.
Annex 5
FDMA/TDMA (digital enhanced cordless telecommunications (DECT)) mobile stations
1 Spectrum mask
If the equipment under test (EUT) is equipped with antenna diversity, the EUT should have the diversity operation defeated for the following tests.
2 Emissions due to modulation
The unwanted emission(s) due to modulation is the power measured in any DECT RF channel other than the one in which the EUT is transmitting, integrated over a bandwidth of 1 MHz.
With transmissions on physical channel Ra (K, L, M, N) in successive frames, the power in physical channel Ra (K, L, Y, N) should be less than the values given in Table A5-2.
TABLE A5-2
Emissions modulation
Emissions on RF channel “Y ” Measurement bandwidth Maximum power level
Y = M 1 (1) 160 W (–8 dBm)Y = M 2 (1) 1 W (–30 dBm)Y = M 3 (1) 80 nW (–41 dBm)
Y = any other DECT channel (1) 40 nW (–44 dBm)(2)
(1) The power in RF channel Y is defined by integration over a bandwidth of 1 MHz centred on the nominal centre frequency, FY, averaged over at least 60% but less than 80% of the physical packet, and starting before 25% of the physical packet has been transmitted but after the synchronization word.
(2) For Y = “any other DECT channel”, the maximum power level should be less than 40 nW (–44 dBm)

94 Rec. ITU-R M.1581-5
except for one instance of a 500 nW (–33 dBm) signal.
3 Emissions due to transmitter transients
The power level of all modulation products (including AM components due to the switching on or off of the modulated RF carrier) in a DECT RF channel as a result of a transmission on another DECT RF channel.
The power level of all modulation products (including AM products due to the switching on or off of a modulated RF carrier) arising from a transmission on RF channel M should, when measured using a peak hold technique, be less than the values given in Table A5-3.
TABLE A5-3
Emissions due to transmitter transients
Emissions on RF channel “Y ” Measurement bandwidth Maximum power level
Y = M 1 (1) 250 W (–6 dBm)Y = M 2 (1) 40 W (–14 dBm)Y = M 3 (1) 4 W (–24 dBm)
Y = any other DECT channel (1) 1 W (–30 dBm)(1) The measurement bandwidth should be 100 kHz and the power should be integrated over a 1 MHz
bandwidth centred on the DECT frequency, FY.
4 Transmitter spurious emissions (conducted)
4.1 Spurious emissions when allocated a transmit channel
The spurious emissions, when a radio end point has an allocated physical channel, should meet the requirements of Table A5-4.1. The requirements of Table A5-4.1 are only applicable for frequencies which are greater than 12.5 MHz away from the centre frequency, fc, of a carrier.
TABLE A5-4.1
Spurious emissions requirements
Frequency Minimum requirement/Reference bandwidth
30 MHz f < 1 000 MHz –36 dBm/100 kHz1 GHz f < 12.75 GHz –30 dBm/1 MHz
fc – 12.5 MHz < f < fc + 12.5 MHz Not defined
Measurements should not be made for transmissions on the RF channel closest to the nearest band edge for frequency offsets of up to 2 MHz.

Rec. ITU-R M.1581-5 95
5 Receiver spurious emissions (idle mode)
5.1 Spurious emissions when the EUT has no allocated transmit channel
The power level of any spurious emissions when the radio end point has no allocated transmit channel should not exceed the limits specified in Table A5-5.1.
TABLE A5-5.1
Receiver spurious emissions
Frequency band Measurement bandwidth
Maximum level(dBm) Note
30 MHz f < 1 GHz 100 kHz(1) –571 GHz f 12.75 GHz 1 MHz(1) –47 With the exception of the
frequencies within the DECT band, covered by Table A5-5.2
(1) The power should be measured using a peak hold technique.
5.2 In the DECT band
The power level of any receiver spurious emissions within the DECT band should not exceed the limit in Table A5-5.2.
TABLE A5-5.2
Receiver spurious emissions within DECT band
Frequency band(MHz)
Measurement bandwidth(MHz)
Maximum level(dBm)
1 900-1 920 2 010-2 025 1 –57(1)
(1) The following exceptions are allowed:– in one 1 MHz band, the maximum allowable e.r.p. should be less than 20 nW;– in up to two bands of 30 kHz, the maximum e.r.p. should be less than 250 nW.
Annex 6
IMT-2000 OFDMA TDD WMAN mobile stations
This Annex defines the unwanted emission limits for IMT-2000 OFDMA TDD WMAN mobile stations.

96 Rec. ITU-R M.1581-5
1 Spectrum emission mask
1.1 Default spectrum emission mask
Unless otherwise specified in sub sections of § 1 for specific bands, the spectrum masks of Tables A6-1.1-a and A6-1.1-b are applicable.
TABLE A6-1.1-a
Default spectrum emission mask for 5 MHz carrier
∆f offset from channel centre (MHz)
Integration bandwidth (kHz)
Allowed emission level (dBm/integration bandwidth) as measured at the antenna port
2.5 to < 3.5 50 –133.5 to 12.5 1 000 –13
NOTE 1 – f is the absolute value of separation in MHz between the carrier frequency and the centre of the measuring filter.NOTE 2 – The first measurement position with a 50 kHz filter is at f equals to 2.525 MHz; the last is at f equals to 3.475 MHz. The first measurement position with a 1 MHz filter is at f equals to 4.0 MHz; the last is at f equals to 12.0 MHz.NOTE 3 – Integration bandwidth refers to the frequency range over which the emission power is integrated.
TABLE A6-1.1-b
Default spectrum emission mask for 10 MHz carrier
Offset from channel centre (MHz)
Integration bandwidth (kHz)
Allowed emission level (dBm/integration bandwidth) as measured at the antenna port
5 to < 6 100 –136 to 25 1 000 –13
NOTE 1 – f is the absolute value of separation in MHz between the carrier frequency and the centre of the measuring filter.NOTE 2 – The first measurement position with a 100 kHz filter is at f equals to 2.550 MHz; the last is at f equals to 5.950 MHz. The first measurement position with a 1 MHz filter is at f equals to 6.5 MHz; the last is at f equals to 24.5 MHz.NOTE 3 – Integration bandwidth refers to the frequency range over which the emission power is integrated.
1.2 Spectrum emission mask for TDD equipment operating in the band 2 300-2 400 MHz (BCG 1.A/1.B)
The spectrum emission mask of mobile station applies to frequencies between 2.5 MHz and 12.5 MHz away from the mobile station centre frequency for the 5 MHz carrier and between 5 MHz and 25 MHz away from the mobile station centre frequency for the 10 MHz carrier. For mobile station with 8.75 MHz channel bandwidth, the spectrum emissions mask applies to frequencies between 4.77 MHz and 21.875 MHz away from the centre frequency.
Tables A6-1.2-a to A6-1.2-d specify the spectrum emission for TDD mobile stations with 10, 5 and 8.75 MHz channel bandwidths.

Rec. ITU-R M.1581-5 97
TABLE A6-1.2-a
Spectrum emission mask for 10 MHz carrier
Segment number
Offset from channel centre frequency
(MHz)
Integration bandwidth
(kHz)
Allowed emission level(dBm/integration bandwidth)
1 5 to < 6 100 –13.002 6 to < 10 1 000 –13.003 10 to < 11 1 000 –13 – 12(f – 10)4 11 to < 15 1 000 –25.00
5 15 to < 20 1 000 –25.00
6 20 to < 25 1 000 –25.00
In Table A6-1.2-a:– Channel bandwidth is 10 MHz.– Integration bandwidth refers to the frequency range over which the emission power is
integrated.∆f is defined as the frequency offset in MHz from the channel centre frequency.
TABLE A6-1.2-b
Spectrum emission mask for 5 MHz carrier
Segment number
Offset from channel centre frequency
(MHz)
Integration bandwidth
(kHz)
Allowed emission level(dBm/integration bandwidth)
1 2.5 to < 3.5 50 –13.002 3.5 to < 7.5 1 000 –13.003 7.5 to < 8 500 –16.004 8 to < 10.4 1 000 –25.005 10.4 to < 12.5 1 000 –25.00
In Table A6-1.2-b:– Channel bandwidth is 5 MHz.– Integration bandwidth refers to the frequency range over which the emission power is
integrated.
For all combination of transmit power and centre frequencies, the spectral mask measurements shall not exceed the limits specified in Tables A6-1.2-a and A6-1.2-b for 10 and 5 MHz channel bandwidth sizes respectively.
The specification of Tables A6-1.2-c and A6-1.2-d are attenuations of out of band emission per integration bandwidth relative to the transmit power calculated over the same frequency interval as integration bandwidth.

98 Rec. ITU-R M.1581-5
TABLE A6-1.2-c
Spectrum emission mask for 8.75 MHz carrier for PTx < 23 dBm
Segment number
Offset from channel centre frequency
(MHz)
Integration bandwidth
(kHz)Specification
1 4.77 to < 9.27 100 –(26+7×(Δf – 4.77)/4.5) dB2 9.27 to < 13.23 100 –(33+4×(Δf – 9.27)/3.96) dB3 13.23 to < 17.73 100 –(37+2×(Δf – 13.23)/4.5) dB4 17.73 to < 21.875 100 –39 dB
TABLE A6-1.2-d
Spectrum emission mask for 8.75 MHz carrier for PTx ≥ 23 dBm
Segment number
Offset from channel centre frequency
(MHz)
Integration bandwidth
(kHz)Specification
1 4.77 to < 9.27 100 –((PTx-23)+26+7×(Δf – 4.77)/4.5) dB
2 9.27 to < 13.23 100 –((PTx-23)+33+4×(Δf – 9.27)/3.96) dB
3 13.23 to < 17.73 100 –((PTx-23)+37+2×(Δf – 13.23)/4.5) dB
4 17.73 to < 21.875 100 –(PTx-23)+39 dB
In Tables A6-1.2-c and A6-1.2-d:PTx: is the measured power in dBm into the antenna and∆f: is defined as the frequency offset in MHz from the channel centre frequency.
1.3 Spectrum emission mask for TDD equipment operating in the band 2 500-2 690 MHz (BCG 3.A)
The spectrum emission mask of mobile station applies to frequencies between 2.5 MHz and 12.5 MHz away from the mobile station centre frequency for the 5 MHz carrier and between 5 MHz and 25 MHz away from the mobile station centre frequency for the 10 MHz carrier.
Tables A6-1.3-a and A6-1.3-b specify the spectrum emission for TDD mobile stations with 10 and 5 MHz channel bandwidths.

Rec. ITU-R M.1581-5 99
TABLE A6-1.3-a
Spectrum emission mask for 10 MHz carrier
Segment number
Offset from channel centre frequency
(MHz)
Integration bandwidth
(kHz)
Allowed emission level(dBm/integration bandwidth)
1 5 to < 6 100 –13.002 6 to < 10 1 000 –13.003 10 to < 11 1 000 –13 – 12(f – 10)4 11 to < 15 1 000 –25.00
5 15 to < 20 1 000If PTx ≤ +23 dBm and
2 550 ≤ fc ≤ 2 620 MHz then –21 – 32/19 × (f – 10.5) else –25
6 20 to < 25 1 000If PTx ≤ +23 dBm and
2 550 ≤ fc ≤ 2 620 MHz then –37 else –25
NOTE – Maximum transmitter output power of mobile station is 23 dBm or smaller in Japan, and the frequency band of operation is limited to 2 545-2 625 MHz.
In Table A6-1.3-a:– The channel bandwidth is 10 MHz.– Integration bandwidth refers to the frequency range over which the emission power is
integrated.∆f: is defined as the frequency offset in MHz from the channel centre frequencyPTx: is the measured power in dBm into the antenna andfc: is the channel centre frequency in MHz.
TABLE A6-1.3-b
Spectrum emission mask for 5 MHz carrier
Segment number
Offset from channel centre frequency
(MHz)
Integration bandwidth
(kHz)
Allowed emission level(dBm/integration bandwidth)
1 2.5 to < 3.5 50 –13.002 3.5 to < 7.5 1 000 –13.00
3 7.5 to < 8 500If PTx ≤ +23 dBm and
2 547.5 ≤ fc ≤ 2 622.5 MHz then –23 – 2.28 × (f – 7.5) else –16.00
4 8 to < 10.4 1 000 –25.00
5 10.4 to < 12.5 1 000If PTx ≤ +23 dBm and
2 547.5 ≤ fc ≤ 2 622.5 MHz then –21 – 1.68 × (f – 8) else –25
NOTE – Maximum transmitter output power of mobile station is 23 dBm or smaller in Japan, and the frequency band of operation is limited to 2 545-2 625 MHz.

100 Rec. ITU-R M.1581-5
In Table A6-1.3-b:– the channel bandwidth is 5 MHz.– Integration bandwidth refers to the frequency range over which the emission power is
integrated.PTx: is the measured power in dBm into the antenna∆f: is defined as the frequency offset in MHz from the channel centre frequency andfc: is the channel centre frequency in MHz.
1.4 Spectrum emission mask for TDD equipment operating in the band 3 400-3 600 MHz (BCG 5L.A/5L.B/5L.C)
1.4.1 5 MHz channel bandwidth
The spectrum emission mask of the mobile station applies to frequency offsets between 2.5 MHz and 12.5 MHz on both sides of the mobile station centre carrier frequency. The out-of-channel emission is specified as power level measured over the specified measurement bandwidth relative to the total mean power of the mobile station carrier measured in the 5 MHz channel.
Table A6-1.4.1 specifies the spectrum emission for TDD mobile stations with 5 MHz channel bandwidth. The mobile station emission shall not exceed the levels specified in Table A6-1.4.1. Assuming specific power classes, relative requirements of Table A6-1.4.1 can be converted to absolute values for testing purposes. A test tolerance value of 1.5 dB is included here.
TABLE A6-1.4.1
Spectrum emission mask requirement for 5 MHz channel bandwidth
Frequency offset f Minimum requirement Measurement bandwidth
2.5 MHz to 3.5 MHz {−33 .5−15( ΔfMHz
−2 . 5)} dBc 30 kHz
3.5 to 7.5 MHz {−33 .5−1( ΔfMHz
−3 . 5)} dBc 1 MHz
7.5 to 8.5 MHz {−37 .5−10( ΔfMHz
−7 .5)} dBc 1 MHz
8.5 to 12.5 MHz –47.5 dBc 1 MHz
NOTE 1 – f is the separation between the carrier frequency and the centre of the measuring filter.NOTE 2 – The first measurement position with a 30 kHz filter is at f equals to 2.515 MHz; the last is at f equals to 3.485 MHz.NOTE 3 – The first measurement position with a 1 MHz filter is at f equals to 4 MHz; the last is at f equals to 12 MHz. As a general rule, the resolution bandwidth of the measuring equipment should be equal to the measurement bandwidth. To improve measurement accuracy, sensitivity and efficiency, the resolution bandwidth can be different from the measurement bandwidth. When the resolution bandwidth is smaller than the measurement bandwidth, the result should be integrated over the measurement bandwidth in order to obtain the equivalent noise bandwidth of the measurement bandwidth.NOTE 4 – Note that equivalent PSD type mask can be derived by applying 10*log ((5 MHz)/(30 kHz)) = 22.2 dB and 10*log((5 MHz)/(1 MHz)) = 7 dB scaling factor for 30 kHz and 1 MHz measurement bandwidth respectively.

Rec. ITU-R M.1581-5 101
1.4.2 7 MHz channel bandwidth
The spectrum emission mask of the mobile station applies to frequency offsets between 3.5 MHz and 17.5 MHz on both sides of the mobile station centre carrier frequency. The out-of-channel emission is specified as power level measured over the specified measurement bandwidth relative to the total mean power of the mobile station carrier measured in the 7 MHz channel.
Table A6-1.4.2 specifies the spectrum emission for TDD mobile stations with 7 MHz channel bandwidth. The mobile station emission shall not exceed the levels specified in Table A6-1.4.2. Assuming specific power classes, relative requirements of Table A6-1.4.2 can be converted to absolute values. A test tolerance value of 1.5 dB is included here.
TABLE A6-1.4.2
Spectrum emission mask requirement for 7 MHz channel bandwidth
Frequency offset f Minimum requirement Measurement bandwidth
3.5 MHz to 4.75 MHz {−33 .5−13 .5⋅( ΔfMHz
−3 . 5)} dBc 30 kHz
4.75 to 10.5 MHz {−35 .0−0 . 7⋅( ΔfMHz
−4 .75)} dBc 1 MHz
10.5 to 11.9 MHz {−39 .0−7⋅( ΔfMHz
−10 . 5)} dBc 1 MHz
11.9 to 17.5 MHz –49.0 dBc 1 MHz
NOTE 1 – f is the separation between the carrier frequency and the centre of the measuring filter.NOTE 2 – The first measurement position with a 30 kHz filter is at f equals to 3.515 MHz; the last is at f equals to 4.735 MHz.NOTE 3 – The first measurement position with a 1 MHz filter is at f equals to 5.25 MHz; the last is at f equals to 17 MHz. As a general rule, the resolution bandwidth of the measuring equipment should be equal to the measurement bandwidth. To improve measurement accuracy, sensitivity and efficiency, the resolution bandwidth can be different from the measurement bandwidth. When the resolution bandwidth is smaller than the measurement bandwidth, the result should be integrated over the measurement bandwidth in order to obtain the equivalent noise bandwidth of the measurement bandwidth.NOTE 4 – Note that equivalent PSD type mask can be derived by applying 10*log ((7 MHz)/(30 kHz)) = 23.7 dB and 10*log((7 MHz)/(1 MHz)) = 8.5 dB scaling factor for 30 kHz and 1 MHz measurement bandwidth respectively.
1.4.3 10 MHz channel bandwidth
The spectrum emission mask of the mobile station applies to frequency offsets between 5.0 MHz and 25.0 MHz on both sides of the mobile station centre carrier frequency. The out-of-channel emission is specified as power level measured over the specified measurement bandwidth relative to the total mean power of the mobile station carrier measured in the 10 MHz channel.
Table A6-1.4.3 specify the spectrum emission for TDD mobile stations with 10 MHz channel bandwidth. The mobile station emission shall not exceed the levels specified in Table A6-1.4.3. Assuming specific power classes, relative requirements of Table A6-1.4.3 can be converted to absolute values. A test tolerance value of 1.5 dB is included here.

102 Rec. ITU-R M.1581-5
TABLE A6-1.4.3
Spectrum emission mask requirement for 10 MHz channel bandwidth
Frequency offset f Minimum requirement Measurement bandwidth
5.0 MHz to 7.0 MHz {−33 .5−9⋅( ΔfMHz
−5 .0)} dBc 30 kHz
7.0 to 15.0 MHz {−36 .5−0 . 5⋅( ΔfMHz
−7 .0)} dBc 1 MHz
15.0 to 17.0 MHz {−36 .5−0 . 5⋅( ΔfMHz
−15. 0)} dBc 1 MHz
17.0 to 25.0 MHz –50.5 dBc 1 MHz
NOTE 1 – f is the separation between the carrier frequency and the centre of the measuring filter.NOTE 2 – The first measurement position with a 30 kHz filter is at f equals to 5.015 MHz; the last is at f equals to 6.985 MHz.NOTE 3 – The first measurement position with a 1 MHz filter is at f equals to 7.5 MHz; the last is at f equals to 24.5 MHz. As a general rule, the resolution bandwidth of the measuring equipment should be equal to the measurement bandwidth. To improve measurement accuracy, sensitivity and efficiency, the resolution bandwidth can be different from the measurement bandwidth. When the resolution bandwidth is smaller than the measurement bandwidth, the result should be integrated over the measurement bandwidth in order to obtain the equivalent noise bandwidth of the measurement bandwidth.NOTE 4 – Equivalent PSD type mask can be derived by applying 10*log ((10 MHz)/(30 kHz)) = 25.2 dB and 10*log((10 MHz)/(1 MHz)) = 10 dB scaling factor for 30 kHz and 1 MHz measurement bandwidth respectively.
1.5 Spectrum emission mask for TDD equipment operating in the bands 3 600-3 800 MHz (BCG 5H.A/5H.B/5H.C)
1.5.1 5 MHz channel bandwidth
The spectrum emission mask of the mobile station applies to frequency offsets between 2.5 MHz and 12.5 MHz on both sides of the mobile station centre carrier frequency. The out-of-channel emission is specified as power level measured over the specified measurement bandwidth relative to the total mean power of the mobile station carrier measured in the 5 MHz channel.
Table A6-1.5.1 specifies the spectrum emission for TDD mobile stations with 5 MHz channel bandwidth. The mobile station emission shall not exceed the levels specified in Table A6-1.5.1. Assuming specific power classes, relative requirements of Table A6-1.5.1 can be converted to absolute values for testing purposes. A test tolerance value of 1.5 dB is included here.

Rec. ITU-R M.1581-5 103
TABLE A6-1.5.1
Spectrum emission mask requirement for 5 MHz channel bandwidth
Frequency offset f Minimum requirement Measurement bandwidth
2.5 MHz to 3.5 MHz {−33 .5−15⋅( ΔfMHz
−2 .5)} dBc 30 kHz
3.5 to 7.5 MHz {−33 .5−1⋅( ΔfMHz
−3 .5)} dBc 1 MHz
7.5 to 8.5 MHz {−37 .5−10⋅( ΔfMHz
−7 . 5)} dBc 1 MHz
8.5 to 12.5 MHz –47.5 dBc 1 MHz
NOTE 1 – f is the separation between the carrier frequency and the centre of the measuring filter.NOTE 2 – The first measurement position with a 30 kHz filter is at f equals to 2.515 MHz; the last is at f equals to 3.485 MHz.NOTE 3 – The first measurement position with a 1 MHz filter is at f equals to 4 MHz; the last is at f equals to 12 MHz. As a general rule, the resolution bandwidth of the measuring equipment should be equal to the measurement bandwidth. To improve measurement accuracy, sensitivity and efficiency, the resolution bandwidth can be different from the measurement bandwidth. When the resolution bandwidth is smaller than the measurement bandwidth, the result should be integrated over the measurement bandwidth in order to obtain the equivalent noise bandwidth of the measurement bandwidth.NOTE 4 – Note that equivalent PSD type mask can be derived by applying 10*log ((5 MHz)/(30 kHz)) = 22.2 dB and 10*log((5 MHz)/(1 MHz)) = 7 dB scaling factor for 30 kHz and 1 MHz measurement bandwidth respectively.
1.5.2 7 MHz channel bandwidth
The spectrum emission mask of the mobile station applies to frequency offsets between 3.5 MHz and 17.5 MHz on both sides of the mobile station centre carrier frequency. The out-of-channel emission is specified as power level measured over the specified measurement bandwidth relative to the total mean power of the mobile station carrier measured in the 7 MHz channel.
Table A6-1.5.2 specifies the spectrum emission for TDD mobile stations with 7 MHz channel bandwidth. The mobile station emission shall not exceed the levels specified in Table A6-1.5.2. Assuming specific power classes, relative requirements of Table A6-1.5.2 can be converted to absolute values. A test tolerance value of 1.5 dB is included here.

104 Rec. ITU-R M.1581-5
TABLE A6-1.5.2
Spectrum emission mask requirement for 7 MHz channel bandwidth
Frequency offset f Minimum requirement Measurement bandwidth
3.5 MHz to 4.75 MHz {−33 .5−13 .5⋅( ΔfMHz
−3 .5)} dBc 30 kHz
4.75 to 10.5 MHz {−35 .0−0 . 7⋅( ΔfMHz
−4 .75)} dBc 1 MHz
10.5 to 11.9 MHz {−39 .0−7⋅( ΔfMHz
−10 . 5)} dBc 1 MHz
11.9 to 17.5 MHz –49.0 dBc 1 MHz
NOTE 1 – f is the separation between the carrier frequency and the centre of the measuring filter.NOTE 2 – The first measurement position with a 30 kHz filter is at f equals to 3.515 MHz; the last is at f equals to 4.735 MHz.NOTE 3 – The first measurement position with a 1 MHz filter is at f equals to 5.25 MHz; the last is at f equals to 17 MHz. As a general rule, the resolution bandwidth of the measuring equipment should be equal to the measurement bandwidth. To improve measurement accuracy, sensitivity and efficiency, the resolution bandwidth can be different from the measurement bandwidth. When the resolution bandwidth is smaller than the measurement bandwidth, the result should be integrated over the measurement bandwidth in order to obtain the equivalent noise bandwidth of the measurement bandwidth.NOTE 4 – Note that equivalent PSD type mask can be derived by applying 10*log ((7 MHz)/(30 kHz)) = 23.7 dB and 10*log((7 MHz)/(1 MHz)) = 8.5 dB scaling factor for 30 kHz and 1 MHz measurement bandwidth respectively.
1.5.3 10 MHz channel bandwidth
The spectrum emission mask of the mobile station applies to frequency offsets between 5.0 MHz and 25.0 MHz on both sides of the mobile station centre carrier frequency. The out-of-channel emission is specified as power level measured over the specified measurement bandwidth relative to the total mean power of the mobile station carrier measured in the 10 MHz channel.
Table A6-1.5.3 specify the spectrum emission for TDD mobile stations with 10 MHz channel bandwidth. The mobile station emission shall not exceed the levels specified in Table A6-1.5.3. Assuming specific power classes, relative requirements of Table A6-1.5.3 can be converted to absolute values. A test tolerance value of 1.5 dB is included here.

Rec. ITU-R M.1581-5 105
TABLE A6-1.5.3
Spectrum emission mask requirement for 10 MHz channel bandwidth
Frequency offset f Minimum requirement Measurement bandwidth
5.0 MHz to 7.0 MHz {−33 .5−9⋅( ΔfMHz
−5 . 0)} dBc 30 kHz
7.0 to 15.0 MHz {−36 .5−0 . 5⋅( ΔfMHz
−7 .0)} dBc 1 MHz
15.0 to 17.0 MHz {−40 . 5−5⋅( ΔfMHz
−15 . 0)} dBc 1 MHz
17.0 to 25.0 MHz –50.5 dBc 1 MHz
NOTE 1 – f is the separation between the carrier frequency and the centre of the measuring filter.NOTE 2 – The first measurement position with a 30 kHz filter is at f equals to 5.015 MHz; the last is at f equals to 6.985 MHz.NOTE 3 – The first measurement position with a 1 MHz filter is at f equals to 7.5 MHz; the last is at f equals to 24.5 MHz. As a general rule, the resolution bandwidth of the measuring equipment should be equal to the measurement bandwidth. To improve measurement accuracy, sensitivity and efficiency, the resolution bandwidth can be different from the measurement bandwidth. When the resolution bandwidth is smaller than the measurement bandwidth, the result should be integrated over the measurement bandwidth in order to obtain the equivalent noise bandwidth of the measurement bandwidth.NOTE 4 – Equivalent PSD type mask can be derived by applying 10*log ((10 MHz)/(30 kHz)) = 25.2 dB and 10*log((10 MHz)/(1 MHz)) = 10 dB scaling factor for 30 kHz and 1 MHz measurement bandwidth respectively.
1.6 Spectrum emission mask for FDD equipment operating in the bands 1 710-1 770/2 110-2 170 MHz (BCG 6A)
The spectrum emission mask of mobile station applies to frequencies between 2.5 MHz and 12.5 MHz away from the mobile station centre frequency for the 5 MHz carrier and between 5 MHz and 25 MHz away from the mobile station centre frequency for the 10 MHz carrier.
Tables A6-1.6-a and A6-1.6-b specify the spectrum emission for FDD mobile stations with 10 and 5 MHz channel bandwidths.
TABLE A6-1.6-a
Spectrum emission mask requirement for 10 MHz channel bandwidth
Segment number
Offset from channel centre
(MHz)
Integration bandwidth
(kHz)
Allowed emission level (dBm/integration bandwidth) as measured at the antenna port
1 5 to < 6 100 –13.002 6 to 25 1 000 –13.00

106 Rec. ITU-R M.1581-5
TABLE A6-1.6-b
Spectrum emission mask requirement for 5 MHz channel bandwidth
Segment number
Offset from channel centre
(MHz)
Integration bandwidth
(kHz)
Allowed emission level (dBm/integration BW)at the antenna port
1 2.5 to < 3.5 50 –132 3.5 to 12.5 1 000 –13
NOTE 1 – Integration bandwidth refers to the frequency range over which the emission power is integrated. NOTE 2 – Protection requirement beyond 25 MHz (250% of the bandwidth) is specified in the spurious emissions requirement.
1.7 Spectrum emission mask for FDD equipment operating in the bands 1 920-1 980/2 110-2 170 MHz (BCG 6.B)
The spectrum emission mask of mobile station applies to frequencies between 2.5 MHz and 12.5 MHz away from the mobile station centre frequency for the 5 MHz carrier and between 5 MHz and 25 MHz away from the mobile station centre frequency for the 10 MHz carrier.
Table A6-1.7-a and Table A6-1.7-b specify the spectrum emission for FDD mobile stations with 5 and 10 MHz channel bandwidths.
TABLE A6-1.7-a
Spectrum emission mask for 5 MHz carrier
Segment number
Offset from channel centre frequency
(MHz)
Integration bandwidth
(kHz)
Allowed emission level(dBm/integration bandwidth)
1 2.5 to < 3.5 30 –15.002 3.5 to < 5.0 1 000 –10.003 5.0 to < 7.5 1 000 –10.004 7.5 to < 8.5 1 000 –13.005 8.5 to < 12.5 1 000 –25.00
NOTE 1 – ∆f is the separation between the carrier frequency and the centre of the measuring filter.NOTE 2 – The first measurement position with a 30 kHz filter is at ∆ f equals to 2.515 MHz; the last is at ∆f equals to 3.485 MHz. The first measurement position with a 1 MHz filter is at ∆ f equals to 4.0 MHz; the last is at ∆f equals to 12.0 MHz.NOTE 3 – Integration bandwidth refers to the frequency range over which the emission power is integrated.

Rec. ITU-R M.1581-5 107
TABLE A6-1.7-b
Spectrum emission mask for 10 MHz carrier
Segment number
Offset from channel centre frequency
(MHz)
Integration bandwidth
(kHz)
Allowed emission level(dBm/integration bandwidth)
1 5.0 to < 6.0 30 –18.002 6.0 to < 7.5 1 000 –10.003 7.5 to < 10.0 1 000 –10.004 10.0 to < 11.0 1 000 –13.005 11.0 to < 15.0 1 000 –13.006 15.0 to < 25.0 1 000 –25.00
NOTE 1 – ∆f is the separation between the carrier frequency and the centre of the measuring filter.NOTE 2 – The first measurement position with a 30 kHz filter is at ∆ f equals to 5.015 MHz; the last is at ∆f equals to 5.985 MHz. The first measurement position with a 1 MHz filter is at ∆ f equals to 6.5 MHz; the last is at ∆f equals to 24.5 MHz.NOTE 3 – Integration bandwidth refers to the frequency range over which the emission power is integrated.
1.8 Spectrum emission mask for FDD equipment operating in the band 2 496-2 690 MHz (BCG 3.B)
The spectrum emission mask of mobile station applies to frequencies between 2.5 MHz and 12.5 MHz away from the mobile station centre frequency for the 5 MHz carrier and between 5 MHz and 25 MHz away from the mobile station centre frequency for the 10 MHz carrier.
Tables A6-1.8-a and A6-1.8-b specify the spectrum emission for FDD mobile stations with 10 and 5 MHz channel bandwidths.
TABLE A6-1.8-a
Spectrum emission mask for 10 MHz carrier
Segment number
Offset from channel centre frequency
(MHz)
Integration bandwidth
(kHz)
Allowed emission level(dBm/integration bandwidth)
1 5 to < 6 100 –13.002 6 to < 10 1 000 –13.003 10 to < 11 1 000 –13 – 12(f – 10)4 11 to < 15 1 000 –25.00
5 15 to < 20 1 000 –25.00
6 20 to < 25 1 000 –25.00
In Table A6-1.8-a:– Channel bandwidth is 10 MHz.– Integration bandwidth refers to the frequency range over which the emission power is
integrated.∆f: is defined as the frequency offset in MHz from the channel centre frequency

108 Rec. ITU-R M.1581-5
PTx: is the measured power in dBm into the antennafc: is the channel centre frequency in MHz.
TABLE A6-1.8-b
Spectrum emission mask for 5 MHz carrier
Segment number
Offset from channel centre frequency
(MHz)
Integration bandwidth
(kHz)
Allowed emission level(dBm/integration bandwidth)
1 2.5 to < 3.5 50 –13.002 3.5 to < 7.5 1 000 –13.003 7.5 to < 8 1 000 –16.004 8 to < 10.4 1 000 –25.005 10.4 to < 12.5 1 000 –25.00
In Table A6-1.8-b:– Channel bandwidth is 5 MHz.– Integration bandwidth refers to the frequency range over which the emission power is
integrated.PTx: is the measured power in dBm into the antenna∆f: is defined as the frequency offset in MHz from the channel centre frequencyfc: is the channel centre frequency in MHz.
1.9 Spectrum emission mask for FDD equipment operating in the bands 1 710-1 785/1 805-1 880 MHz (BCG 6.C)
The spectrum emission mask of mobile station applies to frequencies between 2.5 MHz and 12.5 MHz away from the mobile station centre frequency for the 5 MHz carrier and between 5 MHz and 25 MHz away from the mobile station centre frequency for the 10 MHz carrier.
Table A6-1.9-a and Table A6-1.9-b specify the spectrum emission for FDD mobile stations with 5 and 10 MHz channel bandwidths.
TABLE A6-1.9-a
Spectrum emission mask for 5 MHz carrier
Offset from channel centre (MHz)
Integration bandwidth (kHz)
Allowed emission level (dBm/integration bandwidth) as measured
at the antenna port
2.5 to < 3.5 50 –133.5 to < 7.5 1 000 –107.5 to < 8.5 1 000 –138.5 to < 12.5 1 000 –25

Rec. ITU-R M.1581-5 109
TABLE A6-1.9-b
Spectrum emission mask for 10 MHz carrier
Offset from channel centre(MHz)
Integration bandwidth (kHz)
Allowed emission level (dBm/integration bandwidth) as measured
at the antenna port
5.0 to < 6.0 50 –136.0 to < 10.0 1 000 –1010.0 to < 11.0 1 000 –1311.0 to < 25.0 1 000 –25
1.10 Spectrum emission mask for TDD equipment operating in the bands 698-862 MHz (BCG 7.A)
The spectrum emission mask of mobile station applies to frequencies between 2.5 MHz and 12.5 MHz away from the mobile station centre frequency for the 5 MHz carrier, between 3.5 MHz and 17.5 MHz for the 7 MHz carrier and between 5 MHz and 25 MHz for the 10 MHz carrier.
Table A6-1.10-a to Table A6-1.10-f specify the spectrum emission for FDD mobile stations with 5, 7 and 10 MHz channel bandwidths.
TABLE A6-1.10-a
Spectrum emission mask for 5 MHz carrier – 700.5 fc 795.5
Frequency offset f from channel centre
(MHz)
Integration Bandwidth
(kHz)
Allowed emission level (dBm/integration bandwidth)as measured at the antenna port
2.5 to 2.6 30 –132.6 to 12.5 100 –13
NOTE 1 – f is the separation between the carrier frequency and the centre of the measuring filter.NOTE 2 – The first measurement position with a 30 kHz filter is at f equals to 2.515 MHz; the last is at f equals to 2.585 MHz. The first measurement position with a 100 kHz filter is at f equals to 2.650 MHz; the last is at f equals to 12.450 MHz.
TABLE A6-1.10-b
Spectrum emission mask for 5 MHz carrier – 799.5 fc 859.5
Frequency offset f from channel centre
(MHz)
Integration bandwidth
(MHz)
Allowed emission level (dBm/integration bandwidth) as measured at the antenna port
2.5 to 7.5 5 1.67.5 to 12.5 2 –10
NOTE 1 – f is the separation between the carrier frequency and the centre of the measuring filter.NOTE 2 – The measurement position with a 5 MHz filter is at f equals to 5 MHz. The first measurement position with a 2 MHz filter is at f equals to 8.5 MHz; the last is at f equals to 11.5 MHz.

110 Rec. ITU-R M.1581-5
TABLE A6-1.10-c
Spectrum emission mask for 7 MHz carrier – 701.5 fc 794.5
Frequency offset f from channel centre
(MHz)
Integration bandwidth
(kHz)
Allowed emission level (dBm/integration bandwidth) as measured at the antenna port
3.5 to 3.6 30 –133.6 to 17.5 100 –13
NOTE 1 – f is the separation between the carrier frequency and the centre of the measuring filter.NOTE 2 – The first measurement position with a 30 kHz filter is at f equals to 3.515 MHz; the last is at f equals to 3.585 MHz. The first measurement position with a 100 kHz filter is at f equals to 3.650 MHz; the last is at f equals to 17.450 MHz.
TABLE A6-1.10-d
Spectrum emission mask for 7 MHz carrier – 800.5 fc 858.5
Frequency offset f from channel centre
(MHz)
Integration bandwidth
(MHz)
Allowed emission level (dBm/integration bandwidth)as measured at the antenna port
3.5 to 8.5 5 1.68.5 to 17.5 2 –10
NOTE 1 – f is the separation between the carrier frequency and the centre of the measuring filter.NOTE 2 – The measurement position with a 5 MHz filter is at f equals to 6 MHz. The first measurement position with a 2 MHz filter is at f equals to 9.5 MHz; the last is at f equals to 16.5 MHz.
TABLE A6-1.10-e
Spectrum emission mask for 10 MHz carrier – 703 fc 793
Frequency offset f from channel centre
(MHz)
Integration bandwidth
(kHz)
Allowed emission level (dBm/integration bandwidth)as measured at the antenna port
5.0 to 5.1 30 –135.1 to 25.0 100 –13
NOTE 1 – f is the separation between the carrier frequency and the centre of the measuring filter.NOTE 2 – The first measurement position with a 30 kHz filter is at f equals to 5.015 MHz; the last is at f equals to 5.085 MHz. The first measurement position with a 100 kHz filter is at f equals to 5.150 MHz; the last is at f equals to 24.950 MHz.
TABLE A6-1.10-f
Spectrum emission mask for 10 MHz carrier – 802 fc 857
Frequency offset f from channel centre
(MHz)
Integration bandwidth
(MHz)
Allowed emission level (dBm/integration bandwidth) as measured at the antenna port
5 to 10 5 1.610 to 25 2 –10

Rec. ITU-R M.1581-5 111
NOTE 1 – f is the separation between the carrier frequency and the centre of the measuring filter.NOTE 2 – The measurement position with a 5 MHz filter is at f equals to 7.5 MHz. The first measurement position with a 2 MHz filter is at f equals to 11 MHz; the last is at f equals to 24 MHz.
1.11 Spectrum emission mask for FDD equipment operating in the bands 776-787/746-757 MHz (BCG 7.B)
The spectrum emission mask of mobile station applies to frequencies between 2.5 MHz and 12.5 MHz away from the mobile station centre frequency for the 5 MHz carrier and between 5 MHz and 25 MHz away from the mobile station centre frequency for the 10 MHz carrier.
Table A6-1.11-a and Table A6-1.11-b specify the spectrum emission for FDD mobile stations with 5 and 10 MHz channel bandwidths.
TABLE A6-1.11-a
Spectrum emission mask for 5 MHz carrier
Frequency offset f from channel centre
(MHz)
Integration bandwidth
(kHz)
Allowed emission level (dBm/integration bandwidth) as measured at the antenna port
2.5 to 2.6 30 –132.6 to 12.5 100 –13
NOTE 1 – f is the separation between the carrier frequency and the centre of the measuring filter.NOTE 2 – The first measurement position with a 30 kHz filter is at f equals to 2.515 MHz; the last is at f equals to 2.585 MHz. The first measurement position with a 100 kHz filter is at f equals to 2.650 MHz; the last is at f equals to 12.450 MHz.
TABLE A6-1.11-b
Spectrum emission mask for 10 MHz carrier
Frequency offset f from channel centre
(MHz)
Integration bandwidth
(kHz)
Allowed emission level (dBm/integration bandwidthas measured at the antenna port
5.0 to 5.1 30 –135.1 to 25.0 100 –13
NOTE 1 – f is the separation between the carrier frequency and the centre of the measuring filter.NOTE 2 – The first measurement position with a 30 kHz filter is at f equals to 5.015 MHz; the last is at f equals to 5.085 MHz. The first measurement position with a 100 kHz filter is at f equals to 5.150 MHz; the last is at f equals to 24.950 MHz.
1.12 Spectrum emission mask for FDD equipment operating in the bands 788-793/758-763 and 793-798/763-768 MHz (BCG 7.C)
The spectrum emission mask of mobile station applies to frequencies between 2.5 MHz and 12.5 MHz away from the mobile station centre frequency for the 5 MHz.
Table A6-1.12 specifies the spectrum emission for FDD mobile stations with 5 MHz channel bandwidth.

112 Rec. ITU-R M.1581-5
TABLE A6-1.12
Spectrum emission mask for 5 MHz carrier
Frequency offset f from channel centre
(MHz)
Integration bandwidth
(kHz)
Allowed emission level (dBm/integration bandwidth)as measured at the antenna port
2.5 to 2.6 30 –132.6 to 12.5 100 –13
NOTE 1 – f is the separation between the carrier frequency and the centre of the measuring filter.NOTE 2 – The first measurement position with a 30 kHz filter is at f equals to 2.515 MHz; the last is at f equals to 2.585 MHz. The first measurement position with a 100 kHz filter is at f equals to 2.650 MHz; the last is at f equals to 12.450 MHz.
1.13 Spectrum emission mask for FDD equipment operating in the bands 788-798/758-768 MHz (BCG 7.D)
The spectrum emission mask of mobile station applies to frequencies between 5 MHz and 25 MHz away from the mobile station centre frequency for the 10 MHz channel bandwidth.
Table A6-1.13 specifies the spectrum emission for FDD mobile stations with 10 MHz channel bandwidth.
TABLE A6-1.13
Spectrum emission mask for 10 MHz carrier
Frequency offset f from channel centre
(MHz)
Integration bandwidth
(kHz)
Allowed emission level (dBm/integration bandwidth)as measured at the antenna port
5.0 to 5.1 30 –135.1 to 25.0 100 –13
NOTE 1 – f is the separation between the carrier frequency and the centre of the measuring filter.NOTE 2 – The first measurement position with a 30 kHz filter is at f equals to 5.015 MHz; the last is at f equals to 5.085 MHz. The first measurement position with a 100 kHz filter is at f equals to 5.150 MHz; the last is at f equals to 24.950 MHz.
1.14 Spectrum emission mask for FDD and TDD equipment operating in the bands 698-862 MHz (BCG 7.E)
The spectrum emission mask of mobile station applies to frequencies between 2.5 MHz and 12.5 MHz away from the mobile station centre frequency for the 5 MHz carrier and between 3.5 MHz and 17.5 MHz for the 10 MHz carrier, and between 5 MHz and 25 MHz for the 10 MHz carrier.
Table A6-1.14-a to Table A6-1.14-f specify the spectrum emission for FDD and TDD mobile stations with 5, 7 and 10 MHz channel bandwidths.

Rec. ITU-R M.1581-5 113
TABLE A6-1.14-a
Spectrum emission mask for 5 MHz carrier – 700.5 fc 795.5
Frequency offset f from channel centre
(MHz)
Integration bandwidth
(kHz)
Allowed emission level (dBm/integration bandwidth)as measured at the antenna port
2.5 to 2.6 30 –132.6 to 12.5 100 –13
NOTE 1 – f is the separation between the carrier frequency and the centre of the measuring filter.NOTE 2 – The first measurement position with a 30 kHz filter is at f equals to 2.515 MHz; the last is at f equals to 2.585 MHz. The first measurement position with a 100 kHz filter is at f equals to 2.650 MHz; the last is at f equals to 12.450 MHz.
TABLE A6-1.14-b
Spectrum emission mask for 5 MHz carrier – 799.5 fc 859.5
Frequency offset f from channel centre
(MHz)
Integration bandwidth
(MHz)
Allowed emission level (dBm/integration bandwidth)as measured at the antenna port
2.5 to 7.5 5 1.67.5 to 12.5 2 –10
NOTE 1 – f is the separation between the carrier frequency and the centre of the measuring filter.NOTE 2 – The measurement position with a 5 MHz filter is at f equals to 5 MHz. The first measurement position with a 2 MHz filter is at f equals to 8.5 MHz; the last is at f equals to 11.5 MHz.
TABLE A6-1.14-c
Spectrum emission mask for 7 MHz carrier – 701.5 fc 794.5
Frequency offset f from channel centre
(MHz)
Integration bandwidth
(kHz)
Allowed emission level (dBm/integration bandwidth)as measured at the antenna port
3.5 to 3.6 30 –133.6 to 17.5 100 –13
NOTE 1 – f is the separation between the carrier frequency and the centre of the measuring filter.NOTE 2 – The first measurement position with a 30 kHz filter is at f equals to 3.515 MHz; the last is at f equals to 3.585 MHz. The first measurement position with a 100 kHz filter is at f equals to 3.650 MHz; the last is at f equals to 17.450 MHz.
TABLE A6-1.14-d
Spectrum emission mask for 7 MHz carrier – 800.5 fc 858.5
Frequency offset f from channel centre
(MHz)
Integration bandwidth
(MHz)
Allowed emission level (dBm/Integration Bandwidth)as measured at the antenna port
3.5 to 8.5 5 1.68.5 to 13.5 2 –10

114 Rec. ITU-R M.1581-5
13.5 to 17.5 1 –25
NOTE 1 – f is the separation between the carrier frequency and the centre of the measuring filter.NOTE 2 – The measurement position with a 5 MHz filter is at f equals to 6 MHz. The first measurement position with a 2 MHz filter is at f equals to 9.5 MHz; the last is at f equals to 12.5 MHz. The first measurement position with a 1 MHz filter is at f equals to 14 MHz; the last is at f equals to 17 MHz.NOTE 3 – The emission level of Segment 3 is only applicable when 835.5 fc 858.5.
TABLE A6-1.14-e
Spectrum emission mask for 10 MHz carrier – 703 fc 793
Frequency offset f from channel centre
(MHz)
Integration bandwidth
(kHz)
Allowed emission level (dBm/integration bandwidth)as measured at the antenna port
5.0 to 5.1 30 –135.1 to 25.0 100 –13
NOTE 1 – f is the separation between the carrier frequency and the centre of the measuring filter.NOTE 2 – The first measurement position with a 30 kHz filter is at f equals to 5.015 MHz; the last is at f equals to 5.085 MHz. The first measurement position with a 100 kHz filter is at f equals to 5.150 MHz; the last is at f equals to 24.950 MHz.
TABLE A6-1.14-f
Spectrum emission mask for 10 MHz carrier – 802 fc 857
Frequency offset f from channel centre
(MHz)
Integration bandwidth
(MHz)
Allowed emission level (dBm/integration bandwidth)as measured at the antenna port
5 to 10 5 1.610 to 15 2 –1015 to 25 1 –25
NOTE 1 – f is the separation between the carrier frequency and the centre of the measuring filter.NOTE 2 – The measurement position with a 5 MHz filter is at f equals to 7.5 MHz. The first measurement position with a 2 MHz filter is at f equals to 11 MHz; the last is at f equals to 14 MHz. The first measurement position with a 1 MHz filter is at f equals to 15.5 MHz; the last is at f equals to 24.5 MHz.NOTE 3 – The emission level of Segment 3 is only applicable when 837 fc 857.
1.15 Spectrum emission mask for FDD equipment operating in the bands 880-915/925-960 MHz (BCG 7.F)
The spectrum emission mask of mobile station applies to frequencies between 2.5 MHz and 12.5 MHz away from the mobile station centre frequency for the 5 MHz carrier and between 5 MHz and 25 MHz for the 10 MHz carrier.
Table A6-1.15-a and Table A6-1.15-b specify the spectrum emission for FDD mobile stations with 5 and 10 MHz channel bandwidths.

Rec. ITU-R M.1581-5 115
TABLE A6-1.15-a
Spectrum emission mask for 5 MHz carrier
Offset from channel centre
(MHz)
Integration bandwidth(kHz)
Allowed emission level (dBm/integration bandwidth) as measured at the antenna port
2.5 to < 3.5 50 –133.5 to < 7.5 1 000 –107.5 to < 8.5 1 000 –13
8.5 to 12.5 1 000 –25
TABLE A6-1.15-b
Spectrum emission mask for 10 MHz carrier
Offset from channel centre
(MHz)
Integration bandwidth(kHz)
Allowed emission level (dBm/integration bandwidth) as measured at the antenna port
5.0 to < 6.0 50 –136.0 to < 10.0 1 000 –1010.0 to < 11.0 1 000 –1311.0 to 25.0 1 000 –25
1.16 Spectrum emission mask for TDD equipment operating in the bands 1 785-1 805, 1 880-1 920, 1 910-1 930, 2 010-2 025, and 1 900-1 920 MHz (BCG 8.A)
The spectrum emission mask of mobile station applies to frequencies between 2.5 MHz and 12.5 MHz away from the mobile station centre frequency for the 5 MHz carrier and between 5 MHz and 25 MHz for the 10 MHz carrier.
Table A6-1.16-a and Table A6-1.16-b specify the spectrum emission for TDD mobile stations with 5 and 10 MHz channel bandwidths.
TABLE A6-1.16-a
Spectrum emission mask for 5 MHz carrier
Offset fromchannel centre
(MHz)
Integration bandwidth(kHz)
Allowed emission level (dBm/integration BW) at the antenna port
2.5 to < 3.5 50 –133.5 to < 7.5 1 000 –10
73.5 to 8.5 1 000 –138.5 to 12.5 1 000 –25
NOTE 1 – f is the separation between the carrier frequency and the centre of the measuring filter.NOTE 2 – The first measurement position with a 50 kHz filter is at f equals to 2.525 MHz; the last is at f equals to 3.475 MHz. The first measurement position with a 1 MHz filter is at f equals to 4.0 MHz; the last is at f equals to 12 MHz.

116 Rec. ITU-R M.1581-5
TABLE A6-1.16-b
Spectrum emission mask for 10 MHz carrier
Offset from channel centre
(MHz)
Integration bandwidth(kHz)
Allowed emission level (dBm/integration bandwidth) as measured at the antenna port
5 to < 6 100 –136 to < 10 1 000 –10
106 to 15 1 000 –1315 to 25 1 000 –25
NOTE 1 – f is the separation between the carrier frequency and the centre of the measuring filter.NOTE 2 – The first measurement position with a 100 kHz filter is at f equals to 5.050 MHz; the last is at f equals to 5.950 MHz. The first measurement position with a 1 MHz filter is at f equals to 6.5 MHz; the last is at f equals to 24.5 MHz.
2 Transmitter spurious emissions (conducted)
2.1 Default spurious emissions
Unless otherwise specified in sub sections of § 2 for specific bands, the default spurious emission specifications of Table A6-2.1 are applicable.
TABLE A6-2.1
Default spurious emissions – relevant to FUL-le + ChBW/2 fc FUL-ue – ChBW/2
Spurious frequency (f) range Measurement bandwidth
Maximum emission level
(dBm)
9 kHz f < 150 kHz 1 kHz –36150 kHz f < 30 MHz 10 kHz –36
30 MHz f < 1 000 MHz 100 kHz –361 GHz f < 5 × Fue 30 kHz If 2.5xChBW ∆f < 10xChBW
300 kHz If 10xChBW MHz ∆f < 12xChBW1 MHz If 12xChBW ∆f
–30
2.2 Spurious emissions for TDD equipment operating in the band 2 300-2 400 MHz (BCG 1.A/1.B)
The limits shown in Tables A6-2.2-a to A6-2.2-c are for frequency offsets which are greater than 2.5 times the channel bandwidth from the mobile station centre frequency. In the Table | f | is fc–f, where f is the frequency of the spurious domain emissions and fc is the mobile station transmit centre frequency. All spurious emission specifications are of conducted type.
Tables A6-2.2-a to A6-2.2-c specify the spurious emission for TDD mobile stations with 5, 8.75 and 10 MHz channel bandwidths.

Rec. ITU-R M.1581-5 117
TABLE A6-2.2-a
Spurious emissions for 5 MHz channel size; relevant to 2 302.5 MHz fc 2 397.5 MHz
Row Spurious frequency (f) range Measurement bandwidth
Minimum specification
(dBm)
1 9 kHz f < 150 kHz 1 kHz –362 150 kHz f < 30 MHz 10 kHz –363 30 MHz f < 1 000 MHz 100 kHz –364
1 GHz f < 19 GHz30 kHz If 12.5 | f | < 50300 kHz If 50 | f | < 601 MHz If 60 |f |
–30
TABLE A6-2.2-b
Spurious emissions for 8.75 MHz channel bandwidth
Row Spurious frequency (f) range Measurement bandwidth
Minimum requirement
(dBm)
1 30 MHz f < 1 000 MHz 100 kHz –132 1 GHz f 12 GHz 1 MHz –13
TABLE A6-2.2-c
Spurious emissions for 10 MHz channel size; relevant to 2 305 MHz fc 2 395 MHz
Row Spurious frequency (f) range Measurement bandwidth
Minimum specification
(dBm)
1 9 kHz f < 150 kHz 1 kHz –362 150 kHz f < 30 MHz 10 kHz –363 30 MHz f < 1 000 MHz 100 kHz –364
1 GHz f < 19 GHz30 kHz If 25 | f | < 100300 kHz If 100 | f | < 1201 MHz If 120 |f |
–30
TABLE A6-2.2-d
Additional spurious emissions for 5 MHz channel size; relevant to 2 302.5 fc 2 397.5 (BCG 1.B)
No Spurious frequency (f) range (MHz)
Measurement bandwidth (MHz)
Maximum emission level(dBm)
1 2 110 f < 2 170 1 –502 1 805 f < 1 880 1 –50

118 Rec. ITU-R M.1581-5
3 2 496 f < 2 690 1 –504 925 f < 960 1 –505 1 900 f < 1 920 1 –506 2 010 f < 2 025 1 –507 2 570 f < 2 620 1 –508 791 f < 821 1 –50
TABLE A6-2.2-e
Additional spurious emissions for 10 MHz channel size; relevant to 2 305 fc 2 395 (BCG 1.B)
No Spurious frequency (f) range (MHz)
Measurement bandwidth (MHz)
Maximum emission level(dBm)
1 2 110 f < 2 170 1 –502 1 805 f < 1 880 1 –503 2 496 f < 2 690 1 –504 925 f < 960 1 –505 1 900 f < 1 920 1 –506 2 010 f < 2 025 1 –507 2 570 f < 2 620 1 –508 791 f < 821 1 –50
2.3 Spurious emissions for TDD equipment operating in the band 2 500-2 690 MHz (BCG 3.A)
IMT-2000 OFDMA TDD WMAN mobile station complies with the limits recommended in Recommendation ITU-R SM.329-10. The limits for the 5 MHz carrier, shown in Tables A6-2.3-a, A6-2.3-b and A6-2.3-c are only applicable for frequency offsets which are greater than 12.5 MHz away from the mobile station centre frequency, while the limits for the 10 MHz carrier shown in Tables A6-2.3-d, A6-2.3-e and A6-2.3-f apply only for frequency offsets greater than 25 MHz. f is the frequency of the spurious domain emissions. fc is the mobile station centre frequency.
Tables A6-2.3-a, A6-2.3-b, A6-2.3-c, A6-2.3-d, A6-2.3-e and A6-2.3-f specify the general and additional spurious emission for TDD mobile stations with 5 and 10 MHz channel bandwidths.
TABLE A6-2.3-a
General mobile station spurious emissions limit for 5 MHz channel size; relevant to 2 502.5 MHz fc 2 687.5 MHz
Band Measurement bandwidth Allowed emission level (dBm)
9 kHz f < 150 kHz 1 kHz –36150 kHz f < 30 MHz 10 kHz –36
30 MHz f < 1 000 MHz 100 kHz –361 GHz f < 13.45 GHz 30 kHz If 12.5 MHz ≤ | fc – f | < 50 MHz –30

Rec. ITU-R M.1581-5 119
300 kHz If 50 MHz ≤ | fc – f | < 60 MHz1 MHz If 60 MHz ≤ | fc – f |
TABLE A6-2.3-b
Additional mobile station spurious emission limit for 5 MHz channel size; the requirements of Table are relevant to 2 547.5 MHz ≤ fc ≤ 2 622.5 MHz
Frequency bandwidth Measurementbandwidth
Minimum requirement(dBm) Note
1 000 MHz f < 2 505 MHz 1 MHz –13
2 505 MHz f < 2 530 MHz 1 MHz –372 530 MHz f < 2 535 MHz 1 MHz 1.7f – 4 338
2 535 MHz f < 2 630 MHz 1 MHz–21 – 1.68*(f – 8) 12.5 MHz < f < 17.5 MHz–37 17.5 MHz < f < 22.5 MHz–18 22.5 MHz < f
2 630 MHz f < 2 630.5 MHz 1 MHz –13 – 8/3.5 × (f – 2 627)
2 630.5 MHz f < 2 640 MHz 1 MHz –21 – 16/9.5× (f – 2 630.5)2 640 MHz f < 2 655 MHz 1 MHz –37
2 655 MHz f 1 MHz –13
NOTE 1 – The allowed emission level shall be applied for the frequency range greater than 2.5 times the channel size from the centre frequency. f is the offset from channel centre frequency.NOTE 2 – This additional requirement provides for the protection of satellite systems in the bands 2 500-2 535 MHz and 2 630-2 690 MHz in Japan, and applies only to terminals operating in the frequency band 2 545-2 625 MHz with powers of 23 dBm or smaller.
TABLE A6-2.3-c
Additional mobile station spurious emissions for 5 MHz channel size; relevant to 2 502.5 MHz ≤ fc ≤ 2 687.5 MHz
Row Spurious frequency (f) range Measurement bandwidth Minimum requirement(dBm)
1 2 620 MHz f < 2 690 MHz 1 MHz –40
NOTE – This additional requirement is for the purpose of compliance to ETSI EN 302-544-2.

120 Rec. ITU-R M.1581-5
TABLE A6-2.3-d
General mobile station spurious emissions limit for 10 MHz channel size; relevant to 2 505 MHz ≤ fc ≤ 2 685 MHz
Spurious frequency (f) range Measurement bandwidth Allowed emission level (dBm)
9 kHz f <150 kHz 1 kHz –36150 kHz f < 30 MHz 10 kHz –36
30 MHz f < 1 000 MHz 100 kHz –36
1 GHz f < 13.45 GHz30 kHz If 25 ≤ | fc – f | < 100300 kHz If 100 ≤ | fc – f | < 1201 MHz If 120 ≤ | fc – f |
–30
TABLE A6-2.3-e
Additional mobile station spurious emission limit for 10 MHz channel size, the requirements of Table are relevant to 2 550 MHz ≤ fc ≤ 2 620 MHz
Spurious frequency (f) range Measurement bandwidth
Minimum requirement(dBm) Note
1 000 MHz f < 2 505 MHz 1 MHz –132 505 MHz f < 2 530 MHz 1 MHz –372 530 MHz f < 2 535 MHz 1 MHz 1.7f – 4 3382 535 MHz f < 2 630 MHz 1 MHz –18 25 MHz < f
2 630 MHz f < 2 630.5 MHz 1 MHz –13 – 8/3.5 × (f – 2 627)2 630.5 MHz f < 2 640 MHz 1 MHz –21 – 16/9.5 × (f – 2 630.5)2 640 MHz f < 2 655 MHz 1 MHz –37
2 655 MHz f 1 MHz –13
NOTE 1 – The allowed emission level shall be applied for the frequency range greater than 2.5 times the channel size from the centre frequency. f is the offset from channel centre frequency.NOTE 2 – This additional requirement provides for the protection of satellite systems in the bands 2 500-2 535 MHz and 2 630-2 690 MHz in Japan, and applies only to terminals operating in the frequency band 2 545-2 625 MHz with powers of 23 dBm or smaller.
TABLE A6-2.3-f
Additional mobile station spurious emissions for 10 MHz channel size; relevant to 2 505 MHz ≤ fc ≤ 2 685 MHz
Row Spurious frequency (f) range
Measurement bandwidth
Minimum requirement(dBm)
1 2 620 MHz f < 2 690 MHz 1 MHz –40
NOTE – This additional requirement is for the purpose of compliance to ETSI EN 302-544-2.

Rec. ITU-R M.1581-5 121
2.4 Spurious emission for TDD equipment operating in the band 3 400-3 600 MHz (BCG 5L.A/5L.B/5L.C)
The limits shown in Tables A6-2.4-a to A6-2.4-c are for frequency offsets which are greater than 2.5 times the channel bandwidth from the mobile station centre frequency. In the Table | f | is fc–f, where f is the frequency of the spurious domain emissions and fc is the mobile station transmit centre frequency. All spurious emission specifications are of conducted type.
Tables A6-2.4-a to A6-2.4-c specify the spurious emission for TDD mobile stations with 5, 7 and 10 MHz channel bandwidths.
TABLE A6-2.4-a
Spurious emissions for 5 MHz channel size; relevant to 3 402.5 MHz ≤ fc ≤ 3 797.5 MHz
Row Spurious frequency (f) range Measurement bandwidth
Minimum specification
(dBm)
1 9 kHz f < 150 kHz 1 kHz –362 150 kHz f < 30 MHz 10 kHz –363 30 MHz f < 1 000 MHz 100 kHz –364 1 GHz f < 19 GHz 30 kHz If 12.5 MHz ≤ | f | < 50 MHz
300 kHz If 50 MHz ≤ | f | < 60 MHz1 MHz If 60 MHz ≤ |f |
–30
TABLE A6-2.4-b
Spurious emissions for 7 MHz channel size; relevant to 3 403.5 MHz ≤ fc ≤ 3 796.5 MHz
Row Spurious frequency (f) range Measurement bandwidth
Minimum specification
(dBm)
1 9 kHz f < 150 kHz 1 kHz –362 150 kHz f < 30 MHz 10 kHz –363 30 MHz f < 1 000 MHz 100 kHz –364 1 GHz f < 19 GHz 30 kHz If 17.5 MHz ≤ | f | < 70 MHz
300 kHz If 70 MHz ≤ | f | < 84 MHz1 MHz If 84 MHz ≤ | f |
–30
TABLE A6-2.4-c
Spurious emissions for 10 MHz channel size; relevant to 3 405 MHz ≤ fc ≤ 3 795 MHz
Row Spurious frequency (f) range Measurement bandwidth
Minimum specification
(dBm)
1 9 kHz f < 150 kHz 1 kHz –362 150 kHz f < 30 MHz 10 kHz –363 30 MHz f < 1 000 MHz 100 kHz –36

122 Rec. ITU-R M.1581-5
4 1 GHz f < 19 GHz 30 kHz If 25 MHz ≤ | f | < 100 MHz300 kHz If 100 MHz ≤ | f | < 120 MHz1 MHz If 120 MHz ≤ | f |
–30
2.5 Spurious emissions for TDD equipment operating in the band 3 600-3 800 MHz (BCG 5H.A/5H.B/5H.C)
The limits shown in Tables A6-2.5-a to A6-2.5-c are for frequency offsets which are greater than 2.5 times the channel bandwidth from the mobile station centre frequency. In the Table | f | is fc–f, where f is the frequency of the spurious domain emissions and fc is the mobile station transmit centre frequency. All spurious emission specifications are of conducted type.
Tables A6-2.5-a to A6-2.5-c specify the spurious emission for TDD mobile stations with 5, 7 and 10 MHz channel bandwidths.
TABLE A6-2.5-a
Spurious emissions for 5 MHz channel size; relevant to 3 402.5 MHz ≤ fc ≤ 3 797.5 MHz
Row Spurious frequency (f) range Measurement bandwidth
Minimum specification
(dBm)1 9 kHz f < 150 kHz 1 kHz –362 150 kHz f < 30 MHz 10 kHz –363 30 MHz f < 1 000 MHz 100 kHz –364 1 GHz f < 19 GHz 30 kHz If 12.5 MHz | f | < 50 MHz
300 kHz If 50 MHz | f | < 60 MHz1 MHz If 60 MHz | f |
–30
TABLE A6-2.5-b
Spurious emissions for 7 MHz channel size; relevant to 3 403.5 MHz ≤ fc ≤ 3 796.5 MHz
Row Spurious frequency (f) range Measurement bandwidth
Minimum specification
(dBm)1 9 kHz f < 150 kHz 1 kHz –362 150 kHz f < 30 MHz 10 kHz –363 30 MHz f < 1 000 MHz 100 kHz –364 1 GHz f < 19 GHz 30 kHz If 17.5 MHz | f | < 70 MHz
300 kHz If 70 MHz | f | < 84 MHz1 MHz If 84 MHz | f |
–30

Rec. ITU-R M.1581-5 123
TABLE A6-2.5-c
Spurious emissions for 10 MHz channel size; relevant to 3 405 MHz ≤ fc ≤ 3 795 MHz
Row Spurious frequency (f) range Measurement bandwidth
Minimum specification
(dBm)
1 9 kHz f < 150 kHz 1 kHz –362 150 kHz f < 30 MHz 10 kHz –363 30 MHz f < 1 000 MHz 100 kHz –364 1 GHz f < 19 GHz 30 kHz If 25 MHz | f | < 100 MHz
300 kHz If 100 MHz | f | < 120 MHz1 MHz If 120 MHz | f |
–30
2.6 Spurious emissions for FDD equipment operating in the band 1 710-1 770/2 110-2 170 MHz (BCG 6.A)
The limits shown in Tables A2-A-1.1-c to A2-A-1.2-b are for frequency offsets which are greater than 2.5 times the channel bandwidth from the mobile station centre frequency. In the Table | f | is fc–f, where f is the frequency of the spurious domain emissions and fc is the mobile station transmit centre frequency. All spurious emission specifications are of conducted type.
Tables A6-2.6-a and A6-2.6-b specify the spurious emission for FDD mobile stations with 5 and 10 MHz channel bandwidths.
TABLE A6-2.6-a
Spurious emissions for 5 MHz channel size; relevant to 1 712.5 MHz ≤ fc ≤ 1 752.5 MHz
Row Spurious frequency (f) range Measurement bandwidth
Minimum specification
(dBm)
1 30 MHz f < 8.775 GHz, 12.5 MHz | f |
1 MHz –13
TABLE A6-2.6-b
Spurious emissions for 5 MHz channel size; relevant to 1 715 MHz ≤ fc ≤ 1 750 MHz
Row Spurious frequency (f) range Measurement bandwidth
Minimum specification
(dBm)
1 30 MHz f < 8.775 GHz, 25 MHz | f | 1 MHz –13
2.7 Spurious emissions for FDD equipment operating in the band 1 920-1 980/2 110-2 170 MHz (BCG 6.B)
The limits shown in Tables A6-2.7-a to A6-2.7-d are for frequency offsets which are greater than 2.5 times the channel bandwidth from the mobile station centre frequency. In the Tables | f | is fc–f, where f is the frequency of the spurious domain emissions and fc is the mobile station transmit centre frequency. All spurious emission specifications are of conducted type.

124 Rec. ITU-R M.1581-5
Tables A6-2.7-a to A6-2.7-b specify the spurious emission for FDD mobile stations with 5 and 10 MHz channel bandwidths, while Table A6-2.7-c and Table A6-2.7-d specified the additional spurious emission limits for 5 and 10 MHz channel bandwidths.
TABLE A6-2.7-a
Spurious emissions for 5 MHz channel size; relevant to 1 922.5 MHz ≤ fc ≤ 1 977.5 MHz
Row Spurious frequency (f) range Measurement bandwidth
Minimum specification
(dBm)1 9 kHz f < 150 kHz 1 kHz –362 150 kHz f < 30 MHz 10 kHz –363 30 MHz f < 1 000 MHz 100 kHz –364 1 GHz f < 9.9 GHz, 12.5 | f | 1 MHz –30
TABLE A6-2.7-b
Spurious emissions for 10 MHz channel size; relevant to 1 925 MHz ≤ fc ≤ 1 975 MHz
Row Spurious frequency (f) range Measurement bandwidth Minimum specification
(dBm)
1 9 kHz f < 150 kHz 1 kHz –362 150 kHz f < 30 MHz 10 kHz –363 30 MHz f < 1 000 MHz 100 kHz –364 1 GHz f < 19 GHz, 25 |
f |1 MHz –30
TABLE A6-2.7-c
Additional spurious emissions for 5 MHz channel size; relevant to 1 922.5 MHz ≤ fc ≤ 1 977.5 MHz
Row Spurious frequency (f) range Measurement bandwidth Minimum requirement
(dBm)
1 2 110-2 170 MHz 1 MHz –502 1 805-1 880 MHz 1 MHz –503 2 620-2 690 MHz 1 MHz –504 925-960 MHz 1 MHz –505 1 844.9-1 879.9 MHz 1 MHz –506 1 475.9-1 500.9 MHz 1 MHz –507 1 900-1 920 MHz 1 MHz –508 2 010-2 025 MHz 1 MHz –509 2 570-2 620 MHz 1 MHz –5010 1 880-1 920 MHz 1 MHz –5011 2 300-2 400 MHz 1 MHz –5012 860-895 MHz 1 MHz –50

Rec. ITU-R M.1581-5 125
13 1 884.5-1 919.6 MHz 300 kHz –41
TABLE A6-2.7-d
Additional spurious emissions for 10 MHz channel size; relevant to1 925 MHz ≤ fc ≤ 1 975 MHz
Row Spurious frequency (f) range Measurement bandwidth Minimum requirement
(dBm)
1 2 110-2 170 MHz 1 MHz –502 1 805-1 880 MHz 1 MHz –503 2 620-2 690 MHz 1 MHz –504 925-960 MHz 1 MHz –505 1 844.9-1 879.9 MHz 1 MHz –506 1 475.9-1 500.9 MHz 1 MHz –507 1 900-1 920 MHz 1 MHz –508 2 010-2 025 MHz 1 MHz –509 2 570-2 620 MHz 1 MHz –5010 1 880-1 920 MHz 1 MHz –5011 2 300-2 400 MHz 1 MHz –5012 860-895 MHz 1 MHz –5013 1 884.5-1 919.6 MHz 300 kHz –41
2.8 Spurious emissions for FDD equipment operating in the band 2 496-2 690 MHz (BCG 3.B)
The limits shown in Tables A6-2.8-a to A6-2.8-d are for frequency offsets which are greater than 2.5 times the channel bandwidth from the mobile station centre frequency. In the Table | f | is fc–f, where f is the frequency of the spurious domain emissions and fc is the mobile station transmit centre frequency. All spurious emission specifications are of conducted type.
Tables A6-2.8-a to A6-2.8-d specify the spurious emission for FDD mobile stations with 5 and 10 MHz channel bandwidths.
TABLE A6-2.8-a
Spurious emissions for 5 MHz channel size; relevant to 2 498.5 MHz ≤ fc ≤ 2 687.5 MHz
Row Spurious frequency (f) range Measurement bandwidth
Minimum specification
(dBm)
1 9 kHz f < 150 kHz 1 kHz –362 150 kHz f < 30 MHz 10 kHz –363 30 MHz f < 1 000 MHz 100 kHz –364 1 GHz f < 13.45 GHz 30 kHz If 12.5 | f | < 50
300 kHz If 50 | f | < 601 MHz If 60 | f |
–30
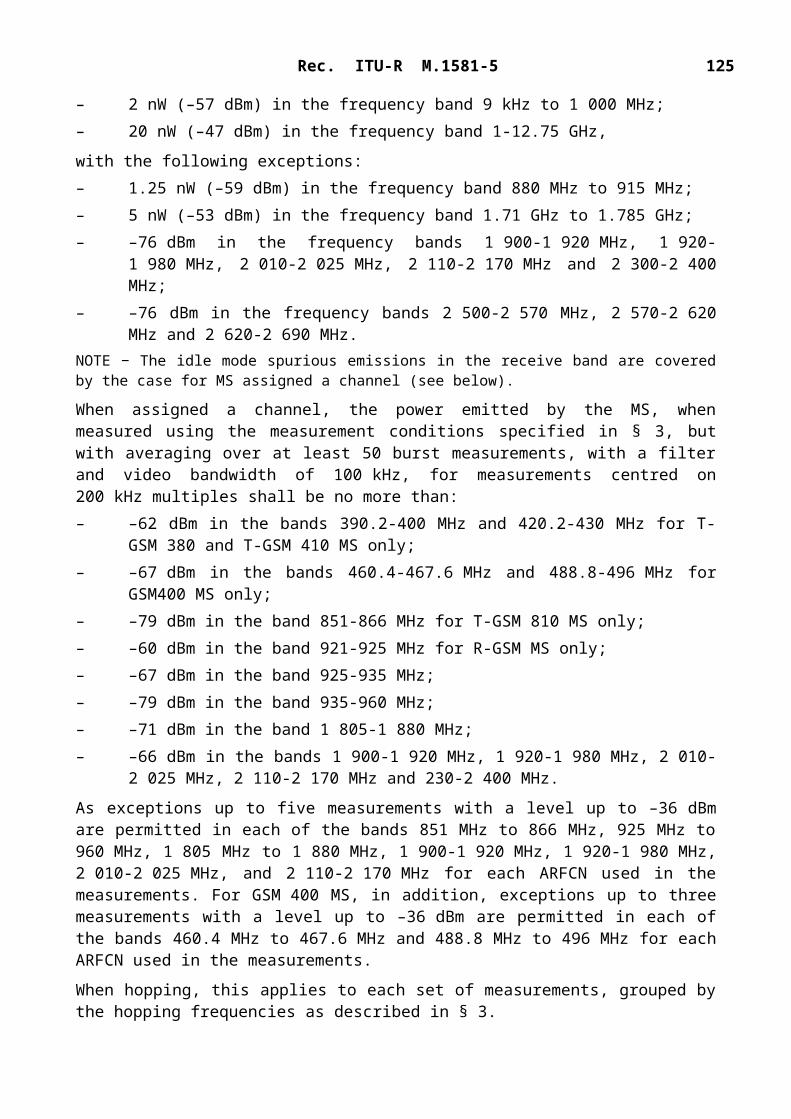
126 Rec. ITU-R M.1581-5
TABLE A6-2.8-b
Spurious emissions for 10 MHz channel size; relevant to 2 501 MHz ≤ fc ≤ 2 685 MHz
Row Spurious frequency (f) range Measurement bandwidth
Minimum specification
(dBm)
1 9 kHz f < 150 kHz 1 kHz –362 150 kHz f < 30 MHz 10 kHz –363 30 MHz f < 1 000 MHz 100 kHz –364 1 GHz f < 13.45 GHz 30 kHz If 25 | f | < 100
300 kHz If 100 | f | < 1201 MHz If 120 | f |
–30
TABLE A6-2.8-c
Additional spurious emissions for 5 MHz channel size; relevant to 2 498.5 MHz ≤ fc ≤ 2 687.5 MHz
Row Spurious frequency (f) range Measurement bandwidth Minimum requirement
(dBm)
1 2 110-2 170 MHz 1 MHz –502 1 805-1 880 MHz 1 MHz –503 2 620-2 690 MHz 1 MHz –504 925-960 MHz 1 MHz –505 1 900-1 920 MHz 1 MHz –506 2 010-2 025 MHz 1 MHz –507 2 570-2 620 MHz 1 MHz –50
TABLE A6-2.8-d
Additional spurious emissions for 10 MHz channel size; relevant to 2 501 MHz ≤ fc ≤ 2 685 MHz
Row Spurious frequency (f) range Measurement bandwidth Minimum requirement
(dBm)
1 2 110-2 170 MHz 1 MHz –502 1 805-1 880 MHz 1 MHz –503 2 620-2 690 MHz 1 MHz –504 925-960 MHz 1 MHz –505 1 900-1 920 MHz 1 MHz –506 2 010-2 025 MHz 1 MHz –507 2 570-2 620 MHz 1 MHz –50
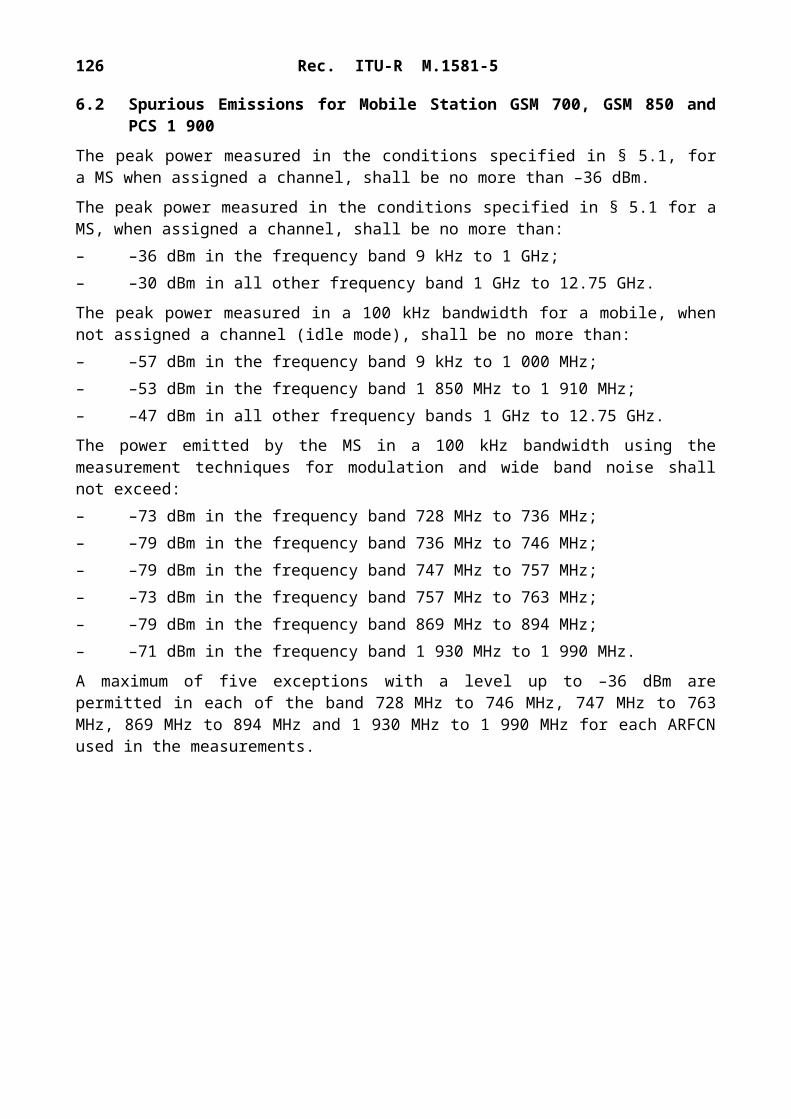
Rec. ITU-R M.1581-5 127
2.9 Spurious emissions for FDD equipment operating in the band 1 710-1 785/1 805-1 880 MHz (BCG 6.C)
The limits shown in Tables A6-2.9-a and A6-2.9-b are for frequency offsets which are greater than 2.5 times the channel bandwidth from the mobile station centre frequency. In the Table | f | is fc–f, where f is the frequency of the spurious domain emissions and fc is the mobile station transmit centre frequency. All spurious emission specifications are of conducted type.
TABLE A6-2.9-a
Spurious emissions
Transmitter centre frequency (fc)
(MHz)
Spurious frequency (f) range Integration bandwidth
Maximum emission
level(dBm)
1 710-1 785 9 kHz f < 150 kHz 1 kHz –361 710-1 785 150 kHz f < 30 MHz 10 kHz –361 710-1 785 30 MHz f < 1 000 MHz 100 kHz –361 710-1 785 1 GHz f < 12.75 GHz 30 kHz If 12.5 MHz f < 50 MHz
300 kHz If 50 MHz f < 60 MHz1 MHz If 60 MHz f
–30
TABLE A6-2.9-b
Additional spurious emissions
NoTransmitter centre
frequency (fc)(MHz)
Spurious frequency (f) range(MHz)
Measurement bandwidth
(MHz)
Maximum emission level
(dBm)
1 710-1 785 925-960 1 –501 475.9-1 500.9 1 –50
1 805-1 880 1 –501 844.9-1 879.9 1 –50
1 900-1 920 1 –502 010-2 025 1 –502 110-2 170 1 –502 570-2 620 1 –502 620-2 690 1 –50
791-821 1 –50

128 Rec. ITU-R M.1581-5
2.10 Spurious emissions for TDD equipment operating in the band 698-862 MHz (BCG 7.A)
The limits shown in Tables A6-2.10-a and A6-2.10-b are for frequency offsets which are greater than 2.5 times the channel bandwidth from the mobile station centre frequency. In the Table | f | is fc–f, where f is the frequency of the spurious domain emissions and fc is the mobile station transmit centre frequency. All spurious emission specifications are of conducted type.
TABLE A6-2.10-a
Spurious emissions for 5 MHz carrier
Transmit frequency range(MHz)
Measurement frequency range (MHz)
Measurement bandwidth
(kHz)
Maximum emission level
(dBm)
698-798 30 f < 4 310(12.5 MHz ∆f)
100 –13
746-758, 776-788 763 ∆f 775, 793 ∆f 805 6.25 –35758-763, 763-768, 788-793,
793-798769 ∆f 775, 799 ∆f 805 6.25 –35
797-862 797 f 862(12.5 MHz ∆f)
5 000 –37
797-862 790 f 791 1 000 –44797-862 470 f 790 8 000 –65
TABLE A6-2.10-b
Spurious emissions for 7 MHz carrier
Transmit frequency range(MHz)
Measurement frequency range (MHz)
Measurement bandwidth
(kHz)
Maximum emission level
(dBm)
698-798 30 f < 4 310(17.5 MHz ∆f)
100 –13
746-758, 776-788 763 ∆f 775, 793 ∆f 805
6.25 –35
758-768, 788-798 769 ∆f 775, 799 ∆f 805
6.25 –35
797-862 797 f 862(17.5 MHz ∆f)
5 000 –37
797-862 790 f 791 1 000 –44797-862 470 f 790 8 000 –65

Rec. ITU-R M.1581-5 129
TABLE A6-2.10-c
Spurious emissions for 10 MHz carrier
Transmit frequency range(MHz)
Measurement frequency range (MHz)
Measurement bandwidth
(kHz)
Maximum emission level
(dBm)
698-798 30 f < 4 310(25 MHz ∆f)
100 –13
746-758, 776-788 763 ∆f 775, 793 ∆f 805
6.25 –35
758-768, 788-798 769 ∆f 775, 799 ∆f 805
6.25 –35
797-862 797 f 862(25 MHz ∆f)
5 000 –37
797-862 790 f 791 1 000 –44797-862 470 f 790 8 000 –65
2.11 Spurious emissions for FDD equipment operating in the band 776-787/746-757 MHz (BCG 7.B)
The limits shown in Tables A6-2.11-a and A6-2.11-b are for frequency offsets which are greater than 2.5 times the channel bandwidth from the mobile station centre frequency. In the Table | f | is fc–f, where f is the frequency of the spurious domain emissions and fc is the mobile station transmit centre frequency. All spurious emission specifications are of conducted type.
TABLE A6-2.11-a
Spurious emissions for 5 MHz carrier
Transmit frequency range(MHz)
Measurement frequency range (MHz)
Measurement bandwidth
(kHz)
Maximum emission level
(dBm)
776-787 30 f < 4 310(12.5 MHz ∆f)
100 –13
776-787 763 ∆f 775, 793 ∆f 805 6.25 –35
TABLE A6-2.11-b
Spurious emissions for 10 MHz carrier
Transmit frequency range(MHz)
Measurement frequency range (MHz)
Measurement bandwidth
(kHz)
Maximum emission level
(dBm)
776-787 30 f < 4 310(25 MHz ∆f)
100 –13
776-787 763 ∆f 775, 793 ∆f 805 6.25 –35
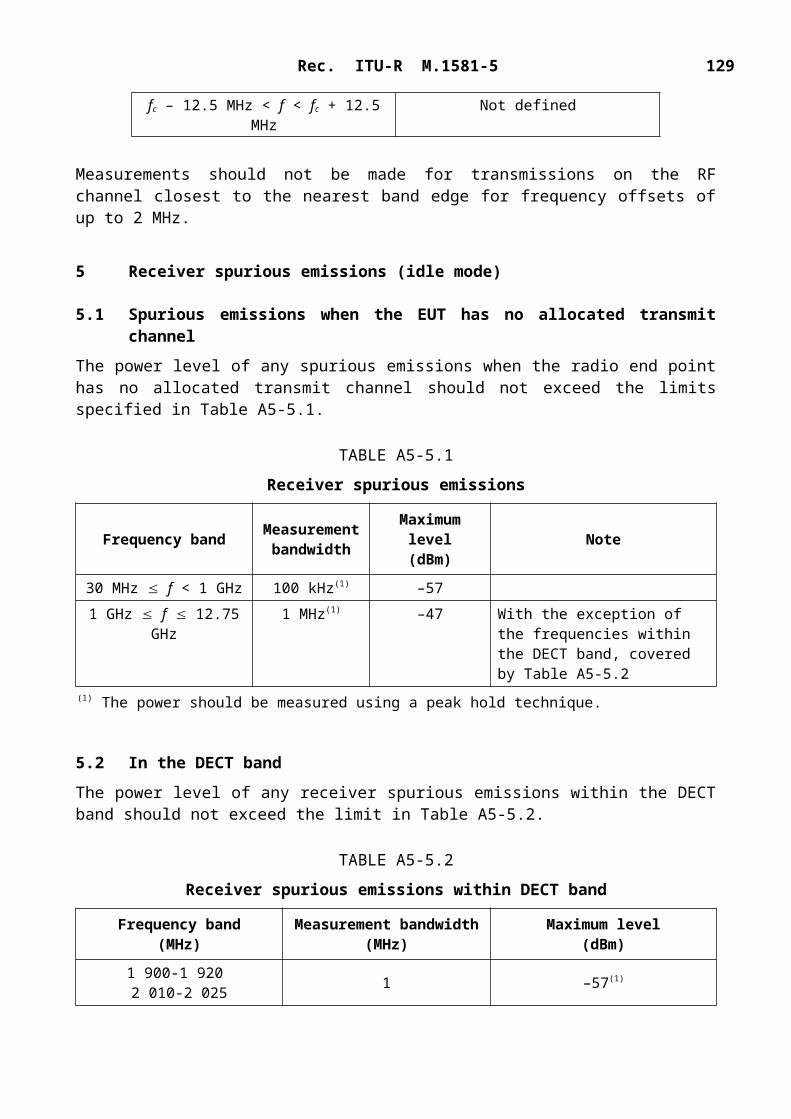
130 Rec. ITU-R M.1581-5
2.12 Spurious emissions for FDD equipment operating in the band 788-793/758-763 and 793-798/763-768 MHz (BCG 7.C)
The limits shown in Table A6-2.12 is for frequency offsets which are greater than 2.5 times the channel bandwidth from the mobile station centre frequency. In the Table | f | is fc–f, where f is the frequency of the spurious domain emissions and fc is the mobile station transmit centre frequency. All spurious emission specifications are of conducted type.
TABLE A6-2.12
Spurious emissions for 5 MHz carrier
Transmit frequency range (MHz)
Measurement frequency range(MHz)
Measurement bandwidth
(kHz)
Maximum emission level
(dBm)
788-793, 793-798 30 f < 4 310(12.5 MHz ∆f)
100 –13
788-793, 793-798 769 ∆f 775, 799 ∆f 805 6.25 –35
2.13 Spurious emission for FDD equipment operating in the bands 788-798/758-768 MHz (BCG 7.D)
The limits shown in Table A6-2.13 are for frequency offsets which are greater than 2.5 times the channel bandwidth from the mobile station centre frequency. In the Table | f | is fc–f, where f is the frequency of the spurious domain emissions and fc is the mobile station transmit centre frequency. All spurious emission specifications are of conducted type.
In this section, measurement uncertainty (as defined in Recommendation ITU-R M.1545) values corresponding to spurious emission limits have not been included.
TABLE A6-2.13
Spurious emissions for 10 MHz carrier
Transmit frequency range (MHz)
Measurement frequency range (MHz)
Measurement bandwidth
(kHz)
Maximum emission level
(dBm)
788-798 30 f < 4 310(25 MHz ∆f)
100 –13
788-798 769 ∆f 775, 799 ∆f 805 6.25 –35
2.14 Spurious emission for FDD and TDD equipment operating in the bands 698-862 MHz (BCG 7.E)
The limits shown in Tables A6-2.14-a and A6-2.14-b are for frequency offsets which are greater than 2.5 times the channel bandwidth from the mobile station centre frequency. In the Table | f | is fc–f, where f is the frequency of the spurious domain emissions and fc is the mobile station transmit centre frequency. All spurious emission specifications are of conducted type.
In this section, measurement uncertainty (as defined in Recommendation ITU-R M.1545) values corresponding to spurious emission limits have not been included.

Rec. ITU-R M.1581-5 131
TABLE A6-2.14-a
Spurious emissions for 5 MHz carrier
Transmit frequency range(MHz)
Measurement frequency range (MHz)
Measurement bandwidth
(kHz)
Maximum emission level
(dBm)
698-798 30 f < 4 310(12.5 MHz ∆f)
100 –13
746-758, 776-788 763 ∆f 775, 793 ∆f 805 6.25 –35758-763, 763-768, 788-793,
793-798769 ∆f 775, 799 ∆f 805 6.25 –35
791-862 797 f 862(12.5 MHz ∆f)
5 000 –37
797-862 790 f 791 1 000 –44832-862 821 f 862
(12.5 MHz ∆f)1 000 –25
832-862 470 f 790 8 000 –65
TABLE A6-2.14-b
Spurious emissions for 7 MHz carrier
Transmit frequency range(MHz)
Measurement frequency range (MHz)
Measurement bandwidth
(kHz)
Maximum emission level
(dBm)
698-798 30 f < 4 310(17.5 MHz ∆f)
100 –13
746-758, 776-788 763 ∆f 775, 793 ∆f 805 6.25 –35758-763, 763-768, 788-793,
793-798769 ∆f 775, 799 ∆f 805 6.25 –35
797-862 797 f 862(17.5 MHz ∆f)
5 000 –37
797-862 790 f 791 1 000 –44832-862 821 f 862
(17.5 MHz ∆f)1 000 –25
832-862 470 f 790 8 000 –65
TABLE A6-2.14-c
Spurious emissions for 10 MHz carrier
Transmit frequency range (MHz)
Measurement frequency range (MHz)
Measurement bandwidth
(kHz)
Maximum emission level
(dBm)
698-798 30 f < 4 310(25 MHz ∆f)
100 –13
746-758, 776-788 763 ∆f 775, 793 ∆f 805 6.25 –35

132 Rec. ITU-R M.1581-5
758-763, 763-768, 788-793, 793-798
769 ∆f 775, 799 ∆f 805 6.25 –35
797-862 797 f 862(25 MHz ∆f)
5 000 –37
797-862 790 f 791 1 000 –44832-862 821 f 862
(25 MHz ∆f)1 000 –25
832-862 470 f 790 8 000 –65
2.15 Spurious emission for FDD equipment operating in the bands 880-915/925-960 MHz (BCG 7.G)
The limits shown in Tables A6-2.15-a and A6-2.15-b are for frequency offsets which are greater than 2.5 times the channel bandwidth from the mobile station centre frequency. In the Table | f | is fc–f, where f is the frequency of the spurious domain emissions and fc is the mobile station transmit centre frequency. All spurious emission specifications are of conducted type.
TABLE A6-2.15-a
Spurious emissions
Transmitter centre frequency (fc)
(MHz)
Spurious frequency (f) range Integration bandwidth
Maximum emission
level(dBm)
880-915 9 kHz f < 150 kHz 1 kHz –36880-915 150 kHz f < 30 MHz 10 kHz –36880-915 30 MHz f < 1 000 MHz 100 kHz –36(1)
880-915 1 GHz f < 12.75 GHz 30 kHz If 12.5 MHz ∆f < 50 MHz300 kHz If 50 MHz ∆f < 60 MHz1 MHz If 60 MHz ∆f
–30
(1) 3GPP TS 36.101, 3rd Generation Partnership Project; Technical Specification Group Radio Access Network; Evolved Universal Terrestrial Radio Access (E-UTRA); User Equipment (UE) radio transmission and reception (FDD).
TABLE A6.2.15-b
Additional spurious emission (BCG 7.G)
NoTransmitter centre
frequency (fc) (MHz)
Spurious frequency (f) range(MHz)
Measurement bandwidth
(MHz)
Maximum emission level
(dBm)
1 880-915 925-960 1 –502 1 805-1 880 1 –503 1 880-1 920 1 –504 1 900-1 920 1 –505 2 010-2 025 1 –50

Rec. ITU-R M.1581-5 133
6 2 110-2 170 1 –507 2 300-2 400 1 –508 2 570-2 620 1 –509 2 620-2 690 1 –50
10 791-821 1 –5011 782-890 8 –65
NOTE – With respect to the spurious frequencies of Lines 2 (entire range) and 9 (2 640-2 690 sub range) (entire range) of Table A6.2.15-b, exceptions in measurements are allowed for harmonic spurious emissions where the harmonics are 2nd or 3rd harmonics of in channel transmissions. In these exception cases, the maximum emission level (–36 dBm/100 kHz) is applicable.
2.16 Spurious emission for TDD equipment operating in the bands 1 785-1 805, 1 880-1 920, 1 910-1 930, 2 010-2 025, and 1 900-1 920 MHz (BCG 8.A)
The limits shown in the Table A6-2.16-a to Table A6-2.16-d are for frequency offsets which are greater than 2.5 times the channel bandwidth from the MS centre frequency. In the Table, f is the frequency of the spurious domain emissions.
In all of the following Tables, measurement uncertainty (as defined in Recommendation ITU-R M.1545) values corresponding to spurious emission limits have not been included here.
TABLE A6-2.16-a
Spurious emission for 5 MHz carrier
Transmitter centre frequency (fc)
(MHz)
Spurious frequency (f) range Integration bandwidth
Maximum emission
level(dBm)
1 787.5-1 802.51 882.5-1 917.51 912.5-1 927.52 012.5-2 022.51 902.5-1 917.5
9 kHz f < 150 kHz 1 kHz –36
1 787.5-1 802.51 882.5-1 917.51 912.5-1 927.52 012.5-2 022.51 902.5-1 917.5
150 kHz f < 30 MHz 10 kHz –36
1 787.5-1 802.51 882.5-1 917.51 912.5-1 927.52 012.5-2 022.51 902.5-1 917.5
30 MHz f < 1 000 MHz 100 kHz –36
1 787.5-1 802.51 882.5-1 917.51 912.5-1 927.52 012.5-2 022.51 902.5-1 917.5
1 GHz f < 12.75 GHz 30 kHz If 12.5 MHz ∆f < 50 MHz300 kHz If 50 MHz ∆f < 60 MHz1 MHz If 60 MHz ∆f
–30

134 Rec. ITU-R M.1581-5
TABLE A6-2.16-b
Spurious emission for 10 MHz carrier
Transmitter centre frequency (fc)
(MHz)
Spurious frequency (f) range Integration bandwidth
Maximum emission
level(dBm)
1 790-1 8001 885-1 9151 915-1 9252 015-2 0201 905-1 915
9 kHz f < 150 kHz 1 kHz –36
1 790-1 8001 885-1 9151 915-1 9252 015-2 0201 905-1 915
150 kHz f < 30 MHz 10 kHz –36
1 790-1 8001 885-1 9151 915-1 9252 015-2 0201 905-1 915
30 MHz f < 1 000 MHz 100 kHz –36
1 790-1 8001 885-1 9151 915-1 9252 015-2 0201 905-1 915
1 GHz f < 12.75 GHz 30 kHz If 12.5 MHz ∆f < 50 MHz300 kHz If 50 MHz ∆f < 60 MHz1 MHz If 60 MHz ∆f
–30

Rec. ITU-R M.1581-5 135
TABLE A6-2.16-c
Additional spurious emission for 5 MHz carrier
Transmitter centre frequency (fc) (MHz)
Spurious frequency (f) range (MHz)
Measurement bandwidth (kHz)
Maximum emission level (dBm)
1 882.5-1 917.5 2 010-2 0252 300-2 400
1 000 –50
1 902.5-1 917.5 925-9601 880-1 9201 930-1 9902 010-2 0252 110-2 1702 300-2 4002 570-2 620
1 000 –50
2 012.5-2 022.5 2 110-2 1701 805-1 8802 620-2 690
925-9601 844.9-1 879.91 475.9-1 500.9
1 900-1 9202 570-2 6201 880-1 9202 300-2 400
1 000 –50
860-895 1 000 –501 884.5-1 919.6 300 –41

136 Rec. ITU-R M.1581-5
TABLE A6-2.16-d
Additional spurious emission for 10 MHz carrier
Transmitter centrefrequency (fc) (MHz)
Spurious frequency (f) range (MHz)
Measurement bandwidth (kHz)
Maximum emission level (dBm)
1 885-1 915 2 010-2 0252 300-2 400
1 000 –50
1 905-1 915 925-9601 880-1 9201 930-1 9902 010-2 0252 110-2 1702 300-2 4002 570-2 620
1 000 –50
2 015-2 020 2 110-2 1701 805-1 8802 620-2 690
925-9601 844.9-1 879.91 475.9-1 500.9
1 900-1 9202 570-2 6201 880-1 9202 300-2 400
1 000 –50
860-895 1 000 –501 884.5-1 919.6 300 –41
3 Receiver spurious emissions (conducted)
3.1 Spurious emissions for TDD equipment operating in the band 2 500-2 690 MHz (BCG 3.A)
Table A6-3.1 specifies the spurious emissions for TDD Mobile Stations with 10 and 5 MHz channel bandwidths. The power of any narrow-band spurious emission should not exceed the maximum level specified in Table A6-3.1.
TABLE A6-3.1
General receiver spurious emission requirements
Band Measurement bandwidth Allowed emission level(dBm)
30 MHz f < 1 GHz 100 kHz –571 GHz f 13.45
GHz30 kHz If 2.5 BW ≤ | fc – f | < 10 × BW300 kHz If 10 BW ≤ | fc – f | < 12 × BW1 MHz If 12 BW ≤ | fc – f |
–47

Rec. ITU-R M.1581-5 137
4 Adjacent channel leakage ratio (ACLR)
Within this Annex, and in a similar manner to other annexes, the ACLR is defined as the ratio of the on-channel transmitted power to the power transmitted in adjacent channels as measured at the output of the receiver filter. In order to measure ACLR, it is necessary to consider a measurement filter for the transmitted signal as well as a receiver measurement bandwidth for the adjacent channel (victim) system.
4.1 ACLR values for TDD equipment operating in the band 2 300-2 400 MHz (BCG 1.B)
For 5 and 10 MHz BW Band Class Group 1.B, the ACLR shall be equal to or greater than the limits specified in the Table below.
TABLE A6-4.1-a
ACLR specification for 5 MHz channel BW (BCG 1.B)
No Adjacent channel centre frequencyMinimum required ACLR relative to
assigned channel frequency (dB)
2 MS channel centre frequency ± 5 MHz 303 MS channel centre frequency ± 10 MHz 44
TABLE A6-4.1-b
ACLR specifications for 10 MHz channel BW (BCG 1.B)
No Adjacent channel centre frequencyMinimum required ACLR relative to
assigned channel frequency (dB)
2 MS channel centre frequency ± 10 MHz 303 MS channel centre frequency ± 20 MHz 44
In Tables A6-4.1-a and A6-4.1-b, the measurement filter bandwidth on the adjacent channel centre frequency is 4.75 MHz for a 5 MHz channelized system and 9.5 MHz for a 10 MHz channelized system.
4.2 ACLR of TDD equipment operating in the frequency range 2 500-2 690 MHz (BCG 3.A)
In this section, data is provided that is relevant to the case where the adjacent system is OFDMA TDD WMAN (intra-system) or the case where the adjacent system is UTRA (inter-system).
ACLR is therefore specified considering the following receiver bandwidths:
When the adjacent system is OFDMA TDD WMAN:– 4.75 MHz for a 5 MHz channelized system, and– 9.5 MHz for a 10 MHz channelized system.
When the adjacent system is UTRA:– 3.84 MHz for a 5 MHz channelized system, and– 7.68 MHz for a 10 MHz channelized system.

138 Rec. ITU-R M.1581-5
The measurement bandwidth for the measurement of on-channel power of the OFDMA TDD WMAN carrier is:– 4.75 MHz for a 5 MHz channelized system, and– 9.5 MHz for a 10 MHz channelized system.
The passband of the receiver filter is centred on the first or second adjacent channel centre frequency. In the case where the adjacent system is OFDMA TDD WAN, both the transmitted power and the received power are measured with a rectangular filter. For adjacent UTRA systems the transmitted power is measured using a rectangular filter and the received power using a RRC filter with a roll-off factor of 0.22.
The ACLR values for TDD mobile stations relevant to the two cases are provided in the Tables A6-4.2-a and A6-4.2-b for 5 and 10 MHz channel bandwidths respectively.
TABLE A6-4.2-a
ACLR for 5 MHz channel bandwidth
Minimum required ACLR relative to assigned channel frequency
(dB)
Adjacent channel centre frequency OFDMA TDD WMAN case UTRA(1) caseMS channel centre frequency ± 5 MHz 30 33MS channel centre frequency ± 10 MHz 44 43
(1) These are similar to the minimum requirements for UTRA systems (see Annexes 1 and 3 to this Recommendation) and in practice may be expected to be larger.
TABLE A6-4.2-b
ACLR for 10 MHz channel bandwidth
Minimum required ACLR relative to assigned channel frequency
(dB)
Adjacent channel centre frequency OFDMA TDD WMAN case UTRA(1) caseMS channel centre frequency ± 10 MHz 30 33MS channel centre frequency ± 20 MHz 44 43
(1) These are similar to the minimum requirements for UTRA systems (see Annexes 1 and 3 to this Recommendation) and in practice may be expected to be larger.
Additional information may be provided in future revisions of this Recommendation.NOTE – Further study is necessary for other systems wherever applicable.
4.3 ACLR of TDD equipment operating in the frequency range 3 400-3 600 MHz (BCG 5L.A/5L.B/5L.C)
In this section, data is provided that is relevant to the case where the adjacent system is OFDMA TDD WMAN (intra-system).
ACLR is therefore specified considering the following receiver bandwidth.

Rec. ITU-R M.1581-5 139
When the adjacent system is OFDMA TDD WMAN:– 4.75 MHz for a 5 MHz channelized system,– 6.7 MHz for a 7 MHz channelized system, and– 9.5 MHz for a 10 MHz channelized system.
The measurement bandwidth for the measurement of on-channel power of the OFDMA TDD WMAN carrier is:– 4.75 MHz for a 5 MHz channelized system,– 6.7 MHz for a 7 MHz channelized system, and– 9.5 MHz for a 10 MHz channelized system.
The passband of the receiver filter is centred on the first or second adjacent channel centre frequency. In the case where the adjacent system is OFDMA TDD WAN, both the transmitted power and the received power are measured with a rectangular filter.
Tables A6-4.3-a to A6-4.3-c specify the ACLR for TDD mobile stations with 5 and 10 MHz channel bandwidths. The values listed in the Tables are applicable when the adjacent channel mean power is greater than –55 dBm.
TABLE A6-4.3-a
ACLR for 5 MHz channel bandwidths
Adjacent channel centre frequencyACLR limit relative to assigned
channel frequency (dB)
Mobile station channel centre frequency ± 5 MHz 33Mobile station channel centre frequency ± 10 MHz 43
TABLE A6-4.3-b
ACLR for 7 MHz channel bandwidths
Adjacent channel centre frequencyACLR limit relative to assigned
channel frequency (dB)
Mobile station channel centre frequency ± 7 MHz 33Mobile station channel centre frequency ± 14 MHz 43
TABLE A6-4.3-c
ACLR for 10 MHz channel bandwidths
Adjacent channel centre frequencyACLR limit relative to assigned
channel frequency (dB)
Mobile station channel centre frequency ± 10 MHz 33Mobile station channel centre frequency ± 20 MHz 43

140 Rec. ITU-R M.1581-5
4.4 ACLR values for FDD equipment operating in the band 1 710-1 785/1 805-1 880 MHz (BCG 6.C)
For 5 and 10 MHz BW Band Class Group 6.C, the ACLR shall be equal to or greater than the limits specified in Tables A6-4.4-a and A6-4.4-b below. ACLR is specified for two configurations.
In Configuration I the receiver channel bandwidth on the adjacent channel is:– 4.75 MHz for a 5 MHz channelized system,– 9.5 MHz for a 10 MHz channelized system.
In Configuration II the receiver channel bandwidth on the adjacent channel is:– 3.84 MHz for a 5 MHz channelized system,– 7.68 MHz for a 10 MHz channelized system.
The measurement bandwidth for the measurement of on-channel power of the Mobile WiMAX carrier is:– 4.75 MHz for a 5 MHz channelized system, and– 9.5 MHz for a 10 MHz channelized system.
In Configuration I both the transmitted power and the received power are measured with a rectangular filter. For Configuration II the transmitted power is measured using a rectangular filter and the received power using a RRC filter with a roll-off factor of 0.22.
In Tables A6-4.4-a and A6-4.4-b, the ACLR specifications are shown. Measurement uncertainty (as defined in Recommendation ITU-R M.1545) values corresponding to the ACLR limits have not been included.
TABLE A6-4.4-a
ACLR specification for 5 MHz channel BW (BCG 6.C)
No DescriptionMinimum required ACLR relative to
assigned channel frequency (dB)
1 Adjacent channel centre frequency Configuration I Configuration II2 MS channel centre frequency ± 5 MHz 30 333 MS channel centre frequency ± 10 MHz 44 43
TABLE A6-4.4-b
ACLR specifications for 10 MHz Channel BW (BCG 6.C)
No DescriptionMinimum required ACLR relative to
assigned channel frequency (dB)
1 Adjacent channel centre frequency Configuration I Configuration II2 MS channel centre frequency ± 10 MHz 30 333 MS channel centre frequency ± 20 MHz 44 43

Rec. ITU-R M.1581-5 141
4.5 ACLR values for FDD equipment operating in the bands 880-915/925-960 MHz (BCG 7.G)
For 5 and 10 MHz BW Band Class Group 7.G, the ACLR shall be equal to or greater than the limits specified in Tables A6-4.5-a and A6-4.5-b below. ACLR is specified for two configurations.
In Configuration I the receiver channel bandwidth on the adjacent channel is:– 4.75 MHz for a 5 MHz channelized system,– 9.5 MHz for a 10 MHz channelized system.
In Configuration II the receiver channel bandwidth on the adjacent channel is:– 3.84 MHz for a 5 MHz channelized system,– 7.68 MHz for a 10 MHz channelized system.
The measurement bandwidth for the measurement of on-channel power of the Mobile WiMAX carrier is:– 4.75 MHz for a 5 MHz channelized system, and– 9.5 MHz for a 10 MHz channelized system.
In Configuration I both the transmitted power and the received power are measured with a rectangular filter. For Configuration II the transmitted power is measured using a rectangular filter and the received power using a RRC filter with a roll-off factor of 0.22.
In Tables A6-4.5-a and A6-4.5-b, the ACLR specifications are shown. Measurement uncertainty (as defined in Recommendation ITU-R M.1545) values corresponding to the ACLR limits have not been included.
TABLE A6-4.5-a
ACLR specification for 5 MHz Channel BW (BCG 7.G)
No DescriptionMinimum required ACLR relative to
assigned channel frequency (dB)
1 Adjacent channel centre frequency Configuration I Configuration II2 MS channel centre frequency ± 5 MHz 30 333 MS channel centre frequency ± 10 MHz 44 43
TABLE A6-4.5-b
ACLR specifications for 10 MHz Channel BW (BCG 7.G)
No DescriptionMinimum required ACLR relative to
assigned channel frequency (dB)
1 Adjacent channel centre frequency Configuration I Configuration II2 MS channel centre frequency ± 10 MHz 30 333 MS channel centre frequency ± 20 MHz 44 43

142 Rec. ITU-R M.1581-5
5 Test tolerance
In this Annex, the test tolerances (as defined in Recommendation ITU-R M.1545) corresponding to various specifications are 0 dB unless stated otherwise in the corresponding section.
Attachment 1
Definition of test toleranceTest tolerance
With reference to Recommendation ITU-R M.1545, “test tolerance” is the relaxation value referred to in recommends 2 of Recommendation ITU-R M.1545, i.e. the difference between the core specification value and the test limit, evaluated applying the shared risk principle as per Figs 2 and 3 of Annex 1 of Recommendation ITU-R M.1545. In case the core specification value is equal to the test limit (Fig. 3 of Annex 1 of Recommendation ITU-R M.1545) the “test tolerances” are equal to 0.
______________