templeton developing markets trust semiannual report
TRANSCRIPT
SEMIANNUAL REPORT AND SHAREHOLDER LETTER
TEMPLETON DEVELOPING MARKETS TRUSTJune 30, 2021
Sign up for electronic delivery at franklintempleton.com/edelivery
Not FDIC Insured May Lose Value No Bank Guarantee
franklintempleton.com Not part of the semiannual report 1
SHAREHOLDER LETTERDear Shareholder:
Emerging market equities have continued their ascent so far in 2021, though the pace has moderated from the momentum of 2020. Emerging markets in general have shown sustained resilience in managing and adapting to COVID-19. What is worth noting, however, is a growing divergence between the perceived challenges surrounding these markets and their demonstrated structural strengths. As the rest of 2021 comes into sharper focus, we highlight three key areas that warrant attention—demand, sentiment and inflation.
Our meetings with companies across a wide range of industries in emerging markets have delivered a consistent message—demand remains robust, and the long-term growth drivers are clear. This has been the case even in countries that generated some of the worst COVID-19 headlines in recent months, such as India and Brazil.
The healthy demand picture we have seen on the ground contrasts with the soft sentiment that has surrounded emerging markets amid new COVID-19 outbreaks, slow vaccination progress and other country-specific concerns. We expect this backdrop to set emerging market economies up for potentially better performance ahead as vaccination rates and COVID-19 trends improve.
Inflation concerns in the U.S. have resurfaced as a stimulus-fueled global economy springs back from the depths of the pandemic. Even as we stay true to our bottom-up and stock-driven investment approach, we remain vigilant about possible macroeconomic headwinds.
As a whole, emerging market economic fundamentals have improved in the past decade, and we believe emerging markets are in a stronger position today to cope with any market volatility. Our overall outlook for emerging markets remains positive as they continue to chart a path out of the pandemic, though some risks may impact our medium-term view. That said, short-term challenges could create longer-term investment opportunities, underpinned by emerging markets’ structural strengths and the competitiveness of their companies.
We are committed to our long-term perspective and disciplined investment approach as we conduct a rigorous, fundamental analysis of securities with a regular emphasis on investment risk management.
Historically, patient investors have achieved rewarding results by evaluating their goals, diversifying their assets globally and maintaining a disciplined investment program, all hallmarks of the Templeton investment philosophy. We continue to recommend investors consult financial professionals and review their portfolios to design a long-term strategy and portfolio allocation that meet their individual needs, goals and risk tolerance.
Templeton Developing Markets Trust’s semiannual report includes more detail about prevailing conditions and a discussion about investment decisions during the period. Please remember all securities markets fluctuate, as do mutual fund share prices.
We thank you for investing with Franklin Templeton, welcome your questions and comments, and look forward to serving your investment needs in the years ahead.
Sincerely,
Manraj S. Sekhon, CFAChief Investment OfficerFranklin Templeton Emerging Markets Equity
This letter reflects our analysis and opinions as of June 30, 2021, unless otherwise indicated. The information is not a complete analysis of every aspect of any market, country, industry, security or fund. Statements of fact are from sources considered reliable.
CFA® is a trademark owned by CFA Institute.

franklintempleton.comSemiannual Report2
ContentsSemiannual ReportTempleton Developing Markets Trust ....................................3Performance Summary..........................................................7Your Fund’s Expenses ...........................................................9Financial Highlights and Statement of Investments.............10Financial Statements ...........................................................19Notes to Financial Statements.............................................23Shareholder Information ......................................................34
Visit franklintempleton.com for fund updates, to access your account, or to find helpful financial planning tools.
3franklintempleton.com Semiannual Report
SEMIANNUAL REPORT
Templeton Developing Markets TrustThis semiannual report for Templeton Developing Markets Trust covers the period ended June 30, 2021.
Your Fund’s Goal and Main InvestmentsThe Fund seeks long-term capital appreciation. Under normal market conditions, the Fund invests at least 80% of its net assets in securities of companies located or operating in “developing market countries,” as defined in the Fund’s prospectus.
Performance OverviewThe Fund’s Class A shares posted a +7.71% cumulative total return for the six months under review. In comparison, the Fund’s new benchmark, the MSCI Emerging Markets (EM) Index-NR, which measures global emerging market stock performance, posted a +7.45% cumulative total return for the same period.1 The Fund’s old benchmark, the MSCI EM Index, posted a +7.58 cumulative total return.1 The investment manager believes the MSCI EM Index-NR provides a more consistent basis for comparison relative to the Fund’s peers. Please note, index performance is provided for reference and we do not attempt to track an index but rather undertake investments on the basis of fundamental research. In addition, the Fund’s return reflects the effect of fees and expenses for professional management, while an index does not have such costs. You can find the Fund’s long-term performance data in the Performance Summary beginning on page 7.
Performance data represent past performance, which does not guarantee future results. Investment return and principal value will fluctuate, and you may have a gain or loss when you sell your shares. Current performance may differ from figures shown. For most recent month-end performance, go to franklintempleton.com or call (800) 342-5236.
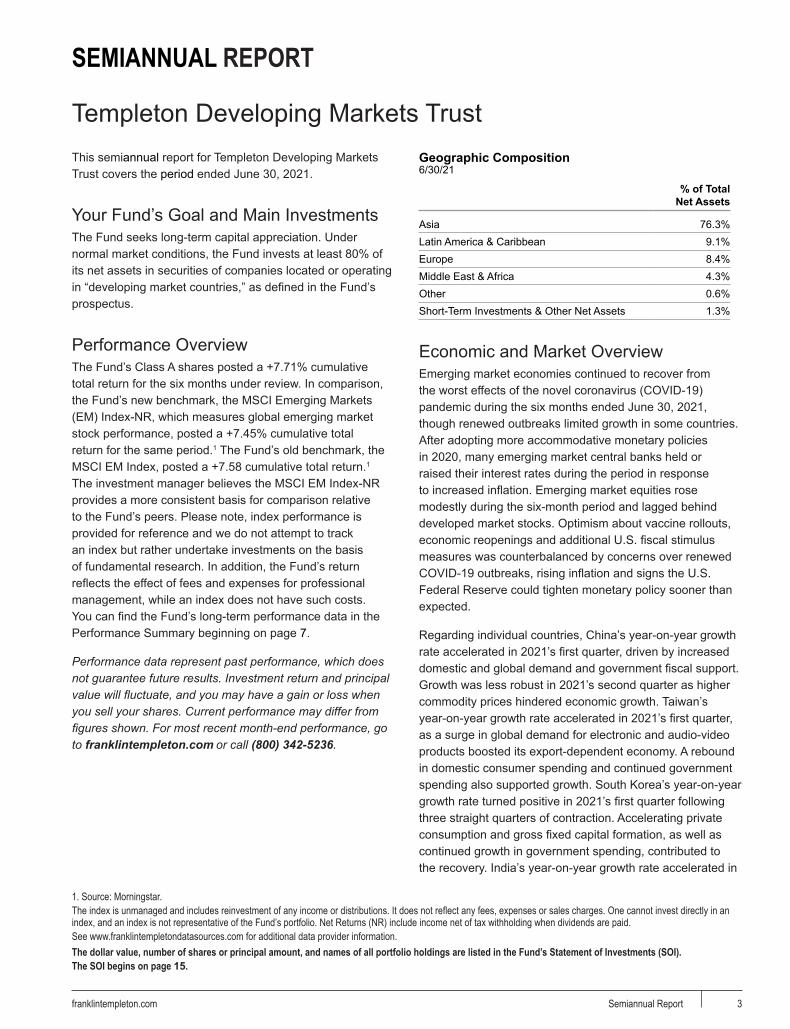
Geographic Composition6/30/21
% of Total Net Assets
Asia 76.3% Latin America & Caribbean 9.1% Europe 8.4% Middle East & Africa 4.3% Other 0.6% Short-Term Investments & Other Net Assets 1.3%
Economic and Market OverviewEmerging market economies continued to recover from the worst effects of the novel coronavirus (COVID-19) pandemic during the six months ended June 30, 2021, though renewed outbreaks limited growth in some countries. After adopting more accommodative monetary policies in 2020, many emerging market central banks held or raised their interest rates during the period in response to increased inflation. Emerging market equities rose modestly during the six-month period and lagged behind developed market stocks. Optimism about vaccine rollouts, economic reopenings and additional U.S. fiscal stimulus measures was counterbalanced by concerns over renewed COVID-19 outbreaks, rising inflation and signs the U.S. Federal Reserve could tighten monetary policy sooner than expected.
Regarding individual countries, China’s year-on-year growth rate accelerated in 2021’s first quarter, driven by increased domestic and global demand and government fiscal support. Growth was less robust in 2021’s second quarter as higher commodity prices hindered economic growth. Taiwan’s year-on-year growth rate accelerated in 2021’s first quarter, as a surge in global demand for electronic and audio-video products boosted its export-dependent economy. A rebound in domestic consumer spending and continued government spending also supported growth. South Korea’s year-on-year growth rate turned positive in 2021’s first quarter following three straight quarters of contraction. Accelerating private consumption and gross fixed capital formation, as well as continued growth in government spending, contributed to the recovery. India’s year-on-year growth rate accelerated in
1. Source: Morningstar.The index is unmanaged and includes reinvestment of any income or distributions. It does not reflect any fees, expenses or sales charges. One cannot invest directly in an index, and an index is not representative of the Fund’s portfolio. Net Returns (NR) include income net of tax withholding when dividends are paid.See www.franklintempletondatasources.com for additional data provider information.The dollar value, number of shares or principal amount, and names of all portfolio holdings are listed in the Fund’s Statement of Investments (SOI).The SOI begins on page 15.
TEMPLETON DEVELOPING MARKETS TRUST
4 franklintempleton.comSemiannual Report
2021’s first quarter, the country’s second straight quarter of growth. Private and government spending rebounded and gross fixed capital formation accelerated. Russia’s year-on-year growth rate contracted in 2021’s first quarter for the fourth straight quarter, albeit at a slower rate due to growth in industrial output and wholesale trade. Brazil’s year-on-year growth rate turned positive in 2021’s first quarter following four straight quarters of contractions, aided by accelerations in manufacturing, transportation and storage, and finance and insurance.
Turning to specific countries’ monetary policies, the People’s Bank of China left its benchmark loan prime rate unchanged during the period. Taiwan’s and South Korea’s central banks held their record low benchmark interest rates steady during the period. India’s central bank also left its benchmark rate unchanged. In contrast, the central banks of Russia and Brazil raised their respective benchmark interest rates three times during the period.
In this environment, emerging market stocks, as measured by the MSCI EM Index-NR, posted a +7.45% total return for the six months ended June 30, 2021.1 Chinese equities rose only slightly during the period, despite the country’s continued economic recovery. Gains were limited by concerns over increased regulations of internet-related companies, U.S.-China political tensions and monetary policy concerns. Equities in Taiwan rose significantly during the period, benefiting from strong exports by its technology-related companies. Russian equities rose as well, outpacing most emerging market peers, boosted by higher oil prices and easing geopolitical tensions with the U.S. Brazilian equities also gained during the period. Better-than-expected economic data and improved vaccination trends in 2021’s second quarter boosted stocks and helped offset losses early in the period due to concerns about increased COVID-19 infections, the country’s debt level and rising inflation.
Investment StrategyWe employ a fundamental research, value-oriented, long-term investment strategy. We focus on the market price of a company’s securities relative to our evaluation of its long-term earnings, asset value, cash flow potential and sustainable earnings power at a discount to intrinsic worth. This includes an assessment of the potential impacts of material environmental, social and governance factors on the long-term risk and return profile of a company. We also consider a company’s profit and loss outlook, balance sheet strength, cash flow trends and asset value in relation to
the current price of the company’s securities. Our analysis considers the company’s position in its sector, the economic framework and political environment.
Manager’s DiscussionKey contributors to absolute performance during the period were Taiwan Semiconductor Manufacturing Co. (TSMC), NAVER and MediaTek.
TSMC is one of the world’s leading semiconductor manufacturers, with major technology companies among its clients. The company’s stock price surged as investors lifted their longer-term outlook for the chipmaker in a robust environment for technology exports, driven by increased consumer demand for computers, game consoles, smartphones and tablets during the pandemic. Strong demand for its leading-edge chips coupled with production setbacks for a key competitor underpinned the optimism. TSMC’s better-than-expected fourth-quarter 2020 profit, upgraded sales growth forecasts and increased capital spending targets sent the stock soaring in January 2021, before signs of increased industry competition erased some gains. Investors also weighed strong first-quarter 2021 results from the chipmaker against mixed guidance, which projected weaker second-quarter margins while upgrading its full-year revenue growth forecast.
NAVER is South Korea’s largest search engine. The company also provides services including LINE, a messenger app that merged with SoftBank subsidiary Yahoo Japan (not a Fund holding). NAVER benefited from increased online shopping on its platform amid the COVID-19 pandemic. Moreover, investors remained confident of NAVER’s penetration into e-commerce, digital content and financial services, and looked positively upon its substantial research and development investment. NAVER
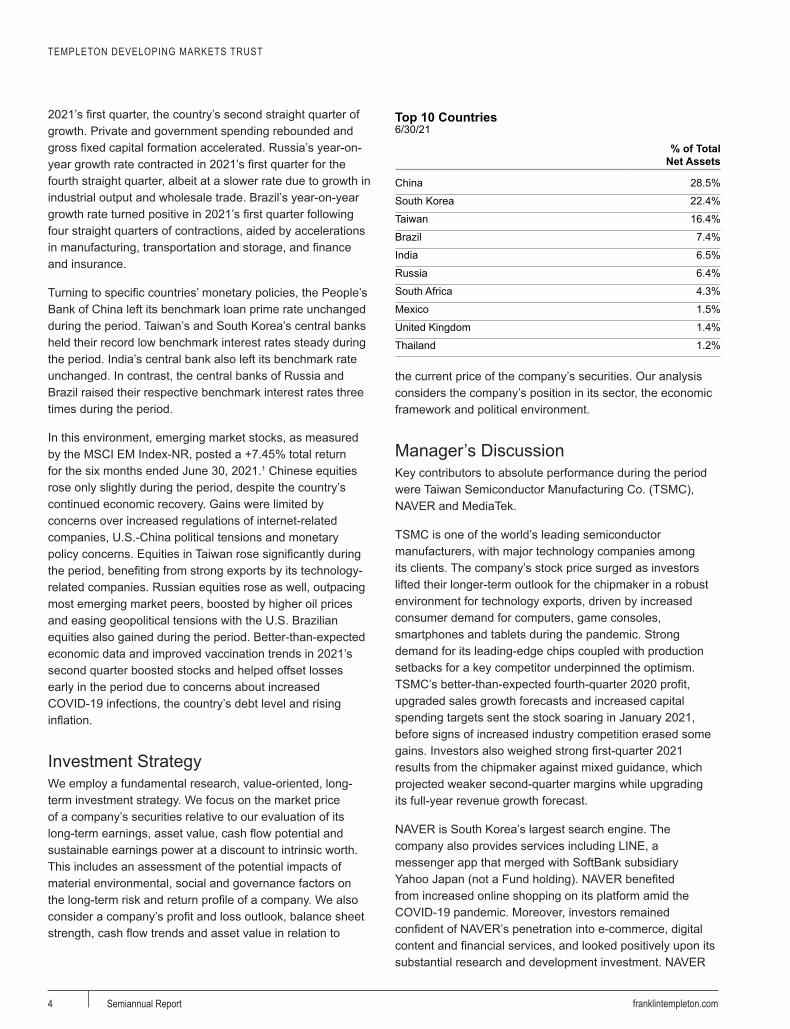
Top 10 Countries6/30/21
a% of Total
Net Assetsa a
China 28.5%
South Korea 22.4%
Taiwan 16.4%
Brazil 7.4%
India 6.5%
Russia 6.4%
South Africa 4.3%
Mexico 1.5%
United Kingdom 1.4%
Thailand 1.2%
TEMPLETON DEVELOPING MARKETS TRUST
5franklintempleton.com Semiannual Report
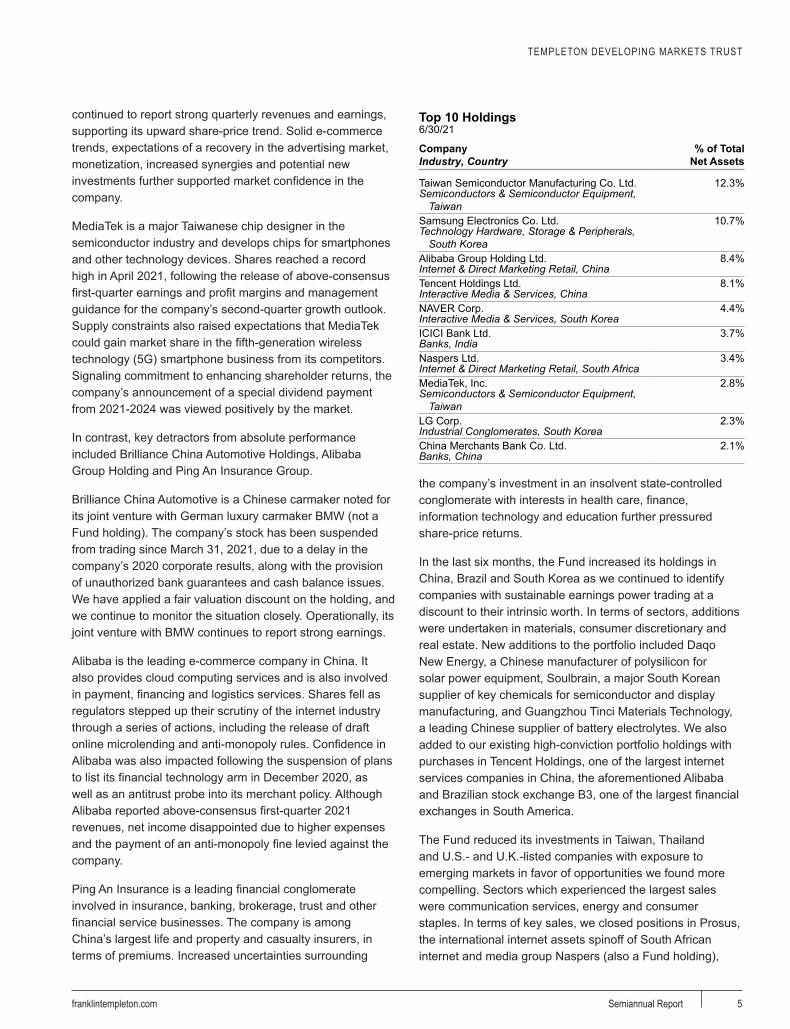
continued to report strong quarterly revenues and earnings, supporting its upward share-price trend. Solid e-commerce trends, expectations of a recovery in the advertising market, monetization, increased synergies and potential new investments further supported market confidence in the company.
MediaTek is a major Taiwanese chip designer in the semiconductor industry and develops chips for smartphones and other technology devices. Shares reached a record high in April 2021, following the release of above-consensus first-quarter earnings and profit margins and management guidance for the company’s second-quarter growth outlook. Supply constraints also raised expectations that MediaTek could gain market share in the fifth-generation wireless technology (5G) smartphone business from its competitors. Signaling commitment to enhancing shareholder returns, the company’s announcement of a special dividend payment from 2021-2024 was viewed positively by the market.
In contrast, key detractors from absolute performance included Brilliance China Automotive Holdings, Alibaba Group Holding and Ping An Insurance Group.
Brilliance China Automotive is a Chinese carmaker noted for its joint venture with German luxury carmaker BMW (not a Fund holding). The company’s stock has been suspended from trading since March 31, 2021, due to a delay in the company’s 2020 corporate results, along with the provision of unauthorized bank guarantees and cash balance issues. We have applied a fair valuation discount on the holding, and we continue to monitor the situation closely. Operationally, its joint venture with BMW continues to report strong earnings.
Alibaba is the leading e-commerce company in China. It also provides cloud computing services and is also involved in payment, financing and logistics services. Shares fell as regulators stepped up their scrutiny of the internet industry through a series of actions, including the release of draft online microlending and anti-monopoly rules. Confidence in Alibaba was also impacted following the suspension of plans to list its financial technology arm in December 2020, as well as an antitrust probe into its merchant policy. Although Alibaba reported above-consensus first-quarter 2021 revenues, net income disappointed due to higher expenses and the payment of an anti-monopoly fine levied against the company.
Ping An Insurance is a leading financial conglomerate involved in insurance, banking, brokerage, trust and other financial service businesses. The company is among China’s largest life and property and casualty insurers, in terms of premiums. Increased uncertainties surrounding
the company’s investment in an insolvent state-controlled conglomerate with interests in health care, finance, information technology and education further pressured share-price returns.
In the last six months, the Fund increased its holdings in China, Brazil and South Korea as we continued to identify companies with sustainable earnings power trading at a discount to their intrinsic worth. In terms of sectors, additions were undertaken in materials, consumer discretionary and real estate. New additions to the portfolio included Daqo New Energy, a Chinese manufacturer of polysilicon for solar power equipment, Soulbrain, a major South Korean supplier of key chemicals for semiconductor and display manufacturing, and Guangzhou Tinci Materials Technology, a leading Chinese supplier of battery electrolytes. We also added to our existing high-conviction portfolio holdings with purchases in Tencent Holdings, one of the largest internet services companies in China, the aforementioned Alibaba and Brazilian stock exchange B3, one of the largest financial exchanges in South America.
The Fund reduced its investments in Taiwan, Thailand and U.S.- and U.K.-listed companies with exposure to emerging markets in favor of opportunities we found more compelling. Sectors which experienced the largest sales were communication services, energy and consumer staples. In terms of key sales, we closed positions in Prosus, the international internet assets spinoff of South African internet and media group Naspers (also a Fund holding),
Top 10 Holdings6/30/21
Company Industry, Country
% of Total Net Assets
a a
Taiwan Semiconductor Manufacturing Co. Ltd. 12.3%Semiconductors & Semiconductor Equipment,
TaiwanSamsung Electronics Co. Ltd. 10.7%Technology Hardware, Storage & Peripherals,
South KoreaAlibaba Group Holding Ltd. 8.4%Internet & Direct Marketing Retail, ChinaTencent Holdings Ltd. 8.1%Interactive Media & Services, ChinaNAVER Corp. 4.4%Interactive Media & Services, South KoreaICICI Bank Ltd. 3.7%Banks, IndiaNaspers Ltd. 3.4%Internet & Direct Marketing Retail, South AfricaMediaTek, Inc. 2.8%Semiconductors & Semiconductor Equipment,
TaiwanLG Corp. 2.3%Industrial Conglomerates, South KoreaChina Merchants Bank Co. Ltd. 2.1%Banks, China

TEMPLETON DEVELOPING MARKETS TRUST
6 franklintempleton.comSemiannual Report
CNOOC, a Chinese energy company, and China Mobile, a Chinese wireless telecommunications provider. We also reduced positions in several key holdings, including Unilever, a U.K.-based global consumer goods giant that generates more than half of its sales in emerging markets, Cognizant Technology Solutions, a U.S.-listed technology services provider that derives most of its earnings from services produced in India, and the aforementioned NAVER.
We thank you for your continued participation in Templeton Developing Markets Trust and look forward to serving your future investment needs.
Chetan Sehgal, CFAAndrew Ness, CFA
Portfolio Management Team
The foregoing information reflects our analysis, opinions and portfolio holdings as of June 30, 2021, the end of the reporting period. The way we implement our main investment strategies and the resulting portfolio holdings may change depending on factors such as market and economic conditions. These opinions may not be relied upon as investment advice or an offer for a particular security. The information is not a complete analysis of every aspect of any market, country, industry, security or the Fund. Statements of fact are from sources considered reliable, but the investment manager makes no representation or warranty as to their completeness or accuracy. Although historical performance is no guarantee of future results, these insights may help you understand our investment management philosophy.

Performance Summary as of June 30, 2021
TEMPLETON DEVELOPING MARKETS TRUST
7franklintempleton.com Semiannual Report
The performance table does not reflect any taxes that a shareholder would pay on Fund dividends, capital gain distributions, if any, or any realized gains on the sale of Fund shares. Total return reflects reinvestment of the Fund’s dividends and capital gain distributions, if any, and any unrealized gains or losses. Your dividend income will vary depending on dividends or interest paid by securities in the Fund’s portfolio, adjusted for operating expenses of each class. Capital gain distributions are net profits realized from the sale of portfolio securities.
Performance as of 6/30/211
Cumulative total return excludes sales charges. Average annual total return includes maximum sales charges. Sales charges will vary depending on the size of the investment and the class of share purchased. The maximum is 5.50% and the minimum is 0%. Class A: 5.50% maximum initial sales charge; Advisor Class: no sales charges. For other share classes, visit franklintempleton.com.
Share ClassCumulative
Total Return2Average Annual
Total Return3
–
A4
6-Month +7.71% +1.78%1-Year +42.13% +34.31%5-Year +102.11% +13.81%10-Year +53.45% +3.79%
Advisor6-Month +7.84% +7.84%1-Year +42.51% +42.51%5-Year +104.76% +15.41%10-Year +57.51% +4.65%
Performance data represent past performance, which does not guarantee future results. Investment return and principal value will fluctuate, and you may have a gain or loss when you sell your shares. Current performance may differ from figures shown. For most recent month-end performance, go to franklintempleton.com or call (800) 342-5236.
See page 8 for Performance Summary footnotes.
TEMPLETON DEVELOPING MARKETS TRUSTPERFORMANCE SUMMARY
8 franklintempleton.comSemiannual Report
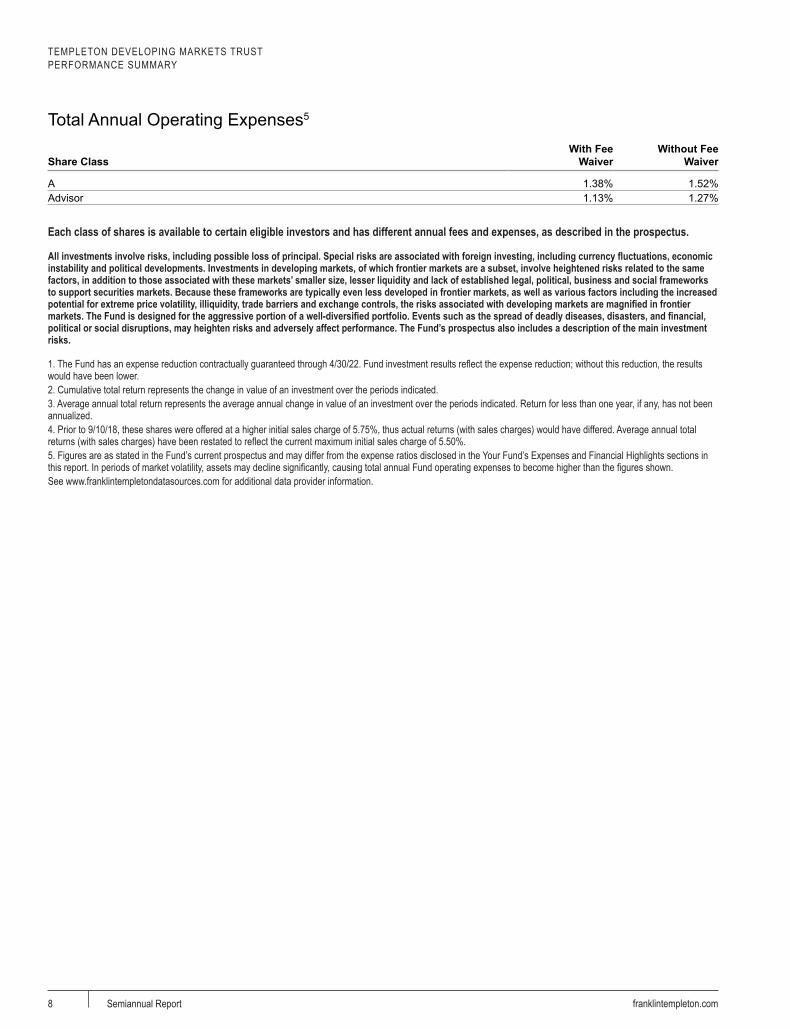
Total Annual Operating Expenses5
Share ClassWith Fee
WaiverWithout Fee
Waiver
A 1.38% 1.52%Advisor 1.13% 1.27%
Each class of shares is available to certain eligible investors and has different annual fees and expenses, as described in the prospectus.
All investments involve risks, including possible loss of principal. Special risks are associated with foreign investing, including currency fluctuations, economic instability and political developments. Investments in developing markets, of which frontier markets are a subset, involve heightened risks related to the same factors, in addition to those associated with these markets’ smaller size, lesser liquidity and lack of established legal, political, business and social frameworks to support securities markets. Because these frameworks are typically even less developed in frontier markets, as well as various factors including the increased potential for extreme price volatility, illiquidity, trade barriers and exchange controls, the risks associated with developing markets are magnified in frontier markets. The Fund is designed for the aggressive portion of a well-diversified portfolio. Events such as the spread of deadly diseases, disasters, and financial, political or social disruptions, may heighten risks and adversely affect performance. The Fund’s prospectus also includes a description of the main investment risks.
1. The Fund has an expense reduction contractually guaranteed through 4/30/22. Fund investment results reflect the expense reduction; without this reduction, the results would have been lower.2. Cumulative total return represents the change in value of an investment over the periods indicated.3. Average annual total return represents the average annual change in value of an investment over the periods indicated. Return for less than one year, if any, has not been annualized.4. Prior to 9/10/18, these shares were offered at a higher initial sales charge of 5.75%, thus actual returns (with sales charges) would have differed. Average annual total returns (with sales charges) have been restated to reflect the current maximum initial sales charge of 5.50%.5. Figures are as stated in the Fund’s current prospectus and may differ from the expense ratios disclosed in the Your Fund’s Expenses and Financial Highlights sections in this report. In periods of market volatility, assets may decline significantly, causing total annual Fund operating expenses to become higher than the figures shown.See www.franklintempletondatasources.com for additional data provider information.
Your Fund’s Expenses
TEMPLETON DEVELOPING MARKETS TRUST
9franklintempleton.com Semiannual Report
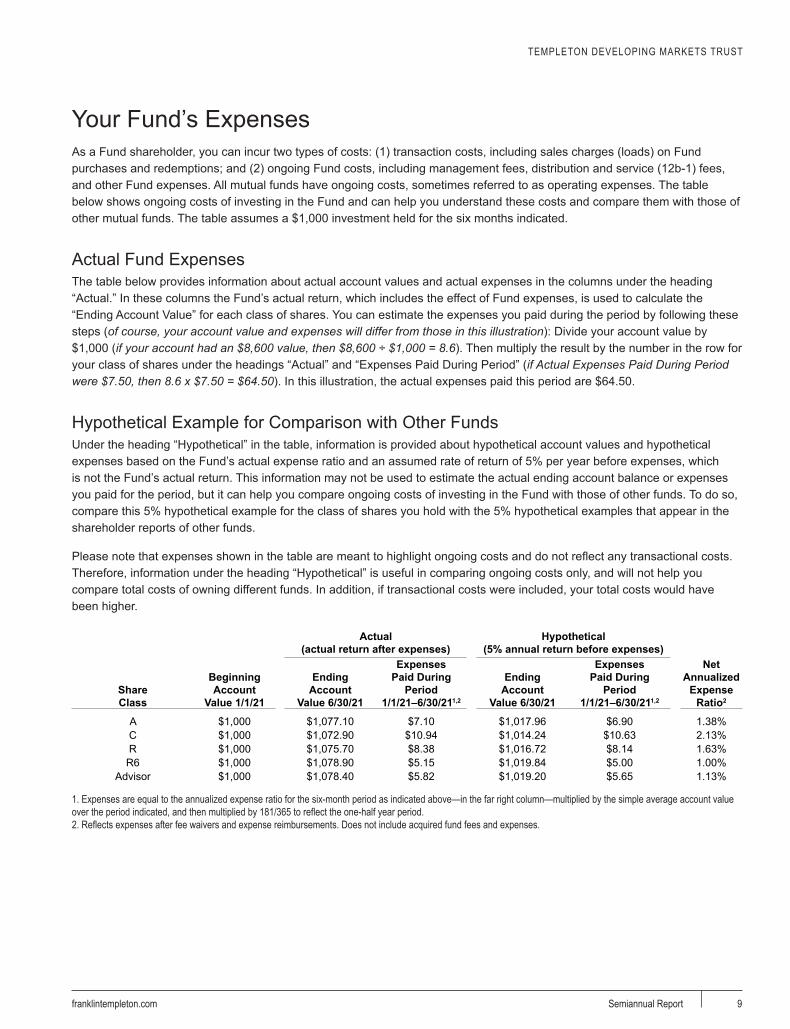
As a Fund shareholder, you can incur two types of costs: (1) transaction costs, including sales charges (loads) on Fund purchases and redemptions; and (2) ongoing Fund costs, including management fees, distribution and service (12b-1) fees, and other Fund expenses. All mutual funds have ongoing costs, sometimes referred to as operating expenses. The table below shows ongoing costs of investing in the Fund and can help you understand these costs and compare them with those of other mutual funds. The table assumes a $1,000 investment held for the six months indicated.
Actual Fund ExpensesThe table below provides information about actual account values and actual expenses in the columns under the heading “Actual.” In these columns the Fund’s actual return, which includes the effect of Fund expenses, is used to calculate the “Ending Account Value” for each class of shares. You can estimate the expenses you paid during the period by following these steps (of course, your account value and expenses will differ from those in this illustration): Divide your account value by $1,000 (if your account had an $8,600 value, then $8,600 ÷ $1,000 = 8.6). Then multiply the result by the number in the row for your class of shares under the headings “Actual” and “Expenses Paid During Period” (if Actual Expenses Paid During Period were $7.50, then 8.6 x $7.50 = $64.50). In this illustration, the actual expenses paid this period are $64.50.
Hypothetical Example for Comparison with Other FundsUnder the heading “Hypothetical” in the table, information is provided about hypothetical account values and hypothetical expenses based on the Fund’s actual expense ratio and an assumed rate of return of 5% per year before expenses, which is not the Fund’s actual return. This information may not be used to estimate the actual ending account balance or expenses you paid for the period, but it can help you compare ongoing costs of investing in the Fund with those of other funds. To do so, compare this 5% hypothetical example for the class of shares you hold with the 5% hypothetical examples that appear in the shareholder reports of other funds.
Please note that expenses shown in the table are meant to highlight ongoing costs and do not reflect any transactional costs. Therefore, information under the heading “Hypothetical” is useful in comparing ongoing costs only, and will not help you compare total costs of owning different funds. In addition, if transactional costs were included, your total costs would have been higher.
Actual (actual return after expenses)
Hypothetical (5% annual return before expenses)
Share Class
Beginning Account
Value 1/1/21
Ending Account
Value 6/30/21
Expenses Paid During
Period 1/1/21–6/30/211,2
Ending Account
Value 6/30/21
Expenses Paid During
Period 1/1/21–6/30/211,2
a
Net Annualized
Expense Ratio2
A $1,000 $1,077.10 $7.10 $1,017.96 $6.90 1.38%C $1,000 $1,072.90 $10.94 $1,014.24 $10.63 2.13%R $1,000 $1,075.70 $8.38 $1,016.72 $8.14 1.63%
R6 $1,000 $1,078.90 $5.15 $1,019.84 $5.00 1.00%Advisor $1,000 $1,078.40 $5.82 $1,019.20 $5.65 1.13%
1. Expenses are equal to the annualized expense ratio for the six-month period as indicated above—in the far right column—multiplied by the simple average account value over the period indicated, and then multiplied by 181/365 to reflect the one-half year period.2. Reflects expenses after fee waivers and expense reimbursements. Does not include acquired fund fees and expenses.
TEMPLETON DEVELOPING MARKETS TRUST
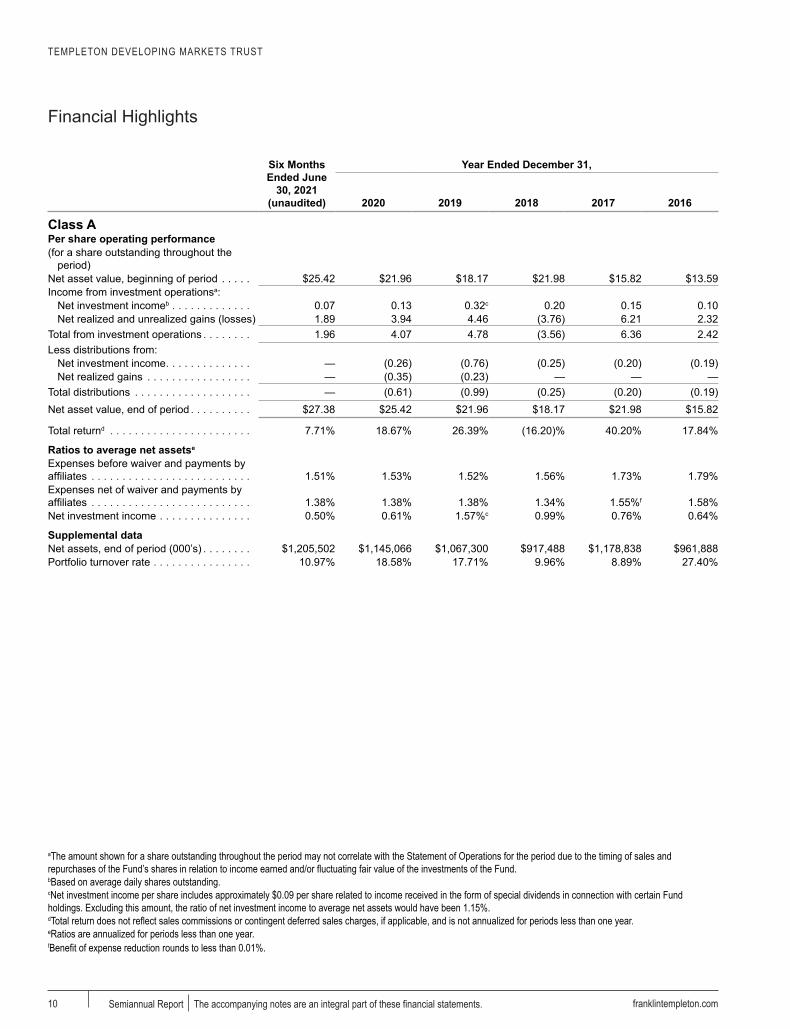
Financial Highlights
franklintempleton.comSemiannual Report The accompanying notes are an integral part of these financial statements.10
a
Six Months Ended June
30, 2021 (unaudited)
Year Ended December 31,
2020 2019 2018 2017 2016
Class APer share operating performance(for a share outstanding throughout the
period)Net asset value, beginning of period . . . . . $25.42 $21.96 $18.17 $21.98 $15.82 $13.59Income from investment operationsa:
Net investment incomeb . . . . . . . . . . . . . 0.07 0.13 0.32c 0.20 0.15 0.10Net realized and unrealized gains (losses) 1.89 3.94 4.46 (3.76) 6.21 2.32
Total from investment operations . . . . . . . . 1.96 4.07 4.78 (3.56) 6.36 2.42Less distributions from:
Net investment income . . . . . . . . . . . . . . — (0.26) (0.76) (0.25) (0.20) (0.19)Net realized gains . . . . . . . . . . . . . . . . . — (0.35) (0.23) — — —
Total distributions . . . . . . . . . . . . . . . . . . . — (0.61) (0.99) (0.25) (0.20) (0.19)Net asset value, end of period . . . . . . . . . . $27.38 $25.42 $21.96 $18.17 $21.98 $15.82
Total returnd . . . . . . . . . . . . . . . . . . . . . . . 7.71% 18.67% 26.39% (16.20)% 40.20% 17.84%
Ratios to average net assetse
Expenses before waiver and payments by affiliates . . . . . . . . . . . . . . . . . . . . . . . . . . 1.51% 1.53% 1.52% 1.56% 1.73% 1.79%Expenses net of waiver and payments by affiliates . . . . . . . . . . . . . . . . . . . . . . . . . . 1.38% 1.38% 1.38% 1.34% 1.55%f 1.58%Net investment income . . . . . . . . . . . . . . . 0.50% 0.61% 1.57%c 0.99% 0.76% 0.64%
Supplemental dataNet assets, end of period (000’s) . . . . . . . . $1,205,502 $1,145,066 $1,067,300 $917,488 $1,178,838 $961,888Portfolio turnover rate . . . . . . . . . . . . . . . . 10.97% 18.58% 17.71% 9.96% 8.89% 27.40%
aThe amount shown for a share outstanding throughout the period may not correlate with the Statement of Operations for the period due to the timing of sales and repurchases of the Fund’s shares in relation to income earned and/or fluctuating fair value of the investments of the Fund.bBased on average daily shares outstanding.cNet investment income per share includes approximately $0.09 per share related to income received in the form of special dividends in connection with certain Fund holdings. Excluding this amount, the ratio of net investment income to average net assets would have been 1.15%.dTotal return does not reflect sales commissions or contingent deferred sales charges, if applicable, and is not annualized for periods less than one year.eRatios are annualized for periods less than one year.fBenefit of expense reduction rounds to less than 0.01%.
TEMPLETON DEVELOPING MARKETS TRUSTFINANCIAL HIGHLIGHTS
franklintempleton.com The accompanying notes are an integral part of these financial statements. Semiannual Report 11
a
Six Months Ended June
30, 2021 (unaudited)
Year Ended December 31,
2020 2019 2018 2017 2016
Class CPer share operating performance(for a share outstanding throughout the
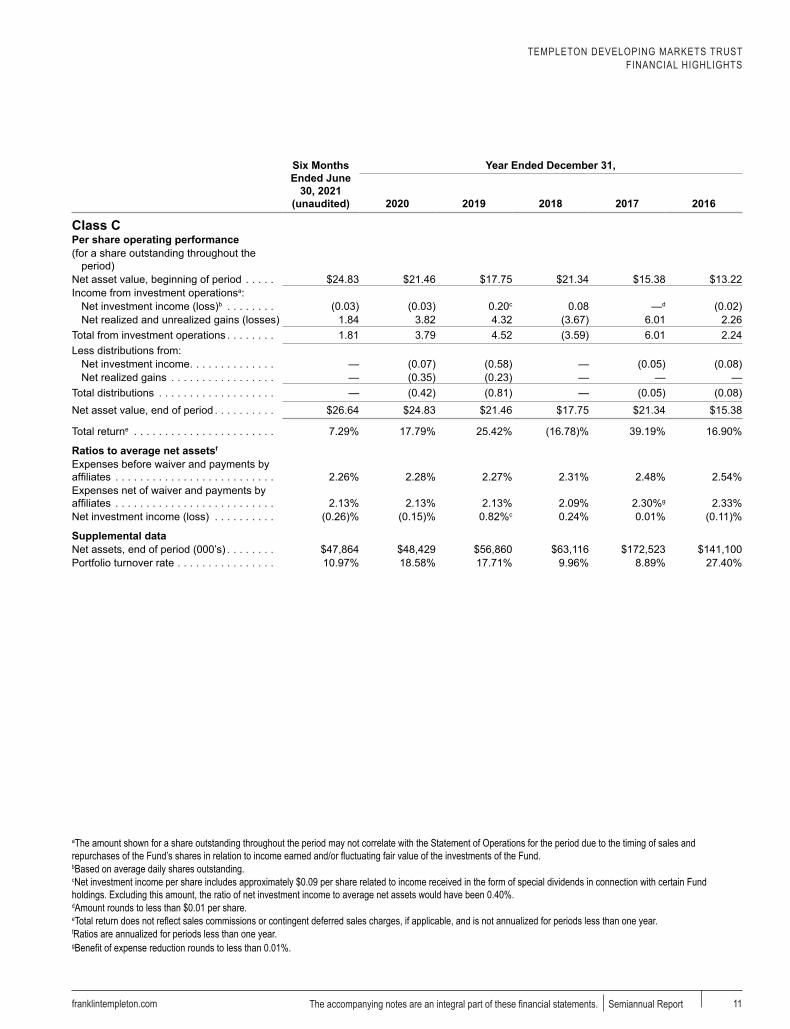
period)Net asset value, beginning of period . . . . . $24.83 $21.46 $17.75 $21.34 $15.38 $13.22Income from investment operationsa:
Net investment income (loss)b . . . . . . . . (0.03) (0.03) 0.20c 0.08 —d (0.02)Net realized and unrealized gains (losses) 1.84 3.82 4.32 (3.67) 6.01 2.26
Total from investment operations . . . . . . . . 1.81 3.79 4.52 (3.59) 6.01 2.24Less distributions from:
Net investment income . . . . . . . . . . . . . . — (0.07) (0.58) — (0.05) (0.08)Net realized gains . . . . . . . . . . . . . . . . . — (0.35) (0.23) — — —
Total distributions . . . . . . . . . . . . . . . . . . . — (0.42) (0.81) — (0.05) (0.08)Net asset value, end of period . . . . . . . . . . $26.64 $24.83 $21.46 $17.75 $21.34 $15.38
Total returne . . . . . . . . . . . . . . . . . . . . . . . 7.29% 17.79% 25.42% (16.78)% 39.19% 16.90%
Ratios to average net assetsf
Expenses before waiver and payments by affiliates . . . . . . . . . . . . . . . . . . . . . . . . . . 2.26% 2.28% 2.27% 2.31% 2.48% 2.54%Expenses net of waiver and payments by affiliates . . . . . . . . . . . . . . . . . . . . . . . . . . 2.13% 2.13% 2.13% 2.09% 2.30%g 2.33%Net investment income (loss) . . . . . . . . . . (0.26)% (0.15)% 0.82%c 0.24% 0.01% (0.11)%
Supplemental dataNet assets, end of period (000’s) . . . . . . . . $47,864 $48,429 $56,860 $63,116 $172,523 $141,100Portfolio turnover rate . . . . . . . . . . . . . . . . 10.97% 18.58% 17.71% 9.96% 8.89% 27.40%
aThe amount shown for a share outstanding throughout the period may not correlate with the Statement of Operations for the period due to the timing of sales and repurchases of the Fund’s shares in relation to income earned and/or fluctuating fair value of the investments of the Fund.bBased on average daily shares outstanding.cNet investment income per share includes approximately $0.09 per share related to income received in the form of special dividends in connection with certain Fund holdings. Excluding this amount, the ratio of net investment income to average net assets would have been 0.40%.dAmount rounds to less than $0.01 per share.eTotal return does not reflect sales commissions or contingent deferred sales charges, if applicable, and is not annualized for periods less than one year.fRatios are annualized for periods less than one year.gBenefit of expense reduction rounds to less than 0.01%.
TEMPLETON DEVELOPING MARKETS TRUSTFINANCIAL HIGHLIGHTS
franklintempleton.comSemiannual Report The accompanying notes are an integral part of these financial statements.12
a
Six Months Ended June
30, 2021 (unaudited)
Year Ended December 31,
2020 2019 2018 2017 2016
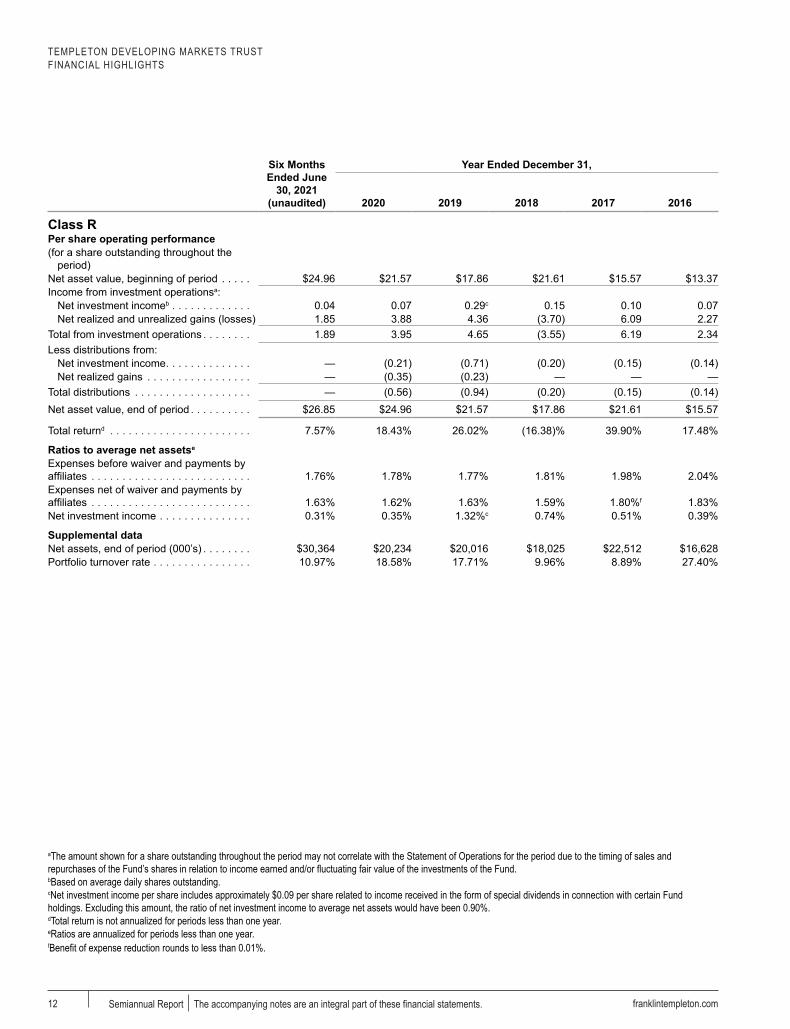
Class RPer share operating performance(for a share outstanding throughout the
period)Net asset value, beginning of period . . . . . $24.96 $21.57 $17.86 $21.61 $15.57 $13.37Income from investment operationsa:
Net investment incomeb . . . . . . . . . . . . . 0.04 0.07 0.29c 0.15 0.10 0.07Net realized and unrealized gains (losses) 1.85 3.88 4.36 (3.70) 6.09 2.27
Total from investment operations . . . . . . . . 1.89 3.95 4.65 (3.55) 6.19 2.34Less distributions from:
Net investment income . . . . . . . . . . . . . . — (0.21) (0.71) (0.20) (0.15) (0.14)Net realized gains . . . . . . . . . . . . . . . . . — (0.35) (0.23) — — —
Total distributions . . . . . . . . . . . . . . . . . . . — (0.56) (0.94) (0.20) (0.15) (0.14)Net asset value, end of period . . . . . . . . . . $26.85 $24.96 $21.57 $17.86 $21.61 $15.57
Total returnd . . . . . . . . . . . . . . . . . . . . . . . 7.57% 18.43% 26.02% (16.38)% 39.90% 17.48%
Ratios to average net assetse
Expenses before waiver and payments by affiliates . . . . . . . . . . . . . . . . . . . . . . . . . . 1.76% 1.78% 1.77% 1.81% 1.98% 2.04%Expenses net of waiver and payments by affiliates . . . . . . . . . . . . . . . . . . . . . . . . . . 1.63% 1.62% 1.63% 1.59% 1.80%f 1.83%Net investment income . . . . . . . . . . . . . . . 0.31% 0.35% 1.32%c 0.74% 0.51% 0.39%
Supplemental dataNet assets, end of period (000’s) . . . . . . . . $30,364 $20,234 $20,016 $18,025 $22,512 $16,628Portfolio turnover rate . . . . . . . . . . . . . . . . 10.97% 18.58% 17.71% 9.96% 8.89% 27.40%
aThe amount shown for a share outstanding throughout the period may not correlate with the Statement of Operations for the period due to the timing of sales and repurchases of the Fund’s shares in relation to income earned and/or fluctuating fair value of the investments of the Fund.bBased on average daily shares outstanding.cNet investment income per share includes approximately $0.09 per share related to income received in the form of special dividends in connection with certain Fund holdings. Excluding this amount, the ratio of net investment income to average net assets would have been 0.90%.dTotal return is not annualized for periods less than one year.eRatios are annualized for periods less than one year.fBenefit of expense reduction rounds to less than 0.01%.
TEMPLETON DEVELOPING MARKETS TRUSTFINANCIAL HIGHLIGHTS
franklintempleton.com The accompanying notes are an integral part of these financial statements. Semiannual Report 13
a
Six Months Ended June
30, 2021 (unaudited)
Year Ended December 31,
2020 2019 2018 2017 2016
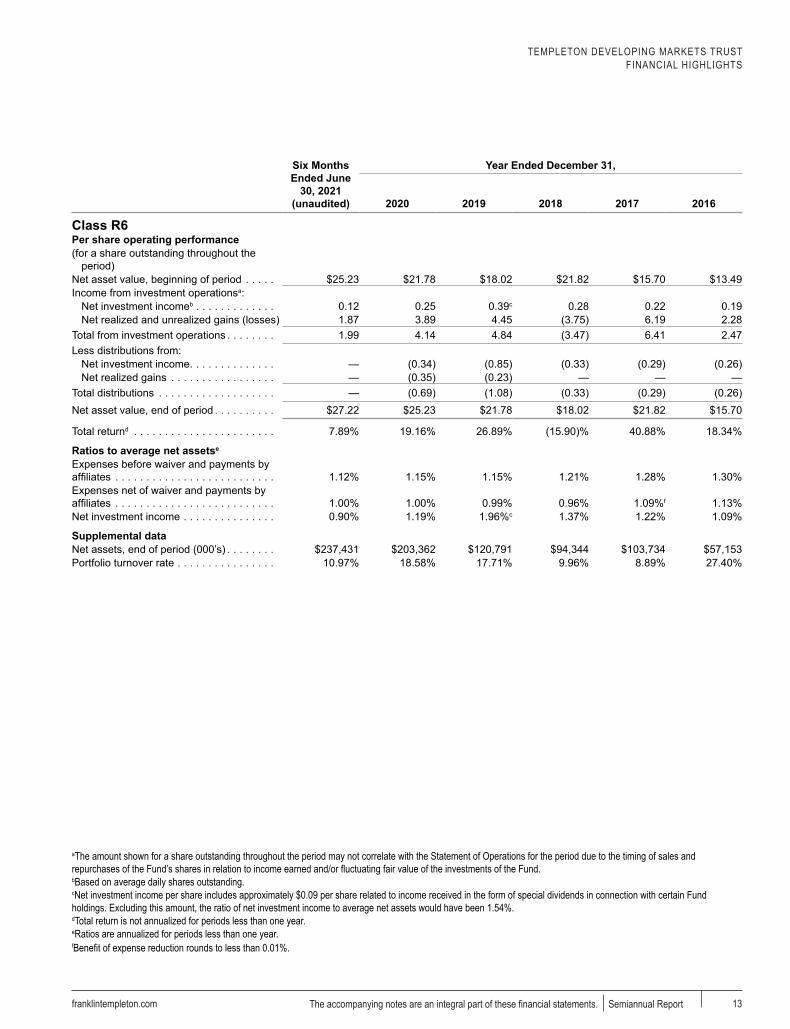
Class R6Per share operating performance(for a share outstanding throughout the
period)Net asset value, beginning of period . . . . . $25.23 $21.78 $18.02 $21.82 $15.70 $13.49Income from investment operationsa:
Net investment incomeb . . . . . . . . . . . . . 0.12 0.25 0.39c 0.28 0.22 0.19Net realized and unrealized gains (losses) 1.87 3.89 4.45 (3.75) 6.19 2.28
Total from investment operations . . . . . . . . 1.99 4.14 4.84 (3.47) 6.41 2.47Less distributions from:
Net investment income . . . . . . . . . . . . . . — (0.34) (0.85) (0.33) (0.29) (0.26)Net realized gains . . . . . . . . . . . . . . . . . — (0.35) (0.23) — — —
Total distributions . . . . . . . . . . . . . . . . . . . — (0.69) (1.08) (0.33) (0.29) (0.26)Net asset value, end of period . . . . . . . . . . $27.22 $25.23 $21.78 $18.02 $21.82 $15.70
Total returnd . . . . . . . . . . . . . . . . . . . . . . . 7.89% 19.16% 26.89% (15.90)% 40.88% 18.34%
Ratios to average net assetse
Expenses before waiver and payments by affiliates . . . . . . . . . . . . . . . . . . . . . . . . . . 1.12% 1.15% 1.15% 1.21% 1.28% 1.30%Expenses net of waiver and payments by affiliates . . . . . . . . . . . . . . . . . . . . . . . . . . 1.00% 1.00% 0.99% 0.96% 1.09%f 1.13%Net investment income . . . . . . . . . . . . . . . 0.90% 1.19% 1.96%c 1.37% 1.22% 1.09%
Supplemental dataNet assets, end of period (000’s) . . . . . . . . $237,431 $203,362 $120,791 $94,344 $103,734 $57,153Portfolio turnover rate . . . . . . . . . . . . . . . . 10.97% 18.58% 17.71% 9.96% 8.89% 27.40%
aThe amount shown for a share outstanding throughout the period may not correlate with the Statement of Operations for the period due to the timing of sales and repurchases of the Fund’s shares in relation to income earned and/or fluctuating fair value of the investments of the Fund.bBased on average daily shares outstanding.cNet investment income per share includes approximately $0.09 per share related to income received in the form of special dividends in connection with certain Fund holdings. Excluding this amount, the ratio of net investment income to average net assets would have been 1.54%.dTotal return is not annualized for periods less than one year.eRatios are annualized for periods less than one year.fBenefit of expense reduction rounds to less than 0.01%.
TEMPLETON DEVELOPING MARKETS TRUSTFINANCIAL HIGHLIGHTS
franklintempleton.comSemiannual Report The accompanying notes are an integral part of these financial statements.14
a
Six Months Ended June
30, 2021 (unaudited)
Year Ended December 31,
2020 2019 2018 2017 2016
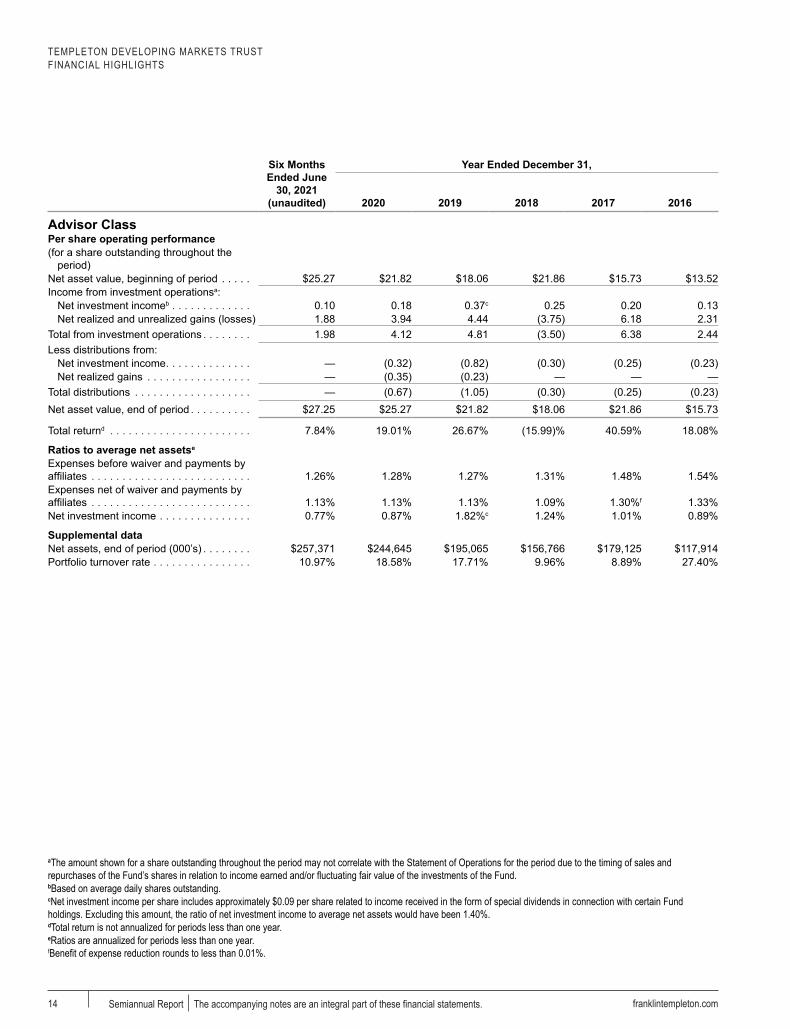
Advisor ClassPer share operating performance(for a share outstanding throughout the
period)Net asset value, beginning of period . . . . . $25.27 $21.82 $18.06 $21.86 $15.73 $13.52Income from investment operationsa:
Net investment incomeb . . . . . . . . . . . . . 0.10 0.18 0.37c 0.25 0.20 0.13Net realized and unrealized gains (losses) 1.88 3.94 4.44 (3.75) 6.18 2.31
Total from investment operations . . . . . . . . 1.98 4.12 4.81 (3.50) 6.38 2.44Less distributions from:
Net investment income . . . . . . . . . . . . . . — (0.32) (0.82) (0.30) (0.25) (0.23)Net realized gains . . . . . . . . . . . . . . . . . — (0.35) (0.23) — — —
Total distributions . . . . . . . . . . . . . . . . . . . — (0.67) (1.05) (0.30) (0.25) (0.23)Net asset value, end of period . . . . . . . . . . $27.25 $25.27 $21.82 $18.06 $21.86 $15.73
Total returnd . . . . . . . . . . . . . . . . . . . . . . . 7.84% 19.01% 26.67% (15.99)% 40.59% 18.08%
Ratios to average net assetse
Expenses before waiver and payments by affiliates . . . . . . . . . . . . . . . . . . . . . . . . . . 1.26% 1.28% 1.27% 1.31% 1.48% 1.54%Expenses net of waiver and payments by affiliates . . . . . . . . . . . . . . . . . . . . . . . . . . 1.13% 1.13% 1.13% 1.09% 1.30%f 1.33%Net investment income . . . . . . . . . . . . . . . 0.77% 0.87% 1.82%c 1.24% 1.01% 0.89%
Supplemental dataNet assets, end of period (000’s) . . . . . . . . $257,371 $244,645 $195,065 $156,766 $179,125 $117,914Portfolio turnover rate . . . . . . . . . . . . . . . . 10.97% 18.58% 17.71% 9.96% 8.89% 27.40%
aThe amount shown for a share outstanding throughout the period may not correlate with the Statement of Operations for the period due to the timing of sales and repurchases of the Fund’s shares in relation to income earned and/or fluctuating fair value of the investments of the Fund.bBased on average daily shares outstanding.cNet investment income per share includes approximately $0.09 per share related to income received in the form of special dividends in connection with certain Fund holdings. Excluding this amount, the ratio of net investment income to average net assets would have been 1.40%.dTotal return is not annualized for periods less than one year.eRatios are annualized for periods less than one year.fBenefit of expense reduction rounds to less than 0.01%.
TEMPLETON DEVELOPING MARKETS TRUST
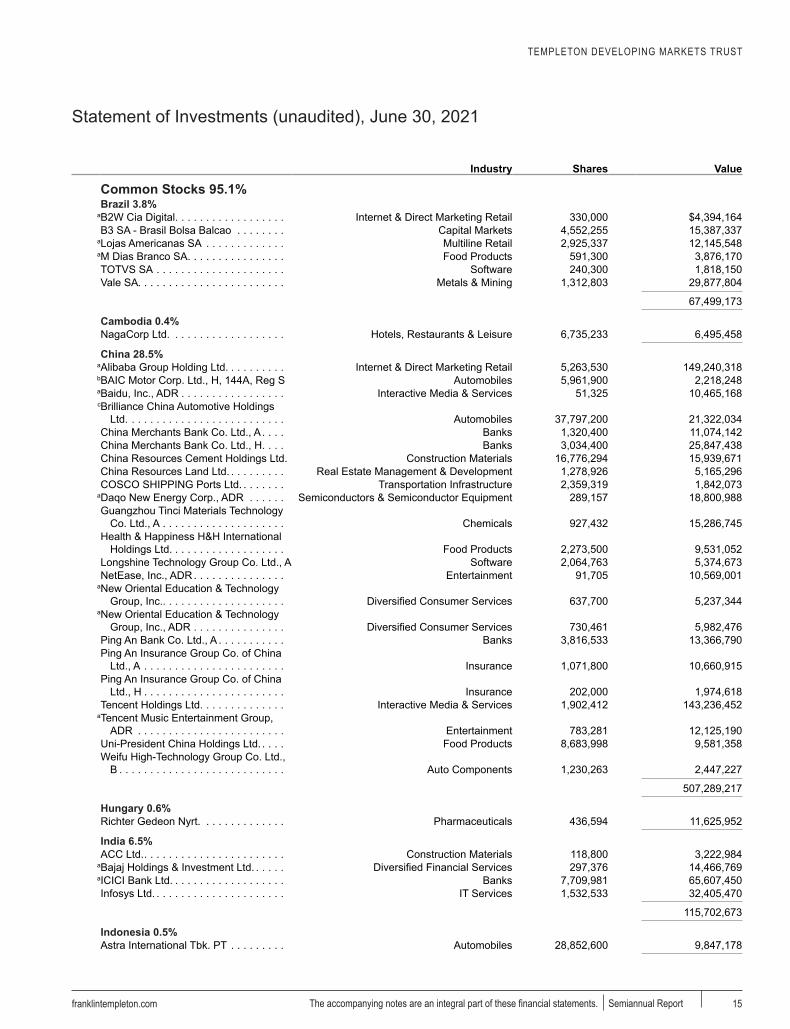
Statement of Investments (unaudited), June 30, 2021
franklintempleton.com The accompanying notes are an integral part of these financial statements. Semiannual Report 15
I
a a Industry Shares a Value a
Common Stocks 95.1% Brazil 3.8%
aB2W Cia Digital . . . . . . . . . . . . . . . . . . Internet & Direct Marketing Retail 330,000 $4,394,164B3 SA - Brasil Bolsa Balcao . . . . . . . . Capital Markets 4,552,255 15,387,337
aLojas Americanas SA . . . . . . . . . . . . . Multiline Retail 2,925,337 12,145,548aM Dias Branco SA . . . . . . . . . . . . . . . . Food Products 591,300 3,876,170TOTVS SA . . . . . . . . . . . . . . . . . . . . . Software 240,300 1,818,150Vale SA . . . . . . . . . . . . . . . . . . . . . . . . Metals & Mining 1,312,803 29,877,804
67,499,173
Cambodia 0.4%NagaCorp Ltd. . . . . . . . . . . . . . . . . . . Hotels, Restaurants & Leisure 6,735,233 6,495,458
China 28.5%aAlibaba Group Holding Ltd. . . . . . . . . . Internet & Direct Marketing Retail 5,263,530 149,240,318bBAIC Motor Corp. Ltd., H, 144A, Reg S Automobiles 5,961,900 2,218,248aBaidu, Inc., ADR . . . . . . . . . . . . . . . . . Interactive Media & Services 51,325 10,465,168cBrilliance China Automotive Holdings
Ltd. . . . . . . . . . . . . . . . . . . . . . . . . . Automobiles 37,797,200 21,322,034China Merchants Bank Co. Ltd., A . . . . Banks 1,320,400 11,074,142China Merchants Bank Co. Ltd., H . . . . Banks 3,034,400 25,847,438China Resources Cement Holdings Ltd. Construction Materials 16,776,294 15,939,671China Resources Land Ltd. . . . . . . . . . Real Estate Management & Development 1,278,926 5,165,296COSCO SHIPPING Ports Ltd. . . . . . . . Transportation Infrastructure 2,359,319 1,842,073
aDaqo New Energy Corp., ADR . . . . . . Semiconductors & Semiconductor Equipment 289,157 18,800,988Guangzhou Tinci Materials Technology
Co. Ltd., A . . . . . . . . . . . . . . . . . . . . Chemicals 927,432 15,286,745Health & Happiness H&H International
Holdings Ltd. . . . . . . . . . . . . . . . . . . Food Products 2,273,500 9,531,052Longshine Technology Group Co. Ltd., A Software 2,064,763 5,374,673NetEase, Inc., ADR . . . . . . . . . . . . . . . Entertainment 91,705 10,569,001
aNew Oriental Education & Technology Group, Inc.. . . . . . . . . . . . . . . . . . . . Diversified Consumer Services 637,700 5,237,344
aNew Oriental Education & Technology Group, Inc., ADR . . . . . . . . . . . . . . . Diversified Consumer Services 730,461 5,982,476
Ping An Bank Co. Ltd., A . . . . . . . . . . . Banks 3,816,533 13,366,790Ping An Insurance Group Co. of China
Ltd., A . . . . . . . . . . . . . . . . . . . . . . . Insurance 1,071,800 10,660,915Ping An Insurance Group Co. of China
Ltd., H . . . . . . . . . . . . . . . . . . . . . . . Insurance 202,000 1,974,618Tencent Holdings Ltd. . . . . . . . . . . . . . Interactive Media & Services 1,902,412 143,236,452
aTencent Music Entertainment Group, ADR . . . . . . . . . . . . . . . . . . . . . . . . Entertainment 783,281 12,125,190
Uni-President China Holdings Ltd. . . . . Food Products 8,683,998 9,581,358Weifu High-Technology Group Co. Ltd.,
B . . . . . . . . . . . . . . . . . . . . . . . . . . . Auto Components 1,230,263 2,447,227
507,289,217
Hungary 0.6%Richter Gedeon Nyrt. . . . . . . . . . . . . . Pharmaceuticals 436,594 11,625,952
India 6.5%ACC Ltd. . . . . . . . . . . . . . . . . . . . . . . . Construction Materials 118,800 3,222,984
aBajaj Holdings & Investment Ltd. . . . . . Diversified Financial Services 297,376 14,466,769aICICI Bank Ltd. . . . . . . . . . . . . . . . . . . Banks 7,709,981 65,607,450Infosys Ltd. . . . . . . . . . . . . . . . . . . . . . IT Services 1,532,533 32,405,470
115,702,673
Indonesia 0.5%Astra International Tbk. PT . . . . . . . . . Automobiles 28,852,600 9,847,178
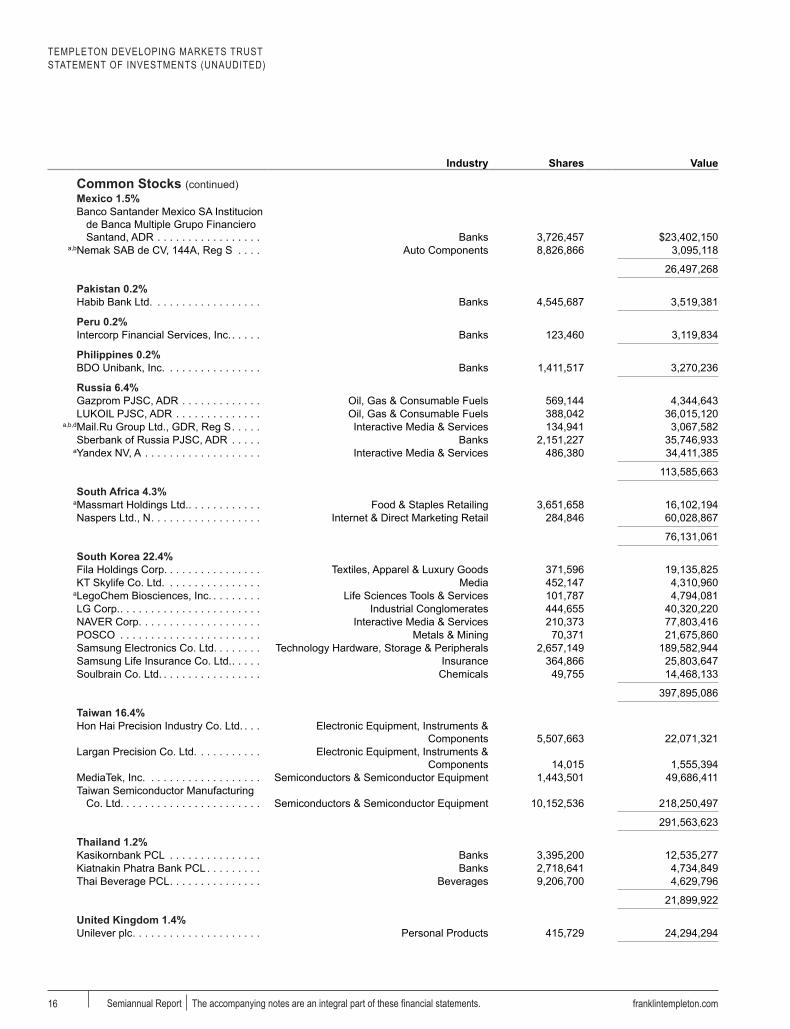
TEMPLETON DEVELOPING MARKETS TRUSTSTATEMENT OF INVESTMENTS (UNAUDITED)
franklintempleton.comSemiannual Report The accompanying notes are an integral part of these financial statements.16
a a Industry Shares a Value a
Common Stocks (continued) Mexico 1.5%Banco Santander Mexico SA Institucion
de Banca Multiple Grupo Financiero Santand, ADR . . . . . . . . . . . . . . . . . Banks 3,726,457 $23,402,150
a,bNemak SAB de CV, 144A, Reg S . . . . Auto Components 8,826,866 3,095,118
26,497,268
Pakistan 0.2%Habib Bank Ltd. . . . . . . . . . . . . . . . . . Banks 4,545,687 3,519,381
Peru 0.2%Intercorp Financial Services, Inc. . . . . . Banks 123,460 3,119,834
Philippines 0.2%BDO Unibank, Inc. . . . . . . . . . . . . . . . Banks 1,411,517 3,270,236
Russia 6.4%Gazprom PJSC, ADR . . . . . . . . . . . . . Oil, Gas & Consumable Fuels 569,144 4,344,643LUKOIL PJSC, ADR . . . . . . . . . . . . . . Oil, Gas & Consumable Fuels 388,042 36,015,120
a,b,dMail.Ru Group Ltd., GDR, Reg S . . . . . Interactive Media & Services 134,941 3,067,582Sberbank of Russia PJSC, ADR . . . . . Banks 2,151,227 35,746,933
aYandex NV, A . . . . . . . . . . . . . . . . . . . Interactive Media & Services 486,380 34,411,385
113,585,663
South Africa 4.3%aMassmart Holdings Ltd. . . . . . . . . . . . . Food & Staples Retailing 3,651,658 16,102,194Naspers Ltd., N . . . . . . . . . . . . . . . . . . Internet & Direct Marketing Retail 284,846 60,028,867
76,131,061
South Korea 22.4%Fila Holdings Corp. . . . . . . . . . . . . . . . Textiles, Apparel & Luxury Goods 371,596 19,135,825KT Skylife Co. Ltd. . . . . . . . . . . . . . . . Media 452,147 4,310,960
aLegoChem Biosciences, Inc. . . . . . . . . Life Sciences Tools & Services 101,787 4,794,081LG Corp. . . . . . . . . . . . . . . . . . . . . . . . Industrial Conglomerates 444,655 40,320,220NAVER Corp. . . . . . . . . . . . . . . . . . . . Interactive Media & Services 210,373 77,803,416POSCO . . . . . . . . . . . . . . . . . . . . . . . Metals & Mining 70,371 21,675,860Samsung Electronics Co. Ltd. . . . . . . . Technology Hardware, Storage & Peripherals 2,657,149 189,582,944Samsung Life Insurance Co. Ltd. . . . . . Insurance 364,866 25,803,647Soulbrain Co. Ltd. . . . . . . . . . . . . . . . . Chemicals 49,755 14,468,133
397,895,086
Taiwan 16.4%Hon Hai Precision Industry Co. Ltd. . . . Electronic Equipment, Instruments &
Components 5,507,663 22,071,321Largan Precision Co. Ltd. . . . . . . . . . . Electronic Equipment, Instruments &
Components 14,015 1,555,394MediaTek, Inc. . . . . . . . . . . . . . . . . . . Semiconductors & Semiconductor Equipment 1,443,501 49,686,411Taiwan Semiconductor Manufacturing
Co. Ltd. . . . . . . . . . . . . . . . . . . . . . . Semiconductors & Semiconductor Equipment 10,152,536 218,250,497
291,563,623
Thailand 1.2%Kasikornbank PCL . . . . . . . . . . . . . . . Banks 3,395,200 12,535,277Kiatnakin Phatra Bank PCL . . . . . . . . . Banks 2,718,641 4,734,849Thai Beverage PCL . . . . . . . . . . . . . . . Beverages 9,206,700 4,629,796
21,899,922
United Kingdom 1.4%Unilever plc . . . . . . . . . . . . . . . . . . . . . Personal Products 415,729 24,294,294
TEMPLETON DEVELOPING MARKETS TRUSTSTATEMENT OF INVESTMENTS (UNAUDITED)
franklintempleton.com The accompanying notes are an integral part of these financial statements. Semiannual Report 17
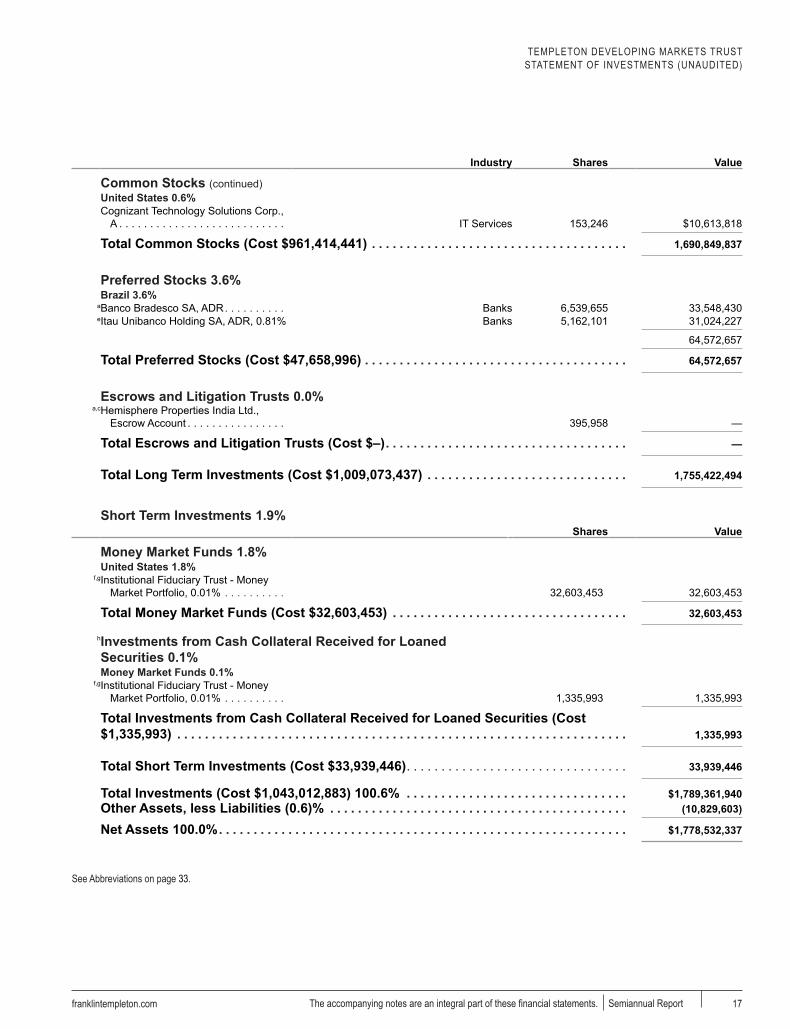
a a Industry Shares a Value a
Common Stocks (continued) United States 0.6%Cognizant Technology Solutions Corp.,
A . . . . . . . . . . . . . . . . . . . . . . . . . . . IT Services 153,246 $10,613,818
Total Common Stocks (Cost $961,414,441) . . . . . . . . . . . . . . . . . . . . . . . . . . . . . . . . . . . . . 1,690,849,837
a
Preferred Stocks 3.6% Brazil 3.6%
aBanco Bradesco SA, ADR . . . . . . . . . . Banks 6,539,655 33,548,430eItau Unibanco Holding SA, ADR, 0.81% Banks 5,162,101 31,024,227
64,572,657
Total Preferred Stocks (Cost $47,658,996) . . . . . . . . . . . . . . . . . . . . . . . . . . . . . . . . . . . . . . 64,572,657
a a a a a
Escrows and Litigation Trusts 0.0%a,cHemisphere Properties India Ltd.,
Escrow Account . . . . . . . . . . . . . . . . 395,958 —
Total Escrows and Litigation Trusts (Cost $–) . . . . . . . . . . . . . . . . . . . . . . . . . . . . . . . . . . . —
Total Long Term Investments (Cost $1,009,073,437) . . . . . . . . . . . . . . . . . . . . . . . . . . . . . 1,755,422,494
Short Term Investments 1.9%a a Industry Shares a Valuea a a a a a
Money Market Funds 1.8%United States 1.8%
f,gInstitutional Fiduciary Trust - Money Market Portfolio, 0.01% . . . . . . . . . . 32,603,453 32,603,453
Total Money Market Funds (Cost $32,603,453) . . . . . . . . . . . . . . . . . . . . . . . . . . . . . . . . . . 32,603,453
hInvestments from Cash Collateral Received for Loaned Securities 0.1%Money Market Funds 0.1%
f,gInstitutional Fiduciary Trust - Money Market Portfolio, 0.01% . . . . . . . . . . 1,335,993 1,335,993
Total Investments from Cash Collateral Received for Loaned Securities (Cost $1,335,993) . . . . . . . . . . . . . . . . . . . . . . . . . . . . . . . . . . . . . . . . . . . . . . . . . . . . . . . . . . . . . . . . . 1,335,993
a a a a a
Total Short Term Investments (Cost $33,939,446) . . . . . . . . . . . . . . . . . . . . . . . . . . . . . . . . 33,939,446a a a
a
Total Investments (Cost $1,043,012,883) 100.6% . . . . . . . . . . . . . . . . . . . . . . . . . . . . . . . . $1,789,361,940Other Assets, less Liabilities (0.6)% . . . . . . . . . . . . . . . . . . . . . . . . . . . . . . . . . . . . . . . . . . . (10,829,603)
Net Assets 100.0% . . . . . . . . . . . . . . . . . . . . . . . . . . . . . . . . . . . . . . . . . . . . . . . . . . . . . . . . . . . $1,778,532,337aa a
See Abbreviations on page 33.
TEMPLETON DEVELOPING MARKETS TRUSTSTATEMENT OF INVESTMENTS (UNAUDITED)
franklintempleton.comSemiannual Report The accompanying notes are an integral part of these financial statements.18
a Non-income producing.b Security was purchased pursuant to Rule 144A or Regulation S under the Securities Act of 1933. 144A securities may be sold in transactions exempt from registration only to qualified institutional buyers or in a public offering registered under the Securities Act of 1933. Regulation S securities cannot be sold in the United States without either an effective registration statement filed pursuant to the Securities Act of 1933, or pursuant to an exemption from registration. At June 30, 2021, the aggregate value of these securities was $8,380,948, representing 0.5% of net assets.c Fair valued using significant unobservable inputs. See Note 9 regarding fair value measurements.d A portion or all of the security is on loan at June 30, 2021. See Note 1(c).e Variable rate security. The rate shown represents the yield at period end.f See Note 3(f) regarding investments in affiliated management investment companies.g The rate shown is the annualized seven-day effective yield at period end.h See Note 1(c) regarding securities on loan.
TEMPLETON DEVELOPING MARKETS TRUSTFINANCIAL STATEMENTS
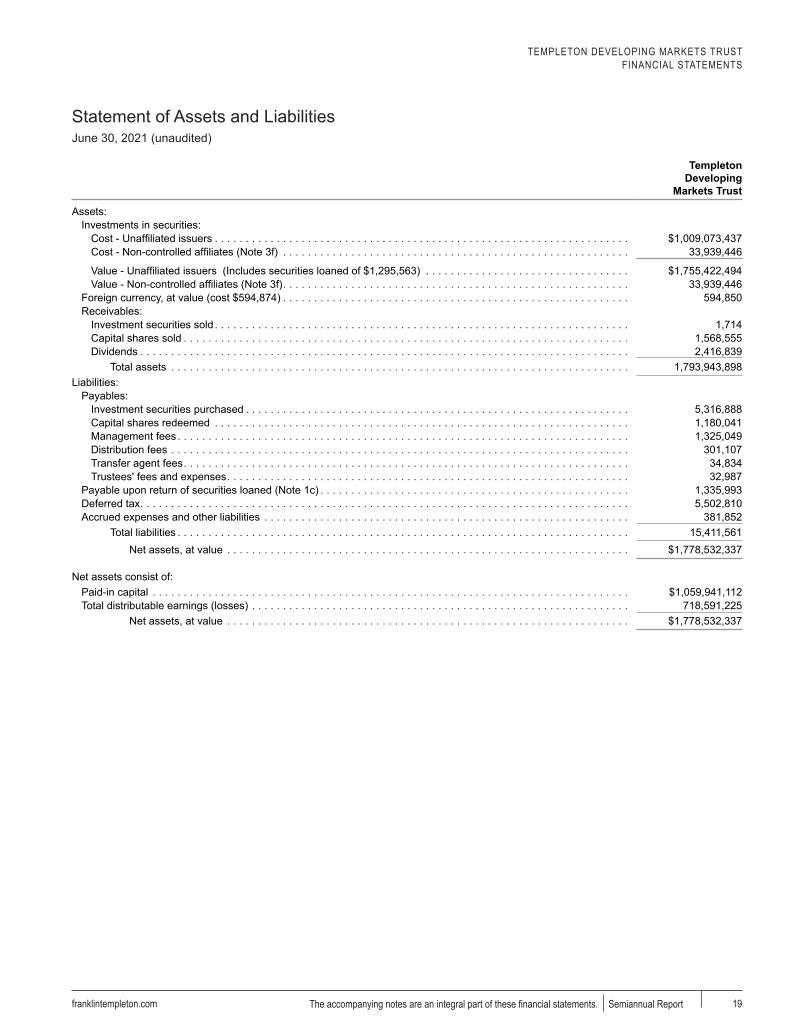
Statement of Assets and LiabilitiesJune 30, 2021 (unaudited)
franklintempleton.com The accompanying notes are an integral part of these financial statements. Semiannual Report 19
Templeton Developing
Markets Trust
Assets:Investments in securities:
Cost - Unaffiliated issuers . . . . . . . . . . . . . . . . . . . . . . . . . . . . . . . . . . . . . . . . . . . . . . . . . . . . . . . . . . . . . . . . . . . $1,009,073,437Cost - Non-controlled affiliates (Note 3f) . . . . . . . . . . . . . . . . . . . . . . . . . . . . . . . . . . . . . . . . . . . . . . . . . . . . . . . . 33,939,446
Value - Unaffiliated issuers (Includes securities loaned of $1,295,563) . . . . . . . . . . . . . . . . . . . . . . . . . . . . . . . . . $1,755,422,494Value - Non-controlled affiliates (Note 3f) . . . . . . . . . . . . . . . . . . . . . . . . . . . . . . . . . . . . . . . . . . . . . . . . . . . . . . . . 33,939,446
Foreign currency, at value (cost $594,874) . . . . . . . . . . . . . . . . . . . . . . . . . . . . . . . . . . . . . . . . . . . . . . . . . . . . . . . . 594,850Receivables:
Investment securities sold . . . . . . . . . . . . . . . . . . . . . . . . . . . . . . . . . . . . . . . . . . . . . . . . . . . . . . . . . . . . . . . . . . . 1,714Capital shares sold . . . . . . . . . . . . . . . . . . . . . . . . . . . . . . . . . . . . . . . . . . . . . . . . . . . . . . . . . . . . . . . . . . . . . . . . 1,568,555Dividends . . . . . . . . . . . . . . . . . . . . . . . . . . . . . . . . . . . . . . . . . . . . . . . . . . . . . . . . . . . . . . . . . . . . . . . . . . . . . . . 2,416,839
Total assets . . . . . . . . . . . . . . . . . . . . . . . . . . . . . . . . . . . . . . . . . . . . . . . . . . . . . . . . . . . . . . . . . . . . . . . . . . 1,793,943,898Liabilities:
Payables:Investment securities purchased . . . . . . . . . . . . . . . . . . . . . . . . . . . . . . . . . . . . . . . . . . . . . . . . . . . . . . . . . . . . . . 5,316,888Capital shares redeemed . . . . . . . . . . . . . . . . . . . . . . . . . . . . . . . . . . . . . . . . . . . . . . . . . . . . . . . . . . . . . . . . . . . 1,180,041Management fees . . . . . . . . . . . . . . . . . . . . . . . . . . . . . . . . . . . . . . . . . . . . . . . . . . . . . . . . . . . . . . . . . . . . . . . . . 1,325,049Distribution fees . . . . . . . . . . . . . . . . . . . . . . . . . . . . . . . . . . . . . . . . . . . . . . . . . . . . . . . . . . . . . . . . . . . . . . . . . . 301,107Transfer agent fees . . . . . . . . . . . . . . . . . . . . . . . . . . . . . . . . . . . . . . . . . . . . . . . . . . . . . . . . . . . . . . . . . . . . . . . . 34,834Trustees' fees and expenses . . . . . . . . . . . . . . . . . . . . . . . . . . . . . . . . . . . . . . . . . . . . . . . . . . . . . . . . . . . . . . . . . 32,987
Payable upon return of securities loaned (Note 1c) . . . . . . . . . . . . . . . . . . . . . . . . . . . . . . . . . . . . . . . . . . . . . . . . . . 1,335,993Deferred tax . . . . . . . . . . . . . . . . . . . . . . . . . . . . . . . . . . . . . . . . . . . . . . . . . . . . . . . . . . . . . . . . . . . . . . . . . . . . . . . 5,502,810Accrued expenses and other liabilities . . . . . . . . . . . . . . . . . . . . . . . . . . . . . . . . . . . . . . . . . . . . . . . . . . . . . . . . . . . 381,852
Total liabilities . . . . . . . . . . . . . . . . . . . . . . . . . . . . . . . . . . . . . . . . . . . . . . . . . . . . . . . . . . . . . . . . . . . . . . . . . 15,411,561Net assets, at value . . . . . . . . . . . . . . . . . . . . . . . . . . . . . . . . . . . . . . . . . . . . . . . . . . . . . . . . . . . . . . . . . $1,778,532,337
Net assets consist of:Paid-in capital . . . . . . . . . . . . . . . . . . . . . . . . . . . . . . . . . . . . . . . . . . . . . . . . . . . . . . . . . . . . . . . . . . . . . . . . . . . . . $1,059,941,112Total distributable earnings (losses) . . . . . . . . . . . . . . . . . . . . . . . . . . . . . . . . . . . . . . . . . . . . . . . . . . . . . . . . . . . . . 718,591,225
Net assets, at value . . . . . . . . . . . . . . . . . . . . . . . . . . . . . . . . . . . . . . . . . . . . . . . . . . . . . . . . . . . . . . . . . $1,778,532,337
TEMPLETON DEVELOPING MARKETS TRUSTFINANCIAL STATEMENTS
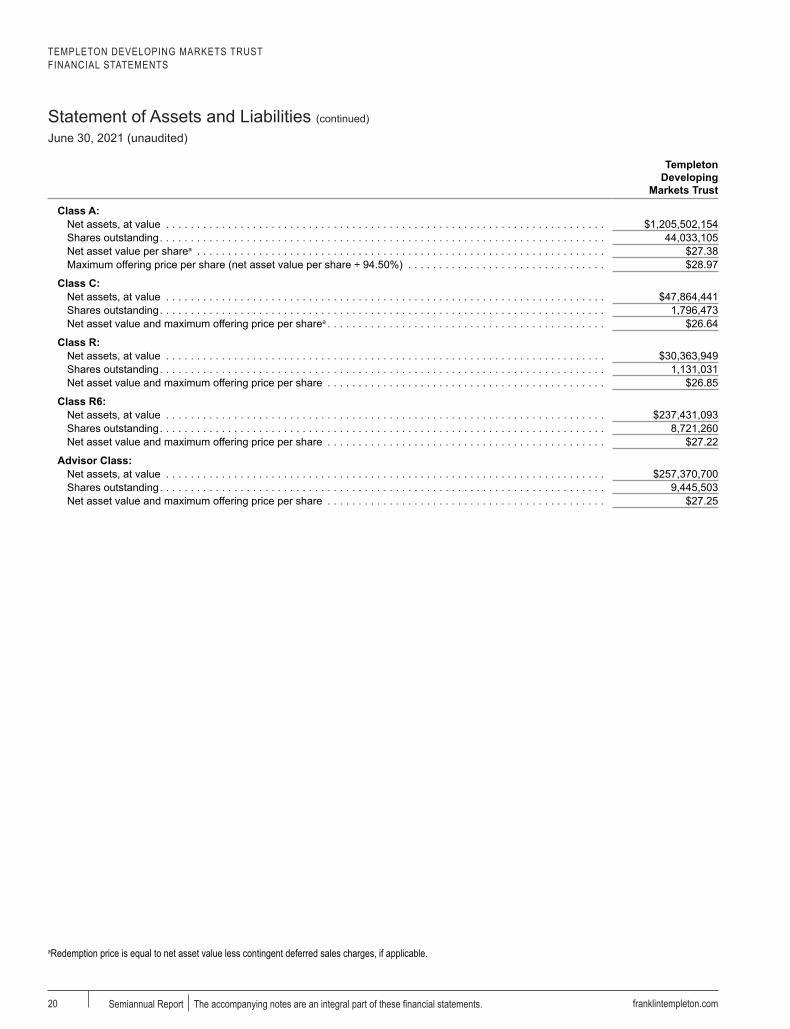
Statement of Assets and Liabilities (continued)
June 30, 2021 (unaudited)
franklintempleton.comSemiannual Report The accompanying notes are an integral part of these financial statements.20
Templeton Developing
Markets Trust
Class A:Net assets, at value . . . . . . . . . . . . . . . . . . . . . . . . . . . . . . . . . . . . . . . . . . . . . . . . . . . . . . . . . . . . . . . . . . . . . . . $1,205,502,154Shares outstanding . . . . . . . . . . . . . . . . . . . . . . . . . . . . . . . . . . . . . . . . . . . . . . . . . . . . . . . . . . . . . . . . . . . . . . . . 44,033,105Net asset value per sharea . . . . . . . . . . . . . . . . . . . . . . . . . . . . . . . . . . . . . . . . . . . . . . . . . . . . . . . . . . . . . . . . . . $27.38Maximum offering price per share (net asset value per share ÷ 94.50%) . . . . . . . . . . . . . . . . . . . . . . . . . . . . . . . . $28.97
Class C:Net assets, at value . . . . . . . . . . . . . . . . . . . . . . . . . . . . . . . . . . . . . . . . . . . . . . . . . . . . . . . . . . . . . . . . . . . . . . . $47,864,441Shares outstanding . . . . . . . . . . . . . . . . . . . . . . . . . . . . . . . . . . . . . . . . . . . . . . . . . . . . . . . . . . . . . . . . . . . . . . . . 1,796,473Net asset value and maximum offering price per sharea . . . . . . . . . . . . . . . . . . . . . . . . . . . . . . . . . . . . . . . . . . . . . $26.64
Class R:Net assets, at value . . . . . . . . . . . . . . . . . . . . . . . . . . . . . . . . . . . . . . . . . . . . . . . . . . . . . . . . . . . . . . . . . . . . . . . $30,363,949Shares outstanding . . . . . . . . . . . . . . . . . . . . . . . . . . . . . . . . . . . . . . . . . . . . . . . . . . . . . . . . . . . . . . . . . . . . . . . . 1,131,031Net asset value and maximum offering price per share . . . . . . . . . . . . . . . . . . . . . . . . . . . . . . . . . . . . . . . . . . . . . $26.85
Class R6:Net assets, at value . . . . . . . . . . . . . . . . . . . . . . . . . . . . . . . . . . . . . . . . . . . . . . . . . . . . . . . . . . . . . . . . . . . . . . . $237,431,093Shares outstanding . . . . . . . . . . . . . . . . . . . . . . . . . . . . . . . . . . . . . . . . . . . . . . . . . . . . . . . . . . . . . . . . . . . . . . . . 8,721,260Net asset value and maximum offering price per share . . . . . . . . . . . . . . . . . . . . . . . . . . . . . . . . . . . . . . . . . . . . . $27.22
Advisor Class:Net assets, at value . . . . . . . . . . . . . . . . . . . . . . . . . . . . . . . . . . . . . . . . . . . . . . . . . . . . . . . . . . . . . . . . . . . . . . . $257,370,700Shares outstanding . . . . . . . . . . . . . . . . . . . . . . . . . . . . . . . . . . . . . . . . . . . . . . . . . . . . . . . . . . . . . . . . . . . . . . . . 9,445,503Net asset value and maximum offering price per share . . . . . . . . . . . . . . . . . . . . . . . . . . . . . . . . . . . . . . . . . . . . . $27.25
aRedemption price is equal to net asset value less contingent deferred sales charges, if applicable.

TEMPLETON DEVELOPING MARKETS TRUSTFINANCIAL STATEMENTS
Statement of Operationsfor the six months ended June 30, 2021 (unaudited)
franklintempleton.com The accompanying notes are an integral part of these financial statements. Semiannual Report 21
Templeton Developing
Markets Trust
Investment income:Dividends: (net of foreign taxes of $2,142,004)
Unaffiliated issuers . . . . . . . . . . . . . . . . . . . . . . . . . . . . . . . . . . . . . . . . . . . . . . . . . . . . . . . . . . . . . . . . . . . . . . . . $16,419,413Non-controlled affiliates (Note 3f) . . . . . . . . . . . . . . . . . . . . . . . . . . . . . . . . . . . . . . . . . . . . . . . . . . . . . . . . . . . . . 560
Income from securities loaned:Unaffiliated entities (net of fees and rebates) . . . . . . . . . . . . . . . . . . . . . . . . . . . . . . . . . . . . . . . . . . . . . . . . . . . . . 88,324Non-controlled affiliates (Note 3f) . . . . . . . . . . . . . . . . . . . . . . . . . . . . . . . . . . . . . . . . . . . . . . . . . . . . . . . . . . . . . 16
Total investment income . . . . . . . . . . . . . . . . . . . . . . . . . . . . . . . . . . . . . . . . . . . . . . . . . . . . . . . . . . . . . . . . . . . 16,508,313Expenses:
Management fees (Note 3a) . . . . . . . . . . . . . . . . . . . . . . . . . . . . . . . . . . . . . . . . . . . . . . . . . . . . . . . . . . . . . . . . . . . 9,011,662Distribution fees: (Note 3c) Class A . . . . . . . . . . . . . . . . . . . . . . . . . . . . . . . . . . . . . . . . . . . . . . . . . . . . . . . . . . . . . . . . . . . . . . . . . . . . . . . . 1,503,239 Class C . . . . . . . . . . . . . . . . . . . . . . . . . . . . . . . . . . . . . . . . . . . . . . . . . . . . . . . . . . . . . . . . . . . . . . . . . . . . . . . . 246,501 Class R . . . . . . . . . . . . . . . . . . . . . . . . . . . . . . . . . . . . . . . . . . . . . . . . . . . . . . . . . . . . . . . . . . . . . . . . . . . . . . . . 67,684Transfer agent fees: (Note 3e) Class A . . . . . . . . . . . . . . . . . . . . . . . . . . . . . . . . . . . . . . . . . . . . . . . . . . . . . . . . . . . . . . . . . . . . . . . . . . . . . . . . 1,033,431 Class C . . . . . . . . . . . . . . . . . . . . . . . . . . . . . . . . . . . . . . . . . . . . . . . . . . . . . . . . . . . . . . . . . . . . . . . . . . . . . . . . 42,459 Class R . . . . . . . . . . . . . . . . . . . . . . . . . . . . . . . . . . . . . . . . . . . . . . . . . . . . . . . . . . . . . . . . . . . . . . . . . . . . . . . . 22,773 Class R6 . . . . . . . . . . . . . . . . . . . . . . . . . . . . . . . . . . . . . . . . . . . . . . . . . . . . . . . . . . . . . . . . . . . . . . . . . . . . . . . 34,798 Advisor Class . . . . . . . . . . . . . . . . . . . . . . . . . . . . . . . . . . . . . . . . . . . . . . . . . . . . . . . . . . . . . . . . . . . . . . . . . . . . 215,859Custodian fees . . . . . . . . . . . . . . . . . . . . . . . . . . . . . . . . . . . . . . . . . . . . . . . . . . . . . . . . . . . . . . . . . . . . . . . . . . . . . 160,173Reports to shareholders . . . . . . . . . . . . . . . . . . . . . . . . . . . . . . . . . . . . . . . . . . . . . . . . . . . . . . . . . . . . . . . . . . . . . . 148,679Registration and filing fees . . . . . . . . . . . . . . . . . . . . . . . . . . . . . . . . . . . . . . . . . . . . . . . . . . . . . . . . . . . . . . . . . . . . 59,623Professional fees . . . . . . . . . . . . . . . . . . . . . . . . . . . . . . . . . . . . . . . . . . . . . . . . . . . . . . . . . . . . . . . . . . . . . . . . . . . 63,601Trustees' fees and expenses . . . . . . . . . . . . . . . . . . . . . . . . . . . . . . . . . . . . . . . . . . . . . . . . . . . . . . . . . . . . . . . . . . 98,133Other . . . . . . . . . . . . . . . . . . . . . . . . . . . . . . . . . . . . . . . . . . . . . . . . . . . . . . . . . . . . . . . . . . . . . . . . . . . . . . . . . . . . 25,589
Total expenses . . . . . . . . . . . . . . . . . . . . . . . . . . . . . . . . . . . . . . . . . . . . . . . . . . . . . . . . . . . . . . . . . . . . . . . . . 12,734,204Expenses waived/paid by affiliates (Note 3f and 3g) . . . . . . . . . . . . . . . . . . . . . . . . . . . . . . . . . . . . . . . . . . . . . . (1,163,262)
Net expenses . . . . . . . . . . . . . . . . . . . . . . . . . . . . . . . . . . . . . . . . . . . . . . . . . . . . . . . . . . . . . . . . . . . . . . . . . 11,570,942Net investment income . . . . . . . . . . . . . . . . . . . . . . . . . . . . . . . . . . . . . . . . . . . . . . . . . . . . . . . . . . . . . . . . 4,937,371
Realized and unrealized gains (losses):Net realized gain (loss) from:
Investments: (net of foreign taxes of $143,115)Unaffiliated issuers . . . . . . . . . . . . . . . . . . . . . . . . . . . . . . . . . . . . . . . . . . . . . . . . . . . . . . . . . . . . . . . . . . . . . . 47,335,862
Foreign currency transactions . . . . . . . . . . . . . . . . . . . . . . . . . . . . . . . . . . . . . . . . . . . . . . . . . . . . . . . . . . . . . . . . (321,309)Net realized gain (loss) . . . . . . . . . . . . . . . . . . . . . . . . . . . . . . . . . . . . . . . . . . . . . . . . . . . . . . . . . . . . . . . . . . 47,014,553
Net change in unrealized appreciation (depreciation) on:Investments:
Unaffiliated issuers . . . . . . . . . . . . . . . . . . . . . . . . . . . . . . . . . . . . . . . . . . . . . . . . . . . . . . . . . . . . . . . . . . . . . . 77,978,699Translation of other assets and liabilities denominated in foreign currencies . . . . . . . . . . . . . . . . . . . . . . . . . . . . . . (36,550)Change in deferred taxes on unrealized appreciation . . . . . . . . . . . . . . . . . . . . . . . . . . . . . . . . . . . . . . . . . . . . . . . (2,264,138)
Net change in unrealized appreciation (depreciation) . . . . . . . . . . . . . . . . . . . . . . . . . . . . . . . . . . . . . . . . . . . . 75,678,011Net realized and unrealized gain (loss) . . . . . . . . . . . . . . . . . . . . . . . . . . . . . . . . . . . . . . . . . . . . . . . . . . . . . . . . . . . . 122,692,564Net increase (decrease) in net assets resulting from operations . . . . . . . . . . . . . . . . . . . . . . . . . . . . . . . . . . . . . . . . . . $127,629,935
TEMPLETON DEVELOPING MARKETS TRUSTFINANCIAL STATEMENTS
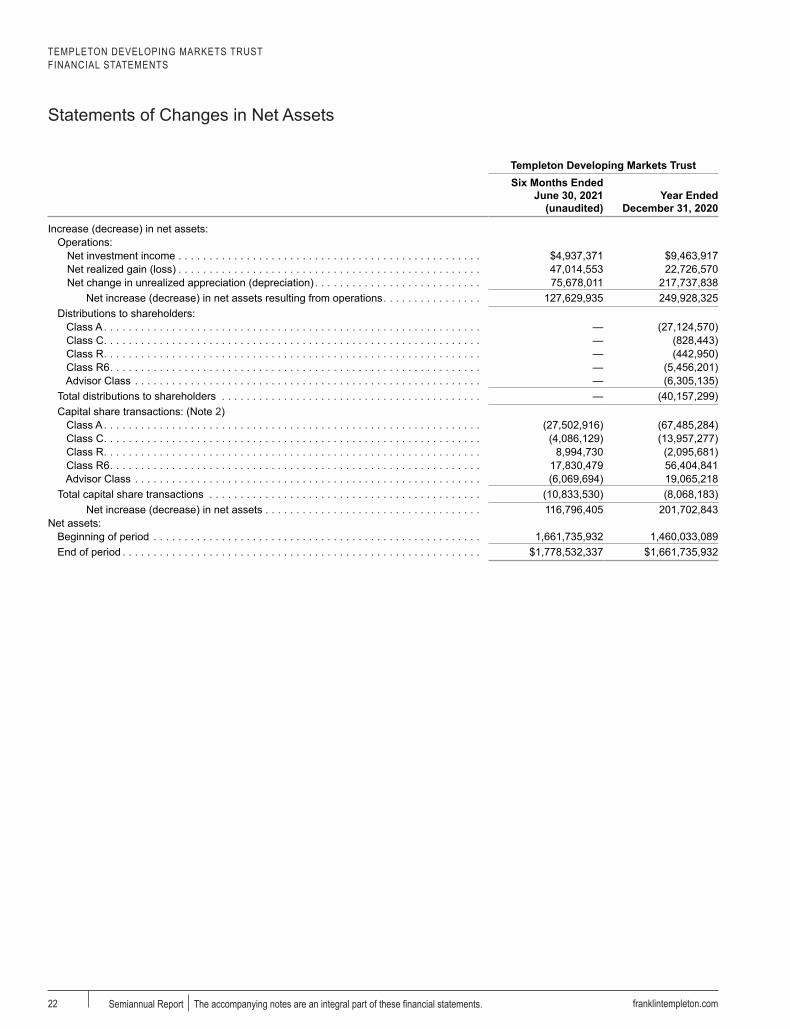
Statements of Changes in Net Assets
franklintempleton.comSemiannual Report The accompanying notes are an integral part of these financial statements.22
Templeton Developing Markets TrustSix Months Ended
June 30, 2021 (unaudited)
Year Ended December 31, 2020
Increase (decrease) in net assets:Operations:
Net investment income . . . . . . . . . . . . . . . . . . . . . . . . . . . . . . . . . . . . . . . . . . . . . . . . . $4,937,371 $9,463,917Net realized gain (loss) . . . . . . . . . . . . . . . . . . . . . . . . . . . . . . . . . . . . . . . . . . . . . . . . . 47,014,553 22,726,570Net change in unrealized appreciation (depreciation) . . . . . . . . . . . . . . . . . . . . . . . . . . . 75,678,011 217,737,838
Net increase (decrease) in net assets resulting from operations . . . . . . . . . . . . . . . . 127,629,935 249,928,325Distributions to shareholders: Class A . . . . . . . . . . . . . . . . . . . . . . . . . . . . . . . . . . . . . . . . . . . . . . . . . . . . . . . . . . . . . — (27,124,570) Class C . . . . . . . . . . . . . . . . . . . . . . . . . . . . . . . . . . . . . . . . . . . . . . . . . . . . . . . . . . . . . — (828,443) Class R . . . . . . . . . . . . . . . . . . . . . . . . . . . . . . . . . . . . . . . . . . . . . . . . . . . . . . . . . . . . . — (442,950) Class R6 . . . . . . . . . . . . . . . . . . . . . . . . . . . . . . . . . . . . . . . . . . . . . . . . . . . . . . . . . . . . — (5,456,201) Advisor Class . . . . . . . . . . . . . . . . . . . . . . . . . . . . . . . . . . . . . . . . . . . . . . . . . . . . . . . . — (6,305,135)Total distributions to shareholders . . . . . . . . . . . . . . . . . . . . . . . . . . . . . . . . . . . . . . . . . . — (40,157,299)Capital share transactions: (Note 2) Class A . . . . . . . . . . . . . . . . . . . . . . . . . . . . . . . . . . . . . . . . . . . . . . . . . . . . . . . . . . . . . (27,502,916) (67,485,284) Class C . . . . . . . . . . . . . . . . . . . . . . . . . . . . . . . . . . . . . . . . . . . . . . . . . . . . . . . . . . . . . (4,086,129) (13,957,277) Class R . . . . . . . . . . . . . . . . . . . . . . . . . . . . . . . . . . . . . . . . . . . . . . . . . . . . . . . . . . . . . 8,994,730 (2,095,681) Class R6 . . . . . . . . . . . . . . . . . . . . . . . . . . . . . . . . . . . . . . . . . . . . . . . . . . . . . . . . . . . . 17,830,479 56,404,841 Advisor Class . . . . . . . . . . . . . . . . . . . . . . . . . . . . . . . . . . . . . . . . . . . . . . . . . . . . . . . . (6,069,694) 19,065,218Total capital share transactions . . . . . . . . . . . . . . . . . . . . . . . . . . . . . . . . . . . . . . . . . . . . (10,833,530) (8,068,183)
Net increase (decrease) in net assets . . . . . . . . . . . . . . . . . . . . . . . . . . . . . . . . . . . 116,796,405 201,702,843Net assets:
Beginning of period . . . . . . . . . . . . . . . . . . . . . . . . . . . . . . . . . . . . . . . . . . . . . . . . . . . . . 1,661,735,932 1,460,033,089End of period . . . . . . . . . . . . . . . . . . . . . . . . . . . . . . . . . . . . . . . . . . . . . . . . . . . . . . . . . . $1,778,532,337 $1,661,735,932
TEMPLETON DEVELOPING MARKETS TRUST
23franklintempleton.com Semiannual Report
Notes to Financial Statements (unaudited)
1.OrganizationandSignificantAccountingPolicies
Templeton Developing Markets Trust (Fund) is registered under the Investment Company Act of 1940 (1940 Act) as an open-end management investment company and applies the specialized accounting and reporting guidance in U.S. Generally Accepted Accounting Principles (U.S. GAAP). The Fund offers five classes of shares: Class A, Class C, Class R, Class R6 and Advisor Class. Class C shares automatically convert to Class A shares after they have been held for 10 years. Each class of shares may differ by its initial sales load, contingent deferred sales charges, voting rights on matters affecting a single class, its exchange privilege and fees due to differing arrangements for distribution and transfer agent fees.
The following summarizes the Fund's significant accounting policies.
a. Financial Instrument Valuation The Fund's investments in financial instruments are carried at fair value daily. Fair value is the price that would be received to sell an asset or paid to transfer a liability in an orderly transaction between market participants on the measurement date. The Fund calculates the net asset value (NAV) per share each business day as of 4 p.m. Eastern time or the regularly scheduled close of the New York Stock Exchange (NYSE), whichever is earlier. Under compliance policies and procedures approved by the Fund's Board of Trustees (the Board), the Fund's administrator has responsibility for oversight of valuation, including leading the cross-functional Valuation Committee (VC). The Fund may utilize independent pricing services, quotations from securities and financial instrument dealers, and other market sources to determine fair value.
Equity securities listed on an exchange or on the NASDAQ National Market System are valued at the last quoted sale price or the official closing price of the day, respectively. Foreign equity securities are valued as of the close of trading on the foreign stock exchange on which the security is primarily traded, or as of 4 p.m. Eastern time. The value is then converted into its U.S. dollar equivalent at the foreign exchange rate in effect at 4 p.m. Eastern time on the day that the value of the security is determined. Over-the-counter (OTC) securities are valued within the range of the most recent quoted bid and ask prices. Securities that trade in multiple markets or on multiple exchanges are valued
according to the broadest and most representative market. Certain equity securities are valued based upon fundamental characteristics or relationships to similar securities.
Investments in open-end mutual funds are valued at the closing NAV.
The Fund has procedures to determine the fair value of financial instruments for which market prices are not reliable or readily available. Under these procedures, the Fund primarily employs a market-based approach which may use related or comparable assets or liabilities, recent transactions, market multiples, book values, and other relevant information for the investment to determine the fair value of the investment. An income-based valuation approach may also be used in which the anticipated future cash flows of the investment are discounted to calculate fair value. Discounts may also be applied due to the nature or duration of any restrictions on the disposition of the investments. Due to the inherent uncertainty of valuations of such investments, the fair values may differ significantly from the values that would have been used had an active market existed.
Trading in securities on foreign securities stock exchanges and OTC markets may be completed before 4 p.m. Eastern time. In addition, trading in certain foreign markets may not take place on every Fund's business day. Events can occur between the time at which trading in a foreign security is completed and 4 p.m. Eastern time that might call into question the reliability of the value of a portfolio security held by the Fund. As a result, differences may arise between the value of the Fund's portfolio securities as determined at the foreign market close and the latest indications of value at 4 p.m. Eastern time. In order to minimize the potential for these differences, an independent pricing service may be used to adjust the value of the Fund's portfolio securities to the latest indications of fair value at 4 p.m. Eastern time. At June 30, 2021, certain securities may have been fair valued using these procedures, in which case the securities were categorized as Level 2 inputs within the fair value hierarchy (referred to as “market level fair value”). See the Fair Value Measurements note for more information.
When the last day of the reporting period is a non-business day, certain foreign markets may be open on those days that the Fund's NAV is not calculated, which could result in differences between the value of the Fund's portfolio securities on the last business day and the last calendar day
TEMPLETON DEVELOPING MARKETS TRUSTNOTES TO FINANCIAL STATEMENTS (UNAUDITED)
24 franklintempleton.comSemiannual Report
of the reporting period. Any security valuation changes due to an open foreign market are adjusted and reflected by the Fund for financial reporting purposes.
b. Foreign Currency Translation Portfolio securities and other assets and liabilities denominated in foreign currencies are translated into U.S. dollars based on the exchange rate of such currencies against U.S. dollars on the date of valuation. The Fund may enter into foreign currency exchange contracts to facilitate transactions denominated in a foreign currency. Purchases and sales of securities, income and expense items denominated in foreign currencies are translated into U.S. dollars at the exchange rate in effect on the transaction date. Portfolio securities and assets and liabilities denominated in foreign currencies contain risks that those currencies will decline in value relative to the U.S. dollar. Occasionally, events may impact the availability or reliability of foreign exchange rates used to convert the U.S. dollar equivalent value. If such an event occurs, the foreign exchange rate will be valued at fair value using procedures established and approved by the Board.
The Fund does not separately report the effect of changes in foreign exchange rates from changes in market prices on securities held. Such changes are included in net realized and unrealized gain or loss from investments in the Statement of Operations.
Realized foreign exchange gains or losses arise from sales of foreign currencies, currency gains or losses realized between the trade and settlement dates on securities transactions and the difference between the recorded amounts of dividends, interest, and foreign withholding taxes and the U.S. dollar equivalent of the amounts actually received or paid. Net unrealized foreign exchange gains and losses arise from changes in foreign exchange rates on foreign denominated assets and liabilities other than investments in securities held at the end of the reporting period.
c. Securities LendingThe Fund participates in an agency based securities lending program to earn additional income. The Fund receives collateral in the form of cash and/or U.S. Government and Agency securities against the loaned securities in an amount equal to at least 102% of the fair value of the loaned securities. Collateral is maintained over the life of the loan in an amount not less than 100% of the fair value of loaned securities, as determined at the close of Fund business each day; any additional collateral required due to changes in security values is delivered to the Fund on the next business day. Any cash collateral received is deposited into a joint cash account with other funds and is used to invest in a money market fund managed by Franklin Advisers, Inc., an affiliate of the Fund. The Fund may receive income from the investment of cash collateral, in addition to lending fees and rebates paid by the borrower. Income from securities loaned, net of fees paid to the securities lending agent and/or third-party vendor, is reported separately in the Statement of Operations. The Fund bears the market risk with respect to any cash collateral investment, securities loaned, and the risk that the agent may default on its obligations to the Fund. If the borrower defaults on its obligation to return the securities loaned, the Fund has the right to repurchase the securities in the open market using the collateral received. The securities lending agent has agreed to indemnify the Fund in the event of default by a third party borrower.
d. Income and Deferred Taxes It is the Fund's policy to qualify as a regulated investment company under the Internal Revenue Code. The Fund intends to distribute to shareholders substantially all of its taxable income and net realized gains to relieve it from federal income and excise taxes. As a result, no provision for U.S. federal income taxes is required.
The Fund may be subject to foreign taxation related to income received, capital gains on the sale of securities and certain foreign currency transactions in the foreign jurisdictions in which it invests. Foreign taxes, if any, are recorded based on the tax regulations and rates that exist in the foreign markets in which the Fund invests. When a capital gain tax is determined to apply, the Fund records an estimated deferred tax liability in an amount that would be payable if the securities were disposed of on the valuation date.
1.OrganizationandSignificantAccountingPolicies (continued)
a. Financial Instrument Valuation (continued)
TEMPLETON DEVELOPING MARKETS TRUSTNOTES TO FINANCIAL STATEMENTS (UNAUDITED)
25franklintempleton.com Semiannual Report
The Fund may recognize an income tax liability related to its uncertain tax positions under U.S. GAAP when the uncertain tax position has a less than 50% probability that it will be sustained upon examination by the tax authorities based on its technical merits. As of June 30, 2021, the Fund has determined that no tax liability is required in its financial statements related to uncertain tax positions for any open tax years (or expected to be taken in future tax years). Open tax years are those that remain subject to examination and are based on the statute of limitations in each jurisdiction in which the Fund invests.
e. Security Transactions, Investment Income, Expenses and DistributionsSecurity transactions are accounted for on trade date. Realized gains and losses on security transactions are determined on a specific identification basis. Estimated expenses are accrued daily. Dividend income is recorded on the ex-dividend date except for certain dividends from securities where the dividend rate is not available. In such cases, the dividend is recorded as soon as the information is received by the Fund. Distributions to shareholders are recorded on the ex-dividend date. Distributable earnings are determined according to income tax regulations (tax basis) and may differ from earnings recorded in accordance with U.S. GAAP. These differences may be permanent or temporary. Permanent differences are reclassified among capital accounts to reflect their tax character. These reclassifications have no impact on net assets or the results of operations. Temporary differences are not reclassified, as they may reverse in subsequent periods.
Realized and unrealized gains and losses and net investment income, excluding class specific expenses, are allocated daily to each class of shares based upon the relative proportion of net assets of each class. Differences in per share distributions by class are generally due to differences in class specific expenses.
f. Accounting EstimatesThe preparation of financial statements in accordance with U.S. GAAP requires management to make estimates and assumptions that affect the reported amounts of assets and liabilities at the date of the financial statements and the amounts of income and expenses during the reporting period. Actual results could differ from those estimates.
g.GuaranteesandIndemnificationsUnder the Fund's organizational documents, its officers and trustees are indemnified by the Fund against certain liabilities arising out of the performance of their duties to the Fund. Additionally, in the normal course of business, the Fund, enters into contracts with service providers that contain general indemnification clauses. The Fund's maximum exposure under these arrangements is unknown as this would involve future claims that may be made against the Fund that have not yet occurred. Currently, the Fund expects the risk of loss to be remote.
1.OrganizationandSignificantAccountingPolicies (continued)
d. Income and Deferred Taxes (continued)
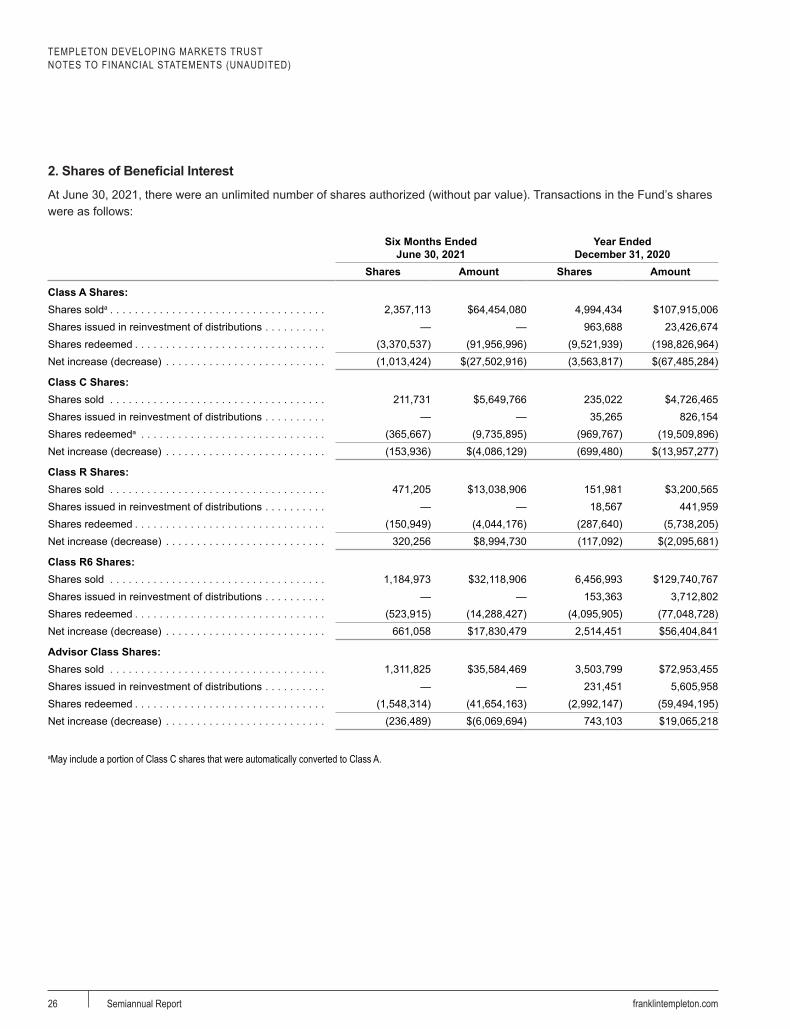
TEMPLETON DEVELOPING MARKETS TRUSTNOTES TO FINANCIAL STATEMENTS (UNAUDITED)
26 franklintempleton.comSemiannual Report
2.SharesofBeneficialInterest
At June 30, 2021, there were an unlimited number of shares authorized (without par value). Transactions in the Fund’s shares were as follows:
Six Months Ended June 30, 2021
Year Ended December 31, 2020
Shares Amount Shares Amount
Class A Shares:Shares solda . . . . . . . . . . . . . . . . . . . . . . . . . . . . . . . . . . . 2,357,113 $64,454,080 4,994,434 $107,915,006Shares issued in reinvestment of distributions . . . . . . . . . . — — 963,688 23,426,674Shares redeemed . . . . . . . . . . . . . . . . . . . . . . . . . . . . . . . (3,370,537) (91,956,996) (9,521,939) (198,826,964)Net increase (decrease) . . . . . . . . . . . . . . . . . . . . . . . . . . (1,013,424) $(27,502,916) (3,563,817) $(67,485,284)
Class C Shares:Shares sold . . . . . . . . . . . . . . . . . . . . . . . . . . . . . . . . . . . 211,731 $5,649,766 235,022 $4,726,465Shares issued in reinvestment of distributions . . . . . . . . . . — — 35,265 826,154Shares redeemeda . . . . . . . . . . . . . . . . . . . . . . . . . . . . . . (365,667) (9,735,895) (969,767) (19,509,896)Net increase (decrease) . . . . . . . . . . . . . . . . . . . . . . . . . . (153,936) $(4,086,129) (699,480) $(13,957,277)
Class R Shares:Shares sold . . . . . . . . . . . . . . . . . . . . . . . . . . . . . . . . . . . 471,205 $13,038,906 151,981 $3,200,565Shares issued in reinvestment of distributions . . . . . . . . . . — — 18,567 441,959Shares redeemed . . . . . . . . . . . . . . . . . . . . . . . . . . . . . . . (150,949) (4,044,176) (287,640) (5,738,205)Net increase (decrease) . . . . . . . . . . . . . . . . . . . . . . . . . . 320,256 $8,994,730 (117,092) $(2,095,681)
Class R6 Shares:Shares sold . . . . . . . . . . . . . . . . . . . . . . . . . . . . . . . . . . . 1,184,973 $32,118,906 6,456,993 $129,740,767Shares issued in reinvestment of distributions . . . . . . . . . . — — 153,363 3,712,802Shares redeemed . . . . . . . . . . . . . . . . . . . . . . . . . . . . . . . (523,915) (14,288,427) (4,095,905) (77,048,728)Net increase (decrease) . . . . . . . . . . . . . . . . . . . . . . . . . . 661,058 $17,830,479 2,514,451 $56,404,841
Advisor Class Shares:Shares sold . . . . . . . . . . . . . . . . . . . . . . . . . . . . . . . . . . . 1,311,825 $35,584,469 3,503,799 $72,953,455Shares issued in reinvestment of distributions . . . . . . . . . . — — 231,451 5,605,958Shares redeemed . . . . . . . . . . . . . . . . . . . . . . . . . . . . . . . (1,548,314) (41,654,163) (2,992,147) (59,494,195)Net increase (decrease) . . . . . . . . . . . . . . . . . . . . . . . . . . (236,489) $(6,069,694) 743,103 $19,065,218
aMay include a portion of Class C shares that were automatically converted to Class A.
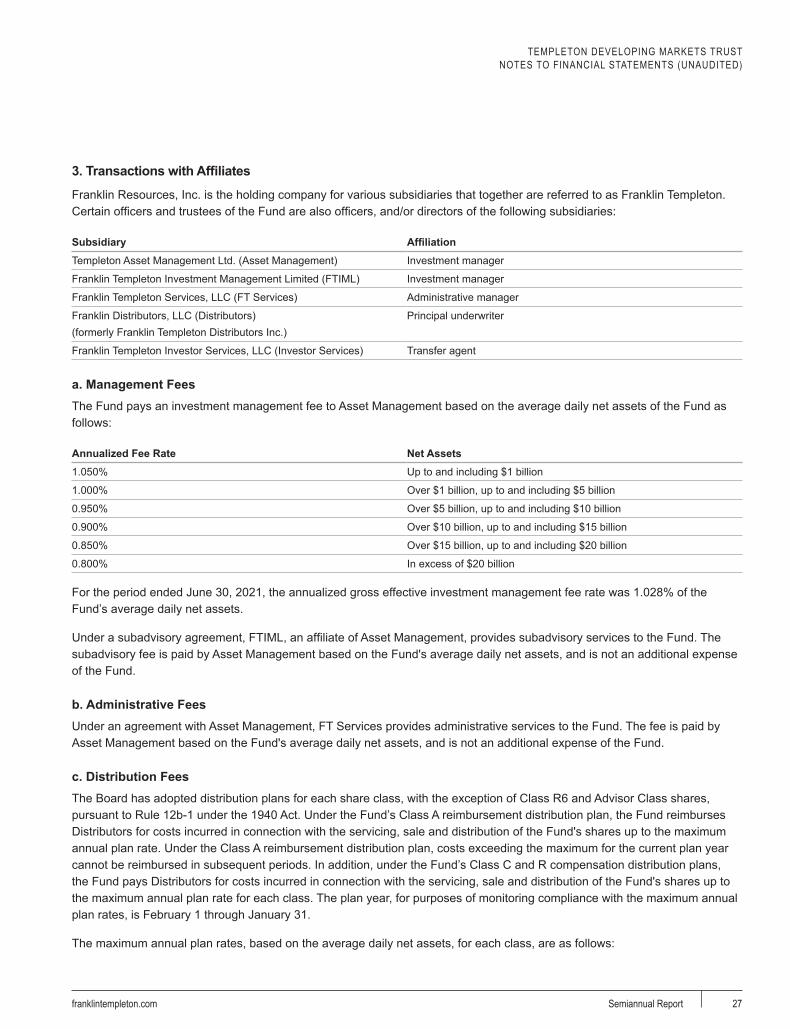
TEMPLETON DEVELOPING MARKETS TRUSTNOTES TO FINANCIAL STATEMENTS (UNAUDITED)
27franklintempleton.com Semiannual Report
3.TransactionswithAffiliates
Franklin Resources, Inc. is the holding company for various subsidiaries that together are referred to as Franklin Templeton. Certain officers and trustees of the Fund are also officers, and/or directors of the following subsidiaries:
Subsidiary AffiliationTempleton Asset Management Ltd. (Asset Management) Investment manager
Franklin Templeton Investment Management Limited (FTIML) Investment manager
Franklin Templeton Services, LLC (FT Services) Administrative manager
Franklin Distributors, LLC (Distributors)(formerly Franklin Templeton Distributors Inc.)
Principal underwriter
Franklin Templeton Investor Services, LLC (Investor Services) Transfer agent
a. Management FeesThe Fund pays an investment management fee to Asset Management based on the average daily net assets of the Fund as follows:
Annualized Fee Rate Net Assets1.050% Up to and including $1 billion
1.000% Over $1 billion, up to and including $5 billion
0.950% Over $5 billion, up to and including $10 billion
0.900% Over $10 billion, up to and including $15 billion
0.850% Over $15 billion, up to and including $20 billion
0.800% In excess of $20 billion
For the period ended June 30, 2021, the annualized gross effective investment management fee rate was 1.028% of the Fund’s average daily net assets.
Under a subadvisory agreement, FTIML, an affiliate of Asset Management, provides subadvisory services to the Fund. The subadvisory fee is paid by Asset Management based on the Fund's average daily net assets, and is not an additional expense of the Fund.
b. Administrative FeesUnder an agreement with Asset Management, FT Services provides administrative services to the Fund. The fee is paid by Asset Management based on the Fund's average daily net assets, and is not an additional expense of the Fund.
c. Distribution FeesThe Board has adopted distribution plans for each share class, with the exception of Class R6 and Advisor Class shares, pursuant to Rule 12b-1 under the 1940 Act. Under the Fund’s Class A reimbursement distribution plan, the Fund reimburses Distributors for costs incurred in connection with the servicing, sale and distribution of the Fund's shares up to the maximum annual plan rate. Under the Class A reimbursement distribution plan, costs exceeding the maximum for the current plan year cannot be reimbursed in subsequent periods. In addition, under the Fund’s Class C and R compensation distribution plans, the Fund pays Distributors for costs incurred in connection with the servicing, sale and distribution of the Fund's shares up to the maximum annual plan rate for each class. The plan year, for purposes of monitoring compliance with the maximum annual plan rates, is February 1 through January 31.
The maximum annual plan rates, based on the average daily net assets, for each class, are as follows:

TEMPLETON DEVELOPING MARKETS TRUSTNOTES TO FINANCIAL STATEMENTS (UNAUDITED)
28 franklintempleton.comSemiannual Report
Class A . . . . . . . . . . . . . . . . . . . . . . . . . . . . . . . . . . . . . . . . . . . . . . . . . . . . . . . . . . . . . . . . . . . . . . . . . . . . . . . . . . . . 0.35%Class C . . . . . . . . . . . . . . . . . . . . . . . . . . . . . . . . . . . . . . . . . . . . . . . . . . . . . . . . . . . . . . . . . . . . . . . . . . . . . . . . . . . . 1.00%Class R . . . . . . . . . . . . . . . . . . . . . . . . . . . . . . . . . . . . . . . . . . . . . . . . . . . . . . . . . . . . . . . . . . . . . . . . . . . . . . . . . . . . 0.50%
The Board has set the current rate at 0.25% per year for Class A shares until further notice and approval by the Board.
d. Sales Charges/Underwriting AgreementsFront-end sales charges and contingent deferred sales charges (CDSC) do not represent expenses of the Fund. These charges are deducted from the proceeds of sales of Fund shares prior to investment or from redemption proceeds prior to remittance, as applicable. Distributors has advised the Fund of the following commission transactions related to the sales and redemptions of the Fund's shares for the period:
Sales charges retained net of commissions paid to unaffiliated brokers/dealers . . . . . . . . . . . . . . . . . . . . . . . . . . . . . . $42,143CDSC retained . . . . . . . . . . . . . . . . . . . . . . . . . . . . . . . . . . . . . . . . . . . . . . . . . . . . . . . . . . . . . . . . . . . . . . . . . . . . . . $1,672
e. Transfer Agent FeesEach class of shares pays transfer agent fees to Investor Services for its performance of shareholder servicing obligations. The fees are based on an annualized asset based fee of 0.02% plus a transaction based fee. In addition, each class reimburses Investor Services for out of pocket expenses incurred and, except for Class R6, reimburses shareholder servicing fees paid to third parties. These fees are allocated daily based upon their relative proportion of such classes' aggregate net assets. Class R6 pays Investor Services transfer agent fees specific to that class.
For the period ended June 30, 2021, the Fund paid transfer agent fees of $1,349,320, of which $585,679 was retained by Investor Services.
f.InvestmentsinAffiliatedManagementInvestmentCompaniesThe Fund invests in one or more affiliated management investment companies. As defined in the 1940 Act, an investment is deemed to be a “Controlled Affiliate” of a fund when a fund owns, either directly or indirectly, 25% or more of the affiliated fund’s outstanding shares or has the power to exercise control over management or policies of such fund. The Fund does not invest for purposes of exercising a controlling influence over the management or policies. Management fees paid by the Fund are waived on assets invested in the affiliated management investment companies, as noted in the Statement of Operations, in an amount not to exceed the management and administrative fees paid directly or indirectly by each affiliate. During the period ended June 30, 2021, the Fund held investments in affiliated management investment companies as follows:
3.TransactionswithAffiliates (continued)
c. Distribution Fees (continued)
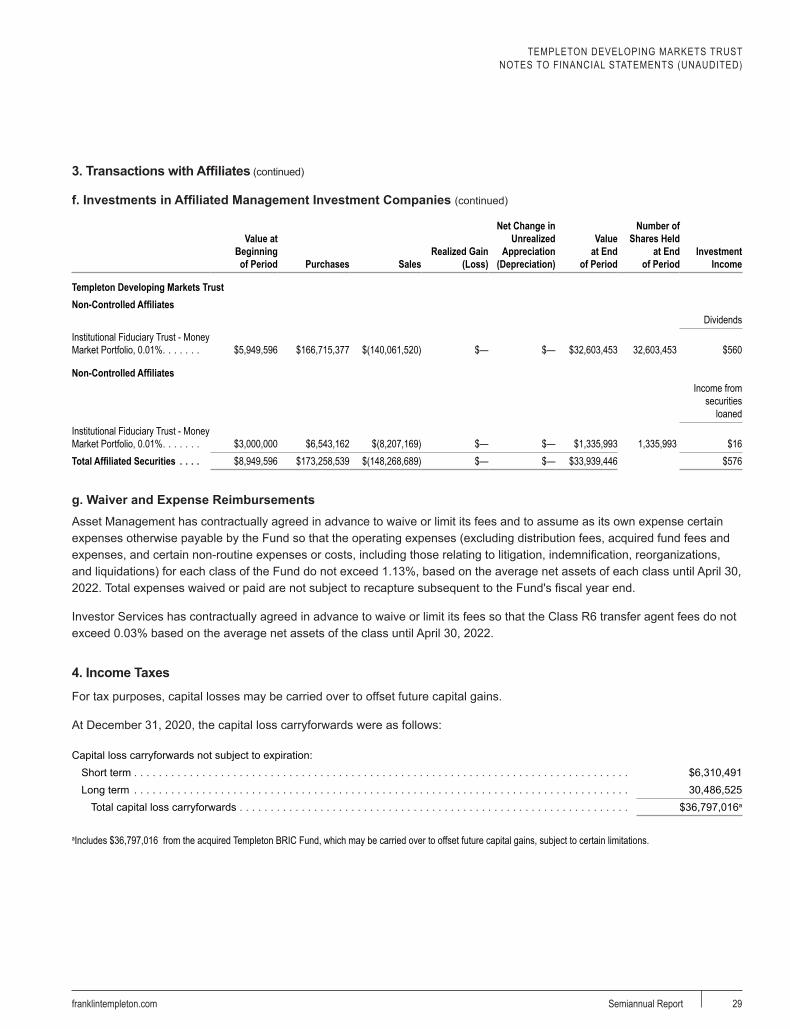
TEMPLETON DEVELOPING MARKETS TRUSTNOTES TO FINANCIAL STATEMENTS (UNAUDITED)
29franklintempleton.com Semiannual Report
aa
Value at Beginning of Period Purchases Sales
Realized Gain (Loss)
Net Change in Unrealized
Appreciation (Depreciation)
Value at End
of Period
Number of Shares Held
at End of Period
Investment Income
a a a a a a a a
Templeton Developing Markets TrustNon-Controlled Affiliates
DividendsInstitutional Fiduciary Trust - Money Market Portfolio, 0.01% . . . . . . . $5,949,596 $166,715,377 $(140,061,520) $— $— $32,603,453 32,603,453 $560
Non-Controlled AffiliatesIncome from
securities loaned
Institutional Fiduciary Trust - Money Market Portfolio, 0.01% . . . . . . . $3,000,000 $6,543,162 $(8,207,169) $— $— $1,335,993 1,335,993 $16Total Affiliated Securities . . . . $8,949,596 $173,258,539 $(148,268,689) $— $— $33,939,446 $576
g. Waiver and Expense ReimbursementsAsset Management has contractually agreed in advance to waive or limit its fees and to assume as its own expense certain expenses otherwise payable by the Fund so that the operating expenses (excluding distribution fees, acquired fund fees and expenses, and certain non-routine expenses or costs, including those relating to litigation, indemnification, reorganizations, and liquidations) for each class of the Fund do not exceed 1.13%, based on the average net assets of each class until April 30, 2022. Total expenses waived or paid are not subject to recapture subsequent to the Fund's fiscal year end.
Investor Services has contractually agreed in advance to waive or limit its fees so that the Class R6 transfer agent fees do not exceed 0.03% based on the average net assets of the class until April 30, 2022.
4. Income Taxes
For tax purposes, capital losses may be carried over to offset future capital gains.
At December 31, 2020, the capital loss carryforwards were as follows:
Capital loss carryforwards not subject to expiration:Short term . . . . . . . . . . . . . . . . . . . . . . . . . . . . . . . . . . . . . . . . . . . . . . . . . . . . . . . . . . . . . . . . . . . . . . . . . . . . . . . . $6,310,491Long term . . . . . . . . . . . . . . . . . . . . . . . . . . . . . . . . . . . . . . . . . . . . . . . . . . . . . . . . . . . . . . . . . . . . . . . . . . . . . . . . 30,486,525
Total capital loss carryforwards . . . . . . . . . . . . . . . . . . . . . . . . . . . . . . . . . . . . . . . . . . . . . . . . . . . . . . . . . . . . . . . $36,797,016a
aIncludes $36,797,016 from the acquired Templeton BRIC Fund, which may be carried over to offset future capital gains, subject to certain limitations.
3.TransactionswithAffiliates (continued)
f.InvestmentsinAffiliatedManagementInvestmentCompanies(continued)
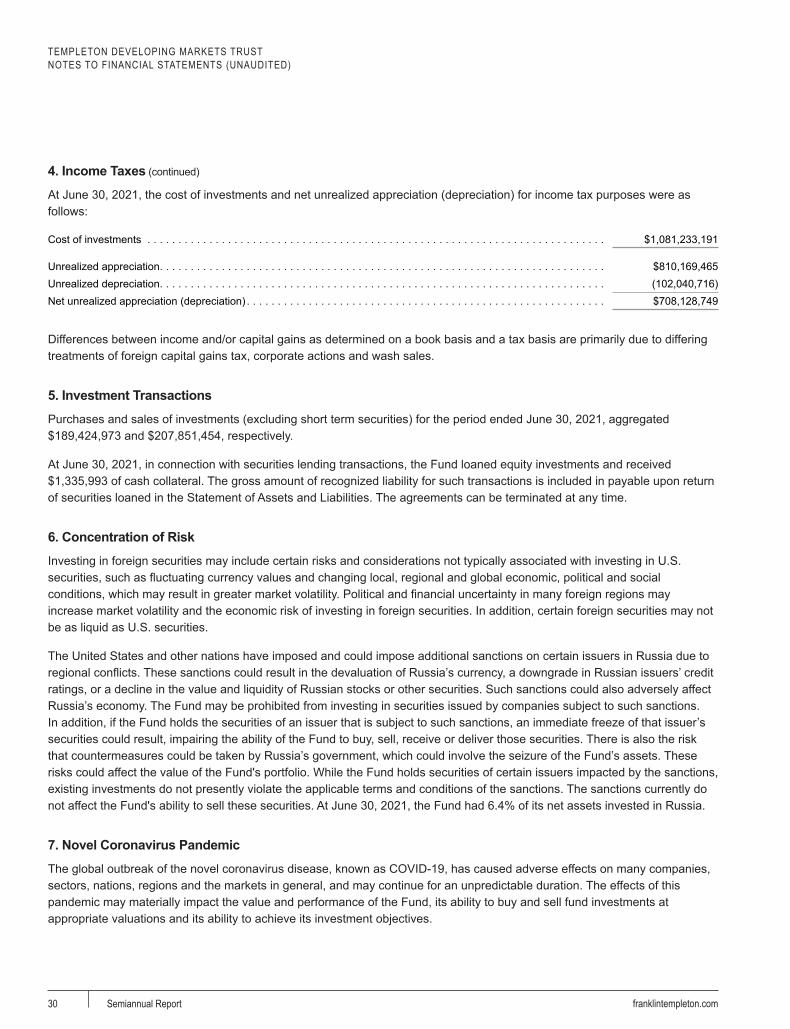
TEMPLETON DEVELOPING MARKETS TRUSTNOTES TO FINANCIAL STATEMENTS (UNAUDITED)
30 franklintempleton.comSemiannual Report
At June 30, 2021, the cost of investments and net unrealized appreciation (depreciation) for income tax purposes were as follows:
Cost of investments . . . . . . . . . . . . . . . . . . . . . . . . . . . . . . . . . . . . . . . . . . . . . . . . . . . . . . . . . . . . . . . . . . . . . . . . . . $1,081,233,191
Unrealized appreciation . . . . . . . . . . . . . . . . . . . . . . . . . . . . . . . . . . . . . . . . . . . . . . . . . . . . . . . . . . . . . . . . . . . . . . . . $810,169,465Unrealized depreciation . . . . . . . . . . . . . . . . . . . . . . . . . . . . . . . . . . . . . . . . . . . . . . . . . . . . . . . . . . . . . . . . . . . . . . . . (102,040,716)Net unrealized appreciation (depreciation) . . . . . . . . . . . . . . . . . . . . . . . . . . . . . . . . . . . . . . . . . . . . . . . . . . . . . . . . . . $708,128,749
Differences between income and/or capital gains as determined on a book basis and a tax basis are primarily due to differing treatments of foreign capital gains tax, corporate actions and wash sales.
5. Investment Transactions
Purchases and sales of investments (excluding short term securities) for the period ended June 30, 2021, aggregated $189,424,973 and $207,851,454, respectively.
At June 30, 2021, in connection with securities lending transactions, the Fund loaned equity investments and received $1,335,993 of cash collateral. The gross amount of recognized liability for such transactions is included in payable upon return of securities loaned in the Statement of Assets and Liabilities. The agreements can be terminated at any time.
6. Concentration of Risk
Investing in foreign securities may include certain risks and considerations not typically associated with investing in U.S. securities, such as fluctuating currency values and changing local, regional and global economic, political and social conditions, which may result in greater market volatility. Political and financial uncertainty in many foreign regions may increase market volatility and the economic risk of investing in foreign securities. In addition, certain foreign securities may not be as liquid as U.S. securities.
The United States and other nations have imposed and could impose additional sanctions on certain issuers in Russia due to regional conflicts. These sanctions could result in the devaluation of Russia’s currency, a downgrade in Russian issuers’ credit ratings, or a decline in the value and liquidity of Russian stocks or other securities. Such sanctions could also adversely affect Russia’s economy. The Fund may be prohibited from investing in securities issued by companies subject to such sanctions. In addition, if the Fund holds the securities of an issuer that is subject to such sanctions, an immediate freeze of that issuer’s securities could result, impairing the ability of the Fund to buy, sell, receive or deliver those securities. There is also the risk that countermeasures could be taken by Russia’s government, which could involve the seizure of the Fund’s assets. These risks could affect the value of the Fund's portfolio. While the Fund holds securities of certain issuers impacted by the sanctions, existing investments do not presently violate the applicable terms and conditions of the sanctions. The sanctions currently do not affect the Fund's ability to sell these securities. At June 30, 2021, the Fund had 6.4% of its net assets invested in Russia.
7. Novel Coronavirus Pandemic
The global outbreak of the novel coronavirus disease, known as COVID-19, has caused adverse effects on many companies, sectors, nations, regions and the markets in general, and may continue for an unpredictable duration. The effects of this pandemic may materially impact the value and performance of the Fund, its ability to buy and sell fund investments at appropriate valuations and its ability to achieve its investment objectives.
4. Income Taxes (continued)

TEMPLETON DEVELOPING MARKETS TRUSTNOTES TO FINANCIAL STATEMENTS (UNAUDITED)
31franklintempleton.com Semiannual Report
8. Credit Facility
The Fund, together with other U.S. registered and foreign investment funds (collectively, Borrowers), managed by Franklin Templeton, are borrowers in a joint syndicated senior unsecured credit facility totaling $2.675 billion (Global Credit Facility) which matures on February 4, 2022. This Global Credit Facility provides a source of funds to the Borrowers for temporary and emergency purposes, including the ability to meet future unanticipated or unusually large redemption requests.
Under the terms of the Global Credit Facility, the Fund shall, in addition to interest charged on any borrowings made by the Fund and other costs incurred by the Fund, pay its share of fees and expenses incurred in connection with the implementation and maintenance of the Global Credit Facility, based upon its relative share of the aggregate net assets of all of the Borrowers, including an annual commitment fee of 0.15% based upon the unused portion of the Global Credit Facility. These fees are reflected in other expenses in the Statement of Operations. During the period ended June 30, 2021, the Fund did not use the Global Credit Facility.
9. Fair Value Measurements
The Fund follows a fair value hierarchy that distinguishes between market data obtained from independent sources (observable inputs) and the Fund's own market assumptions (unobservable inputs). These inputs are used in determining the value of the Fund's financial instruments and are summarized in the following fair value hierarchy:
• Level 1 – quoted prices in active markets for identical financial instruments
• Level 2 – other significant observable inputs (including quoted prices for similar financial instruments, interest rates, prepayment speed, credit risk, etc.)
• Level 3 – significant unobservable inputs (including the Fund's own assumptions in determining the fair value of financial instruments)
The input levels are not necessarily an indication of the risk or liquidity associated with financial instruments at that level.
A summary of inputs used as of June 30, 2021, in valuing the Fund's assets carried at fair value, is as follows:
Level 1 Level 2 Level 3 Total
Templeton Developing Markets TrustAssets:
Investments in Securities:Common Stocks:
Brazil . . . . . . . . . . . . . . . . . . . . . . . . . . . . . . . $67,499,173 $— $— $67,499,173Cambodia . . . . . . . . . . . . . . . . . . . . . . . . . . . . — 6,495,458 — 6,495,458China . . . . . . . . . . . . . . . . . . . . . . . . . . . . . . . 67,473,875 418,493,308 21,322,034 507,289,217Hungary . . . . . . . . . . . . . . . . . . . . . . . . . . . . . — 11,625,952 — 11,625,952India . . . . . . . . . . . . . . . . . . . . . . . . . . . . . . . . — 115,702,673 — 115,702,673Indonesia . . . . . . . . . . . . . . . . . . . . . . . . . . . . — 9,847,178 — 9,847,178Mexico . . . . . . . . . . . . . . . . . . . . . . . . . . . . . . 26,497,268 — — 26,497,268Pakistan . . . . . . . . . . . . . . . . . . . . . . . . . . . . . 3,519,381 — — 3,519,381Peru . . . . . . . . . . . . . . . . . . . . . . . . . . . . . . . . 3,119,834 — — 3,119,834Philippines . . . . . . . . . . . . . . . . . . . . . . . . . . . 3,270,236 — — 3,270,236Russia . . . . . . . . . . . . . . . . . . . . . . . . . . . . . . 34,411,385 79,174,278 — 113,585,663South Africa . . . . . . . . . . . . . . . . . . . . . . . . . . 16,102,194 60,028,867 — 76,131,061South Korea . . . . . . . . . . . . . . . . . . . . . . . . . . — 397,895,086 — 397,895,086Taiwan . . . . . . . . . . . . . . . . . . . . . . . . . . . . . . — 291,563,623 — 291,563,623Thailand . . . . . . . . . . . . . . . . . . . . . . . . . . . . . — 21,899,922 — 21,899,922United Kingdom . . . . . . . . . . . . . . . . . . . . . . . — 24,294,294 — 24,294,294United States . . . . . . . . . . . . . . . . . . . . . . . . . 10,613,818 — — 10,613,818
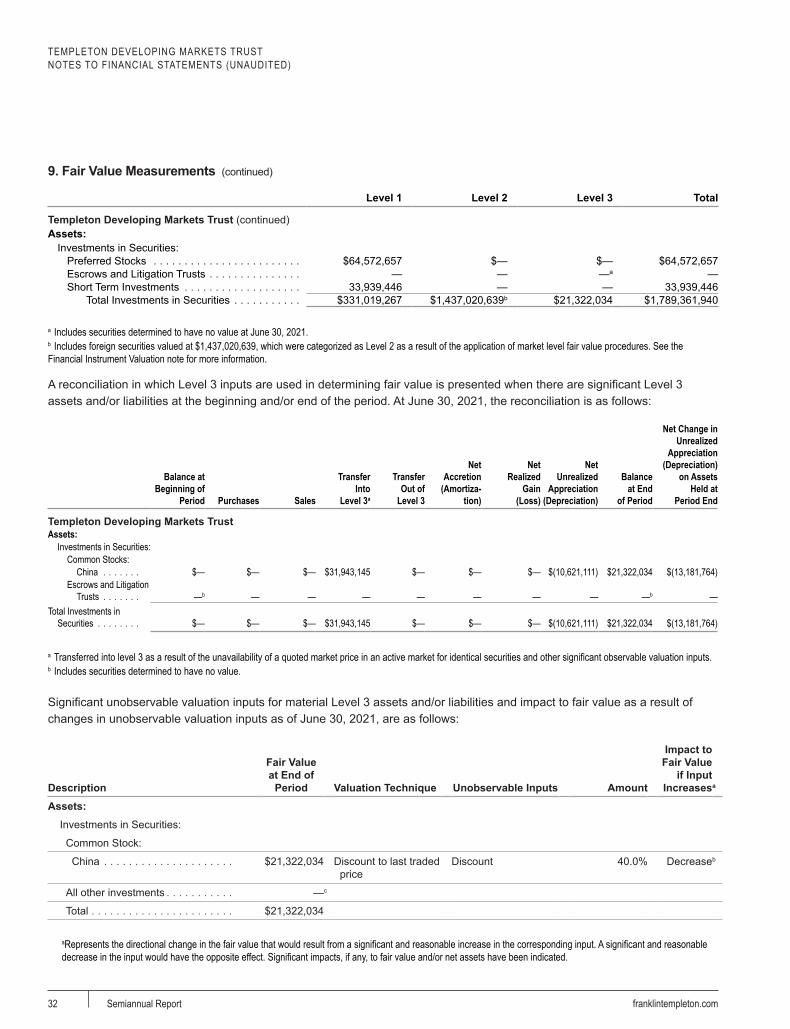
TEMPLETON DEVELOPING MARKETS TRUSTNOTES TO FINANCIAL STATEMENTS (UNAUDITED)
32 franklintempleton.comSemiannual Report
Level 1 Level 2 Level 3 Total
Templeton Developing Markets Trust (continued) Assets:
Investments in Securities: Preferred Stocks . . . . . . . . . . . . . . . . . . . . . . . . $64,572,657 $— $— $64,572,657Escrows and Litigation Trusts . . . . . . . . . . . . . . . — — —a —Short Term Investments . . . . . . . . . . . . . . . . . . . 33,939,446 — — 33,939,446
Total Investments in Securities . . . . . . . . . . . $331,019,267 $1,437,020,639b $21,322,034 $1,789,361,940
a Includes securities determined to have no value at June 30, 2021.b Includes foreign securities valued at $1,437,020,639, which were categorized as Level 2 as a result of the application of market level fair value procedures. See the Financial Instrument Valuation note for more information.
A reconciliation in which Level 3 inputs are used in determining fair value is presented when there are significant Level 3 assets and/or liabilities at the beginning and/or end of the period. At June 30, 2021, the reconciliation is as follows:
Balance at Beginning of
Period Purchases Sales
Transfer Into
Level 3a
Transfer Out of
Level 3
Net Accretion
(Amortiza- tion)
Net Realized
Gain (Loss)
Net Unrealized
Appreciation (Depreciation)
Balance at End
of Period
Net Change in Unrealized
Appreciation (Depreciation)
on Assets Held at
Period Enda a a a a a a a a a a
Templeton Developing Markets Trust Assets:
Investments in Securities:Common Stocks:
China . . . . . . . $— $— $— $31,943,145 $— $— $— $(10,621,111) $21,322,034 $(13,181,764)Escrows and Litigation
Trusts . . . . . . . —b — — — — — — — —b —Total Investments in
Securities . . . . . . . . $— $— $— $31,943,145 $— $— $— $(10,621,111) $21,322,034 $(13,181,764)
a Transferred into level 3 as a result of the unavailability of a quoted market price in an active market for identical securities and other significant observable valuation inputs.b Includes securities determined to have no value.
Significant unobservable valuation inputs for material Level 3 assets and/or liabilities and impact to fair value as a result of changes in unobservable valuation inputs as of June 30, 2021, are as follows:
Description
Fair Value at End of
Period Valuation Technique Unobservable Inputs Amount
Impact to Fair Value
if Input Increasesa
Assets:Investments in Securities:
Common Stock:
China . . . . . . . . . . . . . . . . . . . . . $21,322,034 Discount to last traded price
Discount 40.0% Decreaseb
All other investments . . . . . . . . . . . —c
Total . . . . . . . . . . . . . . . . . . . . . . . $21,322,034
aRepresents the directional change in the fair value that would result from a significant and reasonable increase in the corresponding input. A significant and reasonable decrease in the input would have the opposite effect. Significant impacts, if any, to fair value and/or net assets have been indicated.
9. Fair Value Measurements (continued)
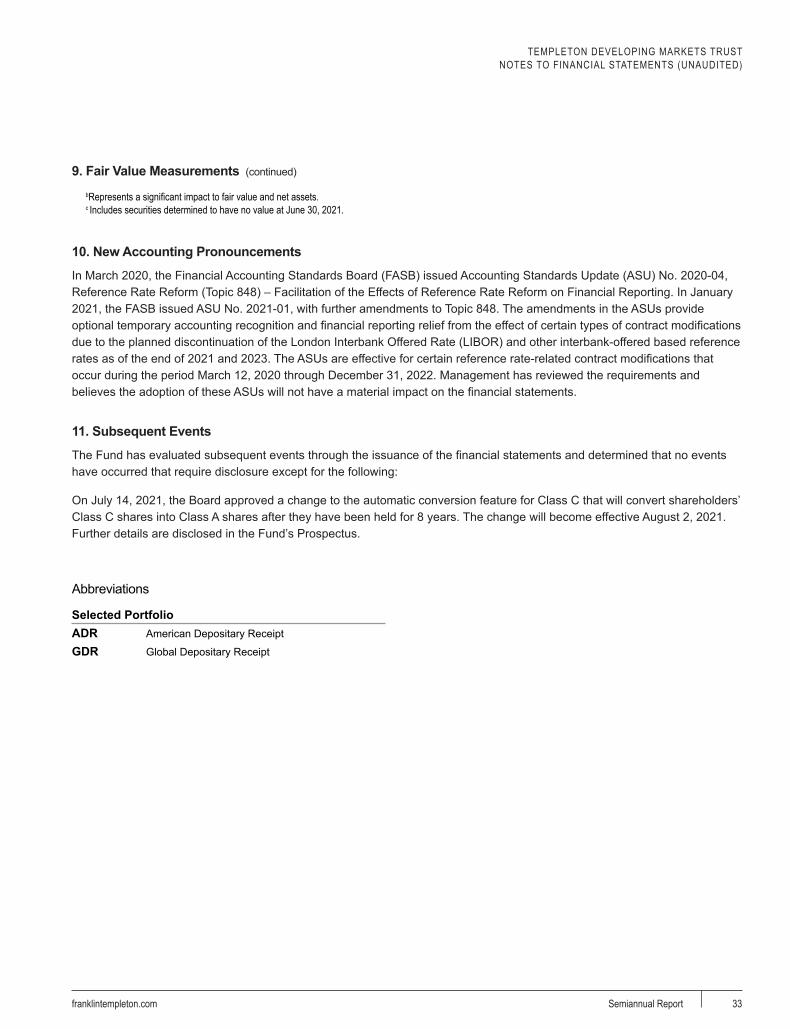
TEMPLETON DEVELOPING MARKETS TRUSTNOTES TO FINANCIAL STATEMENTS (UNAUDITED)
33franklintempleton.com Semiannual Report
bRepresents a significant impact to fair value and net assets.c Includes securities determined to have no value at June 30, 2021.
10. New Accounting Pronouncements
In March 2020, the Financial Accounting Standards Board (FASB) issued Accounting Standards Update (ASU) No. 2020-04, Reference Rate Reform (Topic 848) – Facilitation of the Effects of Reference Rate Reform on Financial Reporting. In January 2021, the FASB issued ASU No. 2021-01, with further amendments to Topic 848. The amendments in the ASUs provide optional temporary accounting recognition and financial reporting relief from the effect of certain types of contract modifications due to the planned discontinuation of the London Interbank Offered Rate (LIBOR) and other interbank-offered based reference rates as of the end of 2021 and 2023. The ASUs are effective for certain reference rate-related contract modifications that occur during the period March 12, 2020 through December 31, 2022. Management has reviewed the requirements and believes the adoption of these ASUs will not have a material impact on the financial statements.
11. Subsequent Events
The Fund has evaluated subsequent events through the issuance of the financial statements and determined that no events have occurred that require disclosure except for the following:
On July 14, 2021, the Board approved a change to the automatic conversion feature for Class C that will convert shareholders’ Class C shares into Class A shares after they have been held for 8 years. The change will become effective August 2, 2021. Further details are disclosed in the Fund’s Prospectus.
Abbreviations
Selected PortfolioADR American Depositary Receipt
GDR Global Depositary Receipt
9. Fair Value Measurements (continued)
TEMPLETON DEVELOPING MARKETS TRUST
Shareholder Information
34 franklintempleton.comSemiannual Report
Board Approval of Investment Management AgreementsTEMPLETON DEVELOPING MARKETS TRUST(Fund)
At a meeting held on February 23, 2021 (Meeting), the Board of Trustees (Board) of the Fund, including a majority of the trustees who are not “interested persons” as defined in the Investment Company Act of 1940 (Independent Trustees), reviewed and approved the continuance of the investment management agreement between Templeton Asset Management Ltd. (TAML) and the Fund, and an investment sub-advisory agreement between TAML and Franklin Templeton Investment Management Limited (Sub-Adviser), an affiliate of TAML, on behalf of the Fund, for an additional one-year period (each a Management Agreement). The Independent Trustees received advice from and met separately with Independent Trustee counsel in considering whether to approve the continuation of each Management Agreement. TAML and the Sub-Adviser are each referred to herein as a Manager.
In considering the continuation of each Management Agreement, the Board reviewed and considered information provided by each Manager at the Meeting and throughout the year at meetings of the Board and its committees. The Board also reviewed and considered information provided in response to a detailed set of requests for information submitted to TAML by Independent Trustee counsel on behalf of the Independent Trustees in connection with the annual contract renewal process. In addition, prior to the Meeting, the Independent Trustees held a telephonic contract renewal meeting at which the Independent Trustees conferred amongst themselves and Independent Trustee counsel about contract renewal matters and, in some cases, requested additional information from the Managers relating to the contract. The Board reviewed and considered all of the factors it deemed relevant in approving the continuance of each Management Agreement, including, but not limited to: (i) the nature, extent and quality of the services provided by each Manager; (ii) the investment performance of the Fund; (iii) the costs of the services provided and profits realized by each Manager and its affiliates from the relationship with the Fund; (iv) the extent to which economies of scale are realized as the Fund grows; and (v) whether fee levels reflect these economies of scale for the benefit of Fund investors.
In approving the continuance of each Management Agreement, the Board, including a majority of the Independent Trustees, determined that the terms of the Management Agreement are fair and reasonable and that the continuance of such Management Agreement is in the best interests of the Fund and its shareholders. While attention was given to all information furnished, the following discusses some primary factors relevant to the Board’s determination.
Nature, Extent and Quality of ServicesThe Board reviewed and considered information regarding the nature, extent and quality of investment management services provided by each Manager and its affiliates to the Fund and its shareholders. This information included, among other things, the qualifications, background and experience of the senior management and investment personnel of each Manager, as well as information on succession planning where appropriate; the structure of investment personnel compensation; oversight of third-party service providers; investment performance reports and related financial information for the Fund; reports on expenses and shareholder services; legal and compliance matters; risk controls; pricing and other services provided by each Manager and its affiliates; and management fees charged by each Manager and its affiliates to US funds and other accounts, including management’s explanation of differences among accounts where relevant. The Board also reviewed and considered an annual report on payments made by Franklin Templeton (FT) or the Fund to financial intermediaries, as well as a memorandum relating to third-party servicing arrangements, which included discussion of the changing distribution landscape for the Fund. The Board noted management’s continuing efforts and expenditures in establishing effective business continuity plans and developing strategies to address areas of heightened concern in the mutual fund industry, such as cybersecurity in the current work-from-home environment and liquidity risk management.
The Board also reviewed and considered the benefits provided to Fund shareholders of investing in a fund that is part of the FT family of funds. The Board noted the financial position of Franklin Resources, Inc. (FRI), the Managers’ parent, and its commitment to the mutual fund business as evidenced by its reassessment of the fund offerings in response to the market environment and project initiatives and capital investments relating to the services provided to the Fund by the FT organization. The Board specifically noted FT’s commitment to enhancing services
TEMPLETON DEVELOPING MARKETS TRUSTSHAREHOLDER INFORMATION
35franklintempleton.com Semiannual Report
and controlling costs, as reflected in its outsourcing of certain administrative functions, and growth opportunities, as evidenced by its recent acquisition of the Legg Mason companies. The Board also noted FT’s attention focused on expanding the distribution opportunities for all funds in the FT family of funds.
Following consideration of such information, the Board was satisfied with the nature, extent and quality of services provided by each Manager and its affiliates to the Fund and its shareholders.
Fund PerformanceThe Board reviewed and considered the performance results of the Fund over various time periods ended November 30, 2020. The Board considered the performance returns for the Fund in comparison to the performance returns of mutual funds deemed comparable to the Fund included in a universe (Performance Universe) selected by Broadridge Financial Solutions, Inc. (Broadridge), an independent provider of investment company data. The Board received a description of the methodology used by Broadridge to select the mutual funds included in a Performance Universe. The Board also reviewed and considered Fund performance reports provided and discussions that occurred with portfolio managers at Board meetings throughout the year. A summary of the Fund’s performance results is below.
The Performance Universe for the Fund included the Fund and all retail and institutional emerging markets funds. The Board noted that the Fund’s annualized total return for the one-, three-, five- and 10-year periods was above the median of its Performance Universe. The Board concluded that the Fund’s performance was satisfactory.
Comparative Fees and ExpensesThe Board reviewed and considered information regarding the Fund’s actual total expense ratio and its various components, including, as applicable, management fees; transfer agent expenses; underlying fund expenses; Rule 12b-1 and non-Rule 12b-1 service fees; and other non-management fees. The Board also noted the quarterly and annual reports it receives on all marketing support payments made by FT to financial intermediaries. The Board considered the actual total expense ratio and, separately, the contractual management fee rate, without the effect of fee waivers, if any (Management Rate) of the Fund in comparison to the median expense ratio and median Management Rate, respectively, of other mutual funds deemed comparable to and with a similar expense structure to the Fund selected by Broadridge (Expense Group). Broadridge fee and expense data is based upon information taken from each fund’s most recent annual report, which
reflects historical asset levels that may be quite different from those currently existing, particularly in a period of market volatility. While recognizing such inherent limitation and the fact that expense ratios and Management Rates generally increase as assets decline and decrease as assets grow, the Board believed the independent analysis conducted by Broadridge to be an appropriate measure of comparative fees and expenses. The Broadridge Management Rate includes administrative charges, and the actual total expense ratio, for comparative consistency, was shown for Class A shares for the Fund and for each other fund in the Expense Group. The Board received a description of the methodology used by Broadridge to select the mutual funds included in an Expense Group.
The Expense Group for the Fund included the Fund and 17 other emerging markets funds. The Board noted that the Management Rate for the Fund was above the median of its Expense Group. The Board also noted that the actual total expense ratio for the Fund was below the median and in the second quintile of its Expense Group. The Board further noted the Fund’s first (best) and second quintile performance for the one-, three- and five-year periods and the fee waiver from management reflected in the Fund’s actual total expense ratio. The Board also noted that the Sub-Adviser’s fees are paid by TAML from the management fee TAML receives from the Fund. The Board concluded that the Management Rate charged to the Fund is reasonable.
ProfitabilityThe Board reviewed and considered information regarding the profits realized by TAML and its affiliates in connection with the operation of the Fund. In this respect, the Board considered the Fund profitability analysis provided that addresses the overall profitability of FT’s US fund business, as well as its profits in providing investment management and other services to each of the individual funds during the 12-month period ended September 30, 2020, being the most recent fiscal year-end for FRI. The Board noted that although management continually makes refinements to its methodologies used in calculating profitability in response to organizational and product-related changes, the overall methodology has remained consistent with that used in the Fund’s profitability report presentations from prior years. The Board further noted management’s representation that the profitability analysis excluded the impact of the recent acquisition of the Legg Mason companies and that management expects to incorporate the legacy Legg Mason companies into the profitability analysis beginning next year. The Board also noted that PricewaterhouseCoopers LLP,

TEMPLETON DEVELOPING MARKETS TRUSTSHAREHOLDER INFORMATION
36 franklintempleton.comSemiannual Report
auditor to FRI and certain FT funds, has been engaged to periodically review and assess the allocation methodologies to be used solely by the Fund’s Board with respect to the profitability analysis.
The Board noted management’s belief that costs incurred in establishing the infrastructure necessary for the type of mutual fund operations conducted by each Manager and its affiliates may not be fully reflected in the expenses allocated to the Fund in determining its profitability, as well as the fact that the level of profits, to a certain extent, reflected operational cost savings and efficiencies initiated by management. As part of this evaluation, the Board considered management’s outsourcing of certain operations, which effort has required considerable up-front expenditures by each Manager but, over the long run is expected to result in greater efficiencies. The Board also noted management’s expenditures in improving shareholder services provided to the Fund, as well as the need to implement systems and meet additional regulatory and compliance requirements resulting from recent US Securities and Exchange Commission and other regulatory requirements.
The Board also considered the extent to which each Manager and its affiliates might derive ancillary benefits from fund operations, including revenues generated from transfer agent services, potential benefits resulting from personnel and systems enhancements necessitated by fund growth, as well as increased leverage with service providers and counterparties. Based upon its consideration of all these factors, the Board concluded that the level of profits realized by each Manager and its affiliates from providing services to the Fund was not excessive in view of the nature, extent and quality of services provided to the Fund.
Economies of ScaleThe Board reviewed and considered the extent to which each Manager may realize economies of scale, if any, as the Fund grows larger and whether the Fund’s management fee structure reflects any economies of scale for the benefit of shareholders. With respect to possible economies of scale, the Board noted the existence of management fee breakpoints, which operate generally to share any economies of scale with the Fund’s shareholders by reducing the Fund’s effective management fees as the Fund grows in size. The Board considered the Managers’ view that any analyses of potential economies of scale in managing a particular fund are inherently limited in light of the joint and common costs and investments each Manager incurs across the FT family of funds as a whole. The Board concluded
that, to the extent economies of scale may be realized by each Manager and its affiliates, the Fund’s management fee structure provided a sharing of benefits with the Fund and its shareholders as the Fund grows.
ConclusionBased on its review, consideration and evaluation of all factors it believed relevant, including the above-described factors and conclusions, the Board unanimously approved the continuation of each Management Agreement for an additional one-year period.
Liquidity Risk Management Program-Funds no HLIMEach Fund has adopted and implemented a written Liquidity Risk Management Program (the “LRMP”) as required by Rule 22e-4 under the Investment Company Act of 1940 (the “Liquidity Rule”). The LRMP is designed to assess and manage each Fund’s liquidity risk, which is defined as the risk that the Fund could not meet requests to redeem shares issued by the Fund without significant dilution of remaining investors’ interests in the Fund. In accordance with the Liquidity Rule, the LRMP includes policies and procedures that provide for: (1) assessment, management, and review (no less frequently than annually) of each Fund’s liquidity risk; (2) classification of each Fund’s portfolio holdings into one of four liquidity categories (Highly Liquid, Moderately Liquid, Less Liquid, and Illiquid); (3) for Funds that do not primarily hold assets that are Highly Liquid, establishing and maintaining a minimum percentage of the Fund’s net assets in Highly Liquid investments (called a “Highly Liquid Investment Minimum” or “HLIM”); and (4) prohibiting the Fund’s acquisition of Illiquid investments that would result in the Fund holding more than 15% of its net assets in Illiquid assets. The LRMP also requires reporting to the Securities and Exchange Commission (“SEC”) (on a non-public basis) and to the Board if the Fund’s holdings of Illiquid assets exceed 15% of the Fund’s net assets. Funds with HLIMs must have procedures for addressing HLIM shortfalls, including reporting to the Board and, with respect to HLIM shortfalls lasting more than seven consecutive calendar days, reporting to the SEC (on a non-public basis).
The Director of Liquidity Risk within the Investment Risk Management Group (the “IRMG”) is the appointed Administrator of the LRMP. The IRMG maintains the Investment Liquidity Committee (the “ILC”) to provide oversight and administration of policies and procedures governing liquidity risk management for FT products and

TEMPLETON DEVELOPING MARKETS TRUSTSHAREHOLDER INFORMATION
37franklintempleton.com Semiannual Report
portfolios. The ILC includes representatives from Franklin Templeton’s Risk, Trading, Global Compliance, Investment Compliance, Investment Operations, Valuation Committee, Product Management and Global Product Strategy.
In assessing and managing each Fund’s liquidity risk, the ILC considers, as relevant, a variety of factors, including the Fund’s investment strategy and the liquidity of its portfolio investments during both normal and reasonably foreseeable stressed conditions; its short and long-term cash flow projections; and its cash holdings and access to other funding sources including the Funds’ interfund lending facility and line of credit. Classification of the Fund’s portfolio holdings in the four liquidity categories is based on the number of days it is reasonably expected to take to convert the investment to cash (for Highly Liquid and Moderately Liquid holdings) or sell or dispose of the investment (for Less Liquid and Illiquid investments), in current market conditions without significantly changing the investment’s market value.
Each Fund primarily holds liquid assets that are defined under the Liquidity Rule as "Highly Liquid Investments," and therefore is not required to establish an HLIM. Highly Liquid Investments are defined as cash and any investment reasonably expected to be convertible to cash in current market conditions in three business days or less without the conversion to cash significantly changing the market value of the investment.
At meetings of the Funds’ Board of Trustees held in May 2021, the Program Administrator provided a written report to the Board addressing the adequacy and effectiveness of the program for the year ended December 31, 2020. The Program Administrator report concluded that (i.) the LRMP, as adopted and implemented, remains reasonably designed to assess and manage each Fund’s liquidity risk; (ii.) the LRMP, including the Highly Liquid Investment Minimum (“HLIM”) where applicable, was implemented and operated effectively to achieve the goal of assessing and managing each Fund’s liquidity risk; and (iii.) each Fund was able to meet requests for redemption without significant dilution of remaining investors’ interests in the Fund.
Proxy Voting Policies and ProceduresThe Trust’s investment manager has established Proxy Voting Policies and Procedures (Policies) that the Trust uses to determine how to vote proxies relating to portfolio securities. Shareholders may view the Trust’s complete Policies online at franklintempleton.com. Alternatively, shareholders may request copies of the Policies free of charge by calling the Proxy Group collect at (954) 527-7678 or by sending a written request to: Franklin Templeton
Companies, LLC, 300 S.E. 2nd Street, Fort Lauderdale, FL 33301, Attention: Proxy Group. Copies of the Trust’s proxy voting records are also made available online at franklintempleton.com and posted on the U.S. Securities and Exchange Commission’s website at sec.gov and reflect the most recent 12-month period ended June 30.
Quarterly Statement of InvestmentsThe Trust files a complete statement of investments with the U.S. Securities and Exchange Commission for the first and third quarters for each fiscal year as an exhibit to its report on Form N-PORT. Shareholders may view the filed Form N-PORT by visiting the Commission’s website at sec.gov. The filed form may also be viewed and copied at the Commission’s Public Reference Room in Washington, DC. Information regarding the operations of the Public Reference Room may be obtained by calling (800) SEC-0330.
Householding of Reports and ProspectusesYou will receive, or receive notice of the availability of, the Fund’s financial reports every six months. In addition, you will receive as an annual updated summary prospectus (detail prospectus available upon request). To reduce Fund expenses, we try to identify related shareholders in a household and send only one copy of the financial reports (to the extent received by mail) and summary prospectus. This process, called “householding,” will continue indefinitely unless you instruct us otherwise. If you prefer not to have these documents householded, please call us at (800) 632-2301. At any time you may view current prospectuses/summary prospectuses and financial reports on our website. If you choose, you may receive these documents through electronic delivery.

711 S 08/21© 2021 Franklin Templeton Investments. All rights reserved.
Authorized for distribution only when accompanied or preceded by a summary prospectus and/or prospectus. Investors should carefully consider a fund’s investment goals, risks, charges and expenses before investing. A prospectus contains this and other information; please read it carefully before investing.
To help ensure we provide you with quality service, all calls to and from our service areas are monitored and/or recorded.
Semiannual Report and Shareholder LetterTempleton Developing Markets Trust
Investment Manager Distributor Shareholder ServicesTempleton Asset Management Ltd.
Franklin Distributors, LLC(800) DIAL BEN® / 342-5236franklintempleton.com
(800) 632-2301