temporal dependence of potentiometric levels and ... · rbrh, porto alegre, v. 22, e54, 2017 fontes...
TRANSCRIPT
Revista Brasileira de Recursos HídricosBrazilian Journal of Water ResourcesVersão On-line ISSN 2318-0331RBRH, Porto Alegre, v. 22, e54, 2017Scientific/Technical Article
http://dx.doi.org/10.1590/2318-0331.0217170059
This is an Open Access article distributed under the terms of the Creative Commons Attribution License, which permits unrestricted use, distribution, and reproduction in any medium, provided the original work is properly cited.
Temporal dependence of potentiometric levels and groundwater salinity in alluvial aquifer upon rainfall and evapotranspiration
Dependência temporal de potenciometria e salinidade de aquífero aluvial com a precipitação e evapotranspiração
Robertson Valério de Paiva Fontes Júnior1 and Abelardo Antônio de Assunção Montenegro1
1Universidade Federal Rural de Pernambuco, Recife, PE, BrazilE-mails: [email protected] (RVPFJ), [email protected] (AAAM)
Received: April 20, 2017 - Revised: August 20, 2017 - Accepted: September 03, 2017
ABSTRACT
Rainfall uncertainty and high evapotranspiration rates in the semiarid regions not only play an important impact on surface water scarcity, but interfere on shallow groundwater quantity and quality. The aim of this study was to apply geostatistical methodology to analyze the time dependence of potentiometric levels and groundwater salinity in an intensively monitored alluvial aquifer upon agroclimatological variables, and thus investigate possible monthly and annual correlations. Statistically stable piezometers were considered for the temporal analysis, representing the mean behavior of the whole aquifer. It has been verified that stable piezometers for groundwater levels exhibited temporal dependence of 7 months, similar to the temporal scale of variation for monthly precipitation and potential evapotranspiration, which is consistent to the resulting crossed-semivariogram. Meanwhile, stable piezometers for electrical conductivity showed high uncertainty on temporal dependence scale, which ranged from 3 to 8 months. Thus, rainfall and evapotranspiration alone did not properly explain the temporal dynamics of groundwater salinity. The produced maps successfully identified the long term time pattern of groundwater variation, constituting an important support for water resources evaluation.
Keywords: Shallow aquifer; Geostatistics; Water availability; Communal farming; Semiarid.
RESUMO
A incerteza das chuvas e as elevadas taxas de evapotranspiração nas regiões semiáridas apresentam não apenas um importante impacto na escassez de água superficial, mas interferem na qualidade e quantidade das águas subterrâneas. O objetivo deste estudo foi analisar a dependência temporal dos níveis potenciométricos e a salinidade das águas subterrâneas em aquífero aluvial intensamente monitorado sobre variáveis agroclimatológicas e assim investigar possíveis correlações mensais e anuais. Foram considerados piezômetros estatisticamente estáveis para a análise temporal, representando o comportamento médio do aquífero. Verificou-se que piezômetros estáveis a níveis exibiram dependência temporal de 7 meses, semelhante à escala temporal de variação para precipitação mensal e evapotranspiração potencial, o que é consistente com o semivariograma cruzado produzido. Entretanto, os piezômetros estáveis para condutividade elétrica apresentaram alta incerteza na escala de dependência temporal, que variou de 3 a 8 meses. Assim, as precipitações e a evapotranspiração isoladamente não explicam a dinâmica temporal da salinidade das águas subterrâneas. Os mapas produzidos identificaram com sucesso o padrão temporal de variação da água subterrânea, constituindo um importante suporte para a avaliação dos recursos hídricos.
Palavras-chave: Aquífero raso; Geoestatística; Disponibilidade hídrica; Agricultura familiar; Semiárido.
RBRH, Porto Alegre, v. 22, e54, 2017
Temporal dependence of potentiometric levels and groundwater salinity in alluvial aquifer upon rainfall and evapotranspiration
INTRODUCTION
Rainfall uncertainty and droughts occurrence in the semi-arid regions, associated to high evapotranspiration rates, strongly limit water resources availability, both in surface reservoirs and in shallow aquifers. Nevertheless, the alluvial aquifers are strategic resources for coping with long droughts periods. Such aquifers are usually of restricted storage capacity, requiring rational explotation for their sustainability (ANDRADE et al., 2014).
Mimoso alluvial valley in the Northeast semiarid has been intensively instrumented (MONTENEGRO, 1997), monitored and studied for groundwater recharging mechanisms (ALBUQUERQUE et al., 2015), groundwater spatial distribution (FONTES JÚNIOR et al., 2012; MONTEIRO; MONTENEGRO; MONTENEGRO, 2014), soil salinity spatial variation (MONTENEGRO et al., 2010), for agricultural support evaluation (SOUZA et al., 2011).
Fontes Júnior et al. (2012) identified spatially representative piezometers for groundwater quantity and quality of in the Mimoso alluvial area using the temporal stability methodology. Such analysis successfully recognized locations representing the mean spatial behavior, thus reducing the number of samplings required for regular monitoring.
Soils of these alluvial aquifers are susceptible to salt accumulation due to irrigation practices, rainfall and diffuse recharge variability and also from capillary flow from a shallow water table (LIU et al., 2016). In order to examine the effects of drought and precipitation on aquifer storage and to provide interpretation about the physical processes that control transient changes on water table levels, it is necessary to analyse the long-term measurements of groundwater levels (GARDNER; HEILWEIL, 2009), and the main information source about potential of hydrological stress within groundwater system (KHORASANI et al., 2016).
The analyses of time series record of piezometric levels and groundwater tables reflect all the natural hydrological processes and human influence on the subsurface environment (SEEBOONGRUANG, 2014). Aflatooni and Mardaneh (2011) and Khorasani et al. (2016) used Box-Jenkings time series method to predict the future groundwater table fluctuations in correlation with rainfall data; and Neves, Costa and Monteiro (2016) used simple spectral analysis, continuous wavelet transform and singular spectral analysis for investigating temporal structure of groundwater, computation of autocorrelation function.
The relationship among hydrological variables might present a degree of dependence that can be studied by geostatistics, originally developed to study spatial patterns of variability (JOURNEL; HUIJBREGTS, 1978), and which has also been used for temporal patterns analysis (LOPEZ; BARAN; BOURGINE, 2015). The study of time series such as precipitation records, which has significant variability in semiarid regions, allows us to define the degree of temporal correlation, aiming at the estimation of minimum variance (LIMA et al., 2008), which has high importance for hydrological modelling.
The temporal precipitation patterns significantly interfer soil water dynamics, thus influencing the irrigated agriculture planning (LIMA et al., 2008). Thus the analysis of the climatological series is essential for the planning and management of water
resources, and for the accomplishment of agroclimatic zoning (SARTORI et al., 2010; RAMOS et al., 2011).
Machiwal et al. (2012) verified the relevance of geostatistical techniques to improve understanding of spatio temporal dynamics of groundwater levels in semiarid areas. Delbari, Motlagh and Amiri (2013) evaluated 13 years of temporal changes in groundwater levels using geostatistics, and found strong spatial correlations for different time periods. In order to support groundwater management for irrigation, Ibrakhimov et al. (2007) applied geostatistics to identify critical areas for salinity levels, using a time series of 11 years.
Dokou, Kourgialas and Karatzas (2015) evaluated spatio temporal patterns of groundwater contamination for a 9 years period, adopting geostatistical methods to support decision making procedures for management.
Hence, the geostatistics constitutes a powerful methodology to allow groundwater mapping. However, such spatio temporal analyses are usually hampered by the sparce nature of spatial groundwater data, which are concentrated only in time, according to Rouhani and Myers (1990).
Notwithstanding such investigations, there is still a lack of information regarding groundwater temporal dynamics of alluvial valleys in semiarid regions, particularly addressing possible correlations among groundwater quantity and quality, upon rainfall and evapotranspiration. Recently, Lopez, Baran and Bourgine (2015) investigated temporal multi scale trends in groundwater quality, in France, adopting geoestatistics.
Santos, Montenegro and Silva (2011) and Lopez, Baran and Bourgine (2015) used the semivariogram analysis on a time scale, unlike temporal analyzes of spatial semivariance in time.
The aim of this study is to analyze time multi scale dependence of agroclimatological variables, potentiometric levels and groundwater salinity in an alluvial aquifer in the semiarid, in order to characterize their temporal dynamics and correlations.
MATERIAL AND METHODS
The alluvial valley under study is located in the Alto Ipanema Basin in the municipality of “Pesqueira”, semiarid of Pernambuco State. The Mimoso alluvial valley has an average depth of 10 m, being about 15 km long and 0.3 km wide. Weather can be classified as BSsh (extremely hot, semiarid region), according to Köppen. As shown in Figure 1, the main soil types in the valley are Regolithic Neosol and Fluvic Neosol (CORRÊA; RIBEIRO, 2001).
The study area has a network of pumping wells and piezometers. Each piezometer is about 6 m deep and has a diameter of 75 mm. The wells are used for irrigation of vegetables (tomatoes, peppers, carrots, and cabbage), fruits (guava, cherry, papaya, banana, and custard apple), corn and pasture (elephant grass and sorghum).
According to estimates made by Monteiro, Montenegro and Montenegro (2014), the maximum average extraction from these wells is 45.16 m3 day-1. Some wells are also used for public supply, fueling water tanker trucks, with approximately 300 m3.day-1 extraction. Such exploitation produces critical groundwater depletion, as modelled by Monteiro, Montenegro and Montenegro (2014).
To study groundwater temporal variability, twelve years records (2002-2013) were used, from three stable piezometers for

RBRH, Porto Alegre, v. 22, e54, 2017
Fontes Júnior and Montenegro
water table, and for three “near” stable piezometers for electrical conductivity, according Fontes Júnior et al. (2012), as shown in Figure 1.
Precipitation and reference evapotranspiration (based on the Penman-Monteith Model (Equation 1) - FAO-56 (ALLEN et al. 1998)) were measured by an automatic Campbell Scientific weather station installed in the alluvial valley (coordinates 735079 N; 9071406 E).
( ) ( )( )
.
.
n 2 s ao
2
9000 408 R G u e et 273ET
1 0 34u
γ
γ
− + −+=
∆ + + (1)
where ETo is a reference evapotranspiration (mm day-1); Rn net radiation at the crop surface (MJ m-2 day-1); G – soil heat flux density (MJ m-2 day-1); T- mean daily air temperature at 2 m height (ºC); u2 – wind speed at 2 m height (m s-1); es – saturation vapour pressure (kPa); ea actual vapour pressure (kPa); es-ea – saturation vapour pressure deficit (kPa); Δ - slope vapour pressure curve (kPa ºC-1); and γ - psychrometric constant (kPa ºC-1).
This equation was calculated in spreadsheet in software LibreOffice© version 5.
Statistical and geostatistical analysis
Groundwater level and salinity data were analyzed by classical statistics, verifying the presence of outliers and extreme values. For variability analysis, the coefficients of variation were evaluated in time for both variables and ranked according to states low variability (for CV≤12%), medium variability (for 12<CV<60%) and high
variability (for CV≥60%). For testing normality, the Kolmogorov-Smirnov test (KS) to 5% was adopted (ANDRADE et al., 2012).
Time dependence was analyzed using the classical semivariogram estimator (JOURNEL; HUIJBREGTS, 1978), according to Equation 2:
( ) ( )n(t) 2
i ii=1
1t = Z x - Z(x +t)2N(t)
γ ∑ (2)
where γ(t) is the semivariance for time lag t, N(t) the number of pairs of observation points separated by time intervals t, Z(xi) the value at instant xi and Z(xi+t) the value in time xi+t (SANTOS; MONTENEGRO; SILVA, 2011).
Temporal data were arranged in a regular grid, considering the annual scale on the ‘y’ axis and the month scale on the x axis. Time dependence between variables was measured by crossed semivariograms, according to Equation 3 (JOURNEL; HUIJBREGTS, 1978):
( ) ( ) ( ) ( ) ( ){ }n(t)
ij i i ii=1
1t = Z x -Z x +t W x -W x+t2N(t)
γ ∑ (3)
where ( )Z x and W(xi) are, respectively, the main and the secondary variable values in time xi.
Fitting of exponential, spherical and Gaussian models to experimental data were conducted. Adjustments for those models were performed using the Weighted Least Squares Method.
Time-dependence was evaluated by temporal dependence index (TD), in which the time dependence is low, when the TD < 25%, moderate when 25% ≤TD ≤ 75% and high when TD> 75%, in
Figure 1. Location of Mimoso alluvial valley in the Ipanema watershed and piezometers location in soil map of the valley. Stable locations are shown.

RBRH, Porto Alegre, v. 22, e54, 2017
Temporal dependence of potentiometric levels and groundwater salinity in alluvial aquifer upon rainfall and evapotranspiration
which TD is the relationship between the structured or variance in scale (C1) and of the sill value (C0 + C1) (RAMOS et al., 2011).
To validate the adjustment of theoretical models, crossed-validation was used Kriging was adopted for mapping, using a search ellipse with horizontal axis scale in months and vertical axis in years.
RESULTS AND DISCUSSIONS
Results of the descriptive statistical analysis of the potentiometric levels, electrical conductivity (for stable locations from Fontes Júnior et al. (2012)), rainfall and monthly evapotranspiration are presented in Table 1. Mean values for precipitation and evapotranspiration were higher than the median, indicating asymmetry for the monthly variation in the analyzed period.
Mean values for depth and electrical conductivity were similar among stable piezometers as expected; as such piezometers are representative of the mean behavior for the whole valley. Similarity between mean values and median indicate Normal behavior for the variables. The potentiometric levels and evapotranspiration presented medium variability, while the electrical conductivity low to medium variability, while rainfall exhibited high variability, according to Warrick and Nielsen (1980).
Groundwater level variability can be explained by recharge from rainfall and depletion due to pumping, as noted in the high value (CV) and the soil properties of the alluvial valley, which influenced groundwater flow (ALMEIDA; FRISCHKORN, 2015).
On the other hand, when analyzing spatial variability, CV values are usually low, as pointed out by Chen and Feng (2013), for groundwater levels (CV ranging from 0.41 to 0.46), and for water quality (from 0.7 to 2.0).
High variability of rainfall results from sequences of dry and wet periods (MELO; MONTENEGRO, 2015; BERNDT; RABIEI; HABERLANDT, 2014), prolonged drought and rainfall occurring at beginning of the hydrological year in region (SANTOS; SOUZA; MONTENEGRO, 2016; SILVA et al., 2015). Thus, rainfall does not adhere to a Normal probability distribution. The box-plot analysis in Figure 2A exhibits several outliers for groundwater levels. Fontes Júnior et al. (2012) confirmed in a previous study the presence of these “outliers” and interference in data dispersion. The driest periods have influenced such on extreme groundwater levels, enhanced by unsaturated drainage processes to the watercourse (KONUKCU; GOWING; ROSE, 2006; MONTEIRO; MONTENEGRO; MONTENEGRO, 2014).
Box-plot for the electrical conductivity (Figure 2B) also shows outliers, but without the presence of extreme values. However, these “outliers” represent periods when increased salinity was significant. In addition, such high amplitude over time is related to soil texture distribution and its role in salts leaching and irrigation practices (MONTEIRO; MONTENEGRO; MONTENEGRO, 2014; ANDRADE et al., 2012).
The interaction between the river and the aquifer can explain most of the variation in the Pz 3.11b piezometer and discrepant values in the Pz 3.11a, as they are near the river channel. Liang and Zhang (2013) and Monteiro, Montenegro and Montenegro (2014) point out that the variation of the piezometric levels nearby river channel is proportional to the time of recharge and discharge, and that the limit of variation is conditional on the distance from the river. These piezometers are nearby the hillside areas, which have piezometric levels closer to the surface, and are recharged by the slope runoff. This region presents a higher concentration of salts in the soil and groundwater (ANDRADE et al., 2012). Figure 2C illustrate the boxplots of rainfall and reference evapotranspiration (ETo), where 75% (3rd quartile) of
Table 1. Descriptive statistics and values of relative difference, and temporal standard deviation, hydraulic conductivity at piezometers due to Montenegro (1997).
Water table(m)
Electrical Conductivity(dS m-1)
Rainfall(mm)
Ref. Evapotranspiration
(mm dia-1)Piezometers
Pz 3.8 Pz 4.6 Pz (P4) Pz 3.8 Pz 3.11a Pz 3.11bRelative Difference -0.02 -0.04 -0.01 0.06 0.03 0.00 - -Temporal Standard deviation 0.09 0.08 0.10 0.12 0.16 0.20 - -Ksat(m d-1) 21.10 116.00 25.12 21.10 43.80 4.80 - -N.º data 143 143 143 143 143 143 144 144Average -2.17 -2.17 -2.23 1.06 1.00 1.41 53.94 131.33Median -2.07 -2.05 -2.07 1.08 0.98 1.39 29.31 123.10Mode -2.00 - 2.52 -2.55 1.13 0.95 1.16 0.00 109.06Minimum -3.99 -4.28 -4.88 0.58 0.13 0.60 0.00 62.18Maximum -0.86 -0.53 -0.90 1.39 1.94 3.89 346.25 263.70Low quintile -2.45 -2.53 -2.49 0.99 0.81 0.97 5.83 96.73High quintile -1.80 -1.68 -1.80 1.14 1.15 1.77 85.83 152.16Variance 0.34 0.58 0.50 0.02 0.06 0.29 3953.48 1875.04Standard. Deviation 0.58 0.76 0.71 0.13 0.24 0.54 62.88 43.30Skewness -0.79 -0.62 -1.41 -0.66 0.41 1.22 1.65 0.68Kurtosis 1.07 0.42 2.79 1.94 2.29 2.99 3.12 -0.17CV(%) 26.72 35.02 22.42 1.88 6.00 38.29 116.57 111.85K-S5% - 0,14 0.09 0.070 0.13 0.09 0.05 0.13 0.20* 0.11* No normality.

RBRH, Porto Alegre, v. 22, e54, 2017
Fontes Júnior and Montenegro
rainfall measurements are less than 100 mm for the studied period, due to the severe drought in the last three years monitored. Rainfall outliers were found for 2004, as occurred in January with 346 mm and in June, with 232 mm, while ETo 264 mm in January of 2008.
Experimental semivariograms for the water table (Figures 3A, 3B and 3C) were fitted to spherical models with ranges of 7 months, while time semivariances for electrical conductivity
adjusted to exponential models (Figures 3E, 3F and 3G), with ranges 3, 4 and 7 months. The semivariances values higher than data variance can be explained by seasonal rain during the hydrological year (FONTES JÚNIOR et al., 2012).
For electrical conductivity, the semivariance patterns are close to the total variance due to low variation over time. Variation observed by Fontes Júnior et al. (2012), did not validated the
Figure 2. Box-plot of the groundwater level depth (A), electrical conductivity (B) of stable piezometers and rainfall and reference evapotranspiration (C).
Figure 3. Time semivariograms time of the groundwater levels (A, B, C); EC (E, F, G); climate data (D and H); crossed semivariogram time (I, J, K, L, M, N). Red lines indicate data variance.

RBRH, Porto Alegre, v. 22, e54, 2017
Temporal dependence of potentiometric levels and groundwater salinity in alluvial aquifer upon rainfall and evapotranspiration
stationarity. The adjusted models to groundwater levels and electrical conductivity exhibited a good fit to experimental estimates for most of piezometers, except for the piezometer Pz 3.11b.
Semivariograms for precipitation (Figure 3D) and ETo (Figure 3H) fitted to a Gaussian model, properly representing semivariances near the origin. The high value for the nugget (C0) (Table 2) for precipitation is due to events of high intensity in the wet months and dry months, and the high rainfall variability in short periods of time. The range close to 7 months is consistent to the duration of the rainy season in the region, including heavy rain for events of January and February, the weather pattern characteristics of the region (ALMEIDA et al., 2011; SARTORI et al., 2010). Semivariogram of potential evapotranspiration also presented a range close to 7 months (Table 2).
Figures 3I, 3J and 3K shows the crossed semivariogram levels of correlation with the time dependence ranging from 5 to 6 months (Table 2), suggesting rapid aquifer response to recharge. Aflatooni and Mardaneh (2011) obtained a time delay of 2 months for the water table recovery due to rainfall in 72% of the studied wells. Neves, Costa and Monteiro (2016) found lag of maximum correlation of 1 month, in their regression analysis between rainfall and piezometric level.
The high dispersion of semivariances data for electrical conductivity (Figures 3L, M and N) is related to low temporal correlation with rain events and salts dilutions ever in wetter months. The C0 value was low and equal to half of the first semivariance, representative is the time variation of ETo within a month. This dispersion can be explained by soil texture and transmissivity heteroneneity (MONTEIRO; MONTENEGRO; MONTENEGRO, 2014; ANDRADE et al., 2014), and significant decrease and increase of groundwater level over time affect groundwater parameters and might contribute to secondary soil salinization, surface water salinization and reduction of soil fertility (AMIRATAEE; ZEINALZADEH, 2016; ARSLAN, 2017)
This dispersion could be a result of flow low dilution of salt in the unsaturated and saturated zone (MONTENEGRO, 1997), due to Loam and Sandy loam textures in alluvial valley and diffuse recharge processes which tend to be slower than infiltration due to flooding (ALMEIDA; FRISCHKORN, 2015).
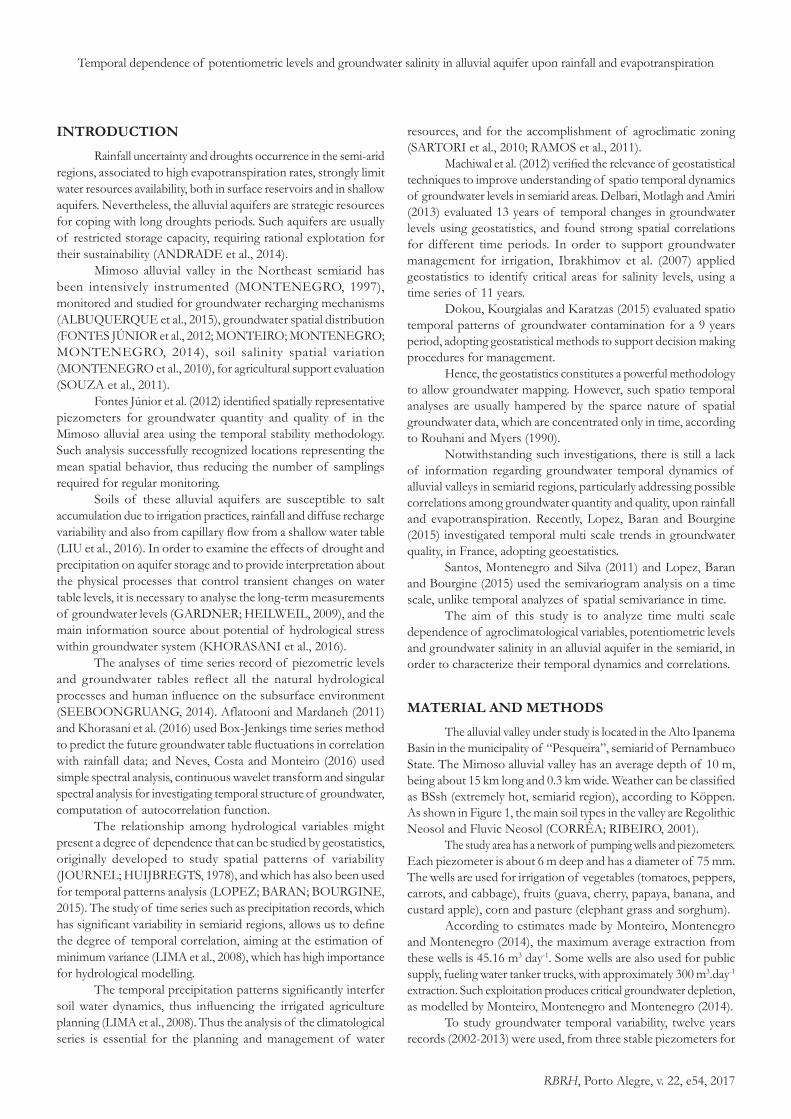
Figure 4 shows the temporal mapping of groundwater levels (Figure 4A, B and C) and the average map of the monthly means levels for stable piezometers (Figure 4D). The maps present annual ranges, point out wet and dry years, and the months in which the influence of rainfall was stronger for recharge (ALBUQUERQUE et al., 2015). The map for means values represents well the dry periods in red, for 2003 and 2013, highlighting the droughts seasonality in the region (Figure 4I). These periods are the most critical in the use of groundwater of the valley for irrigation. Thus, the map for mean values of groundwater levels constitutes an important management tool for farmers, identifying months when shallow aquifer conditions occur, typically during the may-july period. Cross comparing groundwater levels to rainfall, it can be clearly identified the short term response (depletion) of groundwater levels due to droughts. In addition, short term recharge to rainfall can also be observed, as for 2004 year. Rainfall and evapotranspiration affect the water balance in unsaturated zone and, before net recharge from rainfall reaches groundwater storage, the water deficit generated by evapotranspiration due to root uptake must be satisfied first (AFLATOONI; MARDANEH, 2011).For the dry periods, the piezometric level decline was similar of the reference evapotranspiration rate. Rossi et al. (2012) observed that, when comparing climate data with the potentiometric level, in the dry periods the rate of decline of the piezometric level was of the same magnitude order of the average daily reference evapotranspiration.
Figure 4 also presents electrical conductivity maps (Figure 4E, F and G) and the mean monthly conductivity map (Figure 4H). In the annual bands of the electrical conductivity maps, the increase of salts in periods of higher recharge in 2004, 2008, 2009 and 2010, and also the period of greatest evapotranspiration (Figure 4J) can be observed.
This increase is due to the salt leaching from the upper soil layers to groundwater due to rainfall (LIU et al. 2016). Nevertheless, it is worth to note, from the visual inspection of Figure 4H, that the alluvial valley does not exhibits high salt concentrations, even for the drought periods.
Table 2. Parameters of semivariograms models and crossed semivariograms.Semivariograms Crossed Semivariograms
Groundwater Level EC Precip Evap Level x Rainfall and EC x RainfallPz 3.8 Pz P4 Pz 4.6 Pz 3.8 Pz 3.11a Pz 3.11b Pz 3.8 Pz P4 Pz 4.6 Pz 3.8 Pz 3.11a Pz 3.11b
Model Sph Sph Sph Exp Exp Exp Gau Gau Gau Gau Gau
PNE PNE PNE
C0 0.12 0.07 0.26 0.02 0.02 0.12 3076.9 304.1 5 6.15 6.35C1 0.28 0.54 0.43 0.01 0.04 0.19 1402.9 2231.7 9.79 7.83 11.55A 7 7 7 3.09 4.2 7.67 6.87 7.18 3.43 2.56 2.94TD (%) 70 89 62 33 67 61 31 90 34 45 35R2 0.97 0.93 0.95 0.77 0.95 0.88 0.97 0.99 0.97 0.94 0.92Aver. 0.01 0.01 0.02 0.02 0.13 0.07 0.02 0.04S.D. 1.09 1.03 1.04 1.04 0.99 0.92 1.01 0.98C0: nugget effect; C1: sill; A: range; TD (%): Temporal Dependence index; PNE: Pure Nugget Effect; Aver.: Average; S. D.: Standard Deviation; Sph: Spherical model; Exp: Exponential model; Gau: Gaussian model; R2: Correlation Coefficient.
RBRH, Porto Alegre, v. 22, e54, 2017
Fontes Júnior and Montenegro
CONCLUSIONS
The stable piezometers to levels exhibited temporal dependence of 7 months, similar to the temporal scale of variation for monthly rainfall and reference evapotranspiration;
The stable piezometers for electrical conductivity showed high uncertainty on the temporal dependence scale, which ranged from 3 to 8 months;
The produced maps successfully identified the long term time pattern of groundwater variation, constituting an important tool for water resources evaluation.
REFERENCES
AFLATOONI, M.; MARDANEH, M. Time series analysis of groundwater table fluctuations due to temperature and rainfall change in Shiraz plain. International Journal of Water Resources and Environmental Engineering, v. 3, p. 176-188, 2011.
ALBUQUERQUE, C. G.; MONTENEGRO, S. M. G. L.; MONTENEGRO, A. A. A.; FONTES JÚNIOR, R. V. P. Recarga de aquífero aluvial sob uso agrícola. Revista Águas Subterrâneas, v. 29, n. 1, p. 60-71, 2015.
ALLEN, R. G.; PEREIRA, L. S.; RAES, D.; SMITH, M. Crop evapotranspiration: guide lines for computing crop water requirements. Rome: FAO, 1998. 300 p. (FAO Irrigation and Drainage Paper, 56).
ALMEIDA, A. Q.; RIBEIRO, A.; PAIVA, Y. G.; RASCON JUNIOR, N.; LIMA, E. P. Geoestatística no estudo da modelagem temporal da precipitação. Revista Brasileira de Engenharia Agrícola e
Ambiental, v. 15, n. 4, p. 354-358, 2011. http://dx.doi.org/10.1590/S1415-43662011000400004.
ALMEIDA, J. R. F.; FRISCHKORN, H. Salinization mechanisms of a small alluvial aquifer in the semiarid region of northeast Brazil. Revista Brasileira de Engenharia Agrícola e Ambiental, v. 19, n. 7, p. 643-649, 2015. http://dx.doi.org/10.1590/1807-1929/agriambi.v19n7p643-649.
AMIRATAEE, B.; ZEINALZADEH, K. Trends analysis of quantitative and qualitative changes in groundwater with considering the autocorrelation coefficients in west of Lake Urmia, Iran. Environmental Earth Sciences, v. 75, n. 5, p. 371, 2016. http://dx.doi.org/10.1007/s12665-015-4917-2.
ANDRADE, T. S.; MONTENEGRO, S. M. G. L.; MONTENEGRO, A. A. A.; RODRIGUES, D. F. B. Estimation of alluvial recharge in the semiarid. Revista Brasileira de Engenharia Agrícola, v. 34, n. 2, p. 211-221, 2014. http://dx.doi.org/10.1590/S0100-69162014000200003.
ANDRADE, T. S.; MONTENEGRO, S. M. G. L.; MONTENEGRO, A. A. A.; RODRIGUES, D. F. B. Variabilidade espaço-temporal da condutividade elétrica da água subterrânea na região semiárida de Pernambuco. Revista Brasileira de Engenharia Agrícola e Ambiental, v. 16, n. 5, p. 496-504, 2012. http://dx.doi.org/10.1590/S1415-43662012000500005.
ARSLAN, H. Determination of temporal and spatial variability of groundwater irrigation quality using geostatistical techniques on the coastal aquifer of Çarşamba Plain, Turkey, from 1990 to 2012. Environmental Earth Sciences, v. 76, n. 38, p. 1-12, 2017.
Figure 4. Temporal map of groundwater level (A, B, C and D), Electrical Conductivity (E, F, G and H), rainfall (I) and reference evapotranspiration (J).
RBRH, Porto Alegre, v. 22, e54, 2017
Temporal dependence of potentiometric levels and groundwater salinity in alluvial aquifer upon rainfall and evapotranspiration
BERNDT, C.; RABIEI, E.; HABERLANDT, U. Geostatistical merging of rain gauge and radar data for high temporal resolutions and various station density scenarios. Journal of Hydrology, v. 508, p. 88-101, 2014. http://dx.doi.org/10.1016/j.jhydrol.2013.10.028.
CHEN, L.; FENG, Q. Geostatistical analysis of temporal and spatial variations in groundwater levels and quality in the Minqin oasis, Northwest China. Environmental Earth Sciences, v. 70, n. 3, p. 1367-1378, 2013. http://dx.doi.org/10.1007/s12665-013-2220-7.
CORRÊA, M. M.; RIBEIRO, M. R. Levantamento detalhado de solos da Fazenda Nossa Senhora do Rosário (Pesqueira-PE). Recife: Universidade Federal Rural de Pernambuco, 2001. 35 p. Convênio: UFRPE/UFPE/CNPq/BNB.
DELBARI, M.; MOTLAGH, M. B.; AMIRI, M. Spatio-temporal variability of groundwater depth in the Eghlid aquifer in southern Iran. Earth-Science Reviews, v. 17, p. 105-114, 2013.
DOKOU, Z.; KOURGIALAS, N. N.; KARATZAS, G. P. Assessing groundwater quality in Greece based on spatial and temporal analysis. Environmental Monitoring and Assessment, v. 187, n. 12, p. 1-15, 2015. PMid:26612565. http://dx.doi.org/10.1007/s10661-015-4998-0.
FONTES JÚNIOR, R. V. P.; MONTENEGRO, A. A. A.; MONTENEGRO, S. M. G. L.; SANTOS, T. E. M. Estabilidade temporal da potenciometria e da salinidade em vale aluvial no semiárido de Pernambuco. Revista Brasileira de Engenharia Agrícola e Ambiental, v. 16, n. 11, p. 1188-1197, 2012. http://dx.doi.org/10.1590/S1415-43662012001100007.
GARDNER, P. M.; HEILWEIL, V. M. Evaluation of the effects of precipitation on ground-water levels from wells in selected alluvial aquifers in Utah and Arizona, 1936-2005. Arizona: US Geological Survey Scientific Investigations Report, 2009.
IBRAKHIMOV, M.; KHAMZINA, A.; FORKUTSA, I.; PALUASHEVA, G.; LAMERS, J. P. A.; TISCHBEIN, B.; VLEK, P. L. G.; MARTIUS, C. Groundwater table and salinity: spatial and temporal distribution and influence on soil salinization in Khorezm region (Uzbekistan, Aral Sea Basin). Irrigation and Drainage Systems, v. 21, n. 3-4, p. 219-236, 2007. http://dx.doi.org/10.1007/s10795-007-9033-3.
JOURNEL, A. G.; HUIJBREGTS, C. J. Mining geostatistics. London: Academic Press, 1978. 600 p.
KHORASANI, M.; EHTESHAMI, M.; GHADIMI, H.; SALARI, M. Simulation and analysis of temporal changes of groundwater depth using time series modeling. Modeling Earth System Environment, v. 2, n. 90, p. 1-10, 2016.
KONUKCU, F.; GOWING, J. W.; ROSE, D. A. Dry drainage: a sustainable solution to waterlogging and salinity problems in irrigation areas? Agricultural Water Management, v. 83, n. 1-2, p. 1-12, 2006. http://dx.doi.org/10.1016/j.agwat.2005.09.003.
LIANG, X.; ZHANG, Y.-K. Temporal and spatial variation and scaling of groundwater levels in a bounded unconfined aquifer. Journal of Hydrology, v. 479, p. 139-145, 2013. http://dx.doi.org/10.1016/j.jhydrol.2012.11.044.
LIMA, J. S. S.; SILVA, S. A.; OLIVEIRA, R. B.; CECÍLIO, R. A.; XAVIER, A. C. Variabilidade temporal da precipitação mensal em Alegre – ES. Revista Ciência Agronômica, v. 39, p. 327-332, 2008.
LIU, G.; LI, J.; ZHANG, X.; WANG, X.; LV, Z.; YANG, J.; SHAO, H.; YU, H. GIS-mapping spatial distribution of soil salinity for Eco-restoring the Yellow River Delta in combination with Electromagnetic Induction. Ecological Engineering, v. 94, p. 306-314, 2016. http://dx.doi.org/10.1016/j.ecoleng.2016.05.037.
LOPEZ, B.; BARAN, N.; BOURGINE, B. An innovative procedure to assess multi-scale temporal trends in groundwater quality: Example of the nitrate in the Seine-Normandy basin, France. Journal of Hydrology, v. 522, p. 1-10, 2015. http://dx.doi.org/10.1016/j.jhydrol.2014.12.002.
MACHIWAL, D.; MISHRA, A.; JHA, M. K.; SHARMA, A.; SISODIA, S. S. Modeling Short-Term Spatial and Temporal Variability of Groundwater Level Using Geostatistics and GIS. Natural Resources Research, v. 21, n. 1, p. 117-136, 2012. http://dx.doi.org/10.1007/s11053-011-9167-8.
MELO, R. O.; MONTENEGRO, A. A. A. Dinâmica temporal da umidade do solo em uma bacia hidrográfica no semiárido Pernambucano. Revista Brasileira de Recursos Hídricos, v. 20, n. 2, p. 430-441, 2015. http://dx.doi.org/10.21168/rbrh.v20n2.p430-441.
MONTEIRO, A. L. N.; MONTENEGRO, A. A. A.; MONTENEGRO, S. M. G. L. Modelagem de fluxo e análise do potencial hídrico de aquífero aluvial no semiárido de Pernambuco. Revista Brasileira de Recursos Hídricos, v. 19, n. 3, p. 151-163, 2014. http://dx.doi.org/10.21168/rbrh.v19n3.p151-163.
MONTENEGRO, A. A. A. Stochastic Hydrologeological modelling of aquifer salinization from small scale agriculture in Northeast Brazil. 1997. 272 p. Thesis. Newcastle University, United Kingdom, 1997.
MONTENEGRO, A. A. A.; COSTA NETTO, M. L.; MONTENEGRO, S. M. G. L.; SILVA, E. F. F.; FONTES JÚNIOR, R. V. P. Avaliação da salinidade de Neossolo usando-se dispositivo de indução eletromagnética. Revista Brasileira de Engenharia Agrícola e Ambiental, v. 14, p. 187-195, 2010. http://dx.doi.org/10.1590/S1415-43662010000600007.
NEVES, M. C.; COSTA, L.; MONTEIRO, J. P. Climatic and geologic controls on the piezometry of the Querença-Silves karst aquifer, Algarve (Portugal). Hydrogeology Journal, v. 24, p. 1015-1028, 2016.
RAMOS, C. M. C.; SILVA, A. F.; SARTORI, A. A. C.; ZIMBACK, C. R. L.; BASSOI, L. H. Modelagem da variação horária da temperatura do ar em Petrolina, Pe, e Botucatu, SP. Revista Brasileira de Engenharia Agrícola e Ambiental, v. 15, n. 9, p. 959-965, 2011. http://dx.doi.org/10.1590/S1415-43662011000900012.

RBRH, Porto Alegre, v. 22, e54, 2017
Fontes Júnior and Montenegro
ROSSI, M. P.; ALA-AHO, P.; RONKANEN, A.-K.; KLØVE, B. Groundwater-surface water interaction between an esker aquifer and a drained fen. Journal of Hydrology, v. 432-433, p. 52-60, 2012. http://dx.doi.org/10.1016/j.jhydrol.2012.02.026.
ROUHANI, S.; MYERS, D. E. Problems in space-time kriging of geohydrological data. Mathematical Geology, v. 22, n. 5, p. 611-623, 1990. http://dx.doi.org/10.1007/BF00890508.
SANTOS, T. E. M.; MONTENEGRO, A. A. A.; SILVA, D. D. Umidade do solo no semiárido pernambucano usando-se reflectometria no domínio do tempo (TDR). Revista Brasileira de Engenharia Agrícola e Ambiental, v. 15, n. 7, p. 670-679, 2011. http://dx.doi.org/10.1590/S1415-43662011000700004.
SANTOS, T. E. M.; SOUZA, E. R.; MONTENEGRO, A. A. A. Modeling of soil water infiltration with rainfall simulator in different agricultural systems. Revista Brasileira de Engenharia Agrícola e Ambiental, v. 20, n. 6, p. 513-518, 2016. http://dx.doi.org/10.1590/1807-1929/agriambi.v20n6p513-518.
SARTORI, A. A. C.; SILVA, F. A.; RAMOS, C. M. C.; ZIMBACK, C. R. L. Variabilidade temporal e mapeamento dos dados climáticos de Botucatu-SP. Irriga, v. 15, n. 2, p. 131-139, 2010. http://dx.doi.org/10.15809/irriga.2010v15n2p131.
SEEBOONGRUANG, U. An empirical decomposition of deep groundwater time series and possible link to climate variability. Global NEST Journal, v. 16, n. 1, p. 87-103, 2014.
SILVA, J. R. L.; MONTENEGRO, A. A. A.; MONTEIRO, A. L. N.; SILVA JÚNIOR, V. P. Modelagem da dinâmica de umidade do solo em diferentes condições de cobertura no semiárido pernambucano. Revista Brasileira de Ciências Agrárias, v. 10, n. 2, p. 293-303, 2015. http://dx.doi.org/10.5039/agraria.v10i2a4219.
SOUZA, E. R.; MONTENEGRO, A. A. A.; MONTENEGRO, S. M. G. M.; MATOS, J. A. Temporal stability of soil moisture in irrigated carrot crops in Northeast Brazil. Agricultural Water Management, v. 99, p. 26-32, 2011.
WARRICK, A. W.; NIELSEN, D. R. Spatial variability of soil physical properties in the Field. In: HILLEL, D. (Ed.). Applications of soil physics. New York: Academic, 1980. p. 319-344.
Authors contributions
Robertson Valério de Paiva Fontes Júnior: Assembling the experiment and collecting data; Tabulation, statistical and geostatistical analysis of data and creation of tables and figures; Writing the text and standardizing the standards according to the journal; Review of the text and addition of significant parts.
Abelardo Antônio de Assunção Montenegro: Assembling the experiment and collecting data; Tabulation, statistical and geostatistical analysis of data and creation of tables and figures; Writing the text and standardizing the standards according to the journal; Review of the text and addition of significant parts.