temporal scales of coastal variability and land-ocean processes j. salisbury, j. campbell, d....
Post on 22-Dec-2015
214 views
TRANSCRIPT
Temporal scales of coastal variability and land-ocean processes
J. Salisbury, J. Campbell, D. Vandemark, A. Mahadevan, B. Jonsson, H. Xue, C. Hunt

miss2Slides for discussion:
Temporal scales of coastal
variability and land-ocean processes

• Issues– Land fluxes daily variability – Phytoplankton - respiration– Production/sinking dynamics– Tides– Storms– Fronts– Probability of MODIS imagery in GOM?

Wayne Esaias Oceanus, 1981

U.S. Geological SurveyMarine and Coastal Geology Program

% Coverage per image
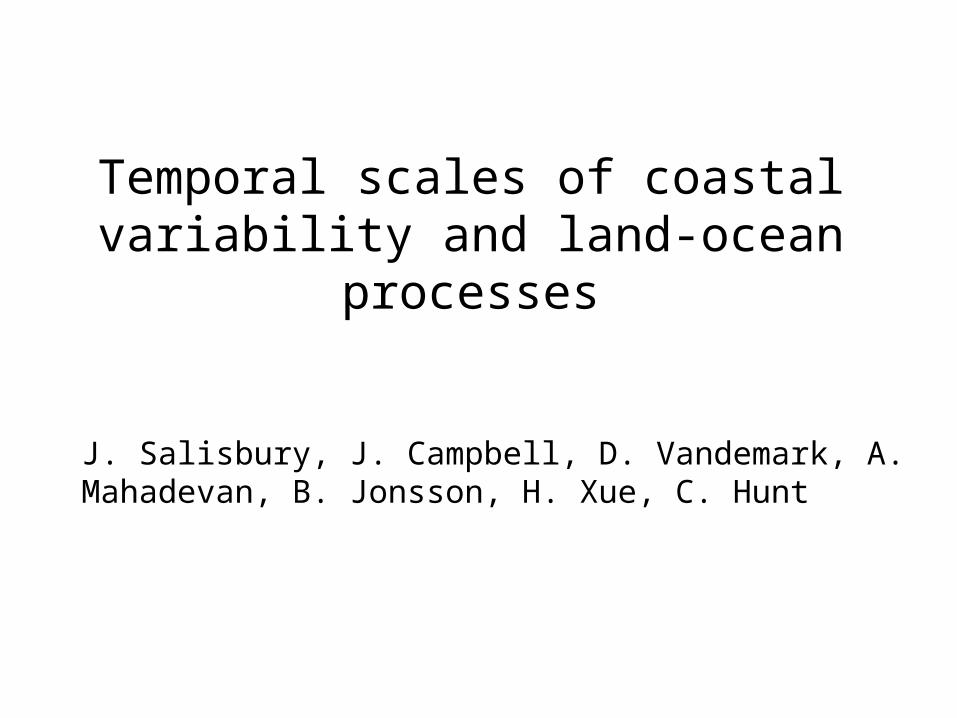
MODIS coverage in the Gulf of Maine
All data
Jonsson, Salisbury Mahadevan, 2007

% Coverage per image
MODIS coverage in the Gulf of Maine
> 30%
Jonsson, Salisbury Mahadevan, 2007
% Coverage
MODIS coverage in the Gulf of Maine
> 60%
Jonsson, Salisbury Mahadevan, 2007

Cruise days (in red) where we had >25% satellite coverage

miss2

QuickTime™ and aH.264 decompressor
are needed to see this picture.

Process studies: the case for staring

Relationship Between River Inputs and Coastal Ecosystem Properties
• Satellite evidence points towards linkages between high chlorophyll and river outflow
3 May 2004

Relationship Between River Inputs and Coastal Ecosystem Properties
• Relationship between river DIN flux and satellite-derived chlorophyll
Eastern Box
Western Box
Western Box
Source: Lohrenz et al. (2008)


Mao et al., 2005 (JGR)
QuickTime™ and aH.264 decompressor
are needed to see this picture.

DOC concentrations vs. EVIIpswich MA
0
0.10.2
0.3
0.4
0.50.6
0.7
0.8
2001 2002 2003 2004time
EVI Value
020040060080010001200140016001800
DOC (umol/l)
EVI-Developed land EVI-Forest land DOC - Ipswich
drought conditions

Station DataStation Data

Short-term changes of bio-optical properties

Backscattering and Chl-a
December 2004 January 2005

Backscattering and Chl-a
Power spectra

Short-term changes in cyanobacteria bloom size

Addressing horizontal motion in remotely sensed data:
Lagrangian tracking of satellite products with a numerical model: NASA-NNH07ZDA001N-Carbon
J.Salisbury (PI), A. Mahadevan, B. Jonsson, J.Tweddle and D. Vandemark.

Jonsson, Salisbury, Mahadevan, Campbell, (2008a, 2008b)
POCt1
POCt2
(POCt2 - POCt1)
(t2 - t1)DICuptake
Ocean color (MODIS) derived POC tracked over “Lagrangian” space-time
Same premise: to the first order:
POCPHYTO ≈ DICuptake ≈ NCP

More assumptions:
1. For this exercise, phytoplankton POCPHYTO : Chl was constant (~60:1)*
3. Sinking, vertical mixing and phyto DOC are minimal, over short (2-7 day) time scales
2. Depth of integration was Kd490nm-1

Methods:
1. Characterize advection in 2 dimensions using a circulation model

QuickTime™ and aH.264 decompressor
are needed to see this picture.

Methods:
Seed the model with satellite-derived POC
(POC based on chlorophyll shown)

QuickTime™ and aH.264 decompressor
are needed to see this picture.

POC at t2 (+ 5 days) POC at t1
Estimate the difference in a Lagrangian frame of reference

QuickTime™ and aH.264 decompressor
are needed to see this picture.

Jonnson et al., 2009
- numbers are reasonable (relative to Salisbury et al, 2009)
- seasonal variability is correct
- slightly above zero (inferred heterotrophic) over 3 years
Median NCP
- we need to try this in an area with less clouds
The results provide estimates of Gulf of Maine NCP over 3 years

Results are promising but we need to address:
- We need phytoplankton carbon from space!
- Mixing, advection (vertical and horizontal)
- Air-sea exchange of CO2
- Disparate ocean color and SST data sets
One broad conclusion for both topics:
Satellite color data contain valuable information about the temporal and spatial dynamics of DICuptake in the surface ocean.

This research is supported by:
NASA
NASA-NNH07ZDA001N-Carbon NASA - NNX06AE29G -NIP
- and NOAANOAA NA05NOS4731206
Thanks!

Our Lagrangian analysis methods also provide a realistic time- space interpolation.

Interpolation of a MODIS chl row over 5 days
Linear
Tim
e (5
days
)
Longitude
Lagrangian

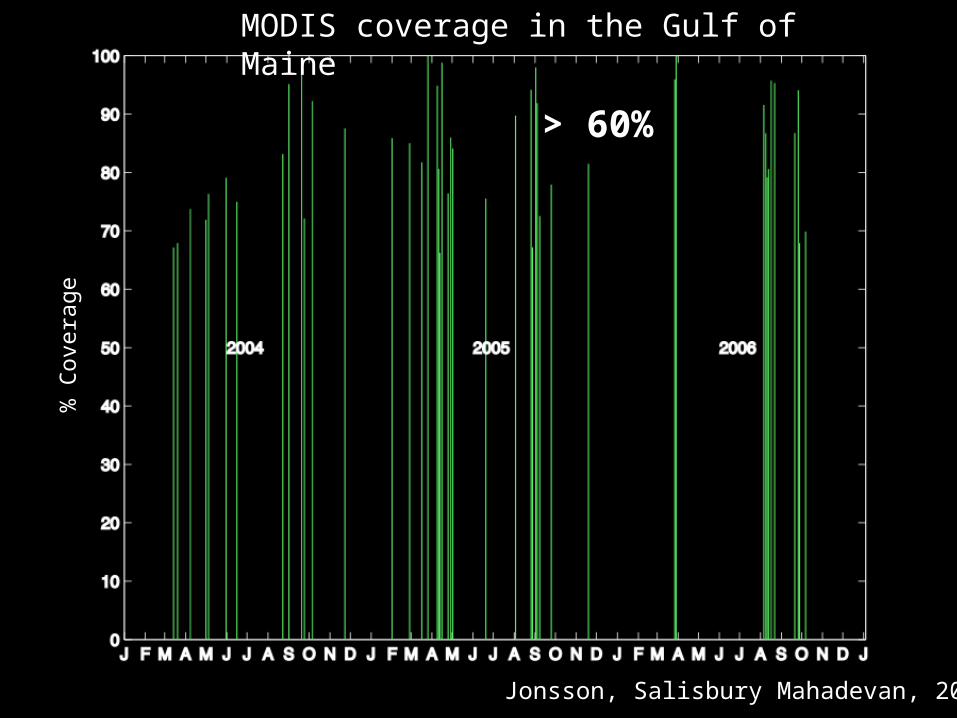
Results from Chalk-ex related to GEOCAPE: highlighting rapid rates
of dispersion of inanimate chalk particles in a Slope environment
William M. Balch, Bigelow Laboratory for Ocean Sciences, POB475, McKown Point Rd, W.
Boothbay Harbor, ME 04575

Chalk particles have slow sinking rates are optically active…


Mass of chalk

Mass of chalk
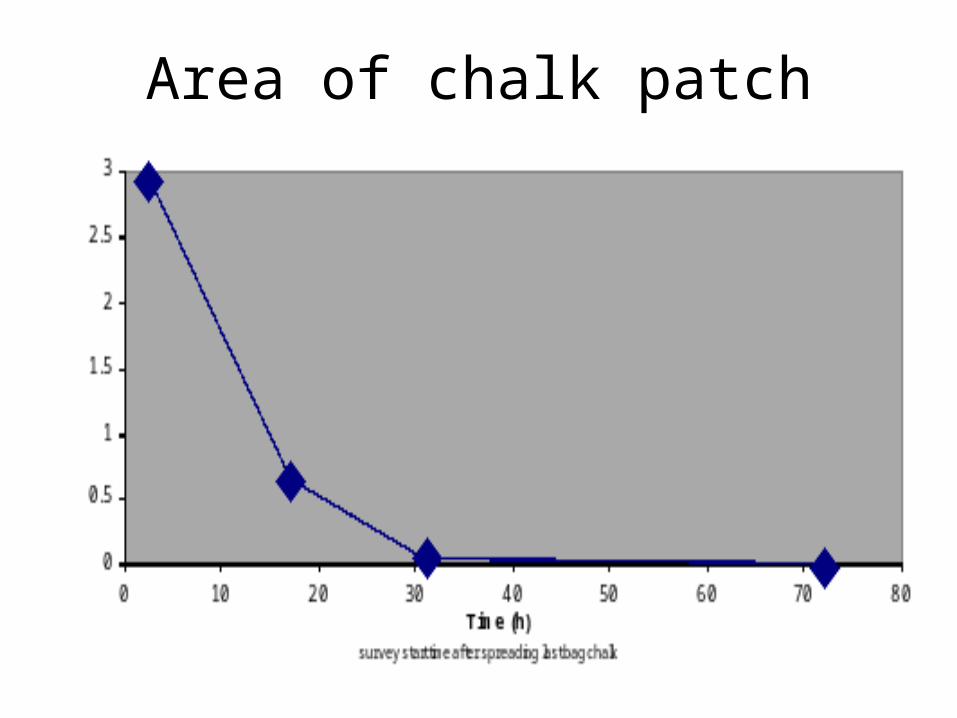
Area of chalk patch

Area of chalk patch