temptation and self control - columbia universitymd3405/be_temptation_1_15.pdf · 3/4/2015 1...
TRANSCRIPT

3/4/2015
1
Temptation and Self Control
Behavioral Economics:
ECON 1820: Brown University
Mark Dean
Temptation and Self Control
• One of the most important areas in behavioral economics• Lots of work:
– Theoretical: Gul, F. and W. Pesendorfer (2001) "Temptation and Self‐Control." Econometrica 69, 6 1403‐1435.
– Empirical: Ashraf, N., D. Karlan, and W. Yin (2006). Tying odysseus to the mast: Evidence‐ from a commitment savings product in the philippines. Quarterly Journal of Economics 121 (2), 635.
– Policy: Richard H. Thaler & Shlomo Benartzi, 2004. "Save More Tomorrow (TM): Using Behavioral Economics to Increase Employee Saving," Journal of Political Economy, University of Chicago Press, vol. 112(S1), pages S164‐S187, February.
• Popular for 3 reasons
(1) Temptation and Self Control Problems Seem to Be Ubiquitous
• Americans are fat
Obesity Trends* Among U.S. AdultsBRFSS, 1985
(*BMI ≥30, or ~ 30 lbs. overweight for 5’ 4” person)
No Data <10% 10%–14%
Obesity Trends* Among U.S. AdultsBRFSS, 1986
(*BMI ≥30, or ~ 30 lbs. overweight for 5’ 4” person)
No Data <10% 10%–14%
Obesity Trends* Among U.S. AdultsBRFSS, 1987
(*BMI ≥30, or ~ 30 lbs. overweight for 5’ 4” person)
No Data <10% 10%–14%

3/4/2015
2
Obesity Trends* Among U.S. AdultsBRFSS, 1988
(*BMI ≥30, or ~ 30 lbs. overweight for 5’ 4” person)
No Data <10% 10%–14%
Obesity Trends* Among U.S. AdultsBRFSS, 1989
(*BMI ≥30, or ~ 30 lbs. overweight for 5’ 4” person)
No Data <10% 10%–14%
Obesity Trends* Among U.S. AdultsBRFSS, 1990
(*BMI ≥30, or ~ 30 lbs. overweight for 5’ 4” person)
No Data <10% 10%–14%
Obesity Trends* Among U.S. AdultsBRFSS, 1991
(*BMI ≥30, or ~ 30 lbs. overweight for 5’ 4” person)
No Data <10% 10%–14% 15%–19%
Obesity Trends* Among U.S. AdultsBRFSS, 1992
(*BMI ≥30, or ~ 30 lbs. overweight for 5’ 4” person)
No Data <10% 10%–14% 15%–19%
Obesity Trends* Among U.S. AdultsBRFSS, 1993
(*BMI ≥30, or ~ 30 lbs. overweight for 5’ 4” person)
No Data <10% 10%–14% 15%–19%
3/4/2015
3
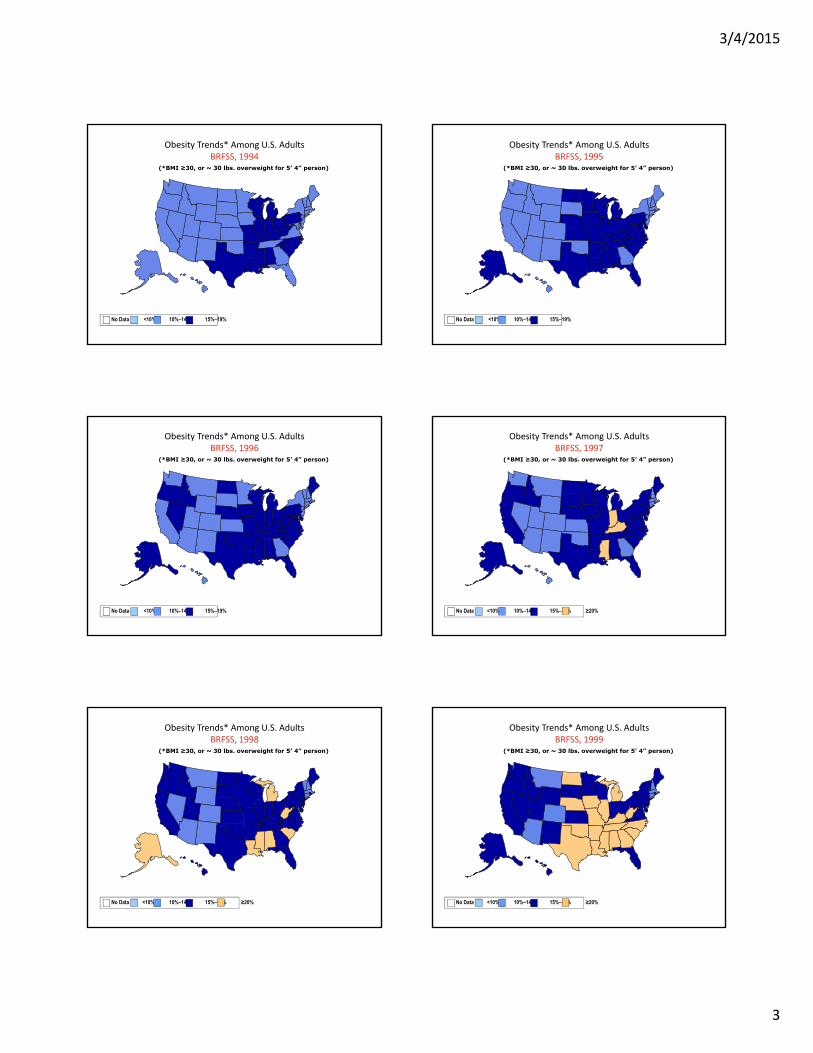
Obesity Trends* Among U.S. AdultsBRFSS, 1994
(*BMI ≥30, or ~ 30 lbs. overweight for 5’ 4” person)
No Data <10% 10%–14% 15%–19%
Obesity Trends* Among U.S. AdultsBRFSS, 1995
(*BMI ≥30, or ~ 30 lbs. overweight for 5’ 4” person)
No Data <10% 10%–14% 15%–19%
Obesity Trends* Among U.S. AdultsBRFSS, 1996
(*BMI ≥30, or ~ 30 lbs. overweight for 5’ 4” person)
No Data <10% 10%–14% 15%–19%
Obesity Trends* Among U.S. AdultsBRFSS, 1997
(*BMI ≥30, or ~ 30 lbs. overweight for 5’ 4” person)
No Data <10% 10%–14% 15%–19% ≥20%
Obesity Trends* Among U.S. AdultsBRFSS, 1998
(*BMI ≥30, or ~ 30 lbs. overweight for 5’ 4” person)
No Data <10% 10%–14% 15%–19% ≥20%
Obesity Trends* Among U.S. AdultsBRFSS, 1999
(*BMI ≥30, or ~ 30 lbs. overweight for 5’ 4” person)
No Data <10% 10%–14% 15%–19% ≥20%

3/4/2015
4
Obesity Trends* Among U.S. AdultsBRFSS, 2000
(*BMI ≥30, or ~ 30 lbs. overweight for 5’ 4” person)
No Data <10% 10%–14% 15%–19% ≥20%
Obesity Trends* Among U.S. AdultsBRFSS, 2001
(*BMI ≥30, or ~ 30 lbs. overweight for 5’ 4” person)
No Data <10% 10%–14% 15%–19% 20%–24% ≥25%
(*BMI ≥30, or ~ 30 lbs. overweight for 5’ 4” person)
Obesity Trends* Among U.S. AdultsBRFSS, 2002
No Data <10% 10%–14% 15%–19% 20%–24% ≥25%
Obesity Trends* Among U.S. AdultsBRFSS, 2003
(*BMI ≥30, or ~ 30 lbs. overweight for 5’ 4” person)
No Data <10% 10%–14% 15%–19% 20%–24% ≥25%
Obesity Trends* Among U.S. AdultsBRFSS, 2004
(*BMI ≥30, or ~ 30 lbs. overweight for 5’ 4” person)
No Data <10% 10%–14% 15%–19% 20%–24% ≥25%
Obesity Trends* Among U.S. AdultsBRFSS, 2005
(*BMI ≥30, or ~ 30 lbs. overweight for 5’ 4” person)
No Data <10% 10%–14% 15%–19% 20%–24% 25%–29% ≥30%

3/4/2015
5
Obesity Trends* Among U.S. AdultsBRFSS, 2006
(*BMI ≥30, or ~ 30 lbs. overweight for 5’ 4” person)
No Data <10% 10%–14% 15%–19% 20%–24% 25%–29% ≥30%
Obesity Trends* Among U.S. AdultsBRFSS, 2007
(*BMI ≥30, or ~ 30 lbs. overweight for 5’ 4” person)
No Data <10% 10%–14% 15%–19% 20%–24% 25%–29% ≥30%
Obesity Trends* Among U.S. AdultsBRFSS, 2008
(*BMI ≥30, or ~ 30 lbs. overweight for 5’ 4” person)
No Data <10% 10%–14% 15%–19% 20%–24% 25%–29% ≥30%
Obesity Trends* Among U.S. AdultsBRFSS, 2009
(*BMI ≥30, or ~ 30 lbs. overweight for 5’ 4” person)
No Data <10% 10%–14% 15%–19% 20%–24% 25%–29% ≥30%
Obesity Trends* Among U.S. AdultsBRFSS, 2010
(*BMI ≥30, or ~ 30 lbs. overweight for 5’ 4” person)
No Data <10% 10%–14% 15%–19% 20%–24% 25%–29% ≥30%
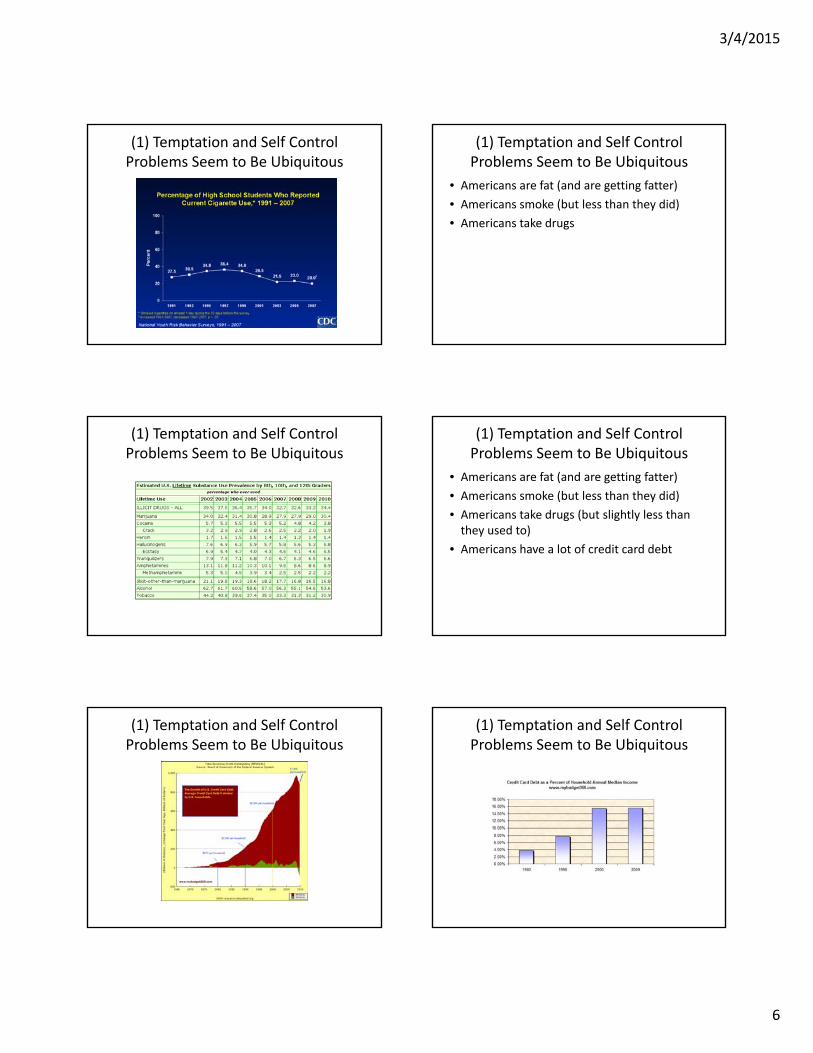
(1) Temptation and Self Control Problems Seem to Be Ubiquitous
• Americans are fat (and are getting fatter)
• Americans smoke
3/4/2015
6
(1) Temptation and Self Control Problems Seem to Be Ubiquitous
(1) Temptation and Self Control Problems Seem to Be Ubiquitous
• Americans are fat (and are getting fatter)
• Americans smoke (but less than they did)
• Americans take drugs
(1) Temptation and Self Control Problems Seem to Be Ubiquitous
(1) Temptation and Self Control Problems Seem to Be Ubiquitous
• Americans are fat (and are getting fatter)
• Americans smoke (but less than they did)
• Americans take drugs (but slightly less than they used to)
• Americans have a lot of credit card debt
(1) Temptation and Self Control Problems Seem to Be Ubiquitous
(1) Temptation and Self Control Problems Seem to Be Ubiquitous

3/4/2015
7
(1) Temptation and Self Control Problems Seem to Be Ubiquitous
(1) Temptation and Self Control Problems Seem to Be Ubiquitous
• Americans are fat (and are getting fatter)
• Americans smoke (but less than they did)
• Americans take drugs (but slightly less than they used to)
• Americans have a lot of credit card debt (more than they used to AND have a balance at the end of the month)
• Americans wished they saved more– 76% of Americans wish that they
More of a Problem for Poorer Households ‐ Obesity
More of a Problem for Poorer Households ‐ Smoking
(2) Self Control Seems to be Linked to Late Life Outcomes
• “Delay of Gratification in Children” by Mischel et al. (Science 1989)– ‘Self control’ measured in 35 young (4 years old) children
– Children shown a worse and better reward (e.g. 1 marshmallow or 2 marshmallows)
– Told that they could wait until the experimenter comes back, and get the better reward
– Or press the bell and get the worse reward
– Temptation measured as length of time before bell is pressed
(2) Self Control Seems to be Linked to Late Life Outcomes
• Self Control at age of 4 correlated with later life outcomes
– SAT verbal and quantitative
– Parental ratings of coping ability as adolescents
• Only true for treatments in which rewards were exposed, not obscured

3/4/2015
8
(2) Self Control Seems to be Linked to Late Life Outcomes
• “A gradient of Childhood self control predicts health, wealth and public safety” Moffitt et al [2011] PNAS
– 1037 children in New Zealand
– Self control measured via
• Self reports
• Observations by researchers
• Reports by teachers and parents
– Combined in a single factor
(2) Self Control Seems to be Linked to Late Life Outcomes
(2) Self Control Seems to be Linked to Late Life Outcomes
• Results remain when intelligence controlled for
• In sibling study, significant results for– Smoking as a 12 year old
– School performance
– Antisocial behavior
• Cohort born in 1994, so no adult outcomes yet
• Remember: correlation does not imply causation
(3) Something that the Standard Model Cannot Capture
• In the standard economic model of decision making, there is a single utility function that people maximize
• In choices over time, decision maker is assumed to be time consistent– Decisions maker at time t agrees with themselves at time t+1
– Even if tastes change
• No room for concepts of temptation or self control
How Do We Spot Someone Having a Temptation/Self Control Problem?
• Loosely speaking “Doing something in the moment that is against your long run interests”
How Do We Spot Someone Having a Temptation/Self Control Problem?
1. We see them doing something naughty– i.e. we identify self control problems with activities
certain activities• Smoking
• Drug taking
• Undersaving
– There is no ‘rational’ reason to take drugs, so anyone who takes drugs must be in the grip of a self control problem
– This goes against standard economic methodology
– Very proscriptive – maybe benefit of cigarette smoking is higher than long term costs for some people

3/4/2015
9
How Do We Spot Someone Having a Temptation/Self Control Problem?
2. They tell us that they want to do one thing, then do another
– For example, tell us that they want to quit smoking, but then carry on smoking
– Hard to interpret this data – why do we treat what they say as more important than what they do?
– In general, economists feel that they know how to deal with ‘self reports’, but know how to deal with choice
– If someone says they want to do a, but actually does b, we would generally consider this evidence that they prefer b over a
– Talk is cheap
How Do We Spot Someone Having a Temptation/Self Control Problem?
3. They change their mind– For example:
• People repeatedly quit smoking, then restart
• People take drugs when they are younger but not when they are older
• People smoke when drunk, but not when sober
– Hard to distinguish between temptation and changing tastes
– Maybe drinking and cigarette smoking are compliments?
Two Approaches to Spotting Temptation and Self Control Problems
1. Preference for Commitment
2. Time Inconsistency in Discounting
Preference For Commitment
• Imagine we saw the following behaviors:
• A gambler asks to be banned from a casino
• A drinker asks to be given a drug that makes them violently ill if they drink
• A diner pays to have a smaller portion of fries with their meal
• In other words, choosing to reduce their choice set in the future
• (all of these happen in real life)
Preference For Commitment
• I would argue that these are signs of temptation/self control problems• Time t self is worried that time t+1 self will do
something that they do not like• Therefore restricts options available to their t+1 self• At time t, removes the option to drink at time t+1
• Such behavior would not be exhibited by someone who • Was perfectly happy with the amount they drank• Had changing preferences over drinking, but were
happy to make a game‐time decision• Stops talk being cheap
Time Inconsistency
• Imagine we saw the following behaviors:• A (very thirsty) decision maker chooses juice now over
twice the amount of juice in 5 mins• Also chooses juice in 20 minutes over twice the amount
of juice in 25 minutes. • This is a ‘preference reversal’• Arguably, this is also an example of a self control problem
• Presumably, in 20 minutes, you would choose juice today over 2 times juice in 5 minutes
• So your preferences now disagree with preferences in 20 minutes time
• Assumes that now is the same as 20 minutes time in all other respects
3/4/2015
10
Is Time Inconsistency the Same as Preference for Commitment?
• Augenblick, Niederle and Sprenger [2015]• Measured time preferences in a real effort task
• Have a certain number of tasks to do (greektranslation)
• Allocate these tasks between two date d1 and d2• Compare allocation chosen at d0 (before d1) and at d1
• Find evidence of present bias (on average allocate 9% more tasks to d1 at d0 than at d1
• Offered same subjects a commitment device• Made it more likely that d0 choices would be used that
d1 choices• 59% of subjects make use of commitment• Present bias predictive of demand for commitment