ten minutes to select the research reports you want to buy. twenty minutes to complete the pro forma...
TRANSCRIPT

• Ten minutes to select the research reports you want to buy.
• Twenty minutes to complete the pro forma and email a copy to me. Please put your group members’ names on it.
• Meet back here at 8:20, ready to discuss the case and make recommendations.
SD CoorsTable A $1,000
Table B $1,500
Table C $2,000
Table D $1,000
Table E $200
Table F $49.50
Table G $6,000
Table H $4,800
Table I $2,000
$18,550To purchase research, bring a piece of paper with the requested reports & the total price.

Product Management• Ability to develop and deliver superior-quality and/or
customized goods and services. Communications Management and Brand-building capability• Create value perceptions leading to high levels of brand equity,
using effective: positioning, advertising, communications, Pricing Management• Ability to extract the optimal revenue & profit from customers Channel Management• Ability to establish and manage channels of distribution that
effectively and efficiently deliver value to end-user customers Customer Relationship Management• Leverage relationships with profitable prospects and customers
to create superior customer-level profits. Market Sensing & Customer Insights• Learn about customers, competitors, channel members and the
broader market to develop actionable intelligence Marketing Planning & Implementation• Implement marketing strategies that optimize the match
between the firm’s resources and the marketplace
Compared to Miller’s & Anheuser-Busch, Coors’ capabilities appear to be:
Inferior Equivalent Superior
Inferior Equivalent Superior
Inferior Equivalent Superior
Inferior Equivalent Superior
Inferior Equivalent Superior
Inferior Equivalent Superior
Inferior Equivalent Superior

Product Management• Ability to develop and deliver superior-quality and/or
customized goods and services. Communications Management and Brand-building capability• Create value perceptions leading to high levels of brand equity,
using effective: positioning, advertising, communications, Pricing Management• Ability to extract the optimal revenue & profit from customers Channel Management• Ability to establish and manage channels of distribution that
effectively and efficiently deliver value to end-user customers Customer Relationship Management• Leverage relationships with profitable prospects & customers
to create superior customer-level profits. Market Sensing & Customer Insights• Learn about customers, competitors, channel members & the
broader market to develop actionable intelligence Marketing Planning & Implementation• Implement marketing strategies that optimize the match
between the firm’s resources and the marketplace
Compared to other distributors, Brownlow’s capabilities appear to be:
Inferior Equivalent Superior
Inferior Equivalent Superior
Inferior Equivalent Superior
Inferior Equivalent Superior
Inferior Equivalent Superior
Inferior Equivalent Superior
Inferior Equivalent Superior

Opportunity Analysis/CustomersKey Learning Points
• A general framework for managing market segments & individual customers.– Defining & Segmenting the Product Market– Selecting & Targeting Key Segments• Acquisition, Retention & Expansion
– Positioning• Quantifying the Value of a Customer (Segment)
w/customer-centric metrics– CRM, CLV, & Customer Equity
4

Customer Relationship Management (CRM)Retention & Expansion
Segmentation
Selection
Targeting– Acquisition– CRM:
Retention & Expansion
Break market into groups (segments) that respond differently to elements of the marketing mix.
Identify segments that will respond most positively (i.e., profitably) to firm’s offerings. Concentrated vs. differentiated targeting strategy.
Determine how to best acquire, retain & expand purchases by the most profitable segments. CRM tracks customers behavior to select, target & retain most profitable customers.
5

Customer Relationship Management ProgramsCustomer-centric Marketing Differentiation
CRM Satisfaction, Retention & Relationship Expansion
Frequency/Loyalty Programs
AAdvantage
Rewards Programs
Capital One Cards
Customization
IBM
Customer Service
Nordstrom
Community BuildingFacebook,
Apple
6

• Marketing Pro Formas • Breakeven Analysis• Customer Lifetime Value (CLV)• Sales Forecasts• Economic Value Analysis• Channel Margin Calculus• Demand Elasticity
Financial Analysis in MarketingK&P Chapter 2
See the Final Exam sample questions.
7

Customer Life Cycle Profit Pattern in the Credit-Card Industry
8

CRM Metrics If you don’t have these metrics,
you don’t have CRM1. Primary Customer Metrics
a) Acquisition rateb) Acquisition costc) Retention rated) Survival rate
2. Popular Customer Metricsa) Share of category requirementb) Size of walletc) Share of wallet
3. Strategic Customer Value Metricsa) Past customer valueb) RFM valuec) Customer lifetime value (CLV)d) Customer equity
Traditional (Brand) Metrics
1. Sales – Volume & Revenues
2. Market Share
3. Sales Growth
Traditional vs. CRM Metrics
9

Customer Lifetime Value (CLV)Useful Analysis at the Individual Customer & Segment
CLVinfinite lifetime= CM/(i* + 1 – r) – ACwhereCM = average annual contribution for the customer (segment)i* = i (=the risk-free discount rate) × risk factorr = retention rate for the customer (segment)AC = acquisition costs
How valuable/profitable is each customer (segment) given prices & variable costs (i.e., contribution), retention rates, discount rate, risk level & acquisition costs?How valuable/profitable is an acquisition or retention campaign given prices & variable costs (i.e., contribution), retention rates, discount rate, risk level & acquisition costs?
― Growth rate
10

CLV (i=10%) as a function of Contribution Margin ($100-200) and Retention Rate (0-100%)$200 $182 $200 $222 $250 $286 $333 $400 $500 $667 $1,000 $2,000
$190 $173 $190 $211 $238 $271 $317 $380 $475 $633 $950 $1,900
$180 $164 $180 $200 $225 $257 $300 $360 $450 $600 $900 $1,800
$170 $155 $170 $189 $213 $243 $283 $340 $425 $567 $850 $1,700
$160 $145 $160 $178 $200 $229 $267 $320 $400 $533 $800 $1,600
$150 $136 $150 $167 $188 $214 $250 $300 $375 $500 $750 $1,500
$140 $127 $140 $156 $175 $200 $233 $280 $350 $467 $700 $1,400
$130 $118 $130 $144 $163 $186 $217 $260 $325 $433 $650 $1,300
$120 $109 $120 $133 $150 $171 $200 $240 $300 $400 $600 $1,200
$110 $100 $110 $122 $138 $157 $183 $220 $275 $367 $550 $1,100
$100 $91 $100 $111 $125 $143 $167 $200 $250 $333 $500 $1,000
0% 10% 20% 30% 40% 50% 60% 70% 80% 90% 100%
$286
$271
$257
$243
$229
$214
$200
$186
$171
$157
$143
40%
$667
$633
$600
$567
$533
$500
$467
$433
$400
$367
$333
80%
$222
$211
$200
$189
$178
$167
$156
$144
$133
$122
$111
20%
11

Customer Lifetime Value (CLV)Useful Analysis at the Individual Customer & Segment
CLVinfinite lifetime= CM/(i* + 1 – r) – ACwhereCM = average annual contribution for the customer (segment)i* = i (=the risk-free discount rate) × risk factorr = retention rate for the customer (segment)AC = acquisition costs
How valuable/profitable is each customer (segment) given prices & variable costs (i.e., contribution), retention rates, discount rate, risk level & acquisition costs?How valuable/profitable is an acquisition or retention campaign given prices & variable costs (i.e., contribution), retention rates, discount rate, risk level & acquisition costs?
― Growth rate
12

How much was a Facebook Customer Worth?
• 2008 Revenues: $300 $350 million • 2008 Unique Users: 80,000,000• CM (90%) ≈ $3.65 Round to $4.00 for simplicity
CLVinfinite lifetime = CM/(i* + 1 – r) – AC
IfCM =$4i* =.06r = .90AC = $0
= 4/(.06 + 1 - .9) – 04/.16$25
CLVinfinite lifetime
See Sample Acquisition Value CLV Final Exam Question 13
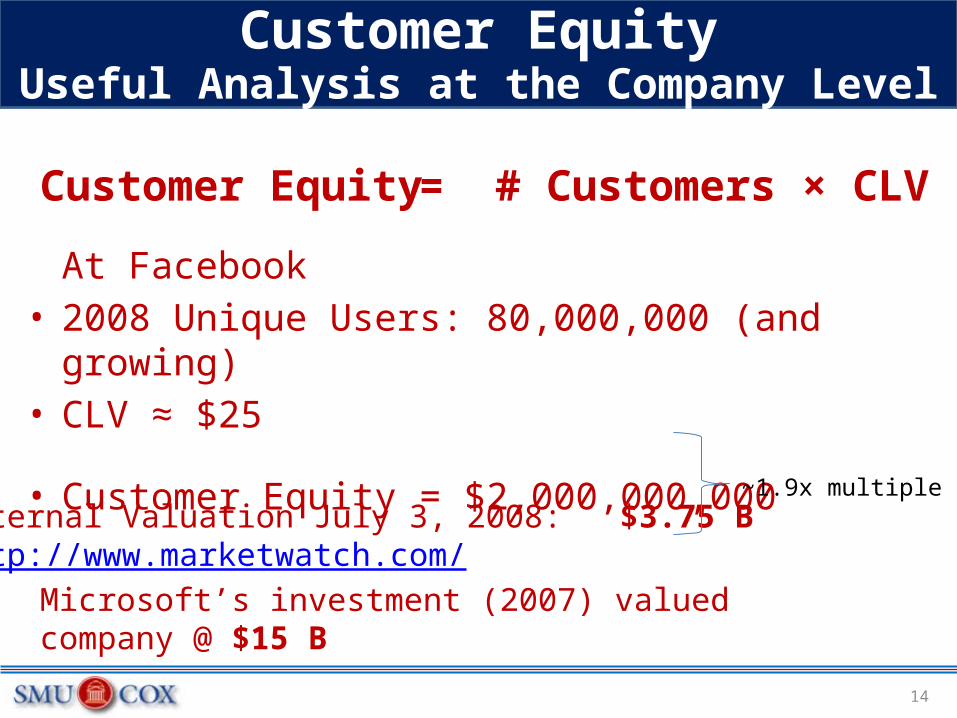
Customer EquityUseful Analysis at the Company Level
At Facebook• 2008 Unique Users: 80,000,000 (and growing)• CLV ≈ $25
• Customer Equity = $2,000,000,000
= # Customers × CLVCustomer Equity
Internal Valuation July 3, 2008: $3.75 Bhttp://www.marketwatch.com/Microsoft’s investment (2007) valued company @ $15 B
14
~1.9x multiple

Customer EquityFacebook Update June 2009
At Facebook• 2009 Unique Users: 250,000,000 (and growing)• If CLV ≈ $25
• Customer Equity = $6,250,000,000
= # Customers × CLVCustomer Equity
External Valuation May 29, 2009: $10.00 Bhttp://www.techcrunch.com
15
~1.6x multiple

Customer EquityFacebook Update January 2011
At Facebook• January 2011 Unique Users: 500,000,000 (and growing)• Revenue ≈ 1.97 B; CM (90%) ≈ $4• CLV ≈ $25
• Customer Equity = $12.5 B
= # Customers × CLVCustomer Equity
External Valuation January 2011: $50 BGoldman
16
~4x multiple

Customer EquityFacebook Update January 2012
At Facebook• January 2012 Unique Users: 800,000,000 • Revenue ≈ 3.7 B; CM (90%) ≈ $4• CLV ≈ $25
• Customer Equity = $20B
= # Customers × CLVCustomer Equity
External Valuation January 2012: ~$82 B
17
~4x multiple
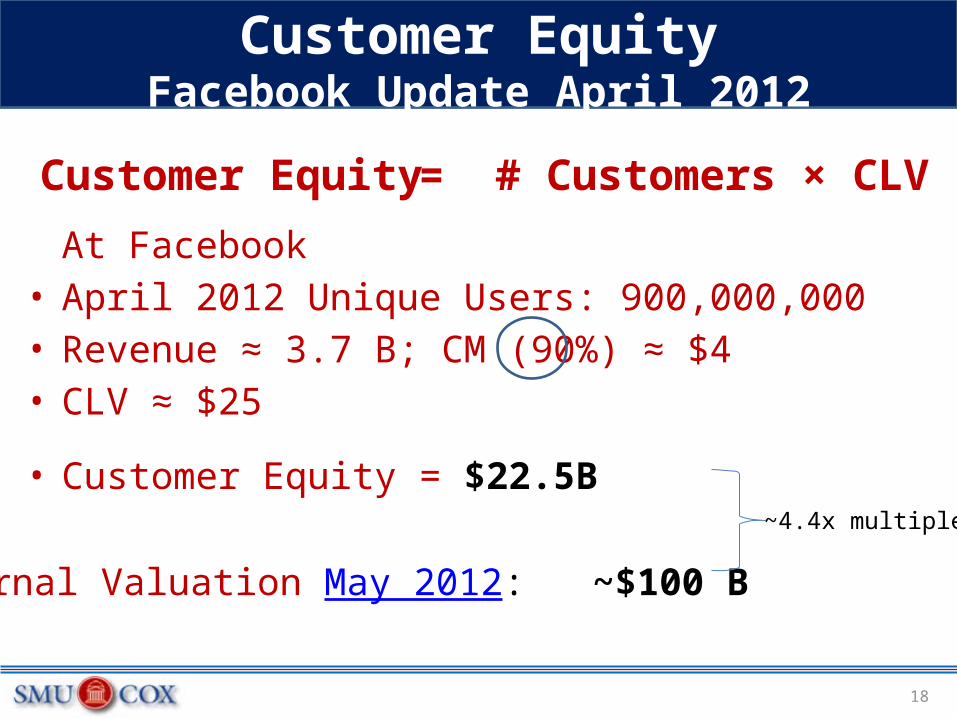
Customer EquityFacebook Update April 2012
At Facebook• April 2012 Unique Users: 900,000,000 • Revenue ≈ 3.7 B; CM (90%) ≈ $4• CLV ≈ $25
• Customer Equity = $22.5B
= # Customers × CLVCustomer Equity
External Valuation May 2012: ~$100 B
18
~4.4x multiple

Customer EquityFacebook Update July 2012
At Facebook• July 2012 Unique Users: 955,000,000 • Revenue ≈ 4.7 B; CM (90%) ≈ $4.4• CLV ≈ $27.50
• Customer Equity = $26.3B
= # Customers × CLVCustomer Equity
External Valuation August 2012: ~$50B
19
~1.9x multiple

Tracking Customer Equity & Facebook’s Market Valuation
20
2008 2009 2011 2012 2012 2012 July May January January April July
$0
$20,000,000
$40,000,000
$60,000,000
$80,000,000
$100,000,000
$120,000,000
Market ValuationCustomer Equity

Review Questions• What are the 3 steps in the general framework of
customer relationship management (CRM)?• How do you define and segment a product
market?• Which types of segmentation variables are most
frequently used in CRM?• What is the formula to calculate infinite customer
lifetime value (CLV)? Customer Equity?• Assignment for Next Week: Netflix
21