ten-year resurvey of epidermal browning and population ... census 2000.pdf · ten-year resurvey of...
TRANSCRIPT

Ten-Year Resurvey of Epidermal Browning and Population Structure of
Saguaro Cactus (Carnegiea gigantea) in Saguaro National Park
Dale S. Turner and Carianne S. Funicelli
Technical Report No. 69
United States Geological Survey Sonoran Desert Field Station The University of Arizona Tucson, Arizona
USGS Sonoran Desert Field Station The University of Arizona, Tucson The Sonoran Desert Field Station (SDFS) at The University of Arizona is a unit of the USGS Western Ecological Research Center (WERC). It was originally established as a National Park Service Cooperative Park Studies Unit (CPSU) in 1973 with a research staff and ties to The University of Arizona. Transferred to the USGS Biological Resources Division in 1996, the SDFS continues the CPSU mission of providing scientific data (1) to assist U.S. Department of Interior land management agencies within Arizona and (2) to foster cooperation among all parties overseeing sensitive natural and cultural resources in the region. It also is charged with making its data resources and researchers available to the interested public. Seventeen such field stations in California, Arizona, and Nevada carry out WERC’s work. The SDFS provides a multi-disciplinary approach to studies in natural and cultural sciences. Principal cooperators include the School of Renewable Natural Resources and the Department of Ecology and Evolutionary Biology at The University of Arizona. Unit scientists also hold faculty or research associate appointments at the university. The Technical Report series distributes information relevant to high priority regional resource management needs. The series presents detailed accounts of study design, methods, results, and applications possibly not accommodated in the formal scientific literature. Technical Reports follow SDFS guidelines and are subject to peer review and editing. Publications may contain findings that are preliminary but have immediate use to field workers in the region. Print runs are small, and distribution is generally limited to parties with a direct involvement in report topics.
Ten-Year Resurvey of Epidermal Browning and Population Structure of
Saguaro Cactus (Carnegiea gigantea) in Saguaro National Park
Dale S. Turner Carianne S. Funicelli
Technical Report No. 69
October 2000
United States Geological Survey Western Ecological Research Center
Sonoran Desert Field Station and
School of Renewable Natural Resources
125 Biological Sciences East The University of Arizona
Tucson, Arizona 85721
ii
Authors Dale S. Turner Carianne S. Funicelli Saguaro National Park 3693 South Old Spanish Trail Tucson, Arizona 85730 USGS Sonoran Desert Field Station Personnel William L. Halvorson, Research Ecologist Cecil R. Schwalbe, Ecologist Peter S. Bennett, Ecologist Michael R. Kunzmann, Ecologist Brooke S. Gebow, Editor Sandra Mosolf, Administrative Assistant Brenda Carbajal, Secretary (520) 670-6885; fax (520) 670-5001 As the nation’s largest water, earth, and biological science and civilian mapping agency, the USGS works in cooperation with more than 200 organizations across the country to provide reliable, impartial, scientific information to resource managers, planners, and other customers. This information is gathered in every state by USGS scientists to minimize loss of life and property from natural disasters, contribute to sound economic and physical development of the nation’s natural resources, and enhance the quality of life by monitoring water, biological, energy, and mineral resources. Reports in this series are produced in limited quantities. As long as the supply lasts, copies may be obtained from USGS Sonoran Desert Field Station, 125 Biological Sciences East, The University of Arizona, Tucson, AZ 85721. This report was printed on recycled paper.

iii
Contents
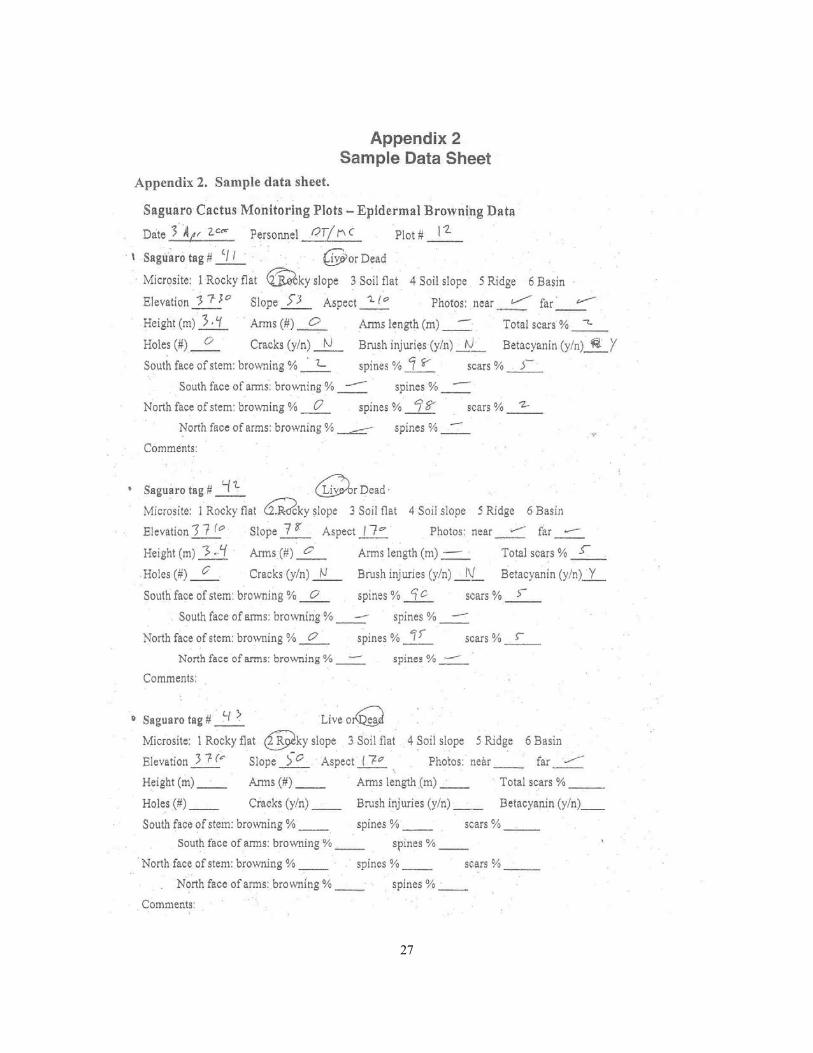
List of Figures ................................................................................................................. iv List of Tables ....................................................................................................................v Acknowledgements .................................................................................................................vi Executive Summary ....................................................................................................... vii Introduction.......................................................................................................................1 Epidermal Browning...................................................................................................1 Saguaro Population Density and Structure .................................................................3 Saguaro Cavities .........................................................................................................4 Methods Present Study ..............................................................................................................5 Eliminated Data ..........................................................................................................7 Differences from Original Study ................................................................................8 Time Budget................................................................................................................8 Results...............................................................................................................................9 Epidermal Browning...................................................................................................9 Saguaro Population Density and Structure ...............................................................12 Saguaro Cavities .......................................................................................................14 Errors in Original Study............................................................................................14 Discussion.......................................................................................................................20 Recommendations...........................................................................................................22 Literature Cited ...............................................................................................................23 Appendix 1. Study Plot Locations .................................................................................26 Appendix 2. Sample Data Sheet ....................................................................................27 Appendix 3. Saguaro Census Protocol ..........................................................................28
iv
Figures
Figure 1. Progression of Epidermal Browning ................................................................2 Figure 2. Saguaro National Park, Showing Plot Locations .............................................6 Figure 3. Saguaro Survival by Browning Class in 1990................................................11 Figure 4. Saguaro Survival by Height Class in 1990.....................................................11 Figure 5. Saguaro Population by Size Class on 18 Study Plots.....................................16 Figure 6. Saguaro Population by 1-m Size Class on 18 Study Plots .............................17 Figure 7. Saguaro Size Distribution in Rincon Mountain District.................................18 Figure 8. Saguaro Size Distribution in Tucson Mountain District ................................18
v
Tables Table 1. Correlation Matrix for Selected Variables.......................................................10 Table 2. Census Plot Results from 1990 and 2000 ........................................................13 Table 3. Area of Saguaro Distribution in Saguaro National Park..................................15 Table 4. Saguaro Population Density in Saguaro National Park ...................................15
vi
Acknowledgements This project was made possible by a generous grant from Canon USA, Inc., through the National Park Foundation. Additional support was provided by the Friends of Saguaro National Park, Student Conservation Association, Earth Friends, and Southwest Parks and Monuments Association. Funding proposals and project oversight were provided by Mark Holden and Pam Anning. Our study design and analysis benefited from discussions with Nancy Ferguson, Tom Orum, Betsy Pierson, and Ray Turner. This report was improved by external review comments from Tom Orum and Ray Turner, and internal review by Pamela Anning, Danielle Foster, Mark Holden, Natasha Kline, and Meg Weesner. Many people contributed to gathering, entering, and checking the data. From Saguaro National Park, these included: Pam Anning, Austin Aslan, Karen Bradford, Lisa Carder, Louise Conrad, Laura Denny, Andrew Farkas, Danielle Foster, Carin Harvey, Mark Holden, Donna King, Dale Kissner, Natasha Kline, Janis Koscielniak, Paula Nasiatka, Todd Nelson, Pamela Nicola, Lori Oldham, Katie Pencke, Brian Rutledge, Robert Stinson, Bo Stone, Don Swann, Keshari Thakali, Cris Trotter, Tiffany Volz, Mike Ward, Meg Weesner, and John Williams. Mohamad Chakaki, a volunteer with the Student Conservation Association, added tremendously to this effort. Other volunteers included: Juliette Benitez, Devon Biggs, Patrick Brick, Munish Chitkara, George Daher, David Dudley, Julia Fonseca, Sabine Frietsch, David Gay, Karen Lieneke, Carl Lienert, Robin Llewellyn, Al Mazzano, Daniel Mills, Monica Mueller, Cindy Salo, and Keith Shallcross. We were aided greatly by students on spring break from three universities: from Northern Colorado University, Brian Jordan, Rachel Haynes, Lee McMains, Holly Patterson, Eva Spagnolini, Cindy Tucker, and Cherry Lynn Tungpalan; from Humboldt State University, Amy Alvarez, Chris Bielecki, Meg Chafin, Claire Cunningham, Travis Fulton, Michael Hibma, Amanda Robinson, and Tom Stolberg; from University of Missouri, Tiffany Ellis, Mark Hewlett, Amy Miles, Cheryl Morton, Ryan Murdock, Jamie Schlereth, Jennifer Schlereth, Carolyn Szczepanski, Carrie Watkins, and Amy Wolf.
vii
Executive Summary This project at Saguaro National Park investigated the health and demography of the park’s most conspicuous resource, the saguaro cactus (Carnegiea gigantea). We conducted an extensive monitoring study on the size structure and health of saguaro populations in both park districts, which are separated by the rapidly growing city of Tucson. Of particular interest was the phenomenon of epidermal browning and its relationship to saguaro health. The causes of this condition are poorly understood, and this study documents its extent and effects on saguaro populations. Researchers collected baseline data for this study in 1990, when 1,350 saguaros were marked for long-term monitoring in 45 four-hectare plots. Thirty saguaros ≥ 2 m tall were randomly chosen on each study plot, and a variety of data was gathered on each. In addition, all saguaros > 10 cm tall on each plot were counted and measured to provide a demographic sampling of the park. This study was the park’s first opportunity to revisit those marked plants, and to analyze changes in epidermal browning over the past decade. It also represents an extensive effort to identify trends in saguaro demographics, critical information as the park continues to recover from historic damaging influences such as grazing, mining, and wood harvesting. Together, these studies may provide useful baseline data for identifying impacts from current influences such as air pollution, urban encroachment, increased visitation, and exotic species invasion. We found that during the past decade, epidermal browning of the surviving marked saguaros increased by 6%, with greater increases in those which were browner ten years ago. We also found evidence that epidermal browning has increased in the whole population, with a mean increase of 3.7% when comparing all saguaros in 18 plots. Among the marked population, 16.5% died during the past decade and epidermal browning appears to have some correlation with mortality. Among the saguaros with ≤ 10% browning in 1990, > 90% remain alive. The survival rate declined with increasing browning, so that among those with ≥ 40% browning in 1990, < 50% remain alive. Mortality also increased with height. Among those saguaros ≤ 5 m tall in 1990, > 90% remain alive. The survival rate declined with increasing height, so that among those ≥ 10 m tall in 1990, < 50% remain alive. Based on our census efforts in 18 of the study plots, we estimate the total population within Saguaro National Park is approximately 1,625,000 saguaros, a 35% increase over the 1990 estimate. Population density averaged 65 saguaros/ha in the lowlands of the Rincon Mountain District and 127 saguaros/ha in the Tucson Mountain District.
1
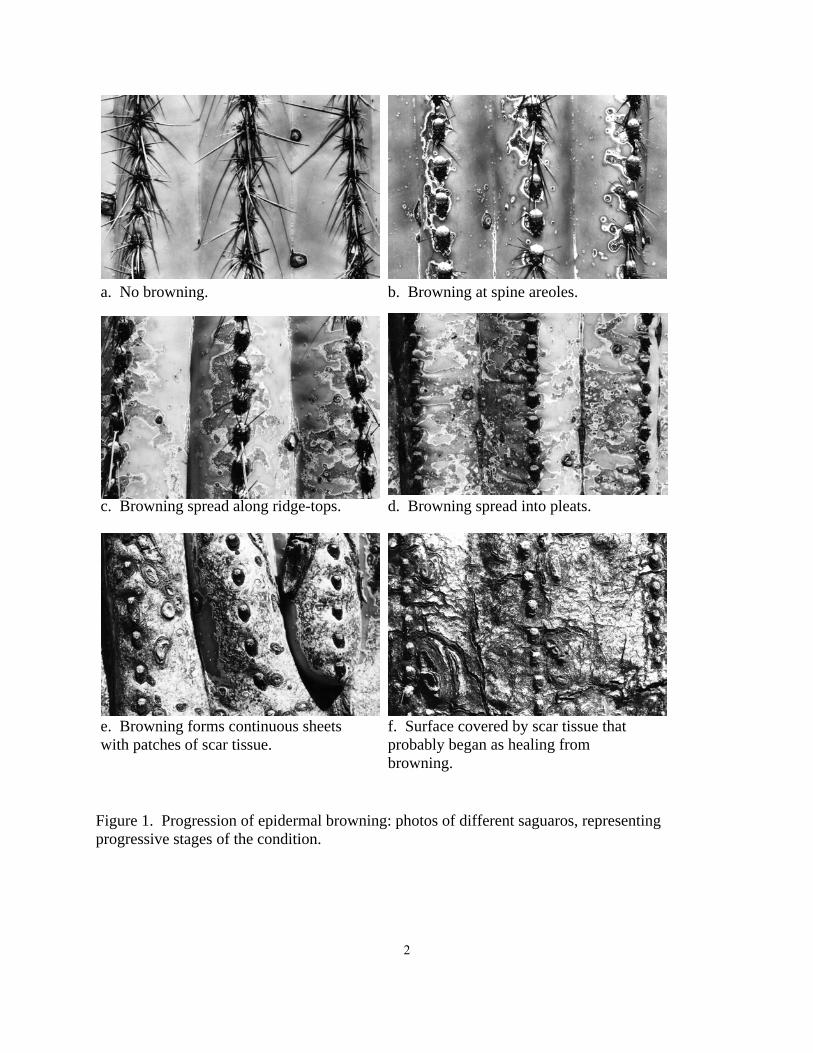
Introduction The saguaro cactus (Carnegiea gigantea) has long been the subject of popular interest and scientific inquiry. Particular concern has focused on the extent and causes of population-level declines, especially in the Rincon Mountain District (RMD) of Saguaro National Park (formerly Saguaro National Monument), Tucson, Arizona (McAuliffe 1993). Beginning in 1985, park service staff became concerned about a seemingly high concentration of saguaros in RMD with relatively thin, brown stems which appeared unhealthy and to be associated with an increase in dead or dying saguaros. These plants contrasted with apparently healthy populations nearby, especially in the San Pedro River valley. Suspicions focused on localized air pollution, especially high ozone concentrations from urban sources and soil contamination caused by airborne emissions from smelters or other industries. In response staff initiated studies of epidermal browning and assorted air pollution effects (McAuliffe 1993). This study builds on baseline data collected during one of those studies (Duriscoe and Graban 1991, 1992), and was conducted to determine the status of population health, size, and structure of saguaros in Saguaro National Park. Epidermal Browning Browning of epidermal tissues in saguaros is a readily observed phenomenon (Figure 1). It begins with discoloration around the areoles of the spines, typically near the ground. Over time, it spreads first to cover the “ridge-tops” of the surface pleats, then extends to continuously cover parts of the plant surface. In its final stages, smooth discolored tissue is replaced by a dark, rough, “bark” of scar tissue (Long 1929; McAuliffe 1993). The discoloration is also associated with the loss of spines. When it occurs, browning typically begins on the south side of a saguaro and advances there to a much greater extent than on the north side. In addition, taller saguaros tend to have more browning than short ones, though saguaros up to 8 m tall have been found with no browning present (Duriscoe and Graban 1992; Evans et al. 1992c). As stems lose their green color and turn brown, there is a build-up of epicuticular wax, the substance that prevents evaporative water loss. This build-up obscures the underlying stomata, preventing normal gas exchange and leading to a decrease in the number of chloroplasts per cell and decreased photosynthetic activity (Long 1929, Evans et al. 1992b). The deeper tissues cannot take in as much CO2 during the nighttime hours when the stomata are open (Lajtha and Kolberg 1992; Lajtha et al. 1997), and thus cannot convert solar radiation to available energy at the same rate as healthy tissues. Therefore, an extensively browned saguaro becomes energetically starved, handicapped in its ability to pump water up from its roots and to perform its other normal growth and reproductive functions. The causes of epidermal browning have been the subject of much speculation. The correlation between browning and height suggests that browning may be a part of the normal aging process
2
Figure 1. Progression of epidermal browning: photos of different saguaros, representing progressive stages of the condition.
a. No browning. b. Browning at spine areoles.
c. Browning spread along ridge-tops. d. Browning spread into pleats.
e. Browning forms continuous sheets with patches of scar tissue.
f. Surface covered by scar tissue that probably began as healing from browning.

3
which accelerates in some individuals (Duriscoe and Graban 1992). Because saguaros have long lives and their growth rates vary widely according to their growing conditions (Steenbergh and Lowe 1983), this relationship may be conclusively determined only with further study. Studies of air pollution as a cause of browning have proven negative or inconclusive. Analysis of soil and saguaro tissue samples did not show significantly elevated levels of inorganic elements (Gladney et al. 1992; Lajtha and Kolberg 1992; McAuliffe 1993). Ozone effects were not directly tested, but the geographic distribution of browning in the park did not suggest any gradients of impact or consistent widespread effects (Duriscoe and Graban 1992). Browning occurs in saguaros far from major human populations or industrial pollution sources, for example, at MacDougal Crater in Mexico’s Pinacate Biosphere Reserve (R. Turner, personal communication). However, the possibility remains that air pollutants could be affecting overall health of the park’s saguaros. The correlation of increased browning with southern exposure led to a suggestion that the condition was advancing due to increased solar ultraviolet radiation (Evans et al. 1992a). A study of this hypothesis was begun but abandoned due to design weaknesses (McAuliffe 1993). Most recently, deduction and research have pointed to heat loading as the proximate cause of epidermal browning. High surface temperatures on affected parts of a saguaro could cause local tissue damage, leading to blocked stomata and the progression described above (McAuliffe 1993; Lajtha et al. 1997). However, this hypothesis has not yet been tested. Saguaro Population Density and Structure Demographic studies of saguaros in Saguaro National Monument began in 1941 as a response to a large die-off of mature plants (Steenbergh and Lowe 1983). At that time, the population in a 2.6 km2 study plot in RMD was disproportionately old, with 82% of the saguaros standing > 4 m tall and only 5% standing < 2 m (Gill and Lightle 1942). Subsequent resurveys of that plot showed a steady population decline, decreasing 16% in the first decade (Gill 1951) and 37% by the end of the second decade (Alcorn and May 1962). A 1975 resurvey found a 51% decrease in population density since 1941, with increases in the smallest and largest size classes which showed a period of greater recruitment of young saguaros and a slightly greater survival rate among the oldest ones (Steenbergh and Lowe 1983). Saguaros on six 4-ha plots within that larger plot have been revisited and mapped annually since 1941, but much of the accumulated data has not been analyzed (Tom Orum personal communication). The age of individual saguaros cannot be easily measured; height is the most likely surrogate but growth rates vary according to climatic conditions and likely vary with substrate (though the latter has not been proven; Steenbergh and Lowe 1983). For a given substrate and climate, growth rates appear consistent among different aspects (Pierson and Turner 1998). Thus, comparisons of age-related conditions (e.g., epidermal browning or mortality) can best be made across time on the same plot or between plots in similar settings, while caution is required when comparing plots with different climates or substrates.
4
Several factors have affected saguaros in the park at the population level. These include occasional catastrophic freezing which selectively kills the youngest and oldest plants (Steenbergh and Lowe 1976), wood harvesting which removes nurse plants (Steenbergh and Lowe 1977; Clemensen 1987), and cattle grazing which inhibits or kills small saguaros (Abouhaidar 1992). Parts of RMD were grazed from the late 1800s until as late as 1978, suppressing recruitment and leading to the aging population noted above. Few livestock grazed the land which became the park’s Tucson Mountain District (TMD) due to lack of surface water, and most of it has been protected since the 1920s as part of the county’s Tucson Mountain Park (Clemensen 1987). Periods of relatively wet weather favor increased establishment and survival of young plants, and can result in pulses of recruitment that appear as distinct growth cohorts for many subsequent years (Pierson and Turner 1998). Population density of reproductive saguaros and the number of arms they bear affect a large community of other organisms which consume saguaro pollen, nectar, fruit, and seed (McGregor et al. 1962, Steenbergh and Lowe 1977, Schmidt et al. 1992). Saguaros begin flowering at about 2.2 m tall. Arms begin to develop when a plant is about 4.5 m tall, and each arm begins flowering in the third spring after it appears (Steenbergh and Lowe 1977). Each stem or arm (reproductive tip) produces an average of 67.5 flowers (Schmidt and Buchmann 1986), of which 42% produce fruit (Alcorn et al. 1959). Individual fruits weigh an average of 52.55 g (Steenbergh and Lowe 1977). While some seed availability is critical to saguaro reproduction, the relative number of reproductive tips is not a factor that limits recruitment within saguaro populations, being less important than climatic conditions (Pierson and Turner 1998). Saguaro Cavities Woodpeckers excavate cavities in saguaros that provide important nesting sites for a variety of bird species. Recent concern has focused on habitat needs of the cactus ferruginous pygmy-owl (Glaucidium brasilianum cactorum), an endangered species that appears to rely heavily on saguaro cavities for nesting in Arizona (U.S. Fish and Wildlife Service 1997). Other management concerns have included the use of saguaro cavities by exotic bird species and the potential competition for cavity nest sites between exotic and native bird species (Bibles and Mannan 1992). This study provided an opportunity to compare data on bird-excavated cavities with a variety of other physical parameters.
5
Methods
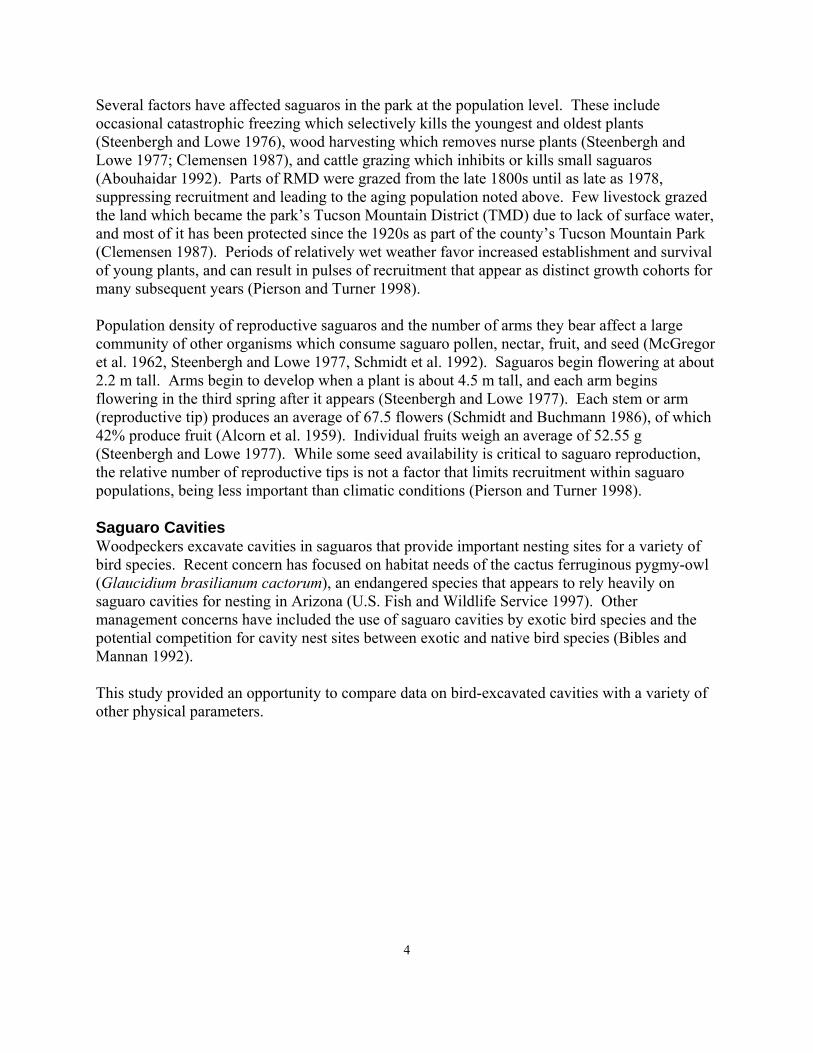
Present Study The study area was within Saguaro National Park, consisting of two separate units on the eastern and western outskirts of Tucson, Arizona. We collected data from 45 study plots distributed throughout the range of saguaros in the park, including 25 plots in RMD and 20 plots in TMD (Figure 2; see also Appendix 1). The plots were established in 1989 using a stratified random method (Duriscoe and Graban 1991). Individual plots were each 200 x 200 m squares (4 ha). Steel rebar stakes with yellow plastic caps were originally placed at each of the plot corners. During this project we replaced the original plastic caps with new aluminum caps labeled with the appropriate corner designations. We used a Trimble GeoExplorer II Global Positioning System (GPS) unit to determine location for each corner to within 3 m. For general vegetation monitoring purposes, we took a photograph from each corner at a 45-degree angle into the plot (225° from the NE corner, 315° from the SE, 45° from the SW, and 135° from the NW), with a 35-mm camera using the widest setting (28 mm) on a 28-70 mm zoom lens. We relocated and recorded GPS locations for all the saguaros tagged by Duriscoe and Graban (1991) for detailed measurement and long-term monitoring. They tagged 30 randomly chosen plants ≥ 2 m within each plot to characterize the population of all saguaros ≥ 2 m within the plot. Some tagged saguaros died in the decade since they were marked, but we chose not to replace them for population-level studies since a sample of 30 saguaros would only validly represent the current demographics of the whole plot if we repeated the random selection process for all 30. We chose instead to characterize the population by collecting data on all saguaros within a subset of plots as described below. The data from the surviving tagged saguaros will allow researchers to follow those individuals through the remainder of their lives and thereby track the progression of epidermal browning in individuals. Each tagged cactus was photographed in color using Kodachrome 64 color-transparency film in 35-mm format. These photos match ones taken a decade ago, allowing visual comparison. The photo points were selected to be as near to due south from the cactus as other existing vegetation would allow for an unobstructed view, and at a distance from the cactus that would include the whole stem in the frame while using a 28-70 mm zoom lens. Close-up photographs were also taken of the south-facing side of each cactus stem centered at a height of 1.34 m. The following variables were measured and recorded on a data form (Appendix 2) at each tagged saguaro: height of the main stem to 0.1 m using a clinometer percentage of the stem and arms covered with epidermal browning and scarring on both north
and south sides of the main stem and arms of the plant (visual estimate) percentage of spines retained on both the north and south sides of the main stem and arms
(visual estimate)
6

7
number and estimated total length of arms to the nearest 0.1 m number of holes created by nesting birds presence or absence of deep cracks, scars from mechanical damage, and discoloration caused
by betacyanin (reddening of tissues, caused by cold stress, which can resemble browning in photos)
microsite characteristics as defined by one of six moisture availability classes, based on the presence or absence of soil and the slope
elevation as interpolated from a topographic map slope, measured with clinometer aspect, measured with a compass.
For analysis, aspect values were grouped by quadrants centered on cardinal directions (e.g., “east” included aspects of 46–135°). Percent visual estimates were made in classes similar to the Horsfall-Barrett system of plant disease measurement (Horsfall and Cowling 1978), which takes into account the human brain’s ability to estimate fine differences in cover when the ratio of diseased/undiseased areas is extreme. Percentage values were thus recorded for classes of varying width, specifically 0, 2, 5, 10, 15, 20, 30, 40, 50, 60, 70, 80, 85, 90, 95, 98, and 100%. In 18 of the plots, we searched for every saguaro ≥ 10 cm tall. Due to funding constraints, we were only able to sample this subset of the study plots and relied heavily on volunteers for data collection (Appendix 3). Using methods described above, we recorded height, number of arms, and estimates of browning and scarring on north and south sides of the stems. These census efforts provide demographic profiles and browning estimates which may be used to characterize the park’s saguaro population. The 18 plots were chosen based on data and classifications from 10 years ago; separating the plots into Rincon and Tucson Mountain Districts, we then differentiated them by topographic class as “slopes,” “foothills,” or “bajadas.” We sorted each of those groups according to the “browning index” for each plot, and selected plots with index values that were the next-to-highest, next-to-lowest, and median for each class and district, thus capturing most of the range of variation in browning but not the extremes. Within each of the 45 plots, we relocated the much smaller subplot (= “ecological plot”) of 100 square meters (10 x 10 m square) established by Duriscoe and Graban (1991) for the purpose of monitoring small perennial plant species (Funicelli et al. 2000). Data were analyzed using common statistical tests (Pearson correlation, linear regression, two-tailed t-test) in Microsoft Excel and SPSS 8.0 for Windows. Eliminated Data Among the tagged saguaros, 26 had been truncated at some time in their lives, distorting the proportion of discolored stem surface by removing the top portion which is least likely to be discolored. Also, some saguaros lacked complete data from 1990 (indicated in data tables by “999” values). In either case, these individuals could not be used for some comparisons.
8
Two of the study plots (#13, 27) were burned by human-caused fires during the past decade. Because the fires resulted in unnatural levels of scarring, mortality, and recruitment, saguaros in these plots were omitted from the analyses. Differences from Original Study Although one of our main objectives was to gather data comparable to that of the earlier study, we modified the study design in several ways. Duriscoe and Graban (1991) used a 225-cell grid of ½-inch hardware cloth to measure browning on saguaro stems with the grid placed at 1.34 m above ground level on both the north and south sides of the plant. For each placement, they gave each cell a discrete value of “green tissue,” “epidermal browning,” and “bark” or “scarred tissue.” This was initially appealing due to its apparent objectivity, and we attempted to duplicate their method. During the course of measuring the first 75 saguaros, however, we found it to be highly dependent on exact placement of the grid. Also, it was hard to distinguish “bark” caused by the advance of browning from “scarred tissue” caused by other forces. Many grid cells could fall into two or three of the categories, requiring a long series of subjective decisions for each saguaro. Finally, the measurements gave only a crude sense of the whole plant’s condition since they were near the stem base where browning consistently begins. Referring back to the final report (Duriscoe and Graban 1991), we found they had neither analyzed nor discussed their grid data, without explanation. For these reasons, we abandoned the grid measurements and relied solely on whole-plant estimates of browning and scarring. Duriscoe and Graban (1991) used mechanical surveying techniques to map the tagged saguaros. We created new maps using GPS data and pre-existing geographic data layers in ArcView. Time Budget This project took approximately 458 person-days at 10 hours/person-day, not including the associated vegetation mapping project. Of that total, 251 person-days were spent on the tagged saguaro portion of the study for an average of 5.6 person-days/plot, and 207 person-days were spent on the census efforts for an average of 11.5 person-days/plot.
9
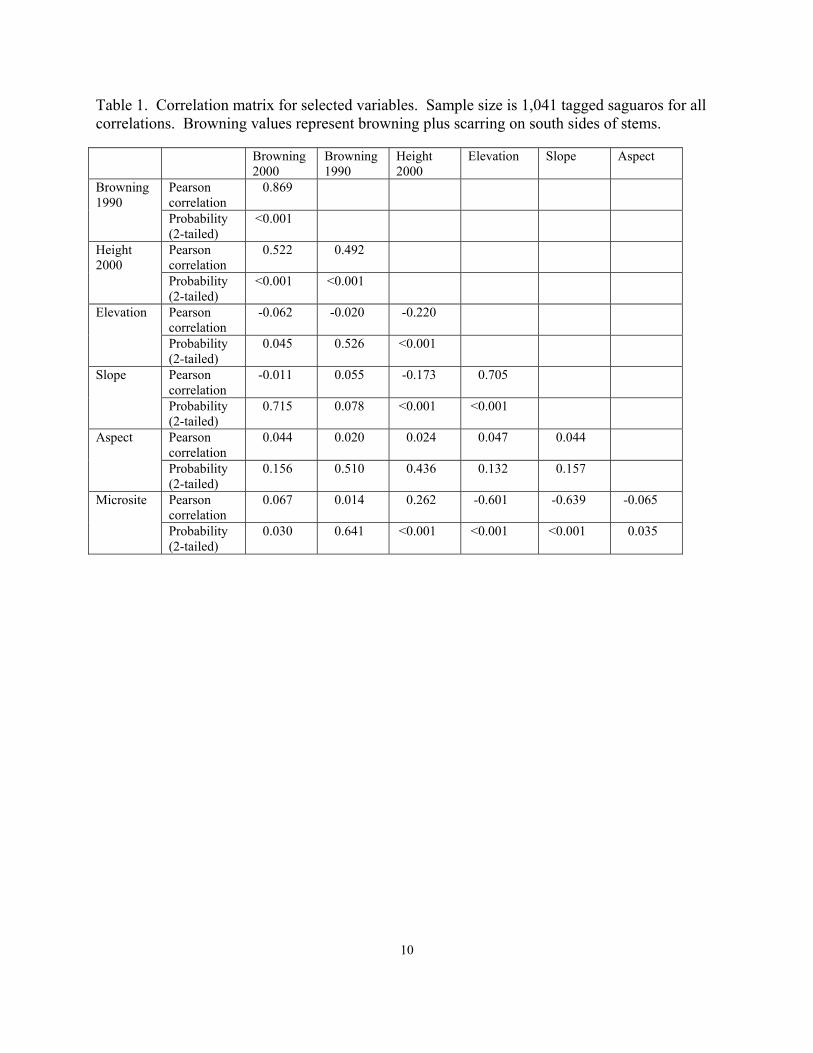
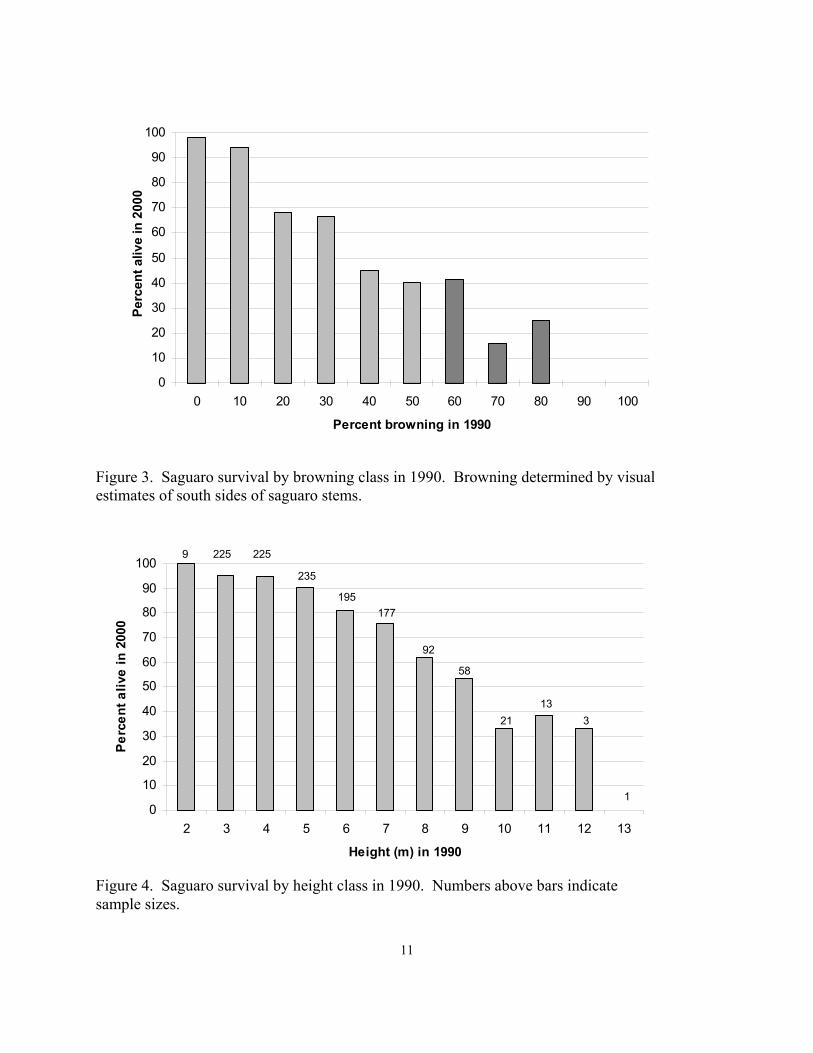
Results We relocated all 1,350 tagged saguaros, of which 1,120 (83%) remained alive. Photographs, raw data, and mapped locations for all were deposited at Saguaro National Park as attachments to this report. Epidermal Browning Our results confirmed those of Duriscoe and Graban (1992) in several comparisons. We found greater height was significantly associated with greater browning (p < 0.001, r2 = 0.27, N = 1041). We found browning covered significantly more surface area on the south sides of stems than on their north sides (p < 0.001, paired t = 21.5, df = 1040), with a mean difference of 10.0% (SE = 0.46, N = 1041). The south face of the stems were also significantly browner than the south face of the arms, where arms were present (p < 0.001, paired t = 17.5, df = 603). Because the south sides of stems show the greatest variation in browning and are most likely to show changes over time, all browning data reported subsequently represents estimates of browning plus scarring on the south faces of the stems, unless noted otherwise. We also found that browning was significantly associated with spine loss on the south faces of the stems (p < 0.001, r2 = 0.60, N = 1041). Browning was not significantly correlated with elevation, slope, or aspect of individual plant locations (Table 1). We found that during the past decade epidermal browning of the surviving marked saguaros increased significantly (p < 0.001, paired t = 30.9, df = 1040), with a median increase of 6% (mean = 9.5%, SE = 0.31, N = 1041), and greater increases in those which were browner ten years ago. We found 61% of the marked population to have ≤ 10% browning, and 75% to have ≤ 20% browning. As a check of methodology, we found our browning values to be closely correlated with those of ten years ago (p < 0.001, r2 = 0.76, N = 1041), an expected result if the two efforts used comparable methods. Among the marked population, 16.5% died during the past decade. The saguaros that died had significantly higher levels of epidermal browning in 1990 than the survivors (p < 0.001, t = 25.2, df = 1262). Among the saguaros with ≤ 10% browning in 1990, > 90% remain alive. The 10-year survival rate declined with increasing browning, so that among those with ≥ 40% browning in 1990, < 50% remain alive (Figure 3). Saguaros which died in the past decade were also taller in 1990 than those which survived (p < 0.001, t = 14.5, df = 1252). Mortality increased with height: among those saguaros ≤ 5 m tall in 1990, > 90% remain alive. The survival rate declined with increasing height, so that among those ≥ 10 m tall in 1990, < 50% remain alive (Figure 4).
10
Table 1. Correlation matrix for selected variables. Sample size is 1,041 tagged saguaros for all correlations. Browning values represent browning plus scarring on south sides of stems. Browning
2000 Browning 1990
Height 2000
Elevation Slope Aspect
Browning 1990
Pearson correlation
0.869
Probability (2-tailed)
<0.001
Height 2000
Pearson correlation
0.522 0.492
Probability (2-tailed)
<0.001 <0.001
Elevation Pearson correlation
-0.062 -0.020 -0.220
Probability (2-tailed)
0.045 0.526 <0.001
Slope Pearson correlation
-0.011 0.055 -0.173 0.705
Probability (2-tailed)
0.715 0.078 <0.001 <0.001
Aspect Pearson correlation
0.044 0.020 0.024 0.047 0.044
Probability (2-tailed)
0.156 0.510 0.436 0.132 0.157
Microsite Pearson correlation
0.067 0.014 0.262 -0.601 -0.639 -0.065
Probability (2-tailed)
0.030 0.641 <0.001 <0.001 <0.001 0.035
11
Figure 3. Saguaro survival by browning class in 1990. Browning determined by visual estimates of south sides of saguaro stems.
0
10
20
30
40
50
60
70
80
90
100
0 10 20 30 40 50 60 70 80 90 100
Percent browning in 1990
Perc
ent a
live
in 2
000
0
10
20
30
40
50
60
70
80
90
100
2 3 4 5 6 7 8 9 10 11 12 13
Height (m) in 1990
Perc
ent a
live
in 2
000
9 225 225
235
195177
92
58
2113
3
1
Figure 4. Saguaro survival by height class in 1990. Numbers above bars indicate sample sizes.
12
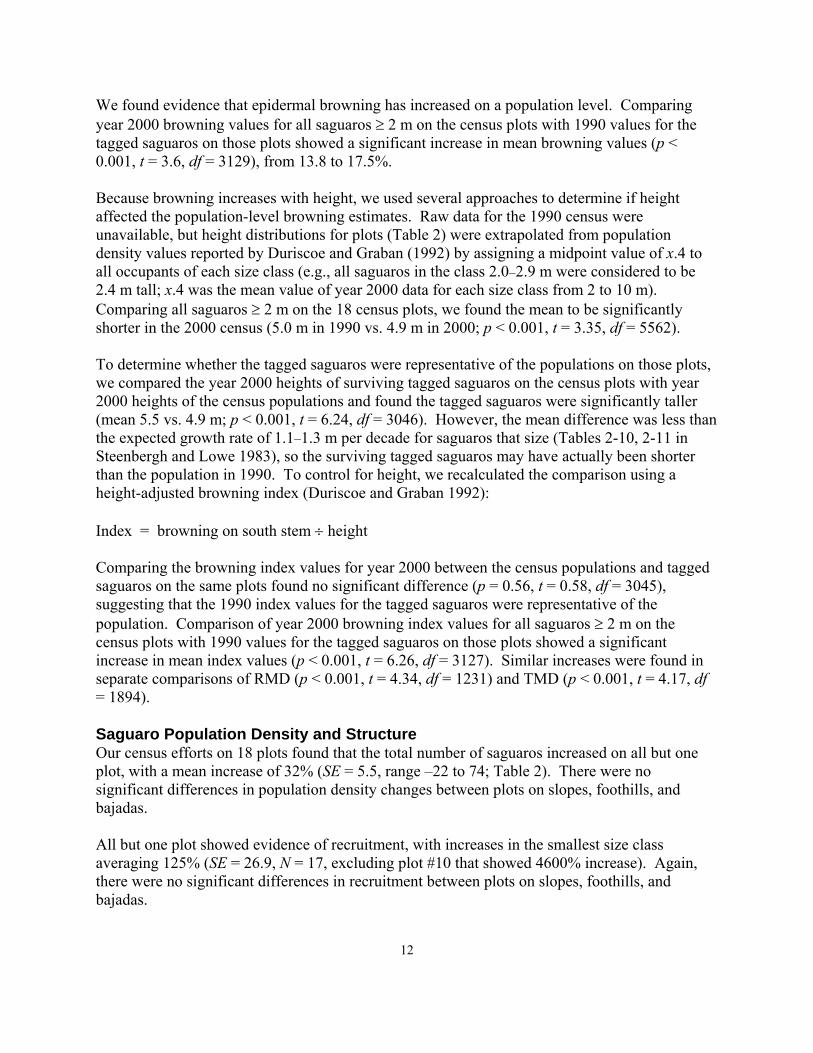
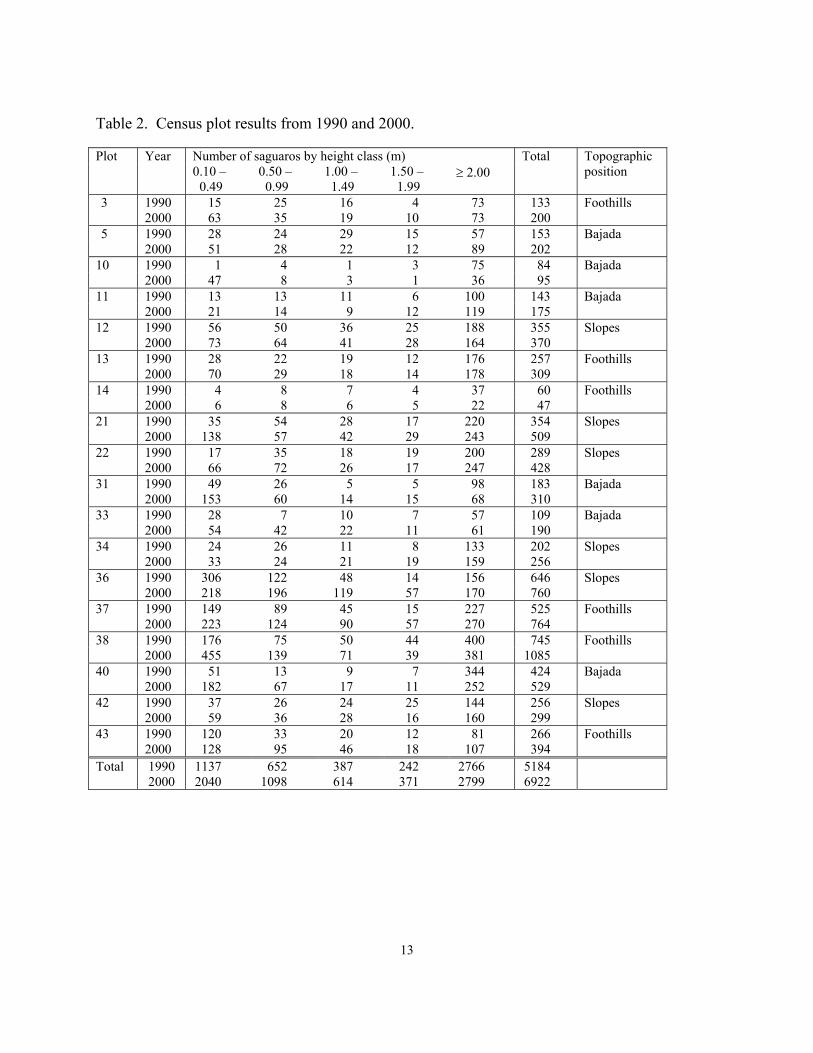
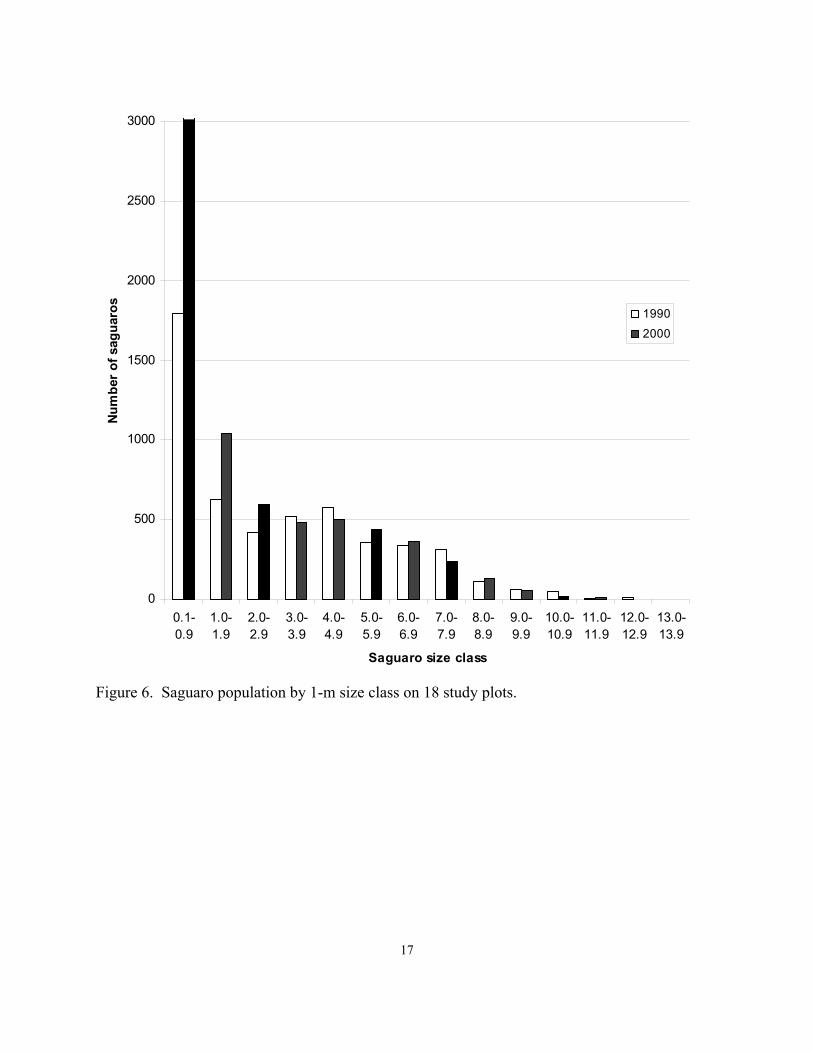
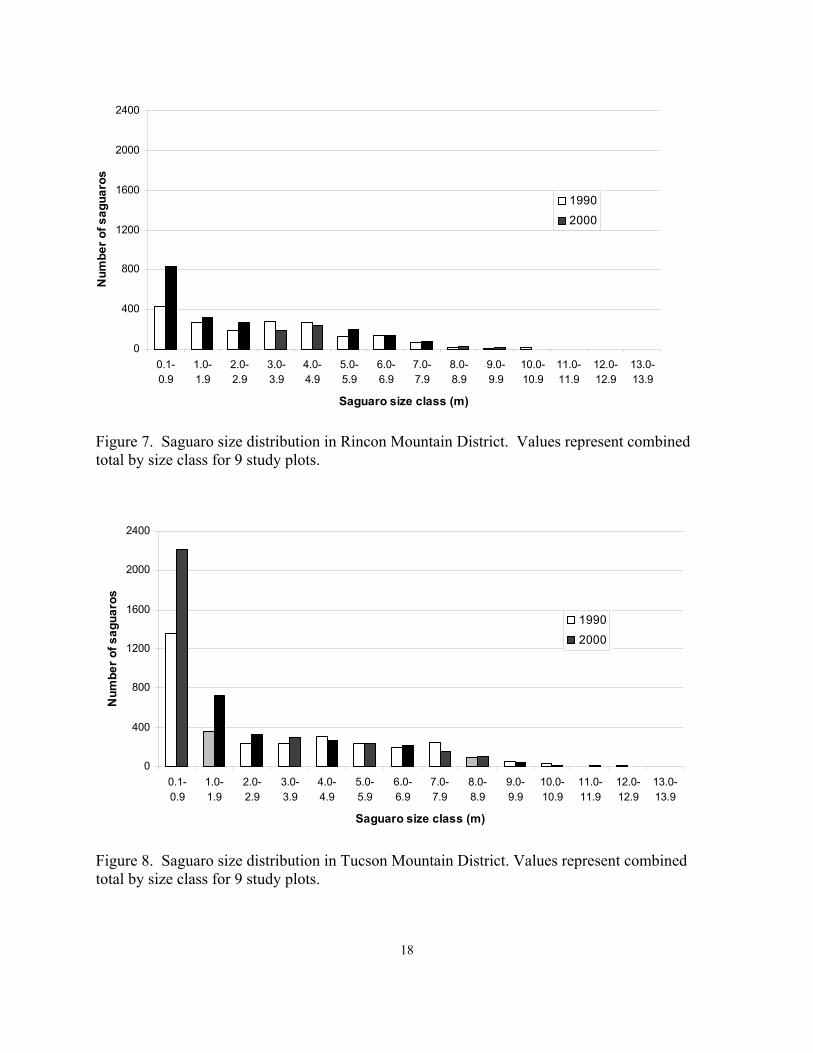
We found evidence that epidermal browning has increased on a population level. Comparing year 2000 browning values for all saguaros ≥ 2 m on the census plots with 1990 values for the tagged saguaros on those plots showed a significant increase in mean browning values (p < 0.001, t = 3.6, df = 3129), from 13.8 to 17.5%. Because browning increases with height, we used several approaches to determine if height affected the population-level browning estimates. Raw data for the 1990 census were unavailable, but height distributions for plots (Table 2) were extrapolated from population density values reported by Duriscoe and Graban (1992) by assigning a midpoint value of x.4 to all occupants of each size class (e.g., all saguaros in the class 2.0–2.9 m were considered to be 2.4 m tall; x.4 was the mean value of year 2000 data for each size class from 2 to 10 m). Comparing all saguaros ≥ 2 m on the 18 census plots, we found the mean to be significantly shorter in the 2000 census (5.0 m in 1990 vs. 4.9 m in 2000; p < 0.001, t = 3.35, df = 5562). To determine whether the tagged saguaros were representative of the populations on those plots, we compared the year 2000 heights of surviving tagged saguaros on the census plots with year 2000 heights of the census populations and found the tagged saguaros were significantly taller (mean 5.5 vs. 4.9 m; p < 0.001, t = 6.24, df = 3046). However, the mean difference was less than the expected growth rate of 1.1–1.3 m per decade for saguaros that size (Tables 2-10, 2-11 in Steenbergh and Lowe 1983), so the surviving tagged saguaros may have actually been shorter than the population in 1990. To control for height, we recalculated the comparison using a height-adjusted browning index (Duriscoe and Graban 1992): Index = browning on south stem ÷ height Comparing the browning index values for year 2000 between the census populations and tagged saguaros on the same plots found no significant difference (p = 0.56, t = 0.58, df = 3045), suggesting that the 1990 index values for the tagged saguaros were representative of the population. Comparison of year 2000 browning index values for all saguaros ≥ 2 m on the census plots with 1990 values for the tagged saguaros on those plots showed a significant increase in mean index values (p < 0.001, t = 6.26, df = 3127). Similar increases were found in separate comparisons of RMD (p < 0.001, t = 4.34, df = 1231) and TMD (p < 0.001, t = 4.17, df = 1894). Saguaro Population Density and Structure Our census efforts on 18 plots found that the total number of saguaros increased on all but one plot, with a mean increase of 32% (SE = 5.5, range –22 to 74; Table 2). There were no significant differences in population density changes between plots on slopes, foothills, and bajadas. All but one plot showed evidence of recruitment, with increases in the smallest size class averaging 125% (SE = 26.9, N = 17, excluding plot #10 that showed 4600% increase). Again, there were no significant differences in recruitment between plots on slopes, foothills, and bajadas.
13
Table 2. Census plot results from 1990 and 2000. Plot Year Number of saguaros by height class (m) Total Topographic
0.10 – 0.49
0.50 – 0.99
1.00 – 1.49
1.50 – 1.99
≥ 2.00 position
3 1990 15 25 16 4 73 133 Foothills 2000 63 35 19 10 73 200
5 1990 28 24 29 15 57 153 Bajada 2000 51 28 22 12 89 202
10 1990 1 4 1 3 75 84 Bajada 2000 47 8 3 1 36 95
11 1990 13 13 11 6 100 143 Bajada 2000 21 14 9 12 119 175
12 1990 56 50 36 25 188 355 Slopes 2000 73 64 41 28 164 370
13 1990 28 22 19 12 176 257 Foothills 2000 70 29 18 14 178 309
14 1990 4 8 7 4 37 60 Foothills 2000 6 8 6 5 22 47
21 1990 35 54 28 17 220 354 Slopes 2000 138 57 42 29 243 509
22 1990 17 35 18 19 200 289 Slopes 2000 66 72 26 17 247 428
31 1990 49 26 5 5 98 183 Bajada 2000 153 60 14 15 68 310
33 1990 28 7 10 7 57 109 Bajada 2000 54 42 22 11 61 190
34 1990 24 26 11 8 133 202 Slopes 2000 33 24 21 19 159 256
36 1990 306 122 48 14 156 646 Slopes 2000 218 196 119 57 170 760
37 1990 149 89 45 15 227 525 Foothills 2000 223 124 90 57 270 764
38 1990 176 75 50 44 400 745 Foothills 2000 455 139 71 39 381 1085
40 1990 51 13 9 7 344 424 Bajada 2000 182 67 17 11 252 529
42 1990 37 26 24 25 144 256 Slopes 2000 59 36 28 16 160 299
43 1990 120 33 20 12 81 266 Foothills 2000 128 95 46 18 107 394
Total 1990 1137 652 387 242 2766 5184 2000 2040 1098 614 371 2799 6922
14
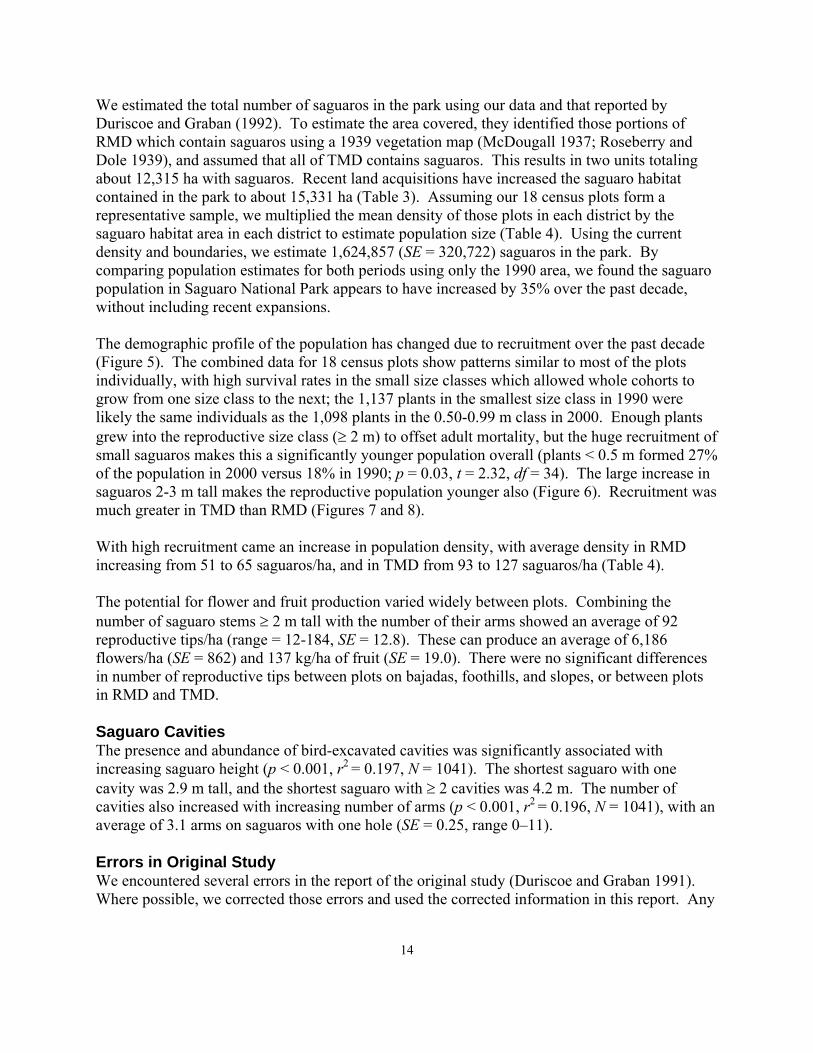
We estimated the total number of saguaros in the park using our data and that reported by Duriscoe and Graban (1992). To estimate the area covered, they identified those portions of RMD which contain saguaros using a 1939 vegetation map (McDougall 1937; Roseberry and Dole 1939), and assumed that all of TMD contains saguaros. This results in two units totaling about 12,315 ha with saguaros. Recent land acquisitions have increased the saguaro habitat contained in the park to about 15,331 ha (Table 3). Assuming our 18 census plots form a representative sample, we multiplied the mean density of those plots in each district by the saguaro habitat area in each district to estimate population size (Table 4). Using the current density and boundaries, we estimate 1,624,857 (SE = 320,722) saguaros in the park. By comparing population estimates for both periods using only the 1990 area, we found the saguaro population in Saguaro National Park appears to have increased by 35% over the past decade, without including recent expansions. The demographic profile of the population has changed due to recruitment over the past decade (Figure 5). The combined data for 18 census plots show patterns similar to most of the plots individually, with high survival rates in the small size classes which allowed whole cohorts to grow from one size class to the next; the 1,137 plants in the smallest size class in 1990 were likely the same individuals as the 1,098 plants in the 0.50-0.99 m class in 2000. Enough plants grew into the reproductive size class (≥ 2 m) to offset adult mortality, but the huge recruitment of small saguaros makes this a significantly younger population overall (plants < 0.5 m formed 27% of the population in 2000 versus 18% in 1990; p = 0.03, t = 2.32, df = 34). The large increase in saguaros 2-3 m tall makes the reproductive population younger also (Figure 6). Recruitment was much greater in TMD than RMD (Figures 7 and 8). With high recruitment came an increase in population density, with average density in RMD increasing from 51 to 65 saguaros/ha, and in TMD from 93 to 127 saguaros/ha (Table 4). The potential for flower and fruit production varied widely between plots. Combining the number of saguaro stems ≥ 2 m tall with the number of their arms showed an average of 92 reproductive tips/ha (range = 12-184, SE = 12.8). These can produce an average of 6,186 flowers/ha (SE = 862) and 137 kg/ha of fruit (SE = 19.0). There were no significant differences in number of reproductive tips between plots on bajadas, foothills, and slopes, or between plots in RMD and TMD. Saguaro Cavities The presence and abundance of bird-excavated cavities was significantly associated with increasing saguaro height (p < 0.001, r2 = 0.197, N = 1041). The shortest saguaro with one cavity was 2.9 m tall, and the shortest saguaro with ≥ 2 cavities was 4.2 m. The number of cavities also increased with increasing number of arms (p < 0.001, r2 = 0.196, N = 1041), with an average of 3.1 arms on saguaros with one hole (SE = 0.25, range 0–11). Errors in Original Study We encountered several errors in the report of the original study (Duriscoe and Graban 1991). Where possible, we corrected those errors and used the corrected information in this report. Any

15
Table 3. Area of saguaro distribution in Saguaro National Park. Distribution in RMD was taken from a digitized version of the “saguaro type” community on a vegetation map for the park (McDougall 1937, Roseberry and Dole 1939). Saguaro distribution in TMD was assumed to equal the whole area of the district.
Rincon Mountain District
Tucson Mountain District
Saguaro National
Park ha acres ha acres ha acres 1990 saguaro distribution
3,750 9,263 8,565 21,156 12,315 30,418
recent area expansions
1,503 3,712 1,513 3,737 3,016 7,450
2000 saguaro distribution
5,253 12,975 10,078 24,893 15,331 37,868
Table 4. Saguaro population density in Saguaro National Park. Density values were determined from eighteen 4-ha plots, nine in each district.
mean density (saguaros/ha)
standard error (saguaros/ha)
population estimate
(saguaros)
population estimate std error
(saguaros) Rincon Mountain District
1990 50.8 9.4 190,500 35,250 2000 64.9 12.9 243,375 48,375 2000 with expansions 340,920 67,764 Tucson Mountain District
1990 93.2 18.6 798,258 159,309 2000 127.4 25.1 1,091,181 214,982 2000 with expansions 1,283,937 252,958 Saguaro National Park (RMD+TMD)
1990 72.0 11.3 988,758 194,559 2000 96.1 15.6 1,334,556 263,357 2000 with expansions 1,624,857 320,722
16
Figure 5. Saguaro population by size class on 18 study plots. Small sizes divided into half-meter size classes to show progression of cohorts.
0
500
1000
1500
2000
2500
3000
0.10-0.49 0.50-0.99 1.00-1.49 1.50-1.99 2.00+
Saguaro size class (m)
Num
ber o
f sag
uaro
s
19902000
17
Figure 6. Saguaro population by 1-m size class on 18 study plots.
0
500
1000
1500
2000
2500
3000
0.1-0.9
1.0-1.9
2.0-2.9
3.0-3.9
4.0-4.9
5.0-5.9
6.0-6.9
7.0-7.9
8.0-8.9
9.0-9.9
10.0-10.9
11.0-11.9
12.0-12.9
13.0-13.9
Saguaro size class
Num
ber
of s
agua
ros
1990
2000
18
Figure 7. Saguaro size distribution in Rincon Mountain District. Values represent combined total by size class for 9 study plots.
Figure 8. Saguaro size distribution in Tucson Mountain District. Values represent combined total by size class for 9 study plots.
0
400
800
1200
1600
2000
2400
0.1-0.9
1.0-1.9
2.0-2.9
3.0-3.9
4.0-4.9
5.0-5.9
6.0-6.9
7.0-7.9
8.0-8.9
9.0-9.9
10.0-10.9
11.0-11.9
12.0-12.9
13.0-13.9
Saguaro size class (m)
Num
ber o
f sag
uaro
s
1990
2000
0
400
800
1200
1600
2000
2400
0.1-0.9
1.0-1.9
2.0-2.9
3.0-3.9
4.0-4.9
5.0-5.9
6.0-6.9
7.0-7.9
8.0-8.9
9.0-9.9
10.0-10.9
11.0-11.9
12.0-12.9
13.0-13.9
Saguaro size class (m)
Num
ber o
f sag
uaro
s
1990
2000

19
future users of that report should particularly note that many of the attached maps of tagged saguaros contain significant errors in placement and identification. These have been corrected in the maps attached to this report.
20
Discussion The results of this study confirm that epidermal browning is a progressive condition in individual plants, something only inferred previously. The results also indicate that browning has increased within the reproductive (> 2 m) population. This result might be sufficient cause for concern, but there are potential alternative explanations: (1) the tagged saguaros were not representative of the population in 1990; (2) the mean age of the reproductive (> 2 m) population increased between 1990 and 2000; or (3) data collection methods differed between 1990 and 2000. Alternative 1 was not tested by Duriscoe and Graban (1991), and therefore cannot be tested now. However, their random selection of 21% of the saguaros > 2 m tall on the plots (1,350 out of 6,373) seems like an adequate sample. The surviving tagged saguaros are not significantly browner for their size than the current population on the plots. It appears likely, therefore, that the tagged saguaros did represent the population ten years ago. Alternative 2 does not appear to be the case. Lack of access to the raw data from 1990 forced us to rely on an estimated size distribution for that effort, but the mean height of the reproductive population on the study plots appears to have gone down during this decade, which should produce a lower mean level of observed browning. In addition, comparisons of the height-adjusted browning index should remove the influence of height, but that showed an increase. The third alternative is more troubling. While we calibrated our visual estimates both among the several researchers and against the recorded values from a decade previous, lack of explicit decision rules from the earlier effort make it possible that we used different criteria. In addition, while a small core team collected all data on the tagged saguaros, the censuses were conducted with large volunteer groups. These groups were trained and monitored by core team members, but the possibility remains of systematic sampling bias. This effect may have been offset by the sheer number of volunteers (those who overestimated may have been balanced by those who underestimated), but the risk of non-comparable data cannot be discounted. If, however, the population has truly gotten browner than would be expected for the height of the plants, it may indicate population-level effects of some external influence. The entwined correlations between height, browning, and mortality make it difficult to separate browning as a cause or indicator of death in saguaros. Further research will be required to determine if the condition of epidermal browning or the factors which contribute to it actually lead to premature death in saguaros, or if browning and mortality are results of a natural aging process. Our demographic data show that the saguaro population in Saguaro National Park is increasing, with some of the most dramatic increases in plots that have had little recruitment in decades (as

21
inferred from current height distributions). This population growth probably reflects several high rainfall years in the early 1980s that produced plants too small to be counted in the 1990 census effort. The recruitment was apparently the first large pulse on some plots since livestock were removed from those parts of the park. This study was conducted during a dry winter, so few winter annual plants were present to obscure small saguaros during our census efforts. Casual review of weather records suggests that conditions were not significantly wetter during the previous study, but wet years could affect future efforts. During the course of this study we learned of two saguaro demography study plots with much longer data baselines that substantially overlap two of our plots. Our plot #5 is nearly identical to the 4-ha plot #B2 established in 1941 (Alcorn and May 1962; Steenbergh and Lowe 1983). Saguaros on that plot have been mapped and monitored almost every year since its establishment (Tom Orum, personal communication). Half of our plot #22 appears to coincide with the 2-ha plot #75M established in 1975 (Steenbergh 1986). Saguaros there were apparently mapped and measured only during the plot’s establishment. In each case, comparison with our data set would require determining the area of overlap and devising a way to eliminate saguaros outside the overlap. That comparison was not possible during this study, but would greatly aid the park’s understanding of saguaro population trends. Results of our census efforts contradict a dire prediction made four decades ago. Niering et al. (1963) stated that: “The vegetation at low elevations in the Rincon Mountains section of Saguaro National Monument represents an advanced stage of the degradation process in a vulnerable community. On the lower flats and adjacent parts of the study area there is no reproduction of saguaro, while older saguaros are dying at a rate (about 2 percent per year) which implies that the last individuals will disappear from this part of the Monument between 1990 and 2000. . . When the deterioration that results from grazing has proceeded to this point, the original community has been replaced by a new one . . . in which the saguaro cannot recover, and in which any change, even though grazing should be wholly eliminated, is likely to be very slow by the time-scale of human purpose.” It appears that recovery has come much faster than anticipated. The large cohort of young saguaros found in this study suggests that the park will contain a large saguaro population for many years to come.
22
Recommendations The park should support or encourage further research on the hypothesis of heat loading as the proximate cause of epidermal browning. Without knowing the causes and mechanisms of epidermal browning, we can only speculate about its implications. We strongly recommend continued monitoring of epidermal browning on study plots within Saguaro National Park. It should be a priority project in the park’s Resource Management Plan or comparable planning documents. Whole-plot surveys on more of the study plots would provide a better picture of local variation in browning. Repeated efforts on the same plots through time would clarify the connections between browning, height, age, and mortality. We recommend continued periodic monitoring of saguaro population size and demographics, either alone or in conjunction with monitoring of epidermal browning. At least two of our study plots largely overlap older plots which could allow long-term comparisons if the areas of overlap are precisely determined and new data are gathered for those areas. Several new plots should be established in recently acquired expansion lands of the park to follow demographic trends in saguaros there. Of particular interest are those lands on the south side of RMD which had livestock grazing until their acquisition. They provide a great opportunity to monitor population-level effects of grazing, but that opportunity will be missed if baseline data are not gathered soon. In addition, those lands will be adjacent to expected land development projects; plots in the expansion lands will allow monitoring of the effects of those projects. To match the density described by Duriscoe and Graban (1991, 1992) of 1 plot/150 ha of saguaro habitat would require 8 new plots in TMD and 9 in RMD. The actual density of plots they established in TMD was 1 plot/438 ha; actual density in RMD is difficult to determine. Matching this lower density on recent expansion lands would require 3 new plots in each district.
23
Literature Cited Abouhaidar, F. 1992. Influence of livestock grazing on saguaro seedling establishment. P. 57–61
in C. P. Stone and E. S. Bellantoni, editors. Proceedings of the Symposium on Research in Saguaro National Monument, 23-24 January 1991. Southwest Parks and Monuments Association, Globe, Arizona.
Alcorn, S. M., S. E. McGregor, G. D. Butler, and E. B. Kurtz. 1959. Pollination requirements of
the saguaro (Carnegiea gigantea). Cactus and Succulent Journal of America 31:39–41. Alcorn, S. M., and C. May. 1962. Attrition of a saguaro forest. Plant Disease Reporter 46:156–
158. Bibles, B. D., and R. W. Mannan. 1992. Impacts of exotic cavity-nesting birds on native cavity-
nesting birds in Saguaro National Monument. P. 95–200 in C. P. Stone and E. S. Bellantoni, editors. Proceedings of the Symposium on Research in Saguaro National Monument, 23–24 January 1991. Southwest Parks and Monuments Association, Globe, Arizona.
Clemensen, A. B. 1987. Cattle, copper, and cactus: the history of Saguaro National Monument.
Historic resource study, Denver Service Center, National Park Service. 272 p. Duriscoe, D. M., and S. L. Graban. 1991. Epidermal browning and population structure of giant
saguaro cactus (Carnegia gigantea) in Saguaro National Monument, Arizona. Unpublished report to USDI National Park Service, Air Quality Division, Denver, Colorado. 37 p. + 10 attachments.
Duriscoe, D. M., and S. L. Graban.1992. Epidermal browning and population dynamics of giant
saguaros in long-term monitoring plots. P. 237–258 in C. P. Stone and E. S. Bellantoni, editors. Proceedings of the Symposium on Research in Saguaro National Monument, 23-24 January 1991. Southwest Parks and Monuments Association, Globe, Arizona.
Evans, L. S., K. A. Howard, and K. H. Thompson. 1992a. Epidermal browning of saguaro cacti:
is it new or related to direction? Pages 23–34 in C. P. Stone and E. S. Bellantoni, editors. Proceedings of the Symposium on Research in Saguaro National Monument, 23-24 January 1991. Southwest Parks and Monuments Association, Globe, Arizona.
Evans, L. S., V. A. Cantarella, and K. W. Stolte. 1992b. Phenological changes associated with
epidermal browning of saguaro cacti at Saguaro National Monument. Pages 35–46 in C. P. Stone and E. S. Bellantoni, editors. Proceedings of the Symposium on Research in Saguaro National Monument, 23–24 January 1991. Southwest Parks and Monuments Association, Globe, Arizona.
24
Evans, L. S., K. A. Howard, and E. J. Stolze.1992c. Epidermal browning of saguaro cacti (Carnegiea gigantea): is it new or related to direction? Environmental and Experimental Botany 32:357-363.
Funicelli, C. S., P. Anning, and D. S. Turner. 2000. Long-term vegetation monitoring at Saguaro
National Park: the first decade of change. Report to Saguaro National Park, Tucson, AZ. Gill, L. S., and P. C. Lightle. 1942. Cactus disease investigations: an outline of objectives, plans,
and accomplishments on project j-2-8. Report to the Bureau of Plant Industry. Reprinted as p. 158–188 in W.H. Steenbergh and C.H. Lowe. 1983. Ecology of the saguaro: III, growth and demography. Scientific Monograph Series, No. 17. USDI, National Park Service, Washington, D.C.
Gill, L. S. 1951. Mortality in the giant cactus as Saguaro National Monument 1941-1950. Report
to the National Park Service. Reprinted as p. 204–207 in W.H. Steenbergh and C.H. Lowe. 1983. Ecology of the saguaro: III, growth and demography. Scientific Monograph Series, No. 17. USDI, National Park Service, Washington, D.C.
Gladney, E. S., R. W. Ferenbaugh, and K. W. Stolte. 1992. An investigation of the impact of
inorganic air pollutants on Saguaro National Monument. P. 223–234 in C. P. Stone and E. S. Bellantoni, editors. Proceedings of the Symposium on Research in Saguaro National Monument, 23-24 January 1991. Southwest Parks and Monuments Association, Globe, Arizona.
Horsfall, J. G., and E. B. Cowling. 1978. Pathometry: the measurement of plant disease. P. 119–
136 in J. G. Horsfall and E. B. Cowling, editors. Plant disease: an advanced treatise; Vol. II, how disease develops in populations. Academic Press, New York.
Lajtha, K., and K. A. Kolberg. 1992. Ecophysiological and toxic element studies of the saguaro
cactus in Saguaro National Monument. P. 47–55 in C. P. Stone and E. S. Bellantoni, editors. Proceedings of the Symposium on Research in Saguaro National Monument, 23–24 January 1991. Southwest Parks and Monuments Association, Globe, Arizona.
Lajtha, K., K. Kolberg, and J. Getz. 1997. Ecophysiology of the saguaro cactus (Carnegiea
gigantea) in the Saguaro National Monument: relationship to symptoms of decline. Journal of Arid Environments 36: 579–590.
Long, F. L. 1929. Stomata which show functional movement for a century. Science 69: 218–
219. McAuliffe, J. R. 1993. Case study of research, monitoring, and management programs associated
with the saguaro cactus (Carnegiea gigantea) in Saguaro National Monument, Arizona. Tech. Report NPS/WRUA/NRTR-93/01, Cooperative National Park Resources Studies Unit, University of Arizona, Tucson. 50 p.
25
McDougall, W. B. 1937. The vegetation of the Saguaro National Monument. Special report, National Park Service. 6 p. + photos.
McGregor, S. E., S. M. Alcorn, and G. Olin. 1962. Pollination and pollinating agents of the
saguaro. Ecology 43:259–267. Niering, W. A., R. H. Whittaker, and C. H. Lowe. 1963. The saguaro: a population in relation to
environment. Science 142:15–23. Pierson, E. A., and R. M. Turner. 1998. An 85-year study of saguaro (Carnegiea gigantea)
demography. Ecology 79:2676–2693. Roseberry, R.D., and N.E. Dole.1939. Vegetation type map: part of the master plan for Saguaro
National Monument. Branch of Forestry, National Park Service, San Francisco, CA. Map. Schmidt, J. O., and S. L. Buchmann. 1986. Floral biology of the saguaro (Cereus giganteus):1.
pollen harvest by Apis mellifera. Oecologia 69:491–498. Schmidt, J. O., S. L. Buchmann, and S. C. Thoenes. 1992. Saguaro and cardon cacti: nectar
sources par excellence for native and honey bees. P. 73–78 in C. P. Stone and E. S. Bellantoni, editors. Proceedings of the Symposium on Research in Saguaro National Monument, 23–24 January 1991. Southwest Parks and Monuments Association, Globe, Arizona.
Steenbergh, W. H. and C. H. Lowe. 1976. Ecology of the saguaro: I. The role of freezing
weather in a warm-desert plant population. P. 49–92 in Research in the Parks. USDI National Park Service Symposium Series 1.
Steenbergh, W. H. and C. H. Lowe. 1977. Ecology of the saguaro: II, reproduction, germination,
establishment, growth, and survival of the young plant. Scientific Monograph Series, No. 8. USDI, National Park Service, Washington, D.C. 242 p.
Steenbergh, W. H. and C. H. Lowe. 1983. Ecology of the saguaro: III, growth and demography.
Scientific Monograph Series, No. 17. USDI, National Park Service, Washington, D.C. 228 p.
Steenbergh, W. H. 1986. Saguaro population study plots at Saguaro National Monument 1941–
1975. Unpublished report, Saguaro National Monument, Tucson, AZ. 22 p. U.S. Fish and Wildlife Service. 1997. Endangered and threatened wildlife and plants;
determination of endangered status for the cactus ferruginous pygmy-owl in Arizona. Federal Register 62(46):10730–10747.
26
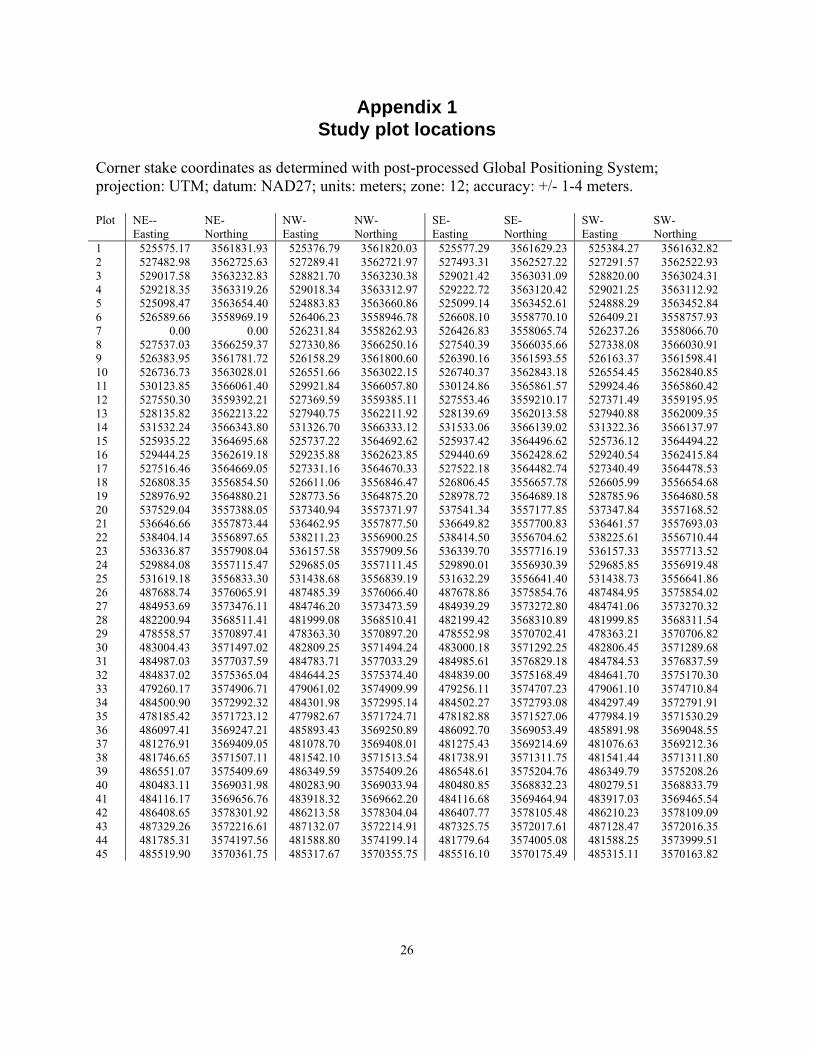
Appendix 1 Study plot locations
Corner stake coordinates as determined with post-processed Global Positioning System; projection: UTM; datum: NAD27; units: meters; zone: 12; accuracy: +/- 1-4 meters. Plot NE--
Easting NE- Northing
NW-Easting
NW-Northing
SE- Easting
SE- Northing
SW-Easting
SW- Northing
1 525575.17 3561831.93 525376.79 3561820.03 525577.29 3561629.23 525384.27 3561632.82 2 527482.98 3562725.63 527289.41 3562721.97 527493.31 3562527.22 527291.57 3562522.93 3 529017.58 3563232.83 528821.70 3563230.38 529021.42 3563031.09 528820.00 3563024.31 4 529218.35 3563319.26 529018.34 3563312.97 529222.72 3563120.42 529021.25 3563112.92 5 525098.47 3563654.40 524883.83 3563660.86 525099.14 3563452.61 524888.29 3563452.84 6 526589.66 3558969.19 526406.23 3558946.78 526608.10 3558770.10 526409.21 3558757.93 7 0.00 0.00 526231.84 3558262.93 526426.83 3558065.74 526237.26 3558066.70 8 527537.03 3566259.37 527330.86 3566250.16 527540.39 3566035.66 527338.08 3566030.91 9 526383.95 3561781.72 526158.29 3561800.60 526390.16 3561593.55 526163.37 3561598.41 10 526736.73 3563028.01 526551.66 3563022.15 526740.37 3562843.18 526554.45 3562840.85 11 530123.85 3566061.40 529921.84 3566057.80 530124.86 3565861.57 529924.46 3565860.42 12 527550.30 3559392.21 527369.59 3559385.11 527553.46 3559210.17 527371.49 3559195.95 13 528135.82 3562213.22 527940.75 3562211.92 528139.69 3562013.58 527940.88 3562009.35 14 531532.24 3566343.80 531326.70 3566333.12 531533.06 3566139.02 531322.36 3566137.97 15 525935.22 3564695.68 525737.22 3564692.62 525937.42 3564496.62 525736.12 3564494.22 16 529444.25 3562619.18 529235.88 3562623.85 529440.69 3562428.62 529240.54 3562415.84 17 527516.46 3564669.05 527331.16 3564670.33 527522.18 3564482.74 527340.49 3564478.53 18 526808.35 3556854.50 526611.06 3556846.47 526806.45 3556657.78 526605.99 3556654.68 19 528976.92 3564880.21 528773.56 3564875.20 528978.72 3564689.18 528785.96 3564680.58 20 537529.04 3557388.05 537340.94 3557371.97 537541.34 3557177.85 537347.84 3557168.52 21 536646.66 3557873.44 536462.95 3557877.50 536649.82 3557700.83 536461.57 3557693.03 22 538404.14 3556897.65 538211.23 3556900.25 538414.50 3556704.62 538225.61 3556710.44 23 536336.87 3557908.04 536157.58 3557909.56 536339.70 3557716.19 536157.33 3557713.52 24 529884.08 3557115.47 529685.05 3557111.45 529890.01 3556930.39 529685.85 3556919.48 25 531619.18 3556833.30 531438.68 3556839.19 531632.29 3556641.40 531438.73 3556641.86 26 487688.74 3576065.91 487485.39 3576066.40 487678.86 3575854.76 487484.95 3575854.02 27 484953.69 3573476.11 484746.20 3573473.59 484939.29 3573272.80 484741.06 3573270.32 28 482200.94 3568511.41 481999.08 3568510.41 482199.42 3568310.89 481999.85 3568311.54 29 478558.57 3570897.41 478363.30 3570897.20 478552.98 3570702.41 478363.21 3570706.82 30 483004.43 3571497.02 482809.25 3571494.24 483000.18 3571292.25 482806.45 3571289.68 31 484987.03 3577037.59 484783.71 3577033.29 484985.61 3576829.18 484784.53 3576837.59 32 484837.02 3575365.04 484644.25 3575374.40 484839.00 3575168.49 484641.70 3575170.30 33 479260.17 3574906.71 479061.02 3574909.99 479256.11 3574707.23 479061.10 3574710.84 34 484500.90 3572992.32 484301.98 3572995.14 484502.27 3572793.08 484297.49 3572791.91 35 478185.42 3571723.12 477982.67 3571724.71 478182.88 3571527.06 477984.19 3571530.29 36 486097.41 3569247.21 485893.43 3569250.89 486092.70 3569053.49 485891.98 3569048.55 37 481276.91 3569409.05 481078.70 3569408.01 481275.43 3569214.69 481076.63 3569212.36 38 481746.65 3571507.11 481542.10 3571513.54 481738.91 3571311.75 481541.44 3571311.80 39 486551.07 3575409.69 486349.59 3575409.26 486548.61 3575204.76 486349.79 3575208.26 40 480483.11 3569031.98 480283.90 3569033.94 480480.85 3568832.23 480279.51 3568833.79 41 484116.17 3569656.76 483918.32 3569662.20 484116.68 3569464.94 483917.03 3569465.54 42 486408.65 3578301.92 486213.58 3578304.04 486407.77 3578105.48 486210.23 3578109.09 43 487329.26 3572216.61 487132.07 3572214.91 487325.75 3572017.61 487128.47 3572016.35 44 481785.31 3574197.56 481588.80 3574199.14 481779.64 3574005.08 481588.25 3573999.51 45 485519.90 3570361.75 485317.67 3570355.75 485516.10 3570175.49 485315.11 3570163.82
27
28
Appendix 3 Saguaro Census Protocol
Equipment List For each group: clipboard, with an attached pen and several data sheets clinometer compass 2 sets of contrasting colored flagging bundle of pin flags meter stick 30 m tape
I. Recruit volunteers. The 2000 Saguaro Census effort was very heavily dependent upon the assistance from volunteer groups in the field. Recruiting of volunteer groups needs to occur well in advance; we began contacting groups in January for our late spring fieldwork. With a group of 10 – 20 volunteers, even very dense plots can be censused in one day. One excellent source of volunteers was Alternative Spring Break, an active program at colleges and universities across the country. This program yielded two full weeks of volunteer work, and helped us to complete almost half of our census plots. Local groups that can be contacted include The Arizona Native Plant Society, Tucson Botanical Gardens, and SAGU Law Enforcement Volunteers. II. Set up plot boundaries. It is easiest and most efficient to locate the plot and mark the boundaries if the field crew has already visited the plot and left flagging at the plot corners (this can be done when the data is taken on the 30 marked saguaros). Once the plot and a plot corner are located in the field, the boundary lines should be flagged (we used yellow and black striped flagging for this purpose, to contrast with the pink flagging we used to mark saguaros). At the first corner, break the group in half to set off in different directions. One person from each group will be standing at the corner and using a compass to sight in the proper direction. Other members of the teams will be directed where to place the flagging at 10-20 m intervals to form a straight line, 200 meters to the next corner. Then the teams each turn 90 degrees and repeat the process, so that both teams finish at the corner opposite from the one they started at. For example: Teams A & B begin at the SW plot corner. Team A heads north to the NW corner, while team B heads east to the SE corner. When they arrive at their respective corners, team A turns east and team B turns north. Both teams should meet at the NE corner, and the boundary is completely flagged. III. Divide the group into teams, and arrange the teams into lanes. Four people per team is ideal, with one data recorder, two people concentrating on tall saguaros (assisting each
29
other with the meter tape and clinometer), and a fourth person to concentrate on small saguaros. Teams will spread out along one border, forming lanes that will stretch to the opposite border. Each team is responsible for data collection on all saguaros within their respective lane. Once data has been recorded on an individual saguaro, it must be marked with flagging (pin flags work well for smaller saguaros). IV. Recheck plot for missed saguaros. When the all teams have reached the far border, teams should swap lanes and work back to the starting boundary, recording any saguaros that have been missed. Teams should pay special attention to the areas where lanes meet. V. Remove flagging. Once everyone is confident that all saguaros have been counted, all flagging should be removed. Long strips of flagging can be straightened and organized for reuse.
30
The cover photograph was taken October 4, 1935, in Saguaro National Monument by the first National Park Service photographer, George Alexander Grant (1891–1964).
As the nation’s principal conservation agency, the U.S. Department of the Interior has responsibility for most of our nationally owned public lands and natural and cultural resources. This includes fostering wise use of our land and water resources, protecting fish, wildlife and plants, preserving the environmental and cultural values of national parks and historic places, and providing for enjoyment of life through outdoor recreation. The Department assesses our energy and mineral resources and works to ensure that their development is in the best interests of all our people. The Department also has a major responsibility for American Indian reservation communities and for people who live in island
territories under U.S. administration.
March 3, 1849
U.S
. DEPAR
T MENT OF THEIN
T ER
IOR