ten years of compressed subcontract report · 303-275-3000 • ... ddc detroit diesel corporation...
TRANSCRIPT

National Renewable Energy Laboratory Innovation for Our Energy Future
A national laboratory of the U.S. Department of EnergyOffice of Energy Efficiency & Renewable Energy
NREL is operated by Midwest Research Institute ● Battelle Contract No. DE-AC36-99-GO10337
Ten Years of Compressed Natural Gas (CNG) Operations at SunLine Transit Agency April 2003 — December 2004 K. Chandler Battelle Columbus, Ohio
Subcontract Report NREL/SR-540-39180 January 2006

Ten Years of Compressed Natural Gas (CNG) Operations at SunLine Transit Agency April 2003 — December 2004 K. Chandler Battelle Columbus, Ohio
NREL Technical Monitor: Richard Parish Prepared under Subcontract No(s). KXAF-9-29764-19
Subcontract Report NREL/SR-540-39180 January 2006
National Renewable Energy Laboratory 1617 Cole Boulevard, Golden, Colorado 80401-3393 303-275-3000 • www.nrel.gov
Operated for the U.S. Department of Energy Office of Energy Efficiency and Renewable Energy by Midwest Research Institute • Battelle
Contract No. DE-AC36-99-GO10337

NOTICE
This report was prepared as an account of work sponsored by an agency of the United States government. Neither the United States government nor any agency thereof, nor any of their employees, makes any warranty, express or implied, or assumes any legal liability or responsibility for the accuracy, completeness, or usefulness of any information, apparatus, product, or process disclosed, or represents that its use would not infringe privately owned rights. Reference herein to any specific commercial product, process, or service by trade name, trademark, manufacturer, or otherwise does not necessarily constitute or imply its endorsement, recommendation, or favoring by the United States government or any agency thereof. The views and opinions of authors expressed herein do not necessarily state or reflect those of the United States government or any agency thereof.
Available electronically at http://www.osti.gov/bridge
Available for a processing fee to U.S. Department of Energy and its contractors, in paper, from:
U.S. Department of Energy Office of Scientific and Technical Information P.O. Box 62 Oak Ridge, TN 37831-0062 phone: 865.576.8401 fax: 865.576.5728 email: mailto:[email protected]
Available for sale to the public, in paper, from: U.S. Department of Commerce National Technical Information Service 5285 Port Royal Road Springfield, VA 22161 phone: 800.553.6847 fax: 703.605.6900 email: [email protected] online ordering: http://www.ntis.gov/ordering.htm
This publication received minimal editorial review at NREL
Printed on paper containing at least 50% wastepaper, including 20% postconsumer waste

Acknowledgments This evaluation of the SunLine Transit Agency would not have been possible without the support and cooperation of many people. U.S. Department of Energy Dennis Smith SunLine Transit Agency Mike Oglesby Tommy Edwards Polo Del Toro Karen Thomas National Renewable Energy Laboratory Richard Parish Leslie Eudy Mike Frailey
iii

Table of Contents Acknowledgments.......................................................................................................................... iii Table of Contents........................................................................................................................... iv List of Tables .................................................................................................................................. v List of Figures ................................................................................................................................. v List of Acronyms and Abbreviations............................................................................................. vi Executive Summary ...................................................................................................................... vii Introduction..................................................................................................................................... 1 SunLine Transit Agency Converts to Exclusive Use of CNG........................................................ 2
Converting the Entire SunLine Fleet to CNG............................................................................. 2 Start-Up of CNG Operations (April-May 1994)......................................................................... 4
SunLine’s CNG Bus Fleet .............................................................................................................. 6 SunLine’s Fueling Infrastructure .................................................................................................... 9
Addition of Other Fuels ............................................................................................................ 12 Experience at the SunLine Fueling Stations ............................................................................. 12
Maintenance Facilities Upgrades and Experience ........................................................................ 13 SunLine CNG Bus Operational Experience ................................................................................. 15
Current SunLine Revenue Service............................................................................................ 15 Vehicle Usage ........................................................................................................................... 16 Fuel Economy and Cost ............................................................................................................ 17 Maintenance Costs .................................................................................................................... 18 Roadcalls................................................................................................................................... 22 Total Fuel and Maintenance Cost-per-Mile.............................................................................. 23
Other Projects at SunLine ............................................................................................................. 24 Future Bus Operations at SunLine................................................................................................ 26 References..................................................................................................................................... 28 Appendix A: List of Buses............................................................................................................ 29 Appendix B: Summary Data by Bus Group ................................................................................. 31 Appendix C: SunLine Fleet Fuel and Maintenance Costs ............................................................ 34
iv

List of Tables
Table ES-1. CNG Buses at SunLine ............................................................................................ viii Table ES-2. Summary of Evaluation Results (FY00-FY04) ......................................................... ix Table 1. CNG Buses at SunLine ..................................................................................................... 6 Table 2. Engine Changes to SunLine CNG Buses.......................................................................... 7 Table 3. Total Miles, Hours of Operation, and Average Speed by Fiscal Year ........................... 16 Table 4. Average Annual Miles by Bus Group............................................................................. 17 Table 5. Average Miles per Gasoline Gallon Equivalent and Fuel Cost-per-Mile....................... 17 Table 6. CNG Consumption and Cost at SunLine Fueling Stations............................................. 18 Table 7. Total Maintenance Cost by Bus Study Group (FY 2000-FY 2004) ............................... 20 Table 8. Engine Rebuilds for Orion V Buses with Cummins L10-240G Engines ....................... 22 Table 9. Total Roadcalls by Bus Study Group (FY 2000 - FY 2004) .......................................... 23 Table 10. Summary of Fuel and Maintenance Cost-per-Mile ...................................................... 23
List of Figures Figure 1. SunLine introduces CNG transit buses to the Coachella Valley in 1994........................ 1 Figure 2. SunLine operating area in the Coachella Valley, California, Area ................................. 3 Figure 3. SunLine CNG buses ........................................................................................................ 6 Figure 4. Public fueling at SunLine’s Thousand Palms CNG fueling station ................................ 9 Figure 5. CNG fueling lane and bus wash (Thousand Palms)........................................................ 9 Figure 6. CNG compressor station (Thousand Palms) ................................................................. 10 Figure 7. SunLine Clean Air Center in Indio, California ............................................................. 11 Figure 8. CNG fueling equipment (Indio) .................................................................................... 11 Figure 9. Maintenance facility in Thousand Palms ...................................................................... 13 Figure 10. Average fuel economy (MPGGE) by fiscal year for each bus group.......................... 18 Figure 11. Fuel cell buses tested in operation at SunLine ............................................................ 24 Figure 12. Hydrogen hybrid internal combustion engine bus....................................................... 26 Figure 13. SunLine ISE/Van Hool/UTC fuel cell bus .................................................................. 27
v

List of Acronyms and Abbreviations ASME American Society of Mechanical Engineers CARB California Air Resources Board CNG compressed natural gas DDC Detroit Diesel Corporation DOE U.S. Department of Energy FTA Federal Transit Administration FY fiscal year GGE gasoline gallon equivalent HHICE hydrogen hybrid internal combustion engine hp horsepower LACMTA Los Angeles County Metropolitan Transit Authority LFL lower flammability limit LNG liquefied natural gas MPGGE miles per gasoline gallon equivalent NGVTF Natural Gas Vehicle Technology Forum NREL National Renewable Energy Laboratory psi pounds per square inch RC roadcalls SAE Society of Automotive Engineers SCAQMD South Coast Air Quality Management District SoCAL Gas Southern California Gas Company
vi

Executive Summary This report has been produced as part of the U.S. Department of Energy’s (DOE) Natural Gas Vehicle Technology Forum (NGVTF) activity, which strives to advance gaseous fuel vehicle technology and fueling infrastructure (natural gas, hydrogen, and hydrogen-natural gas blends) to displace the use of imported petroleum in the U.S. The National Renewable Energy Laboratory leads the NGVTF for DOE’s FreedomCAR and Vehicle Technologies Program. The report focuses on the SunLine Transit Agency, which started operation of compressed natural gas (CNG) transit buses in 1994 by converting its entire operating fleet to CNG, essentially overnight. Now, more than 10 years later, SunLine is still committed to CNG transit bus operations as well as testing other future technologies. The main objective of this report is to capture some of the lessons learned and experiences gained at SunLine from its last 10 years of CNG vehicle operations. SunLine (website at www.sunline.org) started transit operations in 1977 with 22 vehicles. Its transit bus operations are located in the Palm Springs, California area and include much of the Coachella Valley (a service area reported as greater than 1,100 square miles). SunLine currently operates over 2 million miles per year at an average operational speed of around 15 miles per hour. In 1991, SunLine discussed the possibility and then planned to convert its transit buses from diesel to CNG in order to distinguish the small transit agency as a leader for reduced emissions in heavy-duty vehicles. As part of these discussions, SunLine decided to maximize the impact by converting the entire fleet of buses and support vehicles to operate only on CNG as soon as possible. In 1991, there were only approximately 25 heavy CNG buses placed into service in the United States and another 70 heavy CNG buses on order. Therefore, SunLine’s decision was risky, especially since it was made at a very early stage in CNG bus development and deployment in the United States. The SunLine Board of Directors approved the 100% alternative fuels approach in 1992. The greatest challenge at that time with implementing full CNG operations was that it had not yet been accomplished in the United States. In order to undertake this difficult task, several activities needed to be planned and executed at the same time including:
• Collecting a group of experts and knowledge contributors • Ordering new CNG buses • Constructing permanent CNG fueling on-site • Completing appropriate training for staff and mechanics • Developing a public relations strategy • Preparing for implementation.
In 1993, a new CNG fueling station was constructed, and new CNG buses were ordered (with the help and cooperation of Sacramento Regional Transit). Natural gas vehicle training programs were developed at the College of the Desert’s Energy Technology Training Center, and the SunLine mechanics were the first “graduates” of that training. All SunLine employees received
vii

some natural gas vehicle safety familiarization training. The nation’s first fleet to change to 100% CNG bus operations occurred in May 1994. The current SunLine bus fleet includes 41 full size transit buses, five mid-size transit buses, and 23 paratransit vehicles. Additional support vehicles include 35 light- and medium-duty vehicles. All of these SunLine vehicles operate on CNG, and a few operate on CNG mixed with hydrogen. The analysis presented in this report focuses on the full-size and mid-size transit buses operating at SunLine (46 CNG buses in the active fleet) as shown in Table ES-1.
Table ES-1. CNG Buses at SunLine
Bus Number of Buses
Model Year Length Engine Purchase
Price Orion V 34* 1994 40 foot Cummins L10-240G $225,000 ElDorado National 5 1994 29 foot Hercules 5.6L $120,000 Thomas MVP 7 1995 40 foot Cummins B5.9G $85,000 * Two of these buses now have Cummins C8.3G engines and one has a Deere 6081H engine. All three of these buses have prototype engines that have been used for testing. When the CNG buses arrived and began service, normal break-in problems occurred. Some mechanics were eager to work on the new bus equipment and a few were concerned about safety. Over time, the major concern was loose fittings left by the less experienced mechanics. Learning how to troubleshoot these new buses was a challenge and was supported in a timely manner by Cummins Cal Pacific. The SunLine staff reported that the transition to CNG bus operations would have been much more difficult without Cummins’ support. Additional information regarding the first three years of operation (1994-1996) at SunLine and Sacramento Regional Transit was also documented in a report published in 1999 by the Society of Automotive Engineers (SAE)1. The mid-term experience (1997-1999) at SunLine was investigated in discussions with SunLine personnel. The mechanics and operators had become comfortable with the CNG buses and infrastructure by the mid-term. As new mechanics were added to the staff, familiarization training was provided both at the College of the Desert and through on-the-job training at SunLine. This report focuses on an evaluation of the last five years of operation costs for the 46 CNG buses [fiscal year (FY) 2000 through FY 2004). Table ES-2 provides summary results for the CNG buses at SunLine.
1 SAE Paper 1999-01-3738, 1999, “A Three-Year Comparison of Natural Gas and Diesel Transit Buses.”
viii
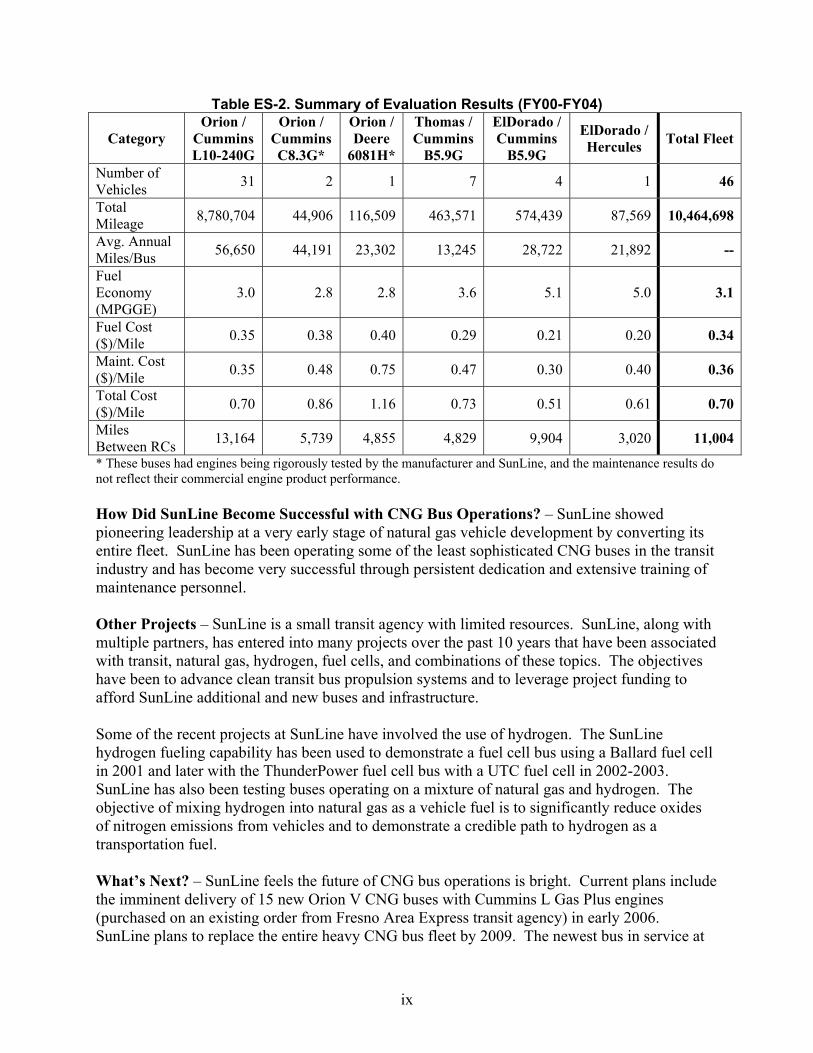
Table ES-2. Summary of Evaluation Results (FY00-FY04)
Category Orion /
Cummins L10-240G
Orion / Cummins C8.3G*
Orion / Deere
6081H*
Thomas / Cummins
B5.9G
ElDorado / Cummins
B5.9G
ElDorado / Hercules Total Fleet
Number of Vehicles 31 2 1 7 4 1 46
Total Mileage 8,780,704 44,906 116,509 463,571 574,439 87,569 10,464,698
Avg. Annual Miles/Bus 56,650 44,191 23,302 13,245 28,722 21,892 --
Fuel Economy (MPGGE)
3.0 2.8 2.8 3.6 5.1 5.0 3.1
Fuel Cost ($)/Mile 0.35 0.38 0.40 0.29 0.21 0.20 0.34
Maint. Cost ($)/Mile 0.35 0.48 0.75 0.47 0.30 0.40 0.36
Total Cost ($)/Mile 0.70 0.86 1.16 0.73 0.51 0.61 0.70
Miles Between RCs 13,164 5,739 4,855 4,829 9,904 3,020 11,004
* These buses had engines being rigorously tested by the manufacturer and SunLine, and the maintenance results do not reflect their commercial engine product performance. How Did SunLine Become Successful with CNG Bus Operations? – SunLine showed pioneering leadership at a very early stage of natural gas vehicle development by converting its entire fleet. SunLine has been operating some of the least sophisticated CNG buses in the transit industry and has become very successful through persistent dedication and extensive training of maintenance personnel. Other Projects – SunLine is a small transit agency with limited resources. SunLine, along with multiple partners, has entered into many projects over the past 10 years that have been associated with transit, natural gas, hydrogen, fuel cells, and combinations of these topics. The objectives have been to advance clean transit bus propulsion systems and to leverage project funding to afford SunLine additional and new buses and infrastructure. Some of the recent projects at SunLine have involved the use of hydrogen. The SunLine hydrogen fueling capability has been used to demonstrate a fuel cell bus using a Ballard fuel cell in 2001 and later with the ThunderPower fuel cell bus with a UTC fuel cell in 2002-2003. SunLine has also been testing buses operating on a mixture of natural gas and hydrogen. The objective of mixing hydrogen into natural gas as a vehicle fuel is to significantly reduce oxides of nitrogen emissions from vehicles and to demonstrate a credible path to hydrogen as a transportation fuel. What’s Next? – SunLine feels the future of CNG bus operations is bright. Current plans include the imminent delivery of 15 new Orion V CNG buses with Cummins L Gas Plus engines (purchased on an existing order from Fresno Area Express transit agency) in early 2006. SunLine plans to replace the entire heavy CNG bus fleet by 2009. The newest bus in service at
ix

SunLine is their hydrogen hybrid internal combustion engine from ISE Research and New Flyer. In November 2005, SunLine also received from ISE Research a new hybrid fuel cell bus with a Van Hool bus chassis using the Siemens hybrid electric propulsion system and a UTC fuel cell power plant.
x

Introduction This report has been produced as part of the U.S. Department of Energy’s (DOE) Natural Gas Vehicle Technology Forum (NGVTF) activity, which strives to advance gaseous fuel vehicle technology and fueling infrastructure (natural gas, hydrogen, and hydrogen-natural gas blends) to displace the use of imported petroleum in the U.S. The National Renewable Energy Laboratory leads the NGVTF for DOE’s FreedomCAR and Vehicle Technologies Program. This NGVTF report focuses on the SunLine Transit Agency, which started operation of compressed natural gas (CNG) transit buses in 1994 by converting its entire operating fleet essentially overnight (Figure 1). Now, more than 10 years later, SunLine is still committed to CNG transit bus operations as well as testing other future vehicle technologies. This report takes a look back at the decisions that led SunLine to a complete changeover to CNG operation and how full implementation of CNG bus operations has fared. There also is an emphasis on the last five years of operations to investigate how these early CNG technology vehicles were maintained up to nearly retirement age. The main objective of this report is to capture some of the lessons learned and experiences gained at SunLine from its 10 years of operating only CNG-fueled vehicles. Some reports and papers have boasted extremely positive experiences at SunLine, while at the same time, some other transit agencies have reported disappointing results with CNG buses. During this same period, a number of transit agencies have experimented with CNG fuel and buses, but moved on to other technologies or back to standard diesel vehicles when they were confronted with growing pains or early operating challenges. SunLine has continued to use early natural gas vehicle and infrastructure technology, and has reported extremely positive results as demonstrated in this report.
Photo courtesy of SunLine Transit Agency
Figure 1. SunLine introduces CNG transit buses to the Coachella Valley in 1994
1

SunLine Transit Agency Converts to Exclusive Use of CNG SunLine (website at www.sunline.org) started transit operations in 1977 with 22 vehicles. SunLine transit bus operations are located in the Palm Springs, California area (Figure 2) and include much of the Coachella Valley (a service area reported as greater than 1,100 square miles). SunLine is physically headquartered in Thousand Palms, California, and has nine member cities as well as one county (Riverside). Each of the following member cities and county has an appointed member on the SunLine board:
• Desert Hot Springs • Palm Springs • Cathedral City • Rancho Mirage • Palm Desert • Indian Wells • La Quinta • Indio • Coachella • Riverside County.
The current SunLine bus fleet includes 41 full-size transit buses (40-foot), five mid-size transit buses (29-foot), and 23 paratransit vehicles. Additional support vehicles include 35 light- and medium-duty vehicles. All of these SunLine vehicles operate on CNG, and a few operate on CNG mixed with hydrogen. The analysis presented in this report is focused on the full-size and mid-size transit buses operating at SunLine (46 CNG buses in the active fleet). Converting the Entire SunLine Fleet to CNG The State of California has some specific and severe air quality challenges identified especially in the Los Angeles metropolitan area. The Coachella Valley, including Palm Springs, is located in Riverside County, which is one of the four counties included in the Los Angeles metropolitan area. In the 1970s, the U.S. Environmental Protection Agency and the California Air Resources Board (CARB) were considering and implementing serious emissions reductions especially for mobile sources (cars and trucks). Starting in the late 1980s and early 1990s, CARB began to strongly encourage alternative fuels for vehicles to help with needed emissions reductions. The South Coast Air Quality Management District (SCAQMD) is the local government entity with jurisdiction on air quality issues in the Los Angeles metropolitan area including Los Angeles, Orange, Riverside, and San Bernardino counties. SCAQMD put in place several incentive programs for conversion of vehicles in the district to alternative fuels. One of the focuses of these incentive programs was on transit buses because of the large emissions impact in urban areas.
2

Figure 2. SunLine operating area in the Coachella Valley, California, Area
In 1991, SunLine changed general managers and was looking for a defining position on clean bus operations. Discussions and plans were made regarding a change of the transit buses to CNG. As part of these discussions, SunLine decided to maximize the impact by converting the entire fleet of buses and support vehicles to operate on CNG as soon as possible. This decision was based on economics and a desire for public recognition of the use of “clean fuels.” This decision at SunLine was made at a very early stage in CNG bus development and deployment in the United States. In 1991 there were only approximately 25 heavy CNG buses just placed into service in the United States and another 70 heavy CNG buses on order. The SunLine Board of Directors approved the 100% alternative fuels approach in 1992. SunLine was active the following year preparing for CNG bus operations. A new CNG fueling station was constructed with the support of the Southern California Gas Company (SoCal Gas). SunLine worked with Sacramento Regional Transit (who was also ordering a significant fleet of new CNG buses) to specify and order the new CNG buses from Orion Bus Industries (34, 40-foot transit buses) and ElDorado National (five, 29-foot buses). Natural gas vehicle training
3
programs were developed at the College of the Desert’s Energy Technology Training Center, and the SunLine mechanics were the first “graduates” of that training. All SunLine employees received some natural gas vehicle safety familiarization training. The nation’s first fleet to change to 100% CNG bus operations occurred in May 1994. Start-Up of CNG Operations (April-May 1994) The greatest challenge in 1993 with implementing full CNG operations was that it had not yet been accomplished in the Coachella Valley or anywhere else in the United States In order to achieve this difficult task, several activities needed to be planned and executed at the same time including:
• Collecting a group of experts and knowledge contributors • Ordering new CNG buses • Constructing permanent CNG fueling on-site • Completing appropriate training for staff and mechanics • Developing a public relations strategy • Preparing for implementation.
SunLine did not execute the implementation of CNG operations single-handedly. Some of the major participants in this implementation included:
• Sacramento Regional Transit (http://www.sacrt.com/) • SoCal Gas (http://www.socalgas.com/) • College of the Desert (http://www.collegeofthedesert.edu/) • Cummins Engine Company (http://www.cummins.com/) • Cummins Cal Pacific (http://www.calpacific.cummins.com/) • Los Angeles County Metropolitan Transit Authority (LACMTA -
http://www.mta.net/default.asp) • Orion Bus Industries (http://www.orionbus.com/orion) • ElDorado National (http://www.thorindustries.com/bus/).
LACMTA was already working with Cummins Engine Company to develop and implement heavy-duty natural gas engines and assisted SunLine with specifying and purchasing CNG buses. The CNG fueling station at the SunLine facility in Thousand Palms was originally owned and operated by SoCal Gas, and SunLine owned 25% of the station. This later changed to a co-ownership with Clean Energy (75%) and SunLine (25%) when the gas utilities were required to divest themselves of the vehicle fueling stations. Currently, Clean Energy operates and maintains the CNG fueling station equipment at SunLine. The training aspects of CNG vehicle operations were in their infancy when SunLine decided to convert to CNG operations. Working with several partners, including College of the Desert and Cummins, SunLine helped develop a training curriculum at the College of the Desert. All SunLine employees received natural gas familiarity and safety training. The mechanics received more intensive training, so they could maintain the heavy- and light-duty vehicles operating on
4

CNG at SunLine. Training information covered topics such as properties of natural gas and CNG, high pressure safety, fittings, and computer/electronic controls and sensors/calibration for the engines. Refresher training is also provided as time and resources allow. All new employees receive this familiarity and safety training for natural gas vehicles. The College of the Desert continues to provide this natural gas vehicle training for the region. Public relations and acceptance of the “new” natural gas transit buses were important aspects of the SunLine CNG operations. SunLine was careful to include the public in its plans for implementing CNG buses. There were press releases and events at the SunLine facility in Thousand Palms. Local newspapers and television produced and continue to produce stories on the SunLine operation. Signage about clean fuels and CNG are on the buses and SunLine has continued outreach to the public including some marketing focused on children in the schools and future riders. SunLine mechanics along with the local Cummins dealer mechanics (Cummins Cal Pacific) prepared for the implementation and support of operations. This solid relationship between SunLine and Cummins Cal Pacific continues to remain strong to this day and is considered to be one of the major reasons for success with CNG operations at SunLine. Several other groups, both local and national, were also key in supporting SunLine’s efforts over the last 10 years including DOE, the Federal Transit Administration (FTA), SCAQMD, CARB, a number of other transit agencies operating CNG buses, and the cities in the Coachella Valley. When the CNG buses arrived and began service, normal break-in problems occurred. Some mechanics were eager to work on the new bus equipment, and a few were concerned about safety. Over time, the most common concern was loose fittings left by the less experienced mechanics. Troubleshooting was supported in a timely manner by Cummins Cal Pacific. The dealer staff was motivated, gathered information, and provided specifications and information when needed. The SunLine staff reported that the transition to CNG bus operations would have been much more difficult without their support.
5

SunLine’s CNG Bus Fleet The CNG buses at SunLine are summarized in Table 1 and shown in Figure 3. The original CNG bus fleet was purchased new from Orion Bus Industries and ElDorado National in 1993, and delivered in 1994. One of SunLine’s older diesel buses was re-powered with a Detroit Diesel Series 50G engine for testing in revenue service. Later in 1999, seven previously owned Thomas MVP model buses were purchased and placed into transit service.
Table 1. CNG Buses at SunLine
Bus Number of Buses
Model Year Length Engine Purchase
Price Orion V 34 1994 40 foot Cummins L10-240G $225,000 ElDorado National 5 1994 29 foot Hercules 5.6L $120,000 Thomas MVP 7 1995 40 foot Cummins B5.9G $85,000 Gillig 1 1985 40 foot Detroit Diesel S50G N/A
Figure 3. SunLine CNG buses (top left – El Dorado; top right – Orion; bottom – Thomas)
SunLine has participated in several demonstrations and testing of emerging natural gas technologies. This testing has provided new equipment at SunLine and allowed for high temperature environment testing for natural gas vehicle technologies. The demonstrations and testing activities have caused many changes over the years for SunLine’s 47 CNG buses as summarized in Table 2.
6

Table 2. Engine Changes to SunLine CNG Buses Timeframe Bus Fleet Change
1997 Orion V
Two buses had L10-240G engines replaced by Cummins C8.3G; in mid-2002, one of these two buses had the C engine re-powered with the C Gas Plus version; the two L10-240G engines were placed into inventory for the remaining 32 Orion buses.
1999 ElDorado
Four of the five buses had the Hercules engines replaced by Cummins B5.9G engines; two of those B engines had the 195 hp settings and two had the 230 hp settings; the remaining ElDorado bus had the Hercules engine in it until the vehicle was retired in 2004.
2000 Orion V One bus had the Cummins L10-240G engine replaced by a John Deere 6081H engine in 2000 for testing; that engine was damaged during testing and was re-powered again in 2002 and testing continued.
2000 Gillig
The one Gillig bus with the DDC S50G engine was retired from SunLine operations and became a mobile library vehicle; this bus was only operating in FY2000 and has not been included in the summary operations analysis presented later in this report.
2003 Thomas
Four of the Thomas buses had the Cummins B5.9G engines rebuilt in chassis to the “Plus” engine package; two of those buses were prepared to operate on a mixture of hydrogen and CNG and were tested.
Each of the natural gas engine technologies used at SunLine is described below:
• Hercules 5.6L – In 1993 (delivery in 1994), SunLine received ElDorado National 29-foot buses equipped with the Hercules 5.6L natural gas engine. There were several chronic issues with this engine that made it unreliable (problems with valves, burning engine oil, cylinders, and pistons) in many locations that operated the engine. SunLine had problems with four of the five vehicles with this engine. Those four engines were replaced in 1999, and the fifth one was left in place until the vehicle was retired in 2003. Hercules discontinued its natural gas engine for on-road vehicles after the 1996 model year. Hercules continues to make natural gas engines for off-road applications.
• Cummins L10-240G – This engine was Cummins’ first commercial natural gas product
for heavy vehicles. The engine had lower horsepower (240 hp versus 280 hp) and torque (750 ft-lb versus 850 ft-lb) than was expected for the typical diesel transit bus application. The engine’s fuel control system was also not as well developed as the product is now. The system has been compared to an older gasoline carbureted engine. The tune of the engine was not precise and easily fell out of adjustment. This would cause problems with emissions and sometimes backfiring. This “out of adjustment” operation of the engine would cause damage to the pistons, liners, and valves. The SunLine mechanics reported that they approached this problem by recognizing that the tune of these engines was “art” and science. The tune of one of these engines would require one mechanic, and a supervisor to check and ensure that the settings were correct. This approach has kept the engine running and in high use service for more than 10 years.
• Detroit Diesel Corporation (DDC) Series 50G – SunLine tested a prototype version of
this engine starting in 1994. In 1997, DDC removed this prototype engine and replaced it
7

with a production engine. There have been no new vehicles purchased by SunLine since the initial purchase of the CNG buses in 1993, so there has been no opportunity to purchase more of the DDC product. Also, the positive relationship between the Cummins dealer (Cummins Cal Pacific) and SunLine made another purchase of DDC engines in the next CNG bus order unlikely. DDC has recently removed the S50 product from the market for diesel and natural gas because of issues with meeting the future emissions certification levels.
• Cummins B5.9G – SunLine has several of the B5.9G engines with the 195 hp setting
and 230 hp setting. Four of the engines with the 230 hp setting have the “Plus” package on the engines. The “Plus” package includes an update of the electronics and feedback sensors for better fuel and knock control.
• Cummins C8.3G – SunLine has two of the C8.3G engines. One of the engines is the
standard C gas engine, and one is the C Gas Plus engine for testing.
• John Deere Power Systems – SunLine had one Deere 6081H natural gas engine installed in an Orion V bus in 2000 for testing. The engine was damaged during testing in 2002 and was replaced with another Deere engine. This bus continues in service.
8

SunLine’s Fueling Infrastructure SunLine’s fueling infrastructure has evolved over time. Vehicles can appropriately fill up with CNG, liquefied natural gas (LNG), hydrogen, or blends of natural gas and hydrogen. Diesel and gasoline are not available at SunLine. As mentioned earlier, SunLine and SoCal Gas built the original CNG fast-fill station at the Thousand Palms facility with construction starting in 1993. Later in 1997, Pickens Fuel Corporation purchased the SoCal Gas portion of the fueling station and operation. Pickens later became Clean Energy in 2001. This CNG fueling station was always designed with commercial and public operations in mind. The station has a public filling station on the outside of the facility at Thousand Palms (Figure 4), and piping is run underground to SunLine’s private bus filling station (Figure 5). The public and private stations provide CNG at 3600 psi or 3000 psi. The compressor station equipment is shown in Figure 6.
Figure 4. Public fueling at SunLine’s Thousand Palms CNG fueling station
Figure 5. CNG fueling lane and bus wash (Thousand Palms)
9

Figure 6. CNG compressor station (Thousand Palms)
The CNG fueling station at Thousand Palms includes two 400 hp natural gas compressors from Wilson Technologies and provides a 10-minute CNG fill for a transit bus. The station design includes six American Society of Mechanical Engineers (ASME) tubes for a buffer to help start the fast fill. In 1995, SunLine opened a second operating location in Indio, California, called its Clean Air Center. Twelve buses were originally operated from this location and now 15 buses are operated. A CNG fueling station was added at this location in 1995 (Figure 7). This station includes both public and private fueling, with higher-speed fueling behind the fence of the facility. One Sulzer and one IMW natural gas compressor along with three ASME tubes for a buffer were installed at Indio (Figure 8). Fueling times range from 12 minutes up to 20 minutes depending on demand. Some trucks and support vehicles are also fueled at this location from the public side of the station.
10

Figure 7. SunLine Clean Air Center in Indio, California
Figure 8. CNG fueling equipment (Indio)
11

Addition of Other Fuels Hydrogen fueling was added to the SunLine fueling station in Thousand Palms in 2000. Hydrogen production was originally provided by an electrolyzer during 2000 to 2003 (from Stuart Energy) and later, a natural gas reformer was added on site. SunLine also added the capability to fuel with a CNG and hydrogen mix. The fueling station now has a natural gas hydrogen reformer from HyRadix for hydrogen fuel production. The fuel station at SunLine’s Thousand Palms facility had LNG fueling added in 2001 as part of the Clean Energy partnership. Waste Management uses the LNG station as a public consumer. Experience at the SunLine Fueling Stations SunLine personnel expressed that the CNG fueling times were acceptable at both stations. A transit agency the size of SunLine is required to have fueling equipment that can fill a transit bus in 10 minutes. Overhauls for the compressors are performed by Clean Energy every two years, so one compressor is overhauled each year while the other compressor is kept in service. Drive-aways at the fueling dispenser have been the main type of safety issue that has occurred at the public fueling station in Thousand Palms. New drivers of light-duty vehicles at the public station have regularly ripped hoses off of the dispenser. As with public gasoline dispensers, the CNG dispenser hoses have a break-away point so that the dispenser is not damaged in the event of a drive-away. The hose pulls away from the dispenser and then can be repaired. However, one particular drive-away ripped the entire dispenser out because the hose had wrapped around the dispenser and did not have a chance to pull out at the break-away point. The transit buses do not generally have the drive-away problem because of a starter cut-out switch at the fueling door. When that fueling door is open, the bus cannot be started. All of the SunLine vehicles have the starter cut-out switch installed (including paratransit and support vehicles). SunLine has attempted to address the drive-away issue at the public station through training and retraining of public access consumers and their own employees. Labels with pictorial instructions were also added on the dispensers to help alleviate the problem. SunLine personnel reported that the small size of its fleet and staff has most likely made it easier to keep up training and awareness than it would with a larger operation.
12

Maintenance Facilities Upgrades and Experience In order to support operations and maintenance of CNG buses, SunLine made some modifications and upgrades to the maintenance facility in 1995. These modifications and upgrades focused around the addition of combustible gas detectors and upgrade of some of the electrical conduit, lighting, and ventilation in the maintenance bays. The fueling station and maintenance facility upgrade costs at the Thousand Palms location were reported to be $1.47 million in 1995. Figure 9 shows the maintenance facility at Thousand Palms. There are no additional costs for the outside bus parking areas. The Indio maintenance facility does not have combustible gas detectors; however, only minor maintenance is performed there. Any major maintenance is performed outdoors at Indio, or the bus is taken to the Thousand Palms facility. The combustible gas sensors and alarms in the maintenance facility are required by building codes for indoor maintenance of CNG vehicles. The combustible gas detection system is designed to alarm at a 20% lower flammability limit (LFL) in air with a siren and lights, and at 40% LFL the siren and lights latch on, power in the building is turned off, and the vents are opened in the roof of the building. The proper operation of this system is tested quarterly and the combustible gas detectors are calibrated every six months.
Figure 9. Maintenance facility in Thousand Palms SunLine’s experience with the combustible gas detectors has been problematic because of false positives (alarms that are not caused by an actual natural gas release). As with other CNG equipment at SunLine, because of early implementation, the equipment used is not as sophisticated or robust as equipment purchased today. When there have been actual natural gas releases from the buses inside the maintenance garage, the mechanics report hearing the leak long before the alarm goes off in the facility. SunLine would like to upgrade this system, but has not yet identified the funding to complete the upgrade. One significant incident occurred at SunLine in the maintenance facility in the first year of operating the CNG buses. A pressure relief device used to relieve excess pressure in the fuel
13

cylinders on the buses failed in the maintenance facility and caught fire. The fire department responded, and the fire was contained quickly. There was some damage to the ceiling of the maintenance facility. In fact, the scorch marks are still visible. And one big problem resulted from this experience—the fire department used a large amount of water in the maintenance facility and filled up the storm sewers. SunLine had to clean up the oil and grease that spilled out of the facility due to the excess water. The lesson learned from this fire incident was the important need to include city, county, and local officials, especially first responders, in the CNG program from the beginning. This relationship with the officials needs to continue beyond the beginning and especially when any changes occur. Continued familiarization training for first responders is critical because of the number of people involved in a 24/7 operation and turnover of those people.
14

SunLine CNG Bus Operational Experience The decision to switch to CNG buses at SunLine has already been discussed. Some additional information regarding the first three years of operation (1994-1996) at SunLine was also documented in a report published in 1999 by the Society of Automotive Engineers (SAE)2. The SAE report included both SunLine and Sacramento Regional Transit and their respective experience with CNG bus operations and life-cycle cost estimates. The general conclusion from this paper was that CNG buses were expected to meet or beat the diesel bus life-cycle cost over a 12-year lifetime. The mid-term experience (1997-1999) at SunLine was investigated in discussions with SunLine personnel. The actual operations data were not readily available from the SunLine computer system because of a change in software in 1999. The mechanics and operators had become comfortable with the CNG buses and infrastructure by the mid-term. As new mechanics were added to the staff, familiarization training was provided both at the College of the Desert and through on-the-job training at SunLine. During the 10-year period of CNG operations in this report, SunLine added or turned over 50% of the approximately 20 mechanics, so there are several mechanics that had been involved from the beginning. This has been extremely helpful for training, troubleshooting, and keeping the CNG engines in tune. Several of the staff that left mechanic positions were promoted to supervisory roles within SunLine over the years, and this has also been helpful in keeping the CNG bus fleet moving. The rest of this section includes an evaluation of the last five years of operation costs for the 46 CNG buses [fiscal year (FY) 2000 through FY 2004]. These analyses were completed by working with SunLine staff in Thousand Palms. This data period translates into July 1999 through June 2004. Summary data for fuel consumption and maintenance costs by vehicle were collected from SunLine’s computer system. More detailed summary data are provided by bus in the Appendix. The data presented in this section include costs that are not corrected for inflation. Current SunLine Revenue Service SunLine operates 12 fixed routes with 46 CNG transit buses (as mentioned above in Table 2, the 47th CNG bus was retired from SunLine service and operates as a mobile library from the SunLine operation in Thousand Palms). The 40-foot buses are randomly dispatched on the 12 fixed routes. The Coachella Valley has average high temperatures above 100°F during the summer months, and the low temperatures rarely drop below 40°F, even in winter. The rainfall average is 6.3 inches per year. The SunLine service area includes much of the desert floor of the Coachella Valley. The heat, low humidity, and low rainfall make this location an extreme duty cycle from an environmental perspective. Table 3 shows by FY the total mileage, hours of operation, and average speed for all routes at SunLine (FY 1998 through FY 2004, with the fiscal year at SunLine being July through June). The general trend for the last seven years has been increasing yearly mileage (except FY2004) and hours of operation. The average speed of the buses has been decreasing slowly until the last
2 SAE Paper 1999-01-3738, 1999, “A Three-Year Comparison of Natural Gas and Diesel Transit Buses.”
15

year where it went down almost one mile per hour. The slowly decreasing average speed has been reported to be generally related to increasing congestion in the Coachella Valley. The change in the last year was in reaction to changes in service planning with removal of a higher speed suburban route called SunLink.
Table 3. Total Miles, Hours of Operation, and Average Speed by Fiscal Year
Fiscal Year
Total Miles
Total Hours of Operation
Average Speed (mph)
1998 1,722,039 108,302 15.9 1999 1,844,061 115,658 15.9 2000 2,026,680 127,276 15.9 2001 2,111,194 133,471 15.8 2002 2,261,201 146,862 15.4 2003 2,272,529 147,080 15.5 2004 2,189,697 149,540 14.6
Vehicle Usage Vehicle usage was analyzed as an indicator of reliability and is shown in Table 4. For a full-size transit bus (40-foot), FTA’s expectation is that the bus will be used at an average rate of approximately 42,000 miles per year or at least 500,000 miles in a 12-year lifetime. The SunLine standard transit buses were used at an average rate of 56,650 miles per year each for the five-year evaluation period. This is well above the FTA benchmark. This indicates that these buses have experienced high usage and availability for service. The Thomas and ElDorado buses are not standard 40-foot transit buses and have lower expectations for usage in transit service. The Thomas buses had about 13,200 miles per year each for the evaluation period. The ElDorado buses had approximately 28,700 miles per year each for the evaluation period. The buses equipped with Cummins C8.3G and John Deere 6081H engines had lower usage than those equipped with the Cummins L10-240G engine. This is an expected result because those three buses have been used as prototype test engines from the two manufacturers. The intent of testing these three engines has been to examine how the engines might operate and potentially fail in extreme desert conditions.
16

Table 4. Average Annual Miles by Bus Group Bus Engine Model Number of
Buses Five-Year
Total Miles Avg. Annual
Miles/Bus Orion Cummins L10-240G 31 8,780,704 56,650Orion Cummins C8.3G 2 441,906 44,191Orion Deere 6081H 1 116,509 23,302Thomas Cummins B5.9G 7 463,571 13,245ElDorado Cummins B5.9G 4 574,439 28,722ElDorado Hercules 5.6L 1 87,569 21,892*Total Fleet 46 10,464,698 -- * This ElDorado bus was retired at the beginning of FY2004.
Fuel Economy and Cost The five-year average miles per gasoline gallon equivalent (MPGGE) calculations for the SunLine fleet are shown in Table 5. The Orion buses equipped with L10-240G engines had a fuel economy of 3.0 MPGGE, which equates to roughly 3.3 miles per diesel equivalent gallon. The other two Orion groups were slightly lower at 2.8 MPGGE. The Thomas buses had an average of 3.6 MPGGE, and the B5.9G-equipped ElDorado buses had an average of 5.1 MPGGE. Interestingly, the Hercules-equipped ElDorado bus had nearly the same fuel economy at 5.0 MPGGE. The fuel cost-per-mile calculations are based on actual fuel costs during the time frame in which the fuel was consumed.
Table 5. Average Miles per Gasoline Gallon Equivalent and Fuel Cost-per-Mile
Bus Engine Model Number of Buses
Five-Year Avg. MPGGE
Fuel Cost ($)/Mile
Orion Cummins L10-240G 31 3.0 0.35 Orion Cummins C8.3G* 2 2.8 0.38 Orion Deere 6081H* 1 2.8 0.40 Thomas Cummins B5.9G 7 3.6 0.29 ElDorado Cummins B5.9G 4 5.1 0.21 ElDorado Hercules 5.6L 1 5.0 0.20 Total Fleet 46 3.1 0.34
* Prototype test engines Clean Energy determined CNG fuel costs based on the base natural gas price, total CNG consumed from the stations (Thousand Palms and Indio) including the public and SunLine consumption, and operations and maintenance costs for each station. SunLine purchases natural gas in a three-year block to help keep costs down. Table 6 shows a summary of total CNG consumed at the SunLine stations and average cost by fiscal year (1999 through 2004).
17
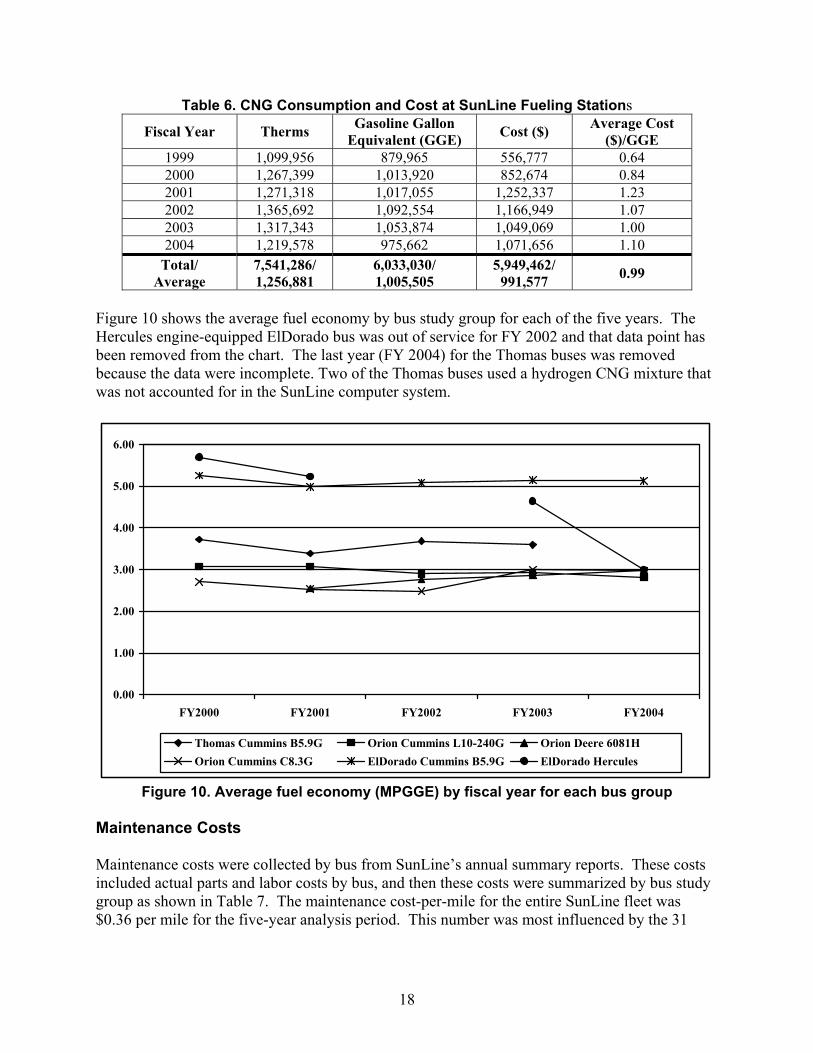
Table 6. CNG Consumption and Cost at SunLine Fueling Stations
Fiscal Year Therms Gasoline Gallon Equivalent (GGE) Cost ($) Average Cost
($)/GGE 1999 1,099,956 879,965 556,777 0.64 2000 1,267,399 1,013,920 852,674 0.84 2001 1,271,318 1,017,055 1,252,337 1.23 2002 1,365,692 1,092,554 1,166,949 1.07 2003 1,317,343 1,053,874 1,049,069 1.00 2004 1,219,578 975,662 1,071,656 1.10
Total/ Average
7,541,286/ 1,256,881
6,033,030/ 1,005,505
5,949,462/ 991,577 0.99
Figure 10 shows the average fuel economy by bus study group for each of the five years. The Hercules engine-equipped ElDorado bus was out of service for FY 2002 and that data point has been removed from the chart. The last year (FY 2004) for the Thomas buses was removed because the data were incomplete. Two of the Thomas buses used a hydrogen CNG mixture that was not accounted for in the SunLine computer system.
0.00
1.00
2.00
3.00
4.00
5.00
6.00
FY2000 FY2001 FY2002 FY2003 FY2004
Thomas Cummins B5.9G Orion Cummins L10-240G Orion Deere 6081HOrion Cummins C8.3G ElDorado Cummins B5.9G ElDorado Hercules
Figure 10. Average fuel economy (MPGGE) by fiscal year for each bus group
Maintenance Costs Maintenance costs were collected by bus from SunLine’s annual summary reports. These costs included actual parts and labor costs by bus, and then these costs were summarized by bus study group as shown in Table 7. The maintenance cost-per-mile for the entire SunLine fleet was $0.36 per mile for the five-year analysis period. This number was most influenced by the 31
18

Orion V buses equipped with the Cummins L10-240G engine, which had a cost-per-mile of $0.35. The Orion V buses with the Cummins C8.3G and Deere engines had significantly higher maintenance costs than the buses with the Cummins L10-240G engines. This occurred because of the status of the engines as a test for operation, reliability, and durability in the desert. The maintenance costs for these three buses included repairs as well as modification costs for installing these engines and equipment. These were only three buses out of 46 and had little impact on the overall cost-per-mile of the fleet. The Thomas buses were relatively expensive to maintain. The ElDorado buses have performed below the average cost-per-mile for the rest of the fleet, except for the Hercules engine-equipped bus, which has been retired. The rest of the ElDorado study group are planned to be taken out of service at the end of the calendar year 2005.
19

Table 7. Total Maintenance Cost by Bus Study Group (FY 2000-FY 2004)
Bus Study Group Mileage Base Parts Cost ($) Labor Cost ($) Total Cost ($) Cost ($) /
Mile Orion/Cummins L10-240G 8,780,704 1,738,073.42 1,323,966.07 3,062,039.49 0.35
Orion/Cummins C8.3G* 441,906 111,463.69 99,495.35 210,959.04 0.48
Orion/Deere 6081H* 116,509 49,610.10 38,221.93 87,832.03 0.75 Thomas/Cummins B5.9G 463,571 92,946.28 123,441.03 216,387.31 0.47
ElDorado/Cummins B5.9G 574,439 80,065.40 94,826.28 174,891.68 0.30
ElDorado/Hercules 87,569 18,790.54 16,427.66 35,218.20 0.40 Total Fleet 10,464,698 2,090,949.43 1,696,378.32 3,787,327.75 0.36 * Prototype test engines The Cummins L10-240G engine has been the workhorse of the SunLine fleet with 31 of 46 buses using this engine (67% of the buses and 84% of the total mileage of the fleet during the analysis period). This engine has been reported by other transit agencies as underpowered and difficult (if not impossible) to maintain. This natural gas engine has primitive (open-loop) electronic control compared to new natural gas engines and has had problems with the high-energy spark plugs and wires, mixer, and regulators. All of these items were specialty items for this engine and the cost for these parts reflects the low volume of engines manufactured. Cummins (and other natural gas engine manufacturers) have gone to more sophisticated electronic controls, better sensors, and coil-over-plug configurations for the spark plugs and wires, which have significantly changed maintainability and cost. SunLine has attempted to address the high parts costs mentioned above by finding other parts sources. The spark plug wires from Cummins cost approximately $100 each and SunLine has found a vendor that supplies essentially the same part for $50 each. The spark plugs have traditionally cost approximately $20 each from Cummins, and SunLine has found the same spark plugs for around $10 each. More cost savings at SunLine have resulted from its experience with the engines and their tune-ups. Cummins recommends tune-ups at 18,000 miles, 36,000 miles, and 72,000 miles. SunLine has extended those tune-ups to 24,000 miles, 48,000 miles, and 96,000 miles for each engine (or at least twice per year). However, the activities are “by the book.” A tune- up consists of changing the spark plugs and air filter, checking the oxygen sensor (including using an exhaust analyzer), and checking the Woodward controller settings. SunLine also has the mechanics inspect the operation of the CNG buses every day. At the 48,000 mile tune-up, the SunLine mechanics also replace the fuel system O-rings, valve cover tubes, and adjust the valves. All of the Cummins’ natural gas engines use a special low ash content engine oil, and the L10-240G engines are no different. The original oil change interval recommendation from Cummins is every 6,000 miles. SunLine tested extending this oil change interval all the way to 24,000 miles using oil analysis at every 6,000 miles. They found that the engine oil was acceptable up to 18,000 miles except during the summer months. SunLine decided on an oil change interval
20

every 12,000 miles to keep the oil changes standardized during the year. However, the engine oil for all of the buses is still analyzed every 6,000 miles to make sure there are no problems. The engine oil change intervals and practices have been in place since 1999 with no known issues. SunLine also reports cost savings for the CNG buses compared to their previous experience with diesel engine equipped buses. The reported savings come from a reduced quantity of hazardous waste collected from cleaning the engines and used engine oil. SunLine has determined that the best time to start rebuilding all of the Cummins L10-240G engines is at about 500,000 miles, which is the same as it would have been with diesel engines. Most experience with early natural gas engine technology has been reported as much lower vehicle usage before an engine rebuild was required. SunLine has had excellent experience with the need for rebuilding the Cummins L10-240G engines. Some Cummins L10-240G engines at SunLine have been used well beyond 500,000 miles before rebuilding (the average mileage of the Cummins L10-240G engine equipped buses was 541,000 miles at the end of the evaluation period, with only 12 of the 31 buses having the rebuild). The engine rebuild cost is typically between $13,000 and $15,000 for each engine. Table 8 shows the engine rebuilds that have been completed and several significant engine repairs with the date and odometer of those repairs. The table also shows the odometer reading for each of these Orion V buses at the end of the operations analysis period (June 2004). SunLine has kept the three Cummins L10-240G engines that were removed from the Orion buses, which now have Cummins C8.3G and Deere 6081H engines. These three L10 engines are used as “swing” engines during the rebuild process. When a bus comes in for the 500,000 mile engine rebuild, that engine is removed, and one of the three spare L10 engines is used as a replacement.
21
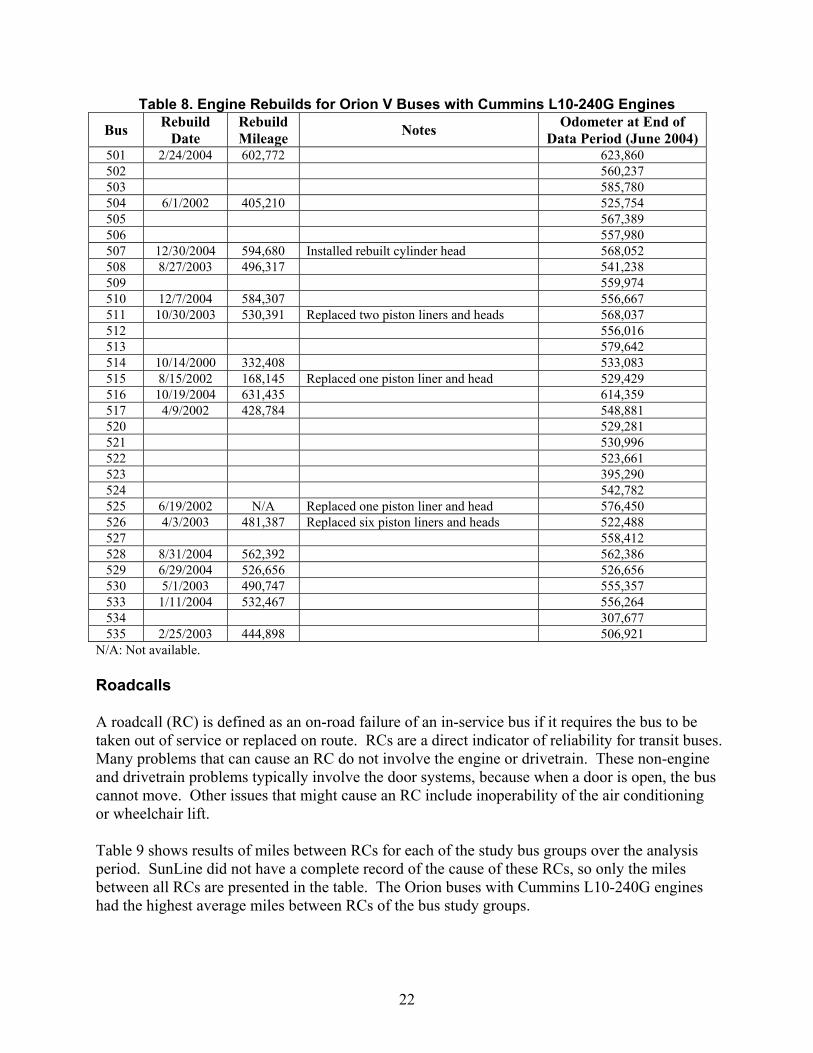
Table 8. Engine Rebuilds for Orion V Buses with Cummins L10-240G Engines
Bus Rebuild Date
Rebuild Mileage Notes Odometer at End of
Data Period (June 2004) 501 2/24/2004 602,772 623,860 502 560,237 503 585,780 504 6/1/2002 405,210 525,754 505 567,389 506 557,980 507 12/30/2004 594,680 Installed rebuilt cylinder head 568,052 508 8/27/2003 496,317 541,238 509 559,974 510 12/7/2004 584,307 556,667 511 10/30/2003 530,391 Replaced two piston liners and heads 568,037 512 556,016 513 579,642 514 10/14/2000 332,408 533,083 515 8/15/2002 168,145 Replaced one piston liner and head 529,429 516 10/19/2004 631,435 614,359 517 4/9/2002 428,784 548,881 520 529,281 521 530,996 522 523,661 523 395,290 524 542,782 525 6/19/2002 N/A Replaced one piston liner and head 576,450 526 4/3/2003 481,387 Replaced six piston liners and heads 522,488 527 558,412 528 8/31/2004 562,392 562,386 529 6/29/2004 526,656 526,656 530 5/1/2003 490,747 555,357 533 1/11/2004 532,467 556,264 534 307,677 535 2/25/2003 444,898 506,921
N/A: Not available. Roadcalls A roadcall (RC) is defined as an on-road failure of an in-service bus if it requires the bus to be taken out of service or replaced on route. RCs are a direct indicator of reliability for transit buses. Many problems that can cause an RC do not involve the engine or drivetrain. These non-engine and drivetrain problems typically involve the door systems, because when a door is open, the bus cannot move. Other issues that might cause an RC include inoperability of the air conditioning or wheelchair lift. Table 9 shows results of miles between RCs for each of the study bus groups over the analysis period. SunLine did not have a complete record of the cause of these RCs, so only the miles between all RCs are presented in the table. The Orion buses with Cummins L10-240G engines had the highest average miles between RCs of the bus study groups.
22

Table 9. Total Roadcalls by Bus Study Group (FY 2000 - FY 2004) Bus Engine Model Mileage
Base Total RCs Miles Between RCs
Orion Cummins L10-240G 8,780,704 667 13,164 Orion Cummins C8.3G* 441,906 77 5,739 Orion Deere 6081H* 116,509 24 4,855 Thomas Cummins B5.9G 463,571 96 4,829 ElDorado Cummins B5.9G 574,439 58 9,904 ElDorado Hercules 5.6L 87,579 29 3,020 Total Fleet 10,464,698 951 11,004
* Prototype test engines Total Fuel and Maintenance Cost-per-Mile Table 10 presents total fuel and maintenance cost-per-mile for each of the bus study groups. The ElDorado buses had the lowest total cost-per-mile. The Orion buses with Cummins L10-240G engines had the next lowest total cost-per-mile with the Thomas buses only slightly higher. The Orion bus with the Deere engine had the highest total cost-per-mile, and the Orion buses with the Cummins C8.3G engines had the next highest total cost-per-mile. These higher costs were caused by higher maintenance costs for the testing activities for these engines.
Table 10. Summary of Fuel and Maintenance Cost-per-Mile
by Bus Study Group (FY 2000-FY 2004) Bus Engine Model Fuel Cost
($) / Mile Maintenance
Cost ($) / Mile Total Cost ($) / Mile
Orion Cummins L10-240G 0.35 0.35 0.70 Orion Cummins C8.3G* 0.38 0.48 0.86 Orion Deere 6081H* 0.40 0.75 1.16 Thomas Cummins B5.9G 0.29 0.47 0.73 ElDorado Cummins B5.9G 0.21 0.30 0.51 ElDorado Hercules 5.6L 0.21 0.40 0.61 Total Fleet 034 0.36 0.70
* Prototype test engines
23

Other Projects at SunLine SunLine is a small transit agency with limited resources. Along with multiple partners, SunLine has entered into many projects over the past 10 years that have been associated with transit, natural gas, hydrogen, fuel cells, and combinations of these fuels and technologies. The objectives have been to advance clean transit bus propulsion systems and to leverage project funding, so SunLine can afford additional and new buses and infrastructure. The novelty of a small transit agency, such as SunLine, to convert completely to natural gas for all vehicles and the additional projects with advanced propulsion and infrastructure has developed great interest in the transit industry, within California, across the United States, and worldwide. SunLine has hosted many visitors to view its operation and the equipment used. The number of visitors gradually increased over time, and SunLine eventually decided to develop training materials and an on-site tour so that visitors could learn about its projects and processes. From this, the Clean Fuels Mall was born. The Clean Fuels Mall tour at SunLine includes 10 stations:
1. An energy sustainability model 2. Fuel cell vehicle garage 3. Teledyne electrolyzer 4. Solar collectors 5. Stuart Energy electrolyzer 6. Mini hydrogen station 7. Hydrogen storage system 8. Trace Technologies inverter 9. Hyradix reformer 10. Fueling mall (compressed and liquefied natural gas, hydrogen, and a mixture of hydrogen
and compressed natural gas). The hydrogen fueling capability at this station has been used to demonstrate a fuel cell bus using a Ballard fuel cell in 2001, as well as a ThunderPower fuel cell bus with a UTC fuel cell in 2002 through 2003. Both buses are shown in Figure 11. Figure 11. Fuel cell buses tested in operation at SunLine (left – ThunderPower bus with a
UTC fuel cell power plant; right – P4 Ballard fuel cell-powered bus)
24

SunLine has also been testing buses operating on a mixture of natural gas and hydrogen. The objective of mixing hydrogen into natural gas as a vehicle fuel is to significantly reduce oxides of nitrogen emissions from vehicles.
25

Future Bus Operations at SunLine SunLine feels the future of CNG bus operations is bright. Current plans include the imminent delivery of 15 new Orion V CNG buses with Cummins L Gas Plus engines (purchased on an existing order from the Fresno Area Express transit agency) in early 2006. SunLine plans to replace the entire heavy CNG bus fleet by 2009. SunLine is also looking for opportunities to expand its bus service so that the Orion buses with rebuilt Cummins L10-240G engines can continue to be used. These buses are capable of several more years of service because the desert does not promote rust and deterioration of the bus body and frame. The newest bus in service at SunLine is their hydrogen hybrid internal combustion engine bus (Figure 12). The bus model is from New Flyer, the engine is a Ford V10 H2, and the hybrid electric propulsion system is from Siemens. ISE Research provided the integration of the system and the Siemens hybrid electric propulsion system. The next new bus from ISE Research is a hybrid fuel cell bus with a Van Hool chassis using the Siemens hybrid electric propulsion system and a UTC fuel cell power plant. This fuel cell bus was purchased with three others for AC Transit in Oakland, California. These four fuel cell buses are essentially identical and the SunLine fuel cell bus from ISE and Van Hool is shown in Figure 13. This bus was delivered to SunLine in November 2005.
Figure 12. Hydrogen hybrid internal combustion engine bus
26

Figure 13. SunLine ISE/Van Hool/UTC fuel cell bus
27

References
1. Beach, C.; Cooke, M.; Daly, T.; Finley, B.; Leroy, C. A Three-Year Comparison of Natural Gas and Diesel Transit Buses. 1999-01-3738.Warrendale, PA: SAE International, 1999.
2. Eudy, L. Natural Gas in Transit Fleets: A Review of the Transit Experience. NREL/TP-
540-31479. Golden, CO: National Renewable Energy Laboratory, 2002.
3. Motta, R.; Norton, P.; Kelly, K.; Chandler, K.; Schumacher, L.; Clark, N. Alternative Fuel Transit Buses, Final Results from the National Renewable Energy Laboratory (NREL) Vehicle Evaluation Program. NREL/TP-425-20513. Golden, CO: National Renewable Energy Laboratory, 1996.
4. Chandler, K.; Eudy, L. ThunderPower Bus Evaluation at SunLine Transit Agency.
DOE/GO-102003-1786. Golden, CO: National Renewable Energy Laboratory, 2003.
5. Munshi, S.; Nedelcu, C.; Harris, J.; Edwards, T.; Williams, J.; Lynch, F.; Frailey, M.; Dixon, G.; Wayne, S.; Nine, R. Hydrogen Blended Natural Gas Operation of a Heavy Duty Turbocharged Lean Burn Spark Ignition Engine. 2004-01-2956. Warrendale, PA: SAE International, 2004.
6. Kamel, M.; Lyford-Pike, E.; Frailey, M.; Bolin, M.; Clark, N.; Nine, R.; Wayne, S. An
Emission and Performance Comparison of the Natural Gas Cummins Westport Inc. C-Gas Plus versus Diesel in Heavy-Duty Trucks. 2002-01-2737. Warrendale, PA: SAE International, 2002.
7. Eudy, L.; Parish, R.; Leonard, J.; Arthur, D. Hydrogen Fuel Cell Bus Evaluation (of the
P4 Ballard bus operating at SunLine Transit Agency). NREL/CP-570-30535. Golden, CO: National Renewable Energy Laboratory, 2001.
28

Appendix A: List of Buses
29

Vehicle VIN Make/Model Year Start at SunLine Used Length Width Fuel Engine Make/Model Notes801 1T75T2F28S1130061 Thomas MVP 1995 6/1/1999 Yes 40 96 CNG Cummins B5.9G+ 230 hp In chassis rebuild to Plus version; HCNG802 1T75T2F25S1130065 Thomas MVP 1995 6/1/1999 Yes 40 96 CNG Cummins B5.9G+ 230 hp In chassis rebuild to Plus version803 1T75T2F29S1130067 Thomas MVP 1995 6/1/1999 Yes 40 96 CNG Cummins B5.9G+ 230 hp In chassis rebuild to Plus version; HCNG804 1T75T2F24S1130073 Thomas MVP 1995 6/1/1999 Yes 40 96 CNG Cummins B5.9G+ 230 hp In chassis rebuild to Plus version805 1T75T2F26S1130074 Thomas MVP 1995 6/1/1999 Yes 40 96 CNG Cummins B5.9G 195 hp806 1T75T2F2XS1130076 Thomas MVP 1995 6/1/1999 Yes 40 96 CNG Cummins B5.9G 195 hp807 1T75T2F21S1130077 Thomas MVP 1995 6/1/1999 Yes 40 96 CNG Cummins B5.9G 195 hp501 2B1569K71R6031839 Orion V 1994 3/31/1994 No 40 102 CNG Cummins L10-240G502 2B1569K70R6031864 Orion V 1994 3/31/1994 No 40 102 CNG Cummins L10-240G503 2B1569K76R6031867 Orion V 1994 4/4/1994 No 40 102 CNG Cummins L10-240G504 2B1569K73R6031874 Orion V 1994 3/30/1994 No 40 102 CNG Cummins L10-240G505 2B1569K79B6031877 Orion V 1994 4/1/1994 No 40 102 CNG Cummins L10-240G506 2B1569K70R6031881 Orion V 1994 4/5/1994 No 40 102 CNG Cummins L10-240G507 2B1569K76R6031884 Orion V 1994 4/9/1994 No 40 102 CNG Cummins L10-240G508 2B1569K73R6031888 Orion V 1994 4/5/1994 No 40 102 CNG Cummins L10-240G509 2B1569K79R6031894 Orion V 1994 4/6/1994 No 40 102 CNG Cummins L10-240G510 2B1569K76R6031898 Orion V 1994 4/20/1994 No 40 102 CNG Cummins L10-240G511 2B1569K72R6031901 Orion V 1994 4/14/1994 No 40 102 CNG Cummins L10-240G512 2B1569K7XR6031905 Orion V 1994 4/14/1994 No 40 102 CNG Cummins L10-240G513 2B1569K75R6031908 Orion V 1994 4/16/1994 No 40 102 CNG Cummins L10-240G514 2B1569K75R6031911 Orion V 1994 4/20/1994 No 40 102 CNG Cummins L10-240G515 2B1569K77R6031912 Orion V 1994 4/23/1994 No 40 102 CNG Cummins L10-240G516 2B1569K79R6031913 Orion V 1994 4/30/1994 No 40 102 CNG Cummins L10-240G517 2B1569K70R6031914 Orion V 1994 4/18/1994 No 40 102 CNG Cummins L10-240G518 2B1569K72R6031915 Orion V 1994 4/16/1994 No 40 102 CNG John Deere 6081H Repowered from L10 in 2000 then again in 2002520 2B1569K76R6031917 Orion V 1994 4/21/1994 No 40 102 CNG Cummins L10-240G521 2B1569K78R6031918 Orion V 1994 4/22/1994 No 40 102 CNG Cummins L10-240G522 2B1569K7XR6031919 Orion V 1994 4/24/1994 No 40 102 CNG Cummins L10-240G523 2B1569K78R6031921 Orion V 1994 5/6/1994 No 40 102 CNG Cummins L10-240G524 2B1569K7XR6031922 Orion V 1994 5/12/1994 No 40 102 CNG Cummins L10-240G525 2B1569K71R6031923 Orion V 1994 5/7/1994 No 40 102 CNG Cummins L10-240G526 2B1569K73R6031924 Orion V 1994 5/14/1994 No 40 102 CNG Cummins L10-240G527 2B1569K75R6031925 Orion V 1994 5/15/1994 No 40 102 CNG Cummins L10-240G528 2B1569K79R6031927 Orion V 1994 5/24/1994 No 40 102 CNG Cummins L10-240G529 2B1569K79R6031930 Orion V 1994 5/25/1994 No 40 102 CNG Cummins L10-240G530 2B1569K74R6031933 Orion V 1994 5/30/1994 No 40 102 CNG Cummins L10-240G533 2B1569K73R6031941 Orion V 1994 6/7/1994 No 40 102 CNG Cummins L10-240G534 2B1569K70R6031945 Orion V 1994 6/7/1994 No 40 102 CNG Cummins L10-240G535 2B1569K74R6031916 Orion V 1994 4/22/1994 No 40 102 CNG Cummins L10-240G603 1N9EBAH63RC084015 ElDorado MO 1994 4/18/1994 No 29 CNG Hercules NG engine out of service in FY04
1477 81063 Gillig 1985 1/1/1985 No 40 102 CNG DDC Series 50G out of service in FY00; now a library bus531 2B1569K7XR6031936 Orion V 1994 5/29/1994 No 40 102 CNG Cummins C8.3G+ Repowered from L10 in 1997532 2B1569K73R6031938 Orion V 1994 6/6/1994 No 40 102 CNG Cummins C8.3G Repowered from L10 in 1997601 1N9EBAH68RC084012 ElDorado MO 1994 4/6/1994 No 29 CNG Cummins B5.9G 195 hp Repowered from Hercules in 1999602 1N9EBAHxxRC084xxx ElDorado MO 1994 4/18/1994 No 29 CNG Cummins B5.9G 230 hp Repowered from Hercules in 1999604 1N9EBAH6XRC084013 ElDorado MO 1994 4/18/1994 No 29 CNG Cummins B5.9G 230 hp Repowered from Hercules in 1999605 1N9EBAH65RC084016 ElDorado MO 1994 4/19/1994 No 29 CNG Cummins B5.9G 195 hp Repowered from Hercules in 1999
30

Appendix B: Summary Data by Bus Group
31

Summary Data by Bus GroupThomas Buses/Cummins B5.9G Engines (801-807)Data Item FY2000 FY2001 FY2002 FY2003 FY2004 TotalMileage 67,212 64,268 86,705 92,400 152,986 463,571Roadcalls 11 9 26 20 30 96Miles Between RCs 6,110 7,141 3,335 4,620 5,100 4,829Fuel Amount 18,063 18,944 23,564 25,715 28,936 115,222Fuel Cost ($) 15,173 23,301 25,213 25,715 31,830 121,232Fuel Cost ($)/Gal 0.84 1.23 1.07 1.00 1.10 1.04MPG 3.72 3.39 3.68 3.59 3.60Fuel Cost ($)/Mile 0.226 0.363 0.291 0.278 0.208 0.288Parts Cost ($) 9,835 15,892 20,485 19,767 26,967 92,946Labor Cost ($) 16,551 14,432 17,251 25,318 49,889 123,441Maintenance Cost ($)/Mile 0.393 0.472 0.435 0.488 0.502 0.467Total Cost ($)/Mile 0.618 0.834 0.726 0.766 0.710 0.728Min Hubodometer 34,002 45,112 55,911 69,440 75,953Max Hubodometer 65,547 74,266 89,765 105,400 128,341
Orion Buses/Cummins L10-240G Engines (501-517; 520-530; 533-535)Data Item FY2000 FY2001 FY2002 FY2003 FY2004 TotalMileage 1,759,876 1,778,284 1,870,528 1,750,797 1,621,219 8,780,704Roadcalls 125 159 125 142 116 667Miles Between RCs 14,079 11,184 14,964 12,330 13,976 13,164Fuel Amount 573,038 577,841 645,535 598,898 577,286 2,972,598Fuel Cost ($) 481,352 710,744 690,722 598,898 635,015 3,116,731Fuel Cost ($)/Gal 0.84 1.23 1.07 1.00 1.10 1.05MPG 3.07 3.08 2.90 2.92 2.81 2.95Fuel Cost ($)/Mile 0.274 0.400 0.369 0.342 0.392 0.355Parts Cost ($) 237,889 367,846 454,763 338,651 338,925 1,738,073Labor Cost ($) 194,233 238,092 264,450 291,410 335,782 1,323,966Maintenance Cost ($)/Mile 0.246 0.341 0.384 0.360 0.416 0.349Total Cost ($)/Mile 0.519 0.740 0.754 0.702 0.808 0.704Min Hubodometer 100,799 151,409 205,591 256,799 307,677Max Hubodometer 390,490 444,325 509,683 566,644 623,860
Orion Bus/Deere 6081H Engine (518)Data Item FY2000 FY2001 FY2002 FY2003 FY2004 TotalMileage 599 39,458 24,109 38,879 13,464 116,509Roadcalls 0 11 1 11 1 24Miles Between RCs 3,587 24,109 3,534 13,464 4,855Fuel Amount 104 15,464 8,724 13,555 4,506 42,353Fuel Cost ($) 87 19,021 9,335 13,555 4,957 46,954Fuel Cost ($)/Gal 0.84 1.23 1.07 1.00 1.10 1.11MPG 2.55 2.76 2.87 2.99 2.75Fuel Cost ($)/Mile 0.146 0.482 0.387 0.349 0.368 0.403Parts Cost ($) 9,105 13,306 11,111 13,437 2,653 49,610Labor Cost ($) 8,261 8,710 6,685 9,480 5,086 38,222Maintenance Cost ($)/Mile 28.992 0.558 0.738 0.589 0.575 0.754Total Cost ($)/Mile 29.137 1.040 1.125 0.938 0.943 1.157Hubodometer 259,747 299,205 323,314 362,193 375,657
32

Orion Buses/Cummins C8.3G Engines (531-532)Data Item FY2000 FY2001 FY2002 FY2003 FY2004 TotalMileage 73,026 80,030 82,334 108,849 97,667 441,906Roadcalls 23 15 7 11 21 77Miles Between RCs 3,175 5,335 11,762 9,895 4,651 5,739Fuel Amount 26,971 31,530 33,174 36,310 32,829 160,814Fuel Cost ($) 22,656 38,782 35,496 36,310 36,112 169,356Fuel Cost ($)/Gal 0.84 1.23 1.07 1.00 1.10 1.05MPG 2.71 2.54 2.48 3.00 2.98 2.75Fuel Cost ($)/Mile 0.310 0.485 0.431 0.334 0.370 0.383Parts Cost ($) 16,304 24,246 26,168 24,527 20,219 111,464Labor Cost ($) 13,828 18,486 18,348 19,991 28,842 99,495Maintenance Cost ($)/Mile 0.413 0.534 0.541 0.409 0.502 0.477Total Cost ($)/Mile 0.723 1.019 0.972 0.743 0.872 0.861Min Hubodometer 155,927 201,601 246,609 326,937 390,748Max Hubodometer 270,826 305,182 342,508 371,029 404,885
ElDorado Buses/Cummins B5.9G Engines (601, 602, 604, 605)Data Item FY2000 FY2001 FY2002 FY2003 FY2004 TotalMileage 93,015 100,833 98,138 110,046 172,407 574,439Roadcalls 13 7 8 13 17 58Miles Between RCs 7,155 14,405 12,267 8,465 10,142 9,904Fuel Amount 17,698 20,225 19,304 21,382 33,589 112,198Fuel Cost ($) 14,866 24,877 20,655 21,382 36,948 118,728Fuel Cost ($)/Gal 0.84 1.23 1.07 1.00 1.10 1.06MPG 5.26 4.99 5.08 5.15 5.13 5.12Fuel Cost ($)/Mile 0.160 0.247 0.210 0.194 0.214 0.207Parts Cost ($) 11,842 14,083 18,252 15,438 20,451 80,065Labor Cost ($) 11,918 12,061 16,348 22,925 31,575 94,826Maintenance Cost ($)/Mile 0.255 0.259 0.353 0.349 0.302 0.304Total Cost ($)/Mile 0.415 0.506 0.563 0.543 0.516 0.511Min Hubodometer 103,885 88,275 88,300 96,586 145,427Max Hubodometer 188,106 222,128 263,036 304,047 347,656
ElDorado Bus/Hercules Engine (603)Data Item FY2000 FY2001 FY2002 FY2003 FY2004 TotalMileage 21,281 24,668 0 41,320 300 87,569Roadcalls 3 14 0 12 0 29Miles Between RCs 7,094 1,762 3,443 3,020Fuel Amount 3,735 4,714 0 8,896 100 17,445Fuel Cost ($) 3,137 5,798 0 8,896 110 17,942Fuel Cost ($)/Gal 0.84 1.23 1.00 1.10 1.03MPG 5.70 5.23 4.64 3.00 5.02Fuel Cost ($)/Mile 0.147 0.235 0.215 0.367 0.205Parts Cost ($) 2,887 3,533 0 12,016 354 18,791Labor Cost ($) 3,097 3,284 0 9,523 523 16,428Maintenance Cost ($)/Mile 0.281 0.276 0.521 2.923 0.402Total Cost ($)/Mile 0.429 0.511 0.737 3.290 0.607Hubodometer 127,174 151,842 151,842 193,162 193,462
33

Appendix C: SunLine Fleet Fuel and Maintenance Costs
34

SunLine Fleet Fuel and Maintenance Costs
Summary Entire FleetData Item FY2000 FY2001 FY2002 FY2003 FY2004 TotalMileage 2,015,009 2,087,541 2,161,814 2,142,291 2,058,043 10,464,698Roadcalls 175 215 167 209 185 951Miles Between RCs 11,514 9,709 12,945 10,250 11,125 11,004Fuel Amount 639,609 668,718 730,301 704,756 677,246 3,420,630Fuel Cost ($) 537,272 822,523 781,422 704,756 744,971 3,590,943Fuel Cost ($)/Gal 0.84 1.23 1.07 1.00 1.10 1.05MPG 3.15 3.12 2.96 3.04 3.04 3.06Fuel Cost ($)/Mile 0.267 0.394 0.361 0.329 0.362 0.343Parts Cost ($) 287,861 438,905 530,779 423,836 409,568 2,090,949Labor Cost ($) 247,889 295,064 323,083 378,647 451,695 1,696,378Maintenance Cost ($)/Mile 0.266 0.352 0.395 0.375 0.418 0.362Total Cost ($)/Mile 0.533 0.746 0.756 0.704 0.780 0.705
Bus 501Data Item FY2000 FY2001 FY2002 FY2003 FY2004 TotalMileage 58,325 53,835 65,358 56,463 57,714 291,695Roadcalls 4 10 3 4 2 23Miles Between RCs 14,581 5,384 21,786 14,116 28,857 12,682Fuel Amount 18,280 17,751 22,560 20,025 20,569 99,185Fuel Cost ($) 15,355 21,834 24,139 20,025 22,626 103,979Fuel Cost ($)/Gal 0.84 1.23 1.07 1.00 1.10 1.05MPG 3.19 3.03 2.90 2.82 2.81 2.94Fuel Cost ($)/Mile 0.263 0.406 0.369 0.355 0.392 0.356Parts Cost ($) 13,608 12,890 10,413 11,856 11,396 60,163Labor Cost ($) 6,827 8,230 7,890 9,188 11,124 43,258Maintenance Cost ($)/Mile 0.350 0.392 0.280 0.373 0.390 0.355Total Cost ($)/Mile 0.614 0.798 0.649 0.727 0.782 0.711Hubodometer 390,490 444,325 509,683 566,146 623,860
Bus 502Data Item FY2000 FY2001 FY2002 FY2003 FY2004 TotalMileage 63,451 44,304 61,323 61,373 60,595 291,046Roadcalls 5 1 11 6 5 28Miles Between RCs 12,690 44,304 5,575 10,229 12,119 10,395Fuel Amount 21,603 14,047 20,681 20,264 21,282 97,877Fuel Cost ($) 18,147 17,278 22,129 20,264 23,410 101,227Fuel Cost ($)/Gal 0.84 1.23 1.07 1.00 1.10 1.03MPG 2.94 3.15 2.97 3.03 2.85 2.97Fuel Cost ($)/Mile 0.286 0.390 0.361 0.330 0.386 0.348Parts Cost ($) 7,591 21,400 14,479 13,685 11,396 68,550Labor Cost ($) 6,639 7,585 9,347 11,241 11,124 45,935Maintenance Cost ($)/Mile 0.224 0.654 0.389 0.406 0.372 0.393Total Cost ($)/Mile 0.510 1.044 0.749 0.736 0.758 0.741Hubodometer 332,642 376,946 438,269 499,642 560,237
35

Bus 503Data Item FY2000 FY2001 FY2002 FY2003 FY2004 TotalMileage 65,529 49,950 62,495 76,677 79,356 334,007Roadcalls 9 8 5 7 6 35Miles Between RCs 7,281 6,244 12,499 10,954 13,226 9,543Fuel Amount 23,023 16,019 21,080 24,621 25,886 110,629Fuel Cost ($) 19,339 19,703 22,556 24,621 28,475 114,694Fuel Cost ($)/Gal 0.84 1.23 1.07 1.00 1.10 1.04MPG 2.85 3.12 2.96 3.11 3.07 3.02Fuel Cost ($)/Mile 0.295 0.394 0.361 0.321 0.359 0.343Parts Cost ($) 7,131 12,407 10,665 13,306 9,116 52,625Labor Cost ($) 7,374 8,316 9,059 10,947 14,171 49,867Maintenance Cost ($)/Mile 0.221 0.415 0.316 0.316 0.293 0.307Total Cost ($)/Mile 0.516 0.809 0.677 0.637 0.652 0.650Hubodometer 317,302 367,252 429,747 506,424 585,780
Bus 504Data Item FY2000 FY2001 FY2002 FY2003 FY2004 TotalMileage 64,163 57,647 49,897 61,738 58,716 292,161Roadcalls 5 6 8 6 5 30Miles Between RCs 12,833 9,608 6,237 10,290 11,743 9,739Fuel Amount 20,979 18,821 17,023 21,014 20,430 98,267Fuel Cost ($) 17,622 23,150 18,215 21,014 22,473 102,474Fuel Cost ($)/Gal 0.84 1.23 1.07 1.00 1.10 1.04MPG 3.06 3.06 2.93 2.94 2.87 2.97Fuel Cost ($)/Mile 0.275 0.402 0.365 0.340 0.383 0.351Parts Cost ($) 12,553 9,384 22,316 13,131 9,482 66,867Labor Cost ($) 6,773 8,283 7,866 8,911 10,219 42,051Maintenance Cost ($)/Mile 0.301 0.306 0.605 0.357 0.336 0.373Total Cost ($)/Mile 0.576 0.708 0.970 0.697 0.718 0.724Hubodometer 297,756 355,403 405,300 467,038 525,754
Bus 505Data Item FY2000 FY2001 FY2002 FY2003 FY2004 TotalMileage 60,410 58,346 61,861 61,319 56,142 298,078Roadcalls 2 8 4 1 2 17Miles Between RCs 30,205 7,293 15,465 61,319 28,071 17,534Fuel Amount 18,904 19,389 20,932 20,612 19,188 99,025Fuel Cost ($) 15,879 23,848 22,397 20,612 21,107 103,844Fuel Cost ($)/Gal 0.84 1.23 1.07 1.00 1.10 1.05MPG 3.20 3.01 2.96 2.97 2.93 3.01Fuel Cost ($)/Mile 0.263 0.409 0.362 0.336 0.376 0.348Parts Cost ($) 8,715 12,271 10,040 10,727 9,939 51,692Labor Cost ($) 6,802 8,528 9,652 9,905 11,652 46,539Maintenance Cost ($)/Mile 0.257 0.356 0.318 0.336 0.385 0.330Total Cost ($)/Mile 0.520 0.765 0.680 0.673 0.761 0.678Hubodometer 329,721 388,067 449,928 511,247 567,389
36
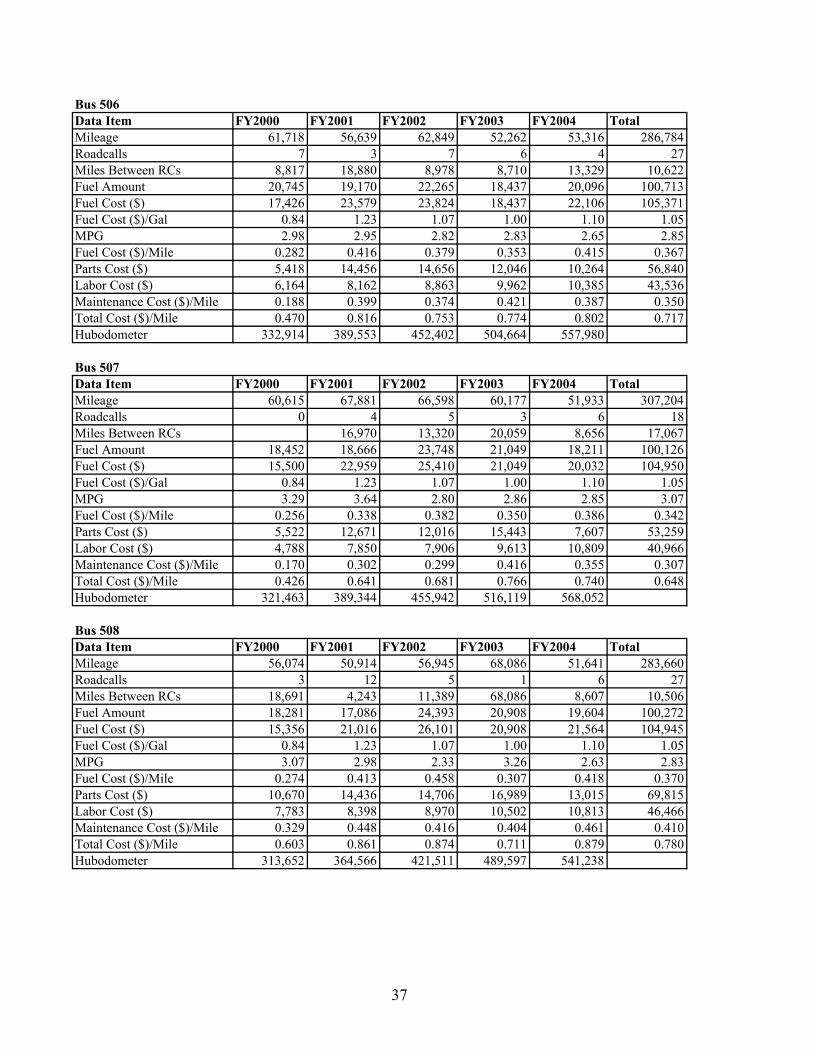
Bus 506Data Item FY2000 FY2001 FY2002 FY2003 FY2004 TotalMileage 61,718 56,639 62,849 52,262 53,316 286,784Roadcalls 7 3 7 6 4 27Miles Between RCs 8,817 18,880 8,978 8,710 13,329 10,622Fuel Amount 20,745 19,170 22,265 18,437 20,096 100,713Fuel Cost ($) 17,426 23,579 23,824 18,437 22,106 105,371Fuel Cost ($)/Gal 0.84 1.23 1.07 1.00 1.10 1.05MPG 2.98 2.95 2.82 2.83 2.65 2.85Fuel Cost ($)/Mile 0.282 0.416 0.379 0.353 0.415 0.367Parts Cost ($) 5,418 14,456 14,656 12,046 10,264 56,840Labor Cost ($) 6,164 8,162 8,863 9,962 10,385 43,536Maintenance Cost ($)/Mile 0.188 0.399 0.374 0.421 0.387 0.350Total Cost ($)/Mile 0.470 0.816 0.753 0.774 0.802 0.717Hubodometer 332,914 389,553 452,402 504,664 557,980
Bus 507Data Item FY2000 FY2001 FY2002 FY2003 FY2004 TotalMileage 60,615 67,881 66,598 60,177 51,933 307,204Roadcalls 0 4 5 3 6 18Miles Between RCs 16,970 13,320 20,059 8,656 17,067Fuel Amount 18,452 18,666 23,748 21,049 18,211 100,126Fuel Cost ($) 15,500 22,959 25,410 21,049 20,032 104,950Fuel Cost ($)/Gal 0.84 1.23 1.07 1.00 1.10 1.05MPG 3.29 3.64 2.80 2.86 2.85 3.07Fuel Cost ($)/Mile 0.256 0.338 0.382 0.350 0.386 0.342Parts Cost ($) 5,522 12,671 12,016 15,443 7,607 53,259Labor Cost ($) 4,788 7,850 7,906 9,613 10,809 40,966Maintenance Cost ($)/Mile 0.170 0.302 0.299 0.416 0.355 0.307Total Cost ($)/Mile 0.426 0.641 0.681 0.766 0.740 0.648Hubodometer 321,463 389,344 455,942 516,119 568,052
Bus 508Data Item FY2000 FY2001 FY2002 FY2003 FY2004 TotalMileage 56,074 50,914 56,945 68,086 51,641 283,660Roadcalls 3 12 5 1 6 27Miles Between RCs 18,691 4,243 11,389 68,086 8,607 10,506Fuel Amount 18,281 17,086 24,393 20,908 19,604 100,272Fuel Cost ($) 15,356 21,016 26,101 20,908 21,564 104,945Fuel Cost ($)/Gal 0.84 1.23 1.07 1.00 1.10 1.05MPG 3.07 2.98 2.33 3.26 2.63 2.83Fuel Cost ($)/Mile 0.274 0.413 0.458 0.307 0.418 0.370Parts Cost ($) 10,670 14,436 14,706 16,989 13,015 69,815Labor Cost ($) 7,783 8,398 8,970 10,502 10,813 46,466Maintenance Cost ($)/Mile 0.329 0.448 0.416 0.404 0.461 0.410Total Cost ($)/Mile 0.603 0.861 0.874 0.711 0.879 0.780Hubodometer 313,652 364,566 421,511 489,597 541,238
37

Bus 509Data Item FY2000 FY2001 FY2002 FY2003 FY2004 TotalMileage 59,555 53,254 64,915 62,521 57,597 297,842Roadcalls 2 3 5 10 2 22Miles Between RCs 29,778 17,751 12,983 6,252 28,799 13,538Fuel Amount 18,712 17,033 21,070 19,777 20,034 96,626Fuel Cost ($) 15,718 20,951 22,545 19,777 22,037 101,028Fuel Cost ($)/Gal 0.84 1.23 1.07 1.00 1.10 1.05MPG 3.18 3.13 3.08 3.16 2.87 3.08Fuel Cost ($)/Mile 0.264 0.393 0.347 0.316 0.383 0.339Parts Cost ($) 7,990 10,138 10,835 12,280 10,300 51,544Labor Cost ($) 6,874 7,995 9,146 9,832 9,551 43,398Maintenance Cost ($)/Mile 0.250 0.341 0.308 0.354 0.345 0.319Total Cost ($)/Mile 0.514 0.734 0.655 0.670 0.727 0.658Hubodometer 321,687 374,941 439,856 502,377 559,974
Bus 510Data Item FY2000 FY2001 FY2002 FY2003 FY2004 TotalMileage 56,381 57,805 65,380 56,546 66,221 302,333Roadcalls 3 4 4 2 4 17Miles Between RCs 18,794 14,451 16,345 28,273 16,555 17,784Fuel Amount 18,519 18,145 22,537 19,030 21,728 99,959Fuel Cost ($) 15,556 22,318 24,115 19,030 23,901 104,920Fuel Cost ($)/Gal 0.84 1.23 1.07 1.00 1.10 1.05MPG 3.04 3.19 2.90 2.97 3.05 3.02Fuel Cost ($)/Mile 0.276 0.386 0.369 0.337 0.361 0.347Parts Cost ($) 10,339 10,874 10,428 12,974 11,470 56,086Labor Cost ($) 6,702 7,735 7,957 8,810 14,346 45,550Maintenance Cost ($)/Mile 0.302 0.322 0.281 0.385 0.390 0.336Total Cost ($)/Mile 0.578 0.708 0.650 0.722 0.751 0.683Hubodometer 310,715 368,520 433,900 490,446 556,667
Bus 511Data Item FY2000 FY2001 FY2002 FY2003 FY2004 TotalMileage 58,607 63,637 68,397 58,170 52,913 301,724Roadcalls 3 4 4 2 3 16Miles Between RCs 19,536 15,909 17,099 29,085 17,638 18,858Fuel Amount 20,552 22,429 19,606 19,553 18,433 100,573Fuel Cost ($) 17,264 27,588 20,978 19,553 20,276 105,659Fuel Cost ($)/Gal 0.84 1.23 1.07 1.00 1.10 1.05MPG 2.85 2.84 3.49 2.97 2.87 3.00Fuel Cost ($)/Mile 0.295 0.434 0.307 0.336 0.383 0.350Parts Cost ($) 6,945 8,179 11,380 19,602 10,761 56,867Labor Cost ($) 7,170 7,630 8,952 9,676 11,411 44,839Maintenance Cost ($)/Mile 0.241 0.248 0.297 0.503 0.419 0.337Total Cost ($)/Mile 0.535 0.682 0.604 0.839 0.802 0.687Hubodometer 324,920 388,557 456,954 515,124 568,037
38

Bus 512Data Item FY2000 FY2001 FY2002 FY2003 FY2004 TotalMileage 60,635 55,664 62,253 57,787 51,233 287,572Roadcalls 4 2 1 2 3 12Miles Between RCs 15,159 27,832 62,253 28,894 17,078 23,964Fuel Amount 19,553 20,629 22,932 21,614 19,918 104,646Fuel Cost ($) 16,425 25,374 24,537 21,614 21,910 109,859Fuel Cost ($)/Gal 0.84 1.23 1.07 1.00 1.10 1.05MPG 3.10 2.70 2.71 2.67 2.57 2.75Fuel Cost ($)/Mile 0.271 0.456 0.394 0.374 0.428 0.382Parts Cost ($) 9,440 13,482 16,739 11,260 7,567 58,487Labor Cost ($) 5,507 7,027 8,147 9,444 10,826 40,951Maintenance Cost ($)/Mile 0.247 0.368 0.400 0.358 0.359 0.346Total Cost ($)/Mile 0.517 0.824 0.794 0.732 0.787 0.728Hubodometer 329,079 384,743 446,996 504,783 556,016
Bus 513Data Item FY2000 FY2001 FY2002 FY2003 FY2004 TotalMileage 60,286 60,113 67,888 56,337 52,443 297,067Roadcalls 13 4 2 7 3 29Miles Between RCs 4,637 15,028 33,944 8,048 17,481 10,244Fuel Amount 19,375 19,189 22,071 18,646 18,528 97,809Fuel Cost ($) 16,275 23,602 23,616 18,646 20,381 102,520Fuel Cost ($)/Gal 0.84 1.23 1.07 1.00 1.10 1.05MPG 3.11 3.13 3.08 3.02 2.83 3.04Fuel Cost ($)/Mile 0.270 0.393 0.348 0.331 0.389 0.345Parts Cost ($) 6,137 8,873 13,225 7,628 17,212 53,075Labor Cost ($) 6,279 7,675 8,611 7,939 14,711 45,217Maintenance Cost ($)/Mile 0.206 0.275 0.322 0.276 0.609 0.331Total Cost ($)/Mile 0.476 0.668 0.670 0.607 0.997 0.676Hubodometer 342,861 402,974 470,862 527,199 579,642
Bus 514Data Item FY2000 FY2001 FY2002 FY2003 FY2004 TotalMileage 60,553 50,320 61,950 56,256 41,226 270,305Roadcalls 4 10 5 1 5 25Miles Between RCs 15,138 5,032 12,390 56,256 8,245 10,812Fuel Amount 17,827 15,640 20,928 18,566 14,052 87,013Fuel Cost ($) 14,975 19,237 22,393 18,566 15,457 90,628Fuel Cost ($)/Gal 0.84 1.23 1.07 1.00 1.10 1.04MPG 3.40 3.22 2.96 3.03 2.93 3.11Fuel Cost ($)/Mile 0.247 0.382 0.361 0.330 0.375 0.335Parts Cost ($) 8,238 15,783 11,013 10,662 8,214 53,909Labor Cost ($) 6,200 9,082 8,653 8,899 10,903 43,737Maintenance Cost ($)/Mile 0.238 0.494 0.317 0.348 0.464 0.361Total Cost ($)/Mile 0.486 0.876 0.679 0.678 0.839 0.697Hubodometer 323,331 373,651 435,601 491,857 533,083
39

Bus 515Data Item FY2000 FY2001 FY2002 FY2003 FY2004 TotalMileage 57,529 49,767 60,409 51,506 59,117 278,328Roadcalls 1 7 5 12 4 29Miles Between RCs 57,529 7,110 12,082 4,292 14,779 9,598Fuel Amount 17,744 16,417 20,747 18,136 20,177 93,221Fuel Cost ($) 14,905 20,193 22,199 18,136 22,195 97,628Fuel Cost ($)/Gal 0.84 1.23 1.07 1.00 1.10 1.05MPG 3.24 3.03 2.91 2.84 2.93 2.99Fuel Cost ($)/Mile 0.259 0.406 0.367 0.352 0.375 0.351Parts Cost ($) 5,682 17,910 21,439 10,629 8,451 64,112Labor Cost ($) 5,372 8,931 9,718 8,853 9,787 42,662Maintenance Cost ($)/Mile 0.192 0.539 0.516 0.378 0.309 0.384Total Cost ($)/Mile 0.451 0.945 0.883 0.730 0.684 0.734Hubodometer 308,630 358,397 418,806 470,312 529,429
Bus 516Data Item FY2000 FY2001 FY2002 FY2003 FY2004 TotalMileage 62,301 63,216 66,874 58,696 47,715 298,802Roadcalls 2 4 1 1 3 11Miles Between RCs 31,151 15,804 66,874 58,696 15,905 27,164Fuel Amount 20,170 21,016 23,101 20,791 18,006 103,084Fuel Cost ($) 16,943 25,850 24,718 20,791 19,807 108,108Fuel Cost ($)/Gal 0.84 1.23 1.07 1.00 1.10 1.05MPG 3.09 3.01 2.89 2.82 2.65 2.90Fuel Cost ($)/Mile 0.272 0.409 0.370 0.354 0.415 0.362Parts Cost ($) 4,705 12,870 10,737 8,311 9,075 45,698Labor Cost ($) 5,861 6,762 8,023 8,294 11,049 39,989Maintenance Cost ($)/Mile 0.170 0.311 0.281 0.283 0.422 0.287Total Cost ($)/Mile 0.442 0.719 0.650 0.637 0.837 0.649Hubodometer 377,858 441,074 507,948 566,644 614,359
Bus 517Data Item FY2000 FY2001 FY2002 FY2003 FY2004 TotalMileage 51,785 61,414 60,582 55,703 52,328 281,812Roadcalls 5 2 2 7 2 18Miles Between RCs 10,357 30,707 30,291 7,958 26,164 15,656Fuel Amount 17,317 20,315 21,432 20,431 18,330 97,825Fuel Cost ($) 14,546 24,987 22,932 20,431 20,163 103,060Fuel Cost ($)/Gal 0.84 1.23 1.07 1.00 1.10 1.05MPG 2.99 3.02 2.83 2.73 2.85 2.88Fuel Cost ($)/Mile 0.281 0.407 0.379 0.367 0.385 0.366Parts Cost ($) 9,761 8,739 20,902 10,179 7,204 56,784Labor Cost ($) 7,194 9,369 8,774 9,242 8,625 43,204Maintenance Cost ($)/Mile 0.327 0.295 0.490 0.349 0.303 0.355Total Cost ($)/Mile 0.608 0.702 0.868 0.715 0.688 0.721Hubodometer 318,854 380,268 440,850 496,553 548,881
40
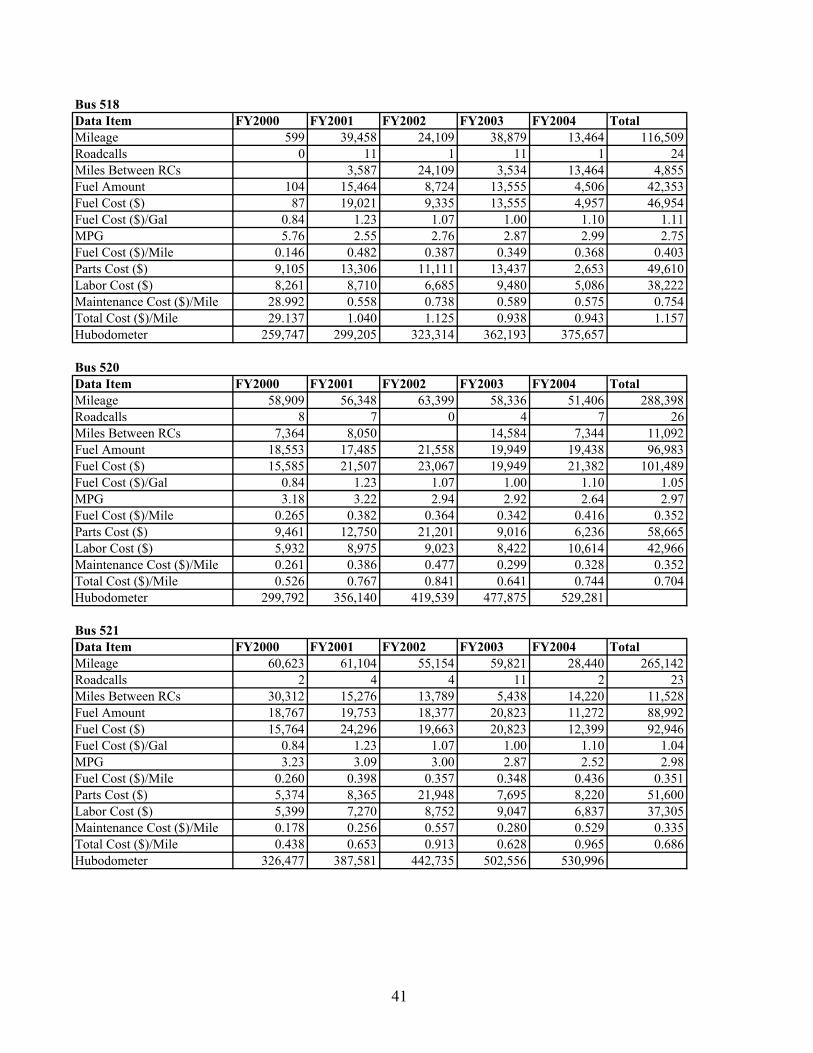
Bus 518Data Item FY2000 FY2001 FY2002 FY2003 FY2004 TotalMileage 599 39,458 24,109 38,879 13,464 116,509Roadcalls 0 11 1 11 1 24Miles Between RCs 3,587 24,109 3,534 13,464 4,855Fuel Amount 104 15,464 8,724 13,555 4,506 42,353Fuel Cost ($) 87 19,021 9,335 13,555 4,957 46,954Fuel Cost ($)/Gal 0.84 1.23 1.07 1.00 1.10 1.11MPG 5.76 2.55 2.76 2.87 2.99 2.75Fuel Cost ($)/Mile 0.146 0.482 0.387 0.349 0.368 0.403Parts Cost ($) 9,105 13,306 11,111 13,437 2,653 49,610Labor Cost ($) 8,261 8,710 6,685 9,480 5,086 38,222Maintenance Cost ($)/Mile 28.992 0.558 0.738 0.589 0.575 0.754Total Cost ($)/Mile 29.137 1.040 1.125 0.938 0.943 1.157Hubodometer 259,747 299,205 323,314 362,193 375,657
Bus 520Data Item FY2000 FY2001 FY2002 FY2003 FY2004 TotalMileage 58,909 56,348 63,399 58,336 51,406 288,398Roadcalls 8 7 0 4 7 26Miles Between RCs 7,364 8,050 14,584 7,344 11,092Fuel Amount 18,553 17,485 21,558 19,949 19,438 96,983Fuel Cost ($) 15,585 21,507 23,067 19,949 21,382 101,489Fuel Cost ($)/Gal 0.84 1.23 1.07 1.00 1.10 1.05MPG 3.18 3.22 2.94 2.92 2.64 2.97Fuel Cost ($)/Mile 0.265 0.382 0.364 0.342 0.416 0.352Parts Cost ($) 9,461 12,750 21,201 9,016 6,236 58,665Labor Cost ($) 5,932 8,975 9,023 8,422 10,614 42,966Maintenance Cost ($)/Mile 0.261 0.386 0.477 0.299 0.328 0.352Total Cost ($)/Mile 0.526 0.767 0.841 0.641 0.744 0.704Hubodometer 299,792 356,140 419,539 477,875 529,281
Bus 521Data Item FY2000 FY2001 FY2002 FY2003 FY2004 TotalMileage 60,623 61,104 55,154 59,821 28,440 265,142Roadcalls 2 4 4 11 2 23Miles Between RCs 30,312 15,276 13,789 5,438 14,220 11,528Fuel Amount 18,767 19,753 18,377 20,823 11,272 88,992Fuel Cost ($) 15,764 24,296 19,663 20,823 12,399 92,946Fuel Cost ($)/Gal 0.84 1.23 1.07 1.00 1.10 1.04MPG 3.23 3.09 3.00 2.87 2.52 2.98Fuel Cost ($)/Mile 0.260 0.398 0.357 0.348 0.436 0.351Parts Cost ($) 5,374 8,365 21,948 7,695 8,220 51,600Labor Cost ($) 5,399 7,270 8,752 9,047 6,837 37,305Maintenance Cost ($)/Mile 0.178 0.256 0.557 0.280 0.529 0.335Total Cost ($)/Mile 0.438 0.653 0.913 0.628 0.965 0.686Hubodometer 326,477 387,581 442,735 502,556 530,996
41

Bus 522Data Item FY2000 FY2001 FY2002 FY2003 FY2004 TotalMileage 56,083 57,693 58,967 56,610 53,761 283,114Roadcalls 4 5 4 1 2 16Miles Between RCs 14,021 11,539 14,742 56,610 26,881 17,695Fuel Amount 18,143 18,330 20,963 18,851 18,949 95,236Fuel Cost ($) 15,240 22,546 22,430 18,851 20,844 99,911Fuel Cost ($)/Gal 0.84 1.23 1.07 1.00 1.10 1.05MPG 3.09 3.15 2.81 3.00 2.84 2.97Fuel Cost ($)/Mile 0.272 0.391 0.380 0.333 0.388 0.353Parts Cost ($) 9,145 8,920 13,423 6,908 7,576 45,972Labor Cost ($) 6,730 7,707 8,007 7,647 9,005 39,096Maintenance Cost ($)/Mile 0.283 0.288 0.363 0.257 0.308 0.300Total Cost ($)/Mile 0.555 0.679 0.744 0.590 0.696 0.653Hubodometer 296,630 354,323 413,290 469,900 523,661
Bus 523Data Item FY2000 FY2001 FY2002 FY2003 FY2004 TotalMileage 52,818 58,102 55,381 53,407 53,830 273,538Roadcalls 5 3 4 3 3 18Miles Between RCs 10,564 19,367 13,845 17,802 17,943 15,197Fuel Amount 17,726 18,850 19,904 18,163 19,668 94,311Fuel Cost ($) 14,890 23,186 21,297 18,163 21,635 99,170Fuel Cost ($)/Gal 0.84 1.23 1.07 1.00 1.10 1.05MPG 2.98 3.08 2.78 2.94 2.74 2.90Fuel Cost ($)/Mile 0.282 0.399 0.385 0.340 0.402 0.363Parts Cost ($) 6,986 11,916 13,530 9,389 15,343 57,163Labor Cost ($) 7,649 7,034 7,726 8,752 9,925 41,086Maintenance Cost ($)/Mile 0.277 0.326 0.384 0.340 0.469 0.359Total Cost ($)/Mile 0.559 0.725 0.768 0.680 0.871 0.722Hubodometer 174,570 232,672 288,053 341,460 395,290
Bus 524Data Item FY2000 FY2001 FY2002 FY2003 FY2004 TotalMileage 49,762 61,991 45,068 60,520 50,339 267,680Roadcalls 5 4 7 6 3 25Miles Between RCs 9,952 15,498 6,438 10,087 16,780 10,707Fuel Amount 16,399 19,704 15,502 20,042 17,040 88,687Fuel Cost ($) 13,775 24,236 16,587 20,042 18,744 93,384Fuel Cost ($)/Gal 0.84 1.23 1.07 1.00 1.10 1.05MPG 3.03 3.15 2.91 3.02 2.95 3.02Fuel Cost ($)/Mile 0.277 0.391 0.368 0.331 0.372 0.349Parts Cost ($) 6,043 14,567 23,771 5,763 7,361 57,505Labor Cost ($) 4,764 7,333 8,431 9,561 12,631 42,720Maintenance Cost ($)/Mile 0.217 0.353 0.715 0.253 0.397 0.374Total Cost ($)/Mile 0.494 0.744 1.083 0.584 0.770 0.723Hubodometer 324,864 386,855 431,923 492,443 542,782
42

Bus 525Data Item FY2000 FY2001 FY2002 FY2003 FY2004 TotalMileage 57,069 66,363 58,789 57,119 51,990 291,330Roadcalls 6 6 4 7 3 26Miles Between RCs 9,512 11,061 14,697 8,160 17,330 11,205Fuel Amount 18,579 20,218 19,841 20,607 19,364 98,609Fuel Cost ($) 15,606 24,868 21,230 20,607 21,300 103,612Fuel Cost ($)/Gal 0.84 1.23 1.07 1.00 1.10 1.05MPG 3.07 3.28 2.96 2.77 2.68 2.95Fuel Cost ($)/Mile 0.273 0.375 0.361 0.361 0.410 0.356Parts Cost ($) 5,279 7,360 20,639 5,794 7,359 46,431Labor Cost ($) 6,950 6,428 9,344 8,375 11,034 42,131Maintenance Cost ($)/Mile 0.214 0.208 0.510 0.248 0.354 0.304Total Cost ($)/Mile 0.488 0.582 0.871 0.609 0.763 0.660Hubodometer 342,189 408,552 467,341 524,460 576,450
Bus 526Data Item FY2000 FY2001 FY2002 FY2003 FY2004 TotalMileage 53,408 61,403 60,863 42,604 33,683 251,961Roadcalls 1 2 5 5 1 14Miles Between RCs 53,408 30,702 12,173 8,521 33,683 17,997Fuel Amount 17,479 19,269 20,376 14,905 12,176 84,205Fuel Cost ($) 14,682 23,701 21,802 14,905 13,394 88,484Fuel Cost ($)/Gal 0.84 1.23 1.07 1.00 1.10 1.05MPG 3.06 3.19 2.99 2.86 2.77 2.99Fuel Cost ($)/Mile 0.275 0.386 0.358 0.350 0.398 0.351Parts Cost ($) 5,425 8,451 14,468 17,190 7,101 52,636Labor Cost ($) 6,213 6,375 8,348 12,537 8,200 41,673Maintenance Cost ($)/Mile 0.218 0.241 0.375 0.698 0.454 0.374Total Cost ($)/Mile 0.493 0.627 0.733 1.048 0.852 0.725Hubodometer 323,935 385,338 446,201 488,805 522,488
Bus 527Data Item FY2000 FY2001 FY2002 FY2003 FY2004 TotalMileage 55,111 58,027 62,095 55,310 51,094 281,637Roadcalls 4 6 3 9 3 25Miles Between RCs 13,778 9,671 20,698 6,146 17,031 11,265Fuel Amount 18,300 18,488 21,545 19,129 17,956 95,418Fuel Cost ($) 15,372 22,740 23,053 19,129 19,752 100,046Fuel Cost ($)/Gal 0.84 1.23 1.07 1.00 1.10 1.05MPG 3.01 3.14 2.88 2.89 2.85 2.95Fuel Cost ($)/Mile 0.279 0.392 0.371 0.346 0.387 0.355Parts Cost ($) 8,484 14,655 7,778 10,278 11,559 52,753Labor Cost ($) 5,818 8,422 8,557 9,744 11,777 44,319Maintenance Cost ($)/Mile 0.260 0.398 0.263 0.362 0.457 0.345Total Cost ($)/Mile 0.538 0.790 0.634 0.708 0.843 0.700Hubodometer 331,886 389,913 452,008 507,318 558,412
43

Bus 528Data Item FY2000 FY2001 FY2002 FY2003 FY2004 TotalMileage 51,164 59,094 62,241 53,662 42,549 268,710Roadcalls 4 7 3 1 2 17Miles Between RCs 12,791 8,442 20,747 53,662 21,275 15,806Fuel Amount 17,858 19,357 21,503 17,935 15,440 92,093Fuel Cost ($) 15,001 23,809 23,008 17,935 16,984 96,737Fuel Cost ($)/Gal 0.84 1.23 1.07 1.00 1.10 1.05MPG 2.87 3.05 2.89 2.99 2.76 2.92Fuel Cost ($)/Mile 0.293 0.403 0.370 0.334 0.399 0.360Parts Cost ($) 10,150 9,281 10,236 17,228 9,252 56,148Labor Cost ($) 6,250 7,265 8,918 9,330 10,312 42,076Maintenance Cost ($)/Mile 0.321 0.280 0.308 0.495 0.460 0.366Total Cost ($)/Mile 0.614 0.683 0.677 0.829 0.859 0.726Hubodometer 344,840 403,934 466,175 519,837 562,386
Bus 529Data Item FY2000 FY2001 FY2002 FY2003 FY2004 TotalMileage 44,633 59,500 56,926 36,580 51,985 249,624Roadcalls 2 8 0 2 9 21Miles Between RCs 22,317 7,438 18,290 5,776 11,887Fuel Amount 14,877 20,153 19,955 12,894 18,634 86,513Fuel Cost ($) 12,497 24,788 21,352 12,894 20,497 92,028Fuel Cost ($)/Gal 0.84 1.23 1.07 1.00 1.10 1.06MPG 3.00 2.95 2.85 2.84 2.79 2.89Fuel Cost ($)/Mile 0.280 0.417 0.375 0.352 0.394 0.369Parts Cost ($) 5,677 13,173 22,326 6,537 33,673 81,386Labor Cost ($) 5,855 7,653 8,069 12,479 12,171 46,228Maintenance Cost ($)/Mile 0.258 0.350 0.534 0.520 0.882 0.511Total Cost ($)/Mile 0.538 0.767 0.909 0.872 1.276 0.880Hubodometer 321,665 381,165 438,091 474,671 526,656
Bus 530Data Item FY2000 FY2001 FY2002 FY2003 FY2004 TotalMileage 47,517 59,045 54,067 52,999 56,011 269,639Roadcalls 9 6 2 4 2 23Miles Between RCs 5,280 9,841 27,034 13,250 28,006 11,723Fuel Amount 15,854 18,804 19,447 18,104 19,231 91,440Fuel Cost ($) 13,317 23,129 20,808 18,104 21,154 96,513Fuel Cost ($)/Gal 0.84 1.23 1.07 1.00 1.10 1.06MPG 3.00 3.14 2.78 2.93 2.91 2.95Fuel Cost ($)/Mile 0.280 0.392 0.385 0.342 0.378 0.358Parts Cost ($) 7,672 10,659 9,607 9,302 8,759 45,999Labor Cost ($) 6,675 6,485 7,982 10,308 9,845 41,295Maintenance Cost ($)/Mile 0.302 0.290 0.325 0.370 0.332 0.324Total Cost ($)/Mile 0.582 0.682 0.710 0.712 0.710 0.682Hubodometer 333,235 392,280 446,347 499,346 555,357
44

Bus 531Data Item FY2000 FY2001 FY2002 FY2003 FY2004 TotalMileage 38,645 45,674 45,008 80,328 63,811 273,466Roadcalls 9 8 4 8 4 33Miles Between RCs 4,294 5,709 11,252 10,041 15,953 8,287Fuel Amount 14,164 18,586 17,485 24,861 20,923 96,019Fuel Cost ($) 11,898 22,861 18,709 24,861 23,015 101,344Fuel Cost ($)/Gal 0.84 1.23 1.07 1.00 1.10 1.06MPG 2.73 2.46 2.57 3.23 3.05 2.85Fuel Cost ($)/Mile 0.308 0.501 0.416 0.309 0.361 0.371Parts Cost ($) 8,054 13,900 12,517 10,295 6,791 51,557Labor Cost ($) 6,670 10,188 9,776 10,893 15,545 53,073Maintenance Cost ($)/Mile 0.381 0.527 0.495 0.264 0.350 0.383Total Cost ($)/Mile 0.689 1.028 0.911 0.573 0.711 0.753Hubodometer 155,927 201,601 246,609 326,937 390,748
Bus 532Data Item FY2000 FY2001 FY2002 FY2003 FY2004 TotalMileage 34,381 34,356 37,326 28,521 33,856 168,440Roadcalls 14 7 3 3 17 44Miles Between RCs 2,456 4,908 12,442 9,507 1,992 3,828Fuel Amount 12,807 12,944 15,689 11,449 11,906 64,795Fuel Cost ($) 10,758 15,921 16,787 11,449 13,097 68,012Fuel Cost ($)/Gal 0.84 1.23 1.07 1.00 1.10 1.05MPG 2.68 2.65 2.38 2.49 2.84 2.60Fuel Cost ($)/Mile 0.313 0.463 0.450 0.401 0.387 0.404Parts Cost ($) 8,250 10,345 13,651 14,232 13,428 59,907Labor Cost ($) 7,158 8,298 8,572 9,099 13,297 46,423Maintenance Cost ($)/Mile 0.448 0.543 0.595 0.818 0.789 0.631Total Cost ($)/Mile 0.761 1.006 1.045 1.219 1.176 1.035Hubodometer 270,826 305,182 342,508 371,029 404,885
Bus 533Data Item FY2000 FY2001 FY2002 FY2003 FY2004 TotalMileage 55,226 56,843 58,334 52,064 51,432 273,899Roadcalls 0 3 7 3 6 19Miles Between RCs 18,948 8,333 17,355 8,572 14,416Fuel Amount 18,383 19,778 20,839 18,851 18,577 96,428Fuel Cost ($) 15,442 24,327 22,298 18,851 20,435 101,352Fuel Cost ($)/Gal 0.84 1.23 1.07 1.00 1.10 1.05MPG 3.00 2.87 2.80 2.76 2.77 2.84Fuel Cost ($)/Mile 0.280 0.428 0.382 0.362 0.397 0.370Parts Cost ($) 8,218 10,110 19,049 6,719 28,458 72,555Labor Cost ($) 5,221 6,588 9,773 7,807 10,324 39,713Maintenance Cost ($)/Mile 0.243 0.294 0.494 0.279 0.754 0.410Total Cost ($)/Mile 0.523 0.722 0.876 0.641 1.151 0.780Hubodometer 337,591 394,434 452,768 504,832 556,264
45

Bus 534Data Item FY2000 FY2001 FY2002 FY2003 FY2004 TotalMileage 45,303 50,610 54,182 51,208 50,878 252,181Roadcalls 1 4 2 5 2 14Miles Between RCs 45,303 12,653 27,091 10,242 25,439 18,013Fuel Amount 14,897 17,323 18,475 17,458 17,931 86,084Fuel Cost ($) 12,513 21,307 19,768 17,458 19,724 90,771Fuel Cost ($)/Gal 0.84 1.23 1.07 1.00 1.10 1.05MPG 3.04 2.92 2.93 2.93 2.84 2.93Fuel Cost ($)/Mile 0.276 0.421 0.365 0.341 0.388 0.360Parts Cost ($) 3,825 9,256 7,147 5,155 6,841 32,224Labor Cost ($) 4,893 6,593 6,730 6,591 9,447 34,254Maintenance Cost ($)/Mile 0.192 0.313 0.256 0.229 0.320 0.264Total Cost ($)/Mile 0.469 0.734 0.621 0.570 0.708 0.624Hubodometer 100,799 151,409 205,591 256,799 307,677
Bus 535Data Item FY2000 FY2001 FY2002 FY2003 FY2004 TotalMileage 54,333 57,455 59,088 48,940 43,615 263,431Roadcalls 2 2 3 3 6 16Miles Between RCs 27,167 28,728 19,696 16,313 7,269 16,464Fuel Amount 17,187 18,567 20,144 17,713 17,138 90,749Fuel Cost ($) 14,437 22,837 21,554 17,713 18,852 95,393Fuel Cost ($)/Gal 0.84 1.23 1.07 1.00 1.10 1.05MPG 3.16 3.09 2.93 2.76 2.54 2.90Fuel Cost ($)/Mile 0.266 0.397 0.365 0.362 0.432 0.362Parts Cost ($) 5,705 11,621 13,650 10,969 8,718 50,663Labor Cost ($) 5,575 6,403 7,257 9,553 12,155 40,942Maintenance Cost ($)/Mile 0.208 0.314 0.354 0.419 0.479 0.348Total Cost ($)/Mile 0.473 0.711 0.719 0.781 0.911 0.710Hubodometer 297,823 355,278 414,366 463,306 506,921
Bus 601Data Item FY2000 FY2001 FY2002 FY2003 FY2004 TotalMileage 34,800 39,143 33,761 25,471 36,829 170,004Roadcalls 3 2 3 4 5 17Miles Between RCs 11,600 19,572 11,254 6,368 7,366 10,000Fuel Amount 6,853 8,195 6,849 5,155 7,865 34,917Fuel Cost ($) 5,757 10,080 7,328 5,155 8,652 36,971Fuel Cost ($)/Gal 0.84 1.23 1.07 1.00 1.10 1.06MPG 5.08 4.78 4.93 4.94 4.68 4.87Fuel Cost ($)/Mile 0.165 0.258 0.217 0.202 0.235 0.217Parts Cost ($) 2,337 2,701 7,097 5,153 7,163 24,450Labor Cost ($) 3,430 2,637 5,514 8,042 7,937 27,560Maintenance Cost ($)/Mile 0.166 0.136 0.374 0.518 0.410 0.306Total Cost ($)/Mile 0.331 0.394 0.591 0.720 0.645 0.523Hubodometer 147,710 186,853 220,614 246,085 282,914
46

Bus 602Data Item FY2000 FY2001 FY2002 FY2003 FY2004 TotalMileage 33,120 34,022 40,908 41,011 43,609 192,670Roadcalls 4 2 2 4 5 17Miles Between RCs 8,280 17,011 20,454 10,253 8,722 11,334Fuel Amount 6,125 7,014 7,448 7,720 8,100 36,407Fuel Cost ($) 5,145 8,627 7,969 7,720 8,910 38,372Fuel Cost ($)/Gal 0.84 1.23 1.07 1.00 1.10 1.05MPG 5.41 4.85 5.49 5.31 5.38 5.29Fuel Cost ($)/Mile 0.155 0.254 0.195 0.188 0.204 0.199Parts Cost ($) 5,366 3,171 5,129 1,849 4,214 19,728Labor Cost ($) 4,205 3,833 4,540 4,371 7,182 24,131Maintenance Cost ($)/Mile 0.289 0.206 0.236 0.152 0.261 0.228Total Cost ($)/Mile 0.444 0.459 0.431 0.340 0.466 0.427Hubodometer 188,106 222,128 263,036 304,047 347,656
Bus 603Data Item FY2000 FY2001 FY2002 FY2003 FY2004 TotalMileage 21,281 24,668 0 41,320 300 87,569Roadcalls 3 14 0 12 0 29Miles Between RCs 7,094 1,762 3,443 3,020Fuel Amount 3,735 4,714 0 8,896 100 17,445Fuel Cost ($) 3,137 5,798 0 8,896 110 17,942Fuel Cost ($)/Gal 0.84 1.23 1.07 1.00 1.10 1.03MPG 5.70 5.23 4.64 3.00 5.02Fuel Cost ($)/Mile 0.147 0.235 0.215 0.367 0.205Parts Cost ($) 2,887 3,533 0 12,016 354 18,791Labor Cost ($) 3,097 3,284 0 9,523 523 16,428Maintenance Cost ($)/Mile 0.281 0.276 0.521 2.92 0.402Total Cost ($)/Mile 0.429 0.511 0.737 3.290 0.607Hubodometer 127,174 151,842 151,842 193,162 193,462
Bus 604Data Item FY2000 FY2001 FY2002 FY2003 FY2004 TotalMileage 25,095 22,309 23,444 35,278 43,128 149,254Roadcalls 6 3 3 4 1 17Miles Between RCs 4,183 7,436 7,815 8,820 43,128 8,780Fuel Amount 4,720 4,687 4,993 6,760 8,245 29,405Fuel Cost ($) 3,965 5,765 5,343 6,760 9,070 30,902Fuel Cost ($)/Gal 0.84 1.23 1.07 1.00 1.10 1.05MPG 5.32 4.76 4.70 5.22 5.23 5.08Fuel Cost ($)/Mile 0.158 0.258 0.228 0.192 0.210 0.207Parts Cost ($) 4,139 6,132 4,180 3,371 4,021 21,844Labor Cost ($) 4,283 3,567 2,911 5,555 9,015 25,331Maintenance Cost ($)/Mile 0.336 0.435 0.302 0.253 0.302 0.316Total Cost ($)/Mile 0.494 0.693 0.530 0.445 0.513 0.523Hubodometer 103,885 126,194 149,638 184,916 228,044
47

Bus 605Data Item FY2000 FY2001 FY2002 FY2003 FY2004 TotalMileage 5,359 25 8,286 48,841 62,511Roadcalls 0 0 1 6 7Miles Between RCs 8,286 8,140 8,930Fuel Amount 329 14 1,747 9,379 11,469Fuel Cost ($) 0 405 15 1,747 10,317 12,484Fuel Cost ($)/Gal 0.84 1.23 1.07 1.00 1.10 1.09MPG 16.29 1.79 4.74 5.21 5.45Fuel Cost ($)/Mile 0.076 0.599 0.211 0.211 0.200Parts Cost ($) 2,078 1,845 5,066 5,054 14,043Labor Cost ($) 2,024 3,383 4,958 7,441 17,805Maintenance Cost ($)/Mile 0.765 209 1.210 0.256 0.509Total Cost ($)/Mile 0.841 210 1.421 0.467 0.709Hubodometer 88,275 88,300 96,586 145,427
Bus 801Data Item FY2000 FY2001 FY2002 FY2003 FY2004 TotalMileage 2,409 10,627 14,595 20,051 30,000 77,682Roadcalls 0 3 6 3 2 14Miles Between RCs 3,542 2,433 6,684 15,000 5,549Fuel Amount 750 2,978 3,580 5,487 421 13,216Fuel Cost ($) 630 3,663 3,831 5,487 463 14,074Fuel Cost ($)/Gal 0.84 1.23 1.07 1.00 1.10 1.06MPG 3.21 3.57 4.08 3.65 71 5.88Fuel Cost ($)/Mile 0.262 0.345 0.262 0.274 0.015 0.181Parts Cost ($) 1,779 4,143 3,063 2,795 4,483 16,263Labor Cost ($) 2,383 2,421 2,140 3,910 10,390 21,243Maintenance Cost ($)/Mile 1.728 0.618 0.356 0.334 0.496 0.483Total Cost ($)/Mile 1.989 0.962 0.619 0.608 0.511 0.664Hubodometer 53,068 63,695 78,290 98,341 128,341
Bus 802Data Item FY2000 FY2001 FY2002 FY2003 FY2004 TotalMileage 12,096 11,422 10,283 5,674 39,747 79,222Roadcalls 0 0 4 4 7 15Miles Between RCs 2,571 1,419 5,678 5,281Fuel Amount 3,262 3,243 3,116 1,707 11,860 23,188Fuel Cost ($) 2,740 3,989 3,334 1,707 13,046 24,816Fuel Cost ($)/Gal 0.84 1.23 1.07 1.00 1.10 1.07MPG 3.71 3.52 3.30 3.32 3.35 3.42Fuel Cost ($)/Mile 0.227 0.349 0.324 0.301 0.328 0.313Parts Cost ($) 478 2,233 1,356 3,935 7,348 15,350Labor Cost ($) 1,871 2,591 1,893 2,505 11,201 20,061Maintenance Cost ($)/Mile 0.194 0.422 0.316 1.135 0.467 0.447Total Cost ($)/Mile 0.421 0.772 0.640 1.436 0.795 0.760Hubodometer 59,533 70,955 81,238 86,912 126,659
48
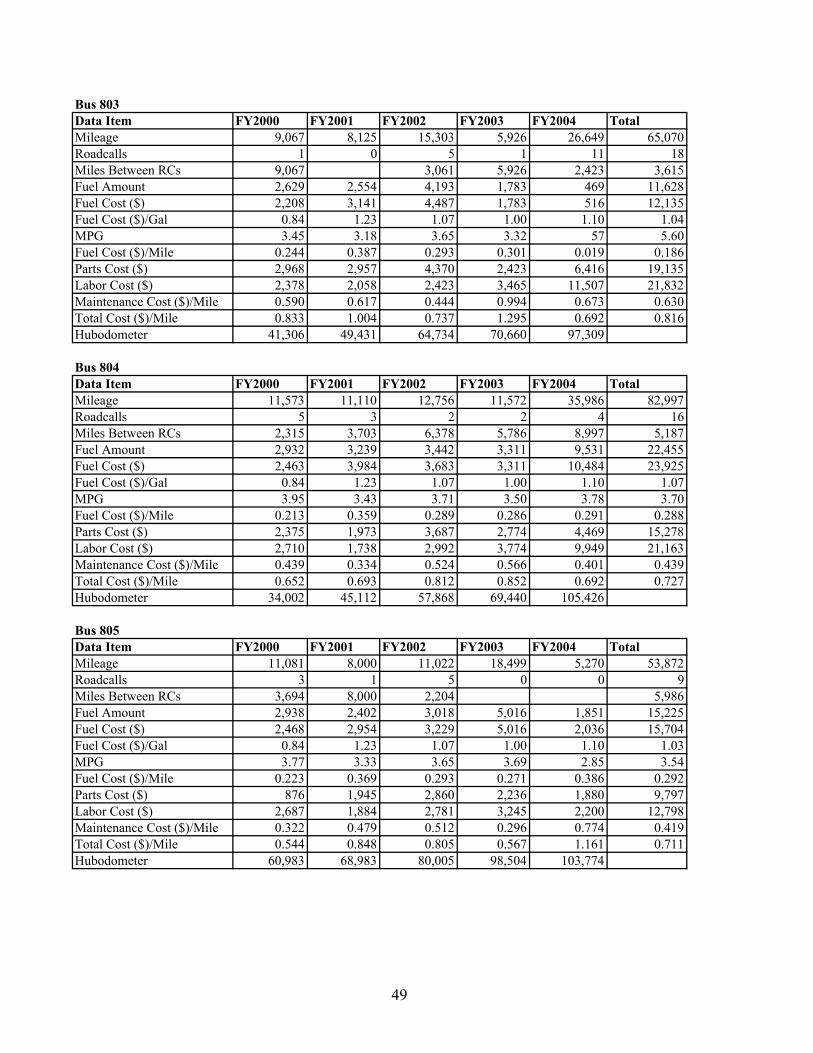
Bus 803Data Item FY2000 FY2001 FY2002 FY2003 FY2004 TotalMileage 9,067 8,125 15,303 5,926 26,649 65,070Roadcalls 1 0 5 1 11 18Miles Between RCs 9,067 3,061 5,926 2,423 3,615Fuel Amount 2,629 2,554 4,193 1,783 469 11,628Fuel Cost ($) 2,208 3,141 4,487 1,783 516 12,135Fuel Cost ($)/Gal 0.84 1.23 1.07 1.00 1.10 1.04MPG 3.45 3.18 3.65 3.32 57 5.60Fuel Cost ($)/Mile 0.244 0.387 0.293 0.301 0.019 0.186Parts Cost ($) 2,968 2,957 4,370 2,423 6,416 19,135Labor Cost ($) 2,378 2,058 2,423 3,465 11,507 21,832Maintenance Cost ($)/Mile 0.590 0.617 0.444 0.994 0.673 0.630Total Cost ($)/Mile 0.833 1.004 0.737 1.295 0.692 0.816Hubodometer 41,306 49,431 64,734 70,660 97,309
Bus 804Data Item FY2000 FY2001 FY2002 FY2003 FY2004 TotalMileage 11,573 11,110 12,756 11,572 35,986 82,997Roadcalls 5 3 2 2 4 16Miles Between RCs 2,315 3,703 6,378 5,786 8,997 5,187Fuel Amount 2,932 3,239 3,442 3,311 9,531 22,455Fuel Cost ($) 2,463 3,984 3,683 3,311 10,484 23,925Fuel Cost ($)/Gal 0.84 1.23 1.07 1.00 1.10 1.07MPG 3.95 3.43 3.71 3.50 3.78 3.70Fuel Cost ($)/Mile 0.213 0.359 0.289 0.286 0.291 0.288Parts Cost ($) 2,375 1,973 3,687 2,774 4,469 15,278Labor Cost ($) 2,710 1,738 2,992 3,774 9,949 21,163Maintenance Cost ($)/Mile 0.439 0.334 0.524 0.566 0.401 0.439Total Cost ($)/Mile 0.652 0.693 0.812 0.852 0.692 0.727Hubodometer 34,002 45,112 57,868 69,440 105,426
Bus 805Data Item FY2000 FY2001 FY2002 FY2003 FY2004 TotalMileage 11,081 8,000 11,022 18,499 5,270 53,872Roadcalls 3 1 5 0 0 9Miles Between RCs 3,694 8,000 2,204 5,986Fuel Amount 2,938 2,402 3,018 5,016 1,851 15,225Fuel Cost ($) 2,468 2,954 3,229 5,016 2,036 15,704Fuel Cost ($)/Gal 0.84 1.23 1.07 1.00 1.10 1.03MPG 3.77 3.33 3.65 3.69 2.85 3.54Fuel Cost ($)/Mile 0.223 0.369 0.293 0.271 0.386 0.292Parts Cost ($) 876 1,945 2,860 2,236 1,880 9,797Labor Cost ($) 2,687 1,884 2,781 3,245 2,200 12,798Maintenance Cost ($)/Mile 0.322 0.479 0.512 0.296 0.774 0.419Total Cost ($)/Mile 0.544 0.848 0.805 0.567 1.161 0.711Hubodometer 60,983 68,983 80,005 98,504 103,774
49

Bus 806Data Item FY2000 FY2001 FY2002 FY2003 FY2004 TotalMileage 10,802 6,265 7,247 15,043 4,999 44,356Roadcalls 1 1 0 1 1 4Miles Between RCs 10,802 6,265 15,043 4,999 11,089Fuel Amount 2,875 1,908 2,124 3,926 1,631 12,464Fuel Cost ($) 2,415 2,347 2,273 3,926 1,794 12,755Fuel Cost ($)/Gal 0.84 1.23 1.07 1.00 1.10 1.02MPG 3.76 3.28 3.41 3.83 3.06 3.56Fuel Cost ($)/Mile 0.224 0.375 0.314 0.261 0.359 0.288Parts Cost ($) 745 1,006 3,179 3,483 780 9,194Labor Cost ($) 2,112 1,904 1,847 4,283 1,875 12,020Maintenance Cost ($)/Mile 0.265 0.464 0.694 0.516 0.531 0.478Total Cost ($)/Mile 0.488 0.839 1.007 0.777 0.890 0.766Hubodometer 42,399 48,664 55,911 70,954 75,953
Bus 807Data Item FY2000 FY2001 FY2002 FY2003 FY2004 TotalMileage 10,184 8,719 15,499 15,635 10,335 60,372Roadcalls 1 1 4 9 5 20Miles Between RCs 10,184 8,719 3,875 1,737 2,067 3,019Fuel Amount 2,677 2,620 4,091 4,485 3,173 17,046Fuel Cost ($) 2,249 3,223 4,377 4,485 3,490 17,824Fuel Cost ($)/Gal 0.84 1.23 1.07 1.00 1.10 1.05MPG 3.80 3.33 3.79 3.49 3.26 3.54Fuel Cost ($)/Mile 0.221 0.370 0.282 0.287 0.338 0.295Parts Cost ($) 613 1,636 1,970 2,121 1,590 7,930Labor Cost ($) 2,409 1,836 3,175 4,135 2,768 14,324Maintenance Cost ($)/Mile 0.297 0.398 0.332 0.400 0.422 0.369Total Cost ($)/Mile 0.518 0.768 0.614 0.687 0.759 0.664Hubodometer 65,547 74,266 89,765 105,400 115,735
Bus 1477Data Item FY2000 FY2001 FY2002 FY2003 FY2004 TotalMileage 6,240 6,240Roadcalls 0 0Miles Between RCsFuel Amount 1,696 1,696Fuel Cost ($) 1,425 0 0 0 0 1,425Fuel Cost ($)/Gal 0.84 1.23 1.07 1.00 1.10 0.84MPG 3.68 3.68Fuel Cost ($)/Mile 0.228 0.228Parts Cost ($) 943 943Labor Cost ($) 1,472 1,472Maintenance Cost ($)/Mile 0.387 0.387Total Cost ($)/Mile 0.615 0.615Hubodometer 21,737
50

F1146-E(12/2004)
REPORT DOCUMENTATION PAGE Form Approved OMB No. 0704-0188
The public reporting burden for this collection of information is estimated to average 1 hour per response, including the time for reviewing instructions, searching existing data sources, gathering and maintaining the data needed, and completing and reviewing the collection of information. Send comments regarding this burden estimate or any other aspect of this collection of information, including suggestions for reducing the burden, to Department of Defense, Executive Services and Communications Directorate (0704-0188). Respondents should be aware that notwithstanding any other provision of law, no person shall be subject to any penalty for failing to comply with a collection of information if it does not display a currently valid OMB control number. PLEASE DO NOT RETURN YOUR FORM TO THE ABOVE ORGANIZATION. 1. REPORT DATE (DD-MM-YYYY)
January 2006 2. REPORT TYPE
Subcontract Report 3. DATES COVERED (From - To)
April 2003 – December 2004 5a. CONTRACT NUMBER
DE-AC36-99-GO10337
5b. GRANT NUMBER
4. TITLE AND SUBTITLE Ten Years of Compressed Natural Gas (CNG) at SunLine Transit: April 2003 – December 2004
5c. PROGRAM ELEMENT NUMBER
5d. PROJECT NUMBER NREL/SR-540-39180
5e. TASK NUMBER FC05.9000
6. AUTHOR(S) K. Chandler
5f. WORK UNIT NUMBER
7. PERFORMING ORGANIZATION NAME(S) AND ADDRESS(ES) Battelle 505 King Avenue, Columbus, Ohio 43201
8. PERFORMING ORGANIZATION REPORT NUMBER KXAF-9-29764-19
10. SPONSOR/MONITOR'S ACRONYM(S) NREL
9. SPONSORING/MONITORING AGENCY NAME(S) AND ADDRESS(ES) National Renewable Energy Laboratory 1617 Cole Blvd. Golden, CO 80401-3393 11. SPONSORING/MONITORING
AGENCY REPORT NUMBER NREL/SR-540-39180
12. DISTRIBUTION AVAILABILITY STATEMENT National Technical Information Service U.S. Department of Commerce 5285 Port Royal Road Springfield, VA 22161
13. SUPPLEMENTARY NOTES NREL Technical Monitor: Richard Parish
14. ABSTRACT (Maximum 200 Words) This report focuses on the lessons learned at the SunLine Transit Agency after it converted in 1994 its entire operating transit bus fleet to compressed natural gas (CNG).
15. SUBJECT TERMS compressed natural gas; CNG; SunLine Transit Agency; transit buses; bus fleet; transit operations
16. SECURITY CLASSIFICATION OF: 19a. NAME OF RESPONSIBLE PERSON a. REPORT
Unclassified b. ABSTRACT Unclassified
c. THIS PAGE Unclassified
17. LIMITATION OF ABSTRACT
UL
18. NUMBER OF PAGES
19b. TELEPHONE NUMBER (Include area code)
Standard Form 298 (Rev. 8/98) Prescribed by ANSI Std. Z39.18