tennessee school improvement plan - home - … · web viewtennessee school improvement planning...
TRANSCRIPT

Tennessee School Improvement Planning Process (TSIPP)
SIP Templates
Tennessee Department of EducationCommissioner Lana C. Seivers

Tennessee School Improvement Planning Process(TSIPP)
Assuranceswith Signature of Principal
I certify that Fairmont School has utilized the data and other requirements requested for each component. The school will operate its programs in accordance with all of the required assurances and certifications for each program area.
I CERTIFY that the assurances referenced above have been satisfied to the best of my knowledge.
__________________________________________ ______________________Signature of Principal Date Signed
Tennessee School Improvement Planning Process Templates – August, 2007 Page 2 of 62
Component 1a - School Profile and Collaborative Process
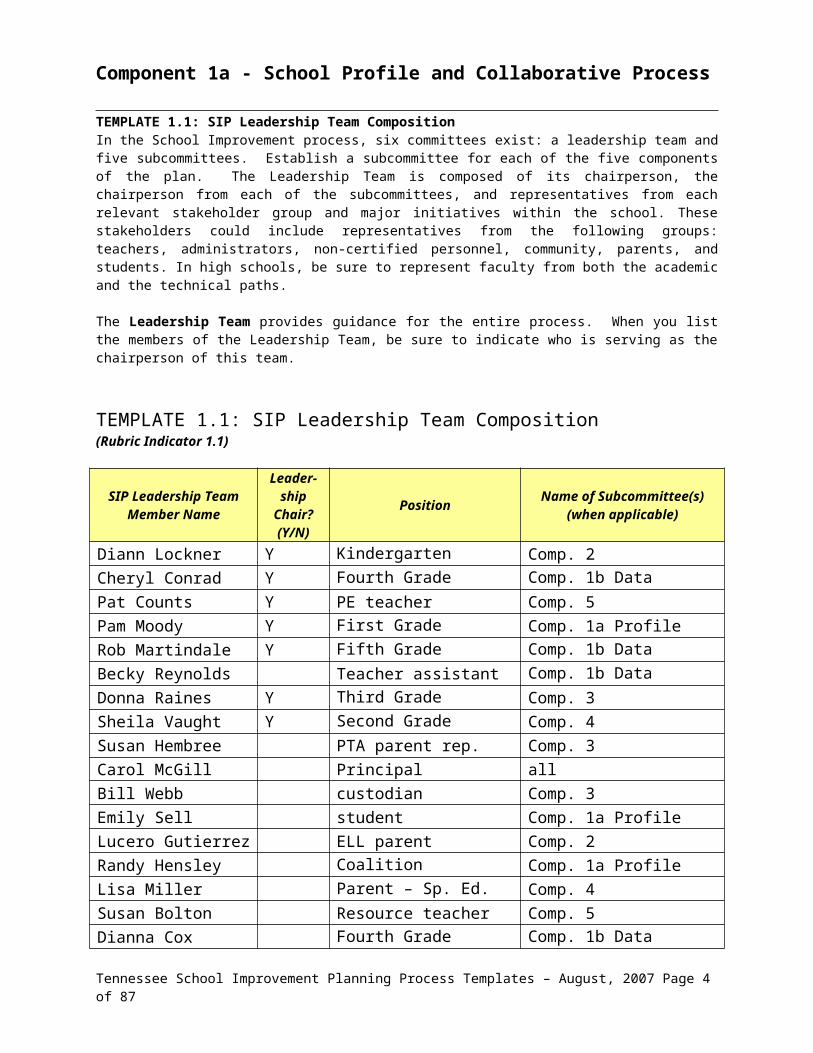
TEMPLATE 1.1: SIP Leadership Team CompositionIn the School Improvement process, six committees exist: a leadership team and five subcommittees. Establish a subcommittee for each of the five components of the plan. The Leadership Team is composed of its chairperson, the chairperson from each of the subcommittees, and representatives from each relevant stakeholder group and major initiatives within the school. These stakeholders could include representatives from the following groups: teachers, administrators, non-certified personnel, community, parents, and students. In high schools, be sure to represent faculty from both the academic and the technical paths.
The Leadership Team provides guidance for the entire process. When you list the members of the Leadership Team, be sure to indicate who is serving as the chairperson of this team.
TEMPLATE 1.1: SIP Leadership Team Composition(Rubric Indicator 1.1)
SIP Leadership Team Member Name
Leader-ship
Chair? (Y/N)
Position Name of Subcommittee(s) (when applicable)
Diann Lockner Y Kindergarten teacher Comp. 2Cheryl Conrad Y Fourth Grade teacher Comp. 1b Data AnalysisPat Counts Y PE teacher Comp. 5Pam Moody Y First Grade teacher Comp. 1a ProfileRob Martindale Y Fifth Grade teacher Comp. 1b Data AnalysisBecky Reynolds Teacher assistant Comp. 1b Data AnalysisDonna Raines Y Third Grade Teacher Comp. 3Sheila Vaught Y Second Grade Teacher Comp. 4Susan Hembree PTA parent rep. Comp. 3Carol McGill Principal allBill Webb custodian Comp. 3Emily Sell student Comp. 1a ProfileLucero Gutierrez ELL parent Comp. 2Randy Hensley Coalition (Community) Comp. 1a ProfileLisa Miller Parent – Sp. Ed. student Comp. 4Susan Bolton Resource teacher Comp. 5Dianna Cox Fourth Grade Teacher Comp. 1b Data Analysis
Component 1a - School Profile and Collaborative Process
Tennessee School Improvement Planning Process Templates – August, 2007 Page 3 of 62
TEMPLATE 1.2: Subcommittee Formation and Operation(Rubric Indicator 1.2)Subcommittee for COMPONENT 1 School Profile and Collaborative Process
Member Name Position ChairPam Moody Classroom teacher Y
Lucretia Stephens Classroom teacher
Mary Alice Nipper Classroom teacher
Nancy Randall Classroom teacher
Natasha Seipert parent
Chris Wolff assistant
Randy Hensley community
Kim Sell parent
Emily Sell student
(tab in last cell to create a new row as needed)
Component 1 Subcommittee has met to address critical components of the SIP and minutes are on file. X YES NO
Subcommittee 1 Chair Signature
Subcommittee for COMPONENT 2 Beliefs, Mission and VisionMember Name Position Chair
Rob Martindale Classroom teacher Y
Cheryl Conrad Classroom teacher Y
Amy Rollins Classroom teacher
Dianna Cox Classroom teacher
Darla Duty Classroom teacher
Brenda Tipton assistant
Amy Sentell parent
Ramsey Sentell student
Dr. Schmalzried Prof. Ed. Milligan
(tab in last cell to create a new row as needed)
Component 2 Subcommittee has met to address critical components of the SIP and minutes are on file. X YES NO
Subcommittee 2 Chair Signature
Tennessee School Improvement Planning Process Templates – August, 2007 Page 4 of 62

Subcommittee for COMPONENT 3 Curricular, Instructional, Assessment, and Organizational Effectiveness
Member Name Position ChairDiann Lockner Classroom teacher Y
Nancy Hodges Classroom teacher
Sarah Glover Classroom teacher
Jennifer Brown Classroom teacher
Brenda Deloach assistant
Jenny Tomita parent
Erin Tomita student
Lucero Gutierrez ELL parent
(tab in last cell to create a new row as needed)
Component 3 Subcommittee has met to address critical components of the SIP and minutes are on file. X YES NO
Subcommittee 3 Chair Signature
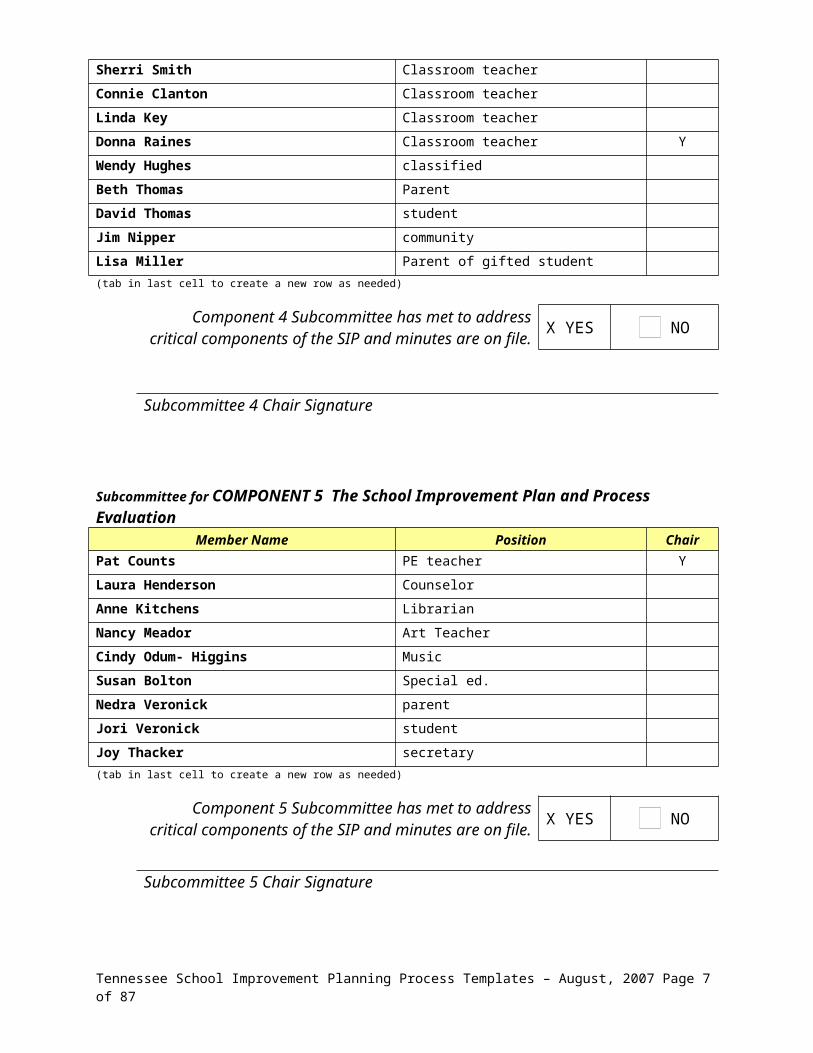
Subcommittee for COMPONENT 4 Action Plan DevelopmentMember Name Position Chair
Sherri Smith Classroom teacher
Connie Clanton Classroom teacher
Linda Key Classroom teacher
Donna Raines Classroom teacher Y
Wendy Hughes classified
Beth Thomas Parent
David Thomas student
Jim Nipper community
Lisa Miller Parent of gifted student
(tab in last cell to create a new row as needed)
Component 4 Subcommittee has met to address critical components of the SIP and minutes are on file. X YES NO
Subcommittee 4 Chair Signature
Subcommittee for COMPONENT 5 The School Improvement Plan and Process EvaluationMember Name Position Chair
Tennessee School Improvement Planning Process Templates – August, 2007 Page 5 of 62

Pat Counts PE teacher Y
Laura Henderson Counselor
Anne Kitchens Librarian
Nancy Meador Art Teacher
Cindy Odum- Higgins Music
Susan Bolton Special ed.
Nedra Veronick parent
Jori Veronick student
Joy Thacker secretary
(tab in last cell to create a new row as needed)
Component 5 Subcommittee has met to address critical components of the SIP and minutes are on file. X YES NO
Subcommittee 5 Chair Signature
Tennessee School Improvement Planning Process Templates – August, 2007 Page 6 of 62
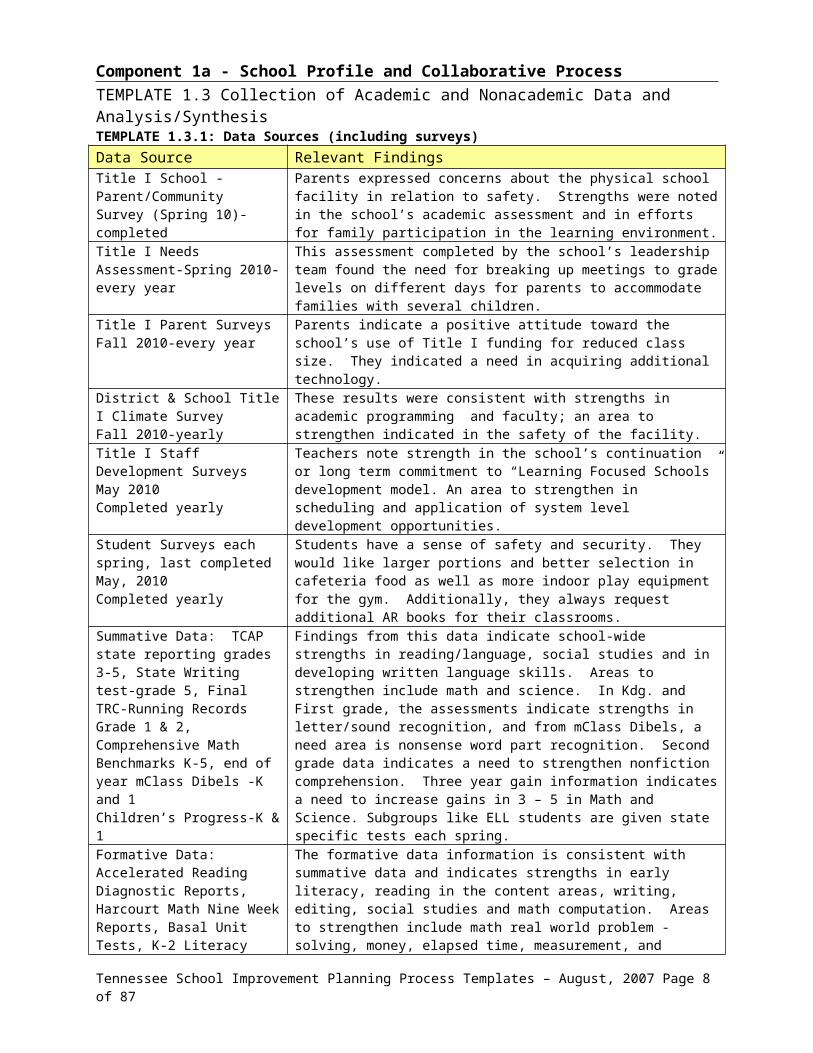
Component 1a - School Profile and Collaborative ProcessTEMPLATE 1.3 Collection of Academic and Nonacademic Data and Analysis/Synthesis TEMPLATE 1.3.1: Data Sources (including surveys)Data Source Relevant FindingsTitle I School -Parent/CommunitySurvey (Spring 10)-completed
Parents expressed concerns about the physical school facility in relation to safety. Strengths were noted in the school’s academic assessment and in efforts for family participation in the learning environment.
Title I Needs Assessment-Spring 2010-every year
This assessment completed by the school’s leadership team found the need for breaking up meetings to grade levels on different days for parents to accommodate families with several children.
Title I Parent SurveysFall 2010-every year
Parents indicate a positive attitude toward the school’s use of Title I funding for reduced class size. They indicated a need in acquiring additional technology.
District & School Title I Climate SurveyFall 2010-yearly
These results were consistent with strengths in academic programming and faculty; an area to strengthen indicated in the safety of the facility.
Title I Staff Development SurveysMay 2010Completed yearly
Teachers note strength in the school’s continuation or long term commitment to “Learning Focused Schools” development model. An area to strengthen in scheduling and application of system level development opportunities.
Student Surveys each spring, last completed May, 2010Completed yearly
Students have a sense of safety and security. They would like larger portions and better selection in cafeteria food as well as more indoor play equipment for the gym. Additionally, they always request additional AR books for their classrooms.
Summative Data: TCAP state reporting grades 3-5, State Writing test-grade 5, Final TRC-Running Records Grade 1 & 2, Comprehensive Math Benchmarks K-5, end of year mClass Dibels -K and 1Children’s Progress-K & 1
Findings from this data indicate school-wide strengths in reading/language, social studies and in developing written language skills. Areas to strengthen include math and science. In Kdg. and First grade, the assessments indicate strengths in letter/sound recognition, and from mClass Dibels, a need area is nonsense word part recognition. Second grade data indicates a need to strengthen nonfiction comprehension. Three year gain information indicates a need to increase gains in 3 – 5 in Math and Science. Subgroups like ELL students are given state specific tests each spring.
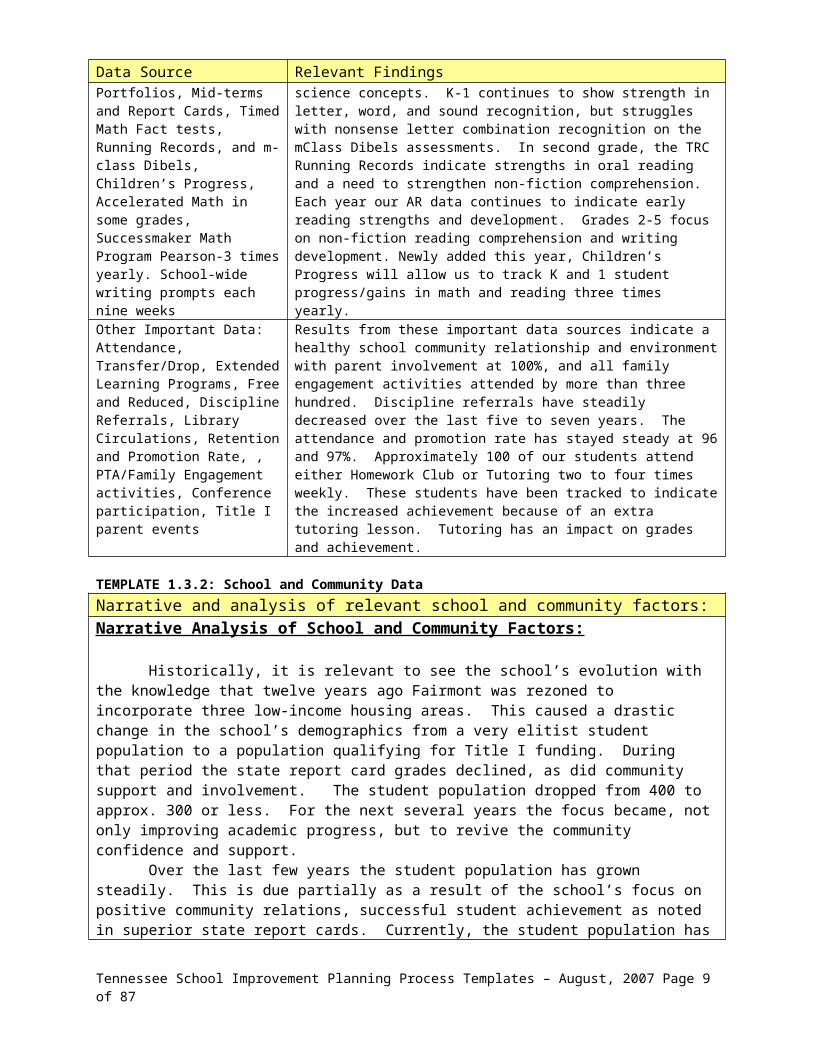
Formative Data: Accelerated Reading Diagnostic Reports, Harcourt Math Nine Week Reports, Basal Unit Tests, K-2 Literacy Portfolios, Mid-terms and Report Cards, Timed Math Fact tests, Running Records, and m-class Dibels, Children’s Progress, Accelerated Math in some grades, Successmaker Math Program Pearson-3 times yearly. School-wide writing prompts each nine weeks
The formative data information is consistent with summative data and indicates strengths in early literacy, reading in the content areas, writing, editing, social studies and math computation. Areas to strengthen include math real world problem -solving, money, elapsed time, measurement, and science concepts. K-1 continues to show strength in letter, word, and sound recognition, but struggles with nonsense letter combination recognition on the mClass Dibels assessments. In second grade, the TRC Running Records indicate strengths in oral reading and a need to strengthen non-fiction comprehension. Each year our AR data continues to indicate early reading strengths and development. Grades 2-5 focus on non-fiction reading comprehension and writing development. Newly added this year, Children’s Progress will allow us to track K and 1 student progress/gains in math and reading three times yearly.
Other Important Data:Attendance, Transfer/Drop, Extended Learning Programs, Free and Reduced, Discipline Referrals, Library Circulations, Retention and Promotion Rate, , PTA/Family Engagement activities, Conference participation, Title I parent events
Results from these important data sources indicate a healthy school community relationship and environment with parent involvement at 100%, and all family engagement activities attended by more than three hundred. Discipline referrals have steadily decreased over the last five to seven years. The attendance and promotion rate has stayed steady at 96 and 97%. Approximately 100 of our students attend either Homework Club or Tutoring two to four times weekly. These students have been tracked to indicate the increased achievement because of an extra tutoring lesson. Tutoring has an impact on grades and achievement.
TEMPLATE 1.3.2: School and Community DataNarrative and analysis of relevant school and community factors:
Tennessee School Improvement Planning Process Templates – August, 2007 Page 7 of 62
Narrative Analysis of School and Community Factors:
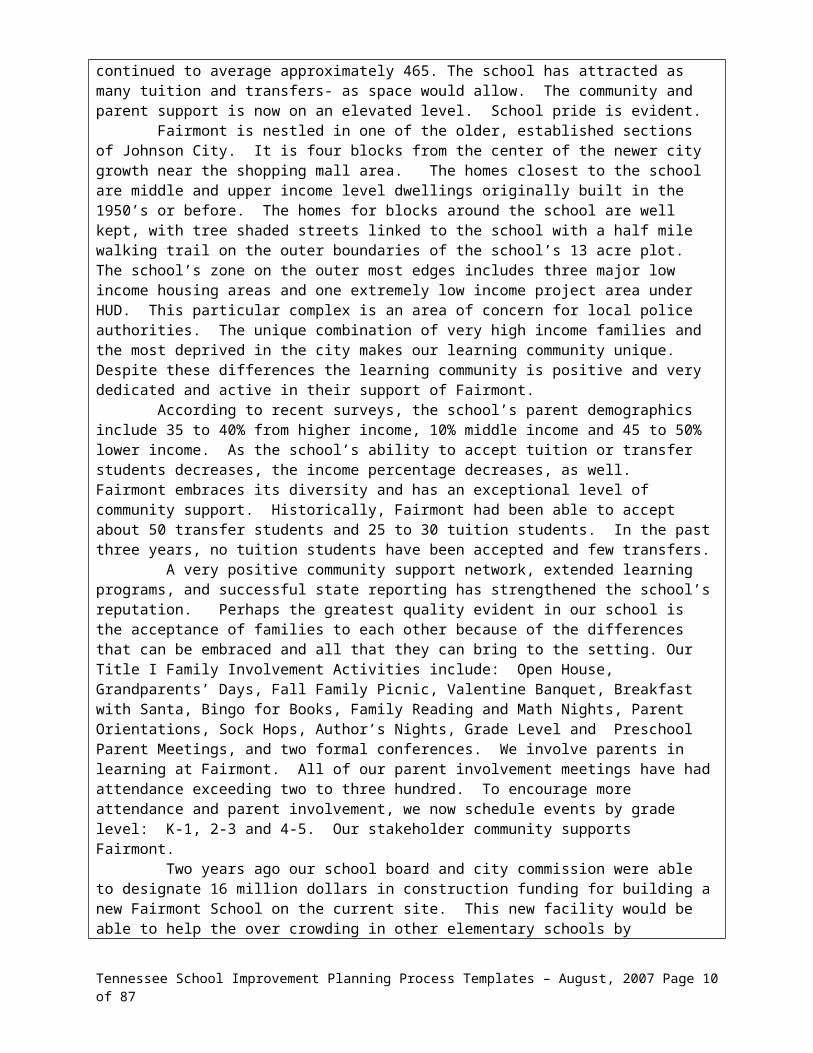
Historically, it is relevant to see the school’s evolution with the knowledge that twelve years ago Fairmont was rezoned to incorporate three low-income housing areas. This caused a drastic change in the school’s demographics from a very elitist student population to a population qualifying for Title I funding. During that period the state report card grades declined, as did community support and involvement. The student population dropped from 400 to approx. 300 or less. For the next several years the focus became, not only improving academic progress, but to revive the community confidence and support. Over the last few years the student population has grown steadily. This is due partially as a result of the school’s focus on positive community relations, successful student achievement as noted in superior state report cards. Currently, the student population has continued to average approximately 465. The school has attracted as many tuition and transfers- as space would allow. The community and parent support is now on an elevated level. School pride is evident. Fairmont is nestled in one of the older, established sections of Johnson City. It is four blocks from the center of the newer city growth near the shopping mall area. The homes closest to the school are middle and upper income level dwellings originally built in the 1950’s or before. The homes for blocks around the school are well kept, with tree shaded streets linked to the school with a half mile walking trail on the outer boundaries of the school’s 13 acre plot. The school’s zone on the outer most edges includes three major low income housing areas and one extremely low income project area under HUD. This particular complex is an area of concern for local police authorities. The unique combination of very high income families and the most deprived in the city makes our learning community unique. Despite these differences the learning community is positive and very dedicated and active in their support of Fairmont. According to recent surveys, the school’s parent demographics include 35 to 40% from higher income, 10% middle income and 45 to 50% lower income. As the school’s ability to accept tuition or transfer students decreases, the income percentage decreases, as well. Fairmont embraces its diversity and has an exceptional level of community support. Historically, Fairmont had been able to accept about 50 transfer students and 25 to 30 tuition students. In the past three years, no tuition students have been accepted and few transfers. A very positive community support network, extended learning programs, and successful state reporting has strengthened the school’s reputation. Perhaps the greatest quality evident in our school is the acceptance of families to each other because of the differences that can be embraced and all that they can bring to the setting. Our Title I Family Involvement Activities include: Open House, Grandparents’ Days, Fall Family Picnic, Valentine Banquet, Breakfast with Santa, Bingo for Books, Family Reading and Math Nights, Parent Orientations, Sock Hops, Author’s Nights, Grade Level and Preschool Parent Meetings, and two formal conferences. We involve parents in learning at Fairmont. All of our parent involvement meetings have had attendance exceeding two to three hundred. To encourage more attendance and parent involvement, we now schedule events by grade level: K-1, 2-3 and 4-5. Our stakeholder community supports Fairmont. Two years ago our school board and city commission were able to designate 16 million dollars in construction funding for building a new Fairmont School on the current site. This new facility would be able to help the over crowding in other elementary schools by accommodating 750 students. The decision was also based on concerns about the current site. The completion date for this facility is summer 2011. The current buildings will be destroyed upon the completion of the new facility. To this point, the construction has not been an obstacle to the effectiveness of the school.
Analysis of School Factors:Historical Background:
Tennessee School Improvement Planning Process Templates – August, 2007 Page 8 of 62
The original Florida style buildings were built in 1959. Every 7 to 10 years thereafter the school added needed buildings. Prior to 1998, Fairmont had been one of the two “higher income” level school populations. The opening of Lake Ridge Elementary and the closing of Stratton Elementary forced Fairmont to seek a newly created identity. Initially, a mass exodus occurred with the higher income families choosing to transfer to either the new school or one of the other non-Title I schools nearby. The system’s open transfer policy allowed this to happen. This trend now seems to have changed and Fairmont is among the schools of choice. However, for the last three years, Fairmont has not been able to accept tuition or transfer students.
Facilities:Ten se Currently, ten separate buildings compose the Florida style campus. Two to four classroom clusters are
built together. Concrete open covered and non-covered walkways join the gym, cafeteria and library to the separate classrooms. The last addition was in 1990. The entire campus received massive renovations four years ago to remove asbestos, replace worn areas and install new covered walkways. All of the related arts and special class teachers are without classrooms. Two of these, music and art, use carts and go from class to class. Others, Speech, ESL, and guidance use storage rooms for make-shift classrooms. Only library and the gym are spaces used for the related arts as intended.
Environmental and Safety Conditions:The campus has an “open” style configuration that makes security much more difficult. In fact, the classroom doors have to remain locked which also causes problems. The Fairmont staff implements many procedures not needed on ordinary interior hallway campus sites. The safety plan includes additional procedures to insure student safety. Students are not allowed out of the classroom without an accompanying adult or without other students. The teachers use two- way radios to call the office to let them know when students will be arriving for the clinic or other needs. The staff members, community and PTA all work to make the outdoor environment appealing and useable as educational areas. There are many outdoor sitting areas and picnic tables. A small outdoor water garden with many unique tree and flower plantings is centrally located. Each year every student plants a bulb to help beautify the campus. Three years ago an outdoor storage area was converted to a covered pavilion with a water fountain and picnic tables. The school has made every attempt to turn the negatives of the facility into positives for student learning, atmosphere and school climate.
Grade Distribution
Kindergarten 80First Grade 72Second Grade 69Third Grade 75Fourth Grade 76Fifth Grade 86Total 458
Length of School Year:The students in Johnson City Schools attend school 180 days.
Length of School Day:Students attend school from 8:15 to 3:15 or 7 hours.
Operational Budget Distribution Equity:Site Base Budget $60,379.00- Title I- $171,954.00
Tennessee School Improvement Planning Process Templates – August, 2007 Page 9 of 62
Per Pupil Expenditures:$8,622.00
Administration, faculty, and staff demographics (race, gender, ethnicity)Professional Staff:One white female administrator, 35 professionally certified staff, 1 male, 34 females: 34 Caucasians, 1 BlackClassified Staff:15 classified staff, 2 males, 13 females; 14 Caucasians, 1 Black
Years of experience of faculty and administration:Professional Faculty Average Years of Experience 15 years, Administrators years of experience in administration 10 years in education 35 years. Total faculty years of experience 510 years .
Percentage of courses taught by Highly Qualified Teachers:All professional staff members are Highly Qualified and all subjects are taught by Highly Qualified staff.
Percentage of faculty who hold advance degrees: Fifty seven percent of the professional faculty hold advance degrees.
Percentage of faculty teaching courses outside their area of certification:None of the faculty are teaching courses outside their area of certification.
Enrollment data: (Included Pk until 2009)2002-302, 2003-324, 2004-376, 2005-405, 2006-467, 2007-442, 2008-468, 2009-445, 2010-458
Curriculum Offerings:Reading/Language Arts, Spelling, Writing, Mathematics, Science, Social Studies, Art, Music, Physical Education, Health, Guidance, Library, Integrated Computer Skills, Study Skills and Geography
Unique Programs:Geography Bee, Extended Learning through after school tutoring, Homework Club, and Computer Club, Chorus, Recorder Consort, Chess Club, Girls on the Run
Honors Classes/ Advanced Placement ClassesGifted Classes, called Discovery are offered one day per week on Thursdays and are taught by the system’s gifted teacher. The program currently serves 15 students
Parental Support:Our PTA has taken many state honors for the past five years: 100% membership, 5% increase, 100% teacher and staff membership; all of the family engagement activities have in excess of 200 to 300 attendees. Our school has become a model of parental and community support as evidenced by their participation in many city-wide activities to promote the school.
Drug, Alcohol, or Tobacco incidents or arrests:There have been no drug, alcohol or tobacco incidences or arrests in the last 3 years
School – Business Partnerships:Our official business partnership through the Chamber of Commerce is Northside Hospital. Additional
Tennessee School Improvement Planning Process Templates – August, 2007 Page 10 of 62

partnerships include Lowe’s, Johnson City Medical Center, Spherion Corporation, Appalachian Christian Village Nursing Home, First Christian Church, and Coalition for Kids, Boys to Men, Boy’ and Girls’ Club, Carver Rec, JC Parks and Recreation.
Mobility and longevity of staff at school:Professional staff averages 8 years at Fairmont
Grants & Awards:State Achievement Incentive Award 2005-06, Eastman Recycling Award 2003, 2004, Chamber of Commerce Recycling Award 2004, 2005, Junior League Education Grants, Eastman Education Innovation Grants, Lowe’s Good Neighbor Grant, 2008 Johnson City Sports Foundation Grants (3), 2007, 08, and 09 Turkey Trot Winner. Our PTA placed in every local category and won three state awards in 2008-09. 2010-11 State Blue Ribbon School Nomination.
Staff involved in school/system leadership activities:System level Teachers of the Year 2001-02, 2003-04 and 2006-07, 2008-09, 2009-10, Math Vertical Team System Level, System Level Long Range Goal Planning Co-Chair, State Writing Committee for Selection of Benchmark Papers 2007-08, TN PTA Principal of the year 2009. Region Teacher of the Year in 2008-09. Two staff members are Nationally Board Certified.
Highly Qualified Paraprofessionals:Fairmont has three full time and one part time Highly Qualified Special Education Paraprofessionals and four other school level Highly Qualified Paraprofessionals: one technology-library, one Reading (LMB), one office and one school-wide. Two of those are part time (5) hour per day employees. Only 2 are full time employees.
Trained and Qualified MentorsOne teacher in K-2 and one teacher in 3-5 have been trained at the state level as mentors.
Student Population Data:
Number of students:458
Student Demographics:458 total, 210 boys, 248 girls, 8 Asian, 42 African American, 13 Hispanic, 1 Native American, and 394 White
English Proficiency:Currently 8 students are on various levels of ELL proficiency
Free and Reduced lunch rate, economically disadvantaged:Currently 219, varies between 46 to 52%Retention Rate:2%
Transfer Rate:20%
Drop-out Rate:
Tennessee School Improvement Planning Process Templates – August, 2007 Page 11 of 62

N/A
Graduation Rate:93.3%
Special Education Disability Types, Numbers and Percentages:Total caseload for Special Education: 28 students; 21 Learning Disabled, 3 Other Health Impaired, 3 Autism, 1 Emotionally Disturbed.Speech Services: 37 students
Students attending Preschool:76%
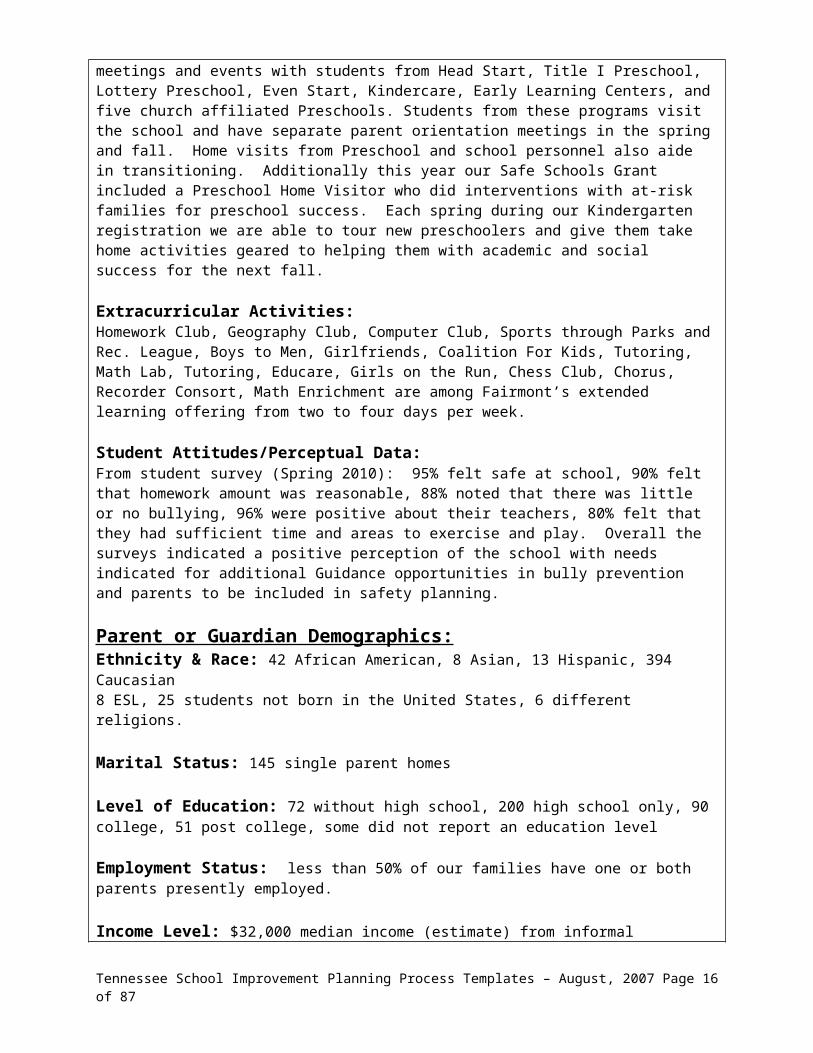
Transitioning to Fairmont from the area Preschools includes Spring Field Trip visits to their new classes, Parent Meetings, Open House and individual conferences. Fairmont has preschool transition meetings and events with students from Head Start, Title I Preschool, Lottery Preschool, Even Start, Kindercare, Early Learning Centers, and five church affiliated Preschools. Students from these programs visit the school and have separate parent orientation meetings in the spring and fall. Home visits from Preschool and school personnel also aide in transitioning. Additionally this year our Safe Schools Grant included a Preschool Home Visitor who did interventions with at-risk families for preschool success. Each spring during our Kindergarten registration we are able to tour new preschoolers and give them take home activities geared to helping them with academic and social success for the next fall.
Extracurricular Activities:Homework Club, Geography Club, Computer Club, Sports through Parks and Rec. League, Boys to Men, Girlfriends, Coalition For Kids, Tutoring, Math Lab, Tutoring, Educare, Girls on the Run, Chess Club, Chorus, Recorder Consort, Math Enrichment are among Fairmont’s extended learning offering from two to four days per week.
Student Attitudes/Perceptual Data:From student survey (Spring 2010): 95% felt safe at school, 90% felt that homework amount was reasonable, 88% noted that there was little or no bullying, 96% were positive about their teachers, 80% felt that they had sufficient time and areas to exercise and play. Overall the surveys indicated a positive perception of the school with needs indicated for additional Guidance opportunities in bully prevention and parents to be included in safety planning.
Parent or Guardian Demographics:Ethnicity & Race: 42 African American, 8 Asian, 13 Hispanic, 394 Caucasian8 ESL, 25 students not born in the United States, 6 different religions.
Marital Status: 145 single parent homes
Level of Education: 72 without high school, 200 high school only, 90 college, 51 post college, some did not report an education level
Employment Status: less than 50% of our families have one or both parents presently employed.
Income Level: $32,000 median income (estimate) from informal information
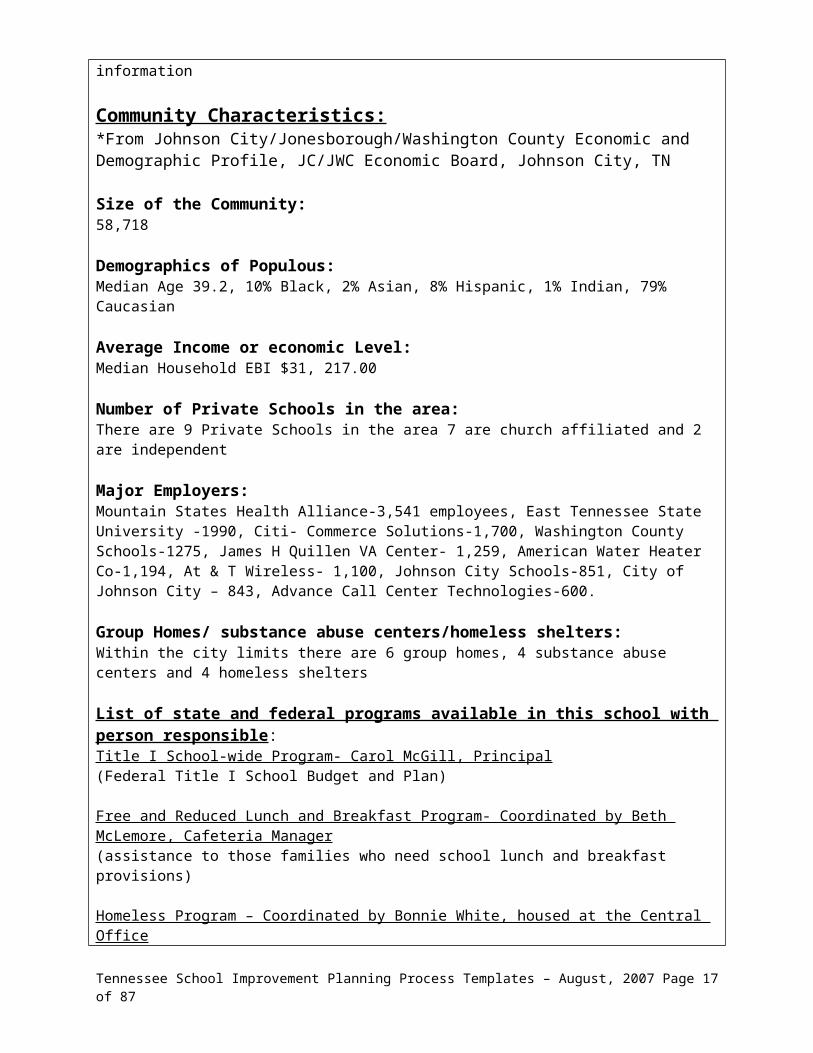
Community Characteristics:*From Johnson City/Jonesborough/Washington County Economic and Demographic Profile,
Tennessee School Improvement Planning Process Templates – August, 2007 Page 12 of 62

JC/JWC Economic Board, Johnson City, TN
Size of the Community:58,718
Demographics of Populous:Median Age 39.2, 10% Black, 2% Asian, 8% Hispanic, 1% Indian, 79% Caucasian
Average Income or economic Level:Median Household EBI $31, 217.00
Number of Private Schools in the area:There are 9 Private Schools in the area 7 are church affiliated and 2 are independent
Major Employers:Mountain States Health Alliance-3,541 employees, East Tennessee State University -1990, Citi- Commerce Solutions-1,700, Washington County Schools-1275, James H Quillen VA Center- 1,259, American Water Heater Co-1,194, At & T Wireless- 1,100, Johnson City Schools-851, City of Johnson City – 843, Advance Call Center Technologies-600.
Group Homes/ substance abuse centers/homeless shelters:Within the city limits there are 6 group homes, 4 substance abuse centers and 4 homeless shelters
List of state and federal programs available in this school with person responsible:Title I School-wide Program- Carol McGill, Principal(Federal Title I School Budget and Plan)
Free and Reduced Lunch and Breakfast Program- Coordinated by Beth McLemore, Cafeteria Manager(assistance to those families who need school lunch and breakfast provisions)
Homeless Program – Coordinated by Bonnie White, housed at the Central Office(McKinley-Vento Act provisions to help qualifying families in need)
English Language Learner Program- Amanda Smith, teacher at school 1:00 to 3:30(Students whose families speak languages other than English as qualified)
Family – School Coordinator- Wendy Hughes, at the school office(Coordinates school family engagement activities and home-school relationships and contacts, also coordinates all benefit health programs for families)
Guidance Services- Laura Henderson, Counselor, at the school and in coordination with Frontier Health, Sally Anderson and our full time Safe Schools Grant counselor, Michelle Elliott, Greg Wallace Coordinator of System-wide Safe School Grant Programs, Thomas Duncan- Safety Officer(Ms. Henderson Coordinates all Guidance services including association with other Mental Health Agencies like Frontier Health, also coordinates DHS and other state and local legal intervention programs. Community Police Officer – one day per week and other times as needed for work in the Safe Schools Grant Program.)
Preschool Home Liaison provided through the Safe Schools Grant, accessed through Donna Sowers. Ms. Sowers coordinates all Preschool enrollments and programming. Her offices are currently at North Side School.
Tennessee School Improvement Planning Process Templates – August, 2007 Page 13 of 62

Highly Qualified Teachers are recruited by Johnson City Schools systematically through the efforts of Lee Herrin, Personnel Director and central office supervisors with Dr. Richard Bales, Director of Schools. The following are some of the strategies our system conducts each year to assure the highest level of Highly Qualified applicants:
Coordination of application and qualification needs with the local universities and colleges; East Tennessee State University, Milligan College, Tusculum College, King College, and regionally with the University of Tennessee system.
Booths and speaking engagements are sought and attended regionally and nationally to assure the inclusion of highly qualified minority applicants.
Communications and job postings are available on-line and through the system’s web site. The personnel phone system also responds to the needs of applicants.
Web site information made easily available to encourage applicants. System information is posted to college web sites for recruiting nationally.
Parent Involvement Activities that Support SIP Goals:Goal 1- Reading/Language ArtsAR Reading Night- Parents read nonfiction and take AR test as their childBook Fair- twice yearlyFolk Tales and Fairy Tales NightFamily Reading NightBingo For Books“How to Motivate Your Reader” Parent SessionGoal 2-MathNew Standards- What Do You Know?Know Your NumbersMake It and Take It- Math GamesFamily Math Game NightParent Tech – Timed Math Session
Component 1b – Academic and Non-Academic Data Analysis/SynthesisList Data Sources Attendance DataTCAP –State Reporting
Tennessee School Improvement Planning Process Templates – August, 2007 Page 14 of 62

Pearson Assessments in Math, Reading/LanguageAccelerated Reading Diagnostic ReportsAccelerated Math Diagnostic ReportsSix Traits WritingState Writing TestHarcourt Math Program ReportsReading Basal Unit TestsK-2 Literacy PortfoliosRunning Records (First and Second Grades)Individual Student Mid-term and Nine Week Report CardsParent, Student, Teacher, Community Surveys (Yearly)Student Transfer/Drop RecordsAfter School Tutoring AttendanceHomework Club AttendanceFree and Reduced PercentagesEarly Literacy Portfolios Writing Portfolios/School-wide Writing PromptsText Chapter and Unit TestsDaily Oral Language Weekly and Unit Evaluations and Math Minutes DailyTimed Math Fact Tests, midterm and term resultsDiscipline ReferralsReading Is Fundamental distributionsLibrary Circulation NumbersStudent Retention Percentages/Promotion RateSite Based Leadership Team Minutes and NotesSuccessmaker Math Diagnostics -CCCParent Conference ParticipationPTA Membership and AttendanceGuidance ReferralsFamily Engagement Attendance MClass Dibels (Kindergarten and First Grade)Geography Club State ESL/ELL academic testing which changes yearlyChallenge extended learning opportunitiesChildren’s Progress Math and Reading in K and 1st gradesReview JournalsStar Reading AssessmentsTutoring/Extended Learning
TEMPLATE 1.5: Data Collection and AnalysisDescribe the data collection and analysis process used in determining your strengths and needs.
Fairmont students are assessed through the following measures: Kindergarten and First Grade: Brigance (Pre and Post Testing), Portfolio Assessments
Tennessee School Improvement Planning Process Templates – August, 2007 Page 15 of 62
for Reading and Language three times yearly, Math Benchmark testing, mClass Dibels, Running Records (First Grade), Children’s Progress for monitoring student progress in K and 1 reading and math.
Second through Fifth Grade students are assessed formally through the following means:STAR (Accelerated Reading Assessment), Harcourt Math Assessments, Pearson Assessments three times per year in Math and Reading/Language, and Second Grade students have reading progress tracked through Running Records.
First through Fifth Graders are administered adopted basal text level assessments weekly and with unit completion, Daily Oral Language-Math Minute Weekly and Unit Evaluations, and Timed Math Fact tests.
Students in Third through Fifth Grades have Tennessee State Achievement Testing (TCAP) data with Fifth Graders also administered the state writing test each February.
Students are given additional diagnostic testing in areas of need through the system’s resource evaluation Student Support Team. System level diagnostic testing is then completed.
English Language Learners are administered state required assessments upon entering the program and additional spring testing. Each year the test name seems to change. Third through Fifth graders in the program are given the spring state test as indicated by the state for TCAP – comparability. Migratory students are evaluated for additional resources through the ELL instructor using the state mandated assessments.
All students have system math benchmarked skills with classroom formative assessments administered.
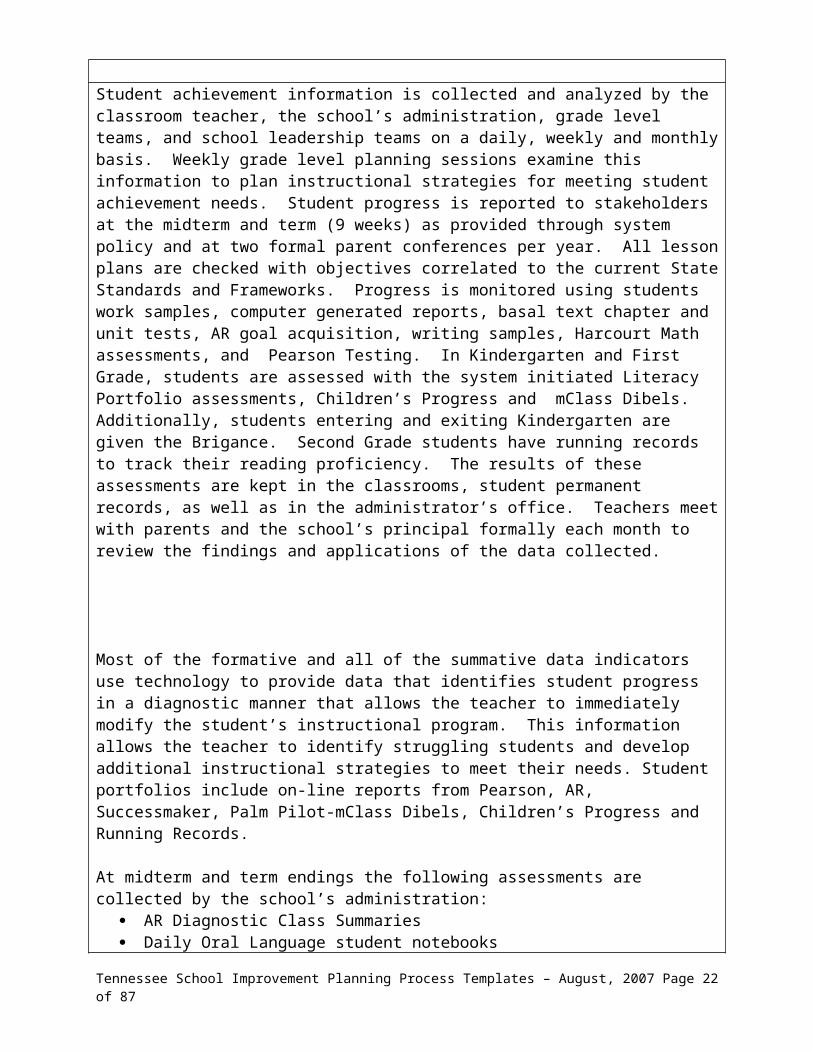
Student achievement information is collected and analyzed by the classroom teacher, the school’s administration, grade level teams, and school leadership teams on a daily, weekly and monthly basis. Weekly grade level planning sessions examine this information to plan instructional strategies for meeting student achievement needs. Student progress is reported to stakeholders at the midterm and term (9 weeks) as provided through system policy and at two formal parent conferences per year. All lesson plans are checked with objectives correlated to the current State Standards and Frameworks. Progress is monitored using students work samples, computer generated reports, basal text chapter and unit tests, AR goal acquisition, writing samples, Harcourt Math assessments, and Pearson Testing. In Kindergarten and First Grade, students are assessed with the system initiated Literacy Portfolio assessments, Children’s Progress and mClass Dibels. Additionally, students entering and exiting Kindergarten are given the Brigance. Second Grade students have running records to track their reading proficiency. The results of these assessments are kept in the classrooms, student permanent records, as well as in the administrator’s office. Teachers meet with parents and the school’s principal formally each month to review the findings and applications of the data collected.
Most of the formative and all of the summative data indicators use technology to provide data that identifies student progress in a diagnostic manner that allows the teacher to immediately modify the student’s instructional program. This information allows the teacher to identify struggling students and develop additional instructional strategies to meet their needs. Student portfolios include on-line reports from Pearson, AR, Successmaker, Palm Pilot-mClass Dibels, Children’s Progress and Running Records.
Tennessee School Improvement Planning Process Templates – August, 2007 Page 16 of 62
At midterm and term endings the following assessments are collected by the school’s administration:
AR Diagnostic Class Summaries Daily Oral Language student notebooks Daily Math Summaries Class Grade Sheets Timed Math Fact Summaries Pearson Assessment Data 2-5, Children’s Progress and Palm Pilot Assessment K-2 Parent Conference Notes Writing Portfolios Student Work Samples Review journals
Grade level teaching teams examine the data and make recommendations about diagnostic changes to strengthen areas of need and to support areas of strength. The team shares proven practices, and materials to develop plans to scaffold student learning at the school level. The Site Based Leadership team meets on the second Wednesday of each month to examine student achievement data and to discuss means of improvements. The SIP leadership team meets on the third Wednesday to make adjustments and updates on the SIP. Grade level and cross grade level teams meet on each third and fourth Wednesday for the purpose of improving strategies based on data results for increased student success.
The state achievement testing provides a summative evaluation of our student performance. When results are received, the stakeholders are given information immediately through mailings, e-mail and parent meetings. Student progress is charted based on gains and achievement criteria. Successes are celebrated with progress noted and plans are immediately implemented using the data to formulate improvement strategies with differentiation to impact achievement.
Strengths: Multiple formative assessments that are based on state standards Accessibility to student information Use of summative state data to formulate instructional plans Communication of formative/summative data to the stakeholders
Areas to Strengthen: Application and use of new formative assessments to improve teaching Use of running records/literacy portfolio information to strengthen instruction
Tennessee School Improvement Planning Process Templates – August, 2007 Page 17 of 62

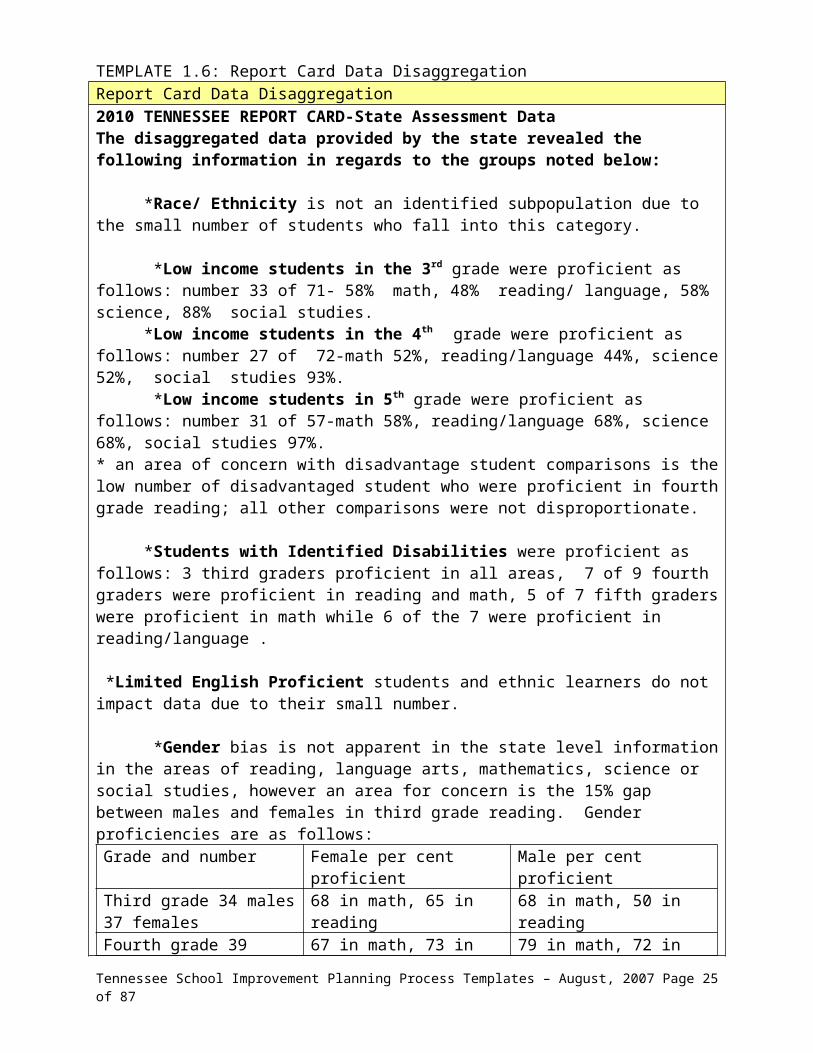
TEMPLATE 1.6: Report Card Data DisaggregationReport Card Data Disaggregation2010 TENNESSEE REPORT CARD-State Assessment DataThe disaggregated data provided by the state revealed the following information in regards to the groups noted below:
*Race/ Ethnicity is not an identified subpopulation due to the small number of students who fall into this category.
*Low income students in the 3rd grade were proficient as follows: number 33 of 71- 58% math, 48% reading/ language, 58% science, 88% social studies. *Low income students in the 4th grade were proficient as follows: number 27 of 72-math 52%, reading/language 44%, science 52%, social studies 93%. *Low income students in 5th grade were proficient as follows: number 31 of 57-math 58%, reading/language 68%, science 68%, social studies 97%.* an area of concern with disadvantage student comparisons is the low number of disadvantaged student who were proficient in fourth grade reading; all other comparisons were not disproportionate. *Students with Identified Disabilities were proficient as follows: 3 third graders proficient in all areas, 7 of 9 fourth graders were proficient in reading and math, 5 of 7 fifth graders were proficient in math while 6 of the 7 were proficient in reading/language .
*Limited English Proficient students and ethnic learners do not impact data due to their small number.
*Gender bias is not apparent in the state level information in the areas of reading, language arts, mathematics, science or social studies, however an area for concern is the 15% gap between males and females in third grade reading. Gender proficiencies are as follows:Grade and number Female per cent proficient Male per cent proficientThird grade 34 males 37 females
68 in math, 65 in reading 68 in math, 50 in reading
Fourth grade 39 males 33 females
67 in math, 73 in reading 79 in math, 72 in reading
Fifth grade 34 males 23 females
70 in math, 83 in reading 62 in math, 71 in reading
*Growth Differences – In examining quintile cumulative data, with very few exceptions, low and middle learners exhibited consistently high academic growth. This can be attributed to our small class sizes, many programs for extended learning, as well as our commitment to engaging our families in all aspects of the school community. We accomplish this through a strong PTA and numerous Title I activities. Data indicates that implementation of challenge and enrichment activities in math, literacy, social studies and science should be considered for higher level learners. Growth differences that should be address are in lower per cent proficiency of SES fourth grade reading and in the weakness noted in proficient level comparisons of third grade males and females in reading.
Tennessee School Improvement Planning Process Templates – August, 2007 Page 18 of 62

Report Card Data Disaggregation
Specifically the growth pattern percentage differences indicate that:Fourth GradeReading/Language in quintiles 1 and 2 had only one year gains while the higher three quintiles had huge gains of 8.7,8.2 and 5.5 gains.Math in the second and lowest quintile showed a year gain while the 4th highest had an incredible 13.6 gain with the highest having only a 1.8 gain.Science in the higher two quintiles showed enormous 20.8 and 20.2 gains. The middle quintile and the lower quintiles scoring only a year’s growth. Social Studies in quintiles 1 and 2 showed 1 year growth while quintiles 3, 4, and 5 had 6.8,9.0 and 8.1 gains.Fifth GradeReading/Language showed the most gains in the high and middle achievement quintiles with quintiles 3 and 4 having 10 point gains and the 5th quintile having 4.0 gains. The other quintiles had one year’s growth.Math quintiles all showed a year’s growth or slightly better, except for the highest quintile which showed a loss of -3.0.Science had positive growth low and middle of one year, while the top two levels had slightly negative gains.Social Studies Quintile 1 had a 1 year gain, quintile 2 had a 4.6 gain, quintile 3 had a -0.3 loss with quintiles 4 and 5 had 6.7 and 4.0 gains.
DIAGNOSTIC REPORTS-Student Quintile Information, Narrative summary
The 2010 reports graphically give information about the lowest to highest level learning for each subject in 4th and 5th grade. In fourth grade the following are strengths and areas to strengthen for each Quintile cohort, for each subject: Math quintiles 2,4,5 are the highest (in that order) with quintile 3 below the baseline. Reading and Language Arts quintiles 4 and 5 are the highest with all above the baseline. Science quintiles 3,4,5 are the highest with all well above state baselines. In Social Studies quintiles are well above state baselines, with 4 and 5 the highest.
Tennessee School Improvement Planning Process Templates – August, 2007 Page 19 of 62

In fifth grade the following are areas to strengthen and areas of strength for each Quintile cohort, for each subject: Math quintile comparisons revealed only quintiles 1 and 2 (lowest) made one year growth; quintiles 3, 4 and 5 had negative progress from –2 to –5. While adversely in reading/language arts all quintiles had positive growth with the highest 4 and 5 having +2. Science in fifth grade did show improvements compared to previous cohorts with current quintiles 1 to 4 having at or above expectation gains, however quintile 5 had a –4. In social studies as in reading all quintiles were positive with 3, 4 and 5 up to a +7 in gains.
For the second year, this information demonstrates the need for challenge and extension growth opportunities for the higher level learners in both Math and Science. Our leadership team has used this information to formulate goals and to address areas of need for the higher level learners in fifth grade. As previously noted, extended learning challenge activities have been successful in closing this gap. However, given the fact that the standards were particularly more difficult in fifth grade math and improvements were noted, we believe that the extended learning opportunities and the use of fraction calculators helped our students. We still need to focus on strengthening fifth grade math, in particular.
CONTENT AREAS Percent Proficient DataAreas of strength and areas to strengthen per grade level per subject:
THIRD GRADE READING/LANGUAGEAreas of strength Areas to strengthenComm. & Media 58% Literature 56%Language 59% Logic 56%Info. Text 58% Writing & Research 56%Voc. 59%THIRD GRADE MATHAreas of strength Areas to strengthenNo. & operations 68% Algebra 66%Math. Processes 72% Geometry 66%
Data Analysis 66%THIRD GRADE SCIENCEAreas of strength Areas to strengthenMatter and energy 63% Interdependence, Biodiversity, Change 59%Motion & Forces in Nature 63%
THIRD GRADE SOCIAL STUDIESAreas of Strength Areas to StrengthenEconomics 93% History 90%Physical Geography 92% Human Geography 90%Governance and Civics 92%
Tennessee School Improvement Planning Process Templates – August, 2007 Page 20 of 62

FOURTH GRADE READING/LANGUAGEAreas of strength Areas to strengthenResearch 72% Literature 69%Comm. & Media 72% Vocabulary 69%Info. Text 72%FOURTH GRADE MATHAreas of strength Areas to strengthenGeometry & Measurement 75% Algebra 67%No. & Operations 72% Math Process 68%
FOURTH GRADE SCIENCEAreas of strength Areas to strengthenMotions, Forces in Nature 75% Matter and Energy 71%
Universe, Earth, Atmosphere 71%
FOURTH GRADE SOCIAL STUDIESAreas of strength Areas to strengthenHistory Period 1 and 2 both 99% Economics 97%Governance and Civics 99% Geography 97%
FIFTH GRADE READING/LANGUAGE Areas of strength Areas to strengthenVoc. 77% Logic 74%Info text 77% Language 75%Literature 77 Communication and Media 75%Writing & Research 77%FIFTH GRADE MATHAreas of strength Areas of strengthenAlgebra 72% Math Processes 63%Data Analysis, Prob., Statistics 70% No. and Operation 65%
FIFTH GRADE SOCIAL STUDIESAreas of strength Areas to strengthenGovernance and Civics 98% U. S. History Period 2 and 3 both 95%Economics 98%
FIFTH GRADE SCIENCEAreas of strength Areas to strengthenInterdependence, biodiversity & change 75% Motion and energy 70%Universe, earth and atmosphere 75%
Tennessee School Improvement Planning Process Templates – August, 2007 Page 21 of 62
AYP- SUBGROUP DISGREGGATED DATA FOR DETERMINING PROFICIENCY
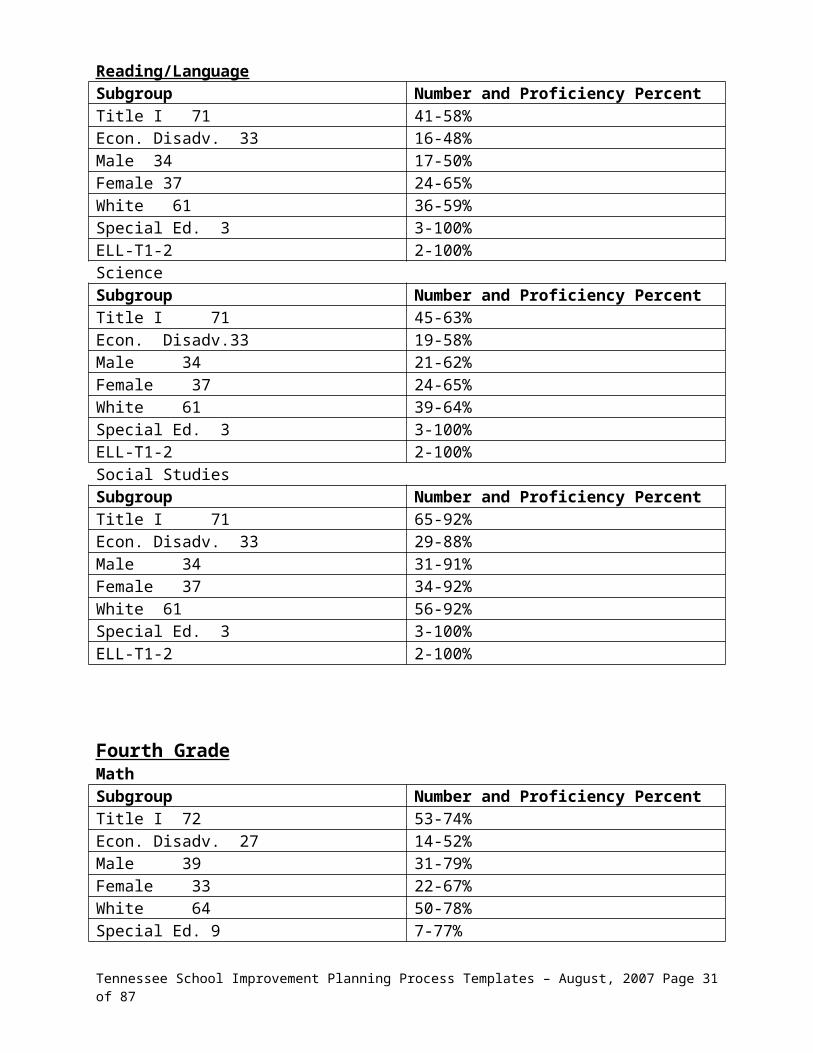
Third GradeMathSubgroup Number and Proficiency PercentTitle I 71 48-68%Econ. Disadv. 33 19-58%Male 34 23-68%Female 37 25-68%White 61 43-70%Special Ed. 3 3-100%ELL-T1-2 2-100%Reading/LanguageSubgroup Number and Proficiency PercentTitle I 71 41-58%Econ. Disadv. 33 16-48%Male 34 17-50%Female 37 24-65%White 61 36-59%Special Ed. 3 3-100%ELL-T1-2 2-100%ScienceSubgroup Number and Proficiency PercentTitle I 71 45-63%Econ. Disadv.33 19-58%Male 34 21-62%Female 37 24-65%White 61 39-64%Special Ed. 3 3-100%ELL-T1-2 2-100%Social StudiesSubgroup Number and Proficiency PercentTitle I 71 65-92%Econ. Disadv. 33 29-88%Male 34 31-91%Female 37 34-92%White 61 56-92%Special Ed. 3 3-100%ELL-T1-2 2-100%
Tennessee School Improvement Planning Process Templates – August, 2007 Page 22 of 62

Fourth GradeMathSubgroup Number and Proficiency PercentTitle I 72 53-74%Econ. Disadv. 27 14-52%Male 39 31-79%Female 33 22-67%White 64 50-78%Special Ed. 9 7-77%ELL-T1-1 1-100%Reading/LanguageSubgroup Number and Proficiency PercentTitle I 72 52-72%Econ. Disadv. 27 12-44%Male 39 28-72%Female 33 24-73%White 64 50-78%Special Ed.9 7-77%ELL-T1-1 1-100%ScienceSubgroup Number and Proficiency PercentTitle I 72 53-74%Econ. Disadv. 27 14-52%Male 39 31-79%Female 33 22-67%White 64 50-78%Special Ed. 9 7-77%ELL-T1-1 1-100%Social StudiesSubgroup Number and Proficiency PercentTitle I 72 70-97%Econ. Disadv. 27 25-93%Male 39 37-95%Female 33 33-100%White 64 63-98%Special Ed. 9 9-100%ELL-T1-1 1-100%
Tennessee School Improvement Planning Process Templates – August, 2007 Page 23 of 62

Fifth GradeMath Subgroup Number and Proficiency PercentTitle I 57 37-65%Econ. Disadv.31 18-58%Male 34 21-62%Female 23 16-70%White 48 32-67%Special Ed. 7 5-57%ELL 2 2-100%Reading/LlanguageSubgroup
Number and Proficiency Percent
Title I 57 43-75%Econ. Disadv.31 21-68%Male 34 24-71%Female 23 19-83%White 48 37-77%Special Ed. 7 6-86%ELL 2 2-100%ScienceSubgroup Number and Proficiency PercentTitle I 57 43-75%Econ. Disadv.31 21-68%Male 34 25-74%Female 23 18-78%White 48 37-77%Special Ed. 7 4-57%ELL 2 1-50%Social StudiesSubgroup Number and Proficiency PercentTitle I 57 56-98%Econ. Disadv.31 30-97%Male 34 34-100%Female 23 22-96%White 48 47-98%Special Ed. 7 7-100%ELL 2 2-100%
Tennessee School Improvement Planning Process Templates – August, 2007 Page 24 of 62
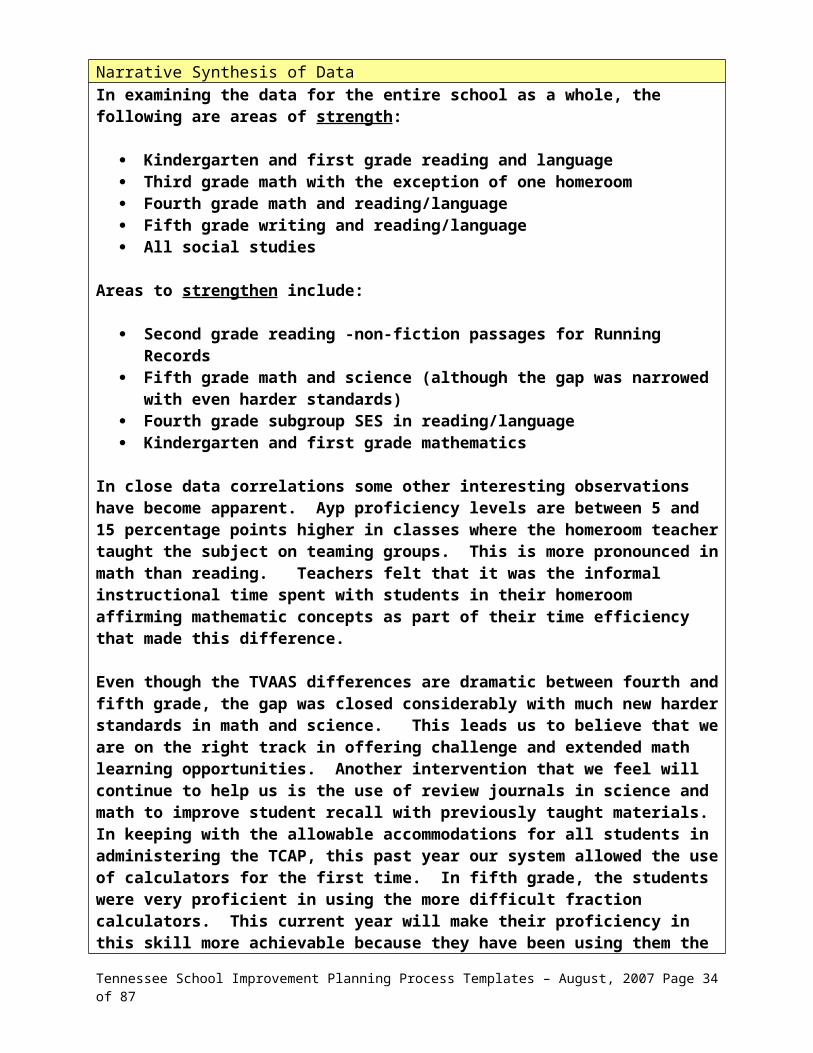
Narrative Synthesis of DataIn examining the data for the entire school as a whole, the following are areas of strength:
Kindergarten and first grade reading and language Third grade math with the exception of one homeroom Fourth grade math and reading/language Fifth grade writing and reading/language All social studies
Areas to strengthen include:
Second grade reading -non-fiction passages for Running Records Fifth grade math and science (although the gap was narrowed with even harder
standards) Fourth grade subgroup SES in reading/language Kindergarten and first grade mathematics
In close data correlations some other interesting observations have become apparent. Ayp proficiency levels are between 5 and 15 percentage points higher in classes where the homeroom teacher taught the subject on teaming groups. This is more pronounced in math than reading. Teachers felt that it was the informal instructional time spent with students in their homeroom affirming mathematic concepts as part of their time efficiency that made this difference.
Even though the TVAAS differences are dramatic between fourth and fifth grade, the gap was closed considerably with much new harder standards in math and science. This leads us to believe that we are on the right track in offering challenge and extended math learning opportunities. Another intervention that we feel will continue to help us is the use of review journals in science and math to improve student recall with previously taught materials. In keeping with the allowable accommodations for all students in administering the TCAP, this past year our system allowed the use of calculators for the first time. In fifth grade, the students were very proficient in using the more difficult fraction calculators. This current year will make their proficiency in this skill more achievable because they have been using them the entire year.
Other concerns for this current year include the high number of students with special needs that have moved into our school in fourth and fifth grade. Those in fifth grade seem to have more apparent behavioral, emotional and attendance issues. We have rallied all our school’s human resources to support their needs. We use extra teacher assistants to give in class individual help to these students.
Our special needs and ELL students have been very successful, primarily due to our commitment to inclusion instruction for all students. We have been able to offer extended learning four days per week for these and all students with academic deficiencies. The transportation provided makes it more accessible for needy students. We plan to “stay the course” with these interventions that continue to improve areas in need of strengthening.
In the final analysis our state report card is the most important determiner of continued
Tennessee School Improvement Planning Process Templates – August, 2007 Page 25 of 62

Narrative Synthesis of Dataimprovement and achievement. Fairmont had all A’s in Achievement, bettering the system and the state. On the TVAAS reporting side, Fairmont had the only A in Reading/Language in the system followed by a B in math and science and an A in social studies.
We feel that this data also serves as a challenge for us to continue to lead in reading/language and to improve to have an A in math and science.
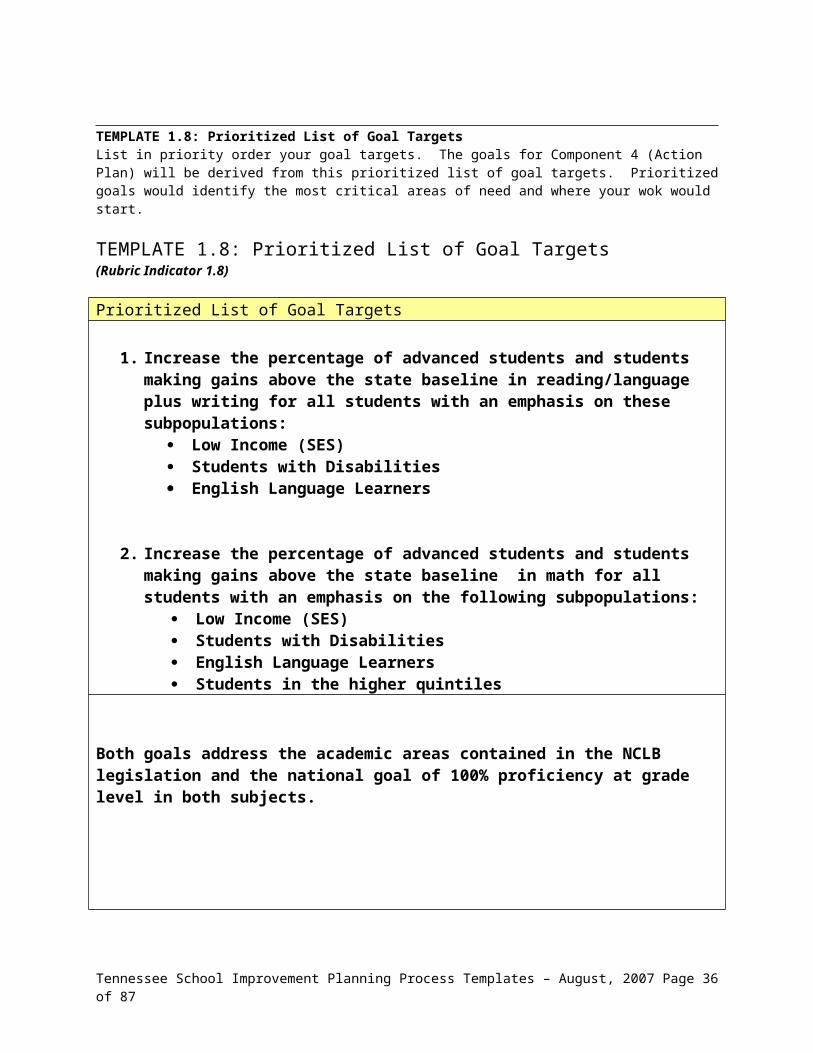
TEMPLATE 1.8: Prioritized List of Goal TargetsList in priority order your goal targets. The goals for Component 4 (Action Plan) will be derived from this prioritized list of goal targets. Prioritized goals would identify the most critical areas of need and where your wok would start.
TEMPLATE 1.8: Prioritized List of Goal Targets(Rubric Indicator 1.8)
Prioritized List of Goal Targets
1. Increase the percentage of advanced students and students making gains above the state baseline in reading/language plus writing for all students with an emphasis on these subpopulations:
Low Income (SES) Students with Disabilities English Language Learners
2. Increase the percentage of advanced students and students making gains above the state baseline in math for all students with an emphasis on the following subpopulations:
Low Income (SES) Students with Disabilities English Language Learners Students in the higher quintiles
Tennessee School Improvement Planning Process Templates – August, 2007 Page 26 of 62

Prioritized List of Goal Targets
Both goals address the academic areas contained in the NCLB legislation and the national goal of 100% proficiency at grade level in both subjects.
Tennessee School Improvement Planning Process Templates – August, 2007 Page 27 of 62

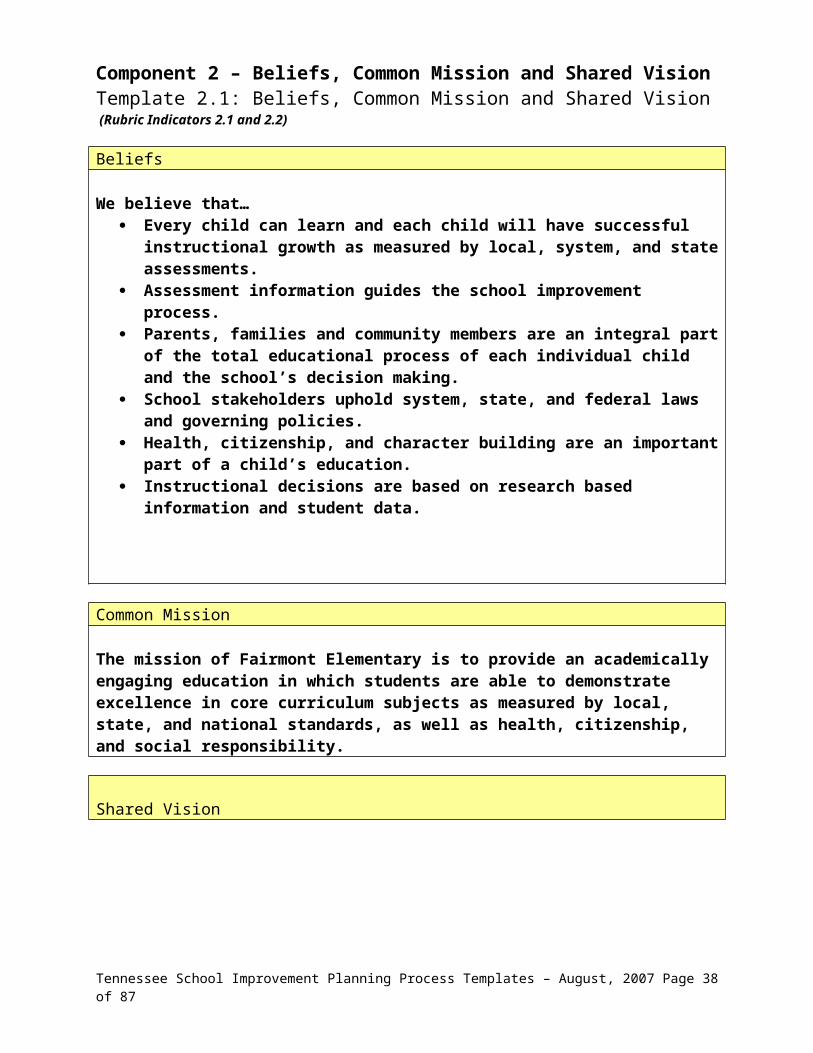
Component 2 – Beliefs, Common Mission and Shared VisionTemplate 2.1: Beliefs, Common Mission and Shared Vision (Rubric Indicators 2.1 and 2.2)
Beliefs
We believe that… Every child can learn and each child will have successful instructional growth as
measured by local, system, and state assessments. Assessment information guides the school improvement process. Parents, families and community members are an integral part of the total
educational process of each individual child and the school’s decision making. School stakeholders uphold system, state, and federal laws and governing policies. Health, citizenship, and character building are an important part of a child’s
education. Instructional decisions are based on research based information and student data.
Common Mission
The mission of Fairmont Elementary is to provide an academically engaging education in which students are able to demonstrate excellence in core curriculum subjects as measured by local, state, and national standards, as well as health, citizenship, and social responsibility.
Shared Vision
The vision of Fairmont Elementary is to enable all students to learn and to be successful while meeting high expectations. This is accomplished by providing the students with the resources to be happy, healthy, productive citizens, and lifelong learners.
Tennessee School Improvement Planning Process Templates – August, 2007 Page 28 of 62

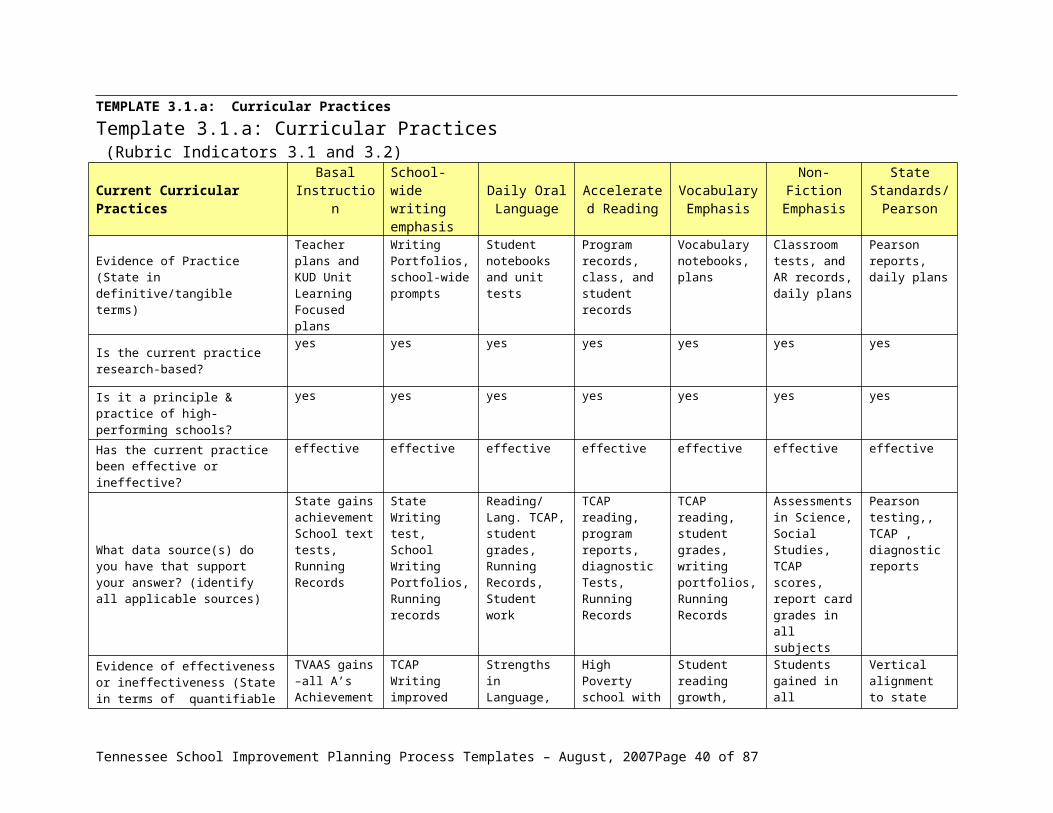
TEMPLATE 3.1.a: Curricular PracticesTemplate 3.1.a: Curricular Practices (Rubric Indicators 3.1 and 3.2)
Current Curricular PracticesBasal
Instruction School-wide writing emphasis
Daily Oral Language
Accelerated Reading
Vocabulary Emphasis
Non-Fiction Emphasis
State Standards/
Pearson
Evidence of Practice (State in definitive/tangible terms)
Teacher plans and KUD Unit Learning Focused plans
Writing Portfolios, school-wide prompts
Student notebooks and unit tests
Program records, class, and studentrecords
Vocabulary notebooks, plans
Classroom tests, and AR records, daily plans
Pearson reports, daily plans
Is the current practice research-based?yes yes yes yes yes yes yes
Is it a principle & practice of high-performing schools?
yes yes yes yes yes yes yes
Has the current practice been effective or ineffective?
effective effective effective effective effective effective effective
What data source(s) do you have that support your answer? (identify all applicable sources)
State gains achievementSchool text tests, Running Records
State Writing test, School Writing Portfolios, Running records
Reading/Lang. TCAP, student grades, Running Records, Student work
TCAP reading, program reports, diagnostic Tests, Running Records
TCAP reading, student grades, writing portfolios, Running Records
Assessments in Science, Social Studies, TCAP scores, report card grades in all subjects
Pearson testing,, TCAP , diagnostic reports
Evidence of effectiveness or ineffectiveness (State in terms of quantifiable improvement)
TVAAS gains –all A’sAchievement also all A’sIn gains except math (B)
TCAP Writing improved from 3.70 to 4.75 over the last 5 years
Strengths in Language, TCAP, Dibels, TRC.
High Poverty school with an A in state Achievement in Reading, STARassessment
Student reading growth, grades, TCAP, Pearson,Early literacy testing, achievement levels, AR reports
Students gained in all subjects because of practice in non-fiction passages
Vertical alignment to state standards at each grade level, tests and tracking of data
Evidence of equitable school support for this practice
Grade Level planning, system reading initiative literacy coaches
System training, school-wide writing prompts
School level time for DOL, samples collected
School level diagnostic reports, parent reports,
Vocabulary walls to support subject area application
Purchases of additional classroom and library trade book support
All students are taught- tested on the benchmarks each nine weeks
Tennessee School Improvement Planning Process Templates – August, 2007 Page 29 of 62

Template 3.1.b: Curriculum Gap AnalysisCurriculum Gap Analysis - Narrative Response Required“What is” The Current Use of: TIME, MONEY, PERSONNEL And OTHER RESOURCES (How are we currently allocating our time, money, personnel and other resources and building capacity around understanding and implementing high quality curricular practices?)
TIME- Curriculum application has been enhanced by the school’s strict commitment to uninterrupted blocks of time for curriculum instruction. Addressing curriculum is accomplished in the area of time allocations.
MONEY-Currently the resource of funds for updating new series each year for new text books to accompany the reading curriculum is an area of need. AR, the web based version is very motivating for our students and must be refunded yearly through system and PTA support, allocations are local for Pearson formative practice assessments. Support from curriculum coaches is also a funding choice
PERSONNEL-Our system’s technology, literacy and math coaches are additional personnel that have helped the teachers present curriculum more successfully.
OTHER RESOURCES-The need for additional curriculum resources through the funding of library materials is one that our system has identified as a need area. The acquisition of nonfiction trade books for early emergent readers continues to be a school goal.
“What Ought to Be” – How Should we be Using Our: TIME, MONEY, PERSONNEL And OTHER RESOURCES
(How should we be allocating our time, money, personnel and other resources and building capacity around understanding and implementing high quality curricular practices?)
TIME-Curricular practices are enhanced by our school’s devotion to effective time management through scheduling, large blocks of instruction and the lengthening of the school day by 30 minutes.
MONEY-Fairmont continues to strive to find additional resources to adequately supply the updated materials and technologies to support our curriculum. Most immediately, the allocation of new textbook funds per pupil needs to reflect the cost of providing the latest editions and updated curriculum materials.
PERSONNEL- New curriculum is only as effective as the teachers who use it. Our personnel can benefit from additional staff development in the use of newly adopted texts. Continuation of curriculum coaching model is most effective and crucial.
OTHER RESOURCES-Additional classroom materials that would enhance the curriculum is always an area we seek to improve. Our philosophy is to have classroom materials that support each area of the curriculum. This improves student achievement across the board. We continually add to “in class” reading support selections and trade books.
Equity and Adequacy:Are we providing equity and adequacy to all of our teachers?
K-2 teachers need increased consumable materials to provide for curriculum acquisition. They
Tennessee School Improvement Planning Process Templates – August, 2007 Page 30 of 62
do not purchase as many “textbooks” for instruction, but still have great needs in presenting the curriculum. We off set or eliminate this inequity by providing more hands-on materials and additional funds to spend for classroom libraries and materials.
Are we targeting funds and resources effectively to meet the needs of all of our teachers in being effective with all their students?
We actually maximize effective use of resources by being proactive in acquiring additional resources through corporate sponsorships, PTA, and grants. Teachers who change grade level or teaching areas are given additional resources to “equalize” funding in their need to acquire new materials to accompany new curriculum/teaching needs.
Based on the data, we are accurately meeting the needs of all students in our school.Since we have high achievement in the accountability and other subgroups, it is evident that our efforts are sustaining the needs of all students. In fact, we have multiple extended learning programs to assure the success of all students. Many of our curricular needs are in upgrading materials to stay on the “cutting edge” and current in curricular practices. We seek to provide many classroom materials to accompany science and social studies texts for direct use for all students.
Tennessee School Improvement Planning Process Templates – August, 2007 Page 31 of 62

Template 3.1.c: Curricular Summary Questions
Curriculum Summary Questions- Narrative Response RequiredWhat are our major strengths and how do we know?
Our strengths are in acquiring research based, innovative curriculum programs in a timely fashion so that our students have the benefit of the best curriculum offerings. Additionally, we have sustained our curricular practices so that there is long term commitment and administrative support. We have data to prove this through both summative state reporting and our multiple means of formative data measures. Our summative data indicates that the curriculum has strengths in reading and language in all grades. Areas to strengthen would include science and math in grades 3 through 5. We continue our data collections and reflections to improve curriculum practices.
Curriculum Summary Questions- Narrative Response RequiredWhat are our major challenges and how do we know.
The prioritized needs on Component 1 identified a curricular need in addressing educating ELL students. Currently, Fairmont needs to have specific support programs for some of the subpopulations that are very expensive. Our accountability subpopulation, SES students, have the greatest need in keeping adequate reading and other materials that can be shared to the home with those groups. Curricular support materials such as trade books to accompany new science and social studies texts are needed in the classrooms to ensure students have the greatest access. Continually replacing these materials so that they can be used is an on-going major challenge. Upgrading maps, and globes, as well as, science equipment is a curricular and financial challenge.
How do we know? Our information is based on student, parent and teacher surveys, leadership team minutes, conferences and the other formation and summative data. Five years ago we made a deliberate effort to purchase science and social studies materials that supported the science and social studies curriculum. This had a positive impact on our school’s achievement levels and their escalations.
Curriculum Summary Questions- Narrative Response Required
How will we address our challenges? In summary, our curriculum is an overall strength in the school’s programming. We believe that this strength is continuing because of the following:
A commitment to the upgrading and adoption of researched based programs and texts and the latest support materials for individual classrooms. Students have greater accessibility to materials when those materials are in their individual classrooms.
Tennessee School Improvement Planning Process Templates – August, 2007 Page 32 of 62

Alignment of the locally adopted curriculum to the state standards. Consistency in the instruction, evaluation and assessments to the curriculum and to
the alignment of all those to the state standards. Curriculum and programs for SES accountability subpopulation have been an
emphasis.
Curriculum areas to strengthen include:
Curriculum support in the matter of materials for classroom reinforcement for ELL students.
Continually upgrading and adding to the materials available in the classrooms for student accessibility. This is especially the case in aligning and procuring materials for social studies and science adoptions. Specifically, classroom trade book or independent reading libraries have the greatest need for additional non-fiction independent reading take home books aligned to the new adoptions and state standards.
Challenge offerings for higher level learners Narrative Writing in the primary grades Supportive technologies
Tennessee School Improvement Planning Process Templates – August, 2007 Page 33 of 62
Template 3.2.a: Instructional Practices
Current Instructional Practices Learning
Focused Strategies
Inclusion Instruction
Lindamood- Bell
Instruction ELL
Instruction
Literacy, Technology and Math Coaching Models
Daily Math Mixed
Practice
Standards based-curriculum alignment
Evidence of Practice (State in definitive/tangible terms)
Classroom observation, teacher lesson plans
Observationcooperativeplanning, assessments
ObservationPlansStudent work, assessments
ObservationPlans, student work, and assessments
Evaluations, Dibels, Literacy portfolios, surveys
Student notebooks, weekly review tests
Teacher plans, TCAP results, formative assessments
Is the current practice research-based?
yes yes yes yes yes yes yes
Is it a principle & practice of high-performing schools?
yes yes yes yes yes yes yes
Has the current practice been effective or ineffective?
effective effective effective effective effective effective effective
What data source(s) do you have that support your answer? (identify all applicable sources)
TCAP, Pearson assessments ,,report card grades, surveys
TCAP, Pearson assessments, Portfolios, grades
TCAP, Pearson assessments report cards, conferences
TCAP , Pearson assessments, TRC, mClass Dibels, report cards
TCAP, State Writing test, Literacy reports, ,surveys
System benchmarks and TCAP achievement in math-TVAAS
TCAP achievement and TVAAS formative dataThink Link
Evidence of effectiveness or ineffectiveness (State in terms of quantifiable improvement)
Improved state achievement and TVAAS, teacher surveys, community surveys
Improved state achievement and TVAAS, subgroup test data
Control group progress through diagnostic testing, and improved report card grades
State designated pre and post test growth data
Improvement in state reading and language, mathachievement and TVAAS, teacher surveys
Pearson assessments, TCAP achievement and TVAAS
All A’s on achievement and TVAAS on state report cards
Evidence of equitable school support for this practice
Practiced in every classroom and special areas
All resource students in grades 1 – 5 are served in regular classes
Available to Special Education students
Available to ELL screened through the state tests for ELL
Available to every class to all students
Practiced in every class with every child
Practiced in every class with all students.
Next Step (changes or continuations)
Continue to refine strategies and techniques, develop further
Continue this practice, schedule additional time as needed
Continue with increased teacher training
Continue and align ELL instruction in regular classes
Continue through system level support
Continue with continued monitoring
Continue this practice with teacher plans aligned
Tennessee School Improvement Planning Process Templates – August, 2007 Page 34 of 62

Template 3.2.b: Instructional Gap AnalysisInstructional Gap Analysis - Narrative Response Required“What is” The Current Use of: TIME, MONEY, PERSONNEL And OTHER RESOURCES (How are we currently allocating our time, money, personnel and other resources and building capacity around understanding and implementing high quality instructional practices?)
TIME- Fairmont has increased instructional time through the recent 30 minutes added to the student day and through our extended learning opportunities. This has strengthened the instruction. Teacher team planning time has also strengthened the teachers’ ability to effectively present instruction.
MONEY-Fiscal resources for instructional practices to be enhances is accomplished through the use of Title funds and Site Based budgets for staff development.
PERSONNEL-School personnel including both professional and classified staff have instructional responsibilities to assure small group and individual instruction. Class size reduction staff make presenting the instruction with individualization. Our Title I budget is almost completely used for teaching and support staff.
OTHER RESOURCES-Lindamood -Bell Instructional materials are expensive and have been purchased through our Special Education system budget, ELL materials are also purchased through the system. Additionally, staff development materials for “Learning Focused” are currently stretching our staff development budget.
“What Ought to Be” – How Should we be Using Our: TIME, MONEY, PERSONNEL And OTHER RESOURCES(How should we be allocating our time, money, personnel and other resources and building capacity around understanding and implementing high quality instructional practices?)
TIME-Instructional time can be further enhanced by continued support through scheduling and time on task measures.
MONEY-Fiscal support for providing materials and staff in-service to develop instructional expertise through Learning Focused Strategies, the Inclusion Model, and
Tennessee School Improvement Planning Process Templates – August, 2007 Page 35 of 62
Lindamood -Bell is always a challenge. It is a challenge to continue to provide the monetary support for those quality instructional practices.
PERSONNEL-Fortunately, our system supports the schools with the “coaching model personnel”, LMB support and resources and ELL personnel.
OTHER RESOURCES- Additional needs include materials for alignment for ELL instruction in the regular class setting, and additional materials for independent reading for all the subgroup populations. Supportive technology is also a great need.
Equity and Adequacy: All students are able to benefit from the “Learning Focused Model”, “Instructional Reading, Math and Technology Coaching”, Daily Mixed Practice, and Standards based-curriculum alignment. These teaching strategies provide for our total population with target subpopulation emphasis.
Are we providing equity and adequacy to all of our teachers? Every teacher has opportunities for development through the staff development models including Learning Focused and Lindamood-Bell. The Resource and ELL teachers serve the needs of all classroom teachers. Additionally, our system level coaches are assigned time in the schools they serve.
Are we targeting funds and resources effectively to meet the needs of all of our teachers in being effective with all their students? We ambitiously fulfill the needs of all of our teachers so that their students demonstrate the effectiveness of the allocation of funds and resources. This is proven through the state reporting and the multiple other assessments which demonstrate the high level of effectiveness.
Based on the data, are we accurately meeting the needs of all students in our school?Yes, as demonstrated by our successful state measures, formative, and other data; our students are demonstrate the effectiveness of the allocation of funds and resources. Our accountability and other subpopulations are above proficiency levels.
Tennessee School Improvement Planning Process Templates – August, 2007 Page 36 of 62

TEMPLATE 3.2.c: Instructional Summary QuestionsTemplate 3.2.c: Instructional Summary Questions
Instructional Summary Questions- Narrative Response RequiredWhat are our major challenges and how do we know. (These should be stated as instructional practice challenges identified in the templates above, that could be a cause of the prioritized needs identified in component 1.)
Instructional practices have challenges in continuing to develop our expertise in Lindamood-Bell for the benefit of identified subpopulations. Fortifying and maintaining Learning Focused and the Literacy Initiative for the greater benefit of the accountability subpopulation, SES. An on-going instructional challenge is providing mentoring programs for new staff to develop their teaching expertise to meet the high standards and expectations that we hold for instruction. Supportive technology acquisitions is an economic challenge.
Tennessee School Improvement Planning Process Templates – August, 2007 Page 37 of 62
Instructional Summary Questions- Narrative Response RequiredWhat are our major strengths and how do we know?
Our major strengths are in the presentation of “Learning Focused” strategies and differentiating instruction for the “Inclusion” Resource” model. We know because this is our 6th year in practicing “Learning Focused” strategies. Our reported achievement and gains demonstrate the fruits of this sustained commitment to research based high quality staff development.
Instructional Summary Questions- Narrative Response RequiredHow will we address our challenges?
Our system is very supportive of the Lindamood-Bell Reading Program and our sustained commitment to the Learning Focused Model. Through system and local support, our school will be able to broaden our instructional knowledge in both these quality programs.
Indoctrinating new staff to bring them up to the high level of instruction expected at Fairmont is a challenge that continues. Mentorship and additional support is only one of the avenues that can help address this issue. Release time can be offered to help new staff acquire the instructional skills through staff development offerings.
Implementation of school-wide writing prompts has heightened the emphasis of narrative writing in all grades, particularly in grades K through 2 for the first time.
Challenge math extended learning and literature groups for higher level learners has offered extensions to assure full student potential is reached.
Template 3.3.a: Assessment Practices
Current Assessment Practices
Pearson testing
Grades 2-5- Reading/
Math/
Diagnostic testing for
ELL students
STAR (AR diagnostic
reading level) (2-5)
TRC (Running records) mClass Dibels
Assessment
Children’s Progress
(Kdg. and 1st)
TCAP Achieve.
grades 3-5 State
Writing Test Grade 5
Brigance Pre and Post testing for
Kdg.
Evidence of Practice (State in definitive/tangible terms)
Reports 3 times per year
Diagnostic testing
Diagnostic Reports at the end of each 9 wks.
Formal data collected 3 times per year (K-2)
System and School data -3 times yearly, Reading/Math
State reporting yearly
Beginning of Kdg. and end of the year reports
Is the current practice research-based?yes yes yes yes yes yes yes
Is it a principle & practice of high-performing schools?
yes yes yes yes yes yes yes
Tennessee School Improvement Planning Process Templates – August, 2007 Page 38 of 62

Has the current practice been effective or ineffective?
effective effective effective effective effective effective effective
What data source(s) do you have that support your answer? (identify all applicable sources)
Diagnostic reports 3 times per yr.
Student grades summative testing
Reports collected 4 times per yr.
Diagnostic on-line reporting three times yr.
Diagnostic reporting on the gains of each student/class
State reporting Reports compiled each fall and spring
Evidence of effectiveness or ineffectiveness (State in terms of quantifiable improvement)
Formative data used to address individuals
Data used to formulate ELL student plans
Reading levels determined from on-line diagnostics
Tracking of individual and class progress through diagnostic reports
Math needs identified through diagnostic testing
Data information concerning sub groups to address needs
Information for teacher planning and student diagnostics
Evidence of equitable school support for this practice
All available tests administered to all students
All students with Foreign Language barriers
Grades 2-5 all children
All students in grades K-2
All students are administered the benchmarks
All students in grades 3-5 are administered these tests
All Kdg. students are given this test
Next Step (changes or continuations)
supportive materials for adoptions
Involve Third grade in this curriculum
Continue with the addition of 1stst grade and Kindergarten
Purchase higher level books for each grade as students raise
Increase Third grade involvement in this emphasis
Acquire l trade books to support Science adoption
Vertical team planning to revise for new standards
Tennessee School Improvement Planning Process Templates – August, 2007 Page 39 of 62
Template 3.3.b: Assessment Gap AnalysisAssessment Gap Analysis – Narrative Response Required“What is” The Current Use of: TIME, MONEY, PERSONNEL And OTHER RESOURCES (How are we currently allocating our time, money, personnel and other resources and building capacity around understanding and implementing high quality assessment practices?)
TIME- Adequate time to administer the TRC, Children’s Progress and the mClass Dibels is a factor for the classroom teachers. These worthwhile evaluations have to be administered individually and this is difficult in the self-contained class setting.
MONEY-System financial support has enabled us to provide Pearson, mClass Dibels, TRC, Children’s Progress and Palm Pilot Literacy testing
PERSONNEL-Classroom teachers have a greater knowledge and use of the assessment data when they administer it. However, we need additional personnel so that they could have the time to test individual students.
OTHER RESOURCES-We have bountiful resources in the area of assessments and evaluation instruments.
“What Ought to Be” – How Should we be Using Our: TIME, MONEY, PERSONNEL And OTHER RESOURCES(How should we be allocating our time, money, personnel and other resources and building capacity around understanding and implementing high quality assessment practices?)
TIME-We should make K-2 mClass Dibels, Children’s Progress and running records information more easily utilized by the teacher and more easily administered.
MONEY-Without system support, we could not afford the wide variety of quality assessments that we currently utilize.
PERSONNEL- Additional support personnel during the administration of the TRC and mClass Dibels would help the classroom teachers.
OTHER RESOURCES-Staff development in the K-2 grades concerning the use of their assessment information to positively affect student learning.
Tennessee School Improvement Planning Process Templates – August, 2007 Page 40 of 62

Equity and Adequacy:
Equity is achieved in our assessment programs because we are able to assure their applications to all students at their appropriate instructional level.
Are we providing equity and adequacy to all of our teachers?
All classroom teachers at the particular assessment’s application grade level have the ability to administer and utilize the information from the evaluations. Resources and assistance is provided for teachers to make evaluations useful for instructional improvements.
Are we targeting funds and resources effectively to meet the needs of all of our teachers in being effective with all their students?
The administration of the individual tests in grades K-2 should have more funding and resources to make accomplishing these tests easier for these classroom teachers. It is difficult to administer an individual test while the other students are also in need of the teacher’s attention during class time.
Based on the data, are we accurately meeting the needs of all students in our school?
Yes, based on the data, we are currently meeting the needs of all our students including the needs of the accountability and other subpopulations. Our assessment component is proof of our success in meeting those needs. We still need to focus on continuing improvements for the sub group populations in the reading/language/writing and mathematics. Our accountability subgroups, SES, have very high Adequate Yearly Progress as measured by state assessments.
Tennessee School Improvement Planning Process Templates – August, 2007 Page 41 of 62

Template 3.3.c: Assessment Summary Questions (Rubric Indicator 3.6)
Assessment Summary Questions- Narrative Response RequiredWhat are our major challenges and how do we know. (These should be stated as assessment practice challenges identified in the templates above, that could be a cause of the prioritized needs identified in component 1.)
Our greatest assessment challenge is to better utilize the bountiful data that we have at our disposal. We continue to need to provide support for the teachers in using the information from assessments in their daily, weekly and unit planning efforts. Our sub group populations could have the greatest benefit from this application. ELL students have their own state dictated assessments upon entering and in the spring with results provided to their instructors. A major challenge is to provide support to the classroom teachers as they need to adjust their planning and instruction based on the assessment information. Our ability to advance the reading/language/writing and math progress of our students, especially of the subgroups, depends on this improvement.
Tennessee School Improvement Planning Process Templates – August, 2007 Page 42 of 62
Assessment Summary Questions- Narrative Response RequiredWhat are our major strengths and how do we know?
Our major strength in evaluating our evaluations is that we have multiple, quality evaluations at all grade levels. Another component of this strength is that these are high quality, proven measures. We know this by the quantity of the data that we are able to provide and use to improve instruction. The reports are generated both by the teachers and by the assessment providers. For instance, three times yearly we have on-line diagnostic reporting through Pearson Assessments. Our web version of Accelerated Reader provides on-line reporting and support. Additionally, we have palm pilot literacy testing for K-2 students with web reports. New this year, we utilize Children’s Progress to track gains in math and reading in K and 1st grades.
Assessment Summary Questions- Narrative Response RequiredHow will we address our challenges?
Our challenge is to use more effectively the amount of assessment information and utilizing it effectively to improve student achievement. Our system level curriculum/literacy coaches plan to provide summer staff development for all classroom teachers in using their literacy information to improve reading/language instruction. Our school plans to provide Unit Planning through Learning Focused to address needs in instruction, as well. During our school’s pre-service opportunities, we plan to have grade level meetings to address using the information from formative and summative assessments.

Template 3.4.a: Organizational Practices
Current Organizational Practices
Scheduling for large blocks of
instruction
School-wide practices for DOL-DOM
UninterruptedInstruction,
Time on Task measures
Challenge after school programs
Tutoring/ExtendedLearning
Homework after school programs
Technology/ Study Skills
Groups
Evidence of Practice (State in definitive/tangible terms)
Master School Schedule
Student samples turned in
Observable Student attendance rolls
Student Attendancerolls
Attendance Rolls
Student attendance
Is the current practice research-based?
yes yes yes yes yes yes yes
Tennessee School Improvement Planning Process Templates – August, 2007 Page 43 of 62

Is it a principle & practice of high-performing schools?
yes yes yes yes yes yes yes
Has the current practice been effective or ineffective?
effective effective effective effective effective effective effective
What data source(s) do you have that support your answer? (identify all applicable sources)
State reporting, surveys, grades
TCAP reading/Language & math
State report card, surveys, formative
Report cards, surveys, teachers
Teachers, report card, surveys, conferences
Surveys, grades, report cards, math benchmarks
Surveys, SS on state report card, grades, conferences
Evidence of effectiveness or ineffectiveness (State in terms of quantifiable improvement)
Reading/Lang and math gains on state report card
Language success on local and state reporting
State, local and system reporting, diagnostics
Student report card grades
AchievementAnd TVAASImprovementMeasured for this group
Grades, math benchmark improvement
Skill accomplishment on state reporting, TVAAS
Evidence of equitable school support for this practice
All teachers and students
All first through fifth
All students 3rd through 5th
2nd through 5th
For all Kdg. through 2nd
All 3rd through 5th
Next Step (changes or continuations)
continue Update and continue to refine
Continue current practices
Continue as funding is available
Provided by extended contract
Continue as provided by Safety Net
Provided byExtended contract
Template 3.4.b: Organizational Gap Analysis
Organizational Gap Analysis – Narrative Response Required
Tennessee School Improvement Planning Process Templates – August, 2007 Page 44 of 62

“What is” The Current Use of: TIME, MONEY, PERSONNEL And OTHER RESOURCES
TIME- Since the lengthening of our school day by 30 minutes 2 years ago, our organization time allocation has been used to meet school goals in core curriculum areas.
MONEY- Providing after school or extended learning funding for tutors and transportation is accomplished through extended contract and Title 1 contract services.
PERSONNEL-All organizational personnel are utilized to the fullest. We are currently in need of additional tutoring and homework personnel.
OTHER RESOURCES- Additional materials for the technology/ study skills and Geography Club is provided through community/ private donations. Other organizational measures, such as smaller class size, have funding provided through the school’s Site Base budget and Title I budgets.
“What Ought to Be” – How Should we be Using Our: TIME, MONEY, PERSONNEL And OTHER RESOURCES
TIME- We have been able to add even more time to our after school programs through community organizations like Coalition and Boys to Men who have had large grants for after school help at Fairmont.
MONEY-Additional support funding through local agencies has helped provide additional funding for extended learning. We are still on the “edge” with this provision because of the constraints of extended contracts and Title 1.
PERSONNEL- The students who stay in our extended learning programs are in need of such individualized help that it is important to keep the student to teacher ration low in these programs. Additionally, we are in need of expanding the Lindamood-Bell instruction with a teacher position dedicated to this program.
OTHER RESOURCES -We have been able to add even more resources to our after school program through community organizations like Coalition for Kids, who have had large grants for after school help at Fairmont. They have been able to obtain several of the lottery grants. This has helped our transportation costs because they are able to provide transportation for a lot of the needy students.
Tennessee School Improvement Planning Process Templates – August, 2007 Page 45 of 62

Equity and Adequacy:
Because we offer transportation to our extended learning opportunities, we are assuring equity and adequacy to the target subgroups and non-targeted subgroups, as well. In fact, all our organization efforts are focused on providing for those most at-risk.
Are we providing equity and adequacy to all of our teachers ?
Teachers of the targeted grade levels are utilizing these organizational practices. All classroom and special class teachers have the same organizational accountability.
Are we targeting funds and resources effectively to meet the needs of all of our teachers in being effective with all their students?
Out funds are fully “stretched” to meet the needs of all students, especially of those students with the greatest academic needs. We are proactive in acquiring additional funding through private businesses and community agencies.
Based on the data, are we accurately meeting the needs of all students in our school?
Since our accountability subgroup population scores are close to or above the “all” student groups on the state level data and the other subgroups are maintaining their progress, we can provide proof that we are meeting the needs of all students in our school. A recent focus has been on providing for means to raise the achievement and progress of students in the higher range. We have been able to address these needs through Geography Club, technology, AR on the web and other enrichment/tutoring extended learning programs.
Tennessee School Improvement Planning Process Templates – August, 2007 Page 46 of 62
Tennessee School Improvement Planning Process Templates – August, 2007 Page 47 of 62

Template 3.4.c: Organization Summary Questions
Organization Summary Questions- Narrative Response RequiredWhat are our major challenges and how do we know. (These should be stated as organizational practice challenges identified in the templates above, that could be a cause of the prioritized needs identified in component 1.) Major challenges (as noted in Part 1 on Prioritized Needs):
Providing transportation for extended learning programs to meet the needs of the at-risk learners and all subgroup populations
Additional materials and technologies for ELL, SES, at-risk learners, as well as, challenge to use in their regular classrooms and during the after school programs.
Organization Summary Questions- Narrative Response RequiredHow will we address our challenges?
Fairmont continues to strengthen the extended learning opportunities through school-level, system and community resources. We are very aggressive in approaching outside support in the extension of learning time for the most at-risk learners.
System level support through extended contract, system funding grants like Safety Net funds and Title 1 funding has been effectively used to maintain these quality programs.Our greatest challenge is to continually fund the very expensive transportation costs and the expensive of quality after school tutors. We believe that offering transportation is important because the students who need extended learning most are the most likely without transportations. In fact, the after school program bus is usually filled to capacity.
Tennessee School Improvement Planning Process Templates – August, 2007 Page 48 of 62

Component 4 – Action Plan Development
TEMPLATE 4.1: Goals (Based on the prioritized goal targets developed in Component 1.)Describe your goal and identify which need(s) it addresses. The findings in Component 1 should drive the goal statements. How does this goal connect to your system’s five year or systemwide plan?(Rubric Indicator 4.1)
TEMPLATE 4.2: Action Steps (Based on the challenges/next steps identified in Component 3 which focus on curricular, instructional, assessment and organizational practices.)Descriptively list the action you plan to take to ensure that you will be able to progress toward your prioritized goal targets. The action steps are strategies and interventions, and should be based on scientifically based research where possible. Professional Development, Parent/Community Involvement, Technology and Communication strategies are to be included within the action steps of each goal statement. (Rubric Indicator 4.2)
TEMPLATE 4.3: Implementation PlanFor each of the Action Steps you list, give the timeline for the step, the person(s) responsible for the step, the projected cost(s), funding sources and the evaluation strategy.
Tennessee School Improvement Planning Process Templates – August, 2007 Page 49 of 62

(Rubric Indicator 4.3)
GOAL 1 – Action Plan DevelopmentTemplate 4.1 – (Rubric Indicator 4.1) Revised DATE: Spring 2008
Section A –Describe your goal and identify which need(s) it addresses. (Remember that your previous components identified the strengths and challenges/needs.)
GoalIncrease the percentage of students who are proficient, advanced and making positive gains in reading/language; plus all 5thtgrade students will make a minimum of 4 on the writing state test with an emphasis on these subpopulations: Low Income (SES), Students with Disabilities, and English Language Learners.
Which need(s) does this Goal address? Students will be proficient, advanced and make positive gains in reading/language plus writing.
How is this Goal linked to the system’s Five-Year Plan? Goal Number 1 of the Johnson City Schools’ Five Year Plan, Objective 1: To meet or exceed Adequate Yearly Progress on state/federal requirements for all students including student subgroup populations.
ACTION STEPS – Template 4.2 – (Rubric Indicator 4.2) IMPLEMENTATION PLAN – Template 4.3 – (Rubric Indicator 4.3)Section B – Descriptively list the action you plan to take to ensure you will be able to progress toward your goal. Action steps are strategies and interventions which should be scientifically based where possible and include professional development, technology, communication, and parent and community involvement initiatives within the action steps of each goal.
Section C – For each of the Action Steps you list, give timeline, person(s) responsible, projected cost(s)/required resources, funding sources, evaluation strategy and performance results/outcomes. (For Evaluation Strategy, define how you will evaluate the action step.)
Timeline Person(s) Responsible
Required Resources
Projected Cost(s) & Funding Sources
Evaluation Strategy Performance Results / Outcomes
Action Step
Provide staff development in using data effectively through Battelle and Learning
Begin fall 2010 and
System curriculum
Supplemental materials for
System level costs and
Teachers will be use this knowledge to
Student achievement and advancement in
Tennessee School Improvement Planning Process Templates – August, 2007 Page 50 of 62

Focused, aligning and teaching standards emphasis on higher order thinking, the use of Pearson assessments and practice prompts for higher order thinking and effective approaches for SES, ELL and at-risk learners- to include LindaMood Bell instruction.
continue Spring
and Summer
2011
coaches, McGill
workshops and presenter fees
$4,000.00 forLF, materials
Title I
formulate improved strategies as noted in
daily plans and student achievement
reading/language and writing will increase.
Action Step
Increase family engagement opportunities for education and involvement in writing/ literacy with student incentives for goal attainment. Offer more activities for families in motivating students to read and in understanding higher order thinking skills.
Scheduled in August,
for the year
McGillHughesSowers
Funds, time, place
$2,500.00Title I Surveys, attendance
Families will participate in literacy
improvements as noted by student
achievement.
Action Step
Plan the use of Pearson Assessments, teachers will need training and targeted skill sequencing, continued unit mapping will need to be developed. Implement use of Children’s Progress in K and 1 to track student gains in reading.
2010-2011, 2012
Classroom teachers, curriculum coaches
Pearson Program developers
test cost plus training,skill sequence developmentTitle I
Use of Pearson Skill testing to better align
evaluations with updated TCAP
Student achievement with increase with the alignment of the test practice with the test
Action Step
Acquire additional supportive technology,materials, non-fiction trade books, MCP phonics series and journals, LMB, materials for at-risk ESL, SES and to challenge higher learners in the regular classroom for reading/language plus writing instruction. Continue web based AR technology support.
Fall 2010-2012
Reynolds, Kitchens,McGill,
Classroom teachers
Tech program for ELL, paperback libraries for the
classrooms
$10,000.00Title I
Surveys, student grades, conference
notes, state achievement
Teachers will be able to meet the needs of subgroup populations
in the regular classroom.
ActionStep
Continue Extended Learning to offer tutoring and enrichment with transportation for reading/language instruction for at-risk.
Beginning in the fall 2010-11
Henderson, McGill
Extended Contract, Safety
Net
$20,000.00Title I
Attendance, achievement data
Students have better grades and TCAP
results.
ActionStep
Effectively communicate reading/writing/language expectations, LMB program and assessment results to all stakeholders in monthly newsletters, weekly web site (Quia) updates, parent conferences (at least twice yearly) and regular monthly family engagement opportunities. Increase family engagement to include academic specific sessions.
August 2010
through May -2011
McGillClassroom teachers
Special Area teachers
Communication
committee
Local site base budget and Title I $2,000.00
Surveys, improvement in
conference attendance and positive climate
Increased family involvement and
knowledge concerning literacy and tools to help
students
Tennessee School Improvement Planning Process Templates – August, 2007 Page 51 of 62
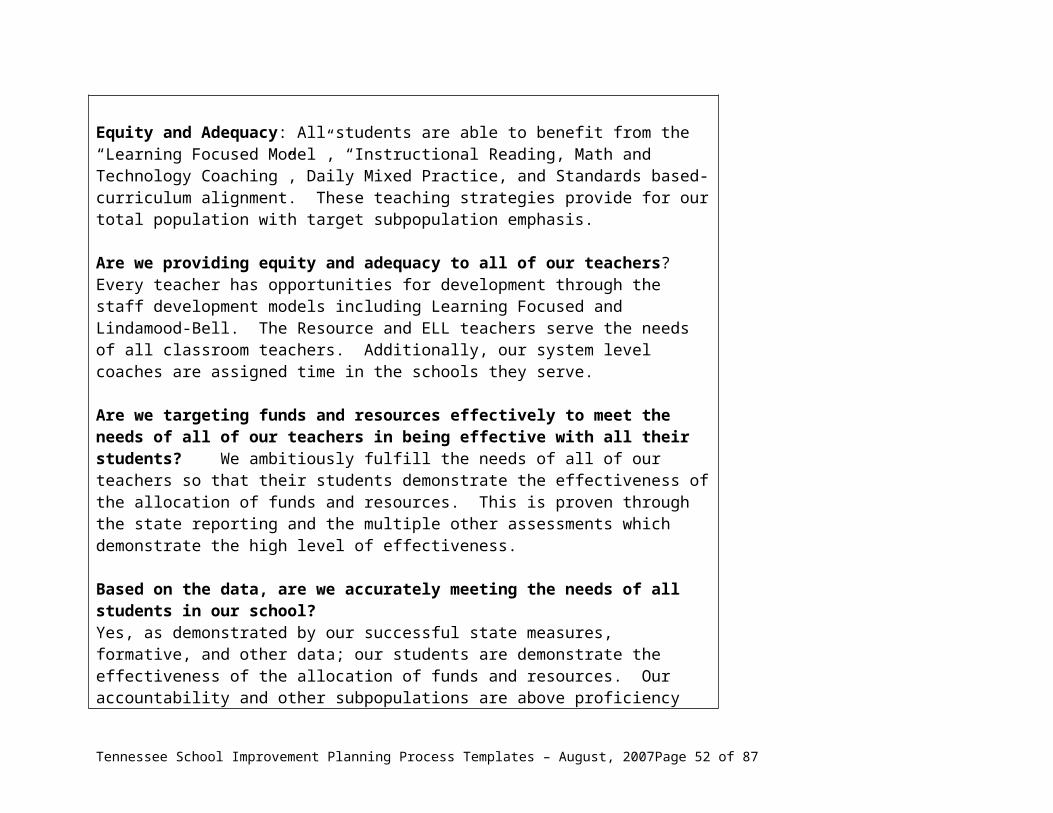
GOAL 2 – Action Plan DevelopmentTemplate 4.1 – (Rubric Indicator 4.1) Revised DATE: Spring 2008
Section A –Describe your goal and identify which need(s) it addresses. (Remember that your previous components identified the strengths and challenges/needs.)
GoalIncrease the percentage of students proficient, advanced and making positive gains in mathematics for all students with an emphasis on these subpopulations: Low income (SES), Students with Disabilities, and English Language Learners.
Which need(s) does this Goal address? Students need to be proficient, advanced and make positive gains in mathematics.
How is this Goal linked to the system’s Five-Year Plan? Goal Number 1 of the Johnson City Schools’ Five Year Plan, Objective 1: To meet or exceed Adequate Yearly Progress on state/federal requirements for all students including student subgroup populations.
ACTION STEPS – Template 4.2 – (Rubric Indicator 4.2) IMPLEMENTATION PLAN – Template 4.3 – (Rubric Indicator 4.3)Section B – Descriptively list the action you plan to take to ensure you will be able to progress toward your goal. Action steps are strategies and interventions which should be scientifically based where possible and include professional development, technology, communication, and parent and community involvement initiatives within the action steps of each goal.
Section C – For each of the Action Steps you list, give timeline, person(s) responsible, projected cost(s)/required resources, funding sources, evaluation strategy and performance results/outcomes. (For Evaluation Strategy, define how you will evaluate the action step.)
Timeline Person(s) Responsible
Required Resources
Projected Cost(s) & Funding Sources
Evaluation Strategy Performance Results / Outcomes
Action Step
Implement courses from Battelle in using math data. Provide staff development in using/aligning the math state standards and in application of “Learning Focused” strategies, with the use of Pearson assessments in math instruction, to include practice probes for higher order thinking to accompany the math unit mapping.
Summer and
school year 2010-
2011
System coaches,
McGill and classroom teachers
Supplemental materials for
workshops and presenters, fees
System level costs and
$4,000.00 for LF convention,
materials and presenters
Teacher plans, Pearson data, student achievement on state data, report cards, surveys
Teachers will be able to utilize data to affect
positive math gains and use Learning
Focused strategies to affect learning in
mathematics.
Action Step
Increase family engagement opportunities for parent knowledge concerning new math standards and tools for increasing student accomplishment of these standards; Familiarize parents with how to support student math learning. Offer family activities to support understanding of harder math concepts and in assisting families in using fraction calculators.
Monthly 2010-2011
McGill, Hughes,Sowers
Funds, time, place $2,500.00 Attendance, surveys
Families will participate in math
activities.
Action Step
Align new math standards with Pearson assessment instruments through creation and implementation of vertical math skill scope and sequence.
Through-out the school year 2010-11
Classroom teachers, math coach
$10 per student and personnel to align skills and
training
$4,000.00
Use of Pearson Skill testing program to
better align evaluations with updated TCAP
Stakeholders will be knowledgeable concerning student math progress
Tennessee School Improvement Planning Process Templates – August, 2007 Page 52 of 62

Action Step
Acquire supportive technology and materials to enhance instruction in math for at-risk subpopulations in the regular classrooms and higher-level math learners. Accelerated Math support for upper grades
Sept.-2010-
throughout the year
2011
Reynolds, Kitchens, classroom teachers
Technology ELL program,
paperback math support
$10,000.00
Surveys, student grades, conference
notes, state achievement in math
Teachers will meet the math needs of
subgroup populations regular classrooms.
Action Step
Continue Extended Learning to offer tutoring and transportation for math after school tutoring and challenge/enrichment opportunities.
Sept.-April 2010-2011
Henderson, McGill
Extended Contract, Safety Net funds, Title 1
$20,000.00 Attendance, achievement data
Students have better grades and TCAP
ActionStep
Effectively communicate math expectations, programs and assessment results to all stakeholders in monthly newsletters, weekly web site (Quia) updates, parent meetings (at least twice yearly) and regular monthly family engagement opportunities. Include Pearson formative data communications including practice information. Communicate through math updates to parents monthly.
August through
May 2010-2011
McGillClassroom teachers
Special Area teachers
Communication
committee
Local site base budget and Title I
$2,000.00 Surveys, improvement in
conference attendance and positive climate
Increased family involvement and
knowledge concerning literacy and tools to help
students
Tennessee School Improvement Planning Process Templates – August, 2007 Page 53 of 62

GOAL 3 – Action Plan DevelopmentTemplate 4.1 – (Rubric Indicator 4.1) Revised DATE: __________________________
Section A –Describe your goal and identify which need(s) it addresses. (Remember that your previous components identified the strengths and challenges/needs.)
Goal
Which need(s) does this Goal address?
How is this Goal linked to the system’s Five-Year Plan?
ACTION STEPS – Template 4.2 – (Rubric Indicator 4.2) IMPLEMENTATION PLAN – Template 4.3 – (Rubric Indicator 4.3)Section B – Descriptively list the action you plan to take to ensure you will be able to progress toward your goal. Action steps are strategies and interventions, which should be scientifically based where possible, and include professional development, technology, communication, and parent and community involvement initiatives within the action steps of each goal.
Section C – For each of the Action Steps you list, give timeline, person(s) responsible, projected cost(s)/required resources, funding sources, evaluation strategy and performance results/outcomes. (For Evaluation Strategy, define how you will evaluate the action step.)
Timeline Person(s) Responsible
Required Resources
Projected Cost(s) & Funding Sources
Evaluation Strategy Performance Results / Outcomes
Action Step
Action Step
Action Step
Action Step
Tennessee School Improvement Planning Process Templates – August, 2007 Page 54 of 62

GOAL 4 – Action Plan DevelopmentTemplate 4.1 – (Rubric Indicator 4.1) Revised DATE: __________________________
Section A –Describe your goal and identify which need(s) it addresses. (Remember that your previous components identified the strengths and challenges/needs.)
Goal
Which need(s) does this Goal address?
How is this Goal linked to the system’s Five-Year Plan?
ACTION STEPS – Template 4.2 – (Rubric Indicator 4.2) IMPLEMENTATION PLAN – Template 4.3 – (Rubric Indicator 4.3)Section B – Descriptively list the action you plan to take to ensure you will be able to progress toward your goal. Action steps are strategies and interventions, which should be scientifically based where possible, and include professional development, technology, communication, and parent and community involvement initiatives within the action steps of each goal.
Section C – For each of the Action Steps you list, give timeline, person(s) responsible, projected cost(s)/required resources, funding sources, evaluation strategy and performance results/outcomes. (For Evaluation Strategy, define how you will evaluate the action step.)
Timeline Person(s) Responsible
Required Resources
Projected Cost(s) & Funding Sources
Evaluation Strategy Performance Results / Outcomes
Action Step
Action Step
Action Step
Action Step
Tennessee School Improvement Planning Process Templates – August, 2007 Page 55 of 62

GOAL 5 – Action Plan DevelopmentTemplate 4.1 – (Rubric Indicator 4.1) Revised DATE: __________________________
Section A –Describe your goal and identify which need(s) it addresses. (Remember that your previous components identified the strengths and challenges/needs.)
Goal
Which need(s) does this Goal address?
How is this Goal linked to the system’s Five-Year Plan?
ACTION STEPS – Template 4.2 – (Rubric Indicator 4.2) IMPLEMENTATION PLAN – Template 4.3 – (Rubric Indicator 4.3)Section B – Descriptively list the action you plan to take to ensure you will be able to progress toward your goal. Action steps are strategies and interventions, which should be scientifically based where possible, and include professional development, technology, communication, and parent and community involvement initiatives within the action steps of each goal.
Section C – For each of the Action Steps you list, give timeline, person(s) responsible, projected cost(s)/required resources, funding sources, evaluation strategy and performance results/outcomes. (For Evaluation Strategy, define how you will evaluate the action step.)
Timeline Person(s) Responsible
Required Resources
Projected Cost(s) & Funding Sources
Evaluation Strategy Performance Results / Outcomes
Action Step
Action Step
Action Step
Action Step
Tennessee School Improvement Planning Process Templates – August, 2007 Page 56 of 62

Component 5 – The School Improvement Plan and Process EvaluationTEMPLATE 5.1: Process EvaluationEvidence of Collaborative Process – Narrative response requiredWhat evidence do we have that shows that a collaborative process was used throughout the entire planning process?
Fairmont’s stakeholders collaborate to insure the highest achievement and progress for all students. A very wide variety of collaborative methods assure ongoing improvements and continual school –wide dedication to the improvement process.
Collaborations for improvement plans actually begin in the year prior to the actions. Immediately after acquiring all summative and formative data information pieces, meetings are held to disaggregate newly acquired summative data and previously acquired formative data information. Staff development opportunities are designed based on data analysis and our school’s improvement plan. Summer and spring planning is vital to any real improvement planning. Each stakeholder group meets with minutes communicated to the other stakeholders. The common thread in these planning sessions is to assure positive improvement processes.
System level administration provides support for the school level staff development and various other research-based commitments. We set aside three summer days to provide staff development and learning team planning. Our staff uses whole faculty meeting times, curriculum group, site-base leadership, grade level teams and system vertical support teams to make our improvement plans an on-going process. The planning component committee chairs communicate to the schools’ stakeholders with newsletters, e-mails and minutes.
Evidence of collaborative processes:
Meetings with Agendas for Site Base, Climate, Grade Level, Curriculum and Vertical Teams
Minutes for the meetings listed above Newsletters, Classroom and school E-mailed weekly news Monthly parent news Monthly Parent Meetings Weekly teacher planning meetings Monthly Curriculum Meetings Monthly Teacher/Faculty Meetings Daily announcements Weekly Updates from the administration Daily folder communications to parents PTA Board Minutes Parent involvement Committee notes Conference Cards
Strengths:
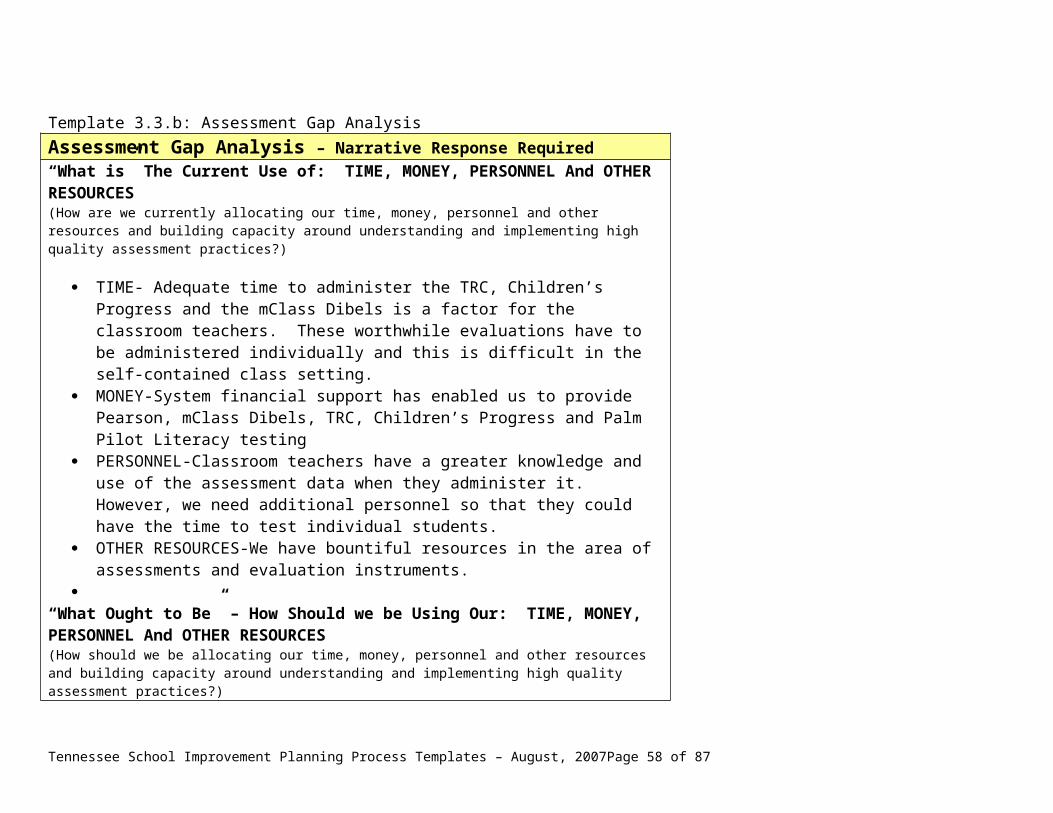
Evidence of Collaborative Process – Narrative response requiredTime devoted to planning by all stakeholdersCollaborative grade level planning
Area to Strengthen:Prompt feedback of various summative and formative data sources to parentsIncrease the communications between tutors and the classroom teachers
Evidence of Alignment of Data and Goals – Narrative response requiredWhat evidence do we have that proves alignment between our data and our goals?
We have carefully aligned our summative and formative data to link these findings to our school’s goals. Our goals are a reflection of the continuing and escalating requirements of NCLB in the accomplishment of 100% proficiency in Reading/Language and Math.
As students return in the fall, data for those children new to our school is collected from their transfer records. This data is formally communicated to the new student’s learning team. Teacher teams have common planning times for the purpose of aligning the new data to formulate plans and goals. Additionally teachers meet with vertical curriculum teams for further alignment of the additional data sources and to adjust goals. Any changes in the curriculum or state expectations are communicated and updated. Weekly teacher lesson plans are turned in to the administration for continual alignment and proof. The plans specifically address the state standards taught and strategies used. These plans note the correlation between classroom applications and state level expectations.
Fairmont is a school with a high SES accountability subpopulation and our goals are a reflection of this data. Our goals for 100% advancement in reading/language/ writing, and math align with the following data:
Some of the evidence used for the alignment includes the following: State Report Card TCAP disaggregated data Pearson Assessments Math/Reading/Language Vertical Team Skill Sequence Report Card Grades Stakeholder surveys Text and individual teacher formative data Teacher lesson plans Grade level Units Multiple school level formative evaluations
Tennessee School Improvement Planning Process Templates – August, 2007 Page 58 of 62
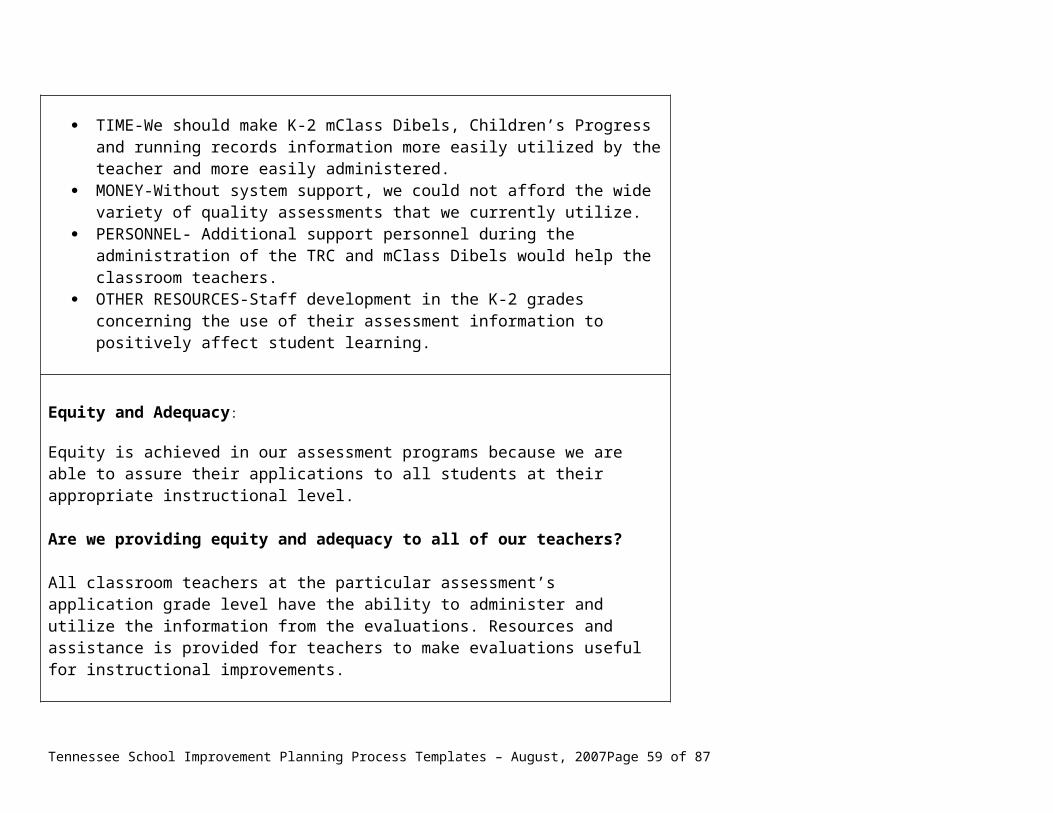
Evidence of Communication with All Stakeholders – Narrative response requiredWhat evidence do we have of our communication of the TSIPP to all stakeholders?
We communicate our TSIPP by posting it on our web site, reproducing it for stakeholders, presenting sections at each faculty meeting, and PTA meetings and other family engagement activities. We invite all our families, community members, and stakeholders to assume ownership by participating on at least one of the committees of the TSIPP. The principal presents a section to the public at each of our PTA monthly meetings. We publish sections in our monthly newsletter, “The Beeline”, so that we can be effective in communicating our SIP. The Title I News Letter each month communicates a focus on opportunities for families.
Evidence of Alignment of Beliefs, Shared Vision, and Mission with Goals – Narrative response requiredWhat evidence do we have that shows our beliefs; shared vision and mission in Component 2 align with our goals in Component 4?Our school’s mission, vision, and beliefs demonstrate our focus on excellence. Our high expectations are noted in our goals, which are aligned because of our consistency and continued lofty standards for the best in student achievement and accomplishment. The school’s vision, mission, goal, and focus are all dedicated to the advancement of our students in all core curriculum area. Fairmont addresses key areas with an additional emphasis on achieving the goals in reading/language/writing and math with the emphasis on the accountability sub group- SES and other subgroups, ELL and students with disabilities.
Evidence of Alignment of Action Steps with Curriculum, Instruction, Assessment and Organization – Narrative response requiredWhat evidence do we have that shows our action steps in Component 4 align with our analyses of the areas of curriculum, instruction, assessment and organization in Component 3?
Action steps are directly related to the school’s needs by communication in curriculum, instruction, assessment, and organization for additional materials for classroom teachers to support teaching accountability subgroups, continued extended learning opportunities, supportive technology for ELL, SES, and students with disabilities, and family engagement to reinforce student learning. The key to alignment is in consistent communication and setting up timely formal communication networks to align action steps to the analyses of curriculum, instruction, assessment and organization.
Tennessee School Improvement Planning Process Templates – August, 2007 Page 59 of 62
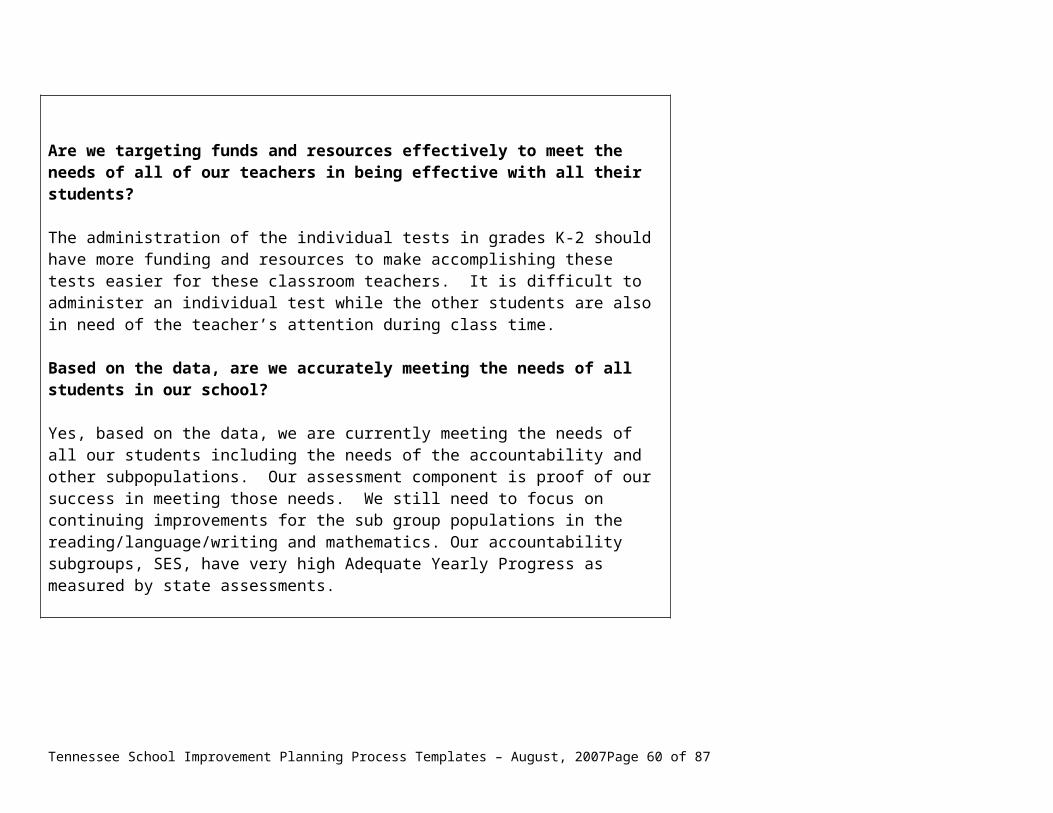
Suggestions for the Process – Narrative response requiredWhat suggestions do we have for improving our planning process?
Our planning process improvements incorporate both space and time. Our challenge is to find a space at the school site during school hours for stakeholders to gather. Since our school faces some serious space issues, finding a common place for stakeholder input and planning is quite a challenge. Meetings outside the school hours are often inconvenient because parents require childcare to attend meetings.
TEMPLATE 5.2: Implementation Evaluation(Rubric Indicator 5.2)Evidence of Implementation – Narrative response required What is our plan to begin implementation of the action steps?
We plan to implement the action steps immediately by advising the persons responsible for each action step and requiring each of them submit an individual plan for achievement of their particular assigned action development. Upon completion of this aspect, we will prepare the budget request for this action. Completion of the implementation should be in effect immediately so that we can positively affect student progress and achievement.
Evidence of the Use of Data – Narrative response requiredWhat is the plan for the use of data?
The data is used throughout the school year in every strand of our planning process and daily actions. Our plan for using the data is to document strengths and areas to strengthen. We continually adjust and realign as we accumulate formative assessment information. Our teams communicate this continual process and individual student information to parents and the community. As we assemble the information, we identify actions to address needs and celebrate successes. For the areas to strengthen, we monitor for re-teaching, strategy adjustment, instructional material selection, and individual student improvements as noted in formative and summative data.
TEMPLATE 5.3: Monitoring and Adjusting Evaluation (Rubric Indicator 5.3)Evidence of Monitoring Dates – Narrative response requiredWhat are the calendar dates (Nov/Dec and May/June) when the School Leadership Team will meet to sustain the Tennessee School Improvement Planning Process? Identify the person(s) responsible for monitoring and the role they will play in the monitoring process.
The SIP Leadership team will begin in the spring to gather end of year data. The team will meet
Tennessee School Improvement Planning Process Templates – August, 2007 Page 60 of 62

with grade level teams and stake holders. This spring the SIP team planning date will be May 11, 2011 for the purpose of on-going, process renewal. Next fall the SIP team will meet initially in August on the third Wednesday and on the third Wednesday thereafter each month at 3:30 p.m. The team chairs will be the Site Base Team. The persons responsible for monitoring will be Carol McGill, principal, Dr. Robbie Anderson, Supervisor of Elementary Education, Laura Henderson, Guidance Counselor, Amanda Smith, ELL instructor, and Susan Bolton, Resource teacher.
Evidence of a Process for Monitoring Plan – Narrative response required What will be the process that the School Leadership Team will use to review the analysis of the data from the assessments and determine if adjustments need to be made in our plan?Student achievement data will be disaggregated by grade, subject, subgroup, and individual student. The team will record, analyze trends and make notes concerning specific skill strengths and areas to strengthen. We have created a document to organize and record this information. This informational process is accomplished with the classroom teachers. All information is assembled and communicated to the parents, and all stakeholders at the first PTA meeting with updates at each monthly meeting thereafter. The goals and action plans are adjusted to meet the changing needs as demonstrated by updating the SIP. Weekly planning meetings will be held to determine the appropriate adjustments to reflect new information. Additionally, our school has hosted three community forums for input during our recent building process. We have made a dedicated effort to have at least one additional parent education-engagement opportunity each month for parent input and parent education on current curricular changes and current program implementations.
Evidence of a Process for Adjusting Plan – Narrative response requiredWhat will be the process that the School Leadership Team will use for adjusting our plan (person(s) responsible, timeline, actions steps, resources, evaluation strategies) when needed?
Ms. McGill, principal, will be responsible for the adjustment process in developing the new timeline, action steps, resources, evaluation, and strategies to reflect updated student achievement data. Ms. Henderson and Ms. Bolton will be responsible for each strategy to accomplish Goal 1. Ms. Smith and Ms. McGill will be responsible for each strategy to accomplish Goal 2. The process will follow the SIP planning format. The team committee will meet to discuss data and reveal their plan for addressing new areas of need or adjusting for new data successes. The team meets in cooperation with the classroom teachers. Our philosophy is that the most direct link to affecting student learning is the classroom teacher. Each teacher will meet at their team planning with the SIP team to discuss data revelations and their contributions to strategy improvement.
Evidence of a Plan for Communicating to All Stakeholders – Narrative response requiredHow will the School Leadership Team communicate success/adjustments of the plan to stakeholders and solicit
Tennessee School Improvement Planning Process Templates – August, 2007 Page 61 of 62

ongoing input from stakeholders?
Formally, we communicate successes and adjustments in several ways: Post updated SIP information on our school’s web site Share updated data, plans and information formally at our monthly parent meeting E-mail minutes of meetings to team chairs and committee members Provide written summaries in each of the school’s monthly newsletters to each home in
the form of letters to parents Gather information through stakeholder surveys, conferences and small group meetings Have parents do on-line questionnaires PTA Newsletters, Title I News (monthly) and other Weekly Bulletins School wide
Tennessee School Improvement Planning Process Templates – August, 2007 Page 62 of 62