tenth annual chile conference santander · santander global banking & markets. 2 company...
TRANSCRIPT

Tenth Annual Chile Conference Santander GLOBAL BANKING & MARKETS
2
Company Overview
Investment Plan
Outlook for 2009-2010
AGENDA
3
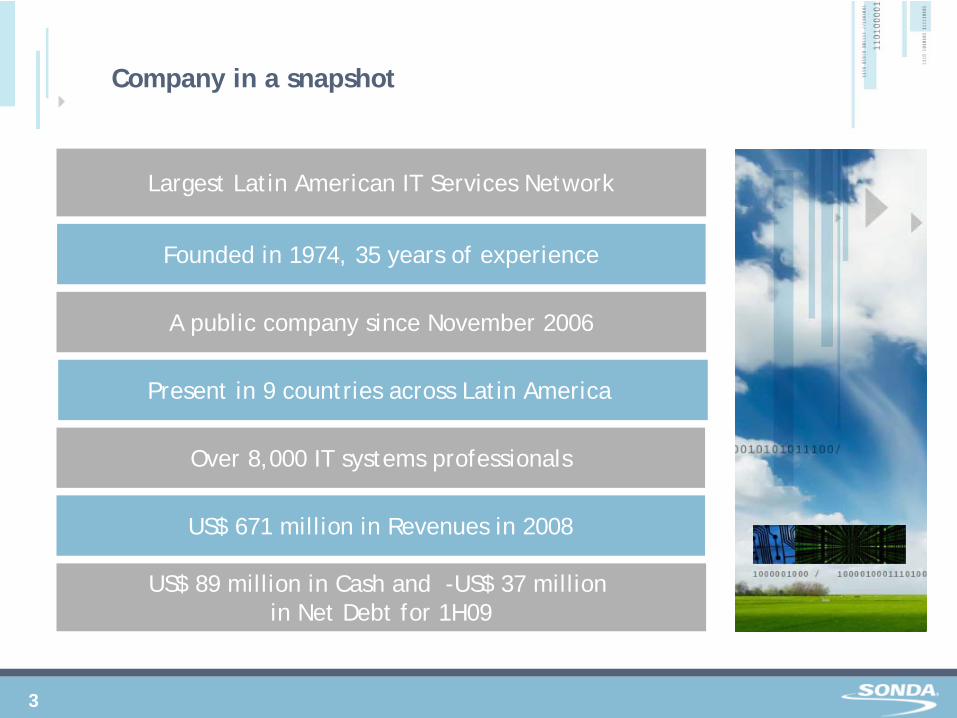
Company in a snapshot
Largest Latin American IT Services Network
Founded in 1974, 35 years of experience
Present in 9 countries across Latin America
A public company since November 2006
Over 8,000 IT systems professionals
US$ 671 million in Revenues in 2008
US$ 89 million in Cash and -US$ 37 million in Net Debt for 1H09
4
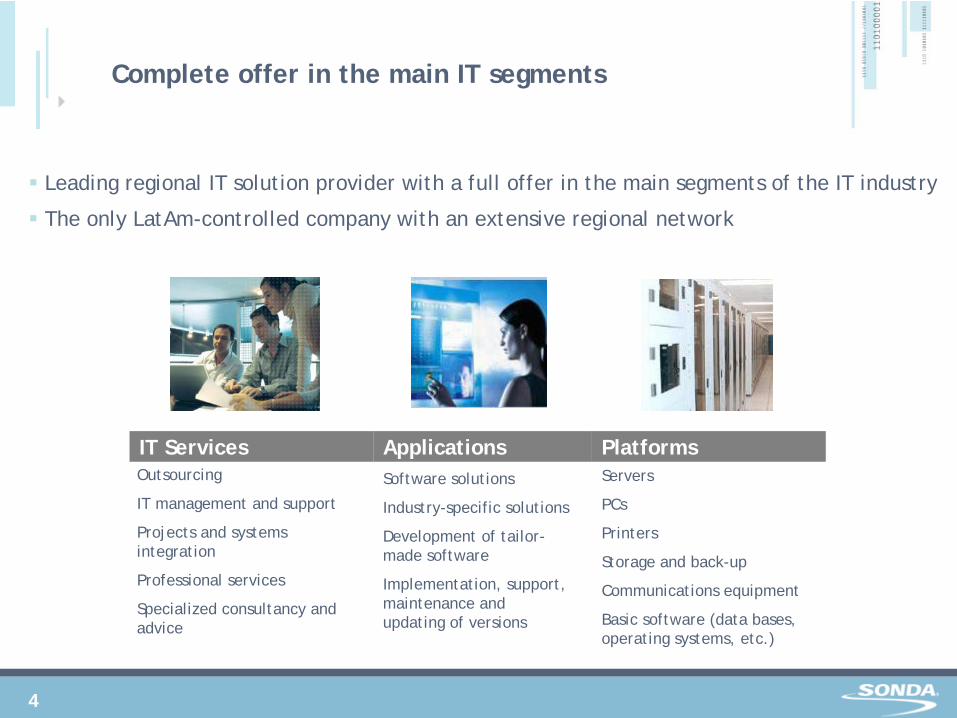
Leading regional IT solution provider with a full offer in the main segments of the IT industry
The only LatAm-controlled company with an extensive regional network
Complete offer in the main IT segments
IT Services Applications PlatformsOutsourcing
IT management and support
Projects and systems integration
Professional services
Specialized consultancy and advice
Software solutions
Industry-specific solutions
Development of tailor- made software
Implementation, support, maintenance and updating of versions
Servers
PCs
Printers
Storage and back-up
Communications equipment
Basic software (data bases, operating systems, etc.)
5
CHILE
COLOMBIA
ECUADOR
MEXICO
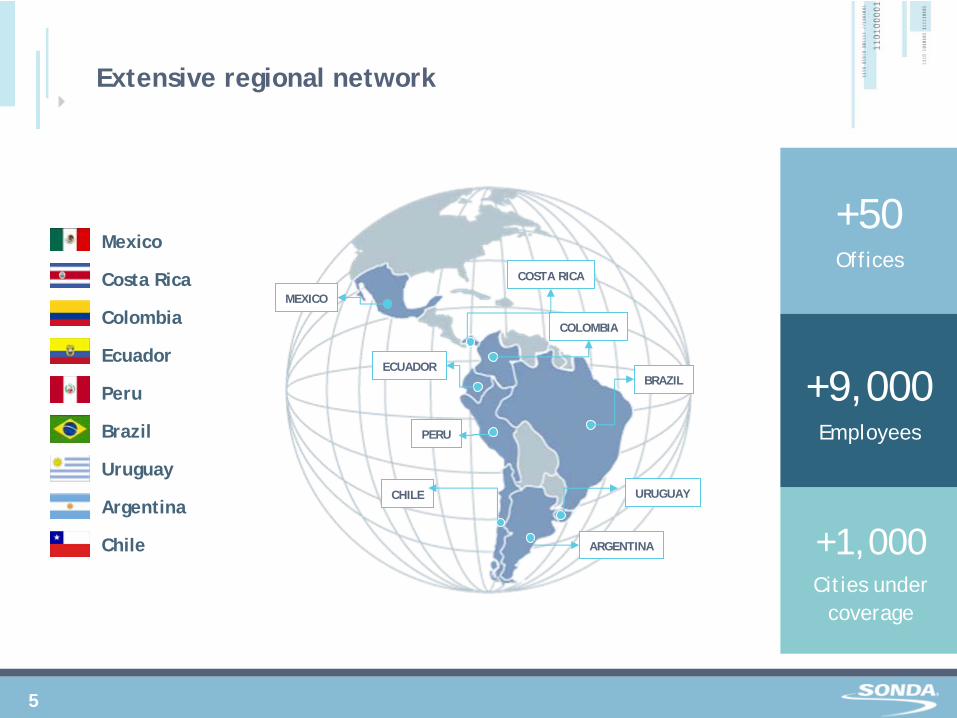
+9,000Employees
+1,000Cities under
coverage
BRAZIL
PERU
ARGENTINA
COSTA RICA
URUGUAY
Extensive regional network
+50Offices
Mexico
Costa Rica
Colombia
Ecuador
Peru
Brazil
Uruguay
Argentina
Chile
6
Leading regional Full IT Solution Provider
Leader in Systems Integration projects, Technical Support and IT Outsourcing
Positioned in the corporate market as an independent full IT services provider, with world class credentials and certifications
Vast experience delivering large-scale projects with important social and economic impact
Business model based on the development of long-term relationships and proximity to customers
US$ 350 million Investment plan intended to consolidate its
leading position in the region
Positive financial results driven by successful regional expansion, increase of value added services and strengthening of the revenue backlog
7
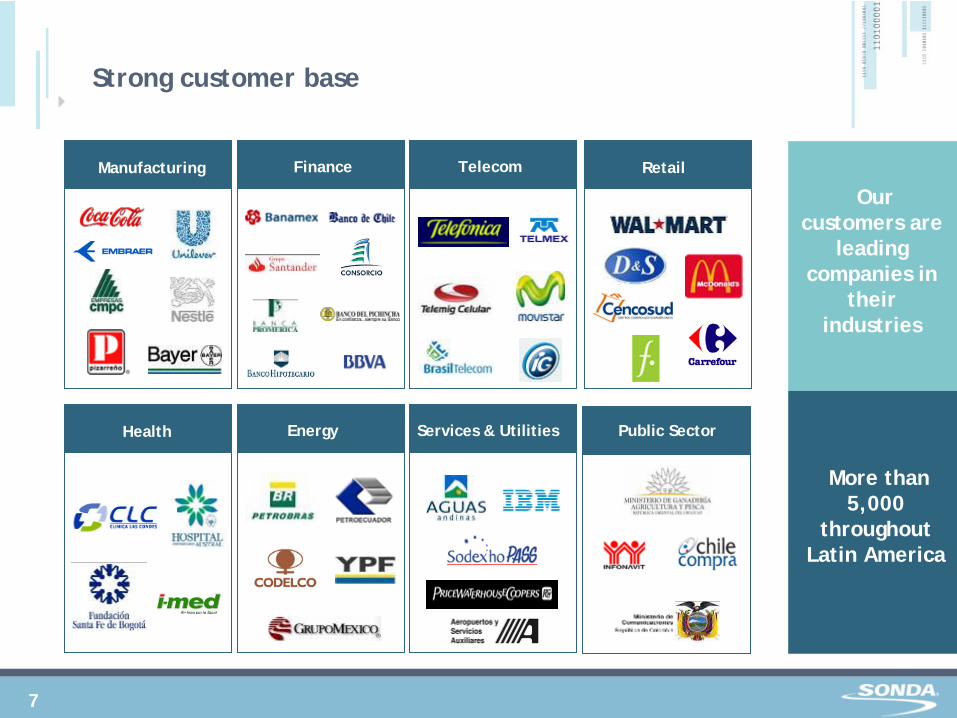
Our customers are
leading companies in
their industries
More than 5,000
throughout Latin America
Strong customer base
Manufacturing Finance Telecom Retail
Public SectorHealth Energy Services & Utilities
8
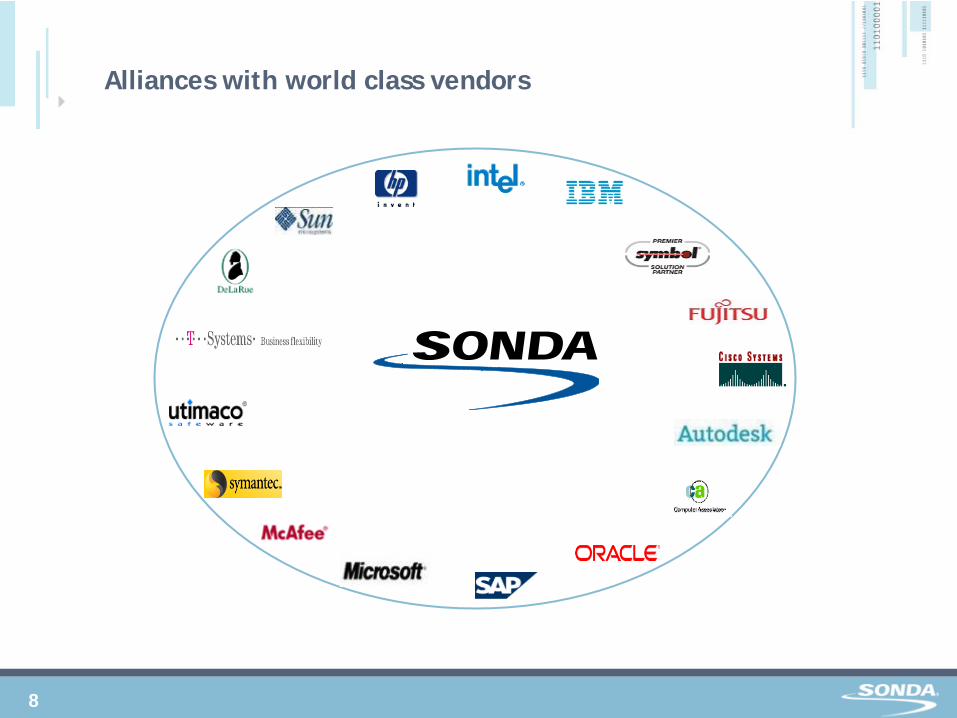
Alliances with world class vendors
9
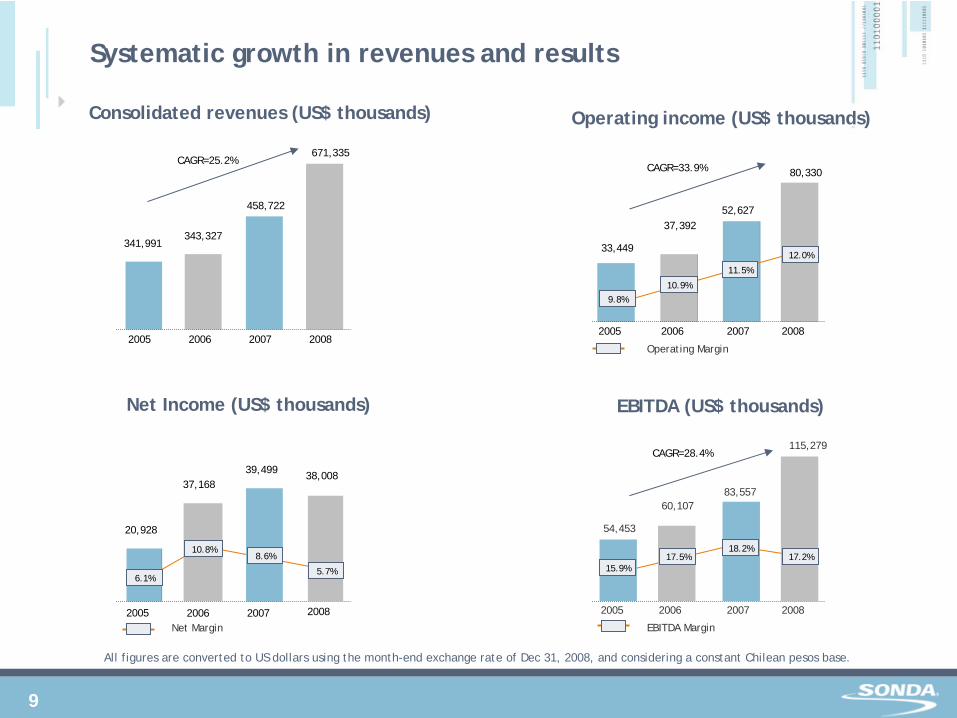
Consolidated revenues (US$ thousands) Operating income (US$ thousands)
Net Income (US$ thousands) EBITDA (US$ thousands)
All figures are converted to US dollars using the month-end exchange rate of Dec 31, 2008, and considering a constant Chilean pesos base.
Systematic growth in revenues and results
2005 2006 2007 2008
CAGR=25.2%
341,991343,327
458,722
671,335CAGR=33.9%
2005 2006 2007 2008
33,449
37,39252,627
80,330
9.8%
10.9%
11.5%
12.0%
Operating Margin
EBITDA Margin
CAGR=28.4%
2005 2006 2007 2008
54,453
60,10783,557
115,279
15.9%17.5%
18.2%17.2%
2005 2006 2007 2008
20,928
37,16839,499 38,008
6.1%
10.8%8.6%
5.7%
Net Margin
10
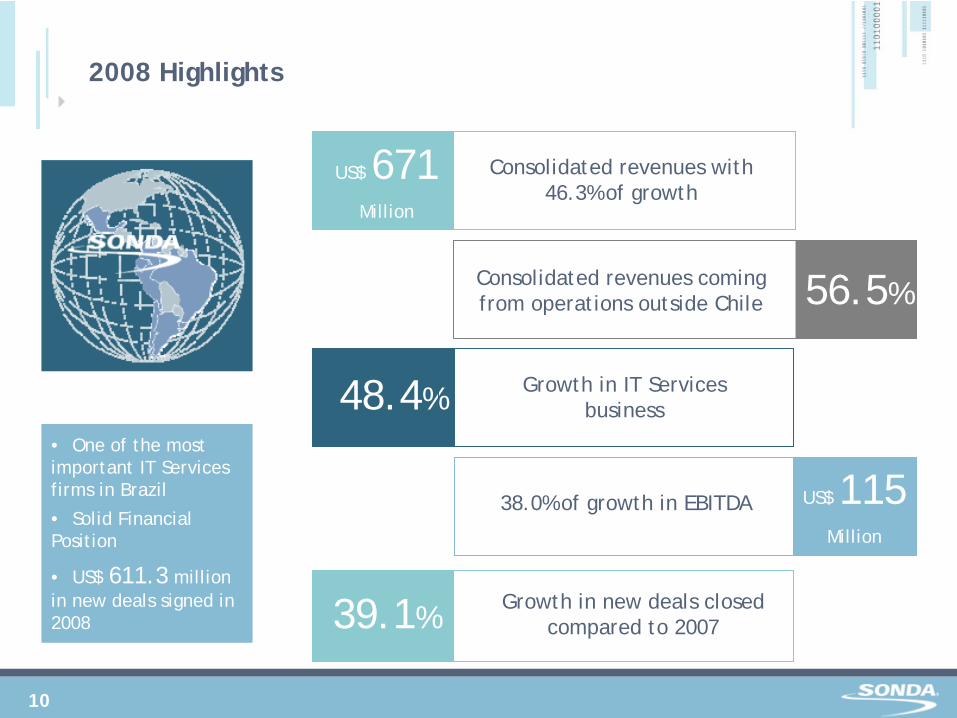
2008 Highlights
149.4%
56.5%Consolidated revenues coming from operations outside Chile
US$ 671 Million
Consolidated revenues with 46.3% of growth
48.4% Growth in IT Services business
39.1%Growth in new deals closed
compared to 2007
38.0% of growth in EBITDA
• One of the most important IT Services firms in Brazil
• Solid Financial Position
• US$ 611.3 million in new deals signed in 2008
US$ 115 Million
11
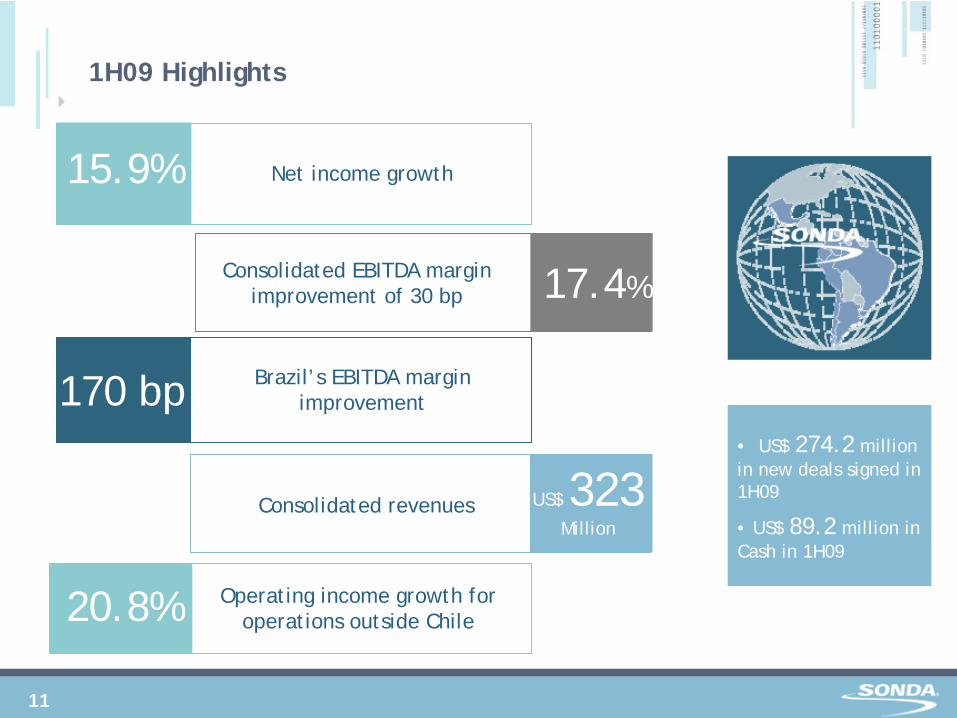
1H09 Highlights
17.4%Consolidated EBITDA margin
improvement of 30 bp
15.9% Net income growth
170 bp Brazil’s EBITDA margin improvement
Operating income growth for operations outside Chile
US$ 323Million
Consolidated revenues
20.8%
• US$ 274.2 million in new deals signed in 1H09
• US$ 89.2 million in Cash in 1H09
12
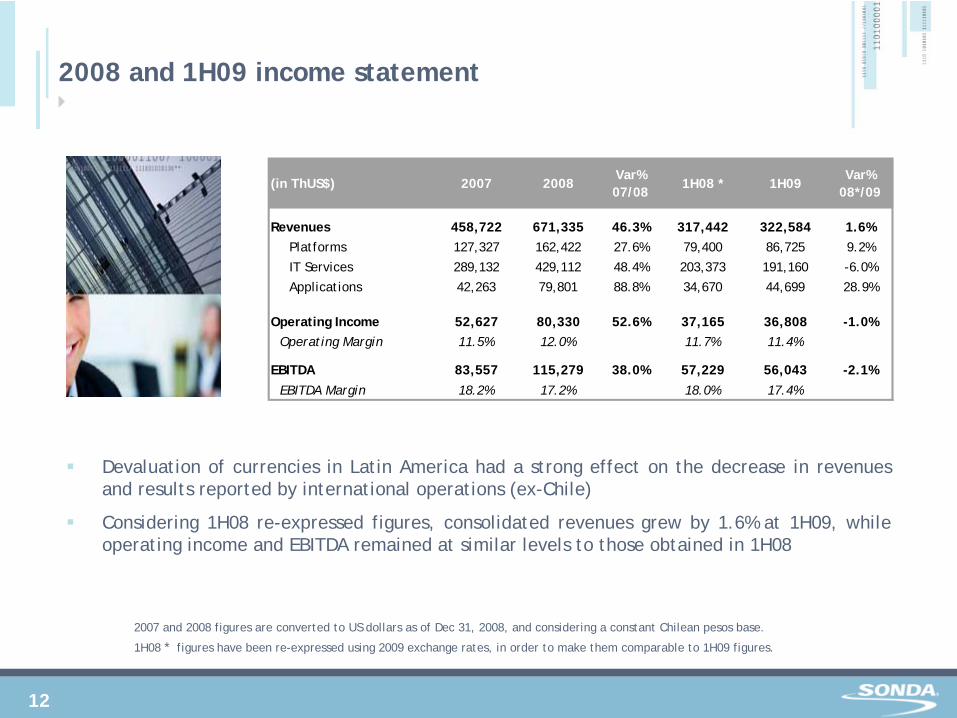
2008 and 1H09 income statement
Devaluation of currencies in Latin America had a strong effect on the decrease in revenues and results reported by international operations (ex-Chile)
Considering 1H08 re-expressed figures, consolidated revenues grew by 1.6% at 1H09, while operating income and EBITDA remained at similar levels to those obtained in 1H08
2007 and 2008 figures are converted to US dollars as of Dec 31, 2008, and considering a constant Chilean pesos base.
1H08 * figures have been re-expressed using 2009 exchange rates, in order to make them comparable to 1H09 figures.
(in ThUS$) 2007 2008Var% 07/08
1H08 * 1H09Var%
08*/09
Revenues 458,722 671,335 46.3% 317,442 322,584 1.6%Platforms 127,327 162,422 27.6% 79,400 86,725 9.2%
IT Services 289,132 429,112 48.4% 203,373 191,160 -6.0%
Applications 42,263 79,801 88.8% 34,670 44,699 28.9%
Operating Income 52,627 80,330 52.6% 37,165 36,808 -1.0%Operating Margin 11.5% 12.0% 11.7% 11.4%
EBITDA 83,557 115,279 38.0% 57,229 56,043 -2.1%EBITDA Margin 18.2% 17.2% 18.0% 17.4%
13
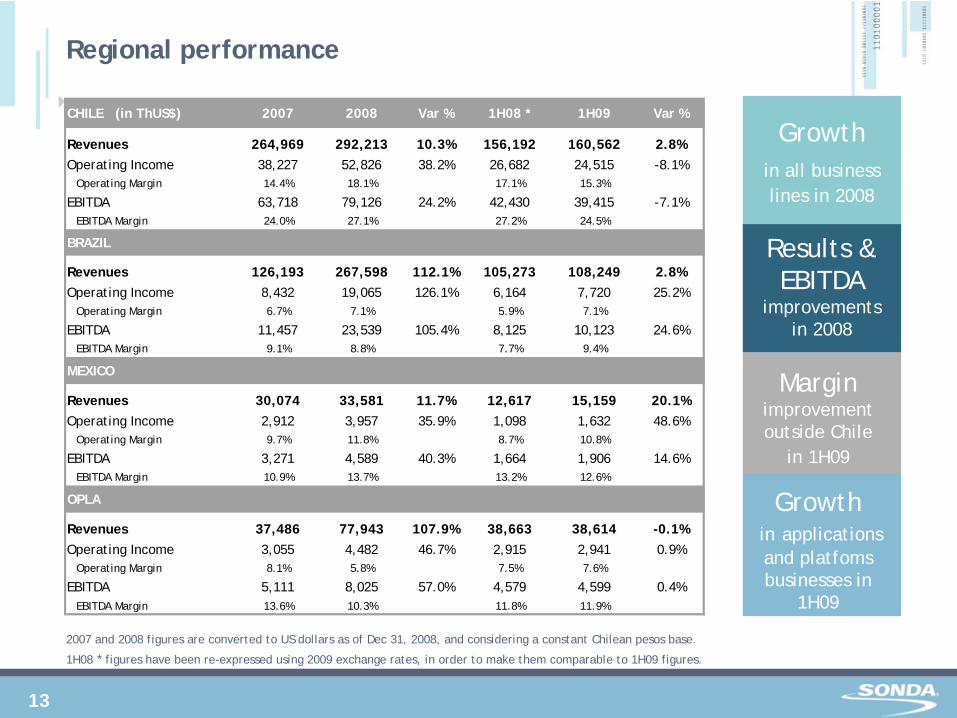
Regional performance
2007 and 2008 figures are converted to US dollars as of Dec 31, 2008, and considering a constant Chilean pesos base.
1H08 * figures have been re-expressed using 2009 exchange rates, in order to make them comparable to 1H09 figures.
Growth in all business lines in 2008
Growthin applications and platfoms businesses in
1H09
Margin improvement outside Chile
in 1H09
Results & EBITDA
improvements in 2008
CHILE (in ThUS$) 2007 2008 Var % 1H08 * 1H09 Var %
Revenues 264,969 292,213 10.3% 156,192 160,562 2.8%Operating Income 38,227 52,826 38.2% 26,682 24,515 -8.1%
Operating Margin 14.4% 18.1% 17.1% 15.3%
EBITDA 63,718 79,126 24.2% 42,430 39,415 -7.1%EBITDA Margin 24.0% 27.1% 27.2% 24.5%
BRAZIL
Revenues 126,193 267,598 112.1% 105,273 108,249 2.8%Operating Income 8,432 19,065 126.1% 6,164 7,720 25.2%
Operating Margin 6.7% 7.1% 5.9% 7.1%
EBITDA 11,457 23,539 105.4% 8,125 10,123 24.6%EBITDA Margin 9.1% 8.8% 7.7% 9.4%
MEXICO
Revenues 30,074 33,581 11.7% 12,617 15,159 20.1%Operating Income 2,912 3,957 35.9% 1,098 1,632 48.6%
Operating Margin 9.7% 11.8% 8.7% 10.8%
EBITDA 3,271 4,589 40.3% 1,664 1,906 14.6%EBITDA Margin 10.9% 13.7% 13.2% 12.6%
OPLA
Revenues 37,486 77,943 107.9% 38,663 38,614 -0.1%Operating Income 3,055 4,482 46.7% 2,915 2,941 0.9%
Operating Margin 8.1% 5.8% 7.5% 7.6%
EBITDA 5,111 8,025 57.0% 4,579 4,599 0.4%EBITDA Margin 13.6% 10.3% 11.8% 11.9%
14
Company Overview
Investment Plan
Outlook for 2009-2010
AGENDA
15
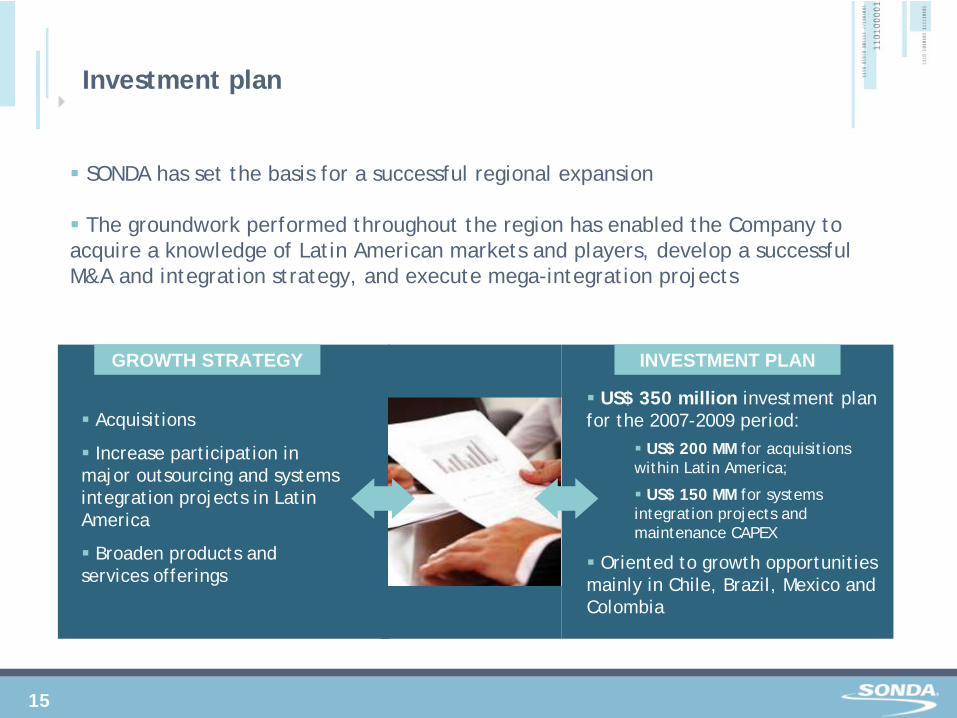
SONDA has set the basis for a successful regional expansion
The groundwork performed throughout the region has enabled the Company to acquire a knowledge of Latin American markets and players, develop a successful M&A and integration strategy, and execute mega-integration projects
Investment plan
Acquisitions
Increase participation in major outsourcing and systems integration projects in Latin America
Broaden products and services offerings
GROWTH STRATEGY
US$ 350 million investment plan for the 2007-2009 period:
US$ 200 MM for acquisitions within Latin America;
US$ 150 MM for systems integration projects and maintenance CAPEX
Oriented to growth opportunities mainly in Chile, Brazil, Mexico and Colombia
INVESTMENT PLAN
16
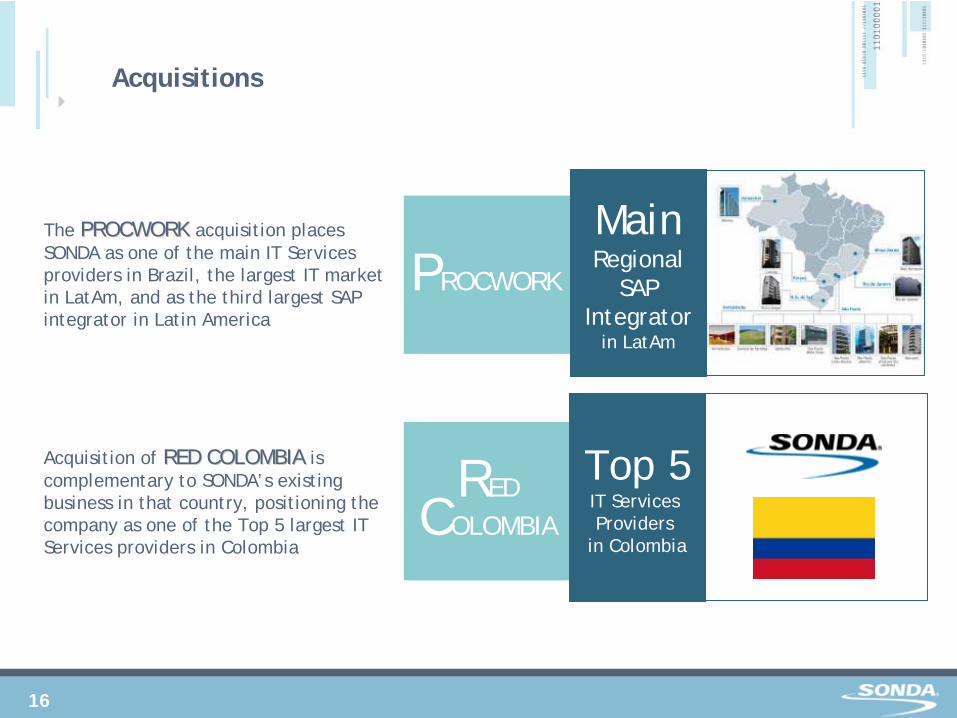
Acquisitions
PROCWORK
REDCOLOMBIA
The PROCWORK PROCWORK acquisition places SONDA as one of the main IT Services providers in Brazil, the largest IT market in LatAm, and as the third largest SAP integrator in Latin America
Acquisition of RED COLOMBIARED COLOMBIA is complementary to SONDA’s existing business in that country, positioning the company as one of the Top 5 largest IT Services providers in Colombia
Top 5IT Services Providers
in Colombia
Main Regional
SAP Integrator
in LatAm
17
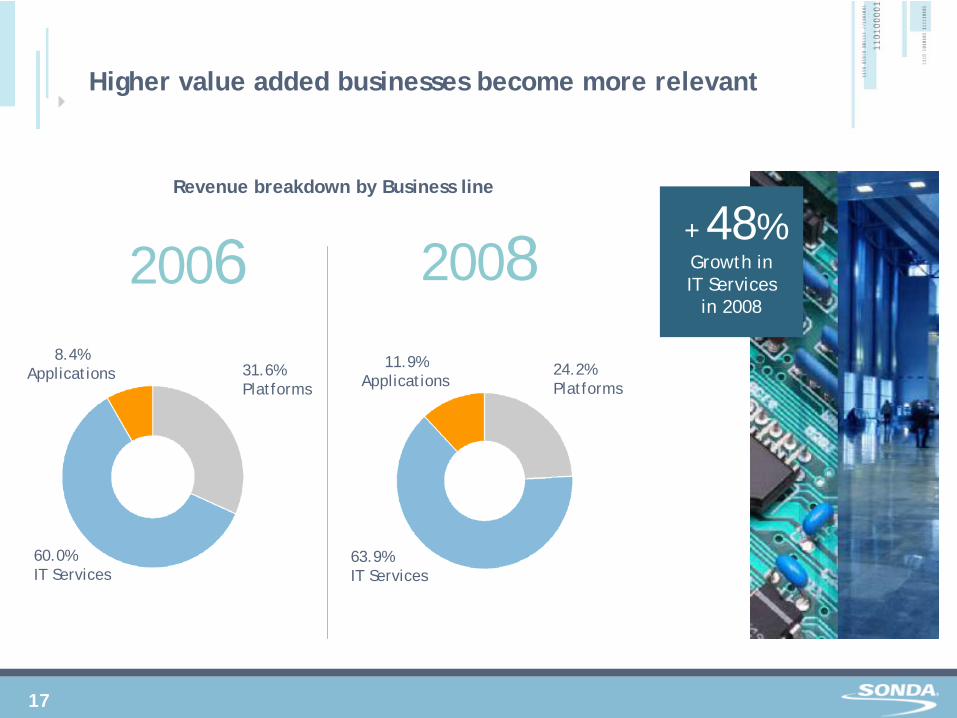
Higher value added businesses become more relevant
2006 2008Revenue breakdown by Business line
31.6%Platforms
60.0%IT Services
8.4%Applications 24.2%
Platforms
63.9%IT Services
11.9%Applications
+ 48%Growth in IT Services
in 2008
18
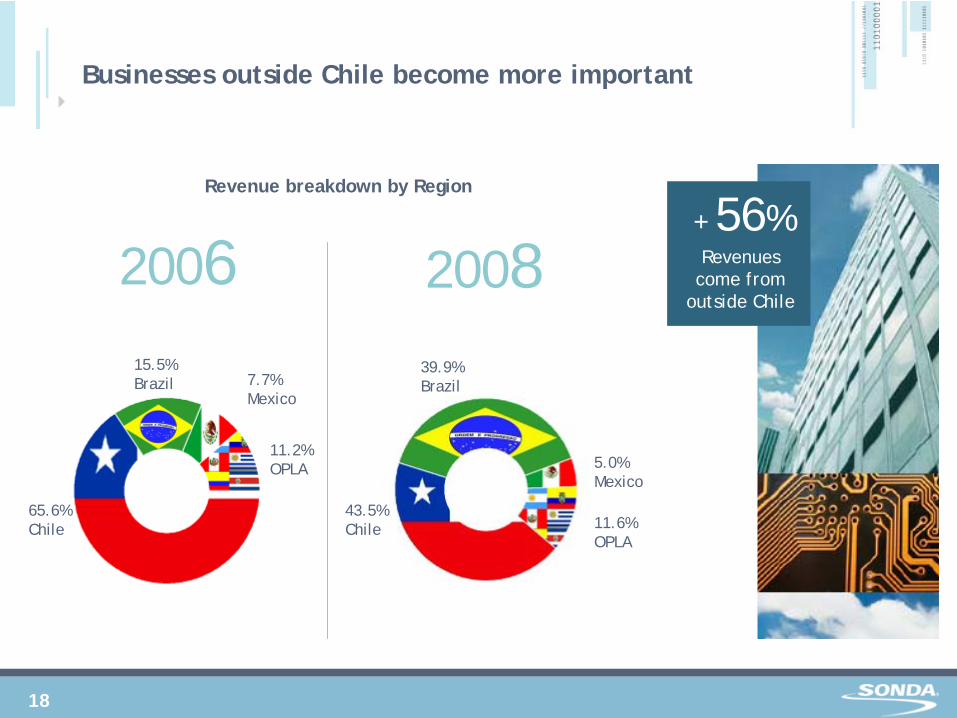
43.5%Chile
5.0%Mexico
11.6%OPLA
39.9%Brazil
65.6%Chile
7.7%Mexico
11.2%OPLA
15.5%Brazil
2006Revenue breakdown by Region
Businesses outside Chile become more important
2008+ 56%Revenues
come from outside Chile
19
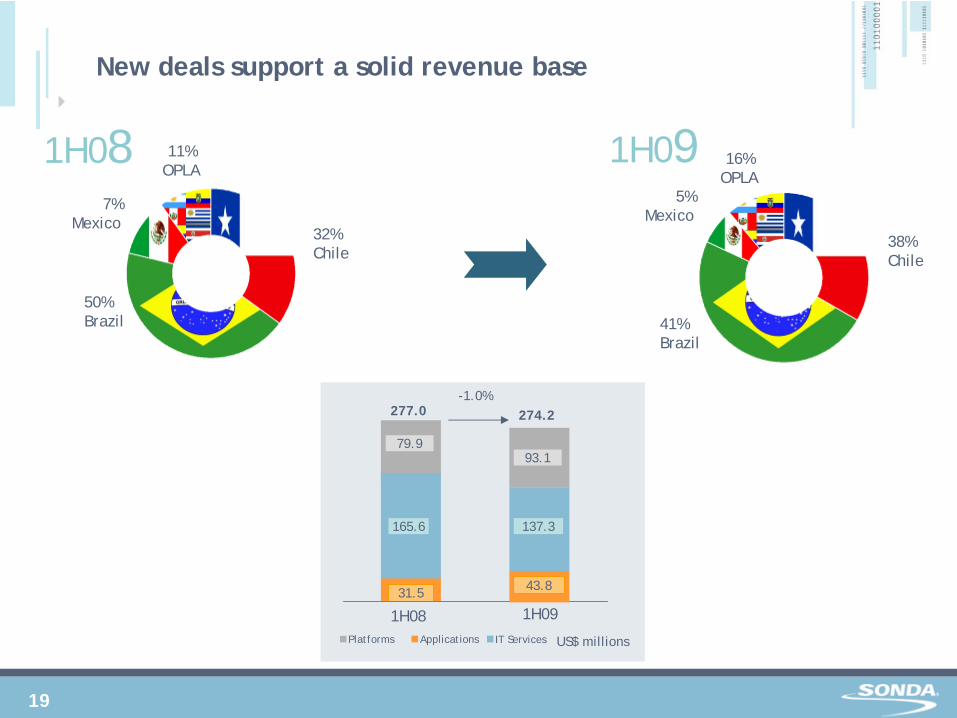
32%Chile
50%Brazil
7%Mexico
11%OPLA
38%Chile
41%Brazil
5%Mexico
16%OPLA
New deals support a solid revenue base
1H08 1H09
Platforms Applications IT Services
79.9
31.5
165.6
93.1
137.3
1H08 1H09
277.0 274.2-1.0%
US$ millions
43.8
20
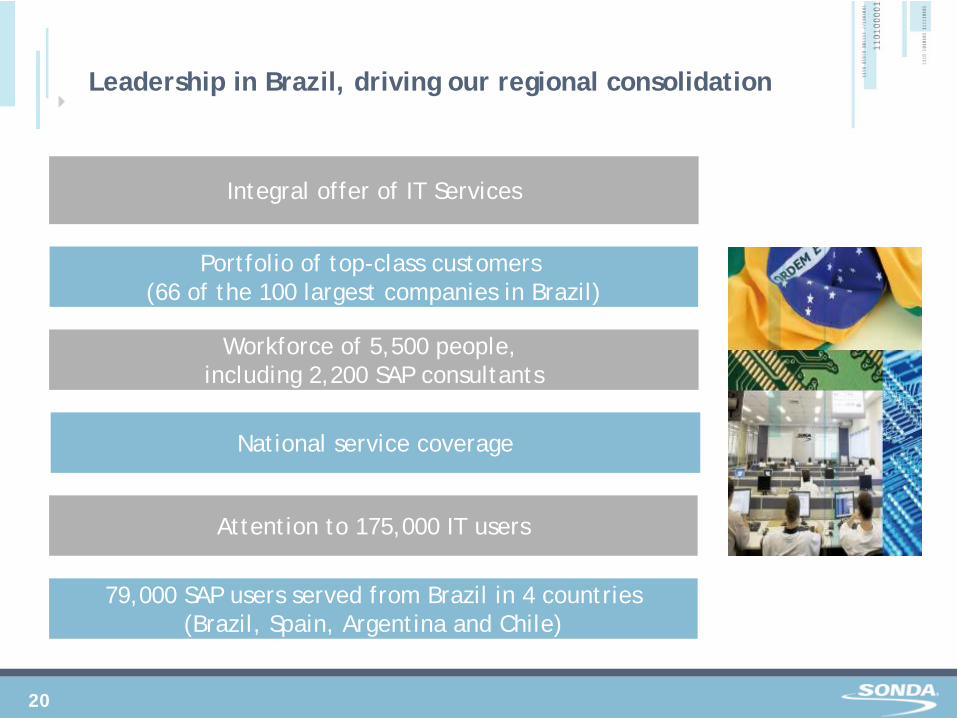
Leadership in Brazil, driving our regional consolidation
Integral offer of IT Services
Portfolio of top-class customers (66 of the 100 largest companies in Brazil)
National service coverage
Workforce of 5,500 people, including 2,200 SAP consultants
Attention to 175,000 IT users
79,000 SAP users served from Brazil in 4 countries(Brazil, Spain, Argentina and Chile)
21
Company Overview
Investment Plan
Outlook for 2009-2010
AGENDA
22
1 Relevant actor in the Brazilian
IT Services Industry
2 Solid financial position with
adequate level of cash and low debt
4 Deepening relationship with
customer base and increase IT services cross-selling
3 Focus on offering and selling
full IT outsourcing services
5 New contracts support a solid
revenue base for next years
6 Organic growth and new
acquisitions in line with regional strategy
7 Developing regional business
with clients that would maximize the use of our services network
8 Growth of 8.4% in IT industry
in Latam for 2010, according to IDC forecast
Outlook for 2009-2010
9 Take advantage of synergies
and opportunities to improve margins
23
Tel (56-2) 657 50 00 Fax (56-2) 657 54 10 Teatinos 500,Santiago, CHILEwww.SONDA.com