tenure and ceo pay - yale universitydepot.som.yale.edu/icf/papers/fileuploads/2701/... ·...
TRANSCRIPT
Electronic copy available at: http://ssrn.com/abstract=1626950
Tenure and CEO Pay
Martijn Cremersa and Darius Palia
b
August 2011
Abstract
This paper studies how the CEO pay level and pay-performance sensitivity vary with her tenure
in the firm. Predictions of four theories are considered: entrenchment, learning, career concerns
and dynamic contracting hypotheses. We document a positive association between tenure and
CEO pay levels, and an analogous positive relation between tenure and the CEO‟s pay-
performance sensitivity. Pay levels of CEOs hired from inside the firm goes up twice as fast with
tenure compared to CEOs hired from inside the firm, and CEOs with higher CEO Pay Slice or
Gindex have a much stronger tenure-pay level association. Therefore, results for pay levels
clearly support the entrenchment hypothesis. Results are also generally consistent with the career
concerns and the dynamic contracting hypotheses.
a Yale School of Management, and
b Rutgers Business School, respectively. We thank Alex Edmans, Xavier Gabaix,
and Zhiguo He for helpful comments. Palia gratefully acknowledges partial financial support from the Thomas A.
Renyi Chair in Banking. All errors remain our responsibility. Corresponding author: Martijn Cremers, Yale School
of Management, International Center for Finance, 135 Prospect Street, New Haven, CT, 05620;
Electronic copy available at: http://ssrn.com/abstract=1626950
1
1. Introduction
There has been considerable academic attention for the relationship between a CEO‟s
pay and performance (Jensen and Murphy 1990, Hall and Leibman 1998, Bebchuk and Fried
2004, among many others). Whereas these studies have focused on whether CEO pay is
optimally set or not, we empirically examine how CEO pay varies over a CEO’s tenure. Murphy
(1986) and Gibbons and Murphy (1992) examine the correlation between stock returns and a
CEO‟s salary and bonus pay using data from the 1970s-80s, when the incidence of options was
very low and was generally not reported.1 As Perry and Zenner (2001) show, CEO pay has
changed substantially from the 1980s to the 1990s, with a much higher reliance on option and
(restricted) share grants.
Accordingly, this paper makes the following contributions to the existing literature. First,
we are the first to examine how both pay levels and pay-performance sensitivities vary over the
CEO‟s tenure. Using a large data set from 1992-2007, we test four possible hypotheses from the
extant literature: entrenchment, learning, career concerns and dynamic contracting.2 Second, we
examine whether the relationship between pay and tenure is different for share versus option
grants. Third, we examine if the relationship depends on the quality of the firm‟s information
environment. Fourth, we analyze if the relationship is different between CEOs hired from the
inside and hired from the outside. Finally, we examine if corporate governance mechanisms are
significantly associated with the pay-tenure relationship.
Under the entrenchment hypothesis of Bebchuk and Fried (2004), entrenched managers
have too much power over their boards and consequently can set their own compensation to the
detriment of their own shareholders. More powerful CEOs can increase their pay and make it
1In a smaller subsample of 73 manufacturing firms for the period 1964-1983, Murphy (1986) finds that 40% of
CEOs with the less than 4.6 years of tenure received options, when compared to 28% (27%) for CEOs with tenure
between 4.6 years and 9 years (for CEOs greater than 9 years). 2 For detailed explanations of each of the theories and their predictions see Section 2 of this paper.

2
less sensitive to firm performance. Assuming that CEOs with longer tenure are more likely to be
entrenched (and vice versa), then the entrenchment hypothesis suggests a positive effect on the
pay level-tenure relationship, and a negative effect on the pay sensitivity-tenure relationship.
Whereas the entrenchment hypothesis is clearly non-optimal from a shareholder‟s
perspective, the next three hypotheses are based on the optimal contracting literature. The second
hypothesis is based on learning about CEO ability and is derived by Murphy (1986). Under this
theory, shareholders and the board learn about the CEO‟s managerial over time by observing
firm performance. As a result of this learning, deviations from expected performance are more
likely to come from random fluctuations rather than from unknown managerial ability in the later
years of a CEO‟s tenure, such that the firm optimally chooses lower pay-performance sensitivity
with increased tenure. This effect would be larger for outsider CEOs or if the firm‟s information
environment is less opaque. In addition, the pay level of an executive increases with experience
as shareholders efficiently update their CEO‟s ability.
Under the career concerns hypothesis of Gibbons and Murphy (1992), the optimal
contract is a trade-off between explicit incentives and implicit contracts such as career concerns.
According to this theory, CEOs are incentivized early in their career by establishing their
reputation in the labor market, which could partially substitute for a higher explicit incentive
contract. Later on in their career, CEOs are given a higher explicit pay-performance sensitivity to
compensate for reduced career concerns. Learning about CEO skill thus translates into a positive
correlation between the CEO‟s pay-performance sensitivity and tenure.
Finally, we examine the dynamic contracting hypothesis of Edmans, Gabaix, Sadzik and
Sannikov (2009), wherein the rewards to exerting managerial effort are spread across all future
periods to achieve intertemporal risk sharing. A higher pay level and greater pay-performance
sensitivity is required as tenure increases, because a risk-averse more-experienced CEO gets less

3
utility from an increase in wealth as she is forced to consume it over fewer periods. As a result,
the required lifetime rewards increase over time as well. Their model derives that both the CEO‟s
pay level and the pay-performance sensitivity level increase with tenure.
We find the following results, consistently showing tenure to have a significant
association with both CEO pay levels and pay-performance sensitivities:
1. A positive association of tenure and the level of CEO pay, which is consistent with the
entrenchment, learning, and dynamic contracting hypotheses.
2. A positive relation between tenure and the CEO‟s total pay-performance sensitivity. This is
consistent with the dynamic contracting and career concerns hypotheses.
3. The information environment of firms has no significant association with the CEO pay level
and tenure relation, or with the pay-performance sensitivity and tenure relation. Outside
CEOs have a higher pay-performance-sensitivity than inside CEOs over her tenure. These
results are generally consistent with the entrenchment hypothesis and not with the learning
hypothesis.
4. Considering corporate governance arrangements and the level of pay and tenure association,
firms with high CPS or high Gindex tend to have considerably stronger CEO pay–tenure
associations than firms with low CPS or low Gindex, consistent with the entrenchment
hypothesis. The impact of governance on the sensitivity – tenure association is mixed.
In summary, our results diverge for pay levels versus pay-performance sensitivity.
Results for pay levels strongly support the entrenchment hypothesis, and are inconsistent with
the learning hypothesis. They are also consistent with the dynamic contracting hypothesis, which
could co-exist with the entrenchment hypothesis. For pay-performance sensitivity, the results are
most consistent with the career concerns and dynamic contracting hypotheses, and inconsistent
with the learning. Assuming that entrenched CEOs mostly care about pay levels and do not

4
attempt to use any bargaining power vis-à-vis the board to change their incentive structure, the
overall evidence supports the entrenchment hypothesis. If managers in low governance firms
have greater flexibility in smoothing out her on-the-job compensation, then these results are also
consistent with He (forthcoming).
The paper proceeds as follows. In Section 2, we explain in detail the theories proposing
testable hypotheses about the association of CEO tenure and pay. Section 3 describes our data
sources and variables, and Section 4 presents our empirical tests and results. We conclude in
Section 5.
2. Theories and their predictions on the tenure-pay relations
This section explains the four theories that have been posited in the previous literature to
explain the association between CEO tenure and pay. These theories are managerial
entrenchment, learning, career concerns and dynamic contracting. In doing so, we explain their
unambiguous predictions with respect to the level of CEO pay, the pay-performance sensitivity,
whether the relationships are affected by the quality of the firm‟s information environment and
corporate governance mechanisms, and whether the CEO is hired from the inside or outside.3 All
the predicted relationships are summarized in Table 1.
***Table 1***
2.1 Entrenchment
Bebchuk and Fried (2004) proposed that entrenched managers have too much power vis-à-
vis their boards and can set their own pay, preferring to make it less sensitive to firm
performance. Accordingly, under this hypothesis the longer the CEO is in power, the more
3 We do not focus on the impact of tenure on the relationship between firm performance and CEO turnover. Dikolli,
Mayew, and Nanda (2010) find that the performance-turnover relationship declines in tenure.
5
entrenched she would seem to be, resulting in a higher pay level and lower pay-performance
sensitivity.
The effect of opaqueness of the firm‟s information environment could have ambiguous
effects on the tenure-pay relation. On the one hand, more opaque firms are might require more
monitoring by boards and shareholders which would predict a less positive impact on the tenure-
pay level relationship and a more positive impact on the CEO‟s pay-performance sensitivity in
such firms. On the other hand, CEOs might be all powerful with their complicit boards and no
amount of opaqueness would affect their pay levels and pay-performance sensitivities.
Given that powerful CEOs have too much power over their board of directors, the
entrenchment hypothesis would predict that poorly-governed firms would have more entrenched
CEOs, resulting in a more positive (negative) impact on the tenure-pay relationship (tenure-pay
sensitivity relationship) when compared to well-governed firms. Inside CEOs might be more
entrenched due to their prior relationships with senior managers, leading to analogous
predictions.
2.2 Learning
Murphy (1986) proposed the learning hypothesis wherein outside shareholders optimally
structure a CEO‟s contract so as to learn about the CEO‟s ability.4 Given that the CEO‟s ability
is less known when the CEO is in her early years, firm performance is more important for
updating beliefs in this period. In the later years of a CEO‟s tenure, more of the deviation from
expected performance is likely to come from random fluctuations than from unknown
managerial ability. Accordingly, the learning hypothesis predicts a negative relationship between
a CEO‟s pay-performance sensitivity and her tenure. In addition, the pay level of an executive
4 Many papers have used learning in other contexts (for example, see Timmerman 1993, Brennan 1998, Pastor,
Taylor and Veronesi 2007, and an excellent survey by Pastor and Veronesi 2009).
6
increases with experience as shareholders efficiently update their CEO‟s ability. Furthermore,
weaker CEOs are less likely to survive, such that the surviving CEOs will be paid relatively well.
The firm‟s information environment could matter for the tenure-pay relationship. Existing
beliefs are more strongly updated if the new signal has lower volatility or if the ex-ante beliefs
have greater uncertainty (see e.g. Pastor and Veronesi (2009). As a result, greater volatility or
more ex-ante uncertainty in the information environment would weaken associations with tenure
for both pay levels and pay-performance sensitivities. Similarly, there may be more to learn
about the abilities of outside CEOs than for those hired from inside the firm. Therefore, we
would expect the association between tenure and pay levels (pay-performance sensitivities) to be
stronger for outside CEOs when compared to those hired from inside the firm.
2.3 Career Concerns
Gibbons and Murphy (1992) derive the optimal contract as a trade-off between explicit
incentives and implicit contracts such as career concerns.5 The concept of managers‟ caring
about their reputation in the labor market was first expressed by Fama (1980) and more formally
developed by Holmstrom (1999). According to Gibbons and Murphy (1992), CEOs are
implicitly incentivized early in their career from their reputation in the labor market, which could
partially substitute for a higher explicit incentive contract. During these years, CEOs would be
more willing to undertake costly unobservable managerial actions to correctly increase the
market‟s assessment of their ability. Later on in their career, CEOs require a higher explicit pay-
performance sensitivity to compensate them for reduced career concerns. Therefore, one would
5 Career concerns have been studied in other contexts by many papers such as Chevalier and Ellison (1999), Hong
and Kubik (2003), and Chung et al. (2010).

7
expect a positive relationship between the CEO‟s explicit pay-performance sensitivity and CEO
tenure.6 The career concerns hypothesis makes no predictions about pay levels.
2.4 Dynamic Contracting
Edmans, Gabaix, Sadzik and Sannikov (2009) model the dynamic contracting hypothesis,
wherein the rewards to exerting managerial effort are spread across all future periods to achieve
intertemporal risk sharing. A positive pay-performance sensitivity and tenure relation arises in
this model due to an “increasing incentives principle.” First, if we hold total lifetime reward for
good effort constant, pay is spread over fewer periods, causing current pay to increase. Second, a
higher pay level and greater pay-performance sensitivity is required as tenure increases, because
a risk-averse more-experienced CEO gets less utility from an increase in wealth as she is forced
to consume it over fewer periods. As a result, the required lifetime rewards increase over time as
well. In the dynamic contracting hypothesis with shareholders facing moral hazard and a risk-
averse CEO, stock has to be given to incentivize the CEO to put forward higher effort. But this
sharing rule subjects the risk-averse CEO to higher risk and she therefore has to be compensated
with a higher pay level as insurance for the higher risk. Note that under this hypothesis, one does
not require any implicit contracts such as career concerns to obtain the positive relationship
between the CEO‟s pay-performance sensitivity and tenure. The dynamic contracting hypothesis
6 We observe that both career concerns and learning have shareholders updating their information about CEO
ability, but with opposite predicted signs on the tenure-pay sensitivity relationship. This is because the career
concerns model assumes a competitive labor market wherein the CEO with the right ability is assigned to the right
firm, and the learning model does not. Under the career concern model, the pay- performance relation is driven by
the tradeoff between the incentives to create shareholder value and risk-sharing for the risk-averse CEO. More pay-
for-performance improves incentives but reduces risk-sharing (if it comes at the cost of say cash salary). In the
beginning of the tenure, there is greater uncertainty about ability, and thus risk-sharing is more difficult as the CEO
is reluctant to bear so much risk. As tenure increases, risk-sharing becomes easier as the CEO becomes less reluctant
to bear firm-specific risk as her risk decreases (i.e., shareholders know more about CEO ability). The learning model
does not assume a competitive labor market and is not about risk-sharing. The tradeoff for shareholders is between
inducing effort (more effort is better) and cost (paying more is worse) in the context of learning about the CEO‟s
ability. Therefore, the key difference seems to be driven by the absence or presence of a competitive labor market.
8
as formulated in Edmans et al. (2009) does not directly address the importance of the information
environment, outsider CEOs or corporate governance.
3. Data sources and variable construction
3.1. Data sources
The CEO compensation and tenure data is from Standard and Poor‟s ExecuComp
database. The Governance Index is obtained from the Investor Responsibility Research Center
(IRRC) and some board characteristics such as proportion of outsiders on the board are obtained
from the IRRC. Accounting data is from the annual Compustat files and stock return data is from
CRSP. Information on inside versus outsider CEOs hired was hand collected and provided by
Cremers and Grinstein (2009). Our sample period is 1992 – 2007, with over 12,000 observations
consisting of about 2,200 different firms and about 3,200 different CEOs.
3.2 Variable construction
CEO pay: In order to examine the effect of tenure on a CEO‟s level of pay we calculate
Lpay, defined as the natural logarithms of the dollar value of CEO‟s total pay (ExecuComp‟s
TDC1). We also construct three measures of a CEO‟s pay-performance sensitivity. Our first
measure is the total sensitivity of the CEO‟s pay to performance βtotal which is defined as the sum
of βoptions and βshares. In order to calculate βoptions we use both the number of option grants given
during this fiscal year and outstanding grants from previous years. The sensitivity of options
granted during the relevant fiscal year is calculated as the partial derivative of individual stock
options granted with respect to a one-dollar change in share price (the Black-Scholes hedge ratio
adjusted for dividends), times the ratio of executive option awards to shares outstanding
(Yermack 1995). The risk-free rate is the interest rate on seven-year constant-maturity Treasury
bond (ExecuComp‟s „risk_free_rate‟), and the standard deviation of stock price over the prior
sixty months (ExecuComp‟s „bs_volatility‟).
9
The sensitivity of outstanding options is difficult to determine accurately because we do
not know the exercise prices of these grants. This difficulty arises because the annual proxy
statements do not report which previously held options have been exercised and which previously
granted options remain in the portfolio. We approximate the sensitivity of executive outstanding
option holdings by following Core and Guay‟s (2002) methodology. In particular, the average
exercise price of the exercisable options is assumed to be the difference between the fiscal year
end stock price and the ratio of the value of exercisable7 in-the-money options (ExecuComp‟s
„inmonex‟) to the number of unexercised exercisable options (ExecuComp‟s „uexnumex‟). The
term to maturity of the exercisable options is set to be three years less than that of the new option
grant (or six years if no new grant was made in that particular year). The average exercise price of
the unexercisable options is set to be the difference between the stock price and the ratio of the
value of unexercisable in-the-money options (ExecuComp‟s „inmonun‟) to the number of
unexercisable options (ExecuComp‟s „uexnumex‟). The term to maturity of the unexercisable
options is set to be one year less than that of the new option grant (or nine years if no new grant
was made in that particular year). Using the estimated exercise prices and expiration terms for
previous options grants, the sensitivity of CEO‟s total option grants is calculated as the sum of
the sensitivities of individual exercisable options outstanding, unexercisable options outstanding
each multiplied by the corresponding proportion of shares represented by these options. Then
βoptions is the sum of the sensitivities of options granted and options outstanding.
Our third measure is the sensitivity of common stock to a change in stock price (βshares)
and is defined as the number of shares owned divided by total shares outstanding.
CEO tenure: We proxy for CEO tenure (Tenure) using the number of years the CEO has
been chief executive at her firm.
7 An option is said to be exercisable if the option can be exercised within 60 days and is considered to be
unexercisable if the manager must wait more than 60 days to exercise the option.
10
Control variables: We use a comprehensive set of control variables that have been
shown to affect a CEO‟s pay-performance sensitivity (for example, see Demsetz and Lehn 1985,
Smith and Watts 1992, Himmelberg, Hubbard, and Palia 1999, and Palia 2001). We begin by
including the natural logarithm of the CEO‟s age (Age) so as to ensure that our results on CEO
tenure are not really picking up the effect of younger or older CEOs getting different
compensation packages.8 We also control for the size of the company by taking the natural
logarithm of the firm‟s market capitalization (Ln_Marketcap) and the firm‟s sales
(Ln_Marketcap2). We control for the firm‟s profitability by including the return on assets (ROA)
ratio, and the firm‟s Herfindahl Index (HHI) defined as the sum of squares of the firm‟s market
share by sales at 2 digit level. We include different measures of the firm‟s risk: Sigma, defined as
the standard deviation of the firm‟s stock price over the prior sixty months, the firm‟s market risk,
Beta, defined as the regression coefficient of the firm‟s stock returns on the market portfolio, and
Dyield, defined as the firm‟s dividend yield. We include two measures to capture intangible
assets, namely the ratio of property, plant, and equipment to assets (PPE) and the ratio of capital
expenditure to assets (Capex). Finally, we control for the firm‟s leverage, Debt, defined as the
ratio of total balance sheet leverage to assets.
The data on the inside versus outside CEO hires were hand collected and provided by
Cremers and Grinstein (2009), which one can refer to for more details. In line with the literature,
if the CEO was affiliated with the current firm for less than two years before becoming CEO, the
CEO is classified as an outsider CEO.
8 In Gibbons and Murphy (1992), hypothesis 2 clearly prescribes a positive relationship for CEO tenure while
holding CEO age constant, whereas hypothesis 1 prescribes a negative relationship for CEO age while holding CEO
tenure constant. Given that we are focusing on the impact of CEO tenure we are testing their second hypothesis.

11
We use three measures to capture the firm‟s corporate governance environment.9 The
first is the Gindex, created by Gompers, Ishii, and Metrick (2003) as an index of anti-takeover
provisions that assist managers in resisting takeovers. A higher value of the Gindex reflects
fewer shareholder rights or more takeover defenses, and is a proxy of the entrenchment of the
board vis-à-vis shareholders. The second measure is the fraction of the board that is independent
(Board_Indep). Baysinger and Butler (1985), Mehran (1995), and Klein (1998) find that firm
value is positively related to the proportion of outsiders on the board. Grey directors, those
directors that have some prior or current business affiliation with the company are treated as
dependent directors. The third measure is the CEO Pay Slice (CPS), or the fraction of the total
compensation of the group of top-five executives of the firm, that is given to the CEO. Bebchuk,
Cremers and Peyer (forthcoming) document that high CPS firms are characterized with lower
valuations and profitability, consistent with CEOs and boards that are more entrenched.
All the above variables are summarized in Table 2 and their descriptive statistics are
presented in Table 3. The pay-performance sensitivity using shares owned can only be calculated
for about half the firm-year observations, in which case we set it to zero when calculating the
total pay-performance sensitivity.
***Tables 2 and 3***
Figure 1 shows the marginal and cumulative distributions of CEO tenure in our sample
(on the left and right axes, respectively). The median tenure equals five years. Table 4 provides
the correlation matrix for the tenure and CEO age variables. Given the relative high correlations
between, for example, Ln_Tenure and Ln_Tenure2 (its square), we verify for all specifications
9 Hermalin (2005) suggests that stricter governance is more costly to the CEO as she must exert higher effort and
increases the risk of her dismissal, which results in the CEO demanding a higher level of pay. Gayle and Miller
(2009) suggest that CEOs in firms with more severe governance problems (such as large firms) have to be given a
higher pay level to compensate these risk averse executives for bearing higher firm-specific risk.

12
that multicollinearity does not generate statistical problems using the „variance inflation factor‟
test.10
***Table 4 ***
***Figure 1***
4. Empirical Results
4.1. Basic Results for Tenure and CEO Pay
We begin by examining the relationship between CEO tenure and the level of CEO pay.
The four theories explained in Section 2 only predict the sign or the slope of the tenure-pay
relationship. Our three empirical specifications also allow possible nonlinear relationships. We
begin by use a specification with ten tenure dummies, one dummy for each of the first ten years
of a CEO‟s tenure. We then capture parsimoniously a linear relationship by using Ln_Tenure
which give less weight to CEOs with very long tenures. The third specification includes the
quadratic term Ln_Tenure2.
Critically, all specifications throughout the paper are run with CEO-firm fixed effects,
which controls for unobserved (but time-invariant) heterogeneity at the CEO-firm level. As a
result, the coefficients on the various tenure variables can be interpreted as measuring the time-
series association between pay and tenure for a given CEO: how does the pay level change if a
given CEO stays in the job?
We run pooled panel regressions of the log of total CEO pay regressions (Lpay) on the
CEO tenure variable(s), including all the control variables described above plus year dummies.
Throughout the paper, all standard errors are corrected for heteroscedasticity and autocorrelation
and are clustered by firm. In all tables we do not report the results on the year dummies which
10
The variance inflation factor (VIF) quantifies the severity of multicollinearity in an ordinary least squares
regression analysis. It provides an index that measures how much the variance of an estimated regression coefficient
(the square of the estimate's standard deviation) is increased because of collinearity.

13
are individually and jointly statistically significant. Results of the Lpay regressions are presented
in Table 5.
*** Table 5 ***
In the first column of Table 5, we find that the coefficients of the ten tenure dummies in
indicate an increasing pattern. Any further tenure dummies (after ten years of tenure) are all
insignificant if added to the specification shown. This result is confirmed in columns (2) and (3),
suggesting a positive and statistically significant relation between total CEO pay and tenure.
When we examine the control variables we find that larger (by market capitalization and
sales) and more profitable (ROA) firms pay a higher level of pay. Given that these firms are able
to attract more talented CEOs our results are consistent with Gabaix and Landier (2008). We find
a statistically insignificant effect between the level of CEO pay and CEO age. We also find that
risker firms (by beta and volatility) also pay their CEOs a higher level of pay. Firms with higher
intangibles (lower property, plant and equipment) paid their CEOs a lower level of pay. Finally,
firms with higher dividend yields also have higher paid CEOs, though this association is only
marginally significant.
Figure 2 plots the association between the log of total CEO pay and tenure for the three
different specification using the fitted values and tenure-related variables only. Each
specification is rescaled to start at zero for tenure equal to one year. The association between pay
levels and tenure is clearly non-linear in tenure, as the specification with the dummies indicates.
In general, the increase in pay levels with tenure is larger in the beginning and then tends to
decrease with increases in tenure after about six years.
The non-linearity could be captured by a step-wise linear specification (e.g. linear with
tenure from 1-5 years, less steep with tenure from 6-10 years, flat after that), but for simplicity
we prefer the log transformation of tenure in all subsequent specifications. This simplicity is

14
especially useful when interaction tenure with various firm and CEO characteristics in
subsequent analyses. However, results in the paper are robust to using a step-wise linear
specification instead.
The figure also shows that the economic importance of tenure on total CEO pay levels is
considerable. For example, going from one to six years of tenure is associated with an increase in
total pay of about 20%. The specification using Ln_Tenure implies a smaller though still
economically strong increase in those five years of 9.2%. Adding Ln_Tenure2 hardly changes
things.
***Figure 2***
Finding a positive relationship is consistent with the entrenchment, learning, and the
dynamic contracting hypotheses but for different reasons. Under entrenchment, the CEO extracts
higher levels of pay because she is very powerful, whereas under the learning and dynamic
contracting hypotheses, higher levels of pay are required to compensate the risk averse CEO for
receiving a higher incentive contract.
Next, we examine the total pay-for-performance sensitivity of the CEO (βtotal). As
discussed above, a negative relationship is consistent with the entrenchment and learning
hypotheses, and a positive relation with the career concerns and dynamic contracting hypotheses.
We again estimate the three regressions with industry, firm and CEO-firm-effects, respectively,
plus year dummies and other controls. The results of these regressions are given in Table 6. We
again summarize these results in Figure 3, which plots the associations between tenure and βtotal
for the three specifications.
***Table 6***
15
We begin by examining the ten tenure dummies specification, finding a strong positive
relation which begins from a value of -12.60 and ends at -1.41, see column 1. This positive
relationship is confirmed when we use Ln_Tenure in column 2, as well as using both Ln_Tenure
and Ln_Tenure2 in column 3.
Examining the control variables we find a strong positive relationship between CEO age
and the CEO‟s total pay-performance sensitivity. This result is consistent with hypothesis 1 of
Gibbons and Murphy (1991) wherein age is positively related to the CEO‟s total pay-
performance sensitivity holding tenure constant. We also find that find that smaller (by market
capitalization and sales) and more profitable (ROA) firms have CEOs with a higher pay-
performance sensitivity. Given that these firms are able to attract more talented CEOs our results
are consistent with Gabaix and Landier (2008). We find a statistically insignificant effect
between the level of CEO pay and CEO age. We find a statistically insignificant relationship
between firm risk (by beta and volatility), intangibles (lower property, plant and equipment) and
the CEO‟s total pay-performance sensitivity. Firms with higher leverage, lower dividends and
incurring higher capital expenditure also award their CEOs a high total pay-performance
sensitivity.
Figure 3 plots the association between the CEO‟s pay-performance sensitivity and tenure
for the three different specification using the fitted values and tenure-related variables only. Once
again, each specification is rescaled to start at zero for tenure equal to one year. We find that
increasing tenure has an economically relevant positive association with the total pay-
performance sensitivity. For example, increasing tenure from one to six years is associated with
an increase in βtotal of about 0.8% using the dummy specification, compared to a median βtotal of
1.29%. The specifications with Ln_Tenure and Ln_Tenure2 result in a similar pattern, implying a
weaker (though still meaningful) economic association than the specification using dummies,.

16
For example, the coefficient on Ln_Tenure suggests that increasing tenure from one to six years
is associated with an increase in βtotal of about 0.6%.
***Figure 3***
The strong positive relationship between and the CEO‟s total pay-performance sensitivity
and tenure is inconsistent with the entrenchment and learning hypothesis. It is consistent with
both the dynamic contracting and the career concerns hypotheses, but for different reasons. The
career concerns hypothesis suggests a positive relationship because the manager has less implicit
incentives later in her career, whereas under the dynamic contracting hypothesis the manager
gets less utility from an increase in wealth, as she will have to consume it over fewer periods.
We next examine whether these results are driven by options and/or shares, where
options have much convexity or implied leverage that can significantly increase pay-
performance sensitivity. It is possible that the effect of options could be diametrically opposite of
the effect of shares, and that the relations we have estimated using total sensitivity is of the more
dominant incentive program. Table 7 presents results of pooled panel regressions of βoptions in the
first three columns (columns 1 to 3), and for βshares in the next three columns (columns 4 to 6).
We again include year dummies and CEO-firm fixed effects throughout plus all the controls of
Table 6, which are not shown for brevity. We find a strong positive relationship in all three
specifications.
***Table 7***
Considering the results for βoptions in columns 1 – 3, we find a consistently positive and
statistically significant relationship with tenure. Figure 4 suggests that the economic magnitude
of increasing tenure from one to six years is associated with an increase in βoptions of 0.13%
(using Ln_Tenure) to 0.25% (using the tenure dummies), as compared to a median βoptions of
0.7%. The results for βshares in columns 4 – 6 also suggest a positive relationship with tenure
17
using either the tenure dummies or Ln_Tenure (or Ln_Tenure2). Indicated by Figure 5, the
economic magnitude of increasing tenure from one to six years is associated with an increase in
βshares of 0.4% (using Ln_Tenure) to 0.6% (using the tenure dummies).
*** Figures 4 and 5***
We conclude that the evidence for the pay-performance sensitivity is most consistent with
a positive relation with tenure, consistent with the career concerns and dynamic contracting
hypotheses, and inconsistent with the entrenchment and learning hypotheses.
4.3. Information Environment and Learning
This section examines the importance of the firm‟s information environment for the
relationship of tenure with pay levels and the pay-performance sensitivity. The main purpose for
doing so is to further investigate the learning hypothesis, which predicts that the board has
considerable ex-ante uncertainty about the skills of the CEO that is resolved through observing
the firm‟s performance. Surviving CEOs are those about whom the board has received positive
information, and whom consequently will receive higher pay. The learning hypothesis could
potentially explain the strong positive association between tenure and pay levels. At the same
time, the positive association between tenure and pay-performance sensitivity is inconsistent
with the learning hypothesis, but could potentially be due to firm with little or very slow
learning.
We posit that if the firm‟s information environment is more opaque, such learning will be
slower, resulting in a weaker association for tenure. Specifically, Bayesian updating of existing
beliefs is greater if the new signal has lower volatility (i.e., more precision) or if the ex-ante
beliefs or priors have greater uncertainty (see e.g. Pastor and Veronesi (2009)).
We use two measures to capture the firm‟s information environment. The first measure
is a proxy for the precision of signals as measured by the firm‟s residual stock return volatility,

18
Resvol, calculated over the fiscal year using daily excess returns and relative to the four-factor
Fama-French-Carhart model. The second measure is a proxy for the ex-ante lack of uncertainty
about value of the assets in place, as measured by the firm‟s fraction of tangible assets (i.e.,
property, plants, and equipment divided by the book value of total assets), PPE. A lower PPE
ratio suggests more intangible assets, implying a more uncertain information environment facing
the firm.13
For both proxies, we create two dummy variables set to unity for all firms in the
lowest (Low_Resvol and Low_PPE) and highest quartile (High_Resvol and High_PPE) of each
proxy in a particular year, and zero otherwise. We interact the dummy variables with Ln_Tenure,
the results of which are presented in Table 9. We include all the controls of Table 6, which are
not shown for brevity.
***Table 8***
The information environment seems to make little difference to the level of pay (columns
1-2). All interactions with Resvol quartile dummies are insignificant (column 1), as is the
interaction with PPE quartile dummies (column 2). When we examine the CEOs total pay-
performance sensitivity (columns 3-4) we once again find a statistically insignificant
relationship. These statistically insignificant results are also confirmed when we analyze options
(columns 5-6) and shares (columns 7-8) separately. We thus also find no evidence that the
positive association of CEO tenure with pay-performance sensitivity is driven by more opaque
firms, where learning may be more difficult. In conclusion, we find no support for the learning
hypothesis when conditioning on the information environment.
4.4 Inside versus Outside CEOs: Entrenchment and Learning
The difference between CEO hired from inside versus outside the firm could potentially
be used to differentiate the entrenchment and learning hypotheses. Both of these predict a
13
We also considered a third proxy based on analyst forecast errors, but failed to find any significant relationships
using that proxy. Results using this proxy were not reported for brevity.

19
positive tenure association for pay levels and a negative tenure association for pay-performance
sensitivity. However, learning seems likely to be more important for outside CEOs, while these
same CEOs seem less likely to be entrenched. As a result, under the learning hypothesis, we
would expect the predicted associations to be stronger for outside CEOs, with the opposite under
the entrenchment hypothesis.
We create a dummy Inside_CEO, which equal to unity if the CEO is hired from inside
the firm, and zero otherwise. In Table 9, we report the results of specifications with Ln_Tenure
and its interaction with this dummy, for Lpay (column 1), βtotal (column 2), βoptions (column 3) and
βshares (column 4). We include all the controls and year dummies, which are not shown for
brevity. Results using both Ln_Tenure and Ln_Tenure2 are very similar and not reported.
***Table 9***
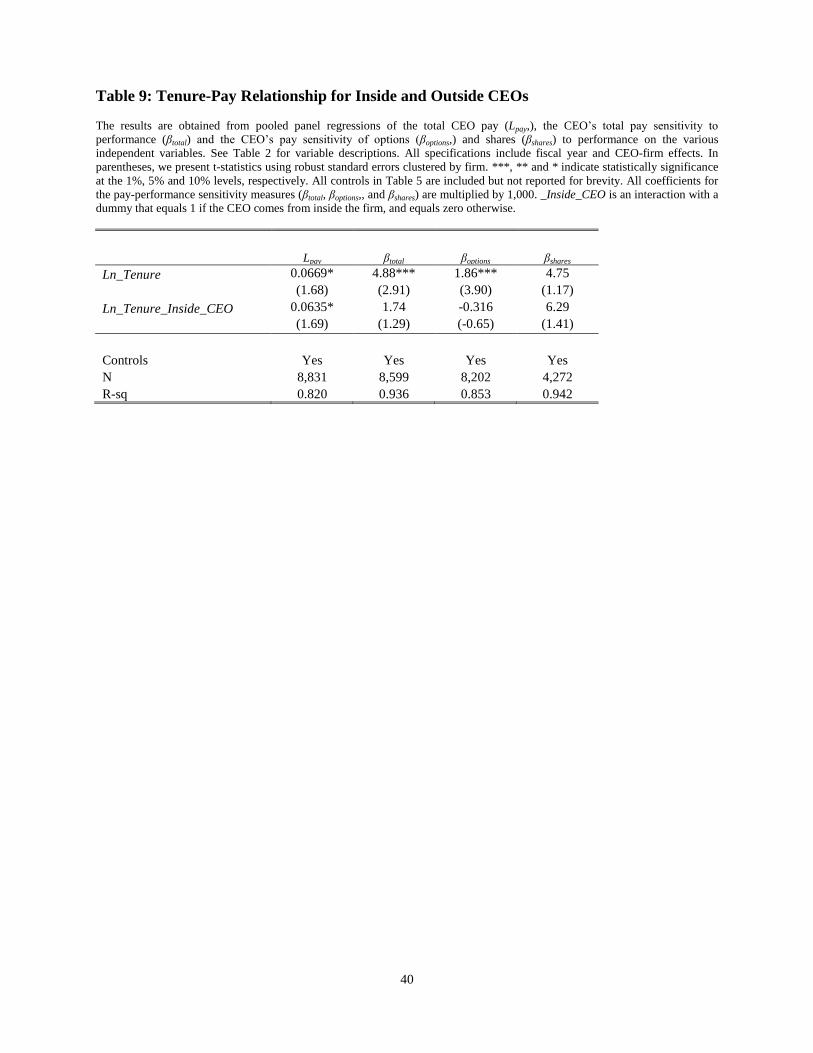
The main result is that tenure of insider CEOs has a twice as positive associations with
pay levels as tenure of outside CEOs, which difference is marginally statistically significant with
a p-value of 9%. The pay-performance sensitivity of insider and outsider CEOs is no different.
The much higher positive association between tenure and pay levels for insider CEOs, about
whom the board should have better information when first hired, is consistent with the
entrenchment hypothesis and inconsistent with the learning hypothesis.
4.5. Governance and Entrenchment
Under the entrenchment hypothesis, poorly-governed firms with their more entrenched
CEOs would award their CEOs a higher (or more positive) pay level when compared to well-
governed firms. Such poorly governed firms would also provide lower incentives (pay-
performance sensitivities) when compared to well-governed firms. We investigate this
hypothesis further by considering the governance structure of the firm using three proxies to
capture the firm‟s governance structure: Gompers, Ishi, and Metrick‟s (2003) index of anti-
20
takeover provisions (Gindex), the fraction of the board that comprises of independent directors
(Board_Indep), and the CEO Pay Slice (CPS) or the fraction of the total pay of the top-five
executive team that goes to the CEO. A higher value of the Gindex reflects fewer shareholder
rights or more takeover defenses, and is a proxy of CEO entrenchment.
Baysinger and Butler (1985), Mehran (1995) and Klein (1998) find that Board_Indep and
firm value is positively correlated, consistent with more monitoring and less entrenchment of the
CEO. Bebchuk, Cremers and Peyer (forthcoming) find that high CPS firms are characterized
with lower firm valuations, lower operating performance and more firm decisions that appear
questionable (such a lower M&A announcement returns and more frequent option backdating),
consistent with CEOs and boards that are more entrenched.
As before, for each of these three measures we create a dummy variable to capture the
lowest quartile (Low_), and a dummy variable to capture the highest quartile (High_). These
variables are then interacted with the tenure variables, the results of which are given in Table 10.
We include all the controls and year dummies, which are not shown for brevity. The results for
pay levels (Lpay) are given in columns 1-3, total pay-performance sensitivity (βtotal) in columns 4-
6, sensitivity of options (βoptions) in columns 7-9, and sensitivity of shares (βshares) in columns 10-
12.
***Table 10***
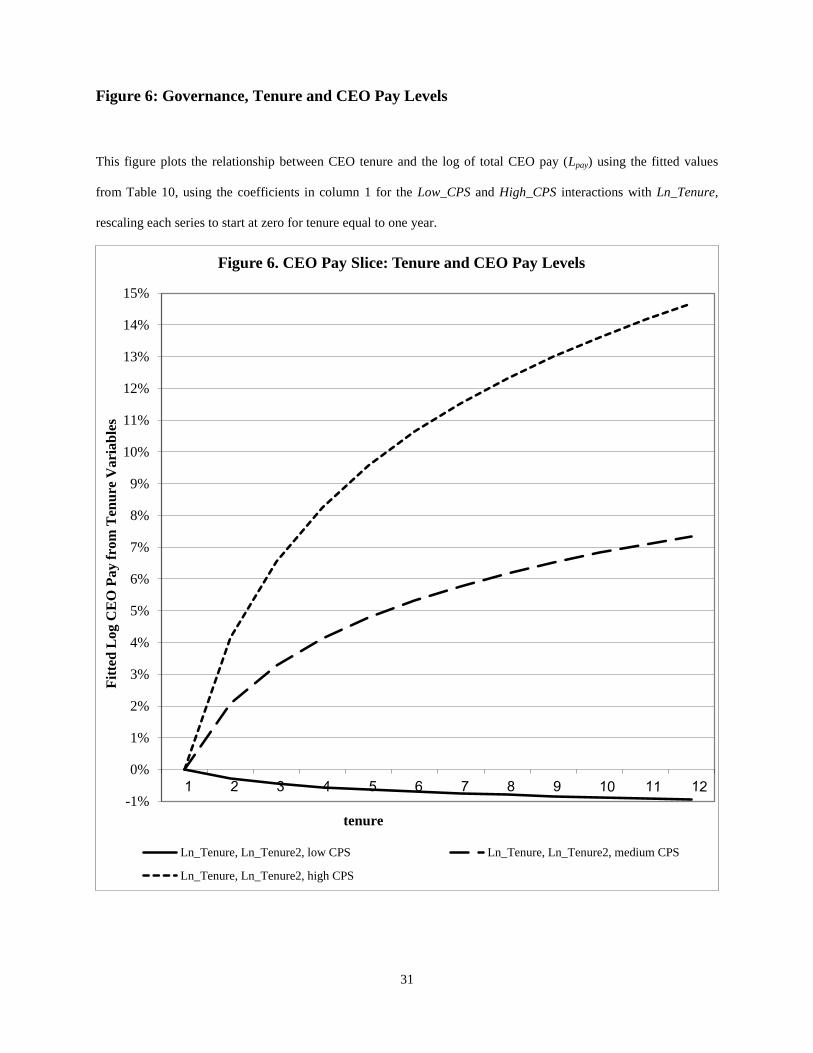
Considering corporate governance arrangements and the level of pay and tenure
association, firms with high CPS tend to have considerably stronger CEO pay–tenure
associations than firms with low CPS. We find a similar relationship for firms with a high
Gindex as compared with firms with a low Gindex. These results are generally consistent with
the entrenchment hypothesis. The economic significance of governance for the association
between tenure and pay levels is strongest for CPS, and is depicted in Figure 6.
21
***Figure 6***
For CEOs with low CPS, there is essentially no relationship between pay levels and
tenure. However, for CEOs with high CPS, the association is quite strong, with an increase from
one to size years of tenure associated with an 11% pay increase.
The impact of governance seems to be mixed on the pay sensitivity–tenure association.
For example, we find a more positive association between tenure and pay-performance
sensitivity for firms with more independent boards, but also for firms with higher Gindex scores.
Similar mixed evidence is found for both options and shares, and in general, the statistical
significance of any differences and the overall effects are relatively weak (i.e., when summing up
the coefficients of Ln_Tenure with the coefficients of any of its interactions).
In summary, this subsection documents very strong support for the entrenchment
hypothesis, especially assuming that entrenched CEOs mostly care about pay levels and do not
attempt to use any bargaining power vis-à-vis the board to change their incentive structure. If we
assume that managers in firms with weaker governance have greater flexibility in smoothing out
her on-the-job compensation, the positive relationship between pay levels and tenure for low
governance firms is also consistent with He (forthcoming).
5. Conclusions
This paper examines the relationship between a CEO‟s pay levels and pay-performance
sensitivity and her tenure in the firm. The previous empirical literature had examined such issues
used historical data that did not include the large amounts of incentive pay (such as options and
shares that were introduced in the 1990s). We examine the predictions of four theories (namely,
entrenchment, learning, career concerns and dynamic contracting) from the extant literature in
order to test the impact of tenure on pay levels and pay-performance sensitivities.

22
We find a positive relationship between tenure and CEO pay levels, as well as a positive
correlation between CEO tenure and the CEO‟s pay-performance sensitivity
Examining the impact of the firm‟s information environment, we find no significant
association with the CEO pay level and tenure relation, or with the pay-performance sensitivity
and tenure relation. This seems inconsistent with the learning hypothesis, or at least provides no
support for it.
Pay levels of inside CEOs go up twice as fast with tenure as pay levels of outside CEOs,
which is again inconsistent with the learning hypothesis but could be explained by entrenchment.
Considering corporate governance arrangements and the association between tenure and the level
of pay, we find that firms with high CPS (or high Gindex) tend to have considerably stronger
CEO pay–tenure associations than firms with low CPS (or low Gindex), again consistent with
the entrenchment hypothesis. The impact of governance seems to be mixed on the sensitivity –
tenure association.
In conclusion, the interpretation of our results diverges for pay levels versus pay-
performance sensitivity. Results for pay levels seem most consistent overall with the
entrenchment hypothesis, and inconsistent with the learning hypothesis. For pay-performance
sensitivity, the results are most consistent with the career concerns and dynamic contracting
hypotheses, and inconsistent with the learning. If entrenched CEOs care primarily about pay
levels, even if some of the additional pay comes in the form of options and shares, then the
positive association between tenure and pay-performance sensitivity would not be inconsistent
with the entrenchment hypothesis either. Finally, overall results are also consistent with the
career concerns and dynamic contracting hypothesis, which could co-exist with the entrenchment
hypothesis.

23
References
Bebchuk, L. A. and J. M. Fried, 2004, Pay Without Performance: The Unfulfilled Promise of
Executive Compensation, Harvard University Press, Cambridge, MA.
Bebchuk, L. A, M. Cremers and U. Peyer, forthcoming, “CEO Pay Slice and Firm Performance,”
Journal of Financial Economics.
Baysinger, B., and H. Butler, 1985, “Corporate Governance and the Board of Directors:
Performance Effects of Changes in Board Composition”, Journal of Law, Economics and
Organization, 1, 101-124.
Brennan, M., 1998, “The Role of Learning in Dynamic Portfolio Decisions,” European Finance
Review, 1, 295-306.
Core, J and W. Guay, 2002, "Estimating the Value of Employee Stock Option Portfolios and
Their Sensitivities to Price and Volatility," Journal of Accounting Research, 40, 613-630.
Chevalier, J., and G. Ellison, 1997, “Risk-Taking by Mutual Funds as a Response to Incentives,”
Journal of Political Economy, 105, 1167-1200.
Chung, C., B. A. Sensoy, L.H. Stern, and M.S. Weisbach, 2010, “Incentives of Private Equity
General Partners From Future Fundraising,” working paper, Ohio State University.
Cremers, K. J. M., and Y. Grinstein, 2009, “The Market for CEO Talent: Implications for CEO
Compensation,” working paper, Yale University
Demsetz, H., and K. Lehn, 1985, “The Structure of Corporate Ownership: Causes and
Consequences”, Journal of Political Economy, 93, 1155-1177.
Dikolli, S.S., W.J. Mayew, and D. Nanda, 2010, “CEO Tenure and the Performance-Turnover
Relation,” working paper, Duke University.
Edmans, A., X. Gabaix, T. Sadzik, and Y. Sannikov, 2009, “Dynamic Incentive Accounts”,
working paper, ssrn=1361797.
Fama, E., 1980, “Agency Problems and the Theory of the Firm,” Journal of Political Economy
88, 288-307.
Gabaix, X., and A. Landier, 2008, “Why Has CEO Pay Increased So Much?” Quarterly Journal
of Economics 123, 49-100.
Gayle, G-L., and R.A. Miller, 2009, “Has Moral Hazard Become a More Important Factor in
Managerial Compensation?” American Economic Review 99, 1740-1769.
Gibbons, R. and K. J. Murphy, 1992, "Optimal Incentive Contracts in the Presence of Career
Concerns: Theory and Evidence," Journal of Political Economy 100, 468-505.

24
Gompers P., J. Ishii and A. Metrick, 2003, "Corporate Governance and Stock Prices," Quarterly
Journal of Economics 118, 107-155.
Hall, B. J. and J. B. Liebman, 1998, "Are CEOs Really Paid Like Bureaucrats?," Quarterly
Journal of Economics 113, 653-691.
He, Zhiguo, forthcoming, “Dynamic Compensation Contracts with Private Savings,” Review of
Financial Studies.
Hermalin, B., 2005, “Trends in Corporate Governance,” Journal of Finance, 53, 2351-2384.
Himmelberg, C., G. Hubbard, G., and D. Palia, 1999, “Understanding the Determinants of
Managerial Ownership and the Link between Ownership and Performance,” Journal of Financial
Economics, 53, 353-384.
Holmstrom, B., 1982, “Managerial Incentive Schemes-A Dynamic Perspective,” in Essays in
honor of Lars Wahlbeck. Helsinki, Sweden.
Hong, H., and J. Kubik, 2003, “Analyzing the Analysts: Career Concerns and Biased Earnings
Forecasts,” Journal of Finance, 58, 313-351.
Jensen, M. C. and K. J. Murphy, 1990, "Performance Pay and Top-Management Incentives,"
Journal of Political Economy, 98, 225-264.
Klein, A., 1998, “Firm Performance and Board Committee Structure”, Journal of Law and
Economics, 41, 275-303.
Mehran, H., 1995, “Executive Compensation Structure, Ownership, and Firm Performance,”
Journal of Financial Economics 38, 163-84
Murphy, K.J, 1986, “Incentives, Learning, and Compensation: A Theoretical and Empirical
Investigation of Managerial Labor Contracts,” Rand Journal of Economics, 17, 59-76.
Palia, D., 2001, "The Endogeniety of Managerial Compensation in Firm Valuation: A Solution,"
Review of Financial Studies, 14, 735-764.
Pastor, L., and P. Veronesi, 2009, “Learning in Financial Markets,” Annual Review of Financial
Markets, 1, 361-381.
Pastor, L., L. Taylor, and P. Veronesi, 2009, “Entrepreneurial Learning, the IPO Decision, and
the Post-IPO Drop in Firm Profitability,” Review of Financial Studies, 22, 3005-3046.
Perry, T. and M. Zenner, 2001, “Pay for Performance? Government Regulation and the Structure
of Compensation Contracts,” Journal of Financial Economics, 62, 453-458.
25
Smith, C. and R. Watts, 1992, "The Investment Opportunity Set and Corporate Financing,
Dividend, and Compensation Policies," Journal of Financial Economics, 7, 117-161.
Timmerman, A.G., 1993, “How Learning in Financial Markets Generates Excess Volatility and
Predictability of Stock Returns,” Quarterly Journal of Economics, 108, 1135-1145.
Yermack, D., 1995, "Do Corporations Award CEO Stock Options Effectively?" Journal of
Financial Economics, 39, 237-269.

26
Figure 1: Distribution of CEO Tenure
This figure plots the marginal distribution (left-side scale, solid line) and the cumulative distribution (right-side scale,
dotted line) of CEO tenure in years, using the full sample of 15,972 observations (see Table 3).
Figure 1. Distribution of CEO Tenure
0%
2%
4%
6%
8%
10%
12%
14%
1 2 3 4 5 6 7 8 9 10 11 12 13 14 15 16 17 18 19 20 21 22 23 24 25tenure
Ma
rg
ina
l D
istr
ibu
tio
n (
So
lid
Lin
e)
)
0%
10%
20%
30%
40%
50%
60%
70%
80%
90%
100%
Cu
mu
lativ
e
Distr
ibu
tion
(Do
tted
)
Marginal Distribution Cumulative Distribution

27
Figure 2: Tenure and CEO Pay Levels
This figure plots the relationship between CEO Tenure and the log of total CEO pay (Lpay) using the fitted values
from Table 5 (columns 1 – 4) and Table 8 (column 1) using tenure-related variables only and rescaling each series to
start at zero for tenure equal to one year.
0%
5%
10%
15%
20%
25%
30%
Fit
ted
Log C
EO
Pay f
rom
Ten
ure
Vari
ab
les
tenure
Figure 2. Tenure and CEO Pay
Dummies Ln_Tenure Ln_Tenure, Ln_Tenure2

28
Figure 3: Tenure and CEO Total Pay-Performance Sensitivity
This figure plots the relationship between CEO Tenure and the total CEO pay-performance sensitivity (βtotal) using
the fitted values from Table 6 (columns 1 – 4) and Table 8 (column 2) using tenure-related variables only and
rescaling each series to start at zero for tenure equal to one year.
-0.10%
0.10%
0.30%
0.50%
0.70%
0.90%
1.10%
Fit
ted
Pay
-Per
form
. S
ensi
tivit
y f
rom
Ten
ure
Vars
tenure
Figure 3. Tenure and Total CEO Pay-Performance Sensitivity
Dummies Ln_Tenure Ln_Tenure, Ln_Tenure2

29
Figure 4: Tenure and CEO Options-Performance Sensitivity
This figure plots the relationship between CEO Tenure and the options‟ CEO pay-performance sensitivity (βoptions)
using the fitted values from Panel A of Table 7 (columns 1 – 4) and Table 8 (column 3) using tenure-related
variables only and rescaling each series to start at zero for tenure equal to one year.
0.00%
0.05%
0.10%
0.15%
0.20%
0.25%
0.30%
Fit
ted
Pay
-Per
form
. S
ensi
tivit
y f
rom
Ten
ure
Vars
tenure
Figure 4. Tenure and Options' CEO Pay-Performance Sensitivity
Dummies Ln_Tenure Ln_Tenure, Ln_Tenure2

30
Figure 5: Tenure and CEO Shares-Performance Sensitivity
This figure plots the relationship between CEO Tenure and the options‟ CEO pay-performance sensitivity (βshares)
using the fitted values from Panel B of Table 7 (columns 1 – 4) and Table 8 (column 4) using tenure-related
variables only and rescaling each series to start at zero for tenure equal to one year.
-0.10%
0.15%
0.40%
0.65%
0.90%
1.15%
Fit
ted
Pay
-Per
form
. S
ensi
tivit
y f
rom
Ten
ure
Vars
tenure
Figure 5. Tenure and Stocks' CEO Pay-Performance
Sensitivity
Dummies Ln_Tenure Ln_Tenure, Ln_Tenure2
31
Figure 6: Governance, Tenure and CEO Pay Levels
This figure plots the relationship between CEO tenure and the log of total CEO pay (Lpay) using the fitted values
from Table 10, using the coefficients in column 1 for the Low_CPS and High_CPS interactions with Ln_Tenure,
rescaling each series to start at zero for tenure equal to one year.
-1%
0%
1%
2%
3%
4%
5%
6%
7%
8%
9%
10%
11%
12%
13%
14%
15%
Fit
ted
Log C
EO
Pay f
rom
Ten
ure
Vari
ab
les
tenure
Figure 6. CEO Pay Slice: Tenure and CEO Pay Levels
Ln_Tenure, Ln_Tenure2, low CPS Ln_Tenure, Ln_Tenure2, medium CPS
Ln_Tenure, Ln_Tenure2, high CPS
32
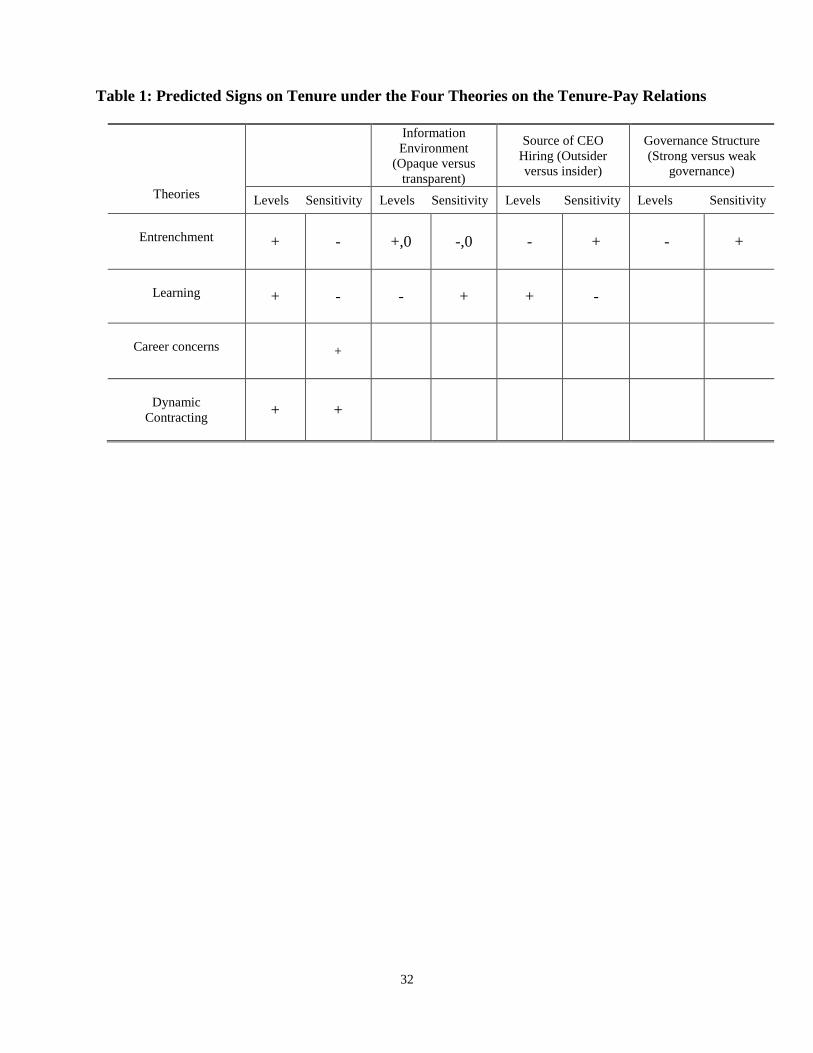
Table 1: Predicted Signs on Tenure under the Four Theories on the Tenure-Pay Relations
Theories
Information
Environment
(Opaque versus
transparent)
Source of CEO
Hiring (Outsider
versus insider)
Governance Structure
(Strong versus weak
governance)
Levels Sensitivity Levels Sensitivity Levels Sensitivity Levels Sensitivity
Entrenchment
+ - +,0 -,0 - + - +
Learning
+ - - + + -
Career concerns +
Dynamic
Contracting
+ +

33
Table 2: Definition of Variables Used in the Regression
Variable Definition
payL Natural logarithm of the dollar value of CEO pay
total Pay-performanc e sensitivity of options and shares owned
options Pay-performance sensitivity of options granted and outstanding
shares Pay-performance sensitivity of shares owned
Tenure1, ... Tenure10 Dummies for 10-deciles of the number of years CEO has been chief executive
Ln_Tenure Log of the number of years CEO has been chief executive
Ln_Tenure2 Square of log the number of years CEO has been chief executive
Ln_Age Log of the CEO‟s age in years
Ln_Marketcap Natural logarithm of firm‟s market capitalization
Ln_Marketcap2 Square of the natural logarithm of firm‟s market capitalization
ROA Firm‟s return-on-assets
HHI Herfindahl Index, sum of squares of market share by sales at the 2-digit SIC level
Sigma Standard deviation of the firm‟s stock price in the prior sixty months
Beta Firm‟s sensitivity to market risk
Dyield Firm‟s dividend yield
PPE Ratio of property, plant and equipment to assets
Capex Ratio of capital expenditure to assets
Leverage Ratio of book value of short term plus long term debt to assets
Outsider Dummy set to unity if CEO was hired from outside the firm, and zero otherwise
Gindex Governance Index of anti-takeover provisions (Gompers, Ishii & Metrick, 2003)
Outsiders Proportion of outsiders on the board
CPS CEO Pay Slide, percentage of total pay of the top 5 executives that goes to the CEO

34
Table 3: Descriptive Statistics
Variable
# of
observations
Mean
Median
Standard
deviation
Minimum
Maximum
Dependent variables:
payL 15,972 7.829 7.780 1.059 5.330 10.43
total 15,489 0.0333 0.0129 0.0589 0.0002 0.344
options 14,866 0.0106 0.0070 0.0113 0.0001 0.063
shares 7,945 0.0454 0.013 0.0765 0.0002 0.390
Independent variables:
Ln_Tenure 15,972 1.63 1.61 0.95 0.00 3.58
Ln_Tenure2 15,972 3.55 2.59 3.17 0.00 12.84
Ln_Age 15,972 4.01 4.03 0.13 3.37 4.33
Ln_Marketcap 15,972 7.51 7.38 1.56 0.83 11.61
Ln_Marketcap2 15,972 58.79 54.46 24.55 0.69 134.79
ROA 15,972 0.15 0.14 0.08 0.01 0.41
HHI 15,972 0.07 0.05 0.07 0.01 0.39
Sigma 15,972 0.40 0.35 0.23 0.10 1.05
Beta 15,972 1.03 0.94 0.60 -1.02 2.87
Dyield 15,972 0.01 0.005 0.02 0.00 0.08
PPE 15,972 0.31 0.25 0.24 0.00 0.89
Capex 15,972 0.06 0.05 0.06 0.00 0.29
Leverage 15,972 0.21 0.20 0.17 0.00 0.71
Gindex 12,576 9.37 9.00 2.65 1.00 17.00
Outsiders 8,831 0.43 0.00 0.49 0.00 1.00
CPS 15,972 37.46 37.36 11.92 0.00 71.83

35
Table 4: Correlation Matrix
The table presents the correlation structure of the different CEO tenure and CEO age variables. See Table 2 for variable
descriptions.
Ln_Tenure Ln_Tenure2 Age Age2 Ln_Age
Ln_Tenure2 95%
Age 36% 41%
Age2 37% 42% 99%
Ln_Age 35% 39% 99% 98%
Ln_Age2 35% 39% 100% 98% 100%

36
Table 5: Tenure and CEO Pay Levels The results are obtained from pooled panel regressions of CEO pay levels (Lpay) on the various independent variables. See Table
2 for variable descriptions. All specifications include fiscal year and CEO-firm effects. In parentheses, we present t-statistics
using robust standard errors clustered by firm. ***, ** and * indicate statistically significance at the 1%, 5% and 10% levels,
respectively.
(1) (2) (3)
Tenure_1
-0.352***
(-5.62)
Tenure_2
-0.334***
(-5.74)
Tenure_3
-0.253***
(-4.68)
Tenure_4
-0.198***
(-3.96)
Tenure_5
-0.178***
(-3.79)
Tenure_6
-0.151***
(-3.46)
Tenure_7
-0.099**
(-2.52)
Tenure_8
-0.124***
(-3.34)
Tenure_9
-0.072**
(-2.17)
Tenure_10
-0.073**
(-2.33)
Ln_Tenure 0.118*** 0.031
(6.26) (1.13)
Ln_Tenure2 0.101***
(4.01)
Ln_Age 0.286 0.461 0.171
(0.55) (0.86) (0.33)
Ln_Marketcap 0.188** 0.184** 0.190**
(2.34) (2.27) (2.36)
Ln_Marketcap2 0.009 0.009 0.009
(1.51) (1.53) (1.47)
ROA 1.091*** 1.086*** 1.096***
(6.34) (6.33) (6.38)
Sigma 0.477*** 0.472*** 0.479***
(5.35) (5.28) (5.38)
Ln_Sales 0.063** 0.063** 0.061**
(2.27) (2.28) (2.22)
HHI 0.403 0.424 0.399
(1.20) (1.26) (1.19)
Beta 0.043*** 0.043*** 0.042***
(2.75) (2.77) (2.71)
Capex 0.299 0.320 0.290
(1.50) (1.61) (1.43)
PPE -0.489*** -0.497*** -0.493***
(-3.63) (-3.68) (-3.67)
book_lev -0.007 -0.003 -0.010
(-0.09) (-0.04) (-0.13)
div_yield 0.386* 0.360* 0.379*
(1.79) (1.65) (1.76)
N 15,972 15,972 15,972
R-sq 0.822 0.822 0.822

37
Table 6: Tenure and the CEO’s Total Pay-Performance Sensitivity The results are obtained from pooled panel regressions of the CEO‟s total pay-performance sensitivity (βtotal) on the various
independent variables. See Table 2 for variable descriptions. All specifications include fiscal year and CEO-firm effects. In
parentheses, we present t-statistics using robust standard errors clustered by firm. ***, ** and * indicate statistically significance
at the 1%, 5% and 10% levels, respectively. The coefficients on Ln_Tenure and Ln_Tenure2 are multiplied by 1,000.
(1) (2) (3)
Tenure_1
-12.601**
(-2.21)
Tenure_2
-11.066**
(-2.11)
Tenure_3
-9.861**
(-2.07)
Tenure_4
-7.801*
(-1.82)
Tenure_5
-6.544*
(-1.70)
Tenure_6
-5.193
(-1.53)
Tenure_7
-4.231
(-1.45)
Tenure_8
-2.966
(-1.21)
Tenure_9
-1.383
(-0.69)
Tenure_10
-1.409
(-0.91)
Ln_Tenure 4.17*** -0.196
(3.28) (-0.19)
Ln_Tenure2 4.990**
(2.35)
Ln_Age 0.112** 0.118** 0.104**
(2.40) (2.51) (2.35)
Ln_Marketcap -0.008** -0.008*** -0.007**
(-2.57) (-2.64) (-2.55)
Ln_Marketcap2 0.0003 0.0003 0.0003
(1.58) (1.64) (1.55)
ROA 0.031*** 0.031*** 0.032***
(4.13) (4.05) (4.16)
Sigma -0.002 -0.002 -0.002
(-0.52) (-0.58) (-0.48)
Ln_Sales -0.010*** -0.010*** -0.010***
(-6.47) (-6.38) (-6.50)
HHI 0.020 0.021 0.020
(1.04) (1.04) (1.03)
Beta -0.0002 -0.0002 -0.0002
(-0.39) (-0.36) (-0.41)
Capex 0.023* 0.024* 0.023*
(1.77) (1.82) (1.75)
PPE -0.006 -0.006 -0.006
(-0.92) (-0.93) (-0.94)
Leverage 0.013*** 0.014*** 0.013***
(3.34) (3.39) (3.30)
Dyield -0.036** -0.036** -0.036**
(-2.51) (-2.52) (-2.51)
N 15489 15,489 15,489
R-sq 0.924 0.924 0.924

38
Table 7: Tenure and the CEO’s Sensitivity of Options and Shares to Performance The results are obtained from pooled panel regressions of the CEO‟s sensitivity of options compensation (βoptions, Panel A) and
shares compensation (βshares, Panel B) to performance on the various independent variables. See Table 2 for variable descriptions.
All specifications include fiscal year and CEO-firm effects. In parentheses, we present t-statistics using robust standard errors
clustered by firm. ***, ** and * indicate statistically significance at the 1%, 5% and 10% levels, respectively. The coefficients on
Ln_Tenure and Ln_Tenure2 are multiplied by 1,000 and all controls in Table 6 are included but not reported for brevity.
Sensitivity of options compensation (βoptions) Sensitivity of shares compensation (βshares)
(1) (2) (3) (4) (5) (6)
Tenure_1
-1.814*
(-1.69)
-13.624*
(-1.83)
Tenure_2
-1.075
(-1.08)
-11.807*
(-1.73)
Tenure_3
-0.463
(-0.50)
-11.690*
(-1.89)
Tenure_4
-0.033
(-0.04)
-8.866
(-1.61)
Tenure_5
0.213
(0.27)
-7.964*
(-1.61)
Tenure_6
0.714
(0.99)
-7.788*
(-1.78)
Tenure_7
0.784
(1.19)
-6.578*
(-1.76)
Tenure_8
0.751
(1.32)
-4.506
(-1.47)
Tenure_9
0.911
(1.78)
-3.653
(-1.45)
Tenure_10
0.117
(0.29)
-2.661
(-1.45)
Ln_Tenure 1.70*** 1.54*** 4.91* -3.81
(6.83) (5.59) (1.91) (-1.50)
Ln_Tenure2 0.185 7.47**
(0.52) (2.28)
Controls Yes Yes Yes Yes Yes Yes
N 14,866 14,866 14,866 7,945 7,945 7,945
R-sq 0.848 0.848 0.848 0.935 0.935 0.935

39
Table 8: Information Environment and the Tenure-Pay Relationship
The results are obtained from pooled panel regressions of CEO pay levels (Lpay) on the various independent variables. All
specifications include fiscal year and CEO-firm effects. In parentheses, we present t-statistics using robust standard errors
clustered by firm. ***, ** and * indicate statistically significance at the 1%, 5% and 10% levels, respectively. All controls in
Table 6 are included but not reported for brevity. See Table 2 for variable descriptions. Low_Resvol (High_Resvol) is a dummy
indicating the residual stock return volatility being in the lowest (highest) quartile each year. Low_PPE (High_PPE) is a dummy
indicating PPE being in the lowest (highest) quartile each year. Ln_Tenure_ and Ln_Tenure2_ indicate interactions with
Ln_Tenure and Ln_Tenure2, respectively. All coefficients in regression (3)-(8) are multiplied by 1,000.
Lpay βtotal βoptions βshares
(1) (2) (3) (4) (5) (6) (7) (8)
Ln_Tenure_Low_Resvol 0.014 -0.230 0.052 -0.310
(1.64) (-0.45) (0.54) (-0.34)
Ln_Tenure 0.028 0.022 -0.094 -0.57 1.55*** 1.46*** -3.890 -4.25
(0.89) (0.68) (-0.08) (-0.49) (4.88) (4.27) (-1.32) (-1.45)
Ln_Tenure_High_Resvol 0.008 -0.13 -0.100 0.024
(-0.68) (-0.24) (-0.71) (0.03)
Ln_Tenure2 0.103*** 0.101*** 5.04** 4.99** 0.184 0.167 7.37* 7.35*
(3.54) (3.46) (-2.05) (2.03) (0.45) (0.41) (1.88) (1.87)
Ln_Tenure_Low_PPE 0.011 0.996 0.034 0.832
(0.62) (1.21) (0.13) (0.91)
Ln_Tenure_High_PPE 0.027 0.823 0.314 0.489
(1.64) (0.75) (1.21) (0.26)
Controls Yes Yes Yes Yes Yes Yes Yes Yes
N 15,972 15,972 15,489 15,489 14,866 14,866 7,945 7,945
R-sq 0.822 0.822 0.924 0.924 0.848 0.848 0.935 0.935
40
Table 9: Tenure-Pay Relationship for Inside and Outside CEOs
The results are obtained from pooled panel regressions of the total CEO pay (Lpay,), the CEO‟s total pay sensitivity to
performance (βtotal) and the CEO‟s pay sensitivity of options (βoptions,) and shares (βshares) to performance on the various
independent variables. See Table 2 for variable descriptions. All specifications include fiscal year and CEO-firm effects. In
parentheses, we present t-statistics using robust standard errors clustered by firm. ***, ** and * indicate statistically significance
at the 1%, 5% and 10% levels, respectively. All controls in Table 5 are included but not reported for brevity. All coefficients for
the pay-performance sensitivity measures (βtotal, βoptions,, and βshares) are multiplied by 1,000. _Inside_CEO is an interaction with a
dummy that equals 1 if the CEO comes from inside the firm, and equals zero otherwise.
Lpay βtotal βoptions βshares
Ln_Tenure 0.0669* 4.88*** 1.86*** 4.75
(1.68) (2.91) (3.90) (1.17)
Ln_Tenure_Inside_CEO 0.0635* 1.74 -0.316 6.29
(1.69) (1.29) (-0.65) (1.41)
Controls Yes Yes Yes Yes
N 8,831 8,599 8,202 4,272
R-sq 0.820 0.936 0.853 0.942

41
Table 10: Governance and the Tenure – Pay Relationship
The results are obtained from pooled panel regressions of the total CEO pay (Lpay,), the CEO‟s total pay sensitivity to performance (βtotal) and the CEO‟s pay sensitivity of options
(βoptions,) and shares (βshares) to performance on the various independent variables. See Table 2 for variable descriptions. All specifications include fiscal year and CEO-firm effects.
In parentheses, we present t-statistics using robust standard errors clustered by firm. ***, ** and * indicate statistically significance at the 1%, 5% and 10% levels, respectively. All
controls in Table 5 are included but not reported for brevity. All coefficients for the pay-performance sensitivity measures (βtotal, βoptions,, and βshares) are multiplied by 1,000. Low-
_CPS (High_CPS) is a dummy indicating the CEO pay slice being in the lowest (highest) quartile each year. Low_Board_Indep (High_Board_Indep) is a dummy indicating that
the faction of board member being in the lowest (highest) quartile each year. Low_Gindex (High_Gindex) is a dummy indicating that the antitakeover shareholder rights being in
the lowest (highest) quartile each year. Ln_Tenure_ and Ln_Tenure2_ indicate interactions with Ln_Tenure and Ln_Tenure2, respectively.
Pay Level Total Pay-Perf. Sensitivity
Options Pay-Perf. Sensitivity Shares Pay-Perf. Sensitivity
(1) (2) (3) (4) (5) (6) (7) (8) (9) (10) (11) (12)
Lpay Lpay Lpay βtotal βtotal βtotal βoptions βoptions βoptions βshares βshares βshares
Ln_Tenure_Low_CPS -0.234*** .00004 -0.0002* 0.0002
(-17.51) (-0.09) (-1.82) (0.45)
Ln_Tenure_Low_Board_Indep .00001 -0.007 0.007 -0.010
(-0.00) (-1.28) (0.48) (-1.46)
Ln_Tenure_Low_Gindex 0.006 -0.002* -0.003 -0.002
(0.42) (-1.73) (-1.47) (-1.16)
Ln_Tenure 0.016 0.028 0.025 -.0003 -.0005 -.0002 0.001*** 0.001*** 0.002*** -0.004 -0.004 -0.005
(0.54) (0.88) (0.77) (-0.25) (-0.44) (-0.19) (4.64) (4.62) (5.01) (-1.35) (-1.39) (-1.56)
Ln_Tenure_High_CPS 0.225*** 0.0004 0.0003*** 0.0002
(23.08) (1.13) (2.82) (0.26)
Ln_Tenure_High_Board_Indep 0.010 0.001*** 0.0002 0.002**
(1.05) (3.12) (1.44) (2.43)
Ln_Tenure_High_Gindex 0.013** 0.001 -0.0001 0.002*
(2.17) (1.16) (-0.32) (1.86)
Ln_Tenure2 0.061** 0.102*** 0.099*** 0.005* 0.005** 0.005* 0.0001 0.0002 0.0002 0.008 0.007* 0.007*
(2.32) (3.44) (3.41) (2.03) (1.98) (1.95) (0.31) (0.46) (0.42) (1.89) (1.80) (1.82)
N 15972 15972 15972 15489 15489 15489 14886 14886 14886 7945 7945 7945
R-sq 0.861 0.822 0.822 0.924 0.924 0.925 0.848 0.848 0.848 0.935 0.936 0.936