term 2017.3 (apr. 2016 mar. 2017) outline of accounts ... 2017.3 (apr. 2016~mar. 2017) outline of...
TRANSCRIPT

Term 2017.3 (Apr. 2016~Mar. 2017)Outline of Accounts Settlement
Stonecrest shop (Lithonia, Georgia)March 3, 2017 open!
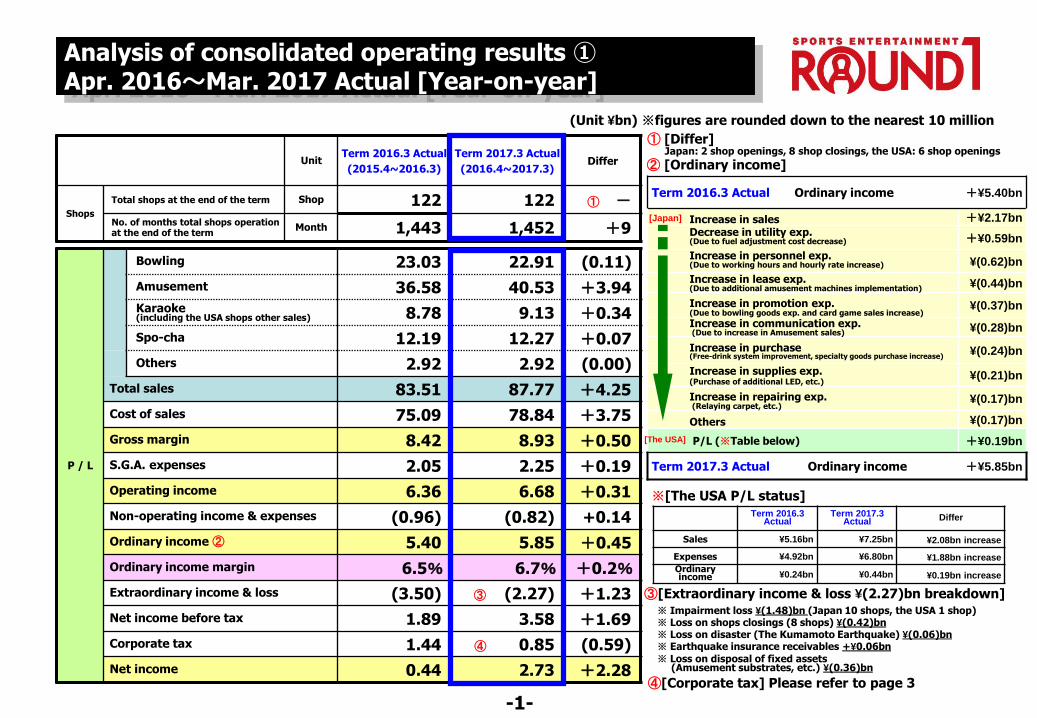
Term 2016.3 Actual Ordinary income +¥5.40bn
Increase in sales +¥2.17bn
Decrease in utility exp. (Due to fuel adjustment cost decrease) +¥0.59bn
Increase in personnel exp.(Due to working hours and hourly rate increase) ¥(0.62)bn
Increase in lease exp.(Due to additional amusement machines implementation) ¥(0.44)bn
Increase in promotion exp.(Due to bowling goods exp. and card game sales increase)
¥(0.37)bn
Increase in communication exp.(Due to increase in Amusement sales) ¥(0.28)bn
Increase in purchase (Free-drink system improvement, specialty goods purchase increase)
¥(0.24)bn
Increase in supplies exp.(Purchase of additional LED, etc.)
¥(0.21)bn
Increase in repairing exp. (Relaying carpet, etc.)
¥(0.17)bn
Others ¥(0.17)bn
P/L (※Table below) +¥0.19bn
Term 2017.3 Actual Ordinary income +¥5.85bn
Analysis of consolidated operating results ①Apr. 2016~Mar. 2017 Actual [Year-on-year]
P / L
Bowling 23.03 22.91 (0.11)
Amusement 36.58 40.53 +3.94Karaoke (including the USA shops other sales) 8.78 9.13 +0.34
Spo-cha 12.19 12.27 +0.07
Others 2.92 2.92 (0.00)
Total sales 83.51 87.77 +4.25
Cost of sales 75.09 78.84 +3.75
Gross margin 8.42 8.93 +0.50
S.G.A. expenses 2.05 2.25 +0.19
Operating income 6.36 6.68 +0.31
Non-operating income & expenses (0.96) (0.82) +0.14
Ordinary income ② 5.40 5.85 +0.45
Ordinary income margin 6.5% 6.7% +0.2%
Extraordinary income & loss (3.50) ③ (2.27) +1.23
Net income before tax 1.89 3.58 +1.69
Corporate tax 1.44 ④ 0.85 (0.59)
Net income 0.44 2.73 +2.28
UnitTerm 2016.3 Actual
(2015.4~2016.3)
Term 2017.3 Actual
(2016.4~2017.3)Differ
Shops
Total shops at the end of the term Shop 122 122 ① -No. of months total shops operation at the end of the term
Month 1,443 1,452 +9
-1-
Term 2016.3Actual
Term 2017.3 Actual Differ
Sales ¥5.16bn ¥7.25bn ¥2.08bn increase
Expenses ¥4.92bn ¥6.80bn ¥1.88bn increase
Ordinary income ¥0.24bn ¥0.44bn ¥0.19bn increase
※[The USA P/L status]
④[Corporate tax] Please refer to page 3
① [Differ]Japan: 2 shop openings, 8 shop closings, the USA: 6 shop openings
② [Ordinary income]
③[Extraordinary income & loss ¥(2.27)bn breakdown]※ Impairment loss ¥(1.48)bn (Japan 10 shops, the USA 1 shop)※ Loss on shops closings (8 shops) ¥(0.42)bn※ Loss on disaster (The Kumamoto Earthquake) ¥(0.06)bn※ Earthquake insurance receivables +¥0.06bn
※ Loss on disposal of fixed assets (Amusement substrates, etc.) ¥(0.36)bn
(Unit ¥bn) ※figures are rounded down to the nearest 10 million
[Japan]
[The USA]
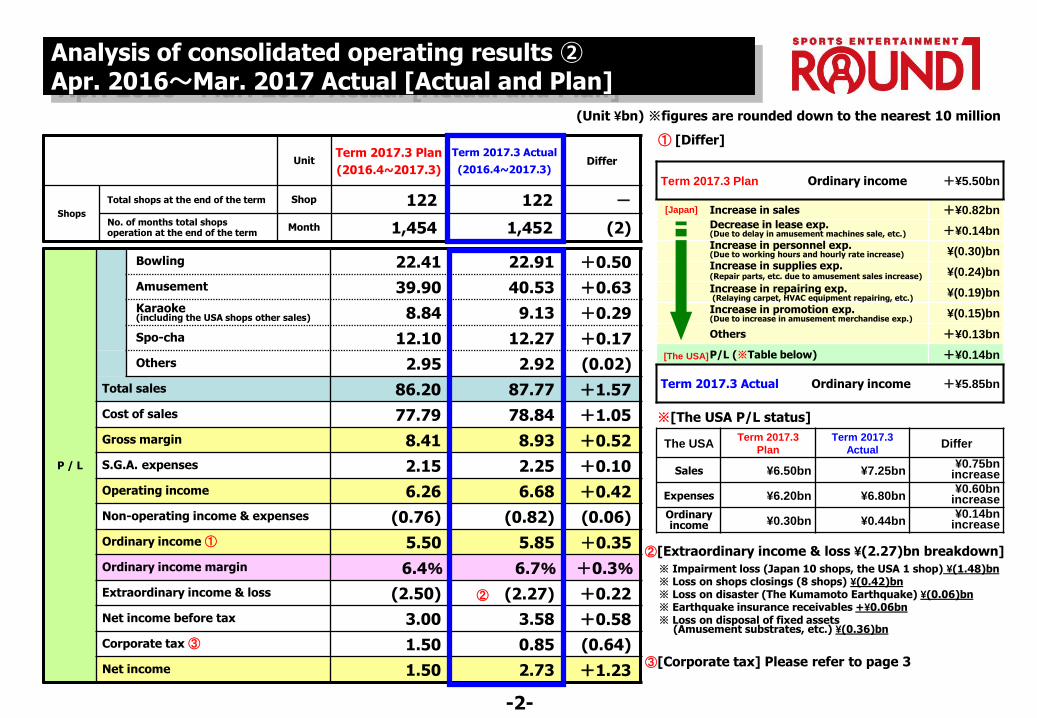
Term 2017.3 Plan Ordinary income +¥5.50bn
Increase in sales +¥0.82bn
Decrease in lease exp.(Due to delay in amusement machines sale, etc.) +¥0.14bn
Increase in personnel exp.(Due to working hours and hourly rate increase) ¥(0.30)bn
Increase in supplies exp.(Repair parts, etc. due to amusement sales increase) ¥(0.24)bn
Increase in repairing exp. (Relaying carpet, HVAC equipment repairing, etc.)
¥(0.19)bn
Increase in promotion exp.(Due to increase in amusement merchandise exp.)
¥(0.15)bn
Others +¥0.13bn
P/L (※Table below) +¥0.14bn
Term 2017.3 Actual Ordinary income +¥5.85bn
Analysis of consolidated operating results ②Apr. 2016~Mar. 2017 Actual [Actual and Plan]
P / L
Bowling 22.41 22.91 +0.50
Amusement 39.90 40.53 +0.63Karaoke (including the USA shops other sales) 8.84 9.13 +0.29
Spo-cha 12.10 12.27 +0.17
Others 2.95 2.92 (0.02)
Total sales 86.20 87.77 +1.57
Cost of sales 77.79 78.84 +1.05
Gross margin 8.41 8.93 +0.52
S.G.A. expenses 2.15 2.25 +0.10
Operating income 6.26 6.68 +0.42
Non-operating income & expenses (0.76) (0.82) (0.06)
Ordinary income ① 5.50 5.85 +0.35
Ordinary income margin 6.4% 6.7% +0.3%
Extraordinary income & loss (2.50) ② (2.27) +0.22
Net income before tax 3.00 3.58 +0.58
Corporate tax ③ 1.50 0.85 (0.64)
Net income 1.50 2.73 +1.23
UnitTerm 2017.3 Plan
(2016.4~2017.3)
Term 2017.3 Actual
(2016.4~2017.3)Differ
Shops
Total shops at the end of the term Shop 122 122 -No. of months total shops operation at the end of the term
Month 1,454 1,452 (2)
-2-
[Japan]
[The USA]
The USATerm 2017.3
Plan
Term 2017.3
ActualDiffer
Sales ¥6.50bn ¥7.25bn¥0.75bn
increase
Expenses ¥6.20bn ¥6.80bn¥0.60bn
increase
Ordinary income ¥0.30bn ¥0.44bn
¥0.14bn increase
※[The USA P/L status]
① [Differ]
(Unit ¥bn) ※figures are rounded down to the nearest 10 million
②[Extraordinary income & loss ¥(2.27)bn breakdown]
※ Impairment loss (Japan 10 shops, the USA 1 shop) ¥(1.48)bn※ Loss on shops closings (8 shops) ¥(0.42)bn※ Loss on disaster (The Kumamoto Earthquake) ¥(0.06)bn※ Earthquake insurance receivables +¥0.06bn※ Loss on disposal of fixed assets
(Amusement substrates, etc.) ¥(0.36)bn
③[Corporate tax] Please refer to page 3
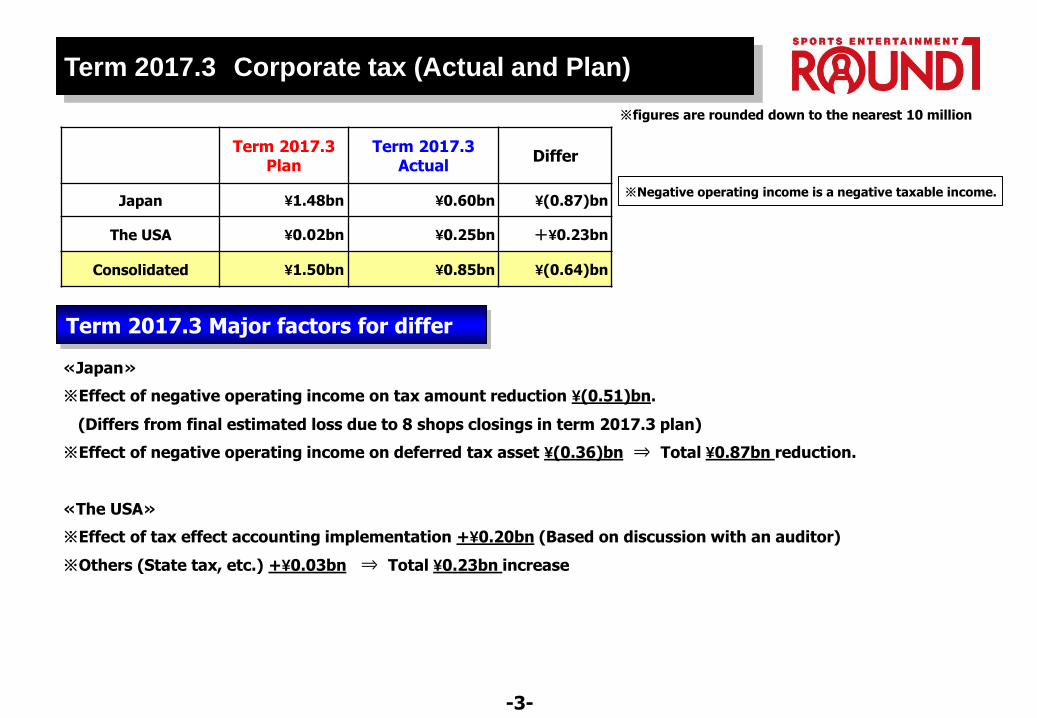
Term 2017.3 Corporate tax (Actual and Plan)
-3-
Term 2017.3 Plan
Term 2017.3 Actual
Differ
Japan ¥1.48bn ¥0.60bn ¥(0.87)bn
The USA ¥0.02bn ¥0.25bn +¥0.23bn
Consolidated ¥1.50bn ¥0.85bn ¥(0.64)bn
Term 2017.3 Major factors for differ
※Negative operating income is a negative taxable income.
※figures are rounded down to the nearest 10 million
≪Japan≫
※Effect of negative operating income on tax amount reduction ¥(0.51)bn.
(Differs from final estimated loss due to 8 shops closings in term 2017.3 plan)
※Effect of negative operating income on deferred tax asset ¥(0.36)bn ⇒ Total ¥0.87bn reduction.
≪The USA≫
※Effect of tax effect accounting implementation +¥0.20bn (Based on discussion with an auditor)
※Others (State tax, etc.) +¥0.03bn ⇒ Total ¥0.23bn increase
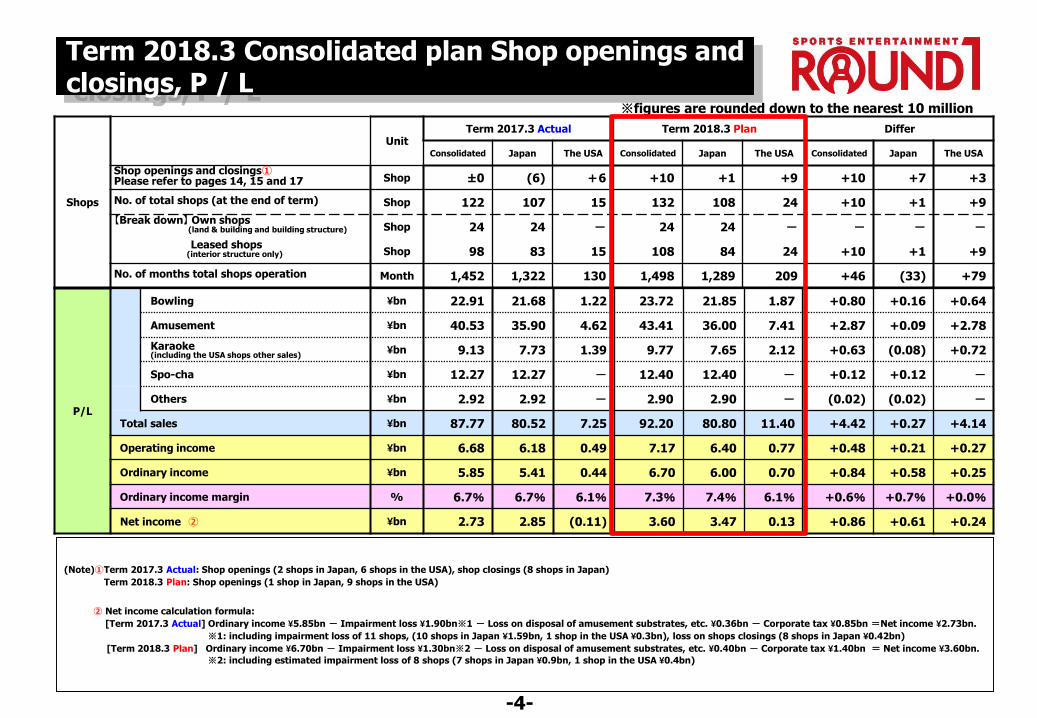
Term 2018.3 Consolidated plan Shop openings and closings, P / L
(Note)①Term 2017.3 Actual: Shop openings (2 shops in Japan, 6 shops in the USA), shop closings (8 shops in Japan)
Term 2018.3 Plan: Shop openings (1 shop in Japan, 9 shops in the USA)
② Net income calculation formula:
[Term 2017.3 Actual] Ordinary income ¥5.85bn - Impairment loss ¥1.90bn※1 - Loss on disposal of amusement substrates, etc. ¥0.36bn - Corporate tax ¥0.85bn =Net income ¥2.73bn.
※1: including impairment loss of 11 shops, (10 shops in Japan ¥1.59bn, 1 shop in the USA ¥0.3bn), loss on shops closings (8 shops in Japan ¥0.42bn)
[Term 2018.3 Plan] Ordinary income ¥6.70bn - Impairment loss ¥1.30bn※2 - Loss on disposal of amusement substrates, etc. ¥0.40bn - Corporate tax ¥1.40bn = Net income ¥3.60bn.
※2: including estimated impairment loss of 8 shops (7 shops in Japan ¥0.9bn, 1 shop in the USA ¥0.4bn)
P/L
Bowling ¥bn 22.91 21.68 1.22 23.72 21.85 1.87 +0.80 +0.16 +0.64
Amusement ¥bn 40.53 35.90 4.62 43.41 36.00 7.41 +2.87 +0.09 +2.78
Karaoke (including the USA shops other sales)
¥bn 9.13 7.73 1.39 9.77 7.65 2.12 +0.63 (0.08) +0.72
Spo-cha ¥bn 12.27 12.27 - 12.40 12.40 - +0.12 +0.12 -
Others ¥bn 2.92 2.92 - 2.90 2.90 - (0.02) (0.02) -
Total sales ¥bn 87.77 80.52 7.25 92.20 80.80 11.40 +4.42 +0.27 +4.14
Operating income ¥bn 6.68 6.18 0.49 7.17 6.40 0.77 +0.48 +0.21 +0.27
Ordinary income ¥bn 5.85 5.41 0.44 6.70 6.00 0.70 +0.84 +0.58 +0.25
Ordinary income margin % 6.7% 6.7% 6.1% 7.3% 7.4% 6.1% +0.6% +0.7% +0.0%
Net income ② ¥bn 2.73 2.85 (0.11) 3.60 3.47 0.13 +0.86 +0.61 +0.24
Shops
UnitTerm 2017.3 Actual Term 2018.3 Plan Differ
Consolidated Japan The USA Consolidated Japan The USA Consolidated Japan The USA
Shop openings and closings①Please refer to pages 14, 15 and 17 Shop ±0 (6) +6 +10 +1 +9 +10 +7 +3
No. of total shops (at the end of term) Shop 122 107 15 132 108 24 +10 +1 +9
【Break down】 Own shops(land & building and building structure) Shop 24 24 - 24 24 - - - -
Leased shops (interior structure only) Shop 98 83 15 108 84 24 +10 +1 +9
No. of months total shops operation Month 1,452 1,322 130 1,498 1,289 209 +46 (33) +79
-4-
※figures are rounded down to the nearest 10 million
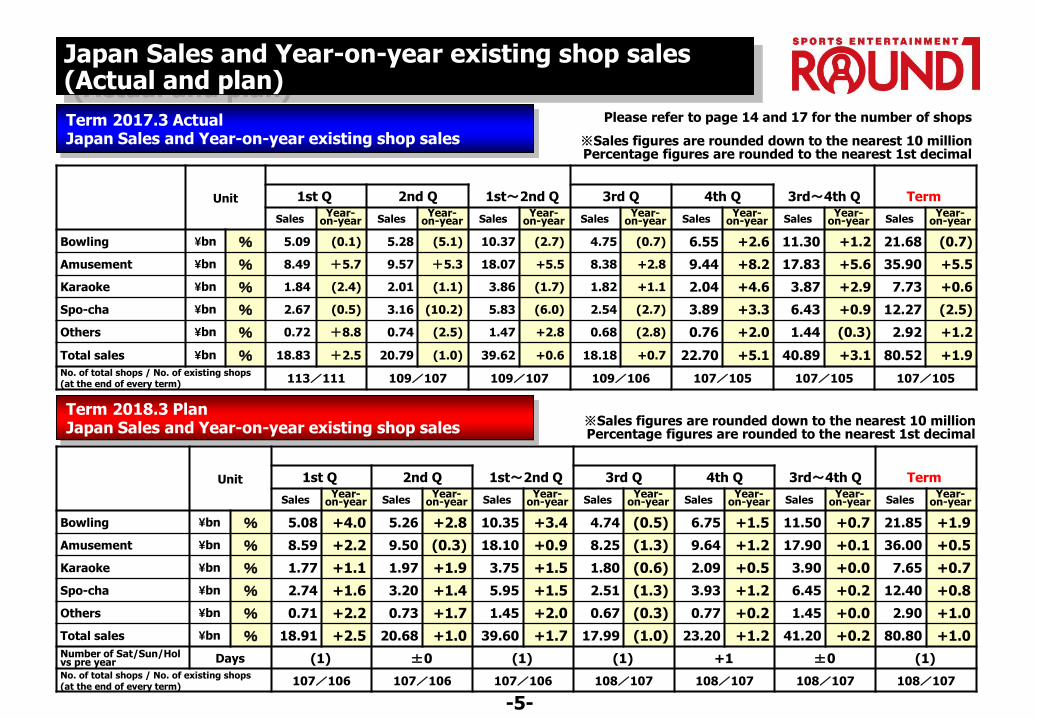
Japan Sales and Year-on-year existing shop sales(Actual and plan)
Unit 1st Q 2nd Q 1st~2nd Q 3rd Q 4th Q 3rd~4th Q Term
SalesYear-
on-year SalesYear-
on-year SalesYear-
on-year SalesYear-
on-year SalesYear-
on-year SalesYear-
on-year SalesYear-
on-year
Bowling ¥bn % 5.08 +4.0 5.26 +2.8 10.35 +3.4 4.74 (0.5) 6.75 +1.5 11.50 +0.7 21.85 +1.9
Amusement ¥bn % 8.59 +2.2 9.50 (0.3) 18.10 +0.9 8.25 (1.3) 9.64 +1.2 17.90 +0.1 36.00 +0.5
Karaoke ¥bn % 1.77 +1.1 1.97 +1.9 3.75 +1.5 1.80 (0.6) 2.09 +0.5 3.90 +0.0 7.65 +0.7
Spo-cha ¥bn % 2.74 +1.6 3.20 +1.4 5.95 +1.5 2.51 (1.3) 3.93 +1.2 6.45 +0.2 12.40 +0.8
Others ¥bn % 0.71 +2.2 0.73 +1.7 1.45 +2.0 0.67 (0.3) 0.77 +0.2 1.45 +0.0 2.90 +1.0
Total sales ¥bn % 18.91 +2.5 20.68 +1.0 39.60 +1.7 17.99 (1.0) 23.20 +1.2 41.20 +0.2 80.80 +1.0Number of Sat/Sun/Holvs pre year Days (1) ±0 (1) (1) +1 ±0 (1)No. of total shops / No. of existing shops (at the end of every term) 107/106 107/106 107/106 108/107 108/107 108/107 108/107
Term 2018.3 PlanJapan Sales and Year-on-year existing shop sales
Term 2017.3 ActualJapan Sales and Year-on-year existing shop sales
Unit 1st Q 2nd Q 1st~2nd Q 3rd Q 4th Q 3rd~4th Q Term
SalesYear-
on-year SalesYear-
on-year SalesYear-
on-year SalesYear-
on-year SalesYear-
on-year SalesYear-
on-year SalesYear-
on-year
Bowling ¥bn % 5.09 (0.1) 5.28 (5.1) 10.37 (2.7) 4.75 (0.7) 6.55 +2.6 11.30 +1.2 21.68 (0.7)
Amusement ¥bn % 8.49 +5.7 9.57 +5.3 18.07 +5.5 8.38 +2.8 9.44 +8.2 17.83 +5.6 35.90 +5.5
Karaoke ¥bn % 1.84 (2.4) 2.01 (1.1) 3.86 (1.7) 1.82 +1.1 2.04 +4.6 3.87 +2.9 7.73 +0.6
Spo-cha ¥bn % 2.67 (0.5) 3.16 (10.2) 5.83 (6.0) 2.54 (2.7) 3.89 +3.3 6.43 +0.9 12.27 (2.5)
Others ¥bn % 0.72 +8.8 0.74 (2.5) 1.47 +2.8 0.68 (2.8) 0.76 +2.0 1.44 (0.3) 2.92 +1.2
Total sales ¥bn % 18.83 +2.5 20.79 (1.0) 39.62 +0.6 18.18 +0.7 22.70 +5.1 40.89 +3.1 80.52 +1.9No. of total shops / No. of existing shops (at the end of every term) 113/111 109/107 109/107 109/106 107/105 107/105 107/105
-5-
※Sales figures are rounded down to the nearest 10 millionPercentage figures are rounded to the nearest 1st decimal
Please refer to page 14 and 17 for the number of shops
※Sales figures are rounded down to the nearest 10 millionPercentage figures are rounded to the nearest 1st decimal

The USA Sales and Year-on-year existing shop sales(Actual and plan)
Unit 1st Q 2nd Q 1st~2nd Q 3rd Q 4th Q 3rd~4th Q Term
SalesYear-
on-year SalesYear-
on-year SalesYear-
on-year SalesYear-
on-year SalesYear-
on-year SalesYear-
on-year SalesYear-
on-year
Bowling ¥bn % 0.39 (0.8) 0.41 (1.4) 0.81 (1.1) 0.44 (2.0) 0.61 (1.1) 1.06 (1.5) 1.87 (1.3)
Amusement ¥bn % 1.55 (2.0) 1.67 (3.6) 3.23 (2.9) 1.62 (4.4) 2.55 (0.8) 4.18 (2.3) 7.41 (2.6)
Karaoke, etc.※ ¥bn % 0.45 +3.8 0.45 +6.3 0.91 +5.1 0.51 +2.5 0.69 +1.4 1.21 +1.9 2.12 +3.2
Total sales ¥bn % 2.40 (0.7) 2.54 (1.5) 4.95 (1.1) 2.58 (2.6) 3.86 (0.4) 6.45 (1.3) 11.40 (1.2)No. of total shops / No. of existing shops (at the end of every term) 15/10 16/11 16/11 18/11 24/13 24/13 24/13
Term 2018.3 Plan The USA Sales and Year-on-year existing shop sales (Year-on-year figures compared in $)
Term 2017.3 Actual The USA Sales and Year-on-year existing shop sales (Year-on-year figures compared in $)
Unit 1st Q 2nd Q 1st~2nd Q 3rd Q 4th Q 3rd~4th Q Term
SalesYear-
on-year SalesYear-
on-year SalesYear-
on-year SalesYear-
on-year SalesYear-
on-year SalesYear-
on-year SalesYear-
on-year
Bowling ¥bn % 0.26 +12.2 0.26 +2.0 0.52 +6.4 0.29 (1.1) 0.39 (7.1) 0.69 (4.5) 1.22 (0.3)
Amusement ¥bn % 0.91 +17.7 1.03 (1.9) 1.95 +6.0 1.10 +2.9 1.56 +0.3 2.67 +1.4 4.62 +3.2
Karaoke, etc.※ ¥bn % 0.27 +10.7 0.28 +1.9 0.56 +5.7 0.35 +3.1 0.47 +1.4 0.83 +2.1 1.39 +3.5
Total sales ¥bn % 1.45 +15.2 1.58 (0.5) 3.04 +6.0 1.75 +2.2 2.44 (0.8) 4.20 +0.4 7.25 +2.6No. of total shops / No. of existing shops (at the end of every term) 10/6 11/7 11/7 12/8 15/9 15/9 15/9
$ exchange rate ¥ 108.1 105.2 105.2 106.6 108.3 108.3 108.3
[Note] In calculation of sales plan exchange rate $1 = ¥110 is used.
※ Karaoke sales is mostly food & beverage sales.
-6-
Please refer to page 14, 15 and 17 for the number of shops
※Sales figures are rounded down to the nearest 10 millionPercentage figures are rounded to the nearest 1st decimal
※Sales figures are rounded down to the nearest 10 millionPercentage figures are rounded to the nearest 1st decimal

Term 2018.3 plan Basis for planning
-7-
Income decrease factors◆Increase in personnel exp.
(Due to working hours and hourly rate increase)
Income decrease¥0.50bn
(Previous term actual ¥19.45bn ⇒ Current term plan ¥19.96bn)
◆Increase in lease exp. (Increase in amusement machines implementation)
Income decrease¥0.57bn
(Previous term actual ¥8.25bn ⇒ Current term plan ¥8.83bn)
◆Increase in rent exp. (Due to LaLaport SHONAN HIRATSUKA, Kichijoji, etc. shop openings)
Income decrease¥0.33bn
(Previous term actual ¥14.60bn ⇒ Current term plan ¥14.93bn)
◆Increase in advertising expenses (Increase in TV commercial and TV personality casting exp.)
Income decrease¥0.19bn
(Previous term actual ¥1.42bn ⇒ Current term plan ¥1.62bn)
◆Decrease in exp. due to shop closings (8 shops)Income increase¥1.62bn
(Previous term actual ¥1.62bn ⇒ Current term plan (none))
Income increase factor◆Non-operating exp. (Foreign exchange loss and interest exp. decrease) Income increase (Previous term actual ¥0.89bn ⇒ Current term plan ¥0.49bn)
¥0.40bn
Year-on-year existing shop sales +1.0% per year ¥0.75bn increase (Previous term actual ¥79.10bn⇒ Current term plan ¥79.85bn)
Shop openings (No. of operation months below 12) ¥0.82bn increase (Previous term actual (none)⇒ Current term plan ¥0.82bn)
Shop closings (8 shops, 46 operation months decrease) ¥1.30bn decrease (Previous term actual ¥1.30bn⇒ Current term plan (none))
[Japan sales ¥0.27bn increase Major factors (compared to previous term)]
[Japan income decrease due to costs of ¥0.07bn and income increase due to non-operating income and expenses of ¥0.37bn Major factors (compared to previous term)]
[Extraordinary income ¥0.57bn increase Major factors (compared to previous term)]
[The USA income ¥0.25bn increase Major factors (compared to previous term)]
※figures are rounded down to the nearest 10 million
Major factors: estimated decrease in impairment loss ¥0.54bn
Previous term actual ¥1.84bn Current term plan ¥1.30bn (Impairment loss 11 shops and 8 shop closings) (Impairment loss 8 shops)
Sales ¥11.40bn (Year-on-year existing shop sales (1.2)% assumed) Number of operating months 209
Ordinary income Previous term actual ¥0.44bn ⇒ Current term plan ¥0.70bn (9 shop openings: including opening exp. ¥0.45bn)
⇒
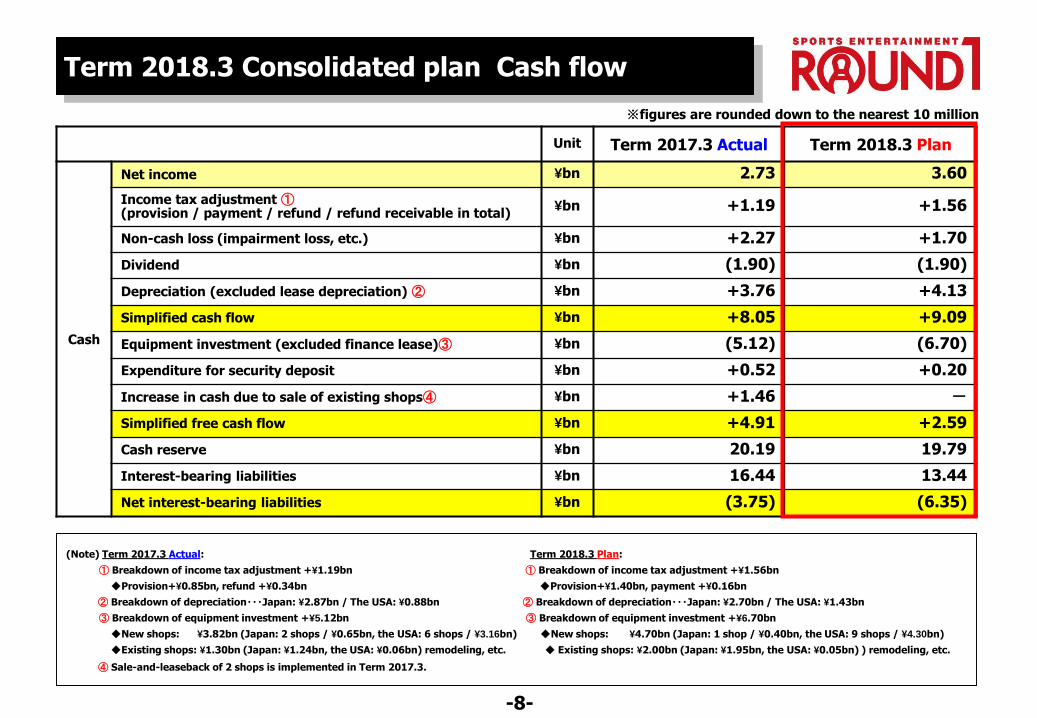
Term 2018.3 Consolidated plan Cash flow
Unit Term 2017.3 Actual Term 2018.3 Plan
Cash
Net income ¥bn 2.73 3.60
Income tax adjustment ①(provision / payment / refund / refund receivable in total)
¥bn +1.19 +1.56
Non-cash loss (impairment loss, etc.) ¥bn +2.27 +1.70
Dividend ¥bn (1.90) (1.90)
Depreciation (excluded lease depreciation) ② ¥bn +3.76 +4.13
Simplified cash flow ¥bn +8.05 +9.09
Equipment investment (excluded finance lease)③ ¥bn (5.12) (6.70)
Expenditure for security deposit ¥bn +0.52 +0.20
Increase in cash due to sale of existing shops④ ¥bn +1.46 -
Simplified free cash flow ¥bn +4.91 +2.59
Cash reserve ¥bn 20.19 19.79
Interest-bearing liabilities ¥bn 16.44 13.44
Net interest-bearing liabilities ¥bn (3.75) (6.35)
(Note) Term 2017.3 Actual: Term 2018.3 Plan:
① Breakdown of income tax adjustment +¥1.19bn ① Breakdown of income tax adjustment +¥1.56bn
◆Provision+¥0.85bn, refund +¥0.34bn ◆Provision+¥1.40bn, payment +¥0.16bn
② Breakdown of depreciation・・・Japan: ¥2.87bn / The USA: ¥0.88bn ② Breakdown of depreciation・・・Japan: ¥2.70bn / The USA: ¥1.43bn
③ Breakdown of equipment investment +¥5.12bn ③ Breakdown of equipment investment +¥6.70bn
◆New shops: ¥3.82bn (Japan: 2 shops / ¥0.65bn, the USA: 6 shops / ¥3.16bn) ◆New shops: ¥4.70bn (Japan: 1 shop / ¥0.40bn, the USA: 9 shops / ¥4.30bn)
◆Existing shops: ¥1.30bn (Japan: ¥1.24bn, the USA: ¥0.06bn) remodeling, etc. ◆ Existing shops: ¥2.00bn (Japan: ¥1.95bn, the USA: ¥0.05bn) ) remodeling, etc.
④ Sale-and-leaseback of 2 shops is implemented in Term 2017.3.
-8-
※figures are rounded down to the nearest 10 million
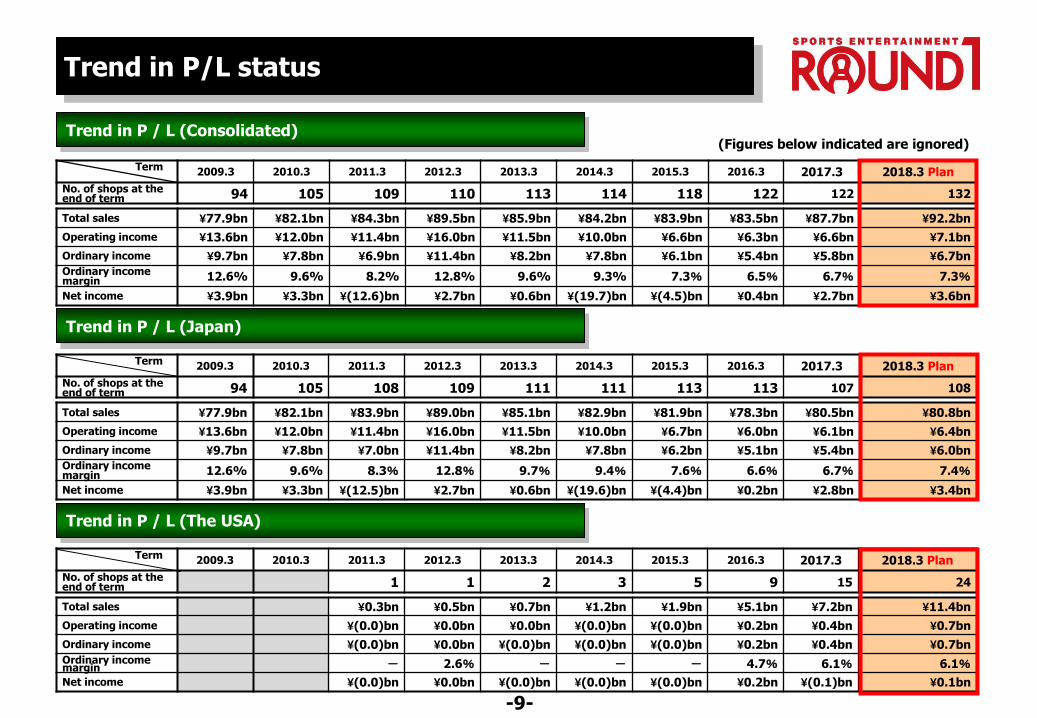
Trend in P/L status
Term 2009.3 2010.3 2011.3 2012.3 2013.3 2014.3 2015.3 2016.3 2017.3 2018.3 Plan
No. of shops at the end of term 94 105 109 110 113 114 118 122 122 132
Total sales ¥77.9bn ¥82.1bn ¥84.3bn ¥89.5bn ¥85.9bn ¥84.2bn ¥83.9bn ¥83.5bn ¥87.7bn ¥92.2bn
Operating income ¥13.6bn ¥12.0bn ¥11.4bn ¥16.0bn ¥11.5bn ¥10.0bn ¥6.6bn ¥6.3bn ¥6.6bn ¥7.1bn
Ordinary income ¥9.7bn ¥7.8bn ¥6.9bn ¥11.4bn ¥8.2bn ¥7.8bn ¥6.1bn ¥5.4bn ¥5.8bn ¥6.7bn
Ordinary income margin 12.6% 9.6% 8.2% 12.8% 9.6% 9.3% 7.3% 6.5% 6.7% 7.3%
Net income ¥3.9bn ¥3.3bn ¥(12.6)bn ¥2.7bn ¥0.6bn ¥(19.7)bn ¥(4.5)bn ¥0.4bn ¥2.7bn ¥3.6bn
Trend in P / L (Consolidated)
Term 2009.3 2010.3 2011.3 2012.3 2013.3 2014.3 2015.3 2016.3 2017.3 2018.3 Plan
No. of shops at the end of term 94 105 108 109 111 111 113 113 107 108
Total sales ¥77.9bn ¥82.1bn ¥83.9bn ¥89.0bn ¥85.1bn ¥82.9bn ¥81.9bn ¥78.3bn ¥80.5bn ¥80.8bn
Operating income ¥13.6bn ¥12.0bn ¥11.4bn ¥16.0bn ¥11.5bn ¥10.0bn ¥6.7bn ¥6.0bn ¥6.1bn ¥6.4bn
Ordinary income ¥9.7bn ¥7.8bn ¥7.0bn ¥11.4bn ¥8.2bn ¥7.8bn ¥6.2bn ¥5.1bn ¥5.4bn ¥6.0bn
Ordinary income margin 12.6% 9.6% 8.3% 12.8% 9.7% 9.4% 7.6% 6.6% 6.7% 7.4%
Net income ¥3.9bn ¥3.3bn ¥(12.5)bn ¥2.7bn ¥0.6bn ¥(19.6)bn ¥(4.4)bn ¥0.2bn ¥2.8bn ¥3.4bn
Term 2009.3 2010.3 2011.3 2012.3 2013.3 2014.3 2015.3 2016.3 2017.3 2018.3 Plan
No. of shops at the end of term 1 1 2 3 5 9 15 24
Total sales ¥0.3bn ¥0.5bn ¥0.7bn ¥1.2bn ¥1.9bn ¥5.1bn ¥7.2bn ¥11.4bn
Operating income ¥(0.0)bn ¥0.0bn ¥0.0bn ¥(0.0)bn ¥(0.0)bn ¥0.2bn ¥0.4bn ¥0.7bn
Ordinary income ¥(0.0)bn ¥0.0bn ¥(0.0)bn ¥(0.0)bn ¥(0.0)bn ¥0.2bn ¥0.4bn ¥0.7bn
Ordinary income margin - 2.6% - - - 4.7% 6.1% 6.1%
Net income ¥(0.0)bn ¥0.0bn ¥(0.0)bn ¥(0.0)bn ¥(0.0)bn ¥0.2bn ¥(0.1)bn ¥0.1bn
Trend in P / L (Japan)
Trend in P / L (The USA)
-9-
(Figures below indicated are ignored)
60
70
80
90
100
110
120
130
140
150
160
170
180
Term1999.3
Term2000.3
Term2001.3
Term2002.3
Term2003.3
Term2004.3
Term2005.3
Term2006.3
Term2007.3
Term2008.3
Term2009.3
Term2010.3
Term2011.3
Term2012.3
Term2013.3
Term2014.3
Term2015.3
Term2016.3
Term2017.3
Term2018.3
Bowling Amusement Total sales
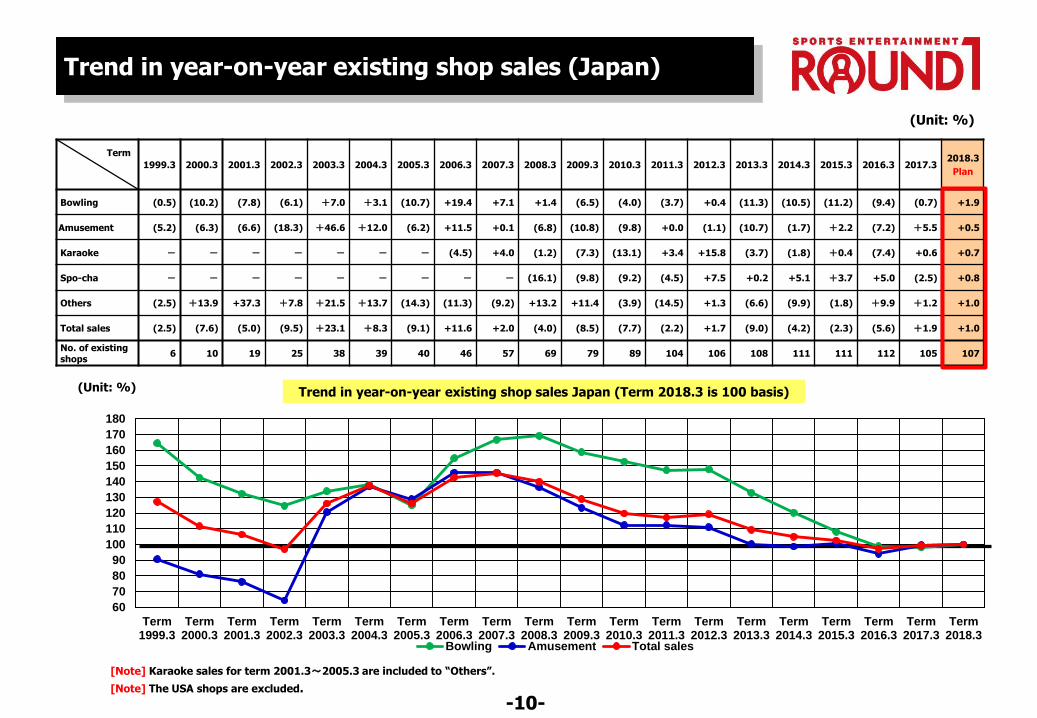
Trend in year-on-year existing shop sales (Japan)
Term
1999.3 2000.3 2001.3 2002.3 2003.3 2004.3 2005.3 2006.3 2007.3 2008.3 2009.3 2010.3 2011.3 2012.3 2013.3 2014.3 2015.3 2016.3 2017.32018.3
Plan
Bowling (0.5) (10.2) (7.8) (6.1) +7.0 +3.1 (10.7) +19.4 +7.1 +1.4 (6.5) (4.0) (3.7) +0.4 (11.3) (10.5) (11.2) (9.4) (0.7) +1.9
Amusement (5.2) (6.3) (6.6) (18.3) +46.6 +12.0 (6.2) +11.5 +0.1 (6.8) (10.8) (9.8) +0.0 (1.1) (10.7) (1.7) +2.2 (7.2) +5.5 +0.5
Karaoke - - - - - - - (4.5) +4.0 (1.2) (7.3) (13.1) +3.4 +15.8 (3.7) (1.8) +0.4 (7.4) +0.6 +0.7
Spo-cha - - - - - - - - - (16.1) (9.8) (9.2) (4.5) +7.5 +0.2 +5.1 +3.7 +5.0 (2.5) +0.8
Others (2.5) +13.9 +37.3 +7.8 +21.5 +13.7 (14.3) (11.3) (9.2) +13.2 +11.4 (3.9) (14.5) +1.3 (6.6) (9.9) (1.8) +9.9 +1.2 +1.0
Total sales (2.5) (7.6) (5.0) (9.5) +23.1 +8.3 (9.1) +11.6 +2.0 (4.0) (8.5) (7.7) (2.2) +1.7 (9.0) (4.2) (2.3) (5.6) +1.9 +1.0
No. of existing shops
6 10 19 25 38 39 40 46 57 69 79 89 104 106 108 111 111 112 105 107
Trend in year-on-year existing shop sales Japan (Term 2018.3 is 100 basis)
-10-
(Unit: %)
[Note] Karaoke sales for term 2001.3~2005.3 are included to “Others”.
[Note] The USA shops are excluded.
(Unit: %)
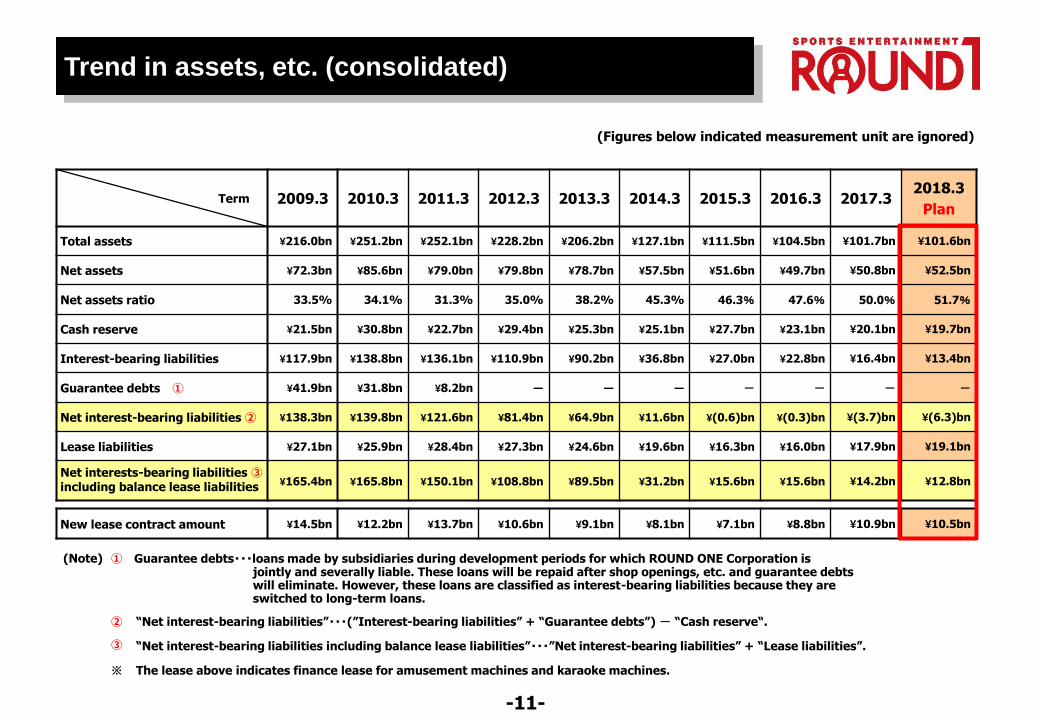
Trend in assets, etc. (consolidated)
Term 2009.3 2010.3 2011.3 2012.3 2013.3 2014.3 2015.3 2016.3 2017.32018.3
Plan
Total assets ¥216.0bn ¥251.2bn ¥252.1bn ¥228.2bn ¥206.2bn ¥127.1bn ¥111.5bn ¥104.5bn ¥101.7bn ¥101.6bn
Net assets ¥72.3bn ¥85.6bn ¥79.0bn ¥79.8bn ¥78.7bn ¥57.5bn ¥51.6bn ¥49.7bn ¥50.8bn ¥52.5bn
Net assets ratio 33.5% 34.1% 31.3% 35.0% 38.2% 45.3% 46.3% 47.6% 50.0% 51.7%
Cash reserve ¥21.5bn ¥30.8bn ¥22.7bn ¥29.4bn ¥25.3bn ¥25.1bn ¥27.7bn ¥23.1bn ¥20.1bn ¥19.7bn
Interest-bearing liabilities ¥117.9bn ¥138.8bn ¥136.1bn ¥110.9bn ¥90.2bn ¥36.8bn ¥27.0bn ¥22.8bn ¥16.4bn ¥13.4bn
Guarantee debts ① ¥41.9bn ¥31.8bn ¥8.2bn ― ― ― - - - -
Net interest-bearing liabilities ② ¥138.3bn ¥139.8bn ¥121.6bn ¥81.4bn ¥64.9bn ¥11.6bn ¥(0.6)bn ¥(0.3)bn ¥(3.7)bn ¥(6.3)bn
Lease liabilities ¥27.1bn ¥25.9bn ¥28.4bn ¥27.3bn ¥24.6bn ¥19.6bn ¥16.3bn ¥16.0bn ¥17.9bn ¥19.1bn
Net interests-bearing liabilities ③including balance lease liabilities ¥165.4bn ¥165.8bn ¥150.1bn ¥108.8bn ¥89.5bn ¥31.2bn ¥15.6bn ¥15.6bn ¥14.2bn ¥12.8bn
New lease contract amount ¥14.5bn ¥12.2bn ¥13.7bn ¥10.6bn ¥9.1bn ¥8.1bn ¥7.1bn ¥8.8bn ¥10.9bn ¥10.5bn
-11-
(Figures below indicated measurement unit are ignored)
(Note) ① Guarantee debts・・・loans made by subsidiaries during development periods for which ROUND ONE Corporation is jointly and severally liable. These loans will be repaid after shop openings, etc. and guarantee debtswill eliminate. However, these loans are classified as interest-bearing liabilities because they are switched to long-term loans.
② “Net interest-bearing liabilities”・・・(”Interest-bearing liabilities” + “Guarantee debts”) - “Cash reserve“.
③ “Net interest-bearing liabilities including balance lease liabilities”・・・”Net interest-bearing liabilities” + “Lease liabilities”.
※ The lease above indicates finance lease for amusement machines and karaoke machines.
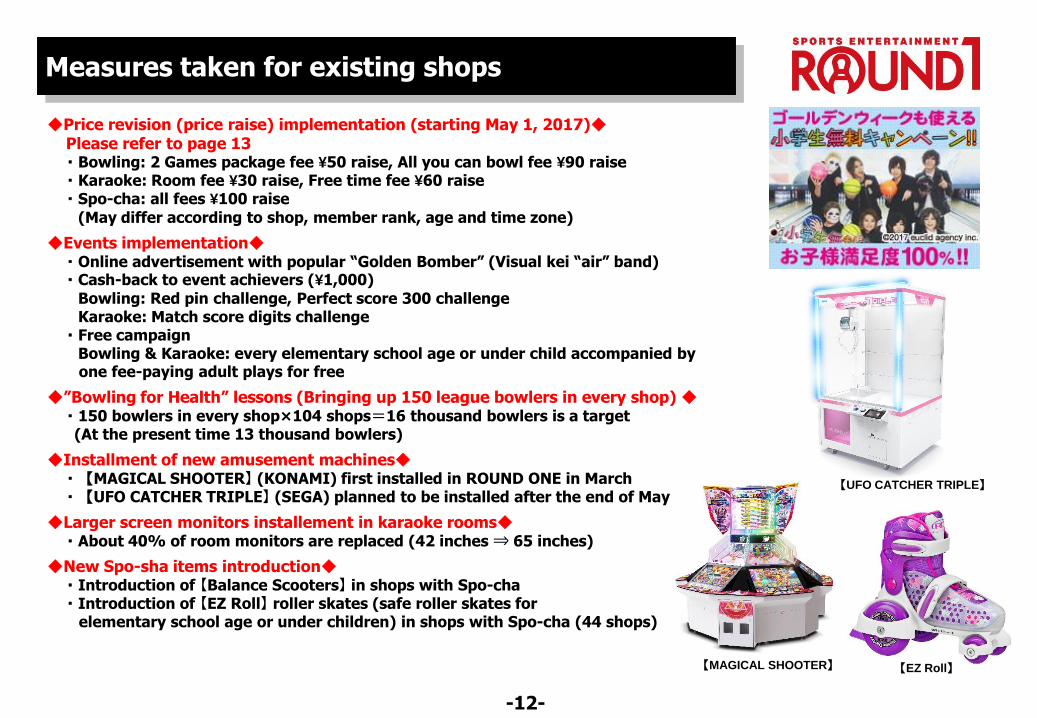
Measures taken for existing shops
-12-
◆Price revision (price raise) implementation (starting May 1, 2017)◆Please refer to page 13・Bowling: 2 Games package fee ¥50 raise, All you can bowl fee ¥90 raise・Karaoke: Room fee ¥30 raise, Free time fee ¥60 raise・Spo-cha: all fees ¥100 raise
(May differ according to shop, member rank, age and time zone)
◆Events implementation◆・Online advertisement with popular “Golden Bomber” (Visual kei “air” band)・Cash-back to event achievers (¥1,000)
Bowling: Red pin challenge, Perfect score 300 challengeKaraoke: Match score digits challenge
・Free campaignBowling & Karaoke: every elementary school age or under child accompanied by one fee-paying adult plays for free
◆”Bowling for Health” lessons (Bringing up 150 league bowlers in every shop) ◆・150 bowlers in every shop×104 shops=16 thousand bowlers is a target
(At the present time 13 thousand bowlers)
◆Installment of new amusement machines◆・【MAGICAL SHOOTER】 (KONAMI) first installed in ROUND ONE in March・【UFO CATCHER TRIPLE】 (SEGA) planned to be installed after the end of May
◆Larger screen monitors installement in karaoke rooms◆・About 40% of room monitors are replaced (42 inches ⇒ 65 inches)
◆New Spo-sha items introduction◆・Introduction of 【Balance Scooters】 in shops with Spo-cha・Introduction of 【EZ Roll】 roller skates (safe roller skates for
elementary school age or under children) in shops with Spo-cha (44 shops)
【MAGICAL SHOOTER】 【EZ Roll】
【UFO CATCHER TRIPLE】
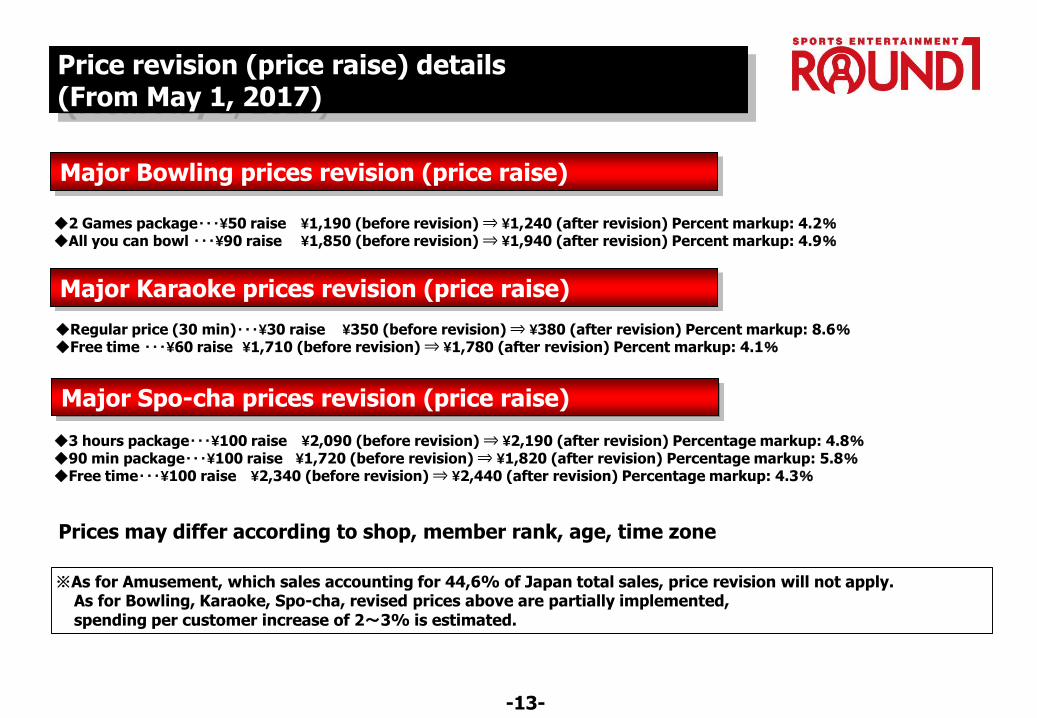
Price revision (price raise) details (From May 1, 2017)
Major Bowling prices revision (price raise)
◆2 Games package・・・¥50 raise ¥1,190 (before revision) ⇒ ¥1,240 (after revision) Percent markup: 4.2%◆All you can bowl ・・・¥90 raise ¥1,850 (before revision) ⇒ ¥1,940 (after revision) Percent markup: 4.9%
Major Karaoke prices revision (price raise)
◆Regular price (30 min)・・・¥30 raise ¥350 (before revision) ⇒ ¥380 (after revision) Percent markup: 8.6%◆Free time ・・・¥60 raise ¥1,710 (before revision) ⇒ ¥1,780 (after revision) Percent markup: 4.1%
Major Spo-cha prices revision (price raise)
◆3 hours package・・・¥100 raise ¥2,090 (before revision) ⇒ ¥2,190 (after revision) Percentage markup: 4.8%◆90 min package・・・¥100 raise ¥1,720 (before revision) ⇒ ¥1,820 (after revision) Percentage markup: 5.8%◆Free time・・・¥100 raise ¥2,340 (before revision) ⇒ ¥2,440 (after revision) Percentage markup: 4.3%
Prices may differ according to shop, member rank, age, time zone
-13-
※As for Amusement, which sales accounting for 44,6% of Japan total sales, price revision will not apply. As for Bowling, Karaoke, Spo-cha, revised prices above are partially implemented,spending per customer increase of 2~3% is estimated.
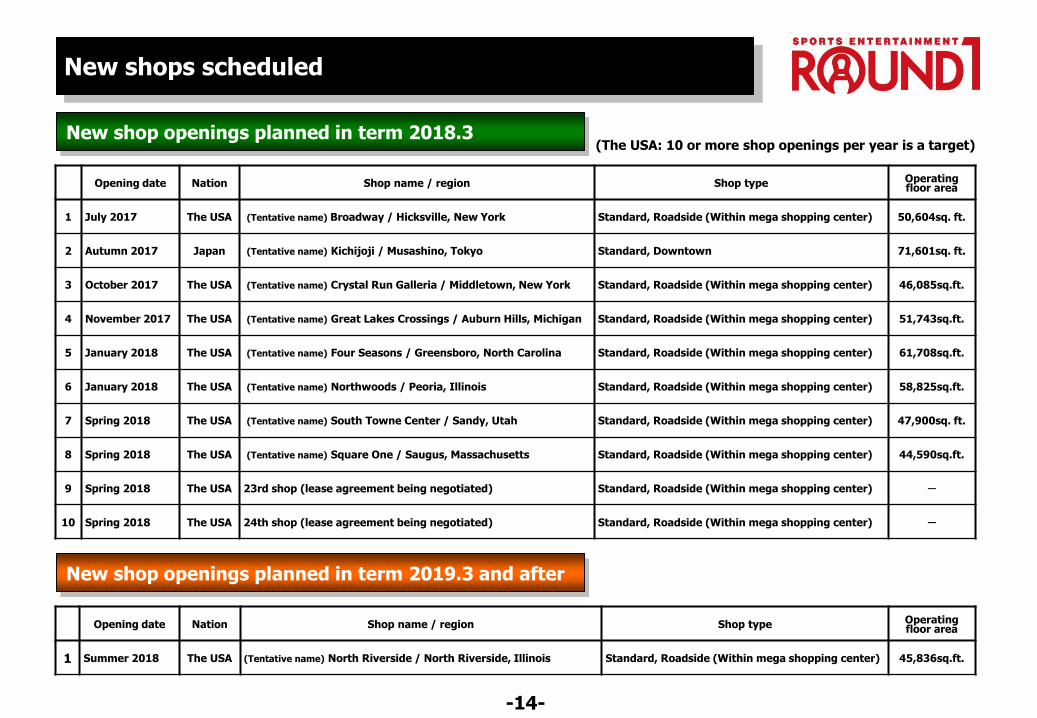
New shops scheduled
New shop openings planned in term 2018.3
Opening date Nation Shop name / region Shop type Operating floor area
1 July 2017 The USA (Tentative name) Broadway / Hicksville, New York Standard, Roadside (Within mega shopping center) 50,604sq. ft.
2 Autumn 2017 Japan (Tentative name) Kichijoji / Musashino, Tokyo Standard, Downtown 71,601sq. ft.
3 October 2017 The USA (Tentative name) Crystal Run Galleria / Middletown, New York Standard, Roadside (Within mega shopping center) 46,085sq.ft.
4 November 2017 The USA (Tentative name) Great Lakes Crossings / Auburn Hills, Michigan Standard, Roadside (Within mega shopping center) 51,743sq.ft.
5 January 2018 The USA (Tentative name) Four Seasons / Greensboro, North Carolina Standard, Roadside (Within mega shopping center) 61,708sq.ft.
6 January 2018 The USA (Tentative name) Northwoods / Peoria, Illinois Standard, Roadside (Within mega shopping center) 58,825sq.ft.
7 Spring 2018 The USA (Tentative name) South Towne Center / Sandy, Utah Standard, Roadside (Within mega shopping center) 47,900sq. ft.
8 Spring 2018 The USA (Tentative name) Square One / Saugus, Massachusetts Standard, Roadside (Within mega shopping center) 44,590sq.ft.
9 Spring 2018 The USA 23rd shop (lease agreement being negotiated) Standard, Roadside (Within mega shopping center) -
10 Spring 2018 The USA 24th shop (lease agreement being negotiated) Standard, Roadside (Within mega shopping center) -
-14-
New shop openings planned in term 2019.3 and after
Opening date Nation Shop name / region Shop type Operating floor area
1 Summer 2018 The USA (Tentative name) North Riverside / North Riverside, Illinois Standard, Roadside (Within mega shopping center) 45,836sq.ft.
(The USA: 10 or more shop openings per year is a target)
Existing shops and principles of conditions for future shops openings in the USA
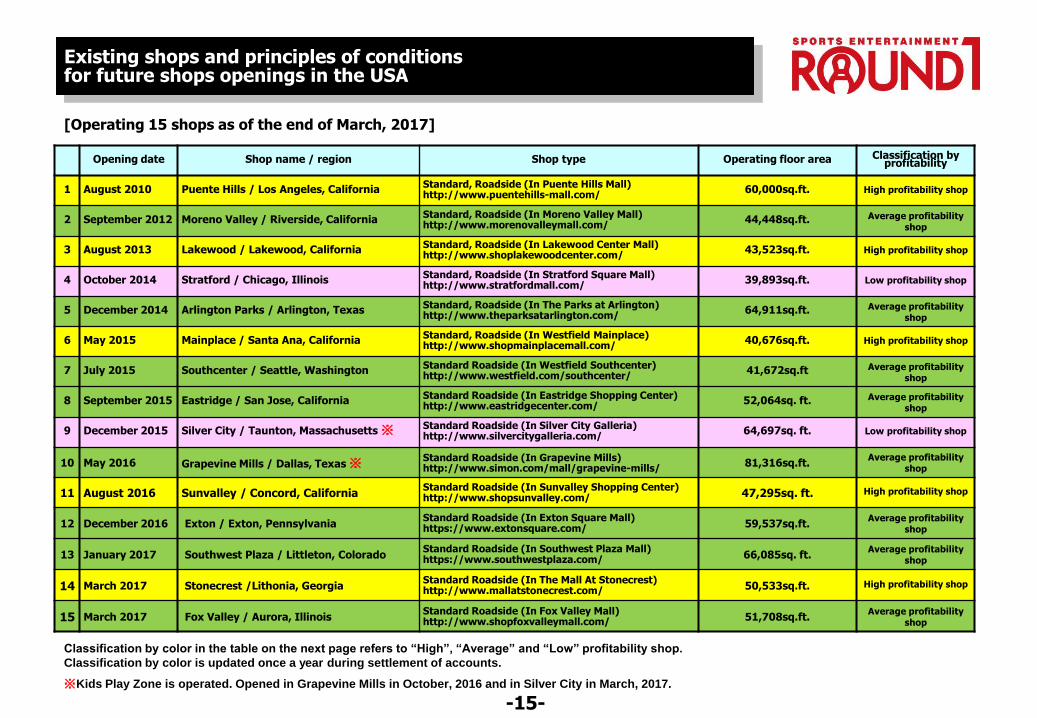
[Operating 15 shops as of the end of March, 2017]
Opening date Shop name / region Shop type Operating floor area Classification by profitability
1 August 2010 Puente Hills / Los Angeles, CaliforniaStandard, Roadside (In Puente Hills Mall)http://www.puentehills-mall.com/
60,000sq.ft. High profitability shop
2 September 2012 Moreno Valley / Riverside, CaliforniaStandard, Roadside (In Moreno Valley Mall)http://www.morenovalleymall.com/
44,448sq.ft. Average profitability shop
3 August 2013 Lakewood / Lakewood, CaliforniaStandard, Roadside (In Lakewood Center Mall)http://www.shoplakewoodcenter.com/
43,523sq.ft. High profitability shop
4 October 2014 Stratford / Chicago, IllinoisStandard, Roadside (In Stratford Square Mall)http://www.stratfordmall.com/
39,893sq.ft. Low profitability shop
5 December 2014 Arlington Parks / Arlington, TexasStandard, Roadside (In The Parks at Arlington)http://www.theparksatarlington.com/
64,911sq.ft. Average profitability shop
6 May 2015 Mainplace / Santa Ana, CaliforniaStandard, Roadside (In Westfield Mainplace)http://www.shopmainplacemall.com/
40,676sq.ft. High profitability shop
7 July 2015 Southcenter / Seattle, WashingtonStandard Roadside (In Westfield Southcenter)http://www.westfield.com/southcenter/
41,672sq.ft Average profitability shop
8 September 2015 Eastridge / San Jose, CaliforniaStandard Roadside (In Eastridge Shopping Center)http://www.eastridgecenter.com/
52,064sq. ft. Average profitability shop
9 December 2015 Silver City / Taunton, Massachusetts ※ Standard Roadside (In Silver City Galleria)http://www.silvercitygalleria.com/
64,697sq. ft. Low profitability shop
10 May 2016 Grapevine Mills / Dallas, Texas ※Standard Roadside (In Grapevine Mills)http://www.simon.com/mall/grapevine-mills/
81,316sq.ft.Average profitability
shop
11 August 2016 Sunvalley / Concord, CaliforniaStandard Roadside (In Sunvalley Shopping Center)http://www.shopsunvalley.com/ 47,295sq. ft. High profitability shop
12 December 2016 Exton / Exton, PennsylvaniaStandard Roadside (In Exton Square Mall)https://www.extonsquare.com/ 59,537sq.ft.
Average profitability shop
13 January 2017 Southwest Plaza / Littleton, ColoradoStandard Roadside (In Southwest Plaza Mall)https://www.southwestplaza.com/ 66,085sq. ft.
Average profitability shop
14 March 2017 Stonecrest /Lithonia, GeorgiaStandard Roadside (In The Mall At Stonecrest)http://www.mallatstonecrest.com/ 50,533sq.ft. High profitability shop
15 March 2017 Fox Valley / Aurora, IllinoisStandard Roadside (In Fox Valley Mall)http://www.shopfoxvalleymall.com/ 51,708sq.ft.
Average profitability shop
-15-
Classification by color in the table on the next page refers to “High”, “Average” and “Low” profitability shop.
Classification by color is updated once a year during settlement of accounts.
※Kids Play Zone is operated. Opened in Grapevine Mills in October, 2016 and in Silver City in March, 2017.
Existing shops and principles of conditions for future shops openings in the USA
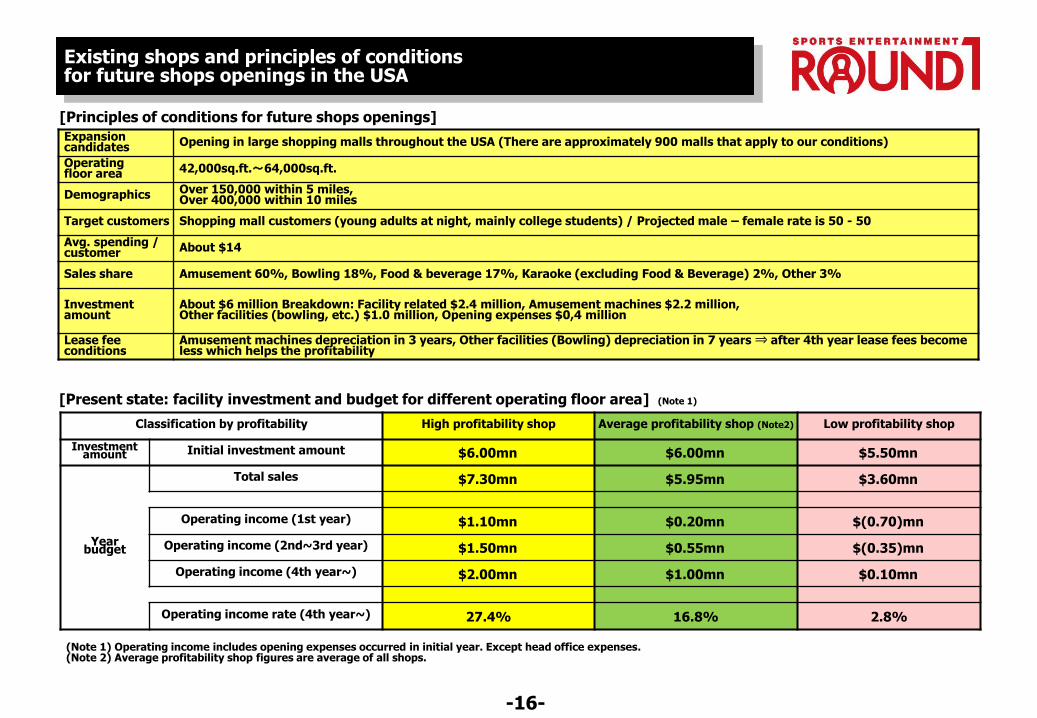
Expansion candidates Opening in large shopping malls throughout the USA (There are approximately 900 malls that apply to our conditions)
Operating floor area 42,000sq.ft.~64,000sq.ft.
Demographics Over 150,000 within 5 miles,Over 400,000 within 10 miles
Target customers Shopping mall customers (young adults at night, mainly college students) / Projected male – female rate is 50 - 50
Avg. spending / customer About $14
Sales share Amusement 60%, Bowling 18%, Food & beverage 17%, Karaoke (excluding Food & Beverage) 2%, Other 3%
Investment amount
About $6 million Breakdown: Facility related $2.4 million, Amusement machines $2.2 million, Other facilities (bowling, etc.) $1.0 million, Opening expenses $0,4 million
Lease fee conditions
Amusement machines depreciation in 3 years, Other facilities (Bowling) depreciation in 7 years ⇒ after 4th year lease fees become less which helps the profitability
[Principles of conditions for future shops openings]
[Present state: facility investment and budget for different operating floor area] (Note 1)
Classification by profitability High profitability shop Average profitability shop (Note2) Low profitability shop
Investment amount Initial investment amount $6.00mn $6.00mn $5.50mn
Year budget
Total sales $7.30mn $5.95mn $3.60mn
Operating income (1st year) $1.10mn $0.20mn $(0.70)mn
Operating income (2nd~3rd year) $1.50mn $0.55mn $(0.35)mn
Operating income (4th year~) $2.00mn $1.00mn $0.10mn
Operating income rate (4th year~) 27.4% 16.8% 2.8%
(Note 1) Operating income includes opening expenses occurred in initial year. Except head office expenses.(Note 2) Average profitability shop figures are average of all shops.
-16-

Statistical snapshot of shops
Trend in number of shops
Japan Term 2008.3 Term 2009.3 Term 2010.3 Term 2011.3 Term 2012.3 Term 2013.3 Term 2014.3 Term 2015.3 Term 2016.3 Term 2017.3 Term 2018.3No. of shop openings 88 13 11 3 1 3 - 2 1 2 1
No. of shop closings ※ 5 ※ 2 - - - ※ 1 - - ※ 1 ※ 8 -
No. of shops at the end of term 83 94 105 108 109 111 111 113 113 107 108
(Note) ※ Reason for closure of 17 shops (expiration of contract periods: 7 shops, removing intra-company competition: 6 shops, construction of new large shops in the neighborhood: 2 shops, reconstruction: 1 shop, closure of trial shop (trial period about 2 years): 1 shop).
The USA Term 2008.3 Term 2009.3 Term 2010.3 Term 2011.3 Term 2012.3 Term 2013.3 Term 2014.3 Term 2015.3 Term 2016.3 Term 2017.3 Term 2018.3No. of shop openings - - - 1 - 1 1 2 4 6 9
No. of shop closings - - - - - - - - - - -
No. of shops at the end of term - - - 1 1 2 3 5 9 15 24
Consolidated Term 2008.3 Term 2009.3 Term 2010.3 Term 2011.3 Term 2012.3 Term 2013.3 Term 2014.3 Term 2015.3 Term 2016.3 Term 2017.3 Term 2018.3No. of shops at
the end of term 83 94 105 109 110 113 114 118 122 122 132
Consolidated 122 shops (at the end of March 2017)Number of shops breakdown
Area
Japan
The USA TotalHokkaido / Tohoku
Hokuriku / Koshinetsu
KantoChubu /
TokaiKansai
Chugoku / Shikoku
Kyushu / Okinawa
Total
店舗数 11 4 32 12 29 8 11 107 15 122
シェア 9.0% 3.3% 26.2% 9.8% 23.8% 6.6% 9.0% 87.7% 12.3% 100.0%
Shops by shop typeNo. of shops at the end of term
Shops by ownershipNo. of shops at the end of term
Standard StadiumLeased shops Own shops
Downtown Roadside Downtown Roadside
10 50 1 46 107 83 24 107
(Note) All the USA shops are standard roadside type,leased shops only.
Japan 107 shops (at the end of March 2017)Number of shops breakdown
(Note) Own shops include 8 shops with owning right for land & building,and 16 shops with owning right for building with tenants.
-17-

Notices and contact for inquiries regarding IR
◎ [Website for PC / Smartphone]
http://www.round1.co.jp/ or
Notices regarding this material
In order to ensure fairness to investors, the company will, in principle, withhold answers to any questions regarding IR for about two weeks before the announcement of financial results (including quarterly results).Even during this period, however, company will respond to inquiries and questions regarding fundamental facts about its operations,information that has already been disclosed, and ongoing events or projects.Thank you for your cooperation and understanding.
round1 Search
◎ [Website for cell phone] (For customers / IR information, etc. are not available)
docomo, Soft Bank, au
http://www.round1.co.jp/mobile/
※ Please note that you are responsible for connection fees and communicationfees (packet fees) when accessing our website for cell phone, and that you maynot be able to access it with some types of cell phones.
This material is not provided for the purpose of soliciting investors. No responsibility is accepted by company or its information providers for any loss or damage that may occur as a result of use of this material. Information contained in this material is current as of the date of preparation. While utmost care has been taken in the preparation of this material, no warranty is given as to therealization of its contests. Should it contain any errors, no responsibility is accepted by company or its information providers. If incorrect figures or other misinformation should come to our attention, we will announce corrections through our website.
ROUND ONE Corporation reserves all rights to all content in this material, and it can not be reproduced, transmitted, etc. for any purpose without the permission of the company.
IR polices (Silent period)
Website addresses (Japanese only)
For inquiries, please contact Administrative Division of ROUND ONE Corporation. Tel:+72-224-5115 (Japanese only)
-18-