terra spacecraft - home - earth online
TRANSCRIPT

Multi-angle Imaging SpectroRadiometer (MISR)Radiometric Validation Studies
Carol J. BrueggeJet Propulsion Laboratory
California Institute of Technology
14th meeting of the Infrared/Visible Optical Systems (IVOS) October 12, 2004
Terra SpacecraftEOS MISR

MISRACKNOWLEDGEMENTS
Calibration teamCalibration lead- Carol Bruegge
(special studies beginning Sept. 2003)
In-situ measurements - Mark HelmlingerVicarious calibration - Wedad Abdou, Barbara GaitleyOn-board calibrator - Nadine Chrien
(retired from JPL June 2003)
Production staff - Kyle Miller, Tom ThallerSoftware support - David Nelson, Charles Thompson, Jeffrery Hall
Science supportDave Diner - MISR Principal InvestigatorRalph Kahn - ocean aerosolJohn Martonchik - land aerosol/ surfaceRoger Davies - Cloud studies
With special thanksLunar calibration results - Hugh Kieffer, United States Geologic SurveyMODIS/ Landsat vicarious calibration - Kurt Thome, University of Arizona
BrueggeIntrodution. 2

MISR
View angles: Multi-angle Imaging SpectroRadiometer0, 26.1, 45.6, 60.0, 70.5° (fore and aft)
Spectral bands: 446, 558, 672, 866 nm
Purpose: Measure the amounts, type, and distribution of aerosols, clouds, andsurface covers and study their interactionwith Earth’s climate
Spatial sampling:275 m - 1.1 km over 360 km swath
on EOS Terra spacecraft

Bruegge
MISRON-BOARD CALIBRATOR
CALIBRATION PROCESS
- Acquire bi-monthly OBC data (6 minute interval at each pole plus dark-earth data).- Conduct annual overflight field campaigns, concurrent with AirMISR
An
Ca
Cf
AaBa
Da
Af
BfDf
HQEs:NRGB
+y-PIN1
Da-PIN3
Df-PIN4
G-PIN
An
Aa
Ba
Af
Bf
67.5°
Diffuse panel
Diffuse panelFlight direction
Nadirfor aft cameracalibration
for forwardcamera calibration(stowed)
(deployed)
Ca
Da
Cf
Df-y-PIN2
MISR Overview. 2
Bruegge
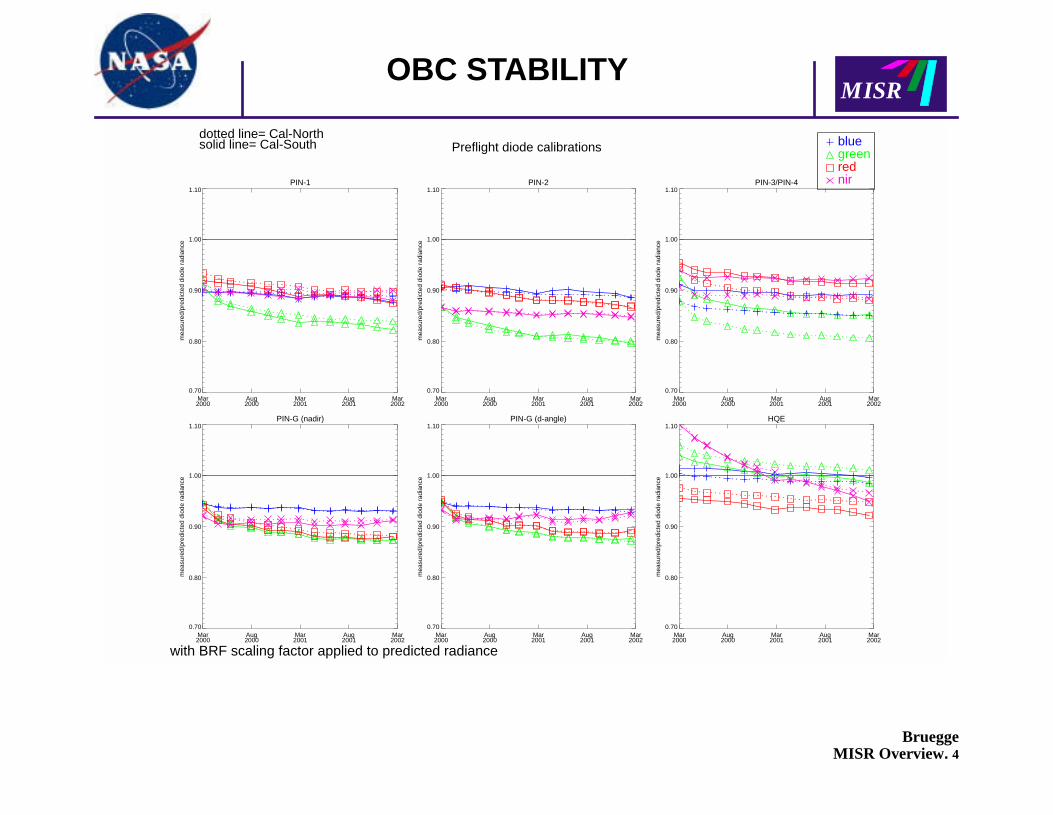
MISROBC STABILITY
PIN-1
Mar2000
Aug2000
Mar2001
Aug2001
Mar2002
0.70
0.80
0.90
1.00
1.10m
easu
red/
pred
icte
d di
ode
radi
ance
PIN-2
Mar2000
Aug2000
Mar2001
Aug2001
Mar2002
0.70
0.80
0.90
1.00
1.10
mea
sure
d/pr
edic
ted
diod
e ra
dian
ce
PIN-3/PIN-4
Mar2000
Aug2000
Mar2001
Aug2001
Mar2002
0.70
0.80
0.90
1.00
1.10
mea
sure
d/pr
edic
ted
diod
e ra
dian
ce
PIN-G (nadir)
Mar2000
Aug2000
Mar2001
Aug2001
Mar2002
0.70
0.80
0.90
1.00
1.10
mea
sure
d/pr
edic
ted
diod
e ra
dian
ce
PIN-G (d-angle)
Mar2000
Aug2000
Mar2001
Aug2001
Mar2002
0.70
0.80
0.90
1.00
1.10m
easu
red/
pred
icte
d di
ode
radi
ance
HQE
Mar2000
Aug2000
Mar2001
Aug2001
Mar2002
0.70
0.80
0.90
1.00
1.10
mea
sure
d/pr
edic
ted
diod
e ra
dian
ce
dotted line= Cal-Northsolid line= Cal-South blue
greenrednir
with BRF scaling factor applied to predicted radiance
Preflight diode calibrations
MISR Overview. 4

Bruegge
MISRCAMERA DEGRADATION
Degradation ~ 2%/ year(1.5, 2.0, 2.5, and 2.4%respectively for the four bands)
Experiment time line spans 2 years(2 months between calibrations)
MISR Overview. 5

Bruegge
MISRVICARIOUS CALIBRATION
PARABOLA IIIREAGAN
SUNPHOTOMETER
ASD
AIRMISR
• The MISR radiometric scale is annuallyvalidated using Vicarious Calibrationdata, collected by our team overRailroad Valley, Nevada• VC and MISR radiances have agreed to within5% for the 2000-2003 field campaigns
MISR Overview. 6

The net effect of the BTB and CTC corrections on aerosol optical depth was estimated by randomly selecting a few orbitscontaining dark water retrievals and regressing the results obtained with and without the corrections. The results areshown in Fig. 5. An overall reduction averaging -0.02 in AOD is obtained, implying that these corrections account forabout one-third of the difference between MISR and AERONET results.
4.3 Calibration-related factors: absolute radiometryEarly in the Terra mission, we discovered that the absolute radiometric response of the OBC photodiodes did not conformto preflight expectations. The likely cause was traced to inadequate characterization of the diode out-of-band spectralresponse. Nevertheless, the OBC has proven to be an excellent stability monitor. Analysis indicates that flight Spectralonpanels and that the blue-filtered HQE diode have each remained stable to better than 0.5% throughout the mission22. Theblue HQE diode is used as the primary calibration standard, and all other photodiodes are recalibrated against it during thebi-monthly OBC activations. The absolute scale is determined by annual vicarious calibration (VC) experiments overdesert playa in Nevada, namely Railroad Valley (RRV), Lunar Lake (LL), Black Rock Desert (BRD), and Ivanpah (Ivan).Vicarious calibration entails making accurate measurements of surface reflectance and atmospheric transmittance, thenusing a radiative transfer code to predict top-of-atmosphere (TOA) radiances. Results from five year’s worth of VC desertdeployments are shown in Fig. 6. As described above and in earlier papers12,21, a systematic analysis of MISR radianceproducts in comparison to both VC and lunar data acquired during the Terra pitchover maneuver21 have led us to apply aband-to-band adjustment to MISR’s radiometric scale. This BTB correction is included in the results shown in Fig. 6.
-0.20
-0.15
-0.10
-0.05
0.00
0.05
0.10
0.15
0.20
0.0 0.1 0.2 0.3 0.4 0.5 0.6 0.7 0.8 0.9 1.0
AOD without calibration adjustment
AO
D c
hang
e w
ith
BTB
and
CTC
adj
ustm
ent
Figure 5. Difference between dark water 558-nmAODs obtained after BTB and CTC calibration adjust-ments and AODs without the adjustments, plottedagainst AOD without the adjustments. Data are fromrandomly selected orbits in March 2002. The BTBcorrection accounts for most of the difference. Onaverage, AOD decreases, with the mean reduction forthis set of test cases amounting to about -0.02. Largerdifferences are seen for some cases, owing to the radi-ometric adjustments resulting in a different set of suc-cessful aerosol mixtures being chosen by the aerosolretrieval algorithm.
An camera vicarious calibration results
-5.0
-4.0
-3.0
-2.0
-1.0
0.0
1.0
2.0
3.0
4.0
5.0
Blue Green Red NIR
100*
(m
isr-
vc)/
vc (
perc
ent)
06-Jun-2000: LL30-Jun-2001: RRV10-Jun-2002: Ivan07-Jul-2003: BRD22-Jul-2003: RRV22-Jun-2004: RRV10-Jun-2002: RRV13-Jun-2003: RRV29-Jun-2004: RRVMean
nadir overpassoff-nadir overpass
Figure 6. Average over 5 years’ worthof desert playa vicarious calibrations,for the MISR nadir (An) camera. A“nadir overpass” means that the surfacetarget is near the center of the camera’sfield of view (FOV), whereas an “off-nadir overpass” places the target closerto the edge of the field (the An camerahas a cross-track FOV of ±15°. Most ofthe data fall within error bars of ±3%,and in the mean there is negligible bias.The band-to-band adjustment describedin the text has been applied to thesedata.

BrueggeMISR Overview
.
12
MISR
BANDPASS COMPARISON
MISR out-of-band-response ~ 3% (spectrally neutral scene)

BrueggeMISR Overview
.
13
MISR
MODIS TO MISRSPECTRAL CORRECTION
WAVELENGTH, NM

BrueggeMISR Overview
.
14
MISR
FIELD OF VIEW VALIDATION(MISR/ MODIS SWATH STUDY)
EgyptMISR Band 2 (Green)Yellow dots depict MISR/ MODISratios between 1.1 and 1.5


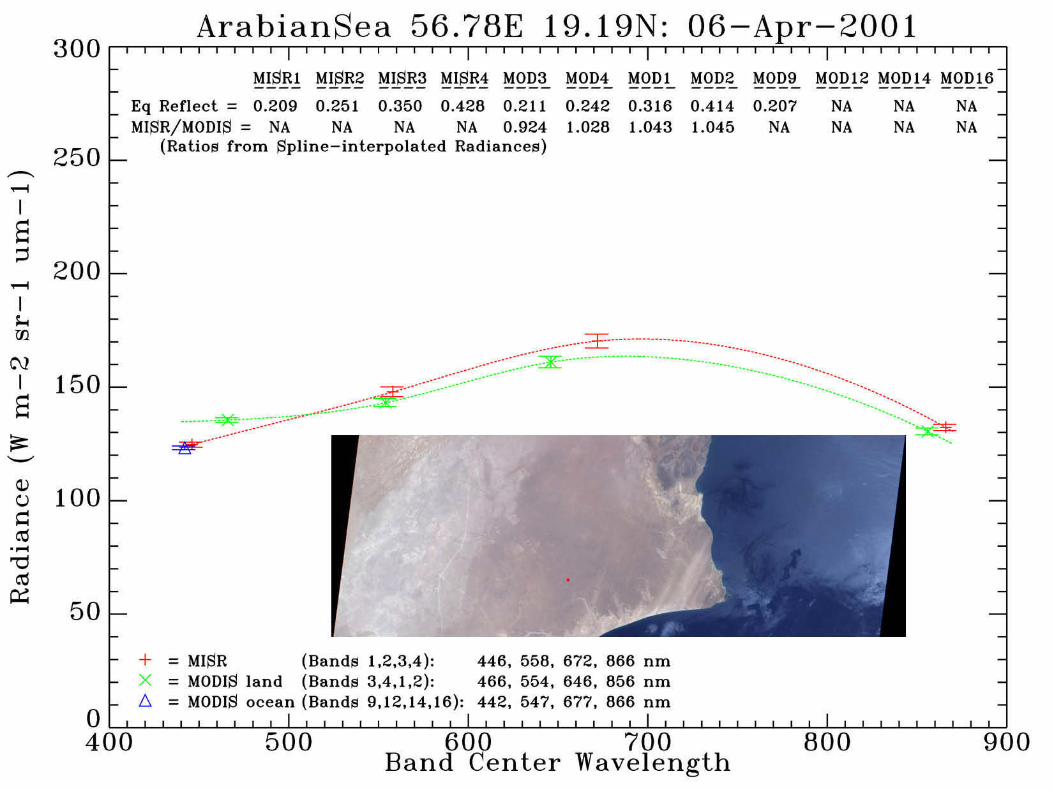

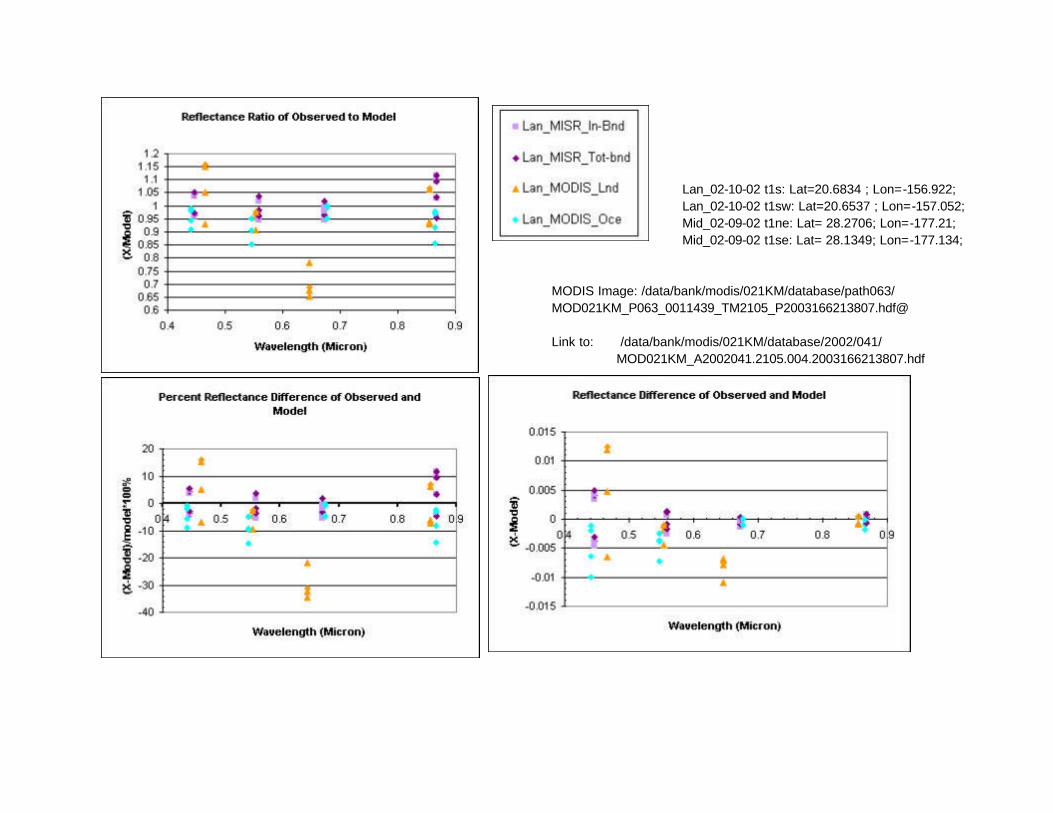
Lan_02-10-02 t1s: Lat=20.6834 ; Lon=-156.922; Lan_02-10-02 t1sw: Lat=20.6537 ; Lon=-157.052; Mid_02-09-02 t1ne: Lat= 28.2706; Lon=-177.21; Mid_02-09-02 t1se: Lat= 28.1349; Lon=-177.134; MODIS Image: /data/bank/modis/021KM/database/path063/ MOD021KM_P063_0011439_TM2105_P2003166213807.hdf@ Link to: /data/bank/modis/021KM/database/2002/041/ MOD021KM_A2002041.2105.004.2003166213807.hdf

BrueggeMISR Overview
.
3
MISR
CALIBRATION PROCESSIMPROVEMENTS
Process update Date Impact
VC scaling.June 11, 2000 vicarious calibration
experiment used to calibrate the flight photodiode standard.
February 15, 2001 9% increase in MISR radiometric scale, for all channels.
Quadratic. calibration equation May 17, 2001 Reduces the residuals in the calibration equation fit
Panel BRF update. December 22, 2001 Aft-camera radiances decreased by a few percent.
Linear October 24, 2004 Restores linear form to cal. eqn.
PSF November 11, 2004 Contrast enhancement
Band-to-band adjustment February 4, 2004 3% in Red Band and 1% in NIR Band adjustments (decrease in radiance)
Camera-to-camera adjustment Planned, November 2004 <1% adjustment for most cameras

Bruegge
MISRMISR/MODIS SCANS ACROSS
ICEBERG EDGE VS. WAVELENGTHMODIS line 850
1 0
1 5
2 0
2 5
3 0
3 5
4 0
1 2 3 0 1 2 5 0 1 2 7 0 1 2 9 0
Sample
Gre
en
Ra
dia
nc
e
MODISMISR
MODIS line 1720
0
5
1 0
1 5
2 0
2 5
3 0
3 5
4 0
4 5
5 0
2 5 0 0 2 5 2 0 2 5 4 0 2 5 6 0 2 5 8 0 2 6 0 0
Sample
NIR
R
ad
ian
ce
MODISMISR
MODIS line 1720
0
5
1 0
1 5
2 0
2 5
3 0
3 5
4 0
4 5
5 0
2 5 0 0 2 5 2 0 2 5 4 0 2 5 6 0 2 5 8 0 2 6 0 0
Sample
Re
dR
ad
ian
ce
MODISMISR
MODIS line 850
3 0
3 5
4 0
4 5
5 0
5 5
6 0
1 2 3 0 1 2 5 0 1 2 7 0 1 2 9 0
Sample
Blu
eR
ad
ian
ce
MODISMISR
MISR Overview. 8

Bruegge
MISRPSF CORRECTION
Empirical PSF calculated by taking first derivative of scan across iceberg edge- core energy is greater in the preflight measurement
Iceberg, line 59973
-2
0
2
4
6
8
10
12
14
16
18
20
425 445 465 485 505 525
Pixel
NIR
Rad
ian
ce
Ghost correction only
Ghost corr + ARPdeconvolution
Ghost corr + testdeconvolution
NIR
0 . 0 0 0 0 1
0 . 0 0 0 1
0 . 0 0 1
0 . 0 1
0 . 1
1
1 1 1 2 1 3 1 4 1 5 1
Pixel
PS
F
p re f l igh t
derived from iceberg edgedouble gaussian
MISR Overview. 9
Bruegge
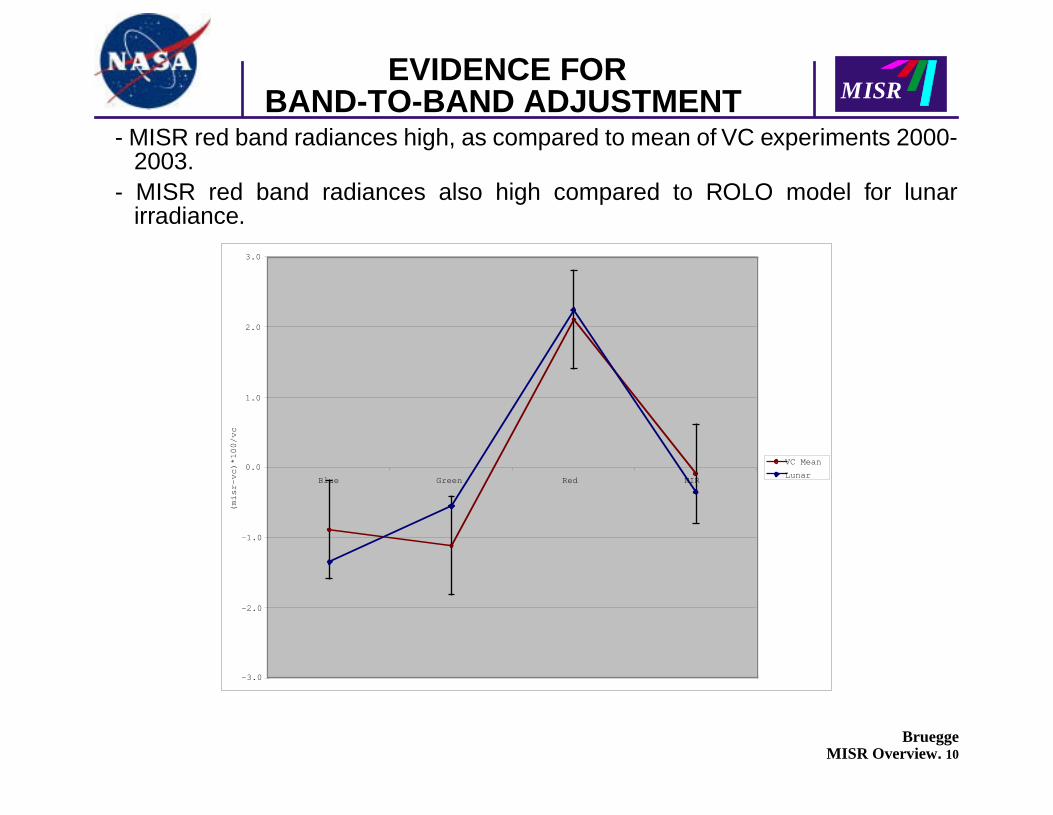
MISREVIDENCE FOR
BAND-TO-BAND ADJUSTMENT- MISR red band radiances high, as compared to mean of VC experiments 2000-
2003.- MISR red band radiances also high compared to ROLO model for lunar
irradiance.
-3.0
-2.0
-1.0
0.0
1.0
2.0
3.0
Blue Green Red NIR
(misr-vc)*100/vc
VC Mean
Lunar
MISR Overview. 10

Bruegge
MISRCAMERA-TO-CAMERA
ADJUSTMENTS- AirMISR to MISR comparisons yield inconsistent camera-relative validations- Symmetry study utilized fore-/ aft- camera observations with a symmetric view
angle with respect to the solar principal plane- Lunar data also applied to establish final camera adjustments
MISR Overview. 11

hand plot of Fig. 3. This figure shows a residual asymmetry, which probably arises from uncorrected differences in theBRFs of the two OBC Spectralon panels. A set of channel-by-channel correction factors was derived based on theseresults, and their application leads to the plot shown on the right-hand side of Fig. 3. One drawback of this technique isthat it cannot tell whether a fore-aft asymmetry is due to one camera being too bright, the other being too dark, or some-thing in between. Consequently, we also looked at the CTC variation observed during the April 2003 lunar calibrationexperiment. All nine cameras swept past the lunar disk at the same face-on observation angle during the “reverse somer-sault” which the Terra spacecraft performed during this maneuver. CTC residuals relative to the mean value in each spec-tral band are shown in the left-hand plot of Fig. 4. Application of the gain correction factors derived to make theadjustments shown in Fig. 3 results in the right-hand plot of Fig. 4. Overall, a slight improvement in the channel-by-chan-nel residuals is observed. We also found that the same adjustment factors reduced the off-nadir BTB differences in MISR/AirMISR radiance ratios. The CTC correction factors were typically small, usually 1% or less. The largest adjustment wasapplied to the Bf camera, particularly in the near-infrared band, where a 2.5% reduction in radiance was applied (this is inaddition to the 1.5% BTB correction derived earlier).
Solar zenith corrected
0.800
0.850
0.900
0.950
1.000
1.050
1.100
1.150
Df/An Cf/An Bf/An Af/An An/An Aa/An Ba/An Ca/An Da/An
Cameras
Eq.
refl
. ra
tio
Adjusted
0.800
0.850
0.900
0.950
1.000
1.050
1.100
1.150
Df/An Cf/An Bf/An Af/An An/An Aa/An Ba/An Ca/An Da/An
Cameras
Eq. re
fl. ra
tio
Figure 3. Left: Plot of “symmetry” data acquired over land. The curves are expected to be symmetric fore-aft. Due to the 7-minutetime interval between the Df and Da views of a particular scene, a correction for solar zenith angle was applied. Right: Effect ofincluding CTC correction factors.
-3.00
-2.00
-1.00
0.00
1.00
2.00
3.00
Df/ROLO Cf/ROLO Bf/ROLO Af/ROLO An/ROLO Aa/ROLO Ba/ROLO Ca/ROLO Da/ROLO
Lunar--not adjusted, band by band residuals
BGRN
-3.00
-2.00
-1.00
0.00
1.00
2.00
3.00
Df/ROLO Cf/ROLO Bf/ROLO Af/ROLO An/ROLO Aa/ROLO Ba/ROLO Ca/ROLO Da/ROLO
Lunar--adjusted, band by band residuals
BGRN
Figure 4. Left: Band-by-band residuals between MISR radiances and values obtained from the RObotic Lunar Observatory (ROLO)model (H. Kieffer, personal communication). The absolute offset between the MISR radiometric scale and the ROLO model ofabout 5% has been subtracted out, so that this plot shows the camera-by-camera residuals about this offset for each spectral band.Right: Residuals obtained after application of the CTC correction factors. Slight reduction in the overall residuals is obtained.Adjustment factors were not permitted to lead to zero residuals, because this would have worsened the “symmetry” data results,which are deemed more accurate because they come from a large statistical database and involve fewer assumptions.

The net effect of the BTB and CTC corrections on aerosol optical depth was estimated by randomly selecting a few orbitscontaining dark water retrievals and regressing the results obtained with and without the corrections. The results areshown in Fig. 5. An overall reduction averaging -0.02 in AOD is obtained, implying that these corrections account forabout one-third of the difference between MISR and AERONET results.
4.3 Calibration-related factors: absolute radiometryEarly in the Terra mission, we discovered that the absolute radiometric response of the OBC photodiodes did not conformto preflight expectations. The likely cause was traced to inadequate characterization of the diode out-of-band spectralresponse. Nevertheless, the OBC has proven to be an excellent stability monitor. Analysis indicates that flight Spectralonpanels and that the blue-filtered HQE diode have each remained stable to better than 0.5% throughout the mission22. Theblue HQE diode is used as the primary calibration standard, and all other photodiodes are recalibrated against it during thebi-monthly OBC activations. The absolute scale is determined by annual vicarious calibration (VC) experiments overdesert playa in Nevada, namely Railroad Valley (RRV), Lunar Lake (LL), Black Rock Desert (BRD), and Ivanpah (Ivan).Vicarious calibration entails making accurate measurements of surface reflectance and atmospheric transmittance, thenusing a radiative transfer code to predict top-of-atmosphere (TOA) radiances. Results from five year’s worth of VC desertdeployments are shown in Fig. 6. As described above and in earlier papers12,21, a systematic analysis of MISR radianceproducts in comparison to both VC and lunar data acquired during the Terra pitchover maneuver21 have led us to apply aband-to-band adjustment to MISR’s radiometric scale. This BTB correction is included in the results shown in Fig. 6.
-0.20
-0.15
-0.10
-0.05
0.00
0.05
0.10
0.15
0.20
0.0 0.1 0.2 0.3 0.4 0.5 0.6 0.7 0.8 0.9 1.0
AOD without calibration adjustment
AO
D c
hang
e w
ith
BTB
and
CTC
adj
ustm
ent
Figure 5. Difference between dark water 558-nmAODs obtained after BTB and CTC calibration adjust-ments and AODs without the adjustments, plottedagainst AOD without the adjustments. Data are fromrandomly selected orbits in March 2002. The BTBcorrection accounts for most of the difference. Onaverage, AOD decreases, with the mean reduction forthis set of test cases amounting to about -0.02. Largerdifferences are seen for some cases, owing to the radi-ometric adjustments resulting in a different set of suc-cessful aerosol mixtures being chosen by the aerosolretrieval algorithm.
An camera vicarious calibration results
-5.0
-4.0
-3.0
-2.0
-1.0
0.0
1.0
2.0
3.0
4.0
5.0
Blue Green Red NIR
100*
(m
isr-
vc)/
vc (
perc
ent)
06-Jun-2000: LL30-Jun-2001: RRV10-Jun-2002: Ivan07-Jul-2003: BRD22-Jul-2003: RRV22-Jun-2004: RRV10-Jun-2002: RRV13-Jun-2003: RRV29-Jun-2004: RRVMean
nadir overpassoff-nadir overpass
Figure 6. Average over 5 years’ worthof desert playa vicarious calibrations,for the MISR nadir (An) camera. A“nadir overpass” means that the surfacetarget is near the center of the camera’sfield of view (FOV), whereas an “off-nadir overpass” places the target closerto the edge of the field (the An camerahas a cross-track FOV of ±15°. Most ofthe data fall within error bars of ±3%,and in the mean there is negligible bias.The band-to-band adjustment describedin the text has been applied to thesedata.

MISR
Bruegge
CONCLUSIONS
Vicarious calibration has been the standard for MISR- Provided update to flight detector response coefficient- Pointed to need for band-to-band adjustment (3% Red; 1% NIR)- Pointed to coding error affecting MISR off-nadir radiometry
Sensor intercomparison studies help refine MISR calibration- MODIS provided evidence that MISR preflight-measured PSF kernels
undercorrected for edge smear
Lunar studies held provide supporting evidence- Corroborated VC band-to-band results- Corroborated symmetry study camera-to-camera results (<1% refinements)
Aerosol team pleased with improved retrieval algorithm- Aerosol optical depths reduced by 0.02, approaching AERONET values
Multiple lines of evidence are often required to define process changes neededto make incremental adjustments to the radiometric scale of an on-orbit sensor.