terrestrial fixed plot monitoring: measurement ... · terrestrial fixed plot monitoring:...
TRANSCRIPT
Terrestrial Fixed Plot Monitoring: Terrestrial Fixed Plot Monitoring: Terrestrial Fixed Plot Monitoring: Terrestrial Fixed Plot Monitoring: Measurement, Observation, Action!Measurement, Observation, Action!
Natasha GonsalvesNatasha GonsalvesToronto and Region ConservationToronto and Region Conservation
Terrestrial Monitoring Forum Terrestrial Monitoring Forum Terrestrial Monitoring Forum Terrestrial Monitoring Forum April 7April 7thth, 2010, 2010
OutlineOutline♦ Program Goals and Objectives♦ Program Goals and Objectives♦ Study Design♦ Plot Placement♦ Plot Placement♦ Protocols♦ Monitoring Measures♦ Monitoring Measures♦ Timeline for Data Analysis & Reporting♦ Highlights♦ Highlights♦ Contacts♦ A k l d t♦ Acknowledgements
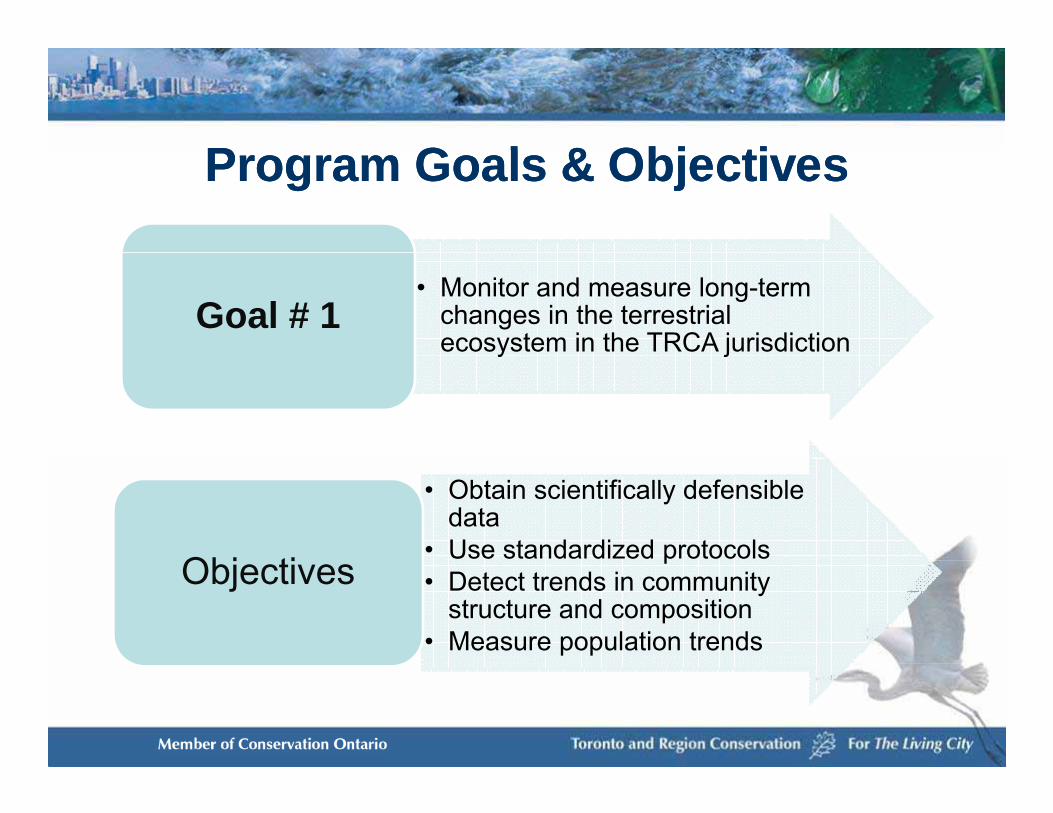
P G l & Obj tiP G l & Obj tiProgram Goals & ObjectivesProgram Goals & Objectives
• Monitor and measure long-term changes in the terrestrial ecosystem in the TRCA jurisdiction
Goal # 1y j
• Obtain scientifically defensible data
• Use standardized protocolsObj ti
p• Detect trends in community
structure and composition• Measure population trends
Objectives
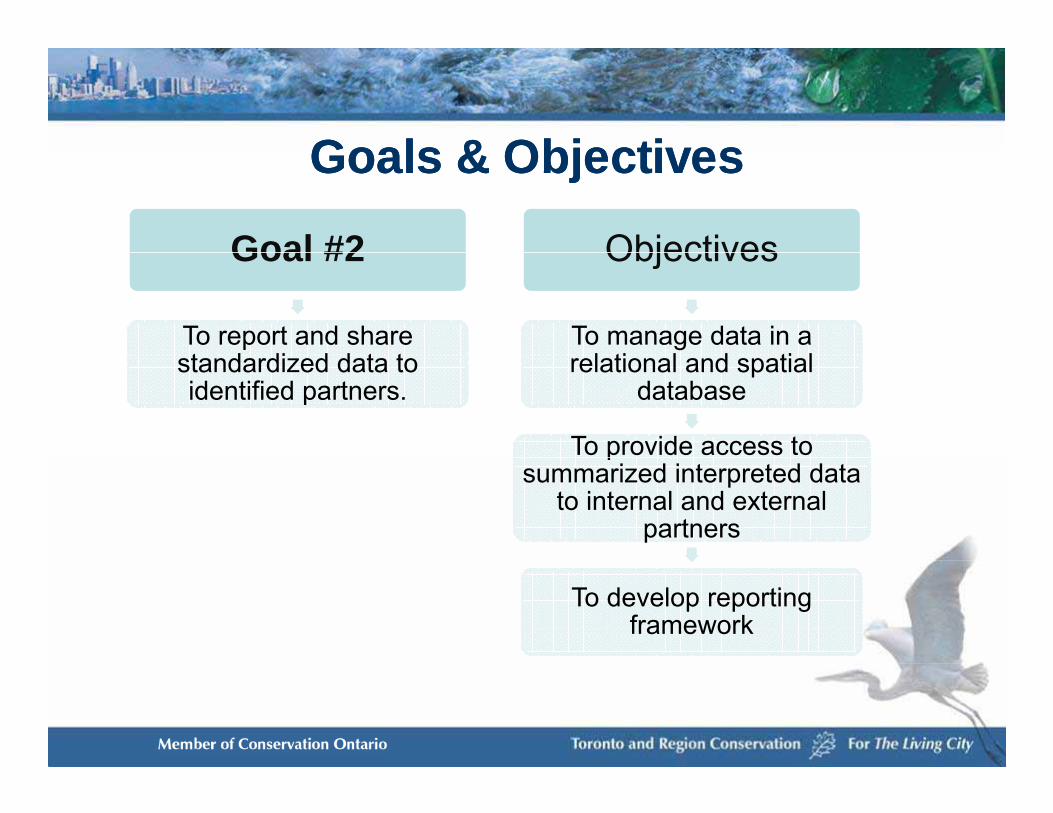
Goals & ObjectivesGoals & ObjectivesGoals & ObjectivesGoals & Objectives
Goal #2 ObjectivesGoal #2
To report and share t d di d d t t
Objectives
To manage data in a l ti l d ti lstandardized data to
identified partners.relational and spatial
database
To provide access to psummarized interpreted data
to internal and external partners
To develop reporting framework
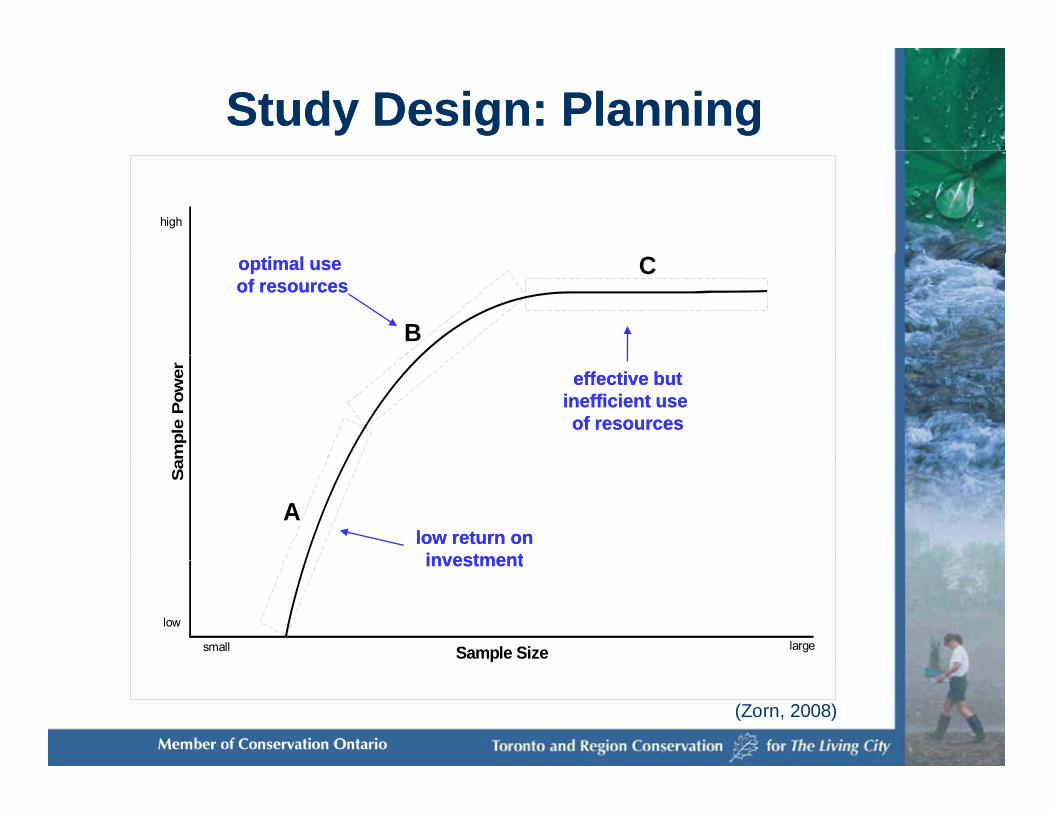
Study Design: PlanningStudy Design: Planning
high
B
Coptimal use optimal use of resourcesof resources
mpl
e P
ower effective buteffective but
inefficient use inefficient use of resourcesof resources
Sam
Alow return onlow return oninvestmentinvestment
Sample Size
low
small large
investmentinvestment
(Zorn, 2008)
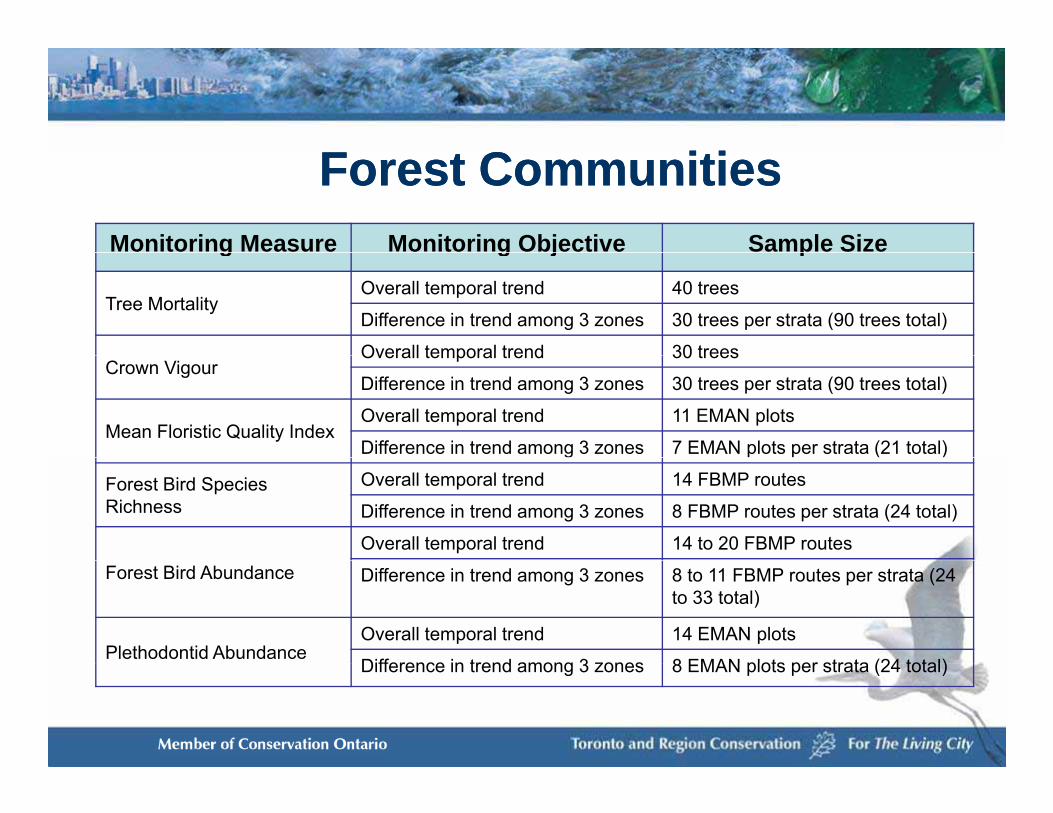
Forest CommunitiesForest CommunitiesMonitoring Measure Monitoring Objective Sample Sizeg g j p
Tree MortalityOverall temporal trend 40 trees
Difference in trend among 3 zones 30 trees per strata (90 trees total)
Overall temporal trend 30 treesCrown Vigour
Overall temporal trend 30 trees
Difference in trend among 3 zones 30 trees per strata (90 trees total)
Mean Floristic Quality IndexOverall temporal trend 11 EMAN plots
Difference in trend among 3 zones 7 EMAN plots per strata (21 total)
Forest Bird Species Richness
Overall temporal trend 14 FBMP routes
Difference in trend among 3 zones 8 FBMP routes per strata (24 total)
Overall temporal trend 14 to 20 FBMP routesForest Bird Abundance Difference in trend among 3 zones 8 to 11 FBMP routes per strata (24
to 33 total)
Plethodontid AbundanceOverall temporal trend 14 EMAN plots
Difference in trend among 3 zones 8 EMAN plots per strata (24 total)Difference in trend among 3 zones 8 EMAN plots per strata (24 total)
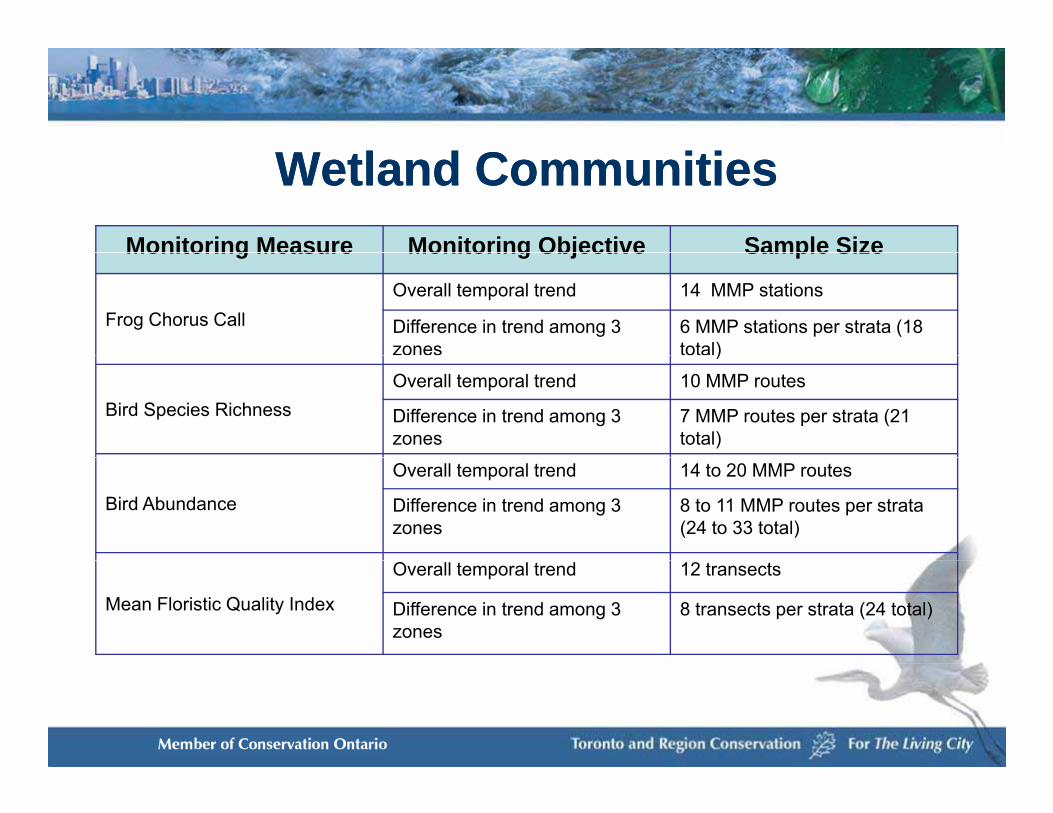
Wetland CommunitiesWetland CommunitiesMonitoring Measure Monitoring Objective Sample SizeMonitoring Measure Monitoring Objective Sample Size
Frog Chorus CallOverall temporal trend 14 MMP stations
Difference in trend among 3 zones
6 MMP stations per strata (18 total))
Bird Species RichnessOverall temporal trend 10 MMP routes
Difference in trend among 3 zones
7 MMP routes per strata (21 total)
Bird Abundance
Overall temporal trend 14 to 20 MMP routes
Difference in trend among 3 zones
8 to 11 MMP routes per strata (24 to 33 total)
Mean Floristic Quality Index
Overall temporal trend 12 transects
Difference in trend among 3 zones
8 transects per strata (24 total)
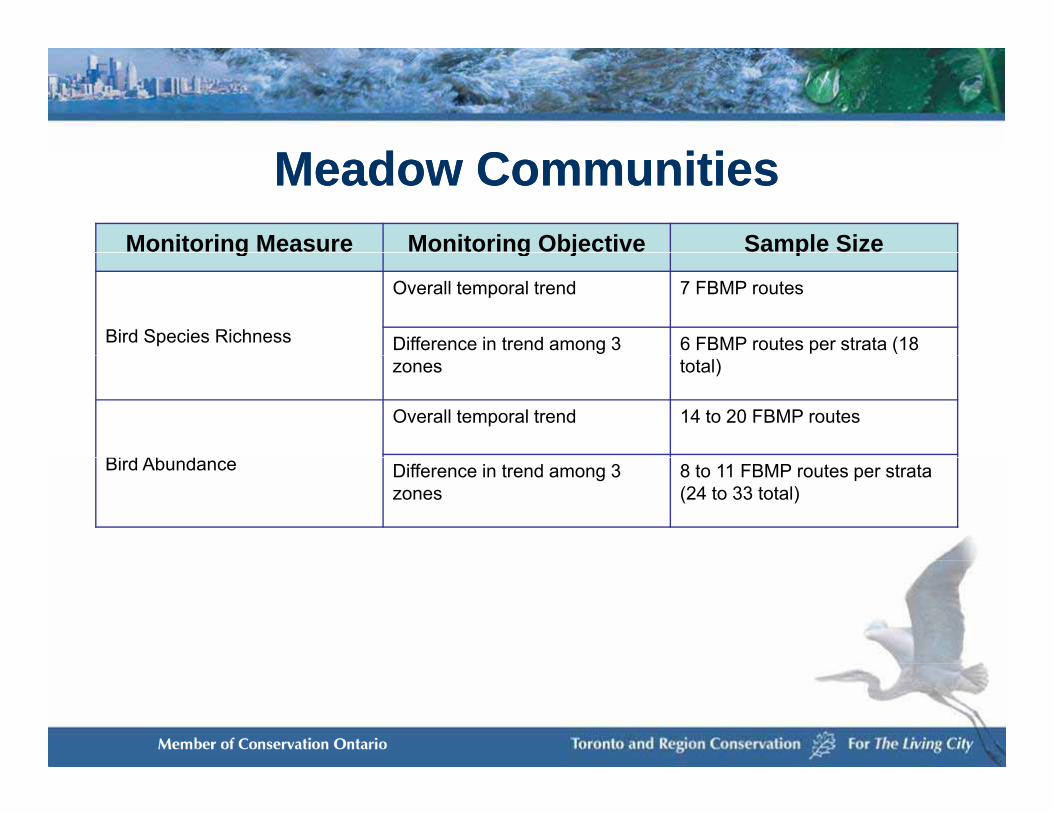
Meadow CommunitiesMeadow CommunitiesMonitoring Measure Monitoring Objective Sample Sizeg g j p
Bird Species Richness
Overall temporal trend 7 FBMP routes
Difference in trend among 3 6 FBMP routes per strata (18 zones total)
Bi d Ab d
Overall temporal trend 14 to 20 FBMP routes
Bird Abundance Difference in trend among 3 zones
8 to 11 FBMP routes per strata (24 to 33 total)
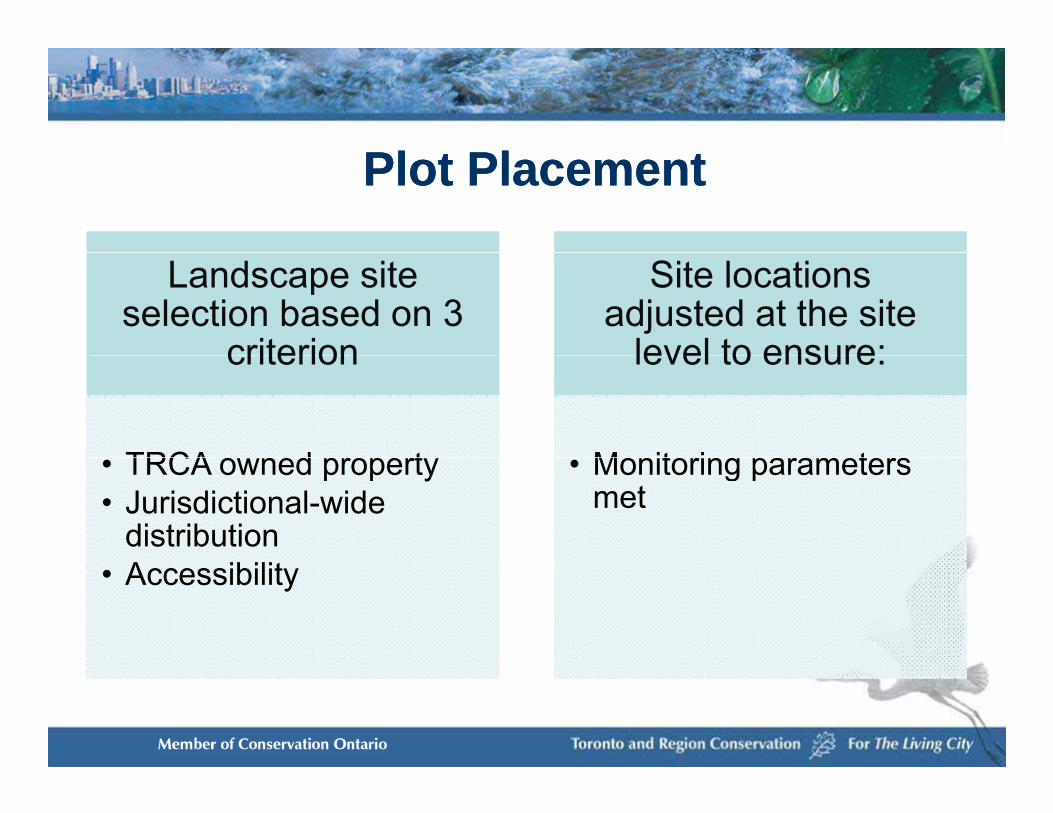
Plot PlacementPlot Placement
Landscape site selection based on 3
criterion
Site locations adjusted at the site
level to ensure:criterion
TRCA o ned propert
level to ensure:
Monitoring parameters• TRCA owned property• Jurisdictional-wide
distribution
• Monitoring parameters met
• Accessibility
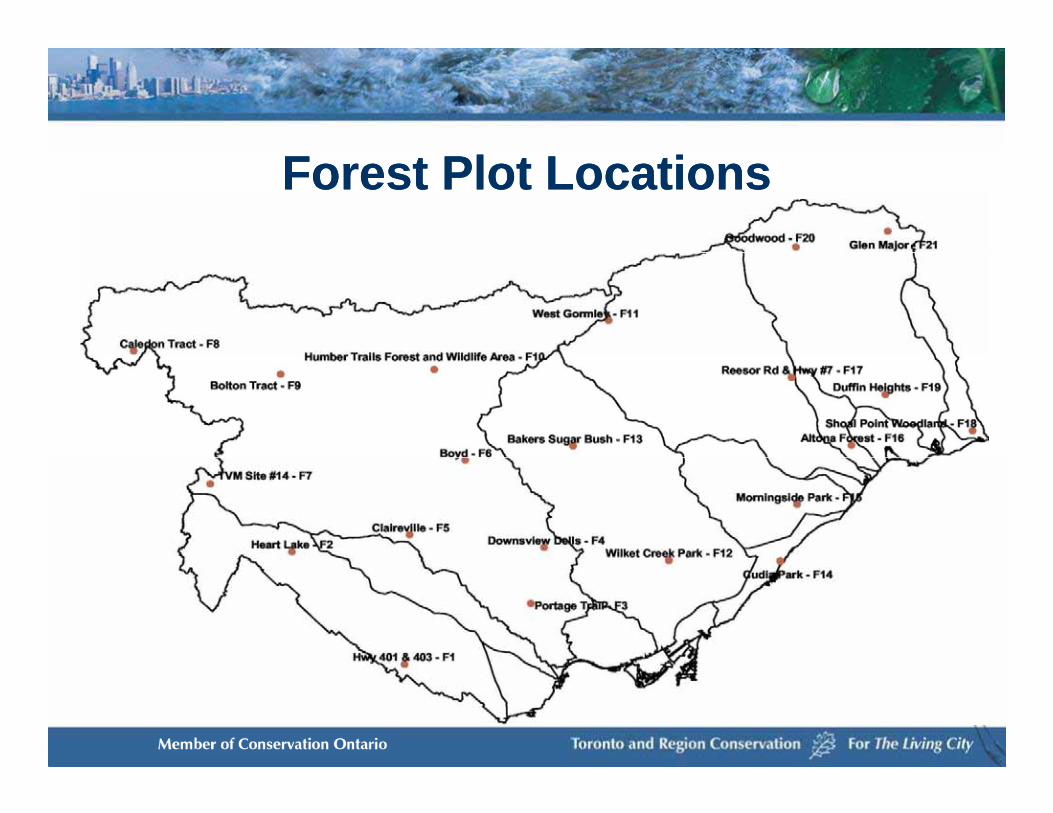
Forest Plot LocationsForest Plot Locations

Wetland Plot LocationsWetland Plot Locations
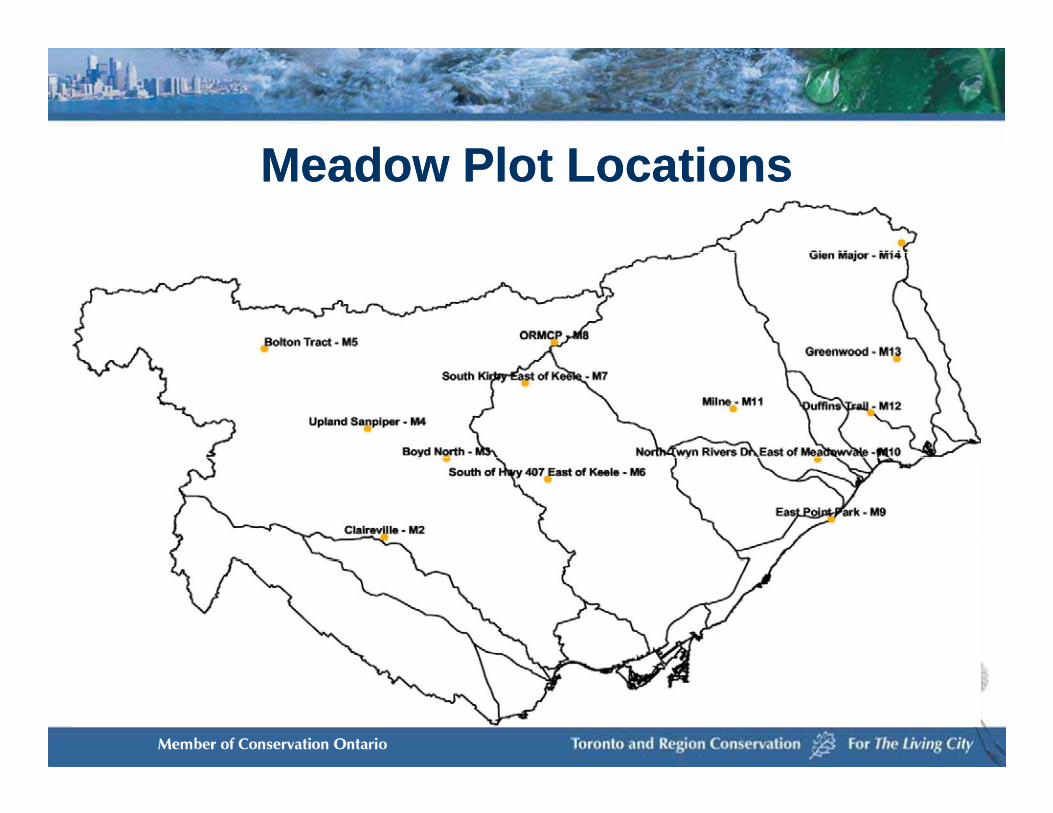
M d Pl t L tiM d Pl t L tiMeadow Plot LocationsMeadow Plot Locations
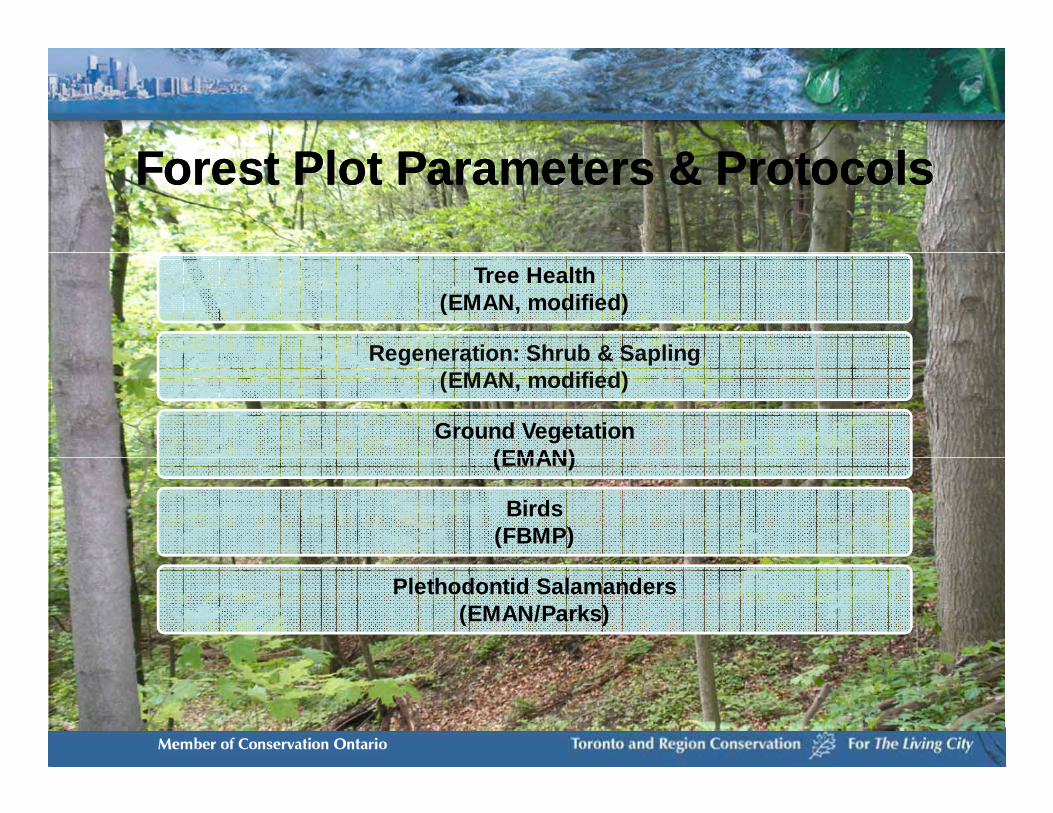
F Pl P & P lF Pl P & P lForest Plot Parameters & ProtocolsForest Plot Parameters & Protocols
Tree Health(EMAN, modified)
Regeneration: Shrub & SaplingRegeneration: Shrub & Sapling(EMAN, modified)
Ground Vegetation(EMAN)(EMAN)
Birds(FBMP)
Plethodontid Salamanders(EMAN/Parks)
ProtocolsProtocols
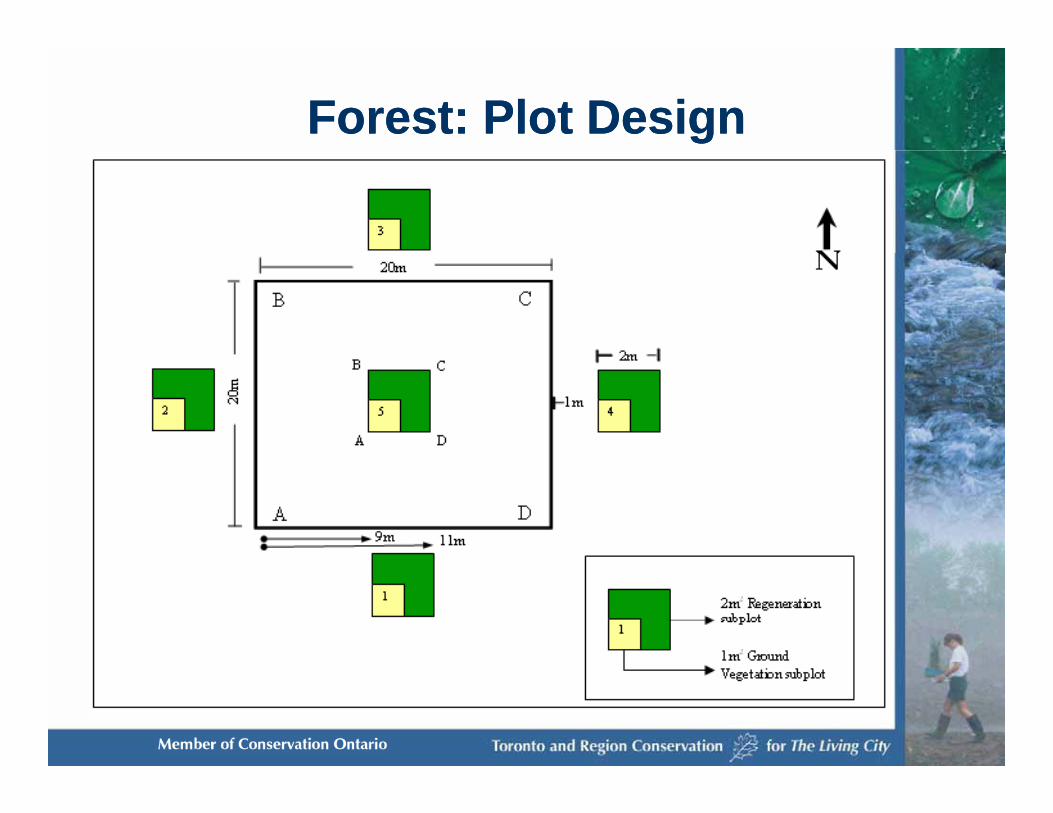
Forest: Plot DesignForest: Plot Design
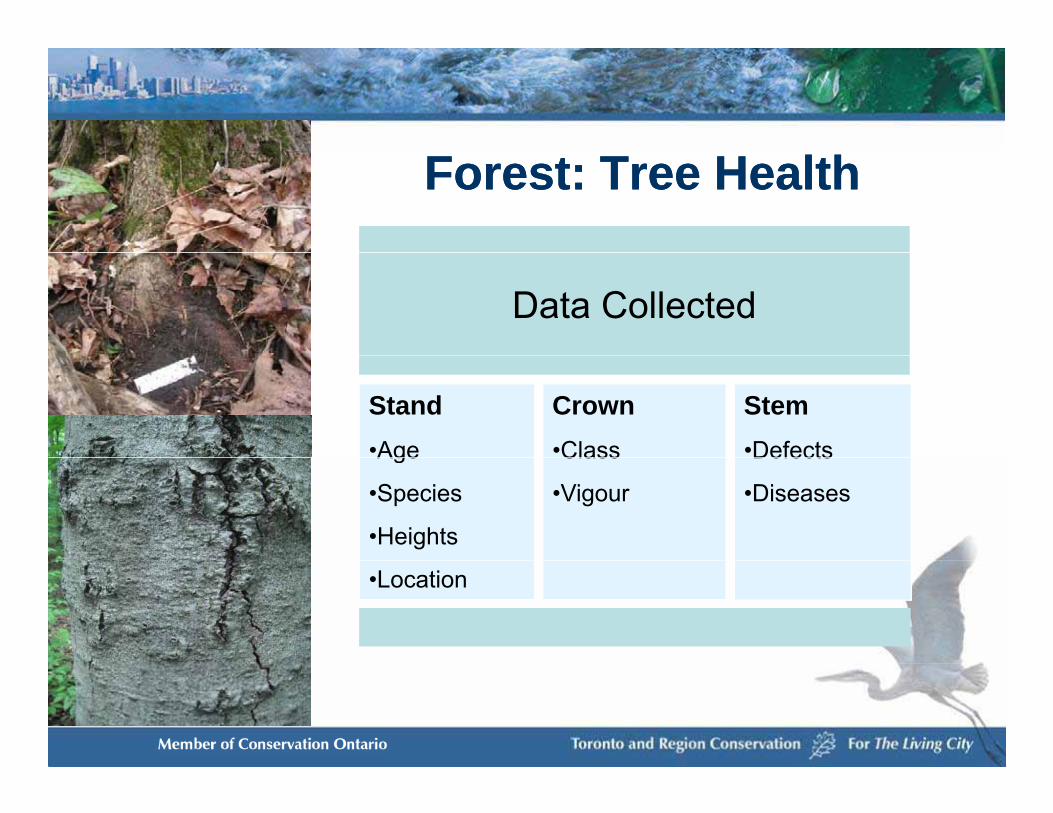
Forest: Tree HealthForest: Tree Health
Data Collected
Stand •Age
Crown•Class
Stem•DefectsAge
•Species
•Heights
Class
•Vigour
Defects
•Diseases
•Location
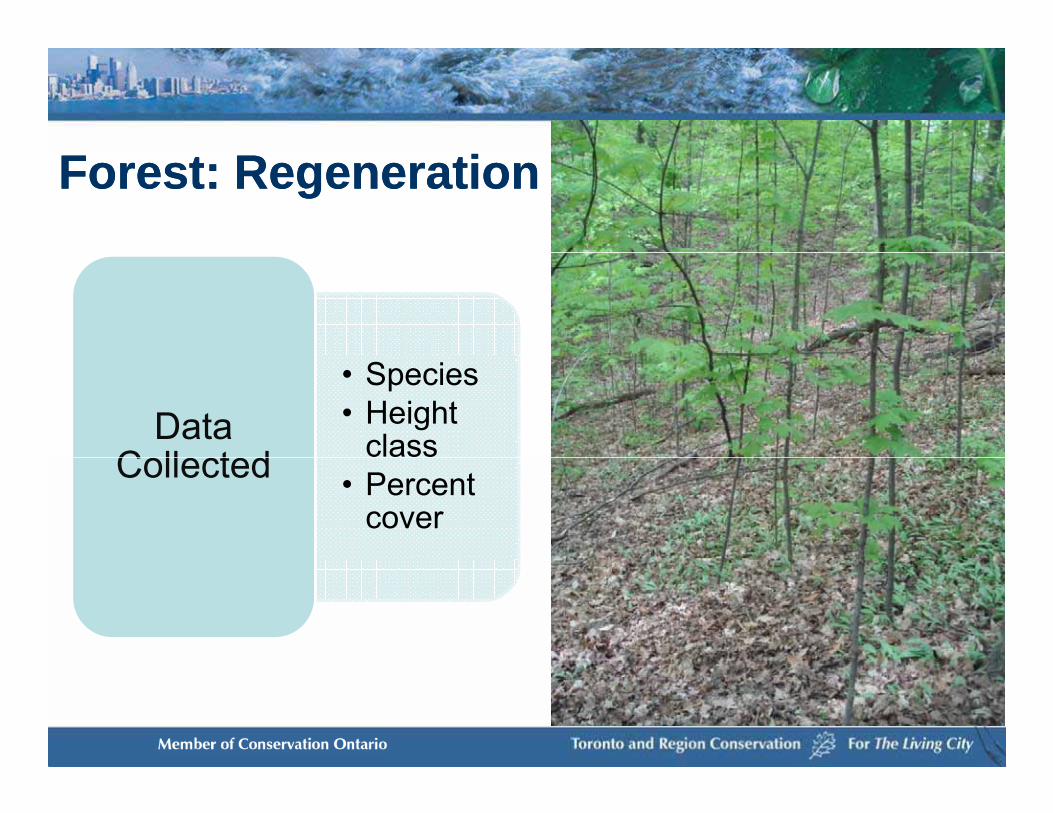
Forest: Regeneration Forest: Regeneration
• Species• Height
classData Collected • Percent
coverCollected
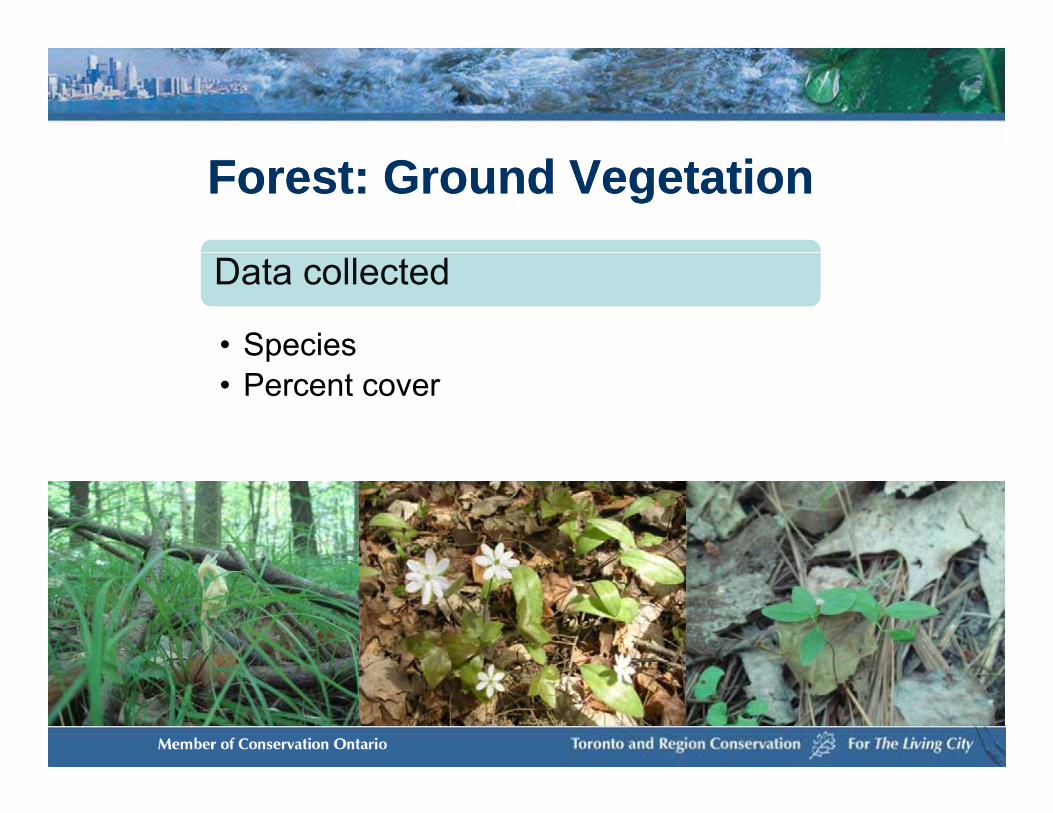
Forest: Ground VegetationForest: Ground Vegetation
Data collected
• SpeciesSpec es• Percent cover
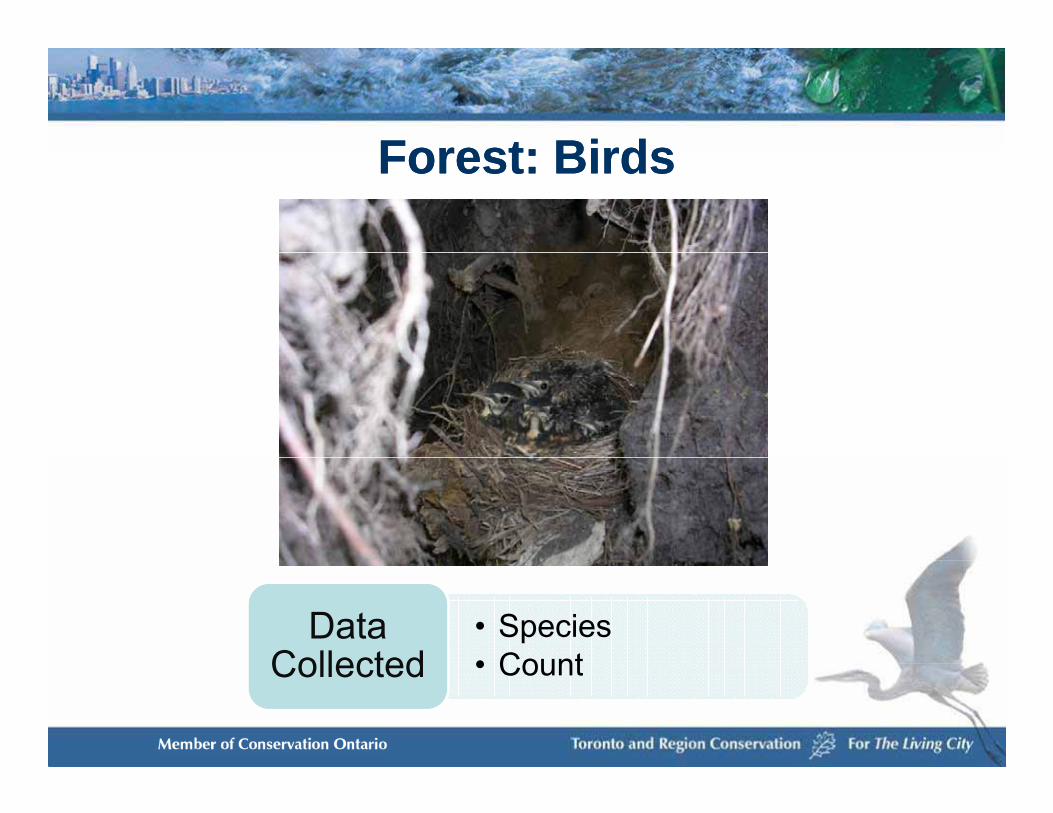
Forest: BirdsForest: BirdsForest: BirdsForest: Birds
• Species• Count
Data Collected • CountCollected

F tF t Pl th d tidPl th d tid S l dS l dForest: Forest: PlethodontidPlethodontid SalamandersSalamanders
• SpeciesC t
Data C ll t d • CountCollected
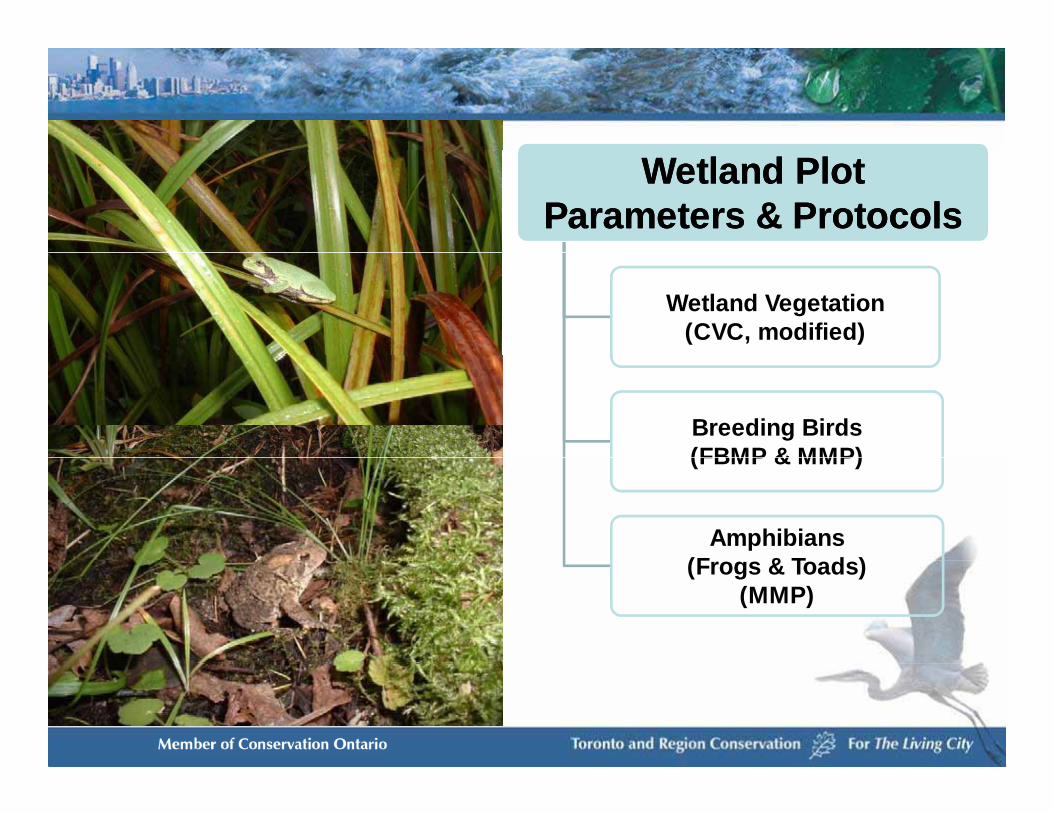
Wetland PlotWetland PlotParameters & ProtocolsParameters & Protocols
Wetland Vegetation(CVC, modified)
Breeding Birds(FBMP & MMP)(FBMP & MMP)
Amphibians (F & T d )(Frogs & Toads)
(MMP)
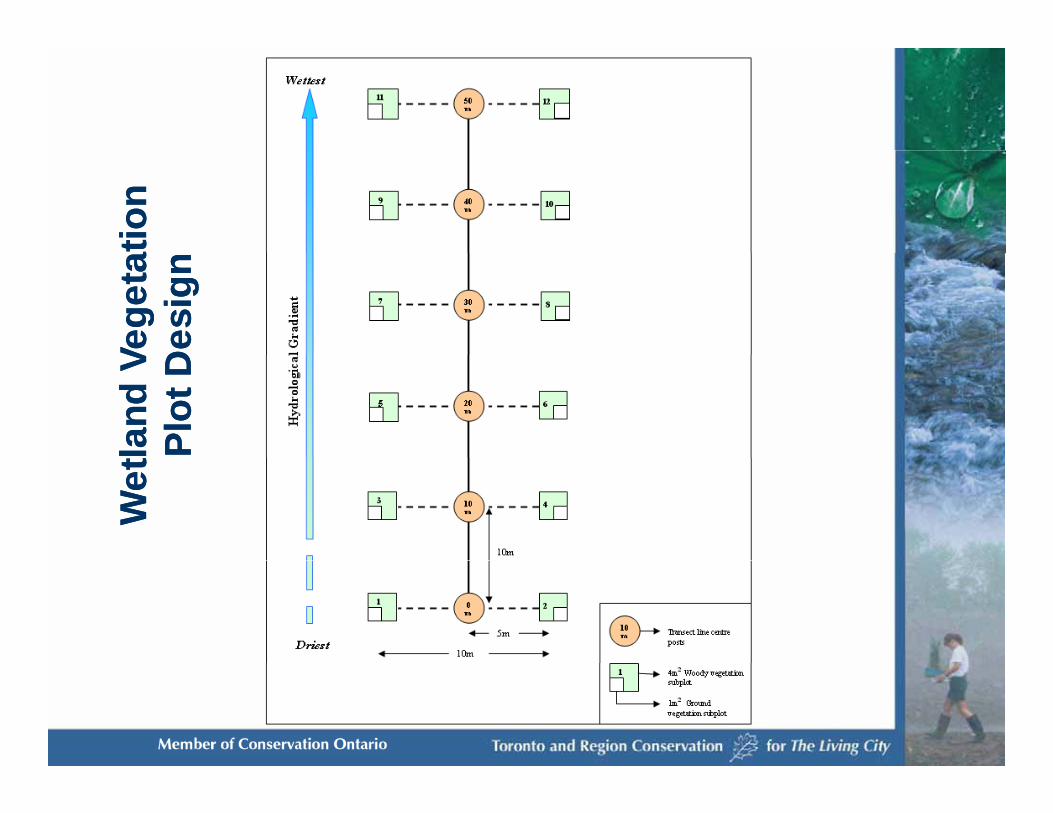
tion
tion
Veg
eta
Veg
eta
Des
ign
Des
ign
land
Vla
nd V
Plo
t D
Plo
t D
Wet
Wet
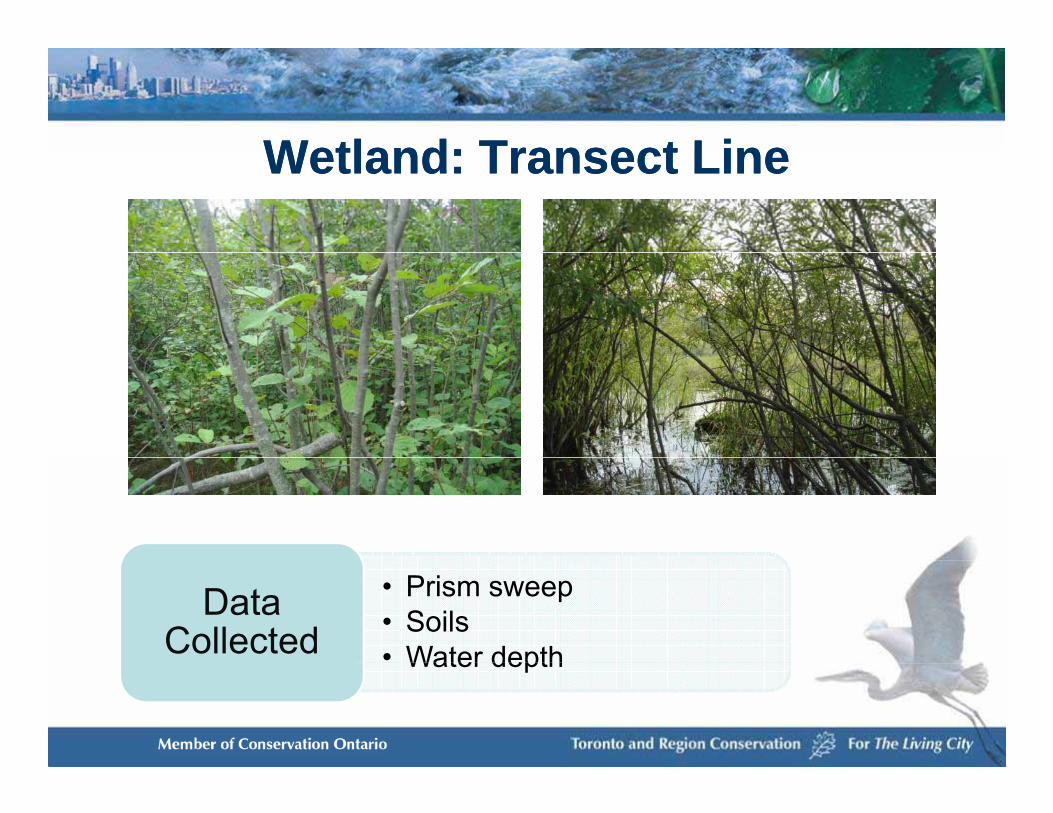
Wetland: Transect LineWetland: Transect LineWetland: Transect LineWetland: Transect Line
• Prism sweep• Soils• Water depth
Data Collected Water depth
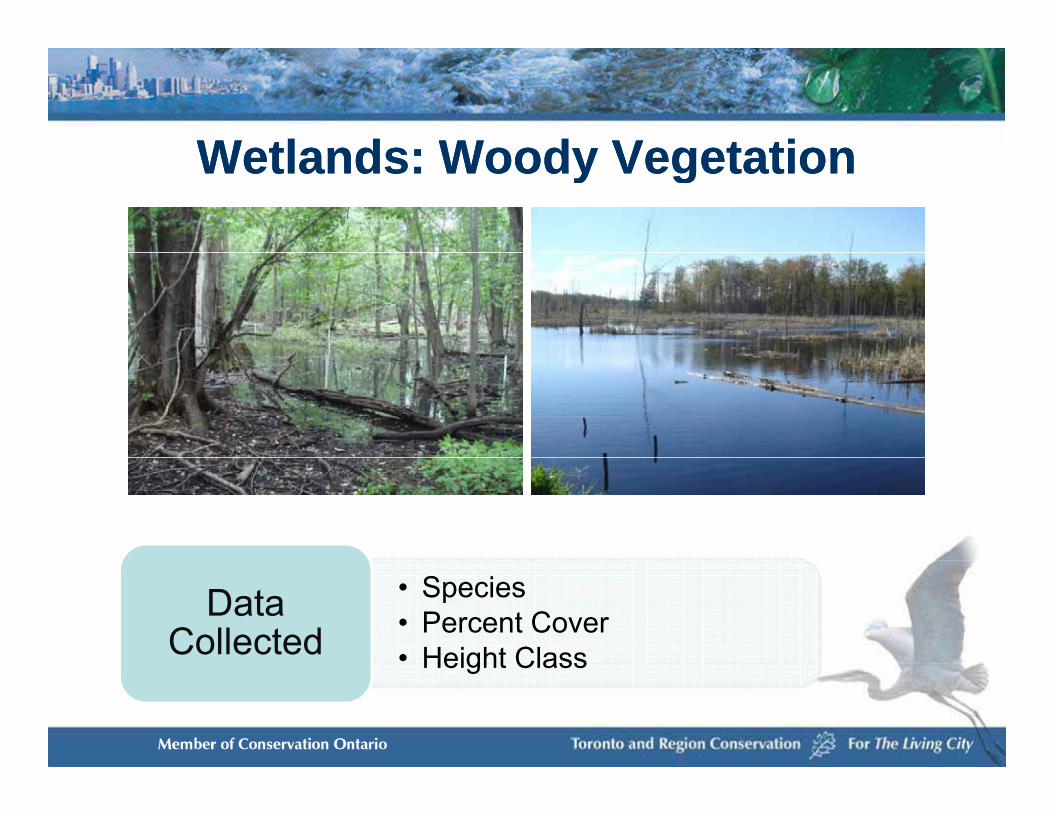
Wetlands: Woody VegetationWetlands: Woody VegetationWetlands: Woody VegetationWetlands: Woody Vegetation
• Species• Percent Cover• Height Class
Data Collected Height Class
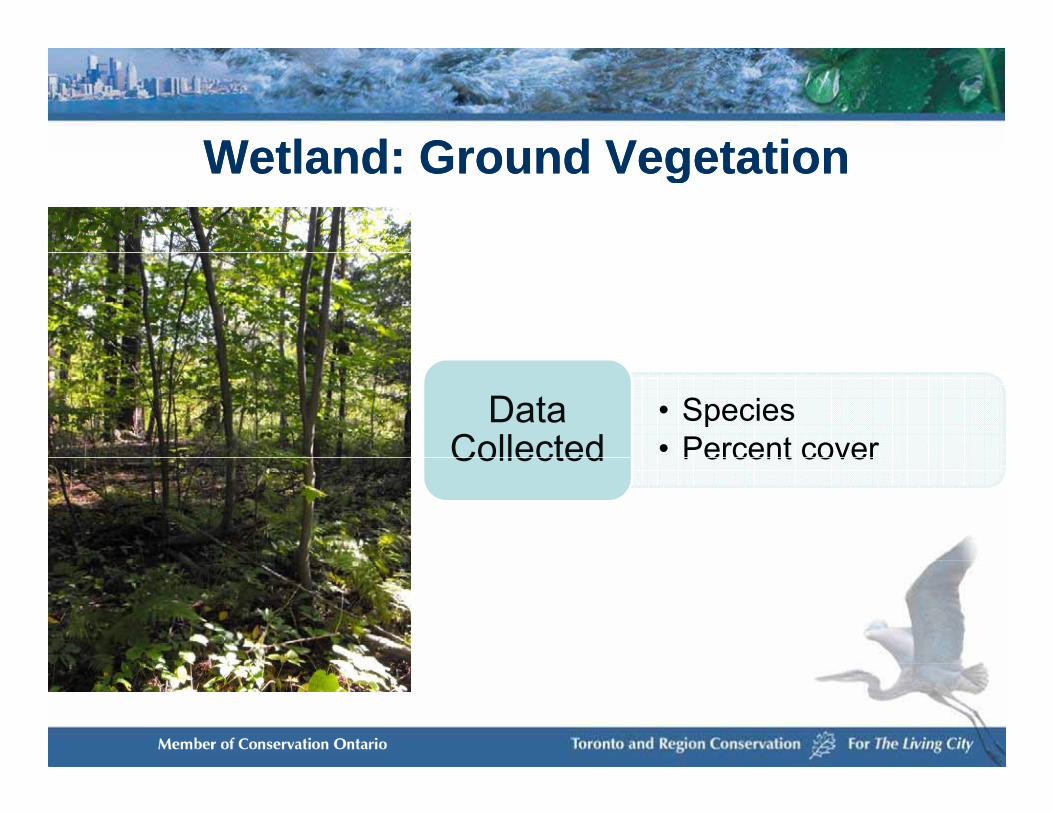
Wetland: Ground VegetationWetland: Ground VegetationWetland: Ground VegetationWetland: Ground Vegetation
• Species• Percent cover
Data Collected Percent coverCollected
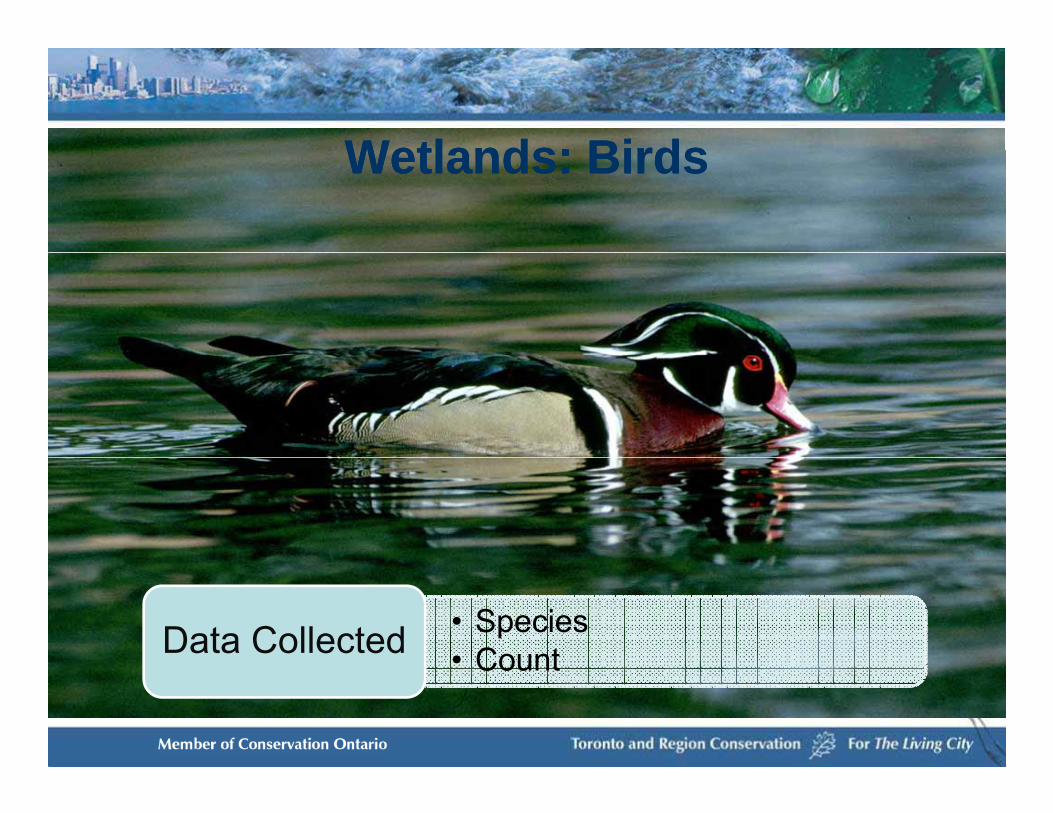
Wetlands: BirdsWetlands: BirdsWetlands: BirdsWetlands: Birds
• Species• CountData Collected • Count
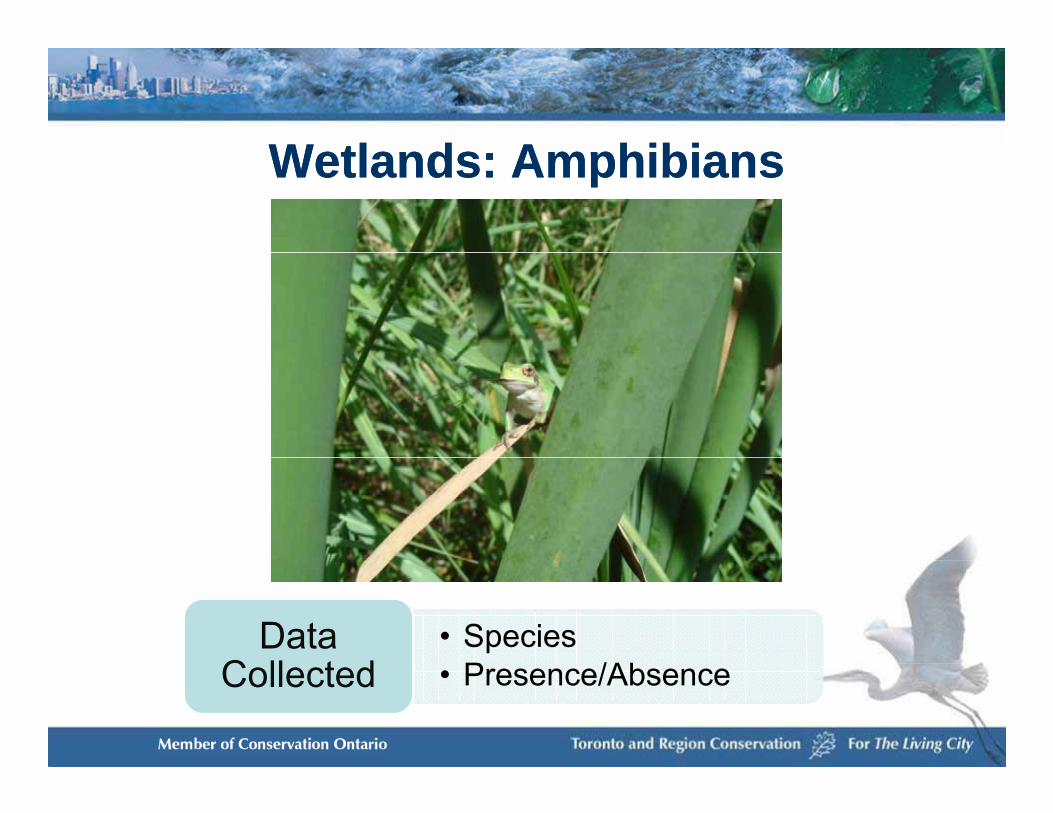
W tl d A hibiW tl d A hibiWetlands: AmphibiansWetlands: Amphibians
• SpeciesP /Ab
Data C ll t d • Presence/AbsenceCollected
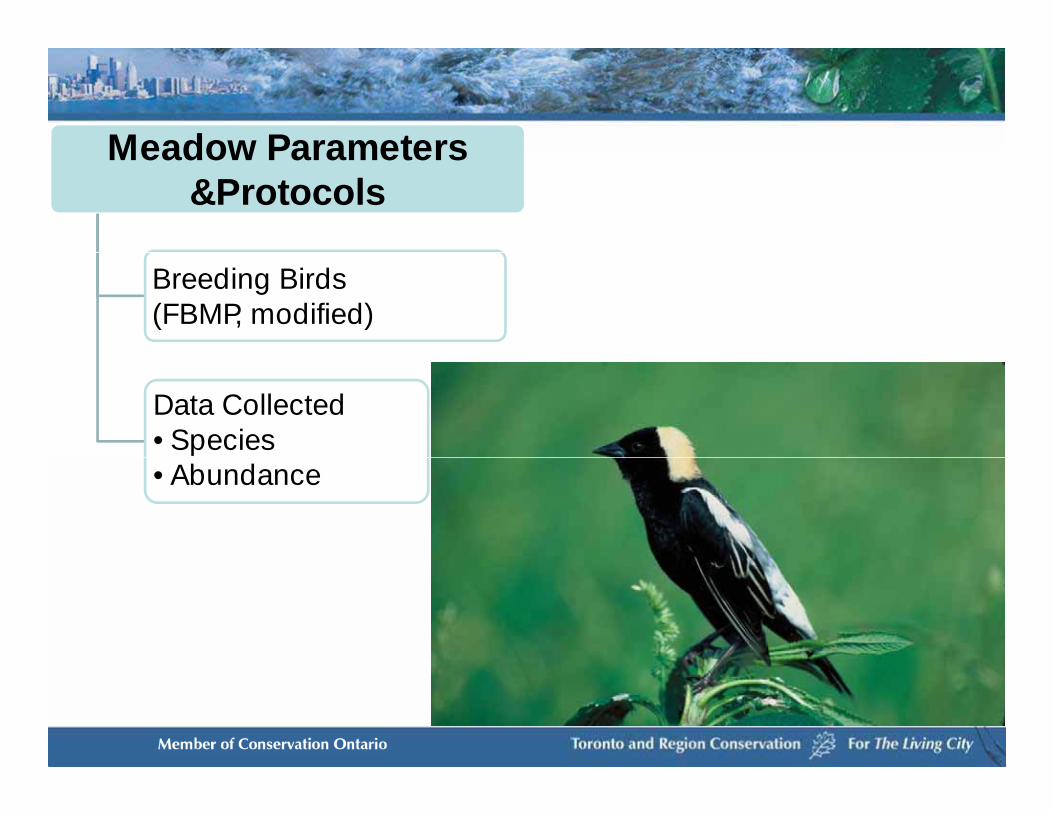
Meadow Parameters Meadow Parameters &Protocols
Breeding Birds(FBMP, modified)
Data Collected•Species•Abundance
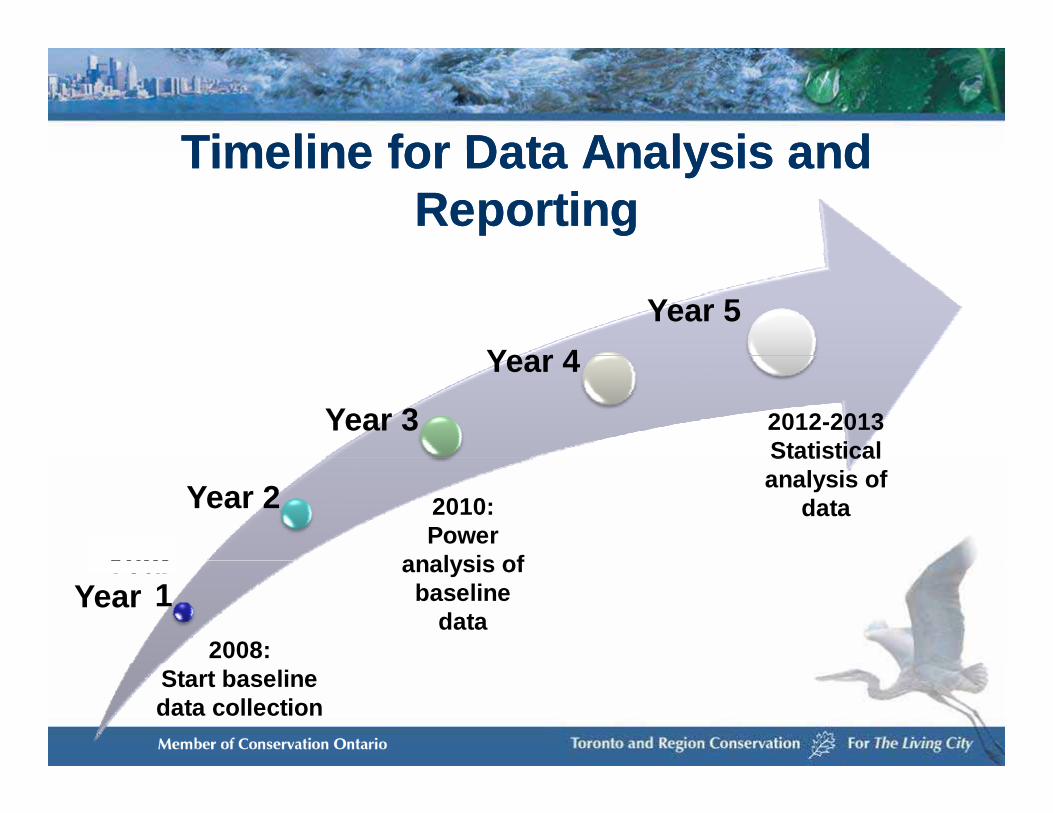
Timeline for Data Analysis and Timeline for Data Analysis and Timeline for Data Analysis and Timeline for Data Analysis and ReportingReporting
Year 4Year 5
Year 3
Year 4
2012-2013Statistical
Year
Year 2 2010:Power
analysis of
Statistical analysis of
data
Year 1Year
2008:
analysis of baseline
data
Start baseline data collection
HighlightsHighlightsHighlightsHighlights♦ Comprehensive monitoring program♦ Comprehensive monitoring program♦ Trend detection♦ Strengthen existing data sets♦ Strengthen existing data sets♦ Contributes to other program & projects♦ Regional and local applications♦ Regional and local applications ♦ Maintain and increase biodiversity
Program ContactsProgram ContactsProgram ContactsProgram Contacts♦ Project Manager, Terrestrial Monitoring and♦ Project Manager, Terrestrial Monitoring and
Inventories – Sue Hayes♦ Manager, Regional Watershed and Reporting -g , g p g
Scott Jarvie♦ Environmental Technical Assistant - Natasha
Gonsalves♦ Flora Biologist - Kelly Purves♦ Flora Biologist - Gavin Miller♦ Fauna Biologist - Paul Priorg
AcknowledgementsAcknowledgementsAcknowledgementsAcknowledgements♦ Region of Durham♦ Region of Durham♦ Peel Region♦ York Region♦ York Region♦ City of Toronto♦ Remedial Action Plan♦ Remedial Action Plan
Thank YouThank YouThank YouThank You
Questions?Questions?