terry blevins principal technologist emerson process ...modelingandcontrol.com/repository/use of...
TRANSCRIPT

Terry Blevins
Principal Technologist
Emerson Process Management
Austin, TX

On-line Decision Support for Operations Personnel
Product quality predictions
Early process fault detection
Embedded On-line Analytics brings quality information, fault
detection, and abnormal situation knowledge to the operator –
bridging the gap between quality and control.
The PAT Guidelines issued by the FDA emphasized the use of
multivariate analytics as a means of reducing cost, improving
product quality.
QUALITY CONTROL

PCA – Principal Components Analysis
Provides a concise overview of a data set. It is powerful for
recognizing patterns in data: outliers, trends, groups,
relationships, etc.
PLS – Projections to Latent Structures
The aim is to establish relationships between input and output
variables and developing predictive models of a process.
PLS-DA – PLS with Discriminant Analysis
When coupled, is powerful for classification. The aim is to
create predictive models of the process but where one can
accurately classify future unknown samples.

Through the use of Principal Component Analysis
(PCA) it will be possible to detect abnormal
operations resulting from both measured and
unmeasured faults.
Measured disturbances – may be quantified through
the application of Hotelling’s T2 statistic.
Unmeasured disturbances – The Q statistic, also
known as the Squared Prediction Error (SPE), may be
used.
Faults are determined by comparing these
calculated statistics to an upper limit
An abnormal condition is indicated if the value exceeds
the limit.
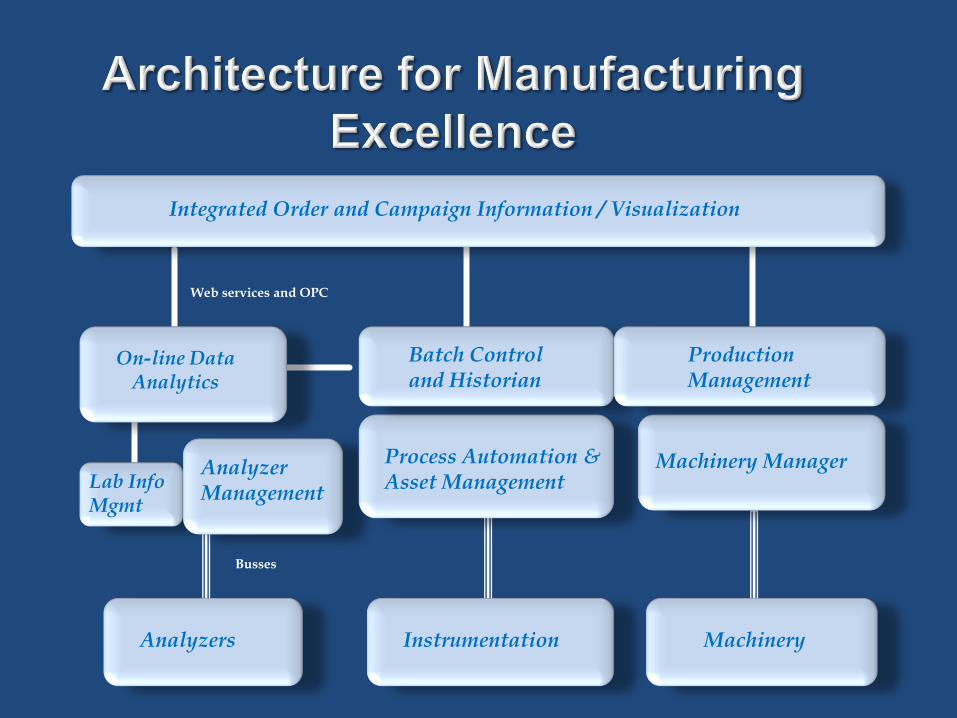
Web services and OPC
Busses
Integrated Order and Campaign Information / Visualization
On-line Data Analytics
Lab Info Mgmt
Analyzer Management
Process Automation & Asset Management
Machinery Manager
Batch Control and Historian
Analyzers
Production Management
Instrumentation Machinery

Process holdups. Tools must account for operator and event initiated processing halts and restarts.
Access to lab data. Lab results must be available to both the off-line and the online analytic toolsets.
Variations in feedstock. The properties associated with each material shipment should be available for use in online analytic tools.
Varying operating conditions. The analytic model must account for the batch being broken into multiple operations that span multiple units.
Concurrent batches. The data collection and analysis toolset and online operation must take into account concurrent batches.
Assembly and organization of the data. Efficient tools to access, correctly sequence, and organize a data set must be available to analyze the process and to move the results of that analysis online.

Time
Bat
ches
Y - Space
On-line Process Measurements
QualityMeasurements
X - Space
Batch 1
Batch 2
Batch 3
Batch 4
Batch 5
Batch 6
Batch .. biBatches all have variable length time durations

Dynamic Time
Warping
A key technology
used in model
generation
Feature matches
dissimilar length
batches to a uniform
length for analysis
1 7 13 19 25 31 37 43 49 55 61 67 73 79 85 91 97 103 109
1 7 13 19 25 31 37 43 49 55 61 67 73 79 85 91 97 103 109
Before
After

ISA S88.01 defines stage
as: “a part of a process
that usually operates
independently from other
process stages and that
usually results in a planned
sequence of chemical or
physical changes in the
material being processed”
Analytic models are defined
based on the batch stage –
consistent with ISA S88
model.
The inputs and outputs
used in analysis may be
different for each stage.

When creating PCA and PLS models for a selected product, the X variables are defined by stages.
Some X variables only apply to certain stages of manufacturing
Define X variable per stage using stage selection

Form a multi-discipline
team that includes plant
operations
Integrate Lab and
Truck Shipment Data
Identify Calculated Properties
Instrumentation Survey , tune control loops
Conduct Formal operator training
Capture team input e.g.
“input-output” data matrix

Analytic Process Models
Evaluation process operation
Process measurements, lab and Truck analysis over last year
Calculated Feed Composition
Process measurements
Operator Interface
Predicted End of Batch Quality
Fault Detection
TT
207
TC
207
TT
206
TC
206
Coolant return
Bioreactor
RSP
AT
205AT
204
FC
203
FC
201
FT
201Feed
e.g. Glucose
AC
204
Reagent
e.g. Ammonia
FC
202
FT
202Air
pH
AC
205Dissolved
Oxygen
Vent
PT
208
PC
208
RSPCharge
e.g. Media
FT
203 Coolant
supply
IT
209
LT
210
To Harvest
TT
207
TC
207
TC
207
TT
206
TC
206
TC
206
Coolant return
Bioreactor
RSP
AT
205AT
204
FC
203
FC
203
FC
201
FC
201
FT
201Feed
e.g. Glucose
AC
204
AC
204
Reagent
e.g. Ammonia
FC
202
FC
202
FT
202Air
pH
AC
205
AC
205Dissolved
Oxygen
Vent
PT
208
PC
208
PC
208
RSPCharge
e.g. Media
FT
203 Coolant
supply
IT
209
LT
210
To Harvest
Storage Tank Design
Tank
Design 2Tank Design 1
Tank
Design 3
Storage Tank Design
Tank
Design 2Tank Design 1
Tank
Design 3

1. If either Fault Detection plot
exceeds or approaches the
upper control limit of 1.0, click
on that point in the trend and
-> Select the Parameter in the
lower corner of the screen that
contributed to the fault
2. Evaluate the parameter trends
from process operation
standpoint
-> take corrective action if
necessary
3. Inspect impact of fault on
quality prediction plot to find out
how quality may be affected
If a fault is indicted in the overview screen, then selecting the batch number will bring up the Fault Detection view.
Analytics Overview
Quality Parameter
Prediction
Contribution Parameter Trend (s)
Fault Detection
1
2
3

When the hot oil
valve is opened,
the flow rate is
much lower than
normal
The lower flow
rate impacts the
time needed for
the mixer to
reach target
temperature –
extending batch
time

Fault shows up in
Indicator 2
deviating above 1.
To find the cause of
the fault, select the
point of maximum
deviation and then
choose the
Contribution Tab or
select the
parameters that
contribute most to
the fault - shown in
the lower corner of
the screen.

The trend
confirms that
the media flow
rate is ~ 2
liters/sec which
is much lower
than the
normal flow
rate of 4
liters/sec.

The prediction
plot confirms
that the low oil
flow rate has
no impact on
the predicted
product
density.

For the Saline process, the prediction of product density has proven to be very accurate even though variations in the salt bin level are a major source of variation in the processing conditions.

Development of a bridge in the salt bin will reduce the flow of salt to the screw feeder and thus will impact the final product concentration
The reduced salt flow is reflected in the change in mixer level when the screw feeder is turned on.

The reduced salt flow when a bridge develops in the salt bin is detected as an unexplained deviation.

Reduced salt
flow is
reflected by a
less than
normal
change in
mixer level
while the salt
feeder turned
on.

Coating of the sensor may introduce a bias into the pH measurement -resulting in a shift of the pH maintained in the reactor.
May impact cell growth rate and product formation.

Fault shows up as an explained and unexplained change – deviation above 1.
To find the cause of the fault, select the point of maximum deviation and then choose the Contribution Tab.

Drift in the pH
measurement is
reflected in the
pH measurement
and controller
output.
A trend of the pH
and pH controller
output can be
obtained by
clicking on media
flow parameter in
the contribution
screen.

Impact of the
change in
measurement
bias is shown as
an immediate
change in pH.

Longer term the
faulty pH
measurement is
reflected in an
abnormally low
reagent addition
being used to
maintain the
indicated pH.


TT
207
TC
207
TT
206
TC
206
Coolant return
Bioreactor
RSP
AT
205AT
204
FC
203
FC
201
FT
201Feed
e.g. Glucose
AC
204
Reagent
e.g. Ammonia
FC
202
FT
202Air
pH
AC
205Dissolved
Oxygen
Vent
PT
208
PC
208
RSPCharge
e.g. Media
FT
203 Coolant
supply
IT
209
LT
210
To Harvest
TT
207
TC
207
TC
207
TT
206
TC
206
TC
206
Coolant return
Bioreactor
RSP
AT
205AT
204
FC
203
FC
203
FC
201
FC
201
FT
201Feed
e.g. Glucose
AC
204
AC
204
Reagent
e.g. Ammonia
FC
202
FC
202
FT
202Air
pH
AC
205
AC
205Dissolved
Oxygen
Vent
PT
208
PC
208
PC
208
RSPCharge
e.g. Media
FT
203 Coolant
supply
IT
209
LT
210
To Harvest
Outputs
Inputs
Unit 1Unit 2
Outputs
Inputs
RM1 add - T setting
RM2 add and hold
Drying
Cartridge filtration
RM1 add - T setting
1st RM2 add and heat
2nd RM2 add and hold
Recover
Filter/adjust
Transfer
TT
207
TC
207
TT
206
TC
206
Coolant return
Bioreactor
RSP
AT
205AT
204
FC
203
FC
201
FT
201Feed
e.g. Glucose
AC
204
Reagent
e.g. Ammonia
FC
202
FT
202Air
pH
AC
205Dissolved
Oxygen
Vent
PT
208
PC
208
RSPCharge
e.g. Media
FT
203 Coolant
supply
IT
209
LT
210
To Harvest
TT
207
TC
207
TC
207
TT
206
TC
206
TC
206
Coolant return
Bioreactor
RSP
AT
205AT
204
FC
203
FC
203
FC
201
FC
201
FT
201Feed
e.g. Glucose
AC
204
AC
204
Reagent
e.g. Ammonia
FC
202
FC
202
FT
202Air
pH
AC
205
AC
205Dissolved
Oxygen
Vent
PT
208
PC
208
PC
208
RSPCharge
e.g. Media
FT
203 Coolant
supply
IT
209
LT
210
To Harvest


The beta test showed through several batches an increasing deviation of the
density measurement of a critical component.
This phenomenon was linked to the start of plugging which was quickly solved
by applying steam without time cycle impact.
The on-line tool indicated a problem going on the cooling system of the reactor
It detected that the component charge was being introduced too slowly and that
the reactor temperature was running a little bit higher. The problem was solved
on the Aero cooler.
These problems were going unnoticed with the existing monitoring and control systems.

Problem identified with an “up stream” boiler negatively impacting
operations. A quote from the operations personnel follows:
“…thanks to the Beta. An equipment failure was discovered in advance and avoid
losing 5 hours per batch for the batch in process and also for the following
batches before discovering the problem with the traditional manner. Probably
some days would have be necessary to discover that type of mechanical problem
without the Beta. (Boiler combustion air controller located in a bad accessible
zone and thermal oil leakage). …(we would have) discovered this latter with the
periodic update of the indicators of efficiency, but we saved time earlier thanks to
the beta. Earlier is better than too late!”

The use of on-line batch data analytics will cause people to think
in entirely new ways and to address process improvement and
operations with a better understanding of the process.
Its use will allow operational personnel to identify and make well-
informed corrections before the end-of-batch, and help ensure that
batches repeatedly hit pre-defined end-of-batch targets.
Use of this methodology with allow engineers and other operations
personnel to gain further insight into the relationships between
process variables and their impact on product quality parameters.
It also will provide additional information to help process control
engineers pinpoint where process control needs to be improved.
The results
Greater understanding of the process
An increase in quality consistency
Increased throughput
More good batches!

Published Papers
Robert Wojewodka and Terry Blevins, “Data Analytics in Batch Operations”, Control, May 2008
Terry Blevins and James Beall, “First Steps to Address PAT Initiative”, Pharmaceutical Canada, Volume 8 Number 4, March-April, 2008
Conference Presentations
Robert Wojewodka, Terry Blevins, “Benefits Achieved Using On-Line Data Analytics”. Emerson Exchange, 2009
Terry Blevins, “Overview of PAT and Application of PAT for Product Development”, Life Science Session, Emerson Exchange, 2008
Robert Wojewodka, Willy Wojsznis, “Process Analytics In Depth”, Emerson Exchange, 2008
Robert Wojewodka, Terry Blevins, “The Application of Data Analytics in Batch Operations”, Emerson Exchange, 2008
Michel Lefrancois, Randy Reiss, “Tools for Online Analytics”, Emerson Exchange, 2008

Conference Presentations (Cont)
Terry Blevins, Michael Boudreau, Yan Zhang, Trish Benton, “Application of PAT in Product Development”, Interphex2008 – Conference Presentation, March, 2008
Philippe Moro, Christopher Worek, “Integrating SAP® Software into DeltaV”, Emerson Exchange, 2008
Robert Wojewodka, Philippe Moro, Terry Blevins, “Coupling Process Control Systems and Process Analytics to Improve Batch Operations”, Emerson Exchange Presentation, 2007
Video
Video: Scott Broadley, Trish Benton, Terry Blevins, Emerson - BroadleyJames Beta: http://www.controlglobal.com/articles/2007/309.html .
Video: Robert Wojewodka, Philippe Moro, Terry Blevins Emerson - Lubrizol Beta: http://www.controlglobal.com/articles/2007/321.html
Books
Michael Boudreau and Gregory McMillan, New Directions in Bioprocess Modeling and Control , Chapter 8, ISA, 2006