terry j. mcgenity kenneth n. timmis balbina nogales
TRANSCRIPT

Hydrocarbon and Lipid Microbiology Protocols
Terry J. McGenityKenneth N. TimmisBalbina Nogales Editors
Bioproducts, Biofuels, Biocatalysts and Facilitating Tools

Springer Protocols Handbooks
More information about this series at http://www.springer.com/series/8623

Terry J. McGenity • Kenneth N. Timmis • Balbina Nogales
Editors
Hydrocarbon and LipidMicrobiology Protocols
Bioproducts, Biofuels, Biocatalystsand Facilitating Tools
Scientific Advisory BoardJack Gilbert, Ian Head, Mandy Joye, Victor de Lorenzo,
Jan Roelof van der Meer, Colin Murrell, Josh Neufeld,
Roger Prince, Juan Luis Ramos, Wilfred Roling,
Heinz Wilkes, Michail Yakimov

EditorsTerry J. McGenitySchool of Biological SciencesUniversity of EssexColchester, Essex, UK
Kenneth N. TimmisInstitute of MicrobiologyTechnical University BraunschweigBraunschweig, Germany
Balbina NogalesDepartment of BiologyUniversity of the Balearic Islandsand Mediterranean Institutefor Advanced Studies(IMEDEA, UIB-CSIC)
Palma de Mallorca, Spain
ISSN 1949-2448 ISSN 1949-2456 (electronic)Springer Protocols HandbooksISBN 978-3-662-53113-6 ISBN 978-3-662-53115-0 (eBook)DOI 10.1007/978-3-662-53115-0
Library of Congress Control Number: 2016938230
# Springer-Verlag Berlin Heidelberg 2017This work is subject to copyright. All rights are reserved by the Publisher, whether the whole or part of the material isconcerned, specifically the rights of translation, reprinting, reuse of illustrations, recitation, broadcasting, reproduction onmicrofilms or in any other physical way, and transmission or information storage and retrieval, electronic adaptation,computer software, or by similar or dissimilar methodology now known or hereafter developed.The use of general descriptive names, registered names, trademarks, service marks, etc. in this publication does not imply,even in the absence of a specific statement, that such names are exempt from the relevant protective laws and regulations andtherefore free for general use.The publisher, the authors and the editors are safe to assume that the advice and information in this book are believed to betrue and accurate at the date of publication. Neither the publisher nor the authors or the editors give a warranty, express orimplied, with respect to the material contained herein or for any errors or omissions that may have been made.
Printed on acid-free paper
This Springer imprint is published by Springer NatureThe registered company is Springer-Verlag GmbH Berlin Heidelberg

Preface to Hydrocarbon and Lipid MicrobiologyProtocols1
All active cellular systems require water as the principal medium and solvent for their metabolic and
ecophysiological activities. Hydrophobic compounds and structures, which tend to exclude water,
although providing inter alia excellent sources of energy and a means of biological compartmental-
ization, present problems of cellular handling, poor bioavailability and, in some cases, toxicity.
Microbes both synthesize and exploit a vast range of hydrophobic organics, which includes biogenic
lipids, oils and volatile compounds, geochemically transformed organics of biological origin
(i.e. petroleum and other fossil hydrocarbons) and manufactured industrial organics. The underlying
interactions between microbes and hydrophobic compounds have major consequences not only for
the lifestyles of the microbes involved but also for biogeochemistry, climate change, environmental
pollution, human health and a range of biotechnological applications. The significance of this
“greasy microbiology” is reflected in both the scale and breadth of research on the various aspects
of the topic. Despite this, there was, as far as we know, no treatise available that covers the subject.
In an attempt to capture the essence of greasy microbiology, the Handbook of Hydrocarbon and LipidMicrobiology (http://www.springer.com/life+sciences/microbiology/book/978-3-540-77584-3) was
published by Springer in 2010 (Timmis 2010). This five-volume handbook is, we believe, unique
and of considerable service to the community and its research endeavours, as evidenced by the large
number of chapter downloads. Volume 5 of the handbook, unlike volumes 1–4 which summarize
current knowledge on hydrocarbon microbiology, consists of a collection of experimental protocols
and appendices pertinent to research on the topic.
A second edition of the handbook is now in preparation and a decision was taken to split off the
methods section and publish it separately as part of the Springer Protocols program (http://www.
springerprotocols.com/). The multi-volume work Hydrocarbon and Lipid Microbiology Protocols,while rooted in Volume 5 of the Handbook, has evolved significantly, in terms of range of topics,
conceptual structure and protocol format. Research methods, as well as instrumentation and
strategic approaches to problems and analyses, are evolving at an unprecedented pace, which can
be bewildering for newcomers to the field and to experienced researchers desiring to take new
approaches to problems. In attempting to be comprehensive – a one-stop source of protocols for
research in greasy microbiology – the protocol volumes inevitably contain both subject-specific and
more generic protocols, including sampling in the field, chemical analyses, detection of specific
functional groups of microorganisms and community composition, isolation and cultivation of such
organisms, biochemical analyses and activity measurements, ultrastructure and imaging methods,
genetic and genomic analyses, systems and synthetic biology tool usage, diverse applications, and
1Adapted in part from the Preface to Handbook of Hydrocarbon and Lipid Microbiology.
v

the exploitation of bioinformatic, statistical and modelling tools. Thus, while the work is aimed at
researchers working on the microbiology of hydrocarbons, lipids and other hydrophobic organics,
much of it will be equally applicable to research in environmental microbiology and, indeed,
microbiology in general. This, we believe, is a significant strength of these volumes.
We are extremely grateful to the members of our Scientific Advisory Board, who have made
invaluable suggestions of topics and authors, as well as contributing protocols themselves, and to
generous ad hoc advisors like Wei Huang, Manfred Auer and Lars Blank. We also express our
appreciation of Jutta Lindenborn of Springer who steered this work with professionalism, patience
and good humour.
Colchester, Essex, UK Terry J. McGenity
Braunschweig, Germany Kenneth N. Timmis
Palma de Mallorca, Spain Balbina Nogales
Reference
Timmis KN (ed) (2010) Handbook of hydrocarbon and lipid microbiology. Springer, Berlin, Heidelberg
vi Preface to Hydrocarbon and Lipid Microbiology Protocols

Contents
Introduction to Bioproducts, Biofuels, Biocatalysts and Facilitating Tools . . . . . . . . . . . 1
Willy Verstraete
Genetic Enzyme Screening System: A Method for High-Throughput Functional
Screening of Novel Enzymes from Metagenomic Libraries . . . . . . . . . . . . . . . . . . . . . . 3
Haseong Kim, Kil Koang Kwon, Eugene Rha, and Seung-Goo Lee
Functional Screening of Metagenomic Libraries: Enzymes Acting
on Greasy Molecules as Study Case . . . . . . . . . . . . . . . . . . . . . . . . . . . . . . . . . . . . . . . . 13
Monica Martınez-Martınez, Peter N. Golyshin, and Manuel Ferrer
Screening for Enantioselective Lipases . . . . . . . . . . . . . . . . . . . . . . . . . . . . . . . . . . . . . . 37
Thomas Classen, Filip Kovacic, Benjamin Lauinger, Jorg Pietruszka,
and Karl-Erich Jaeger
Use of Bacterial Polyhydroxyalkanoates in Protein Display Technologies . . . . . . . . . . . 71
Iain D. Hay, David O. Hooks, and Bernd H.A. Rehm
Bacterial Secretion Systems for Use in Biotechnology:
Autotransporter-Based Cell Surface Display and Ultrahigh-Throughput
Screening of Large Protein Libraries . . . . . . . . . . . . . . . . . . . . . . . . . . . . . . . . . . . . . . . 87
Karl-Erich Jaeger and Harald Kolmar
Syngas Fermentation for Polyhydroxyalkanoate Productionin Rhodospirillum rubrum . . . . . . . . . . . . . . . . . . . . . . . . . . . . . . . . . . . . . . . . . . . . . . . . 105
O. Revelles, I. Calvillo, A. Prieto, and M.A. Prieto
Genetic Strategies on Kennedy Pathway to Improve Triacylglycerol
Production in Oleaginous Rhodococcus Strains . . . . . . . . . . . . . . . . . . . . . . . . . . . . . . . 121
Martın A. Hernandez and Hector M. Alvarez
Production of Biofuel-Related Isoprenoids Derived
from Botryococcus braunii Algae . . . . . . . . . . . . . . . . . . . . . . . . . . . . . . . . . . . . . . . . . . 141
William A. Muzika, Nymul E. Khan, Lauren M. Jackson, Nicholas Winograd,
and Wayne R. Curtis
Protocols for Monitoring Growth and Lipid Accumulation
in Oleaginous Yeasts . . . . . . . . . . . . . . . . . . . . . . . . . . . . . . . . . . . . . . . . . . . . . . . . . . . 153
Jean-Marc Nicaud, Anne-Marie Crutz-Le Coq, Tristan Rossignol,
and Nicolas Morin
Protocol for Start-Up and Operation of CSTR Biogas Processes . . . . . . . . . . . . . . . . . . 171
vii

A. Schnurer, I. Bohn, and J. Moestedt
Protocols for the Isolation and Preliminary Characterization
of Bacteria for Biodesulfurization and Biodenitrogenation
of Petroleum-Derived Fuels . . . . . . . . . . . . . . . . . . . . . . . . . . . . . . . . . . . . . . . . . . . . . . 201
Marcia Morales and Sylvie Le Borgne
Protocol for the Application of Bioluminescence Full-Cell Bioreporters
for Monitoring of Terrestrial Bioremediation . . . . . . . . . . . . . . . . . . . . . . . . . . . . . . . . 219
Sarah B. Sinebe, Ogonnaya I. Iroakasi, and Graeme I. Paton
Protocols for the Use of Gut Models to Study the Potential
Contribution of the Gut Microbiota to Human Nutrition Through
the Production of Short-Chain Fatty Acids . . . . . . . . . . . . . . . . . . . . . . . . . . . . . . . . . . 233
Andrew J McBain, Ruth Ledder, and Gavin Humphreys
viii Contents

About the Editors
Terry J. McGenity is a Reader at the University of Essex, UK. His
Ph.D., investigating the microbial ecology of ancient salt deposits
(University of Leicester), was followed by postdoctoral positions at
the Japan Marine Science and Technology Centre (JAMSTEC, Yoko-
suka) and the Postgraduate Research Institute for Sedimentology (Uni-
versity of Reading). His overarching research interest is to understand
how microbial communities function and interact to influence major
biogeochemical processes. He worked as a postdoc with Ken Timmis at
the University of Essex, where he was inspired to investigate microbial
interactions with hydrocarbons at multiple scales, from communities to cells, and as both a source of
food and stress. He has broad interests in microbial ecology and diversity, particularly with respect
to carbon cycling (especially the second most abundantly produced hydrocarbon in the atmosphere,
isoprene), and is driven to better understand how microbes cope with, or flourish in hypersaline,
desiccated and poly-extreme environments.
Kenneth N. Timmis read microbiology and obtained his Ph.D. at
Bristol University, where he became fascinated with the topics of
environmental microbiology and microbial pathogenesis, and their
interface pathogen ecology. He undertook postdoctoral training at the
Ruhr-University Bochum with Uli Winkler, Yale with Don Marvin,
and Stanford with Stan Cohen, at the latter two institutions as a Fellow
of the Helen HayWhitney Foundation, where he acquired the tools and
strategies of genetic approaches to investigate mechanisms and causal
relationships underlying microbial activities. He was subsequently
appointed Head of an Independent Research Group at the Max Planck
Institute for Molecular Genetics in Berlin, then Professor of Biochem-
istry in the University of Geneva Faculty of Medicine. Thereafter, he became Director of the
Division of Microbiology at the National Research Centre for Biotechnology (GBF)/now the
Helmholtz Centre for Infection Research (HZI) and Professor of Microbiology at the Technical
University Braunschweig. His group has worked for many years, inter alia, on the biodegradation ofoil hydrocarbons, especially the genetics and regulation of toluene degradation, pioneered the
genetic design and experimental evolution of novel catabolic activities, discovered the new group
of marine hydrocarbonoclastic bacteria, and conducted early genome sequencing of bacteria that
ix

became paradigms of microbes that degrade organic compounds (Pseudomonas putida and Alcani-vorax borkumensis). He has had the privilege and pleasure of working with and learning from some
of the most talented young scientists in environmental microbiology, a considerable number of
which are contributing authors to this series, and in particular Balbina and Terry. He is Fellow of
the Royal Society,Member of the EMBO, Recipient of the Erwin Schrodinger Prize, and Fellow of the
American Academy of Microbiology and the European Academy of Microbiology. He founded the
journals Environmental Microbiology, Environmental Microbiology Reports and Microbial Biotech-nology. Kenneth Timmis is currently Emeritus Professor in the Institute of Microbiology at the
Technical University of Braunschweig.
Balbina Nogales is a Lecturer at the University of the Balearic Islands,
Spain. Her Ph.D. at the Autonomous University of Barcelona (Spain)
investigated antagonistic relationships in anoxygenic sulphur photo-
synthetic bacteria. This was followed by postdoctoral positions in the
research groups of Ken Timmis at the German National Biotechnology
Institute (GBF, Braunschweig, Germany) and the University of Essex,
where she joined Terry McGenity as postdoctoral scientist. During that
time, she worked in different research projects on community diversity
analysis of polluted environments. After moving to her current posi-
tion, her research is focused on understanding microbial communities in chronically hydrocarbon-
polluted marine environments, and elucidating the role in the degradation of hydrocarbons of certain
groups of marine bacteria not recognized as typical degraders.
x About the Editors

Introduction to Bioproducts, Biofuels, Biocatalystsand Facilitating Tools
Willy Verstraete
Abstract
In this volume, two main aspects are addressed. First, there is the enzymatic machinery dealing withhydrocarbons, fats, and oils. There is great progress in this domain and plenty of novel routes are stillpossible to explore and to upgrade to bring better microbial derived toolboxes to market implementation.Secondly there is the vast array of microbial lipid-associated molecules, ranging from volatile fatty acids toalkanoates and oils. Also in this domain, novel breakthroughs are at hand. The fact that enzymes capable ofacting towards greasy molecules both in the bioconversion and the cleantech industry are of greatimportance is well recognized. The protocols provided in this chapter allow to screen for a panoply ofempowered fat-modifying biocatalysts such as, e.g., esterases, lipases, phospholipases, and even dehalo-genases and C-C metacleavage product hydrolyses. Clearly, these approaches offer potential for a variety ofenvironmental friendly removals/degradations/modifications of this important group of waxy-greasy typesof natural and xenobiotic molecules.
Keywords: Gut simulators, Novel lipases and esterases, Oleaginous microbial strains, PHA as proteinbinder
The production of proteins of interest directly relates to the puta-tive secretion of proteinaceous products. A special chapter describesthe generation of protein libraries and library screening, usingmagnetic- and fluorescence-activated cell sorting technologieswhich can be of specific use in the development of new novel lipasesand esterases.
Short chain fatty acids produced in the gut by fermentation offeed/food components are of crucial importance in terms ofresorption by the colonic epithelium. The understanding of thegastro-intestinal microbiome has made great progress in the lastdecade. A major breakthrough has been the development of gutmodels of such as the well known TIM system [1] and the wellaccessible SHIME [2] and its further advanced developments [3].The protocol describes the set-up of a do-it-yourself three-stagecontinuous culture system and the way next generation sequencing
T.J. McGenity et al. (eds.), Hydrocarbon and Lipid Microbiology Protocols, Springer Protocols Handbooks, (2017) 1–2,DOI 10.1007/8623_2016_200, © Springer-Verlag Berlin Heidelberg 2016, Published online: 08 November 2016
1

will generate the potential to better understand the possible linksbetween fatty acid metabolism of the gastro-intestinal microbiomeand the health of the host.
The pictures of “obese” microbial cells full of polyhydroxybu-tyrate are well known. There are a multitude of potential applica-tions already reported in the literature about poly hydroxylalkanoates ranging from a substrate to make biodegradable plastic[4] over a putative carbon source for denitrification [5] being apowerful prebiotic [6]. Yet the application of PHA as a biocompat-ible and biodegradable carrier for immobilized microbial proteins isreally a very startling development, the more because it apparentlycan easily be engineered in E. coli.
To immobilize functional proteins on a solid support material iscommon practice in the biotech industry. This has also led tovarious catalytic processes enhancements but also to progress inthe biosensor and micro-array technologies. The fact that one canachieve inside the microbial cell, the in vivo production of a func-tional protein covalently attached to the surface of a bio-polyesterby fusing the functional protein to the polyester synthase, is really amarvellous concept.
Microbial oil and handling oleaginous strains is a topic of long-standing interest. Bacterial triacylglycerides (TAGs) have applica-tions in feeds, cosmetics, and lubricants. The protocol on geneticstrategies to enhance the single cell oil levels is most welcome in theframework of upgrading simple carbon sources under specific con-ditions (often N limiting) and offers quite some perspectives.
References
1. Jedidi H et al (2014) Effect of milk enrichedwith conjugated linoleic acid and digested in asimulator (TIM-1) on the viability of probioticbacteria. Int Dairy J 37:20–25
2. Alander M et al (1999) The effect of prebioticstrains on the microbiota of the simulator of thehuman microbial ecosystem (SHIME). Int JFood Microbiol 46:71–79
3. Marzorati M et al (2014) The HMI (TM) mod-ule a new tool to study the host-microbiotainteraction in the human gastrointestinal tractin vitro. BMC Microbiol 14(133). doi:10.1186/1471-2180-14-133
4. Jiang Y et al (2014) Plasticicumulans lactivoranssp nov, a polyhydroxybutyrate-accumulatinggammaproteobacterium from a sequencing-batch bioreactor fed with lactate. Int J SystEvol Microbiol 64:33–38
5. Gutierrez-Wing MT et al (2012) Evaluation ofpolyhydroxybutyrate as a carbon source forrecirculating aquaculture water denitrification.Aquacult Eng 51:36–43
6. Hung V et al (2015) Application of poly-betahydroxybutyrate (PHB) in mussel larvicul-ture. Aquaculture 446:318–324
2 Willy Verstraete

Genetic Enzyme Screening System: A Methodfor High-Throughput Functional Screening of NovelEnzymes from Metagenomic Libraries
Haseong Kim, Kil Koang Kwon, Eugene Rha, and Seung-Goo Lee
Abstract
This protocol describes a single-cell high-throughput genetic enzyme screening system (GESS) in whichGFP fluorescence is used to detect the production of phenolic compounds from a given substrate bymetagenomic enzyme activity. One of the important features of this single-cell genetic circuit is that it canbe used to screen more than 200 different types of enzymes that produce phenolic compounds from phenylgroup-containing substrates. The highly sensitive and quantitative nature of the GESS, combined with flowcytometry techniques, will facilitate rapid finding and directed evolution of valuable new enzymes such asglycosidases, cellulases, and lipases from metagenomic and other genetic libraries.
Keywords: Enzyme screening, Fluorescence-assisted cell sorting, Genetic enzyme screening system,High-throughput screening, Metagenomic library, Synthetic biology
1 Introduction
The success of biology-based industrial applications largely dependson how efficiently bio-industrial products can be manufacturedusing biocatalysts, which are currently used to manufacture over500 industrial products [1, 2]. In uncultivated environmental bac-teria, the metagenome, which is theoretically considered one of therichest available enzyme sources, contains a vast number of unchar-acterized enzyme-encoding genes [3]. Therefore, screening novelenzymes from the metagenome is essential for sustainable, cost-effective bio-industrial applications. Despite the rapid accumula-tion of sequence-driven approaches from genetic resources [4, 5],function-based screening techniques allow us to identify novelenzymes by direct observation of enzyme activities. The majorityof metagenome-derived enzymes, including many esterases andlipases, have been isolated by functional screening methods [6].Prior to 2008, a total of 76 esterases and lipases were identified via
T.J. McGenity et al. (eds.), Hydrocarbon and Lipid Microbiology Protocols, Springer Protocols Handbooks, (2017) 3–12,DOI 10.1007/8623_2015_65, © Springer-Verlag Berlin Heidelberg 2015, Published online: 04 April 2015
3

metagenomic functional screening; however, only 11 of theseenzymes were characterized due to time and cost constraints asso-ciated with overexpression and purification of metagenomic genes[7]. The recent development of rapid screening techniques hasaddressed some of the limitations of functional screening methods[8–12]. In particular, substrate-/product-induced transcriptionsystems coupled with flow cytometry have enabled high-throughput enzyme screening frommetagenomic/mutant libraries[8–10]. However, these methods require specific metabolite-responsive or product-induced transcriptional systems, suggestingtheir applications with other enzymes will be limited.
Here, we provide a detailed protocol for the genetic enzymescreening system (GESS), which was originally published in 2014[13]. GESS was designed to utilize phenol-dependent transcrip-tional activators to screen for phenol-producing enzymes, whichare one of the most abundant compounds in nature. The mecha-nism of GESS is depicted in Fig. 1. The system consists of two ANDlogics, the first of which has two inputs: a target enzyme and its
Fig. 1 Schematic representation of the genetic enzyme screening system. Intracellular phenolic compoundsare generated by various enzymatic reactions within the cell and visualized through enhanced greenfluorescent protein (EGFP), expression of which is activated by the phenol–DmpR complex. X groups can beα-/β-glycosidases, phosphates, alkyls, amines, amino acids, or halogens. R groups represent differentsubstituents on the aromatic ring. Genes for target enzymes, such as hydrolases, esterases/lipases, lyases,oxygenases, and amidases/peptidases, are selected from genetic libraries based on fluorescence signals
4 Haseong Kim et al.

substrate; the reaction between the enzyme and substrate is respon-sible for the accumulation of a phenol compound within the cell. Inthe other logic, the phenol compound and its inducible transcrip-tion factor activate the expression of a downstream reporter gene.Therefore, this system can detect the activity of any enzyme thatproduces phenolic compounds. In the BRENDA database (http://www.brenda-enzymes.info, 2013.7), 211 enzyme species havebeen reported to generate phenols or p-nitrophenol compoundsas by-products of their catalytic reactions (Table 1). Intracellularphenol is specifically recognized by the transcription activator
Table 1Enzymes that produce p-nitrophenol or phenol listed in the BRENDA database
EC numbers Description
No. of p-nitrophenol-producing enzymes(no. of reactions)
No. of phenol-producing enzymes(no. of reactions)
EC 1Oxidoreductases
1.3 Acting on the CH–CHgroup of donors
– 1 (1)
1.11 Peroxygenase 2 (2) –1.14 Acting on paired donors,
with incorporation orreduction of molecularoxygen
– 2 (4)
EC 2Transferases
2.3 Acyltransferases 1 (30) –2.4 Glycosyltransferases 8 (18) –2.5 Transferring alkyl or
aryl groups, otherthan methyl groups
1 (11) 1 (1)
2.7 Transferring phosphorus-containing groups
1 (65) 1 (10)
2.8 Transferring sulfur-containing groups
3 (111) 1 (2)
EC 3Hydrolases
3.1 Act on ester bonds 67 (1,933) 16 (121)3.2 Glycosylases 75 (1,546) 21 (167)3.4 Act on peptide
bonds – peptidase26 (116) 4 (4)
3.5 Act on carbon–nitrogenbonds, other thanpeptide bonds
5 (10) 3 (5)
3.6 Act on acid anhydrides 4 (26) –3.7 Act on carbon–carbon bonds 2 (3) –
EC 4Lyases
4.1 Carbon–carbon lyases – 3 (75)4.2 Carbon–oxygen lyases 1 (32) –4.3 Carbon–nitrogen lyases 1 (4) –
Subtotal number of enzymes (reactions) 197 (3,907) 53 (390)
Total number of enzymes (excluding overlapped enzymes) 211
The first and second columns show EC numbers and class descriptions. All the enzymes in these classes could be primary
candidates for GESS applications
Genetic Enzyme Screening System: A Method for High-Throughput Functional. . . 5

DmpR, an NtrC family transcriptional regulator of the (methyl)phenol catabolic operon [14, 15]. We performed a sensitivity test ofDmpR depending on the phenol concentration in Luria-Bertani(LB) media and minimal media with glucose. In addition, 21phenolic compounds were tested for DmpR specificity [13].DmpR (E135K), a mutant derivative of DmpR, can also beemployed in GESS to detect p-nitrophenol; threefold moreenzymes (197 enzymes) are responsible for p-nitrophenol produc-tion than for phenol production (53 enzymes) (Table 1). Cellu-lases, lipases, alkaline phosphatases, tyrosine phenol-lyases, andmethyl parathion hydrolases have been screened by this high-throughput method [13, 16].
Lipases and hydrocarbons are one of the major enzyme–pro-duct pairs used in sustainable bio-industries. Lipases (EC 3.1.1.3)are particularly important biocatalysts in the biotechnologicalindustry for their ability to hydrolyze insoluble triglycerides com-posed of long-chain fatty acids. p-Nitrophenol-mediated colori-metric assays are commonly used to determine lipase activity.Indeed, p-nitrophenyl esters, such as p-nitrophenyl butyrate, liber-ate p-nitrophenol via lipase activity, allowing for spectrophotomet-ric activity measurements at 405–410 nm [17, 18]. GESS can alsouse p-nitrophenyl butyrate as a substrate; however, when combinedwith flow cytometry, our single-cell-based fluorescence-detectiontechnique enables us to explore more than 107 library cells per day.Moreover, GESS can be used to screen for other types of lipases oresterases by simply changing substrates; Table 1 shows the possiblecandidates. Choosing a proper phenol-containing substrate is criti-cal for successful identification of target enzyme activities frommetagenomic DNA. Thus far, we have confirmed that twophenol-tagged substrates (phenyl phosphate and organopho-sphates) and three p-nitrophenol-tagged substrates (p-nitrophenylbutyrate, p-nitrophenyl cellotrioside, and methyl parathion) can beused to screen metagenomic enzymes [13, 16].
The vector map containing GESS (pGESS) is shown in Fig. 2,and a typical high-throughput screening protocol with pGESS isdescribed below.
Fig. 2 Plasmid pGESS, in which dmpR is under the control of its own promoter PX, and EGFP is induced by theDmpR-regulated s54-dependent promoter PR. The transcriptional terminator sequences rrnBT1T2 and tL3 areat the end of the EGFP and dmpR genes, respectively
6 Haseong Kim et al.

2 Materials
2.1 Metagenomic
DNA Library
Preparation
1. Strains: Escherichia coli EPI300 (KO)
2. Plasmids: pGESS (see Note 1) and pCC1FOS™ (Epicentre,USA) metagenomic DNA library (see Note 2)
3. Growth media: Luria-Bertani (LB): 10 g tryptone, 5 g yeastextract, and 10 g NaCl per 1 L distilled water; super optimalbroth with glucose (SOC): 2% (w/v) tryptone, 0.5% (w/v)yeast extract, 10 mM NaCl, 2.5 mM KCl, 10 mM MgCl2,10 mM MgSO4, and 20 mM glucose per 1 L distilled water
4. Antibiotic stock solution: 50 mg/mL ampicillin and34 mg/mL chloramphenicol
5. Cell storage media: 1� TY (8 g tryptone, 5 g yeast extract, and2.5 g NaCl per 1 L distilled water) containing 15% (v/v)glycerol
2.2 Detection and
Screening of Catalytic
Activities Using
Fluorescence-Assisted
Cell Sorting (FACS)
1. Strains: E. coli EPI300 harboring the metagenomic DNAlibrary and pGESS
2. Antibiotic stock solution: 50 mg/mL ampicillin and34 mg/mL chloramphenicol
3. Flow cytometer: FACSAriaIII (BD Biosciences, USA) orequivalent
4. Microscope: AZ100M (Nikon, Japan) or equivalent epifluor-escence instruments
5. Growth media: Luria-Bertani (LB): 10 g tryptone, 5 g yeastextract, and 10 g NaCl per 1 L distilled water
6. FACS sample buffer: phosphate-buffered saline (PBS), 8 gNaCl, 0.2 g KCl, 1.1 g Na2HPO4, and 0.2 g KH2PO4 indistilled water, filtered through a 0.22-μm filter is necessary
3 Methods
3.1 Preparation of a
Metagenomic DNA
Library for GESS
1. Construct a metagenomic library in E. coli EPI300 with thepCC1FOS vector using a CopyControl™ Fosmid Library Pro-duction Kit (Epicentre), according to the manufacturer’s pro-tocol (see Note 2). The library is stored at �70�C with anoptical density (OD600) of 100.
2. Thaw 100 μL of the stock metagenomic library and inoculate ina 500-mL flask containing 50 mL LB and 12.5 μg/mL chlor-amphenicol, and then incubate at 37�C for 2 h.
3. Harvest the cells in a 50-mL conical tube (BD Falcon, USA) bycentrifugation at 5,000�g for 10 min at 4�C. Resuspend thepellet quickly in 50 mL ice-cold distilled water and centrifuge at
Genetic Enzyme Screening System: A Method for High-Throughput Functional. . . 7

5,000�g for 10 min at 4�C. Resuspend the pellet in 50 μLice-cold 10% (v/v) glycerol, which should reach an OD600 of100. This 50-μL cell aliquot is used as a source of electrocom-petent cells.
4. Place the mixture of electrocompetent cells and pGESS DNA(10 ng) in an ice-cold electroporation cuvette, and electropo-rate (18 kV/cm, 25 μF; Gene Pulser Xcell, Bio-Rad, Hercules,CA, USA) the mixture. Quickly add 1 mL SOC medium,gently resuspend the cells, and allow them to recover at 37�Cfor 1 h.
5. Spread the cells on an LB agar plate containing 12.5 μg/mLchloramphenicol and 50 μg/mL ampicillin. Incubate at 30�Cfor 12 h (see Note 3).
6. Collect the bacterial colonies into a 50-mL conical tube usingice-cold cell storage media.
7. Centrifuge at 5,000�g for 10 min at 4�C. Resuspend the pelletin 20-mL ice-cold cell storage media.
8. Centrifuge at 5,000�g for 10 min at 4�C. Resuspend the pelletin ice-cold cell storage media to an OD600 of 100.
9. Aliquot 20 μL of the cells for storage at �70�C.
10. For the negative control, prepare E. coli EPI300 containingempty pCC1FOS by standard transformation protocols andfollow steps 3–9.
3.2 Detection and
Screening of Catalytic
Activities Using FACS
1. Thaw the stock metagenomic library cells containingpCC1FOS and pGESS plasmids.
2. Inoculate 10 μL of the cells in 2 mL LB containing 50 μg/mLampicillin and 12.5 μg/mL chloramphenicol in a 14-mLround-bottomed tube (BD Falcon). Incubate at 37�C withshaking at 200 rpm for 6 h.
3. Turn on the FACS machine and use the following settings:nozzle tip diameter, 70 μm; forward scatter (FSC) sensitivity,300 V-logarithmic amplification; side scatter (SSC) sensitivity,350 V-logarithmic amplification; fluorescein isothiocyanate(FITC) sensitivity, 450 V-logarithmic amplification; andthreshold parameter, FSC value 500. For GFP fluorescenceintensity measurement, fix the FITC photomultiplier tube volt-age at the fluorescence intensity of the negative control (lowerthan 101).
4. Place the diluted metagenomic library sample in the FACSsample tube, and adjust the event rate to 3,000–5,000events/s (see Note 4).
5. Check the cell count versus the log-scaled FSC and log-scaledSSC histogram. The number of peaks should be one, and no
8 Haseong Kim et al.

cutoff should be observed in the edges of the bell-shapeddistribution. Plot the cell count versus the log-scaled FITC,and then adjust the FITC power such that the peak of the bell-shaped distribution is less than 101 for the FITC intensity.
6. Set a sample gate R1 around the bacterial population on thelog-scaled FSC and log-scaled SSC plot. Set a sorting gate R2on the cell count versus the log-scaled FITC plot.
7. Place a collection tube containing 0.2 mL LB at the outlet ofthe FACS instrument, and sort out 107 cells that show lowFITC intensity (5% of the cells on the left side of the distribu-tion) satisfying both the R1 and R2 gates. This step minimizesfalse-positive cells showing fluorescence in the absence ofappropriate substrates (see Note 5).
8. Transfer the sorted cells to 2 mL LB containing 50 μg/mLampicillin and 12.5 μg/mL chloramphenicol. Incubate at 37�Cwith shaking at 200 rpm to OD600 0.5.
9. Add 50 μMphenol-containing substrates into the culture brothto activate GFP expression from pGESS when a putativeenzyme in pCC1FOS releases phenol or phenol derivativesfrom the substrate. Add 5 μL CopyControl induction solution(Epicentre) to amplify the intracellular fosmid copy number(see Note 6).
10. Incubate the cells at 30�C to OD600 ~2 with vigorous shaking(see Note 3).
11. To prepare the FACS samples, dilute the cells by adding 5 μLsample to a 5-mL round-bottomed tube (BD Falcon) contain-ing 1 mL PBS (see Note 4).
12. Along with the metagenomic library sample, prepare a negativecontrol by following the same procedure described in steps 1,2, and 9–11 with the negative control stock containing theempty pCC1FOS vector with pGESS.
13. Place the negative control in the FACS sample tube, and adjustthe event rate to 3,000–5,000 events/s (see Note 4).
14. Set a sample gate R1 around the bacterial population on thelog-scaled FSC and log-scaled SSC plot.
15. Set a sorting gate R2 on the cell count versus the log-scaledFITC plot so that less than 0.1% (10 out of 10,000 cells) ofnegative control cells is detected within this R2 gate.
16. Replace the negative control sample with the diluted metage-nomic library sample, and adjust the event rate to 3,000–5,000events/s.
17. Place a collection tube containing 0.2 mL LB at the outlet ofthe FACS instrument, and sort out 10,000 positive cells satis-fying both the R1 and R2 gates.
Genetic Enzyme Screening System: A Method for High-Throughput Functional. . . 9

18. Remove the collection tube, cap, and gently vortex afterfinishing the sorting procedure.
19. Spread the collected cells in a 0.2 mL volume on an LB agarplate containing 50 μg/mL ampicillin, 12.5 μg/mL chloram-phenicol, and appropriate concentrations of the phenol-containing substrate. Incubate overnight at 37�C (seeNote 7).
20. It is possible to perform additional rounds of sorting forenrichment by repeating steps 17–19. In each round, modifythe sorting criteria of gate R2 as the FITC fluorescence isenriched.
21. Colonies that show higher fluorescence intensity than the neg-ative control are picked as positives by observation under anAZ100M microscope (Nikon, Japan). The colonies can beobserved using any epifluorescence instrument instead of theAZ100M microscope (see Note 8).
22. Inoculate the selected colonies in 2 mL LB containing50 μg/mL ampicillin and 12.5 μg/mL chloramphenicol ina 14-mL round-bottomed tube (BD Falcon), and incubateovernight at 37�C with shaking at 200 rpm.
23. Test the in vitro enzyme activity or extract fosmid DNA usingstandard extraction procedures, and analyze the nucleotidesequence to identify the candidate enzyme.
4 Notes
1. pGESS can be constructed by referring to the vector map inFig. 2. The dmpR gene can be replaced with dmpR (E135K) toconstruct a GESS detecting p-nitrophenol.
2. Metagenomic DNA can be isolated from a location of interestusing a HydroShear machine (GeneMachines, GenomicInstrumentation Services, CA, USA). E. coli EPI300 is usedfor the library host, and the library can be constructed asdescribed in the CopyControl Fosmid Library Production Kit(Epicentre). The average insert size of the pCC1FOS vectoris 30 kb.
3. The library is incubated at 30�C rather than at 37�C to main-tain library diversity by slowing the growth of E. coli.
4. The final concentration of the diluted cell solution depends onthe event rate in FACS. If the event rate is less than 3,000events/s, add more cells to the diluted sample; if the rate ismore than 5,000, add more PBS to the sample. Note that theevent rate can also be controlled by the flow rate parameter inthe FACS software.
10 Haseong Kim et al.

5. To minimize false positives, remove any cells that fluoresce inthe absence of substrate (optional). The positivity rate of aGESS screen of a metagenome library is dependent on thesubstrate, metagenome sources, target enzymes, and user-defined screening criteria. In the original GESS paper [13],we defined false-positive hits as fluorescence less than 400(log of FITC intensity) in the library without substrate,1 mM phenyl phosphate. The positivity rate after treatmentwith phenyl phosphate was approximately 15% of the total cells,but only 0.5% of the total were sorted out as true positives fornovel phosphatases.
6. The pCC1FOS vector contains both the E. coli F-factor single-copy origin of replication and the inducible high-copy oriV.CopyControl fosmid clones are typically grown at single copyto ensure insert stability and successful cloning of encoded andexpressed toxic protein and unstable DNA sequences. TheCopyControl induction solution can induce the fosmid clonesup to 50 copies per cell. This step maximizes metagenomicenzyme activity while maintaining plasmid stability.
7. The number of recovered colonies is dependent on cell condi-tion at the time of sorting. To maximize recovery and minimizecell damage, we add 0.2 mL LB to the collection tube prior tosorting (Step 17).
8. A light-emitting diode (LED) illuminator such as UltraSlim(Maestrogen, USA) may be used instead of the microscope toobserve GFP fluorescence.
9. In conclusion, GESS is a practical and useful genetic circuit thatturns enzyme activity into in vivo fluorescence intensity. Theexceptional sensitivity, high-throughput, and analytical proper-ties of this system enable us to detect diverse metagenomicenzymes including various types of lipase. Further develop-ment and characterization of the genetic parts of GESS willprovide a high-throughput platform for screening and evenevolutionary engineering of important industrial enzymes.
Acknowledgment
This research was supported by grants from the Intelligent Syn-thetic Biology Center of Global Frontier Project (2011–0031944)and the KRIBB Research Initiative Program.
Genetic Enzyme Screening System: A Method for High-Throughput Functional. . . 11

References
1. Kumar A, Singh S (2013) Directed evolution:tailoring biocatalysts for industrial applications.Crit Rev Biotechnol 33(4):365–378
2. Jemli S, Ayadi-Zouari D, Hlima HB, Bejar S(2014) Biocatalysts: application and engineer-ing for industrial purposes. Crit Rev Biotech-nol 1–13
3. Lorenz P, Eck J (2005) Metagenomics andindustrial applications. Nat Rev Microbiol 3(6):510–516
4. Simon C, Daniel R (2011) Metagenomic ana-lyses: past and future trends. Appl EnvironMicrobiol 77(4):1153–1161
5. Iqbal HA, Feng Z, Brady SF (2012) Biocata-lysts and small molecule products from meta-genomic studies. Curr Opin Chem Biol 16(1):109–116
6. Ferrer M, Beloqui A, Timmis KN, GolyshinPN (2008) Metagenomics for mining newgenetic resources of microbial communities. JMol Microbiol Biotechnol 16(1–2):109–123
7. Steele HL, Jaeger K-E, Daniel R, Streit WR(2008) Advances in recovery of novel biocata-lysts from metagenomes. J Mol Microbiol Bio-technol 16(1–2):25–37
8. Uchiyama T, Abe T, Ikemura T, Watanabe K(2004) Substrate-induced gene-expressionscreening of environmental metagenomelibraries for isolation of catabolic genes. NatBiotechnol 23(1):88–93
9. van Sint Fiet S, van Beilen JB, Witholt B (2006)Selection of biocatalysts for chemical synthesis.Proc Natl Acad Sci U S A 103(6):1693–1698
10. Dietrich JA, McKee AE, Keasling JD (2010)High-throughput metabolic engineering:advances in small-molecule screening andselection. Annu Rev Biochem 79:563–590
11. Lakhdari O, Cultrone A, Tap J, Gloux K, Ber-nard F, Ehrlich SD, Lefevre F, Dore J, BlottiereHM (2010) Functional metagenomics: a highthroughput screening method to decipher
microbiota-driven NF-κB modulation in thehuman gut. PLoS One 5(9):e13092
12. Jacquiod S, Demaneche S, Franqueville L,Ausec L, Xu Z, Delmont TO, Dunon V, Cag-non C, Mandic-Mulec I, Vogel TM (2014)Characterization of new bacterial catabolicgenes and mobile genetic elements by highthroughput genetic screening of a soil metage-nomic library. J Biotechnol 190:18–29
13. Choi S-L, Rha E, Lee SJ, Kim H, Kwon K,Jeong Y-S, Rhee YH, Song JJ, Kim H-S, LeeS-G (2013) Toward a generalized and high-throughput enzyme screening system basedon artificial genetic circuits. ACS Synth Biol 3(3):163–171
14. Shingler V, Bartilson M, Moore T (1993)Cloning and nucleotide sequence of the geneencoding the positive regulator (DmpR) of thephenol catabolic pathway encoded by pVI150and identification of DmpR as a member of theNtrC family of transcriptional activators. J Bac-teriol 175(6):1596–1604
15. Ng LC, O’Neill E, Shingler V (1996) Geneticevidence for interdomain regulation of thephenol-responsive 54-dependent activatorDmpR. J Biol Chem 271(29):17281–17286
16. Jeong Y-S, Choi S-L, Kyeong H-H, Kim J-H,Kim E-J, Pan J-G, Rha E, Song JJ, Lee S-G,Kim H-S (2012) High-throughput screeningsystem based on phenolics-responsive tran-scription activator for directed evolution oforganophosphate-degrading enzymes. ProteinEng Des Sel 25(11):725–731
17. LESUISSE E, Schanck K, Colson C (1993)Purification and preliminary characterizationof the extracellular lipase of Bacillus subtilis168, an extremely basic pH‐tolerant enzyme.Eur J Biochem 216(1):155–160
18. Salameh M, Wiegel J (2007) Lipases fromextremophiles and potential for industrialapplications. Adv Appl Microbiol 61:253–283
12 Haseong Kim et al.
Functional Screening of Metagenomic Libraries: EnzymesActing on Greasy Molecules as Study Case
Monica Martınez-Martınez, Peter N. Golyshin, and Manuel Ferrer
Abstract
Greasy molecules such as aromatic and aliphatic hydrocarbons are ubiquitous and chemically heteroge-neous microbial substrates that occur in the biosphere through human activities as well as natural inputs.Organic compounds consisting of one, two, or more fused aromatic rings are due to their toxicityconsidered as pollutants of a great concern; however, they are also important chemical building blocks ofrelevance for biology, chemistry, and materials sciences. Biological approaches are known to provideexquisite ecologically friendly methods, as compared to chemical ones, for their biodegradation orbioconversions. For that, ubiquitous yet specialized hydrocarbonoclastic bacteria and polycyclic aromatichydrocarbons (PAH) degrading bacteria of the genera Alcanivorax, Marinobacter, Oleispira, Thalassoli-tus, Oleiphilus, Cycloclasticus, and Neptunomonas to name some, have developed a complex arsenal ofcatabolic genes involved in greasy oil component degradation. Oxidoreductases and hydrolases are thefirst enzymes initiating on their catabolism. The rapid evolution of next generation sequencing methodshad a big impact on the identification of genes for metabolism of greasy molecules. But sequencingallows only the identification of enzymes with certain sequence similarity to those previously deposited indatabases without functional information. Functional screening of expression libraries from pure culturesor microbial consortia is an alternative approach that solves the problem of sequence similarity and alsoensures proper function assignation. Here we describe available screening methods to identify enzymescapable of acting towards greasy molecules that include not only oil components such as alkanes andPAH but also other types of greasy molecules of biotechnological relevance to produce fine chemicals andprecursors in chemical industries.
Keywords: Dioxygenase, Esterase, Lipase,Meta-cleavage, Metagenomic, Monooxygenase, Screening
1 Introduction
Greasy molecules and, among them, polycyclic aromatic hydrocar-bons (PAH) are a group of hydrophobic organic compoundsconsisting of two or more fused benzene rings in linear, angular,or cluster structural arrangements [1]. They are ubiquitous environ-mental chemicals owing to their abundance in crude oil and theirwidespread use in chemical manufacturing [2] and are considered aspollutants of great concern owing to their toxicity to living cells [3].
T.J. McGenity et al. (eds.), Hydrocarbon and Lipid Microbiology Protocols, Springer Protocols Handbooks, (2017) 13–36,DOI 10.1007/8623_2015_104, © Springer-Verlag Berlin Heidelberg 2015, Published online: 17 June 2015
13

Because of their low aqueous solubility and their absorption to solidparticles, most of them persist in the ecosystem for many years[4, 5]. They are introduced in the biosphere through human activ-ities such as crude oil spillage, fossil fuel combustion, and gasolineleakage as well as natural inputs like forest fire smoke and naturalpetroleum seepage [6]. These chemicals can be removed from theenvironment through many processes including volatilization, pho-tooxidation, chemical oxidation, bioaccumulation, adsorption, andmicrobial transformation and degradation [7]. Despite all the pos-sible approaches, biological treatments should be considered asattractive methods as they present advantages such as the completedegradation of the pollutants, lower costs, greater safety, and lessenvironmental alteration [8]. Although greasymolecules with lowercomplexity such as low-molecular-weight PAH are usually degradedby a number of bacteria under laboratory and in situ conditions, lessis known about bacteria able to metabolize complex ones such asPAH containing five or more rings [9].
The rapid development of the functional sequencing technol-ogies has the potential to dramatically impact the study of greasymolecules metabolism [10] by providing information about thegenomic and enzymatic complements needed for their biodegrada-tion. Oxidoreductases, including reductases, oxidases, dehydro-genases, peroxidases, and laccases, to cite some, are positionedamong the first steps in the biodegradation pathways and usuallyare the first enzymes initiating their metabolism [10, 11]. Hydro-lases, such as esterases, C–C meta-cleavage hydrolases, and dehalo-genases, are among the second most abundant class of enzymesinvolved in bioremediation processes [11]. Ester formation is acommon detoxification mechanism, but little is known aboutwhether aromatics, including greasy molecule esters, occur natu-rally. Recently a novel esterase (CN1E1) has been described as thefirst efficient and catalytically active esterase from the α/β-hydrolasefamily for PAH ester hydrolysis [12].
Nowadays as genomic sequencing is an increasingly cheaperand more accessible technique, the number of genomes of greasymolecule-degrading organisms is rapidly growing [13, 14]. Buthigh-throughput sequencing only allows the identification ofgenes encoding enzymes involved in their degradation based onsequence similarity to those previously described and listed indatabases. Furthermore amplifying annotation mistakes in data-bases are of great concern as they may drive to wrong functionalassignments [15]. Functional screens guarantee the identificationof enzymes from clone libraries with no sequence information andat the same time solve the problems related to sequence/activityinconsistencies in databases [15]. Functional screening might thusbe considered as an advantageous method for proper annotationof enzymes, including those acting toward greasy molecules.
14 Monica Martınez-Martınez et al.

In fact, wrong annotation is particularly noticeable in case ofenzymes acting toward such chemicals [3].
In the present chapter protocols for the functional screens forclones or microbes containing greasy molecules-modifyingenzymes are provided. Special attention is given for mono- anddioxygenases, laccases, dehydrogenases, and hydrolases such asesterases, lipases, phospholipases, dehalogenases, and C–C meta-cleavage product hydrolases, among the most significant ones.Screens are valid for any kind of microbial cells and/or metage-nomic libraries constructed using different types of vectors (e.g.,plasmids, phagemids, fosmids, cosmids, and bacterial artificialchromosomes (BAC)) which are developed for the cloning ofDNA inserts with different sizes (from few kbp to 300 kbp) andbacterial hosts [16, 17].
2 Materials (see Note 1)
Unlike otherwise stated, most of the described materials, neededfor the different screens, can be used for clone or phage librariesprepared as clone arrays (e.g., individual clones arrayed in 96- or384-well format) or pool of clones or phages. For a review ofmetagenomic library constructions using distinct type of vectorsand hosts, see Vieites et al. [17].
2.1 Buffered (B)
Solutions
1. B1: 50 mM phosphate buffer pH 7.5. This buffer must beprepared preferably the day of the assay by using ready-to-usestock solutions of 0.2 M KH2PO4 and 0.2 M Na2HPO4
(Panreac, Barcelona, Spain; http://www.panreac.es) that maybe prepared and maintained at 4�C for several months. Mix8 mL of 0.2 M KH2PO4, 42 mL of 0.2 M Na2HPO4, and50 mL of sterile distilled water to prepare a 0.1 M phosphatebuffer pH 7.5. The day of the assay dilute 0.1 M phosphatebuffer pH 7.5 to 50 mM with sterile distilled water.
2. B2: 50 mM Tris–HCl pH 7.5.
3. B3: 20 mM 4-(2-hydroxyethyl) piperazine-1-ethanesulfonicacid (HEPES) pH 7.0.
4. B4: 50 mM HEPES pH 7.0.
5. B5: 5 mM 4-(2-hydroxyethyl)-1-piperazinepropanesulfonicacid (EPPS) pH 8.0 supplemented with 450 μM phenol red.This buffer must be prepared preferably the day of the assay byusing ready-to-use stock solutions of 100 mM EPPS bufferpH 8.0 and 0.9 mM phenol red solution in 5 mM EPPSpH 8.0, that may be prepared and maintained at 4�C for severalmonths. The day of the assay mix equal volume of 5 mM EPPSbuffer pH 8.0 and 5 mM EPPS buffer pH 8.0 containing0.9 mM phenol red.
Functional Screening of Metagenomic Libraries. . . 15

2.2 Agar-Containing
Buffer Solutions
(AB Buffers)
For activity screens in solid media, it is recommended to usesolidified buffers. For that the utilization of agarose or, preferably,agar is recommended.
1. Add 0.4 g of agar (GibcoBRL, Life Technologies, Rockville,MD USA; http://www.lifetechnologies.com) to 100 mL Buf-fers B1 to B5 described in the previous section (Subhead-ing 2.1) and dissolve it in a microwave at approximately 240watts for 5–10 min. The final percentage of agar is 0.4% w/v.Once a homogeneous solution is achieved, cool the solution to40–50�C before utilization. Agar-containing buffers (AB1to AB5) must be prepared preferably the day of the assay andmaintained at 40–50�C until use.
2.3 Substrate
Solutions (SS) for Easy
Screens (See Note 2)
The following substrate solutions are recommended for screenassays in which the microbes or clones are already cultured underappropriate conditions. The activity test is performed directly ongrown single colonies with a diameter about 1 mm.
1. SS1: 10 mM 3-methyl-catechol in distilled water. Note thatother substrates such as catechol, 4-methyl-catechol, or4-chloro-catechol can be used instead of 3-methyl-catechol.
2. SS2: 10 mM 2,3-dihydroxybiphenyl in 10% v/v ethanol:H2O(Scharlab, Barcelona, Spain; http://www.scharlab.com).
3. SS3 [0.15 mM 6-oxo-6-phenylhexa-2,4-dienoate (HOPHD)]and SS4 [0.15 mM 2-hydroxy-6-oxohepta-2,4-dienoate(HOHD)], prepared as described elsewhere [18–20].
4. SS5: 1% w/v guaiacol or syringaldazine in water (see Note 3).
5. SS6: 100 mM 2,20-azino-bis(3-ethylbenzothiazoline-6-sul-fonic acid) (ABTS) in distilled water (see Note 3).
6. SS7: 15 mM 12-para-nitrophenoxydodecanoic acid (12-pNCA,Angene; http://www.an-gene.com) in dimethyl sulfoxide(DMSO).
7. SS8: 100 mg/mL C2 to C30 alkanes in acetonitrile.
8. SS9: pure 1,2-ethanediol or 2,3-butanediol, 1,2-propanediolor glycerol.
9. SS10: 20 mg/mL α-naphthyl acetate in acetone (Scharlab,Barcelona, Spain; http://www.scharlab.com), prepared asdescribed in Reyes-Duarte et al. [21].
10. SS11: 20 mg/mL indoxyl acetate (IA) or indoxyl laurate (IL)in acetone (Scharlab, Barcelona, Spain; http://www.scharlab.com), prepared as described in Beloqui et al. [22].
11. SS12: 100 mg/mL in acetonitrile of any esters for whichhydrolytic activity should be checked. Full details of esterssuccessfully tested and protocol for the preparation can be
16 Monica Martınez-Martınez et al.

seen in Martınez-Martınez et al. [12], Alcaide et al. [18], andAlcaide et al. [23].
12. SS13: 100 mg/mL in acetonitrile of any haloacids or haloalk-anes, prepared as described in Beloqui et al. [22].
13. SS14: 4% w/v Remazol Brilliant Blue in distilled water. Dis-solve 0.4 g of Remazol Brilliant Blue in 10 mL of distilled water(see Note 3).
2.4 Substrate-
Containing Culture
Media (SCM) for Easy
Screens
In some cases it is preferably to add the substrate for activity screenin the culture medium. In this case, substrates are added to thestandard culture media where clones are going to be cultivated.
1. SCM1: tributyrin emulsion (50% v/v tributyrin, 33 g/L gumarabic). Weigh 1.65 g of gum arabic and add 25 mL of tribu-tyrin. Add distilled water to reach 50 mL. Dissolve using ahomogenizer or blender. Add 22.5 mL of the emulsionto 500 mL of the appropriate agar medium (e.g., LB agar;Subheading 2.7) and sterilize by autoclaving.
2. SCM2: olive oil emulsion rhodamine agar medium. To 500mLappropriate agar medium (e.g., LB agar; Subheading 2.7), add15.625mL of olive oil and 5mL of reagent 3 (Subheading 2.5).Mix thoroughly using a homogenizer or blender.
3. SCM3: olive oil brilliant green agar emulsion (20% v/v olive oiland 4% w/v gum arabic). Add 2 g of gum arabic to a 100 mLPyrex bottle containing 40 mL of distilled water, minimalmedium or appropriate medium. Dissolve the gum arabic andadd 10mL of olive oil. Emulsify on ice by sonication using a pinsonicator (Sonicator® 3000; Misonix) (two pulses of 3 mineach one). Let the emulsion stand at room temperature for15–30 min and transfer the volume to a new bottle, avoidingthe upper part (containing not emulsified oil). Sterilize byautoclaving (see Note 4). To each 500 mL of autoclaved solu-tion, add 25 mL of autoclaved olive oil emulsion and 4 mL ofreagent R4 (Subheading 2.5) (see Note 5).
4. SCM4: egg yolk agar plates. Add an egg yolk (circa 8% v/v) toeach 500 mL of appropriate agar medium (e.g., LB agar;Subheading 2.7) cooled to less than 40�C after autoclaving.Then, add appropriate antibiotics and supplements such asautoinduction solution (Subheadings 2.5 and 2.6).
5. SCM5: 0.01% w/v guaiacol or syringaldazine agar medium. Toeach 500 mL of appropriate agar medium (e.g., LB agar;Subheading 2.7) cooled to less than 40�C after autoclaving,add 5 mL of SS5 (Subheading 2.3).
6. SCM6: 1mMABTS agar medium. To each 500mL of appropri-ate agar medium (e.g., LB agar; Subheading 2.7) cooled to lessthan 40�C after autoclaving, add 5mL of SS6 (Subheading 2.3).
Functional Screening of Metagenomic Libraries. . . 17
7. SCM7: 0.01% w/v Remazol Brilliant Blue agar medium. Toeach 500 mL of appropriate agar medium (e.g., LB agar;Subheading 2.7) cooled to less than 40�C after autoclaving,add 5 mL of SS14 (Subheading 2.3).
8. SCM8: 100 mM benzyl alcohol, benzoylformate, mandeloni-trile, or benzoin in acetonitrile. To each 500 mL of appropriateagar medium (e.g., LB agar; Subheading 2.7) cooled to lessthan 40�C after autoclaving add 50 mL of the previous sub-strate solution.
2.5 Reagents 1. Reagent 1 (R1): Schiff reagent in 96% v/v ethanol (Scharlab,Barcelona, Spain; http://www.scharlab.com). Dissolve 25 mgof p-rosaniline in 10 mL of 95% ethanol: distilled water. Add125 mg of sodium bisulfite and dissolve (see Note 2).
2. R2: 80 mg/mL Fast Blue RR (or 4-benzoylamino-2,5-dimethoxyaniline, Azoic DiazoNo. 24) in DMSO (seeNote 2).
3. R3: 0.1% w/v rhodamine B in distilled water (see Note 3).
4. R4: 1% w/v brilliant green in distilled water (see Note 3).
2.6 Antibiotics
and Additives
1. Chloramphenicol (Cm25): 25 mg/mL in 100% ethanol (seeNote 2).
2. Ampicillin (Amp): 100 mg/mL in distilled water (see Notes2 and 3).
3. CCFAS: CopyControl fosmid autoinduction solution (Epicen-tre Biotechnologies, Madison, WI; http://www.epicentre.com). Add 800 μL to 400 mL of LB broth or LB agar toreach the appropriate final concentration.
4. Isopropyl-β-D-galactopyranoside (IPTG): 1 M IPTG (FisherScientific, Madrid, Spain; http://www.fishersci.com) indistilled water (see Notes 2 and 3).
5. Tetracycline (Tc10): 10 mg/mL in ethanol stored at �20�C(see Note 2).
2.7 Bacterial Growth
Media
The culture media (sterilized by autoclaving at 120�C for 15 min)and strains to be used should be adapted to the different vectorsused for library screens. For simplicity, we describe in this chapterthe conditions used for screening clone libraries created in thepCCFOS fosmid that are also based on bacterial F factor andE. coli EPI300-T1R strain (Epicentre Biotechnologies; Madison,WI, USA) as a host and Luria Bertani (LB) as medium. The insertsize cloned into fosmids can be as long as 25–40 Kb.
1. LBb: LB broth medium.
2. LBa: LB agar medium (Lennox formulation).
18 Monica Martınez-Martınez et al.

3. LBbCm: LBb containing 12.5 μg/mL Cm final concentration.
4. LBaCmCCFAS: LBa containing 12.5 μg/mL Cm final con-centration and 800 μL inductor (CCFAS) per each 400 mL ofmelted (<50�C) LBa.
5. M9 medium for functional screenings over pLAFR3 libraries inPseudomonas.
2.8 Small
Equipments
1. Heating water bath.
2. Microwave.
3. Probe sonicator (e.g., Pin Sonicator®3000; Misonix).
4. Bacteriological incubators (to 37�C).
5. Refrigerated centrifuge.
6. Refrigerated incubator or chamber.
7. Ultraturrax homogenizer (e.g., Janke & Kunkel KG, Staufen,Germany) or Blender.
3 Methods
3.1 General
Comments
The following protocols allow for the identification of clones con-taining genes encoding enzymes capable of modifying greasy mole-cules. For simplicity, methods for screening pool of clones based onpCC1FOS fosmid are described in this chapter. The pCC1FOSvector contains both a single copy origin and the high-copy oriVorigin of replication. Initiation of replication from oriV requirestrfA gene product. The Epi300 E. coli employed here to constructfosmid libraries possess a mutant trfA gene whose expression isunder tight, regulated control inducible promoter. So, this systemallows recovering from one (clone counting purposes) to 10–200(fosmid DNA recovery, functional screening purposes) copies ofrecombinant fosmids per cell by adding the induction or autoin-duction solution to the growth medium. The pCC1FOS vectorcontains a chloramphenicol (Cm) resistance gene to maintain selec-tion pressure. A final concentration of 12.5 μg/mL Cm (Subhead-ing 2.6) should be always added to supplement growth medium.To perform functional screening from the libraries, here we willdescribe the utilization of LB medium (Subheading 2.7).
As mentioned before, other types of libraries could be also usedfor functional screenings described below, as, for example, librariesbased on the cosmid pLAFR3 or on BACs (pBac vectors) orlibraries using the Lambda Zap®Express System (Stratagene, Agi-lent, Santa Clara, CA, USA; http://www.genomics.agilent.com).In each case growth medium has to be supplemented with theappropriate antibiotic and supplements and, when necessary, induc-tor molecules (e.g., CCFAS or IPTG; Subheading 2.6).
Functional Screening of Metagenomic Libraries. . . 19

3.2 Preparation and
Replication of pCCFOS
Libraries for
Functional Screening
Purposes
1. Prepare a 1/10 serial dilution of the clone library in LBbCm.Add 100 μL of the working library to a 1.5 mL Eppendorf tubecontaining 900 μL of LBbCm and vortex gently to mix. Thiswill be the 1/10 dilution. Take 100 μL of this dilution andtransfer them to a new tube containing 900 μL of LBbCm tomake the 1/100 dilution. Vortex gently and repeat until reach1/10,000 or 1/100,000 dilutions.
2. Seed 145 mm LB agar Petri dishes containing supplementedLBaCm with up to 100 μL clone serial dilutions. Check severaldilutions and use different volumes of each one (e.g., plate 20,50, and 100 μL of 1/1,000, 1/10,000, and 1/100,000 dilu-tions). In order to be able to uniformly distribute bacteria allover the medium surface, the final volume added to the Petridish should be 100 μL or higher.
3. Spread all the volume over the surface of the LBaCm using adigralsky spreader.
4. Once the liquid has been absorbed, turn the dishes upsidedown and incubate them overnight (12–15 h) at 37�C, ifotherwise not stated, to produce single colonies with a diame-ter about 1 mm.
5. The plates containing grown clones are directly subjected toactivity screens, following the methods described below. Forfunctional screening purposes select the dilution and volumethat correspond to the plates where a total number of coloniesaround 1,000–3,000 have grown separated enough to pickthem easily.
In case clone libraries are arrayed in 96- or 384-well format,replicate the clones directly in Petri dishes containing LBaCmCC-FAS. Then turn the dishes upside down and incubate them over-night (12–15 h) at 37�C, if otherwise not stated, to produce singlecolonies with a diameter about 1 mm. It is highly recommended touse square Petri dishes (120 � 120 mm), where about a totalnumber of 2,304 clones might be directly screened by any of themethods described below.
3.3 Functional
Screening for Extradiol
Dioxygenases
Biodegradation of aromatics by oxygenases requires the presence ofmolecular oxygen to initiate the enzymatic attack of benzene rings.The initial oxidation of arenes drives to the formation of dihydroxy-lated intermediates that may then be cleaved by intra or extradiolring-cleaving dioxygenases through either an ortho-cleavage pathwayor a meta-cleavage pathway leading to central intermediates thatare further converted to tricarboxylic acid (TCA) intermediates [9].The protocol described below aims to detect enzymes that catalyzering cleavage of 2,3-dihydroxybiphenyl or 3-methyl-catecholyielding a yellow meta-cleavage product (6-oxo-6-phenylhexa-2,4-dienoate (HOPHD) and 2-hydroxy-6-oxohepta-2,4-dienoate(HOHD) respectively).
20 Monica Martınez-Martınez et al.

1. In a Falcon tube containing 24.5 mL of AB1 (Subheading 2.2),add 500 μL of SS1 (Subheading 2.3). In a second Falcon tubecontaining 24.5 mL of Buffer AB1 (Subheading 2.2), add500 μL of the SS2 (Subheading 2.3). Mix gently by invertingthe tubes several times. Final concentration of each substratewill be 0.2 mM. Higher concentrations are not recommendedas they may cause substrate inhibition giving false-positiveresults.
2. Overlay the plates containing grown clones with the abovesolutions: one plate per substrate mix.
3. Positive clones will appear as intense or pale yellow colonies in1–60 min (see Note 6).
The protocol can be also performed by spraying with filter-sterilized catechol (1% w/v) after 36 h of incubation [20]. Positivecolonies turned yellow due to extradiol cleavage of catechol. Asexample, a total of 254 unique positive clones (corresponding to ahit rate of 1:240) were identified as active out of a total of 61,000clones in two contaminated soil samples [24]. In some cases,screening for extradiol dioxygenase can be performed also in liquidassays [25], as follows.
1. Cells are grown in 96-well plates with vigorous agitation(1,200 rpm) at 37�C overnight in LBbCmCCFAS medium.
2. Harvest cells by centrifugation (3,000 rpm, 15 min, 4�C).
3. After removing the supernatant, re-suspend cells in 100 μL of50 mM phosphate buffer (pH 7.5).
4. Add 100 μL filter-sterilized catechol (1% w/v) to each 100 μLof cell suspension and the plates incubated with mild agitation(250 rpm) at 25�C.
5. Positive wells are identified by the presence of a yellow color,after incubation for 1 or 16 h.
Although this method has been proven successful, with thedetection of up to a total of 91 positive clones (corresponding toa hit rate of 1:1,054) out of a total of 96,000 clones from activatedsludge used to treat coke plant wastewater [25], it is more timeconsuming.
3.4 Functional
Screening for Aromatic
Ring Hydroxylases
(Acting Toward Indigo/
Indirubin)
This assay attempts to detect the expression of oxygenases able tohydroxylate indole and thus other aromatic rings. Indole can beoxidized by mono- and dioxygenases to various 2- and 3-positionhydroxyl and epoxide indoles. Upon exposure to air, the generatedcompounds further oxidize and dimerize to form indigo and indir-ubin, both intensely colored [26]. LBmedium contains tryptophanthat is converted to indole through tryptophanase from E. coli. If aclone from the library contains a gene for an oxygenase able to
Functional Screening of Metagenomic Libraries. . . 21

hydrolyze indole, then this enzyme will transform indole to indigoor to indirubin and as a consequence positive clones will appear asdark blue/black- or red-colored colonies.
1. Incubate plates at 25�C (room temperature) for 2–4 daysinstead of overnight at 37�C.
2. After 2–4 days incubate the plates at 4�C during 1–3 h.
3. Look for dark blue colonies.
The protocol has been successfully applied for the screening ofpigment-producing clones containing flavin monooxygenases froman effluent treatment plant sludge metagenomic library [27](2 clones out of a total of 40,000 clones; hit rate of 1:20,000)and forest soil [28] (1 clone out of a total of 113,700 clones).
3.5 Functional
Screening for C–C
Hydrolase Activity
(see Note 6)
The aim of the following assay is to detect meta-cleavage product(MCP) hydrolases as well as recently described dual esterases –MCP hydrolases [18], both from the α/β-hydrolase family. MCPhydrolases catalyze the hydrolysis of linear C–C bonds of vinylo-gous 1,5-diketones formed by the dioxygenative meta-cleavage ofactivated aromatic hydrocarbons [29]. In Subheading 3.3, it wasdescribed that 3-methyl-catechol can be hydroxylated to HOPHDby the action of catechol 2,3-dioxygenases and in the same way 2,3-dihydroxybiphenyl can be hydroxylated to HOHD by 2,20,3-trihy-droxibiphenyl dioxygenase. MCP hydrolases are able to hydrolyzeboth colored products, and the reaction can be detected throughthe loss of yellow color.
1. In a Falcon tube containing 24.5 mL of AB1 (Subheading 2.2),add 500 μL of SS3 or SS4 (Subheading 2.3). Mix gently byinverting the tubes several times.
2. Once an intense yellow color is produced due to substratesconversion, overlay the plates containing grown clones withthe above solutions, one plate per substrate mix, and incubatefor 1–60 min.
3. Positive clones will appear due to de formation of a colorlesshalo over a yellowish background.
3.6 Functional
Screening for Laccase
Activity
Laccases (benzenediol-oxygen oxidoreductases) are copper-containing enzymes that catalyze the oxidative conversion of a varietyof chemicals using oxygen as the final electron acceptor [30].Although they play an important role in the carbon cycle due totheir participation in the transformation of lignin and other polyphe-nols, these enzymes are especially attractive because their potentialability to transform aromatics and xenobiotic compounds. Laccasescan oxidize a wide variety of substrates [31], and due to the broadsubstrate specificity, a wide range of chromogenic substrates has beenproposed to measure their activity [32] as, for example, RemazolBrilliant Blue, guaiacol, and ABTS.
22 Monica Martınez-Martınez et al.

1. Replicate clone library in SCM5, SCM6, or SCM7 media(Subheading 2.4).
2. Incubate the plates overnight at 37�C.
3. Positive clones will be identified as a halo around an intenseblue background when growing in SCM5 plates or as blue/dark brown colonies when growing in SCM6 or SCM7 plates.
A recent successful example of the application of such protocolis described in Beloqui et al. [33], where one positive clone hasbeen identified by screening a bacteriophage λ-based metagenomelibrary of bovine rumen microflora on indicator plates supplemen-ted with syringaldazine.
3.7 Functional
Screening for
Monooxygenases
Acting Toward
12-pNCA Acids
Monooxygenases catalyze the insertion of molecular oxygen intonon-activated C–H bonds, and thus they are of enormous biotech-nological interest. While they naturally function in primary andsecondary metabolism as well as in drug detoxification, theseenzymes may also have a great industrial potential for the synthesisof fine chemicals or polymer building blocks and also for pollutionmanagement [34–37]. The protocol described below is based on acolorimetric assay using as substrate 12-para-nitrophenoxydodeca-noic acid (12-pNCA), a carboxylic acid covalently bound to anitrophenol group. Its oxygenation by a monooxygenase leads toan unstable intermediate which dissociates into an oxycarboxylateand p-nitrophenolate which results in yellow color formation. Thissubstrate is commercially available, but the assay can be performedusing other p-nitrophenoxycarboxylic acids with shorter or longercarbon chains that can be synthesized following a previously pub-lished protocol [38].
1. Add 10 μL of SS7 (Subheading 2.3) to a Falcon tube contain-ing 20 mL of buffer AB2 (Subheading 2.1) and mix by gentlyinverting the tube.
2. Overlay the plates containing grown clones with the abovesolution and incubate 1–24 h.
3. Positive clones will appear as yellow colonies.
Note that bacterial cell wall is not totally permeable to thesubstrate, so detection of monooxygenase activity can be quitedifficult. Therefore, the performance of a complementary assaywhere colonies are grown in liquid media in microtiter plates,prior the assay, is highly recommended. A protocol based on cellwall permeabilization and cofactor regeneration facilitation, usingalso in 12-pNCA as a substrate, has been developed [39]. In thatcase, plates have to be replicated in liquid media in 96 multi-wellplates under similar conditions as for the ones used in solid media.
Other assays to detect monooxygenases based on epoxidationof styroles [40] as well as in hydroxylation of carbon chains [41]
Functional Screening of Metagenomic Libraries. . . 23

have been published. Both protocols can be performed using pro-tein extracts from pCCFOS and other type of metagenomiclibraries. The first assay is based on the use of the yellow chromo-phore para-nitrophenolate (pNTP). Monooxygenase drives theepoxidation of a styrol (e.g., styrene) to a styrol oxide that isattacked by the nucleophilic pNTP resulting in a colorless product.The activity can be monitored as a decrease in absorbance at405 nm. The second protocol based on hydroxylation allows dis-crimination between terminal and subterminal hydroxylations ofcarbon chains using a two-step assay. Terminal and subterminalhydroxylation of alkanes drives to the formation of primary andsecondary alcohols, respectively. Hydroxylation reaction impliesNADPH consumption, which can be monitored as a decrease ofabsorbance at 340 nm. In the published method, hydroxylationreaction is coupled with an oxidation reaction catalyzed by a com-mercial alcohol dehydrogenase (ADH) that oxidizes only primaryalcohols, resulting in NADP+ reduction to NADPH that can bemonitored as an increase in absorbance at 340 nm.
3.8 Functional
Screening for Enzymes
Catalyzing the
Hydroxylation of
Alkanes (Toward
Pseudomonas putida
KT2440 Libraries)
Several enzymes are potentially useful to degrade alkanes. Themethod described below is based on the use of the bacterial strainP. putida KT2440 which can grow with C10 to C22 fatty alcoholsbut not with alkanes as a sole carbon and energy source. Then toperform this assay, it is necessary to use a metagenomic librarybased on pLAFR3 cosmid which is a vector with a broad hostrange, being able to replicate in different Gram-negative species[42] including P. putida. The library will be grown in a minimalmedia (e.g., M9) supplemented with the desired alkane, so onlyclones carrying the genes that codify for the enzymatic activitiesrequired to convert the substrate into fatty acids will grow in thesupplemented minimal medium.
1. Prepare M9 agar plates (Subheading 2.7) supplemented withthe desired alkane (SS8, Subheading 2.3). Prepare one plate foreach alkane to be tested. Add 560 μL of 100 mg/mL alkane toeach 35 mL of M9 agar (1.6 mg/mL alkane final concentra-tion) supplemented with Tc10 (Subheading 2.6). Plate into120 � 120 mm squared Petri dishes.
2. Replicate the clone library from the P. putida pLAFR3 libraryin the plates prepared in step 1.
3. Grow plates at 30�C for 48 h.
4. Positive clones will be those that are able to grow in each plate.
3.9 Functional
Screening for Alcohol
Dehydrogenase
Activity
Interconversion of alcohols, aldehydes, and ketones is involved in anastonishingly wide range of essential metabolic reactions in micro-organisms. These redox reactions are catalyzed by oxidoreductases,including dehydrogenases [43]. Alcohol dehydrogenases catalyze
24 Monica Martınez-Martınez et al.

the reaction alcohol + NAD(P)+ ↔ aldehyde + NAD(P)H + H+.Carbonyl group from the aldehyde product drives to an intenselyred Schiff base formation.
1. Add the appropriate volume of the desired substrate SS9 (Sub-heading 2.3) to reach a final concentration of 100 mM to20 mL of Buffer AB3 (Subheading 2.2) supplemented withreagent R1 (Subheading 2.5) and mix by inverting the tube/bottle.
2. Overlay the agar plates containing individual clones with20 mL of the mix from step 1.
3. Positive clones will appear like intensely red colonies sur-rounded by a zone of dye diffusion.
The protocol has been successfully applied for the screening ofalcohol/aldehyde dehydrogenases capable to act toward glyceroland 1,2-propanediol from a sugar beet field [43]: 24 clones out of atotal of 100,000 clones; hit rate of 1:4,170).
3.10 Functional
Screening for Enzymes
Catalyzing the
Synthesis of Greasy
Enantiomers (Using
Libraries Created
in P. putida KT2440)
Several enzymes are potentially useful for the conversion of greasymolecules that can be used to synthesize pure enantiomers (e.g.,alcohol dehydrogenases, hydroxynitrile lyases, benzoylformate dec-arboxylases, benzaldehyde lyases). Recently a growth selectionmethod to identify new benzoylformate decarboxylases has beendeveloped [44]. This method is based on the use of the strainP. putida KT2440, which can grow with benzaldehyde as a solecarbon and energy source. At the same time, this strain lacks theenzymes necessary to form benzaldehyde from several precursors(e.g., benzyl alcohol, benzoylformate, mandelonitrile, or benzoin).So, as explained in Subheading 3.8, when a metagenomic DNA iscloned in pLAFR3 cosmid, the library can be developed intoP. putida. Then the published method can be applied to P. putidarecombinant colonies from the generated metagenomic library.Clone library will be grown in minimal media (e.g., M9) supple-mented with the mentioned precursors of benzaldehyde to detectalcohol dehydrogenase, hydroxynitrile lyase, benzoylformate decar-boxylase, and benzaldehyde lyase activities.
1. Plate M9 agar medium (Subheading 2.7), supplemented withTc10 (Subheading 2.6) and the desired benzaldehyde precur-sor substrate (at a final concentration of 10 mM from a stocksolution of 100 mM in acetonitrile) into 120 � 120 mmsquared Petri dishes. Prepare one plate for each enzymaticactivity to be tested.
2. Replicate the clones from a P. putida pLAFR3 library in theplates prepared in step 1.
3. Grow plates at 30�C for up to 16–48 h.
4. Positive clones will be those that are able to grow in each plate.
Functional Screening of Metagenomic Libraries. . . 25

A recent successful example of the application of such protocolis described in Henning et al. [44], where one positive clone,containing benzoylformate decarboxylase activity, was identifiedby screening 14,000 clones whose genomic material was trans-ferred to P. putida KT2440, on an agar plate containing benzoyl-formate selective medium.
3.11 Functional
Screening for General
Esterase/Lipase
Activity (Toward
Greasy α-NaphthylAcetate)
This protocol is based on the use of the substrate α-naphthyl acetatethat is enzymatically hydrolyzed by esterases, liberating a free naph-thol product [21]. This then couples with a diazonium compound(4-benzoylamino-2,5-dimethoxyaniline, Azoic Diazo No. 24; alsoknown as Fast Blue RR solution), forming brown-colored depositsat sites of general esterase activity. Then positive clones will appeardue to the formation of a dark brown precipitate.
1. Add 320 μL of the substrate solution SS10 (Subheading 2.3)and 320 μL of the reagent R2 (Subheading 2.5) to a Falcontube containing 20 mL of Buffer AB4 and mix by inverting thetube.
2. Overlay the plates containing individual clones with 20 mL ofthe mix.
3. Positive clones will appear as dark brown colonies after 30 s to60 min (see Note 8).
The protocol has been successfully applied for the screening ofesterase and lipases from the α/β-fold hydrolase superfamily frombacteriophage λ-based metagenome libraries of deep hypersalineanoxic basins in the Eastern Mediterranean Sea [45] (5 positives)and bovine rumen microflora (22 positives) [46].
3.12 Functional
Screening for General
Esterase/Lipase
Activity (Toward
Greasy Indoxyl
Substrates)
Indoxyl esters are aromatic compounds which can be hydrolyzed byan organophosphate-sensitive enzyme. The hydrolysis of indoxylesters yields indoxyl, which react with molecular oxygen to formindigo that as explained before is a blue-colored compound.
1. Add 320 μL of SS11 (Subheading 2.3) to a Falcon tube con-taining 20 mL of AB4 (Subheading 2.2) and mix by invertingthe tube/bottle.
2. Overlay the plates containing individual clones with 20 mL ofthe mix.
3. Positive clones will appear as blue colonies after 30 s to 60 min.
A recent successful example of the application of such protocolis described in Alcaide et al. [18], where two positive clones havebeen identified by screening a bacteriophage λ-based metagenomelibrary (14,000 phage particles) of crude oil-enriched seawatersample.
26 Monica Martınez-Martınez et al.

3.13 Functional
Screening for General
Lipase Activity
(Toward Greasy
Tributyrin)
The following protocol is based on a published method for detec-tion of lipolytic microorganisms in foodstuffs and other materials[47]. The assay is based on the use of tributyrin as substrate and onthe ability of the secreted lipases to diffuse in the medium and tohydrolyze the tributyrin. That hydrolysis results in a clear haloformation surrounding lipolytic colonies.
1. Replicate clone library into SCM1 agar plates(Subheading 2.4).
2. Incubate the plates for 16 h at 37�C.
3. Positive clones will appear as colonies surrounded by a clearhalo.
This protocol, that uses a common noncommercially valuablesubstrate (tributyrin), has been proven successful for the identifica-tion of esterase/lipase-like enzymes with interesting properties.Thus, recently a lypolytic enzyme from the cutinase family withpolyethylene terephthalate-degrading activity has been identifiedfrom a fosmid library of a leaf-branch compost metagenome byfunctional screening using tributyrin agar plates [48].
3.14 Functional
Screening for General
Lipase Activity
(Toward Rhodamine
and Olive Oil)
The protocol described below is based on previously publishedmethods [49–51] and it uses the ability of rhodamine B to formcolored compounds when reacting with acidic materials. Whenolive oil is hydrolyzed by a lipase, free fatty acids are completelyionized. Then the resulting liberated protons react with rhodamineB producing its cationic form. This cationic form reacts with thefree fatty acids forming the colored compounds. In the followingprotocol, agar plates are pink. Clones expressing lipases aredetected due to the observation of an orange fluorescent halosurrounding the colonies after UV light irradiation (350 nm).
1. Replicate clone library into SCM2 agar plates(Subheading 2.4).
2. Incubate the plates for 16 h at 37�C.
3. Place the plates under UV light (350 nm) and positive cloneswill appear as colonies surrounded by an orange fluorescenthalo.
A recent successful example of the application of such protocolis described in Zheng et al. [52], where six positive clones wereidentified by screening 20,000 clones.
3.15 Functional
Screening for General
Lipase Activity
(Toward Brilliant Green
and Olive Oil)
The following protocol is based on the method described bySvendsen and collaborators [53], modified in order to be appliedover colonies growth in agar plates. This method is based on theformation of blue spots after hydrolysis of olive oil by a lipase. Thus,positive clones will appear as green/blue colonies surrounded by aclear halo.
Functional Screening of Metagenomic Libraries. . . 27

1. Replicate clone library into SCM3 green agar plates(Subheading 2.4).
2. Incubate the plates for 24–96 h at 37�C.
3. Positive clones will appear as blue/green colonies.
3.16 Functional
Screening for
Phospholipase Activity
The protocol described below is based in a previously publishedmethod [54] that uses the phospholipids from egg yolk to detectphospholipase activity. Hydrolysis of phospholipids drives to theliberation of fatty acids. Calcium forms a complex with the free fattyacids resulting in the formation of a precipitation halo around thecolonies.
1. Replicate clone library into SCM4 agar plates(Subheading 2.4).
2. Incubate the plates for 16 h at 37�C.
3. Positive clones will appear as colonies surrounded by a precipi-tation halo.
3.17 Functional
Screening for
Hydrolases Using pH
Indicator and General
Greasy Esters
When an ester conjugated molecule is hydrolyzed by an esterase/lipase or other hydrolase, acetic acid is liberated occurring acidifica-tion of the medium. In the protocol described below, pH indicatorphenol red will turn yellow as a consequence of that acetic acidformation, so positive clones will appear as yellow clones. Thisprotocol has been successfully applied to different substrates suchas short-to-long acetyl, propionyl, and butyryl esters of long fattyacids, triglycerides, and cinnamic esters as well as a broad range ofenantiomeric esters (Subheading 2.3). This method can be appliedalso to detect dehalogenases using halo acids or halo alkanes assubstrates. Dehalogenases are hydrolases that remove a halogenatom from a substrate, like an acid or an alkane molecule. Theyare thus of potential interest for the production of modified halo-genated chemicals for industrial applications and represent impor-tant tools for bioremediation [55]. During the dehalogenation aproton is liberated at the expense of a single water molecule so theenzymatic reaction can be followed because of the protons pro-duced, which, in turn, can be monitored by a pH indicator.
1. Add 320–1,000 μL of the desired substrate (from SS12 or SS13list; (Subheading 2.3) at 100 mg/mL (seeNote 9) to 20 mL ofbuffer AB5 and mix by inverting the tube/bottle.
2. Overlay the plates containing individual clones with 20 mL ofthe mix (see Note 10).
3. Positive clones will appear as yellow colonies on a redbackground.
A recent successful example of the application of such protocolis described in Beloqui et al. [22], where an esterase-haloaciddehalogenase-positive clone was identified by screening a
28 Monica Martınez-Martınez et al.

bacteriophage λ-based metagenome library of crude oil-enrichedseawater sample. Recently, a clone (hit rate 1:1,375) versatile ester-ase (CN1E1) from the α/β-hydrolase family able to act towardgreasy molecules such as polyaromatic hydrocarbon (phenan-threne, anthracene, naphthalene, benzoyl, protocatechuate, andphthalate) esters has been identified by using naphthalene carbox-ylic acid methyl ester as substrate [12].
3.18 Functional
Screening for Enzymes
Catalyzing the
Formation of
Unsaturated Fatty
Acids
Fatty acid-modifying enzymes are of great biotechnological inter-est, especially those catalyzing the production of unsaturated fattyacids (UFA). These fatty acids are widely sought as food or healthadditives, as valuable precursor molecules, and for applications inpetrol chemistry. Several systems are known for UFA production inbacteria. For instance, fatty acid desaturases are capable of introdu-cing double bonds into existing fatty acids of various chain lengths.UFAs can also be produced by de novo biosynthesis. Most bacteriaproduce C18:1 UFAs using an alternate function of the standardfatty acid synthesis pathway. Some bacteria from deep-sea environ-ments, however, are known to produce long chain, polyunsaturatedfatty acids (e.g., eicosapentaenoic acid (C20:5) and docosahexae-noic acid (C22:6)) to cope with the low temperatures of thosehabitats. The production of those fatty acids involves enzymeswhich share similarities with polyketide synthases and fatty acidsynthases [56]. The genes involved in known systems of this typeare usually located in a single cluster of about 20 kb in size.Enzymes involved in UFA formation mainly function as part of anadaptive mechanism to enhance cold tolerance [57]. Thus atemperature-based screening method to identify such enzymescould be established. E. coli cells containing a metagenomic librarywill be grown at low temperatures to identify faster growing colo-nies with increased cold tolerance. While the focus of this screeningsystem is on UFA-forming enzymes, it is also possible to identifyother types of proteins that enhance cell growth at low tempera-tures. Several fatty acid desaturases originating from Arthrospiraplatensis, Synechocystis, Bacillus subtilis, and Stappia aggregate werealready heterologously expressed in E. coli BL21(DE3) to confirmthe functionality of the screening method. E. coli BL21(DE3)containing expression vectors harboring putative desaturase genesare incubated at low temperatures (5–25�C) and their growth iscompared to E. coli BL21(DE3) cells harboring the empty expres-sion vector.
1. Replicate the clone library in LBaCmCCFAS(Subheading 2.7).
2. Incubate the plates at different temperatures between 5 and25�C for several days.
3. Select the clones that grow faster at each temperature.
Functional Screening of Metagenomic Libraries. . . 29

The applicability of other E. coli strains including E. coli M5,M8, and PAM155 which are unable to grow at low temperaturesdue to a mutation in the genes fabA (M8, PAM155) or fabB (M5)which are vital for UFA synthesis [58, 59] has been also investi-gated. At restrictive temperatures, these strains can only grow inculture medium supplemented with exogenous UFAs. Hence, het-erologous expression of genes or gene clusters encoding desaturat-ing activities should relieve this phenotype resulting in growth ofsuch cold-sensitive E. coli expression strains.
3.19 Screening
Method Statistics:
Summary
Table 1 summarizes the list of target enzymes, cost time, and hitrates for the different substrate-detection methods (e.g., colorchange, growth ability) described above. The table contains infor-mation regarding different enzymatic activities and different sub-strates within them to screen. For comparative purposes, statisticsare also provided for the utilization of other enzyme activities andsubstrates. For references and detailed description, see above andinformation reported in the table.
4 Notes
1. Unless otherwise stated, chemicals, biochemicals, and solventswere purchased from Sigma Chemical Co. (St. Louis, MO,USA), Aldrich (Oakville, ON), or Fluka (Oakville, ON) andwere of p.a. (pro-analysis) quality.
2. Substrate solutions must be prepared preferably the day of theassay, although they can be stored for up to 24 h at 4�C. In caseof ester substrates, they can be stored at �20�C for longerincubations. For antibiotics and IPTG solutions, store themat �20�C.
3. Sterilize by filtering through a 0.22 μm syringe filter.
4. Olive oil substrate is an emulsion of olive oil in gum arabic so toget the emulsion, vigorous agitation or sonication should beapplied. To avoid emulsion disruption, the autoclaved substrateshould be used on the day of preparation.
5. To ensure uniform distribution of olive oil substrate in eachplate, mix vigorously the bottle containing LB olive oil brilliantgreen agar before plating every 4–5 plates or as many times asnecessary.
6. To be sure that all positive clones have been detected, oncepositive clones have been identified, mark them with a perma-nent marker and leave the plates in the bench at room temper-ature till next day. Look again for new yellow clones and pickthem in a new 96 multi-well plate.
30 Monica Martınez-Martınez et al.

Table 1List of target enzymes, cost time, and hit rates for the different substrate-detection methods
Panel A: statistics for enzyme activities
Enzymatic activityPositive incidencerange (mean)
Detectionmethod Assay time Reference
Esterases-lipases 1:11 to 1:193,200(1:17,321)
Color/halo 1 min to48 h
See below and inthe text
Oxidoreductases 1:32 to 1: 20,000(1:6,671)
Color/growth
1 min to96 h
Penicillin G acylases 1:333 Color 1 min to96 h
Phosphatases 1:2,843 Color 1 min to48 h
Proteases 1:833 to 1:30,000(1:9,318)
Halo 24–48 h
Glycosidases 1:43 to 1:700,000(1:31,189)
Color/halo 1 min to96 h
Panel B: statistics for substrate-dependent hydrolytic (e.g., esterase and lipase-like) activity
Substrate Positive incidencerange (mean)
Detectionmethod
Assay time Reference
α-NA 1:1,375 to 1:77,600(1:19,924)
Color 1–60 min [21]
Indoxyl acetate 1:700 Color 1–60 min [18]
Olive oil 1:1,000 to 1:50,000(1:25,500)
Color/Halo 16–48 h [52, 53]
Tributyrin 1:11 to 1:100,000(1:13,289)
Halo 16–48 h [60–64]
Tricaprylin 1:3,937 to 1:193,200(1:68,279)
Halo 16–48 h [60–64]
Triolein 1:7,680 to 1:36,000(1:19,768)
Halo 16–48 h [52]
Esters 1:191 to 1:30,000(1:20,064)
Color 1–300 min [12, 22]
Tween-20 and 80 1:500 to 1: 26,496(1:13,498)
Halo 16–48 h [65, 66]
5-Bromo-4-chloro-3-indolylcaprylate
1:7,000 to 1:93,000(1:50,000)
Halo 1–300 min [67]
pNP-dodecanoate 1:706 Color 1–300 min [68]
Polyethylene terephthalate 1:21,400 Halo 16–48 h [48]
Poly (DL-lactic acid) 1:13,333 Halo 16–48 h [66, 69]
Egg yolk 1:833 to 1: 30,000(9,318)
16–48 h [54]
(continued)
Functional Screening of Metagenomic Libraries. . . 31

7. Substrates for meta-cleavage product hydrolases are stable forat least 4–5 h but it is preferably to use them immediately.
8. Don’t leave the plates for more than 10 min as at the end all thecolonies will turn brown, but it doesn’t mean that the clonesare necessarily esterase positive.
9. For some substrates, particularly esters (SS12), or haloacids,and haloalkanes (SS13), higher initial concentrations up to200 mg/mL could be necessary to reach positive clones. Suchconcentrations are needed as the functional screens based onpH indicators require accumulation of acid (after hydrolysis ofan ester) before color change is observed.
10. In this case, in order to save substrate, and depending on thenumber of individual clones to be checked, you can performthe functional screening pipetting the substrate drop by dropover each individual clone.
Table 1(continued)
Panel C: statistics for substrate-dependent oxidoreductase activity
Substrate Positive incidence range(mean)
Detectionmethod
Assay time Reference
Catechol 1:111 to 1:1,842(1:946)
Color 1–60 min [25]
Guaiacol 1:8,000 Color 1–60 min [33]
Indigo 1:6,000 to 1:20,000(1:10,889)
Color 48–96 h [27, 28]
Phenol 1:32 Color 16–48 h [70]
Alkanes (e.g., hexadecane) 1:69 Growth 48 h [71]
Glycerol/1,2-propanediol 1:4,170 Color 24 h [43]
Benzaldehyde 1:14,000 Growth 16–48 h [44]
12-pNCA n.d. Color 1–60 min [38–40]
HOHD:HOPHD n.d. Color 1–60 min [18]
Syringaldazine n.d. Color 1–60 min [33]
UFA synthesis n.d. Growth 24–48 h [56–59]
ABTS n.d. Color 16 h [32, 33]
Incidence rate (clones with the desired activity referred to the total number of clones screened) is reported for
studies in which metagenomic clone libraries were subjected to functional naıve screens. Note that to avoid biases dueto the type of libraries, only studies considering the screen of fosmid clones have been considered. Statistics for general
enzyme-dependent screens (A), for screening hydrolytic activity using different substrates (B), and for screening
oxidoreductase activity using different substrates (C) are shownn.d. not determined before the number of total screened clones was not described
32 Monica Martınez-Martınez et al.

Acknowledgments
The authors gratefully acknowledge the financial support providedby the European Community project MAMBA (FP7-KBBE-2008-226977), MAGIC-PAH (FP7-KBBE-2009-245226), ULIXES(FP7-KBBE-2010-266473), KILL-SPILL (FP7-KBBE-2012-312139), and MicroB3 (FP7-OCEAN.2011-2-287589). Wethank EU Horizon 2020 Program for the support of the ProjectINMARE H2020-BG-2014-2634486. This work was furtherfunded by grants BIO2011-25012, PCIN-2014-107, andBIO2014-54494-R from the Spanish Ministry of Economy andCompetitiveness. The present investigation was also funded bythe Spanish Ministry of Economy and Competitiveness within theERA NET IB2, grant number ERA-IB-14-030. The authors grate-fully acknowledge the financial support provided by the EuropeanRegional Development Fund (ERDF).
References
1. Bamforth SM, Singleton I (2005) Bioremedia-tion of polycyclic aromatic hydrocarbons: cur-rent knowledge and future directions. J ChemTechnol Biotechnol 80:723–736
2. K€astner M (2000) Degradation of aromaticand polyaromatic compounds. In: Rehm HJ,Reed G (eds) Biotechnology. Wiley-VCH,Weinheim, pp 211–239
3. Guazzaroni ME, Herbst FA, Lores I, JavierTamames J, Pelaez AI, Lopez-Cortes N,Alcaide M, Del Pozo MV, Vieites JM, vonBergen M, Gallego JLR, Bargiela R, Lopez-Lopez A, Pieper DH, Ramon Rossello-MoraR, Sanchez J, Seifert J, Ferrer M (2013) Meta-proteogenomic insights beyond bacterialresponse to naphthalene exposure and bio-stimulation. ISME J 7:122–136
4. Volkering F, Breure AM, van Adel JG (1993)Effect of microorganisms on the bioavailabil-ity and biodegradation of crystalline naphtha-lene. Appl Microbiol Biotechnol 40:535–540
5. Bosma TNP, Middeldorp PJM, Scraa G, Zen-der AJB (1997) Mass transfer limitation of bio-transformation: quantifying bioavailability.Environ Sci Technol 31:248–252
6. Dolfing J, Xu A, Gray ND, Larter SR, Head IM(2009) The thermodynamic landscape ofmethanogenic PAH degradation. MicrobiolBiotechnol 2:566–574
7. Moscoso F, Ferreira L, Deive FJ, Moran P,Sanroman MA (2013) Viability of phenan-threne biodegradation by an isolated bacterial
consortium: optimization and scale-up.Bioprocess Biosyst Eng 36:133–141
8. Habe H, Omori T (2003) Genetic of polycyclicaromatic hydrocarbon metabolism in diverseaerobic bacteria. Biosci Biotechnol Biochem67:225–243
9. Peng RH, Xiong AS, Xue Y, Fu XY, Gao F,Zhao W, Tian YS, Yao QH (2008) Microbialbiodegradation of polyaromatic hydrocarbons.FEMS Microbiol Rev 32:927–955
10. Singleton DR, Hu J, Aitken DA (2012) Heter-ologous expression of polycyclic aromatichydrocarbon ring-hydroxylating dioxygenasegenes from a novel pyrene-degrading Betapro-teobacterium. Appl Environ Microbiol78:3552–3559
11. Shah V, Jain K, Desai C, Madamwar D (2012)Molecular analyses of microbial activitiesinvolved in bioremediation. In: SatyanarayanaT, Johri BN, Prakash A (eds) Microorganismsin environmental management: microbesand environment. Springer, Berlin, pp221–247
12. Martınez-Martınez M, Lores I, Pena-Garcıa C,Bargiela R, Reyes-Duarte D, Guazzaroni ME,Pelaez AI, Sanchez J, Ferrer M (2014) Bio-chemical studies on a versatile esterase that ismost catalytically active with polyaromaticesters. Microbiol Biotechnol 7:184–191
13. Bergmann F, Selesi D, Weinmaier T, Tischler P,Rattei T, Meckenstock RU (2011) Genomicinsights into the metabolic potential of the
Functional Screening of Metagenomic Libraries. . . 33

polycyclic aromatic hydrocarbon degradingsulfate-reducing DeltaproteobacteriumN47emi_2391. Environ Microbiol13:1125–1137
14. Chauhan A, Layton AC, Williams DE, SmarttAE, Ripp S, Karpinets TV, Brown SD, SaylerGS (2011) Draft genome sequence of the poly-cyclic aromatic hydrocarbon-degrading, genet-ically engineered bioluminescent bioreporterPseudomonas fluorescens HK44. J Bacteriol193:5009–5010
15. Fernandez-Arrojo L, Guazzaroni ME, Lopez-Cortes N, Beloqui A, Ferrer M (2010) Meta-genomic era for biocatalyst identification. CurrOpin Biotechnol 21:725–733
16. Shizuya H, Birren B, Kin UJ, Mancino V, Sle-pak T, Tachiiri Y, Simon M (1992) Cloningand stable maintenance of 300-kilobase-pairfragments of human DNA in Escherichia coliusing an F factor-based vector. Proc Natl AcadSci 89:8794–8797
17. Vieites JM, Guazzaroni ME, Beloqui A, Goly-shin PN, Ferrer M (2010) Molecular methodsto study complex microbial communities. In:Streit WR, Daniel R (eds) Metagenomics.Methods and protocols. Humana, Totowa,pp 1–37
18. Alcaide M, Tornes J, Stogios PJ, Xu X, GertlerC, Di Leo R, Bargiela R, Lafraya A, GuazzaroniME, Lopez-Cortes N, Chernikova TN, Goly-shina OV, Nechitaylo TY, Plumeier I, PieperDH, Yakimov MM, Savchenko A, GolyshinPN, Ferrer M (2013) Single residues dictatethe co-evolution of dual esterases: MCP hydro-lases from the α/β hydrolase family. Biochem J454:157–166
19. Happe B, Eltis LD, Poth H, Hedderich R,Timmis KN (1993) Characterization of2,20,3-trihydroxybiphenyl dioxygenase, anextradiol dioxygenase from the dibenzofuran-and dibenzo-p-dioxin-degrading bacteriumSphingomonas sp. strain RW1. J Bacteriol175:7313–7320
20. Junca H, Plumeier I, Hecht HJ, Pieper DH(2004) Difference in kinetic behaviour of cate-chol 2,3-dioxygenase variants from a pollutedenvironment. Microbiology 150:4181–4187
21. Reyes-Duarte D, Ferrer M, Garcia-Arellano H(2012) Functional-based screeningmethods for lipases, esterases and phospholi-pases in metagenomic libraries. In: Sandoval G(ed) Lipases and phospholipases: methodsand protocols. Springer, New York,pp 101–113
22. Beloqui A, Polaina J, Vieites JM, Reyes-DuarteD, Torres R, Golyshina OV, Chernikova TN,Waliczek A, Aharoni A, Yakimov MM, TimmisKN, Golyshin PN, Ferrer M (2010) Novel
hybrid esterase-haloacid dehalogenase enzyme.Chembiochem 11:1975–1978
23. Alcaide M, Tchigvintsev A, Martınez-Martı-nez M, Popovic A, Reva ON, Lafraya A,Bargiela R, Nechitaylo TY, Matesanz R,Cambon-Bonavita MA, Jebbar M, YakimovMM, Savchenko A, Golyshina OV, YakuninAF, Golyshin PN, Ferrer M (2015) Identifica-tion and characterization of carboxyl esterasesof gill chamber-associated microbiota in thedeep-sea shrimp Rimicaris exoculata usingfunctional metagenomics. Appl EnvironMicrobiol 81(6):2125–2136
24. Brennerova MV, Josefiova J, Brenner V, PieperDH, Junca H (2009) Metagenomics revealsdiversity and abundance of meta-cleavage path-ways in microbial communities from soil highlycontaminated with jet fuel under air-spargingbioremediation. Environ Microbiol11:2216–2227
25. Suenaga H, Ohnuki T, Miyazaki K (2007)Functional screening of a metagenomic libraryfor genes involved in microbial degradation ofaromatic compounds. Environ Microbiol9:2289–2297
26. Johannes TW, Woodyer RD, Zhao H (2006)High-throughput screening methods devel-oped for oxidoreductases. In: Reymond JL(ed) Enzyme assays: high-throughput screen-ing, genetic selection and fingerprinting.Wiley-VCH, Weinheim, pp 77–93
27. Singh A, Singh Chauhan N, Thulasiram HV,Taneja V, Sharma R (2010) Identification oftwo flavin monooxygenases from an effluenttreatment plant sludge metagenomic library.Bioresour Technol 101:8481–8484
28. Lim HK, Chung EJ, Kim JC, Choi GJ, JangKS, Chung YR, Cho KY, Lee SW (2005) Char-acterization of a forest soil metagenome clonethat confers indirubin and indigo productionon Escherichia coli. Appl Environ Microbiol71:7768–7777
29. Hernaez MJ, Andujar E, Rıos JL, KaschabekSR, Reineke W, Santero E (2000) Identifica-tion of a serine hydrolase which cleaves thealicyclic ring of tetralin. J Bacteriol182:5448–5453
30. Thurston CF (1994) The structure and func-tion of fungal laccases. Microbiology140:19–26
31. Baldrian P (2006) Fungal laccases – occurrenceand properties. FEMS Microbiol Rev30:215–242
32. Eichlerova I, Snajdr J, Baldrian P (2012) Lac-case activity in soils: considerations for themeasurement of enzyme activity. Chemosphere88:1154–1160
34 Monica Martınez-Martınez et al.

33. Beloqui A, Pita M, Polaina J, Martınez-Arias A,Golyshina OV, Zumarraga M, Yakimov MM,Garcıa-Arellano H, Alcalde M, Fernandez VM,Elborough K, Andreu JM, Ballesteros A, PlouFJ, Timmis KN, Ferrer M, Golyshin PN (2006)Novel polyphenol oxidase mined from a meta-genome expression library of bovine rumen:biochemical properties, structural analysis,and phylogenetic relationships. J Biol Chem28:22933–22942
34. Stegeman JJ, Lech JJ (1991) Cytochrome P-450 monooxygenase systems in aquatic species:carcinogen metabolism and biomarkers for car-cinogen and pollutant exposure. EnvironHealth Perspect 90:101–109
35. Juchau MR (1990) Substrate specificities andfunctions of the P450 cytochromes. Life Sci47:2385–2394
36. Guengerich FP, Gillam EM, Shimada T (1996)New applications of bacterial systems to pro-blems in toxicology. Crit Rev Toxicol26:551–583
37. Schneider S, Wubbolts MG, Sanglard D, With-olt B (1998) Biocatalyst engineering by assem-bly of fatty acid transport and oxidationactivities for In vivo application of cytochromeP-450BM-3 monooxygenase. Appl EnvironMicrobiol 64:3784–3790
38. Schwaneberg U, Schmidt-Dannert C, SchmittJ, Schmid RD (1999) A continuous spectro-photometric assay for P450 BM-3, a fatty acidhydroxylating enzyme, and its mutant F87A. JBiotechnol 269:359–366
39. Schwaneberg U, Otey C, Cirino PC, FarinasE, Arnold FH (2001) Cost-effective whole-cell assay for laboratory evolution of hydroxy-lases in Escherichia coli. J Biomol Screen6:111–117
40. Tee KL, Schwaneberg U (2006) A screeningsystem for the directed evolution of epoxy-genases: importance of position 184 inP450BM3 for stereoselective styrene epoxida-tion. Angew Chem Int Ed 45:5380–5383
41. Lentz O, Feenstra A, Habicher T, Hauer B,Schmid RD, Urlacher VB (2006) Altering theregioselectivity of cytochrome P450CYP102A3 of Bacillus subtilis by using a newversatile assay system. ChemBioChem7:345–350
42. Guazzaroni ME, Golyshin PN, Ferrer M(2010) Analysis of complex microbial commu-nities through metagenomic survey. In: MarcoD (ed) Metagenomics: theory, methods andapplications. Caister Academic Press, Norfolk,pp 55–77
43. Knietsch A, Waschkowitz T, Bowien S, HenneA, Daniel R (2003) Construction and
screening of metagenomic libraries derivedfrom enrichment cultures: generation of agene bank for genes conferring alcohol oxido-reductase activity on Escherichia coli. ApplEnviron Microbiol 69:1408–1416
44. Henning H, Leggewie C, Pohl M, M€uller M,Eggert T, Jaeger KE (2006) Identification ofnovel benzoylformate decarboxylases bygrowth selection. Appl Environ Microbiol72:7510–7517
45. Ferrer M, Golyshina OV, Chernikova TN, Kha-chane AN, Martins Dos Santos VA, YakimovMM, Timmis KN, Golyshin PN (2005) Micro-bial enzymes mined from the Urania deep-seahypersaline anoxic basin. Chem Biol12:895–904
46. Ferrer M, Golyshina OV, Chernikova TN,Khachane AN, Reyes-Duarte D, Santos VA,Strompl C, Elborough K, Jarvis G, Neef A,Yakimov MM, Timmis KN, Golyshin PN(2005) Novel hydrolase diversityretrieved from a metagenome library ofbovine rumen microflora. Environ Microbiol7:1996–2010
47. Anderson JA (1940) The use of tributyrin agarin dairy bacteriology. Rept Proc Int CongrMicrobiol 3:726
48. Sulaiman S, Yamato S, Kanaya E, Kim JJ, KogaY, Takano K, Kanaya S (2012) Isolation of anovel cutinase homolog with polyethyleneterephthalate-degrading activity from leaf-branch compost by using a metagenomicapproach. Appl Environ Microbiol78:1556–1562
49. Kouker G, Jaeger KE (1987) Specific and sen-sitive plate assay for bacterial lipases. Appl Envi-ron Microbiol 53:211–213
50. Mackenzie RD, Blohm TR, Auxier EM, LutherAC (1967) Rapid colorimetric micromethodfor free fatty acids. J Lipid Res 8:589–597
51. Hofelmann M, Kittsteiner-Eberle R, SchreierP (1983) Ultrathin-layer agar gels: a novelprint technique for ultrathin-layer isoelectricfocusing of enzymes. Anal Biochem128:217–222
52. Zheng J, Liu C, Liu L, Jin Q (2013) Charac-terisation of a thermo-alkali-stable lipase fromoil-contaminated soil using a metagenomicapproach. Syst Appl Microbiol 36:197–204
53. Svendsen A, Clausen IG, Okkels JS, ThellersenM (1995) A method of preparing a variant of alipolytic enzyme. Patent: Novo Nordisk, WO95/22615
54. Price MF, Wilkinson ID, Gentry LO (1982)Plate method for detection of phospholipaseactivity in Candida albicans. Sabouraudia20:7–14
Functional Screening of Metagenomic Libraries. . . 35

55. Chang CH, Schindler JF, Unkefer CJ, Vander-berg LA, Brainard JR, Terwilliger TC (1999)In vivo screening of haloalkane dehalogenasemutants. Bioorg Med Chem 7(2175):2181
56. Mansilla MC, Banchio CE, de Mendoza D(2008) Signalling pathways controlling fattyacid desaturation. Subcell Biochem 49:71–99
57. Okuyama H, Orikasa Y, Nishida T, WatanabeK, Morita N (2007) Bacterial genes responsiblefor the biosynthesis of eicosapentaenoic anddocosahexaenoic acids and their heterologousexpression. Appl Environ Microbiol73:665–670
58. Broekman JH, Steenbakkers JF (1974) Effectof the osmotic pressure of the growth mediumon fabB mutants of Escherichia coli. J Bacteriol117:971–977
59. Johnson BF, Greenberg J (1975) Mapping ofsul, the suppressor of lon in Escherichia coli. JBacteriol 122:570–574
60. Glogauer A, Martini VP, Faoro H, Couto GH,M€uller-Santos M, Monteiro RA, Mitchell DA,de Souza EM, Pedrosa FO, Krieger N (2011)Identification and characterization of a newtrue lipase isolated through metagenomicapproach. Microb Cell Fact 10:54–68
61. Song JK, Chung B, Oh YH, Rhee JS (2002)Construction of DNA-shuffled and incremen-tally truncated libraries by a mutagenic andunidirectional reassembly method: changingfrom a substrate specificity of phospholipaseto that of lipase. Appl Environ Microbiol68:6146–6151
62. Liu K, Wang J, Bu D, Zhao S, McSweeney C,Yu P, Li D (2009) Isolation and biochemicalcharacterization of two lipases from a metage-nomic library of China Holstein cow rumen.Biochem Biophys Res Commun 385:605–611
63. Tirawongsaroj P, Sriprang R, HarnpicharnchaiP, Thongaram T, Champreda V, Tanapongpi-pat S, Pootanakit K, Eurwilaichitr L (2008)Novel thermophilic and thermostable lipolyticenzymes from a Thailand hot spring metage-nomic library. J Biotechnol 133:42–49
64. Colin DY, Deprez-Beauclair P, Silva N,Infantes L, Kerfelec B (2010) Modification ofpancreatic lipase properties by directed molec-ular evolution. Protein Eng Des Sel23:365–373
65. Heravi KM, Eftekhar F, Yakhchali B, TabandehF (2008) Isolation and Identification of aLipase producing Bacillus sp. from soil. Pak JBiol Sci 11:740–745
66. Okamura Y, Kimura T, Yokouchi H, Meneses-Osorio M, Katoh M, Matsunaga T, TakeyamaH (2010) Isolation and characterization of aGDSL esterase from the metagenome of amarine sponge associated bacteria. Mar Bio-technol 12:395–402
67. Li G, Wang K, Liu YH (2008) Molecular clon-ing and characterization of a novel pyrethroidhydrolyzing esterase originating from themetagenome. Microb Cell Fact 7:38–47
68. Dror A, Shemesh E, Dayan N, Fishman A(2014) Protein engineering by random muta-genesis and structure-guided consensus of Geo-bacillus stearothermophilus lipase T6 forenhanced stability in methanol. Appl EnvironMicrobiol 80:1515–1527
69. Akutsu-Shigeno Y, Teeraphatpornchai T,Teamtisong K, Nomura N, Uchiyama H,Nakahara T, Nakajima-Kambe T (2003) Clon-ing and sequencing of a poly(DL-lactic acid)depolymerase gene from Paenibacillus amyloly-ticus strain TB-13 and its functional expressionin Escherichia coli. Appl Environ Microbiol69:2498–2504
70. Choi SL, Rha E, Lee SJ, Kim H, Kwon K,Jeong YS, Rhee YH, Song JJ, Kim HS, LeeSG (2014) Toward a generalized and high-throughput enzyme screening system basedon artificial genetic circuits. ACS Synth Biol3:163–171
71. Xu M, Xiao X, Wang F (2008) Isolation andcharacterization of alkane hydroxylases from ametagenomic library of Pacific deep-sea sedi-ment. Extremophiles 12:255–262
36 Monica Martınez-Martınez et al.

Screening for Enantioselective Lipases
Thomas Classen, Filip Kovacic, Benjamin Lauinger, Jorg Pietruszka,and Karl-Erich Jaeger
Abstract
Many lipolytic enzymes are enantioselective thus being able to distinguish between two enantiomers of agiven racemic substrate. This property together with ample availability and comparatively easy handlingmakes lipolytic enzymes the most widely used class of biocatalysts in the chemical and pharmaceuticalindustries. However, lipase activity as well as selectivity is often negligible towards typical industrialsubstrates which usually do not resemble natural ones. Therefore, suitable enzymes must first be identified,usually by activity-based screening methods which, however, differ in reliability, throughput and surrogatefunction. Here, we describe important parameters determining the reliability and reproducibility of suchscreening systems for five different assays in detail. Moreover, comprehensive protocols for the synthesis ofenantiopure lipase substrates and their use for screening of enantioselective lipases are provided.
Keywords: Adrenaline assay, Agar plate assay, Colorimetric assay, Fluorometric assay, Quick E assay
1 Introduction
The application of lipases (EC 3.1.1.3) at an industrial scale wasdriven by the fact that these enzymes do not require costly cofactorsfor activity and they are considerably stable at high temperatures aswell as in organic solvents, i.e. under biotechnological processconditions [1, 2]. The physiological function of lipases isthe hydrolysis of lipidic ester substrates although they catalyse thesynthesis of esters under low water conditions as well [3]. Completeor partial substitution of water by an organic solvent increasesthe solubility of hydrophobic substrates, on the one hand, andshifts the thermodynamic equilibrium of a lipase reaction towardsthe product side, on the other hand.
Both hydrolytic and synthetic lipase reactions are used inorganic chemistry mainly due to the regio- and stereoselectivity oflipases [4, 5], e.g. for the regioselective synthesis of sugar fatty acidester derivatives [6], regioselective deacetylation of quercetin pen-taacetate [7, 8] or the enantioselective synthesis of psymberic acid
T.J. McGenity et al. (eds.), Hydrocarbon and Lipid Microbiology Protocols, Springer Protocols Handbooks, (2017) 37–69,DOI 10.1007/8623_2016_218, © Springer-Verlag Berlin Heidelberg 2016, Published online: 19 October 2016
37

by kinetic resolution [9] (Scheme 1). While regioselectivity can beharnessed for precise (de-)protections or acylations allowing atarget-oriented processing of the very molecule, kinetic resolutionsare an easy way to obtain enantiopure compounds. However, sub-strate specific transformations require identification of highly selec-tive enzymes. Typically, most lipases lack selectivity for industrialsubstrates; therefore, suitable enzymes must be identified. To thisend, three conceptually different approaches were developed: (1)screening of commercially available enzymes [10, 11]; (2) screen-ing of rationally or randomly generated libraries obtained from aspecific enzyme [12, 13]; or (3) screening of libraries constructed
O
O
HO
O
HO
OH
OH
MMLMTBE, nBuOH
MTBE, nBuOHCALB
1
2
3
a
b
OMe
OMe
OMe
OMeOMe
O OH
O
O
+
esterase 00125 °CE >100
c
O
OH
HOHO
OH
OHCALB
O
O
HOHO
OH
OH
O
O
12
O
12
6
7
8
27%
29%
AcO
OAc
OAc
OAc
OAc
OAc
OAc
OAcOAc
OAc
OAc
rac-4
(S)(S)
(S,S)-5
(R)(R)
ionic liquid, tBuOH89%
(R,R)-4
Scheme 1 (a) Regioselective deprotection of quercetin pentaacetate (1) by Mucor miehei lipase (MML) andCandida antarctica lipase B (CALB) to the flavones 2 and 3 [7, 8]. (b) Kinetic resolution for the enantioselectivesynthesis of psymberic acid (5) from its racemic ester (4) [9]. (c) Selective synthesis of myristic acid ester(8) from glucose (6) and vinyl myristate (7) using CALB [25]. These reactions can be carried out chemically onlyby labour-intensive reaction sequences including many steps and with much lower final yields.Yields (%) andenantioselectivity (% ee) are given;MTBEmethyl tert-butyl ether, nBuOH n-butanol, tBuOH tert-butanol, nPrOHn-propanol
38 Thomas Classen et al.

with DNA isolated from uncultured microorganisms (so-calledmetagenomic libraries) [14–18]. Molecular biological methodsfor the construction of large libraries based on error-pronepolymerase chain reaction (PCR), degenerate oligonucleotides,mutator strains, DNA shuffling and direct or indirect methodsfor the extraction and cloning of environmental DNA weresuccessfully applied in the quest for isolating enzymes withincreased enantioselectivity [19–21]. Recently developed novelapproaches for the generation of combinatorial libraries usingsolid-phase gene synthesis showed clear advantages over conven-tional PCR methods [22].
Obviously, the identification of enantioselective biocatalystsfrom large libraries requires efficient screening techniques. Therespective screening systems should provide reliable analytic out-puts for about 1,000–100,000 variants, ideally within a day. Fur-thermore, screening substrates should be derivatives or analoguesof the substrate of interest, so-called surrogate substrates. In addi-tion to our previously published detailed protocols for determina-tion of lipase activities [23, 24], we describe here protocols for thesynthesis of chromogenic and fluorogenic lipase substrates andscreening methods to identify enantioselective lipases developedin our laboratory.
1.1 Methods
to Determine
the Stereopreference
of an Enzyme
By definition, enantiomers do not behave different from each otherin an achiral environment. Unfortunately, most routine analyticssuch as chromatography methods (GC, HPLC, TLC), spectros-copy (UV/Vis, IR) or mass spectrometry are achiral themselves andthus do not differentiate between enantiomers. Three strategies toovercome this problem have been successfully developed. Firstly,achiral methods can be converted into chiral ones. Prominentexamples are GC or HPLC which can be carried out using chiralstationary phases to separate enantiomers (Fig. 1a; [26]). As a moresophisticated attempt, NMR-spectroscopy has been used for enan-tiomeric analysis using chiral solvents or adding chiral ligands to thecompound of interest [27, 28]. The aforementioned strategy –analysing the enantiomers directly by diastereomeric interactions– is the only way to analyse reactions where stereogenic informationis generated by asymmetric synthesis from a prochiral compound.The strategies only work when the stereogenic information isalready present in the substrate, which is true for most lipase sub-strates. In the second approach, the enantiomers are chemicallyconverted into pseudo-enantiomers to make them inherently dis-tinguishable (Fig. 1b), often by isotope labelling of one enantiomerusing deuterium or 13C [29–32]. The tested enzyme ignoresthe difference between these enantiomers and converts the sub-strate according to its natural stereopreference, but the products orthe residual substrate can be easily analysed and distinguished withstandard mass spectrometric, NMR- and IR-spectroscopic methods
Screening for Enantioselective Lipases 39

[29, 31, 32]. Differences might occur if kinetic isotope effects (e.g.quantum tunnelling) take place, which has to be evaluated,although it is not expected for lipases and esterases. Similar, butchemically not identical pseudo-enantiomers can be synthesisedsubstituting a methyl group by a trifluoromethyl group. This sub-stitution does not change significantly neither the volume [V(CH3)¼ 29 A3, V(CF3) ¼ 44 A3] nor the superficial charge distributiondue to similar geometries of both groups. It should be stated thatsuch two molecules are not stereoisomers by definition; conse-quently, their internal electronic structures may differ, which finallymight affect the conversion rates of these (pseudo-)enantiomers. Inthe last approach of utilising pseudo-enantiomers, entire functionalgroups are different, e.g. the enantiomers are coupled with differ-ent fluorophores or chromophores, which enables a very fast analy-sis with standard methods but comes at the cost of decreasedsimilarity between apparent and true stereoselectivities. The‘Quick-E’ screening assay described below in more detail representssuch an approach [33].
The third method for characterising the stereopreference of anenzyme relies on the determination of the conversion rates for both
Fig. 1 Three strategies for the enantiomeric analysis. Enantiomers are designated with R and S, while squaresand circles represent different compounds. (a) Enantiomers can be distinguished in a chiral environment orcan be converted to diastereomers. Interactions between chiral stationary phase (squares) and chiralsubstrates or products (circles) are indicated by dashed lines while covalent bonds are indicated by solidlines. (b) Pseudo-enantiomers can be chemically synthesised by introducing isotopes, similar atoms anddifferent chromophores or fluorophores. (c) The conversion rates of an enzyme for the enantiomers of a givensubstrate can be separately compared
40 Thomas Classen et al.

enantiomers separately (Fig. 1c). Although the ratio of these ratesreflects the stereoselectivity of the particular enzyme, only an appar-ent stereoselectivity can be calculated because reaction conditionsare non-competitive, i.e. the enzyme cannot differentiate betweenthe two enantiomers at the same time as only one of them isavailable in the reaction mixture. Thus, inhibiting effects or lowerconversion rates of one enantiomer, which might occur in a com-petitive fashion, can hardly be detected. Only if the conversion rateof the racemic mixture is similar to the arithmetic mean of bothindividual conversion rates, the apparent stereoselectivity is mostlikely similar to the effective one. This approach allows using simplespectroscopic or chromatographic methods without the need forany previous chiral modifications.
1.2 The Screening
System
Three main criteria characterise the systems used to screen forenantioselectivity, namely their throughput, reliability and theuse of surrogate substrates. A comparison of various screeningmethods with respect to these criteria is shown in Table 1 andFig. 2.
Throughput: The more enzyme variants need to be tested, thefaster a screening system has to be. Usually, NMR spectroscopy orchromatographic techniques are restricted in throughput, althoughthey deliver very accurate data. Due to the efforts of the groups ofReetz and Trapp, the throughput of various chromatographicmethods could significantly be increased [26, 34]. Ultraviolet–visi-ble (UV–vis) and fluorescence spectroscopy using 96- or 384-microtiter plate photometers allow for high throughput analysis,and the fluorescence activated cell sorting (FACS) technique is anultra-high throughput method with the ability to analyse tenthousands of cells per minute [35].
Reliability: The identification of active and enantioselectiveenzymes by screening may be affected by the presence of interferingcompounds. This is an important issue for qualitative agar plateassays with growing microbial colonies (e.g. the tributyrin andrhodamine B assays) [36, 37] or quantitative microtiter plate assayswith crude cell lysates or supernatants (colorimetric or fluorometricassays). Variations in protein expression levels and thus yield ofactive enzymes may also prevent positive results and exact repro-ducibility. A single amino acid exchange in an enzyme can alreadysignificantly alter the essential cellular processes of transcription,translation, folding and transport.
Usually, pre-screening on agar plates of lipase-producing clonesis the method of choice using either the tributyrin agar plate assay[33] identifying esterases and lipases or the rhodamine B agar plateassay [37] for the detection of true lipases. Positive colonies aretransferred from agar plates into microtiter plates containinggrowth medium followed by cultivation. Preferably 500–1,000colonies should be obtained for convenient handling of assays.
Screening for Enantioselective Lipases 41

Table1
Screening
assays
Nr.
Assay,substrate
Form
at,throughput
Method
Strengths
Weaknesses
Ref.
1Agar
plates,tributyrin
Agar
plate,>100k/
day
Qualitativeden
sitometry
Rapid
iden
tificationof
lipases
andesterases,
nativesubstrate
Noen
antioselectivity,
preference
for
extracellular
hyd
rolases
[36]
2Agar
plates,triolein,
rhodam
ineB
Agar
plate,>100k/
day
Qualitativefluorometry
Rapid
iden
tificationof
lipases,native
substrate
Noen
antioselectivity,
preference
for
extracellular
hyd
rolases
[37]
3Liquid
assay,p-
nitrophen
ylester
Microtiterplate,1–1
0k/
day
Photometry
Linearread-outonwide
concentrationscale
Non-competitive
selectivity,moderate
sensitivity,artificial
substrate
[41]
4Liquid
assay,umbelliferyl
ester
Microtiterplate,1–1
0k/
day
Fluorometry
Highsensitivity,suitable
forweakactivities
Non-competitive
selectivity,artificial
substrate
[42,43]a
5Liquid
QuickEassay,p-
nitrophen
ylesterand
resorufine
tetradecanoate
Microtiterplate,1–1
0k/
day
Photometry
Quasi-competitiveassay,
linearread-outon
wideconcentration
scale
Evaluationofthe
screen
ingresultswith
realsubstrates
necessary
[33]
6Liquid
adrenalineassay,
polyolacetateesters
Microtiterplate,1–1
0k/
day
Photometry
Nativesubstrates,
detailedsubstrate
spectrum
Non-competitive
selectivity,specific
substrate
required
[44]
42 Thomas Classen et al.

7b
Invivo
covalent
attachmen
tof
productsvia
enzymedisplay,
biotin-tyram
ide
ester,streptavidin
andR-phycoerythrin
Cellsorter,>1,000k/
day
Fluorometry
Ultra-highthroughput,
highsensitivity,
competitiveassay
Technically
challenging
[35]
8b
Liquid
assaywith
isotope-labelled
pseudo-enantiomers,
anyester
Autosampler,100-10k/
day
NMRspectroscopy
Precise
quantification,
analysisofmultiple
products,competitive
assays
Lowthroughput,low
sensitivity,abstractness
ofthepseudo-
enantiomer
(cf.
Fig.1b)
[32]
9b
Liquid
assaywith
deu
terium-labelled
pseudo-enantiomers,
anyester
Autosampler,1-10k/
day
Massspectrometry
Precise
quantification,
highsensitivity,
analysisofmultiple
products,competitive
assays
Degreeofabstractionof
thepseudo-
enantiomer
(see
Fig.1b)
[29]
10b
Liquid
HPLC
andGC
assay,liquid
and
violable
esters
Autosampler,10-700/day
HPLC,GC
Precise
quantification,
highsensitivity,
analysisofmultiple
products,competitive
assays
Lowthroughput,
reference
compounds
needed
[26,45]
a Thebasishas
beensetbyachiralsubstrates;theen
antioselectivityassayisdescribed
inthisbookchapter
bThesemethodsarenotdescribed
indetailin
thischapter
Screening for Enantioselective Lipases 43

Growth temperature, incubation time, volume of growth mediumand agitation speed are common parameters to be optimised toachieve detectable enzymatic activity. Microtiter master plates con-taining a library of variants producing enzymatically active enzymesmay be stored at �80�C in the presence of 15% (v/v) glycerol.
Surrogate Substrates: Several high throughput screening methodsare based on the hydrolysis of chromogenic or fluorogenic surro-gate substrates. Researchers should be aware that these substratesallow easy handling of assays, but the results may not be transferableto the biocatalytic conversion of ‘real’ substrates, i.e. the enantios-electivities of enzymes determined with surrogate substrates maynot be relevant for industrial substrates.
Therefore, microtiter plate assays were developed allowing forscreening with label-free substrates which may represent real sub-strates of interest. For screening of lipases, available methodsinclude measuring pH changes due to released carboxylic acidsusing indicators [38] or measuring NADH production in reactionscoupled to the oxidation of released carboxylic acid [39].
Surrogate parameters may be defined as well for the reactionconditions used for screening. If a biocatalytic conversion needsdefined pH, temperature or the presence of organic solvents, thescreening system should mimic these conditions, too. For example,an enzyme variant identified by screening for enhanced enantios-electivity might have lost the temperature or pH stability of therespective wild-type enzyme and consequently, will not be applica-ble for the desired process. The problem of considering surrogate
lowactivity only
moderateapparent E-value
highreal E-value
abst
ract
mod
erat
ere
al
surr
ogat
e pa
ram
eter
quantity of analytic data
1 2
3/4 5
6 10/8 9
3 5 -110 -10 d2 3 -110 -10 d
6 -1≥10 d
throughput
tributyrin rhodamine B
pNP-/Umb-assay
Quick-E
adrenaline
pseudoenantiomers(NMR/MS)
HPLC
7attachment
Fig. 2 Schematic classification of various assays; numbers refer to the entries in Table 1. Throughput per dayis indicated by size and shape, respectively, of polygons shown in the insert
44 Thomas Classen et al.

parameters during screening is best illustrated by Frances Arnold’sstatement ‘you get what you screen for’ [40].
1.3 Calculating
Stereoselectivity
Usually, two parameters describe enantioselectivity: the enantiomericexcess (ee) and theE-value. The ee-value indicates the composition ofa mixture of two enantiomers which is calculated as the difference ofthe concentrations (c) of both enantiomers divided by the sum ofboth concentrations [here: (R)-enantiomer assumed to be the majorcomponent]:
ee ¼ cR � cScR þ cS
100%
The rationale behind this formula is depicted by an example shownin Fig. 3a. Having a mixture of 75% of the (R)-enantiomer and 25%of the (S)-enantiomer, all molecules of the (S)-enantiomer do find apendant within the amount of the (R)-enantiomer. Thus, one canassume that 50% (25% R plus 25% S) of the mixture are racemic.Consequently, the remaining 50% must consist of the (R)-enantio-mer corresponding to an ee-value of 50%. From a practical point ofview, the ee-value is used rather than a simple ratio of both enan-tiomers, because this value behaves linear over all possible composi-tions ranging from 0% to 100% ee (the value is by definition alwayspositive).
The E-value is defined as the ratio between the conversion rateconstant of the faster converted enantiomer and the conversion rateconstant for the slower converted enantiomer. Two types of reac-tions can be envisaged (see Fig. 3b): for an asymmetric synthesis, aprochiral compound (P) is converted to a chiral one (R/S); for akinetic resolution, an enantiomeric starting material (A/B) is con-verted to the respective enantiopure products (R/S). In both cases,the catalysed reaction is described by the kinetic rate constants k1and k2. Hence, the E-value is defined as:
Fig. 3 The rationales behind enantiomeric excess ee (a) and theenantioselectivity E (b)
Screening for Enantioselective Lipases 45

E ¼ k1=k2
¼kcat,1Km,1
�kcat,2Km,2
For an asymmetric synthesis, the E-value gives the ratio betweenthe measured concentrations of both enantiomers and this value isindependent of the conversion.
In contrast, the conversion rates for A and B, respectively,(Fig. 3b) strongly depend on the enantiomeric excess and theconversion. Thus, the determination of conversion rate constants(k1/k2) is more sophisticated. A detailed description of the analysisof such cases can be found in reference [46]. The rate constants canbe determined from steady-state kinetics, where the ratio of theturnover number kcat and the Michaelis-constant Km equals theconversion rate constant k.
In the context of screening, you won’t survey a steady-statekinetic for each and every library member. Usually, simplificationsare used to get a good idea of what could be the real E-value (e.g.measurements at substrate saturation concentration). Distinctassumptions and simplifications will be mentioned in the para-graphs describing the screening methods. However, the differencebetween apparent and effective E-value should be discussed hereshortly. The effective (or real) E-value is defined under competitiveconditions, i.e. the non-preferred enantiomer is present while theother is converted. This could cause competitive inhibition or evenallosteric effects. In screenings, the rates for both enantiomers areoften determined individually and then, the E-value is calculatedaccording to the mentioned equation. Such apparent E-valuesmight be different from real enantioselectivities. The strength ofan enantioselectivity screening is measured by its ability to predictor estimate the real E-value under simplified conditions.
2 Materials
All chemicals and solvents are commercially available (for companyweb-sites, see http://www.sigmaaldrich.com; http://www.tcichemicals.com/ and http://www.alfa.com/; for laboratoryequipment and glass ware, see http://www.carlroth.com andhttps://de.vwr.com/). Prepare all buffer solutions using analyticalgrade reagents and ultrapure water with electrical resistivity of18 MΩ cm. The accuracy of any activity assay strongly dependson the careful preparation of all solutions; therefore, pay attentionwhen weighing small amounts of substrates and pipetting smallvolumes of solutions. We recommend to freshly prepare buffersneeded for activity assays rather than to add toxic sodium azidefor conservation. Buffers can usually be stored for up to 2 weeks at
46 Thomas Classen et al.

room temperature or up to one month at 8�C. Warm up the assaybuffers to the temperature chosen for the assays and ensure that pHis adjusted at this same temperature (Note 1).
2.1 Agar Plate
Assays
Luria-Bertani (LB) agar medium [44]: 10 g/L bacto-tryptone,10 g/L sodium chloride, 5 g/L bacto-yeast extract, 15 g/L agar.Add distilled water, dissolve the components, adjust to pH 7 withNaOH and autoclave.
2.1.1 Tributyrin Emulsion
Assay [36]
Tributyrin emulsion: 50% (v/v) tributyrin, sterilised by filtrationthrough 0.22 μm membranes, 50 g/L sterile gum arabic dissolvedin sterile distilled water. Mix the emulsion for 1 min using a homo-geniser (e.g. Ultra Turrax, IKA Labortechnik, Germany) rinsedwith 70% (v/v) ethanol.
2.1.2 Rhodamine B
Assay [37]
Rhodamine B solution: 1 mg/mL dissolved in sterile distilledwater; sterilise by filtration through 0.22 μm membranes.
Olive oil emulsion: mix 25 g/L olive oil with sterile distilledwater, sterilise by filtration and emulsify by mixing for 1 min with ahomogeniser rinsed with 70% (v/v) ethanol.
2.2 Synthesis
of Chiral
4-Methylumbelliferyl
Esters and
Fluorimetric Screening
2.2.1 General Materials
1. Dewar vessel
2. Dry ice
3. Low-temperature thermometer
4. Acetone
5. Heat gun
6. Schlenk flasks (10 mL, 25 mL, 50 mL, 100 mL)
7. Rubber septa
8. Magnetic stir bars
9. Magnetic stirrer
10. Schlenk line for providing dry nitrogen (Note 2) and vacuum
11. Brine (saturated sodium chloride solution)
12. Erlenmeyer flasks
13. Anhydrous magnesium sulphate
14. Funnels with Celite™ filter material or filter paper
15. Round bottom flasks
16. B. Braun Injekt® 5 mL Luer Solo syringes
17. B. Braun Injekt® 20 mL Luer Solo syringes
18. B. Braun Injekt® 2 mL Luer Solo syringes
19. B. Braun Sterican® 0.80 � 120 mm BL/LB (21G � 4 ¾00)hypodermic-needles
20. Ethyl acetate
Screening for Enantioselective Lipases 47

21. Petroleum ether (bp 40–60�C)
22. Chromatography column
23. Silica gel (230–400 mesh)
24. Separation funnels
2.2.2 Synthesising (R)-
and (S)-2-Methyldecanoic
Acid (12) in Three
Steps [47]
Synthesis of (R)-
and (S)-4-Benzyl-3-
Decanoyloxazolidin-2-One
1. Anhydrous tetrahydrofuran (THF)
2. (R)-4-Benzyloxazolidin-2-one
3. (S)-4-Benzyloxazolidin-2-one
4. n-Butyl lithium (2.5 M in hexane)
5. Decanoyl chloride
6. Saturated aqueous ammonium chloride solution
7. Dichloromethane (CAUTION: Dichloromethane is toxic andsuspected of causing cancer!)
8. Aqueous potassium carbonate solution (1.0 M)
Synthesis of (4R,20R)-and (4S,20S)-3-(20-Methyldecanoyl)-4-
Benzyloxazolidin-2-One
1. Sodium bis(trimethylsilyl)amide (1.0 M in THF, 3.3 mL,3.3 mmol)
2. (R)-4-Benzyl-3-decanoyloxazolidin-2-one
3. (S)-4-Benzyl-3-decanoyloxazolidin-2-one
4. Iodomethane (EXTREME CAUTION: Iodomethane is toxicand suspected of causing cancer!)
5. Saturated aqueous ammonium chloride solution
6. Dichloromethane (CAUTION: Dichloromethane is toxic andsuspected of causing cancer!)
7. Aqueous sodium sulphite solution (1.0 M)
Synthesis of (R)-and
(S)-2-Methyldecanoic Acid
1. (4R,20R)-3-(20-methyldecanoyl)-4-benzyloxazolidin-2-one
2. (4S,20S)-3-(20-methyldecanoyl)-4-benzyloxazolidin-2-one
3. THF
4. Ice bath (0�C)
5. Deionized water
6. Aqueous hydrogen peroxide solution (30%)
7. Lithium hydroxide hydrate
8. Aqueous HCl solution (1.0 M)
9. pH indicator paper
10. Dichloromethane (CAUTION: Dichloromethane is toxic andsuspected of causing cancer!)
11. Aqueous sodium sulphite solution (1.5 M)
48 Thomas Classen et al.

2.2.3 Coupling of the
Fluorophore
Methylumbelliferone
to 2-Methyldecanoic
Acid [48]
1. (R)-2-Methyldecanoic acid in a small (10–25 mL) Schlenk flask
2. (S)-2-Methyldecanoic acid in a small (10–25 mL) Schlenk flask
3. Ice bath (0�C)
4. N-(3-Dimethylaminopropyl)-N0-ethylcarbodiimide hydro-chloride (EDC · HCl)
5. Anhydrous N,N-dimethylformamide (DMF)
6. 4-Methylumbelliferone (4-MU)
7. 4-(Dimethylamino)pyridine (4-DMAP, EXTREME CAU-TION: 4-DMAP may be fatal in contact with skin!)
8. Saturated aqueous sodium bicarbonate (sodium hydrogen car-bonate) solution
2.3 Screening
for Enantioselectivity
of Lipases/Esterases
Using (R)- and (S)-
Methylumbelliferyl
2-Methyldecanoate
2.3.1 Performing the
Enantioselectivity Assay
1. Screening buffer: mixture of 50 mM Na2HPO4 and 50 mMKH2PO4 adjusted to pH 8.0, add 50mM sodium deoxycholateand 0.1% (w/v) gum Arabic
2. Substrate stock solutions 1 mM in DMSO (see Sect. 3.2.4.1)
3. 4-MU stock solutions in DMSO (0.125 mM, 0.25 mM,0.5 mM, 0.75 mM, 1.0 mM and 1.25 mM, see 3.2.4.1)
4. 1.5 mL or 2.0 mL Eppendorf Safe Lock Tubes™ or 15 mLvessels
5. Black 96-well microtiter plate (flat bottom, e.g. from GreinerBio-One)
6. DMSO
7. Multiwell-spectrofluorometer (Infinite® M1000Pro, Tecan)
8. Lipase/esterase stock solution
2.4 Synthesis of
p-Nitrophenyl Esters
and Colorimetric
Screening
2.4.1 Synthesis of (R)-
and (S)-2-Methyldecanoic
Acid [47]
1. For the synthesis of (R)- and (S)-2-methyldecanoic acid, seethe materials described in Sects. 2.2.1 and 2.2.2
2.4.2 Coupling of
p-Nitrophenol
to 2-Methyldecanoic
Acid [48]
1. (R)-2-Methyldecanoic acid in a small (10–25 mL) Schlenk flask
2. (S)-2-Methyldecanoic acid in a small (10–25 mL) Schlenk flask
3. Ice bath (0�C)
4. EDC · HCl
5. DMF
6. para-nitrophenol (p-NP)
Screening for Enantioselective Lipases 49

7. 4-DMAP (EXTREME CAUTION: 4-DMAP may be fatal incontact with skin!)
8. Saturated aqueous sodium bicarbonate (sodium hydrogen car-bonate) solution
2.4.3 p-Nitrophenyl
2-Methyldecanoate (p-NP
2-MD) Substrates [41]
1. Substrate stock: 10 mg/mL (R)-p-NP 2-MD in acetonitrile(Note 3).
2. Substrate stock: 10 mg/mL (S)-p-NP 2-MD in acetonitrile(Note 3).
3. Assay buffer: 100 mM Tris-HCl pH 7.5
4. p-NP standard stock solution: 10 mg/ml p-nitrophenol inassay buffer.
5. Microplate reader: Vis spectrophotometer for measurements in96-well microplates (e.g. SpectraMax 250, Molecular DevicesCorp.).
6. 96-well microplates.
2.5 Adrenaline
Assay [44]
1. Substrates: 10 mM of compounds listed in the Table 2dissolved in acetonitrile.
2. Titrant 1: 10 mM NaIO4 in water (Note 4).
3. Titrant 2: 15 mM L-adrenaline hydrochloride in water.
4. Enzyme in 50 mM aqueous borate buffer pH 8.0 (Note 5).
5. 96-well microplates.
6. Microplate reader:Vis spectrophotometer formeasurements in96-well microplates (e.g. SpectraMax 250, Molecular Devices Corp.).
2.6 Quick E Assay 1. Assay buffer: 50 mM Tris-HCl pH 8; 4.5 g/L Triton X-100
2. (S)-p-NP 2-PP substrate solution S: 7.8 mM (S)-p-nitrophenyl2-phenylpropanoate [(S)-p-NP 2-PP] dissolved in acetonitrile.
3. (R)-p-NP 2-PP substrate solution R: 7.8 mM p-nitrophenyl-(R)-2-phenylpropanoate [(R)-p-NP 2-PP] dissolved inacetonitrile.
4. Reference substrate solution: 1.6 mM resorufine tetradecano-ate dissolved in acetonitrile.
5. 96-well microplates.
6. Plate reader.
3 Methods
3.1 Agar Plate
Assays
LB-agar is the most widely used solid medium for the growth ofbacteria. It can be supplemented with antibiotics to maintainexpression plasmids and with inducers of gene expression, e.g.isopropyl-β-D-galactopyranoside (IPTG). Substrates should be
50 Thomas Classen et al.

freshly emulsified before adding to the agar medium to obtain anemulsion with optimal properties. It is recommended to use freshagar plates to increase assay sensitivity and reproducibility (Note 6).The agar plates are usually incubated for 1 day at optimal growthtemperature for enzyme production followed by incubation at 4�Cup to 50�C required for detection of an enzymatic activity. Whenassaying lipases secreted into culture medium, enzymatic activitymay be detected even before colonies are formed. For assay ofintracellular lipases, strains should be grown to form colonies
Table 2Commercially available polyol acetate substrates used for adrenaline lipase assays [49]
Substrate name CAS number Supplier
Ethylene glycol diacetate 111-55-7 Sigma Aldrich
Diacetin, glycerol α,α0-diacetate 5395-31-7 TCI Europe
Propylene glycol diacetate 623-84-7 Sigma Aldrich
Triacetin 102-76-1 Sigma Aldrich
(R)-(+)-Dihydro-5-(hydroxymethyl)-2(3H)-furanone
52813-63-5 Sigma Aldrich
(S)-(+)-Dihydro-5-(hydroxymethyl)-2(3H)-furanone
32780-06-6 Sigma Aldrich
(1R,2R)-2-(Acetyloxy)cyclohexyl acetate 1759-71-3 Sigma Aldrich
β-D-Ribofuranose 1,2,3,5-tetraacetate 13035-61-5 AK Scientific
α-D-Mannose pentaacetate 4163-65-9 Sigma Aldrich
β-D-Ribopyranose 1,2,3,4-tetraacetate 4049-34-7 Sigma Aldrich
D-(+)-Sucrose octaacetate 126-14-7 Sigma Aldrich
4-O-(2,3,4,6-Tetra-O-acetyl-α-D-mannopyranosyl)-D-mannopyranosetetraacetate
123809-59-6 TRC
β-D-Galactose pentaacetate 4163-60-4 Sigma Aldrich
β-D-Ribopyranose 1,2,3,4-tetraacetate 4049-34-7 Sigma Aldrich
Lactose octaacetate 6291-42-5 TRC
D-(+)-Cellobiose octaacetate 3616-19-1 TRC
Mannitol hexaacetate 5346-76-9 MP Biomedicals
D-Sorbitol hexaacetate 7208-47-1 Sigma Aldrich
β-L-Glucose pentaacetate 66966-07-2 TRC
1,2,3,4-Tetra-O-acetyl-α-L-fucopyranoside 64913-16-2 TCI Europe
β-D-Ribopyranose 1,2,3,4-tetraacetate 4049-34-7 Sigma Aldrich
TRC Toronto Research Chemicals, TCI Europe Tokyo Chemical Industry Europe
Screening for Enantioselective Lipases 51

followed by assaying enzymatic activities at growth suppressingtemperature (usually in the refrigerator for psychrophilic and meso-philic enzymes). Not more than 500 clones per standard Petri dish(90 mm diameter) should be plated to achieve good spatial resolu-tion of clones and allow identification of single enzyme-producingclones.
3.1.1 Tributyrin Agar
Plate Assay [36]
The most common agar plate assay to detect extracellular andintracellular lipases uses tributyrin which is a natural lipase sub-strate. However, tributyrin is a triglyceride ester with short chain(C4) fatty acids which is hydrolysed by lipases and esterases as well.Clear zones appearing around the bacterial colonies indicate theproduction of catalytic active lipolytic enzymes.
1. Add 30mL of tributyrin emulsion, the respective antibiotic and(if required) inducer (e.g. IPTG) to 1 L of melted LB agarmedium cooled to a temperature of about 60�C and mixthoroughly.
2. Pour 20 mL medium into appropriate Petri plates and let itsolidify for at least 20 min.
3. Plate bacterial clones and incubate at optimal growth tempera-ture for at least 16 h.
4. Positive clones are identified after overnight growth or afterprolonged (2–4 days) incubation in refrigerator for clonesexpressing low amounts of active enzymes (Note 7).
3.1.2 Rhodamine B (RB)
Agar Plate Assay [37]
This assay is specific for true lipases because it uses triolein as asubstrate, which is a triglyceride ester containing long chain (C-18:1) fatty acids. Released fatty acids form fluorescent complexeswith the cationic rhodamine B resulting in fluorescent halos aroundlipase-positive clones after irradiation of the agar plate with UVlight at 350 nm. Clones which do not produce lipases appear pinkcoloured, but non-fluorescent (Note 8).
1. Add 31.25 mL of olive oil emulsion, 10 mL RB solution,respective antibiotic and inducer (e.g. IPTG) to 1 L of meltedLB agar medium at a temperature of about 60�C and mixthoroughly.
2. Pour 20 mL medium into appropriate plates and let it solidify.Normally, plates are pink coloured and have opaqueappearance.
3. Plate the clones and incubate at optimal growth temperaturefor at least 16 h.
4. Positive clones are identified under UV light (e.g. hand lamp at350 nm) by fluorescent halos around colonies (Note 9).
52 Thomas Classen et al.

3.2 Fluorimetric
Screening with Chiral
Methylumbelliferyl
(R)- and (S)-2-
Methyldecanoate
In this section, the synthesis of (R)-methylumbelliferyl 2-methyldecanoate (9R) and (S)-methylumbelliferyl 2-methyldecanoate(9S) will be described starting from decanoyl chloride (10) and theEvans auxiliary (R)-4-benzyloxazolidin-2-one (11R) or (S)-4-benzy-loxazolidin-2-one, respectively (Scheme 2) [47].
Determining the activity of a lipase or esterase towards both 4-methylumbelliferyl 2-methyldecanoate enantiomers under non-competitive conditions in separate reactions enables a fast estima-tion of the enantioselectivity of the tested enzyme in a 96-well platescale. Hydrolysis of 4-MU esters by lipases can be followed contin-uously by monitoring the increase of fluorescence intensity due tothe production of highly fluorescent 4-methylumbelliferone(4-MU) with an emission spectra maximum at 460 nm. In contrastto emission maxima the fluorescence excitation maxima of 4-MU ispH dependent and varies from 330 nm at pH 4.6 to 385 nm at
Cl
O
OHN
O
Ph
O
N O
O
Ph
6 6
O
OH6
O
N O
O
Ph
6
O
O6
O O
Cl
O
OHN
O
Ph
6
O
O6
O O
a
b9R
10
10
9S
14R12R
a) NaN(SiMe3)2b) MeI
THF, -78°C
(R)
(R)
n-BuLi, THF, -78°C
(R)
(R)
(R)
11R
13R
EDC·HCl4-DMAP4-methylumbelliferone
LiOH,H2O2,
0 °C
(R)
(S)
11S(S)
n-BuLi,THF, -78°C
Scheme 2 (a) Synthesis of the screening substrate (R)-methylumbelliferyl 2-methyldecanoate (9R). Thestereoselectivity of the alkylation (step 2) is controlled by the Evans auxiliary 4-benzyloxazolidin-2-one(11R). Using (R)-4-benzyloxazolidin-2-one (11R) yields the (R)-methylumbelliferyl 2-methyldecanoate (9R).(b) To obtain (S)-methylumbelliferyl 2-methyldecanoate (9S) the synthesis has to be performed starting with(S)-4-benzyloxazolidin-2-one (11S)
Screening for Enantioselective Lipases 53

pH 10.4 [43]. For activity calculations, it is necessary to correct forspontaneous hydrolysis of the substrates and background fluores-cence of the protein sample. Enzyme activity is defined as theamount of released 4-MU per minute, and can be calculated witha standard curve obtained by measuring the fluorescence of 4-MUunder assay conditions. The reported assay is based on theconditions described by Winkler and Stuckmann [51].
3.2.1 General Procedures 1. Fill a Dewar vessel halfway with acetone and carefully add dryice until a temperature of �78�C is reached (Note 10).
2. Preparation of an inert Schlenk flask: Connect a Schlenk flask ofappropriate size to the Schlenk line, add a magnetic stir bar, sealit with a rubber septum and evacuate the flask. Heat the evac-uated flask carefully all-over with a heat gun while the flask isconnected to the vacuum. (CAUTION: DO NOT HEAT ACLOSED FLASK!). Let the Schlenk flask chill and flush it withdry nitrogen (Note 11). Repeat this evacuation, heating, chill-ing and flushing circle two times.
3.2.2 Synthesising
(R)- and (S)-2-
Methyldecanoic Acid (12)
in Three Steps [47]
Synthesis of (R)- and
(S)-4-Benzyl-3-
Decanoyloxazolidin-2-
One (13)
1. Transfer 20 mL of anhydrous THF to the nitrogen flushed100 mL Schlenk flask under inert conditions by using a 20 mLsyringe with a hypodermic-needle.
2. Dissolve (R)-4-benzyloxazolidin-2-one (1.0 g, 5.6 mmol) inTHF under inert conditions by stirring.
3. Cool the reaction mixture to -78�C using a dry ice/acetonecooling bath.
4. Add n-butyl lithium (2.5 M in hexane, 2.3 mL, 5.7 mmol)under inert conditions drop wise at -78�C during 15 min usinga 5 mL syringe with a hypodermic-needle.
5. Add decanoyl chloride (1.18 g, 1.28 mL, 6.2 mmol) underinert conditions drop wise at -78�C by using a 2 mL syringewith a hypodermic-needle.
6. Allow the solution to warm to 0�C during 1 h by slowly liftingthe flask out of the acetone/dry ice cooling bath and dipping itinto an ice bath.
7. Let the solution stir for further 1 h.
8. Quench the reaction by slowly adding 10 mL of saturatedaqueous ammonium chloride solution with a 20 mL syringecoupled to hypodermic-needle.
9. Transfer the reaction mixture to a separation funnel (use afunnel without filter paper if necessary) and rinse the Schlenkflask with dichloromethane. Add the dichloromethane used forrinsing to the separation funnel (CAUTION: Dichloro-methane is toxic and suspected of causing cancer!).
54 Thomas Classen et al.

10. Extract the reaction mixture with dichloromethane three timesand collect the organic layers.
11. Wash the combined organic layers with aqueous potassiumcarbonate solution (1.0 M). CAUTION: Residual ammoniumchloride can react with potassium carbonate and release carbondioxide. To avoid high pressures in the separation funnel slew itslowly before closing with the plug.
12. Wash the combined organic layers with brine.
13. Transfer the combined organic layers to an Erlenmeyer flaskand add anhydrous magnesium sulphate for drying.
14. Filter and transfer the combined organic layers by using afunnel with Celite™ or filter paper to a round bottom flask.
15. Remove the solvent under reduced pressure by using a rotaryevaporator.
16. Purify the crude product by column chromatography usingsilica gel and a mixture of petroleum ether/ethyl acetate(9:1). Removing the solvent under reduced pressure by usinga rotary evaporator gives (R)-4-benzyl-3-decanoyloxazolidin-2-one as colourless oil (1.17 g, 62%) that crystallises on stand-ing to a colourless solid.
17. Transfer the product to a small (10 or 25 mL) round bottom orSchlenk flask (Note 11).
18. Analytical data [47]: mp 37–39�C; optical rotatory power:[α]D20 ¼ �60.6 (c ¼ 1.0, CH2Cl2);
1H NMR δ ¼ 0.87 (t,J ¼ 6.7 Hz, 3H, 10-H), 1.15–1.34 (m, 12H, 6� CH2),1.56–1.68 (m, 2H, 3-H), 2.74 (dd, J ¼ 13.4, 9.6 Hz, 1H,CHHPh), 2.79–2.94 (m, 2H, 2-H), 3.28 (dd, J ¼ 13.4,3.2 Hz, 1H, CHHPh), 4.08–4.16 (m, 2H, 50-H), 4.57–4.64(m, 1H, 40-H), 7.12–7.28 (m, 5H, Ph-H); 13C NMRδ ¼ 14.45, 22.70, 24.31 (decanoyl C-3), 29.17, 29.31,29.44, 29.48, 31.91, 35.57 (decanoyl C-2), 37.97, 55.19,66.17, 127.36, 128.97, 129.45, 135.38, 153.49, 173.45(decanoyl C-1).
19. Using (S)-4-benzyloxazolidin-2-one as starting material in thestep 4 yields (S)-4-benzyl-3-decanoyloxazolidin-2-one as a col-ourless oil (1.72 g, 93%) (mp 37–39�C); optical rotatory power:[α]D20 ¼ +63.7 (c ¼ 1.0, CH2Cl2); the NMR data corre-sponds to (R)-4-benzyl-3-decanoyloxazolidin-2-one [47].
Synthesis of (4R,20R)- and(4S,20S)-3-(20-Methyldecanoyl)-4-
Benzyloxazolidin-2-
One (14)
1. Prepare a 25 mL and a 50 mL Schlenk flask for working underinert conditions and a dry ice/acetone cooling bath asdescribed in Sect. 3.2.1.
2. Transfer sodium bis(trimethylsilyl)amide (1.0 M in tetrahydro-furan, 3.3 mL, 3.3 mmol) under inert conditions to the nitro-gen flushed 50 mL Schlenk flask by using a 5 mL syringe with ahypodermic-needle.
Screening for Enantioselective Lipases 55

3. Cool the reaction mixture to -78�C by using the dry ice/acetone cooling bath.
4. Flush the round bottom or Schlenk flask containing (R)-4-benzyl-3-decanoyloxazolidin-2-one (1.0 g, 3.0 mmol) withdry nitrogen and seal it with a rubber septum.
5. Transfer 5–10 mL of anhydrous THF under inert conditions tothe (R)-4-benzyl-3-decanoyloxazolidin-2-one containing flaskand dissolve the (R)-4-benzyl-3-decanoyloxazolidin-2-one.Cool the solution to 0�C.
6. Add the pre-cooled (R)-4-benzyl-3-decanoyloxazolidin-2-onein THF solution under inert conditions drop wise to thesodium bis(trimethylsilyl)amide solution at -78�C.
7. Let the reaction mixture stir for 1 h at -78�C.
8. Transfer 5 mL anhydrous THF under inert conditions to theempty nitrogen flushed 25 mL Schlenk flask by using a 5 mLsyringe with a hypodermic-needle.
9. Bend a new hypodermic-needle carefully by 90� close to theplastic Luer lock.
10. Fill an empty 2 mL syringe equipped with the bendhypodermic-needle with iodomethane (0.9 mL, 15 mmol).EXTREME CAUTION: Iodomethane is volatile, toxic andsuspected of causing cancer! Wear proper gloves and work ina well-ventilated fume hood!
11. Take up 0.5 mL of anhydrous THF from the 25 mL Schlenkflask (filled with 5 mL of THF) with the iodomethane contain-ing syringe equipped with the bend hypodermic-needle. Holdthe syringe with the plunger pointing down to avoid the loss ofiodomethane.
12. A homogeneous solution is formed shaking the syringe withTHF and iodomethane carefully with its plunger fullyextended. Hold the syringe with the plunger pointing downto avoid the loss of iodomethane and THF.
13. Add the iodomethane in THF solution drop wise to the reac-tion mixture at -78�C under inert conditions and let it stir forfurther 3 h.
14. Stop the reaction by adding saturated aqueous ammoniumchloride solution (10 mL) using a 5 mL syringe with a hypo-dermic-needle.
15. Allow the reaction mixture to warm to room temperature.
16. Transfer the reaction mixture carefully into a separation funnel(use a funnel if necessary). EXTREME CAUTION: The reac-tion mixture contains an excess of iodomethane! Rinse the
56 Thomas Classen et al.

Schlenk flask with dichloromethane and transfer the dichloro-methane to the separation funnel as well.
17. Extract the reaction mixture thrice with dichloromethane andcollect the organic layers. EXTREME CAUTION:IODOMETHANE!
18. Transfer the combined organic layers to a clean separationfunnel and wash with aqueous sodium sulphite (1.0 M) solu-tion EXTREME CAUTION: IODOMETHANE!
19. Transfer the combined organic layers to an Erlenmeyer flaskand add anhydrous magnesium sulphate for drying.EXTREME CAUTION: IODOMETHANE!
20. Filter and transfer the combined organic layers by using afunnel with filter paper to a round bottom flask. EXTREMECAUTION: IODOMETHANE!
21. Remove the solvent in vacuo by using a rotary evaporator.EXTREME CAUTION: IODOMETHANE! Use a rotaryevaporator placed in a well-ventilated fume hood!
22. Purify the crude product by column chromatography usingsilica gel and a mixture of petroleum ether/ethyl acetate(95:5).
23. Removing the solvent under reduced pressure by using a rotaryevaporator gives (4R,20R)-3-(2-methyldecanoyl) 4-benzylox-azolidin-2-one (650 mg, 1.9 mmol, 63%) as colourless oil.
24. Transfer the product to 100 mL round bottom flask.
25. Analytical data [47]: optical rotatory power: [α]D20 ¼ �73.5(c ¼ 1.0, CH2Cl2);
1H NMR δ ¼0.86 (t, J ¼ 6.7 Hz, 3H, 10-H), 1.20 (d, J ¼ 6.9 Hz, 3H, 2-CH3), 1.16–1.26 (m, 12H,6 � decanoyl CH2), 1.30–1.38 (m, 1H, 3-Ha), 1.62–1.70 (m,1H, 3-Hb), 2.75 (dd, 1H, J ¼ 13.2, 9.5 Hz, CHHPh), 3.26(dd, J ¼ 13.4, 3.2 Hz, 1H, CHHPh), 3.60–3.66 (m, 1H, 2-H), 4.07–4.15 (m, 2H, 50-H), 4.58–4.63 (m, 1H, 40-H),7.11–7.28 (m, 5H, Ph-H); 13C NMR δ ¼ 14.09, 17.35(decanoyl 2-CH3), 22.64, 27.25, 29.24, 29.46, 29.65,31.85, 33.46 (decanoyl 3-C), 37.71 (decanoyl 2-C), 37.90,55.36, 65.99, 127.32, 128.92, 129.44, 135.35, 153.05,177.37.
26. Using (S)-4-benzyl-3-decanoyloxazolidin-2-one as startingmaterial in the step 24 yields (4S,20S)-3-(2-methyldecanoyl)-4-benzyloxazolidin-2-one as a colourless oil (68%). Opticalrotatory power: [α]D20 ¼ +76.6 (c ¼ 1.0, CH2Cl2); theNMR data are identical to its enantiomer (4R,20R)3-(2-methyldecanoyl)-4-benzyloxazolidin-2-one [47].
Screening for Enantioselective Lipases 57

Synthesis of (R)- and (S)-2-
Methyldecanoic Acid (12)
1. Dissolve (4R,20R)-3-(20-methyldecanoyl) 4-benzyloxazolidin-2-one (650mg, 1.9 mmol) in THF (27mL) in a 100mL roundbottom flask with stirring.
2. Add 9 mL of deionized water.
3. Cool the reaction mixture with an ice bath to 0�C.
4. Add 1.4 mL aqueous hydrogen peroxide (30%), 150 mg(3.8 mmol) lithium hydroxide hydrate and stir at 0�C for 3 h(Note 12).
5. Stop the reaction by adding aqueous sodium sulphite solution(1.5 M, 13 mL, 20 mmol).
6. Acidify the reaction mixture with aqueous HCl (1.0 M) topH 1 (check with pH indicator paper).
7. Transfer the reaction mixture to a separation funnel (use afunnel without filter paper if necessary) and rinse the roundbottom flask with dichloromethane. Add the dichloromethaneused for rinsing to the separation funnel.
8. Extract the reaction mixture with dichloromethane thrice andcollect the organic layers.
9. Transfer the combined organic layers to an Erlenmeyer flaskand add anhydrous magnesium sulphate for drying.
10. Filter and transfer the combined organic layers by using afunnel with filter paper to a round bottom flask.
11. Remove the solvent under reduced pressure by using a rotaryevaporator.
12. Purify the crude product by column chromatography usingsilica gel and a mixture of petroleum ether/ethyl acetate75:25 (Note 13).
13. Removing the solvent in vacuo by using a rotary evaporatorgives (R)-2-methyldecanoic acid (320 mg, 1.7 mmol, 91%) ascolourless oil.
14. Transfer the product to a small (10–25 mL) round bottom orSchlenk flask.
15. Analytical data [47]: optical rotatory power: [α]D20 ¼ �16.3(c ¼ 1.0, methanol), [α]D20 ¼ �15.8 (neat); [α]D20 ¼ �15.4(c 0.84, methanol); 1HNMR δ ¼ 0.86 (t, 3H, J ¼ 6.7, 10-H),1.16 (d, 3H, J ¼ 6.9 Hz, 2-CH3), 1.22–1.48 (m, 13H, 6 �CH2 + 3-Ha), 1.65–1.72 (m, 1H, 3-Hb), 2.42–2.49 (m, 1H,2-H); 13C NMR δ ¼ 14.09, 16.80, 22.65, 27.13, 29.25,29.42, 29.50, 31.85, 33.50, 39.38, 183.49.
16. Using (4S,20S)-3-(20-methyldecanoyl)-4-benzyloxazolidin-2-one as starting material in the step 47 yields (S)-2-methyldeca-noic acid as a colourless oil (260 g, 1.4 mmol, quant.). Opticalrotatory power: [α]D20 ¼ +15.8 (c ¼ 1.0, methanol); theNMR data are identical to its enantiomer (R)-2-methyldeca-noic acid [47].
58 Thomas Classen et al.

3.2.3 Coupling of the
Fluorophore
Methylumbelliferone to
(R)-2-Methyldecanoic Acid
1. Flush the Schlenk flask containing (R)-2-methyldecanoic acid(279 mg, 1.5 mmol) with dry nitrogen.
2. Dissolve the 2-methyldecanoic acid in anhydrous DMF(2–5 mL) under a dry nitrogen atmosphere using a 5 mLsyringe with a hypodermic-needle.
3. Prepare an inert 100 mL Schlenk flask as described inSect. 3.2.1.
4. Transfer the 2-methyldecanoic acid in anhydrous DMF underinert conditions to the dry, nitrogen flushed 100 mL Schlenkflask using a 5 mL syringe with a hypodermic-needle.
5. Add additional anhydrous DMF up to a final volume of 10 mLunder inert conditions using a 10 mL syringe with a hypoder-mic-needle.
6. Cool the solution to 0�C using an ice bath.
7. Add 4-DMAP (32 mg, 260 μmol, 0.17 eq.) under inert con-ditions. EXTREME CAUTION: 4-DMAP may be fatal incontact with skin!
8. Add EDC · HCl (359 mg, 1.8 mmol, 1.3 eq.) under inertconditions.
9. Add 4-MU (317 mg, 1.8 mmol, 1.2 eq.) under inertconditions.
10. Let the reaction stir for 1 h at 0�C.
11. Allow the reaction to warm to room temperature and let it stirover night.
12. Dilute the reaction mixture with 30 mL ethyl acetate.
13. Transfer the reaction mixture to a separation funnel (use afunnel without filter paper if necessary) and rinse the Schlenkflask with ethyl acetate. Add the ethyl acetate used for rinsing tothe separation funnel.
14. Wash the organic layer with saturated aqueous sodium bicar-bonate solution thrice.
15. Wash the organic layer with deionized water thrice.
16. Transfer the organic layer to an Erlenmeyer flask and addanhydrous magnesium sulphate for drying.
17. Filter and transfer the organic layer by using a funnel with filterpaper to a round bottom flask.
18. Remove the solvent under reduced pressure by using a rotaryevaporator.
19. Purify the crude product by column chromatography usingsilica gel and a mixture of petroleum ether/ethyl acetate77:23. Removing the solvent under reduced pressure using arotary evaporator gives methylumbelliferyl (2R)-
Screening for Enantioselective Lipases 59

methyldecanoate (0.299 g, 58%) as a white solid. Optical rota-tory power::mp 37.0–38.5�C; [α]D20 ¼ -28.0 (c ¼ 1.0,CHCl3); TLC: Rf ¼ 0.38 (petroleum ether/ethyl acetate,7:3); 1H NMR (600 MHz, CDCl3) δ ¼ 0.89 (t, J ¼ 6.8 Hz,3H, 10-H),1.21–1.47 (m, 12H, 6 � decanoyl CH2) 1.31 (d,J ¼ 6.9 Hz, 3H, 2-CH3), 1.53–1.64 (m, 1H, 3-Ha),1.77–1.86 (m, 1H, 3-Hb), 2.44 (s, 3H, 40-CH3), 2.71 (ddq,J ¼ 7.0, 7.0, 6.9 Hz, 1H, 2-H), 6.27 (s, 1H, 30-H), 7.05 (dd,J ¼ 8.7, 2.3 Hz, 1H, 60-H), 7.09 (d, J ¼ 2.3 Hz, 1H, 80-H),7.60 (d, J ¼ 8.6 Hz, 1H, 50-H); 13C NMR (151 MHz,CDCl3) δ ¼ 14.11 (C-10), 16.89 (2-CH3), 18.74 (40-CH3),22.67 (decanoyl CH2), 27.21 (decanoyl CH2), 29.25 (decan-oyl CH2), 29.46 (decanoyl CH2), 29.50 (decanoyl CH2),31.85 (decanoyl CH2), 33.68 (C-3), 39.68 (C-2), 110.43(C-80), 114.46 (C-30), 117.72 (arom. C), 118.11 (C-60),125.31 (C-50), 151.91 (arom. C), 153.36 (arom. C), 154.21(arom. C), 160.50 (20), 174.71 (1); IR (ATR film): v ¼ 2,959,2,920, 2,853, 1,758, 1,725, 1,616, 1,573, 1,501, 1,466,1,440, 1,418, 1,387, 1,368, 1,327, 1,261, 1,227, 1,145,1,129, 1,116, 1,102, 1,066, 1,039, 1,018, 981, 939, 924,896, 876, 860, 800, 748, 721, 705, 683, 664, 605, 580,535, 520; GC-MS (EI, 70 eV): m/z (%) ¼ 344 (10%), 177(100%), 148 (50%), 112 (20%), 85 (45%), 57 (40%)
20. Using (S)-2-methyldecanoic acid as starting material in a step 1yields methylumbelliferyl 2-(S)-methyldecanoate as a whitesolid (66%): mp 38.5–39.0�C; Optical rotatory power:[α]D20 ¼ +26.7 (c ¼ 1.0, CHCl3); HRMS (ESI-TOF): calcdfor (C21H28O4K)
+ ([M + K]+) 383.1625, found 383.1628;the NMR, IR and GC-MS data are identical to its enantiomer(R)-methylumbelliferyl 2-methyldecanoate.
3.2.4 Fluorimetric
Screening with Chiral
Methylumbelliferyl
2-Methyldecanoate
Preparation of Substrate
Stock Solutions
1. Dissolve 3.4 mg of methylumbelliferyl 2-(R)-methyldecanoatein 1 mL DMSO to obtain a 10 mM stock solution. Use a1.5 mL Eppendorf Safe Lock Tube™ as vessel.
2. Transfer 100 μL of the 10 mM methylumbelliferyl 2-(R)-methyldecanoate stock solution to an empty 1.5 mL Eppen-dorf Safe Lock Tube™ and add 900 μL of DMSO to obtain a1 mM stock solution.
3. Dissolve 3.4 mg of methylumbelliferyl 2-(S)-methyldecanoatein 1 mL DMSO to obtain a 10 mM stock solution. Use a1.5 mL Eppendorf Safe Lock Tube™ as vessel.
4. Transfer 100 μL of the 10 mM methylumbelliferyl 2-(S)-methyldecanoate stock solution to an empty 1.5 mL Eppen-dorf Safe Lock Tube™ and add 900 μL of DMSO to obtain a1 mM stock solution.
60 Thomas Classen et al.

5. Prepare six 4-MU in DMSO stock solutions with a concentra-tion of 0.125 mM, 0.25 mM, 0.5 mM, 0.75 mM, 1.0 mM and1.25 mM in 1.5 mL Eppendorf Safe Lock Tubes™.
6. All stock solutions can be stored at -20�C for at least 2 months.
Performing the
Enantioselectivity Assay
1. Pre-mix 100 μL screening buffer, 15 μLDMSO (Note 14) and5 μL of (R)-methylumbelliferyl 2-methyldecanoate 1 mMstock solution per reaction in, e.g., a 1.5 mL, 2 mL or 15 mLtube and vortex thoroughly.
2. Pre-mix 100 μL screening buffer, 15 μLDMSO (Note 14) and5 μL of (S)-methylumbelliferyl 2-methyldecanoate 1 mM stocksolution per reaction in, e.g., a 1.5 mL, 2 mL or 15 mL tubeand vortex thoroughly.
3. Set up the temperature of the spectrofluorometer at 30�C(Note 15).
4. Transfer 120 μL of each pre-mixed reaction mixture to separatewells of a black 96-well microtiter plate.
5. Prepare standard curve samples using 100 μL screening buffer,15 μL DMSO and each with 5 μL of the particular 4-MU stocksolutions in DMSO (0.0 mM [DMSO only], 0.125 mM,0.25 mM, 0.5 mM, 0.75 mM, 1.0 mM and 1.25 mM).
6. Start the separate reactions with both (R)-methylumbelliferyl2-methyldecanoate and (S)-methylumbelliferyl 2-methyldecanoate by adding 30 μL enzyme stock solution orbuffer in which the enzyme is dissolved (as blank) to therespective reaction mixtures and standard curve mixtures(Note 16). Mix thoroughly.
7. Follow the reaction for 30 min at 360 nm/465 nm (excita-tion/emission).
8. Calculate the standard curve by plotting the fluorescence versusthe final 4-MU concentrations in the wells. Ensure that there isa linear correlation.
9. Calculate the initial reaction velocity (linear range) by subtract-ing the blank and using the standard curve. Estimate the appar-ent E-value for each enzyme by dividing the initial velocity ofthe fast enantiomer by the initial velocity of the slow enantio-
mer: Eapp ¼ vfast enantiomer
vslow enantiomer(Note 17).
3.3 Colorimetric
Screening with Chiral
p-Nitrophenol (R)-
and (S)-2-
Methyldecanoate
The following synthesis can be carried out as described for chiral 4-methylumbelliferyl esters, but substituting 4-MU by p-NP toobtain the substrates for photometric screening [52]. These com-pounds have already been used in a high throughput fashion for thescreening of enantioselective lipases [41]. This method is based onthe quantification of p-nitrophenolate (p-NP) released during the
Screening for Enantioselective Lipases 61

hydrolysis of p-nitrophenyl acyl esters by lipolytic enzymes.The artificial p-NP substrate analogues are suitable for routineand accurate quantification of lipase activity using standard equip-ment usually available in biochemical laboratories. The p-NP ischromogenic with an absorption maximum at 410 nm and it canbe quantified continuously using a spectrophotometer. The p-NPester substrates are not water-soluble, therefore, they are dissolvedin organic solvents and then diluted with assay buffer. These lipidicsubstrates form micelles in solution the properties of which may bedrastically affected by the temperature and the preparation proce-dure. Therefore, it is recommended to prepare substrate emulsionsidentically for the purpose of reproducibility which is a critical issuewhen thousands of variants are compared. The major disadvantageof p-NP acyl ester substrates is their spontaneous hydrolysis underassay conditions requiring careful control of assay conditions (tem-perature and pH).
3.3.1 Synthesis of (R)-
and (S)-2-Methyldecanoic
Acid
1. The synthesis procedure for (R)- and (S)-2-methyldecanoicacid is described in Sect. 3.2.2.
3.3.2 Coupling of p-NP
to 2-Methyldecanoic Acid
1. 2-Methyldecanoic acid can also be esterified with p-NP usingthe same conditions as described for 4-MU (see Sect. 3.2.2).Instead of 4-methylumbelliferone use p-nitrophenol (250 mg,1.8 mmol, 1.2 eq.).
2. Analytical data: (R)-MU 2-MD: optical rotary power[α]D20 ¼ -28.0 (c ¼ 0.95, CHCl3, ee > 99%); 1H NMR(600 MHz, CDCl3) δ ¼ 0.88 (t, 3H, J ¼ 6.9 Hz, 10-H),1.31 (d, 3H, J ¼ 7.0 Hz, 2-CH3), 1.22–1.46 (m, 6 � CH2),1.52–1.62 (m, 1H, 3-Ha), 1.75–1.86 (m, 1H, 3-Hb), 2.72(ddq, 1H, J ¼ 7.0, 7.0, 7.0 Hz, 2-H), 7.24–7.29 (m, 2H),8.25–8.29 (m, 2H); 13CNMR (151MHz, CDCl3) δ ¼ 14.10,16.86, 22.67, 27.20, 29.24, 29.44, 29.48, 31.85, 33.63,39.72, 122.42, 125.18, 145.24, 155.69, 174.39; GC-MS(EI, 70 eV): m/z (%) ¼ 195 (18%), 169 (80%), 139 (25%),109 (43%), 85 (90%), 71 (75%), 57 (100%); IR (ATR film):v ¼ 3,120, 3,080, 2,925, 2,855, 1,763, 1,615, 1,593, 1,523,1,490, 1,462, 1,378, 1,345, 1,206, 1,159, 1,097, 1,012, 882,861, 746, 723, 689, 658; (S)-MU 2-MD: optical rotary power[α]D20 ¼ +28.0 (c ¼ 0.94, CHCl3, ee > 99%), NMR, IR andGC-MS data are identical to its enantiomer.
3.3.3 Colorimetric
Screening with Chiral
p-Nitrophenyl-2-
Methyldecanoate
Substrates [41, 50–53]
1. Dilute (R)-p-NP 2-MD substrate stock solution 20 fold withthe 12 assay buffer and vortex for 2 min.
2. Dilute (S)-p-NP 2-MD substrate stock solution 20 fold withthe assay buffer and vortex for 2 min.
3. Pipette enzyme sample into microplates (10–30 μL). The sameenzyme sample should be pipetted into two wells, one for
62 Thomas Classen et al.

assaying with (R)- and second for assaying with (S)-enantio-mer. Prepare the blank (non-enzymatic control) by addingbuffer in which the enzyme is dissolved to the reaction tubeor microplate well.
4. Set up the temperature of Vis spectrometer at 30�C (Note 18).
5. Fill one half of the microplate with (R)- and second half with(S)-substrate (100–200 μL) (Note 19). Place the plate into VISmicroplate spectrophotometer (plate reader). Set up a 5 s mix-ing step prior measurements, start and record A410nm each10–30 s over the time course of 30 min.
6. Prepare at least six standard solution of p-NP by diluting stan-dard stock solution of p-NP in the assay buffer in a range of0.05–0.5 mg/mL under the assay conditions. Measure theA410nm of p-NP dilutions. Prepare the standard curve by plot-ting the A410nm versus the p-NP concentration. Ensure thatthere is a linear correlation.
7. Subtract the absorbance of the blank from the measured valuesfor the enzyme samples and convert the A410nm into enzymeactivity using the standard curve.
8. Estimate the apparent E-value for each enzyme by dividing theinitial velocity of the fast enantiomer by the initial velocity of
the slow enantiomer: Eapp ¼ vfast enantiomer
vslow enantiomer(Note 17).
3.4 Adrenaline
Assay [44]
The adrenaline assay is used for the simultaneous lipase activitymeasurement towards a range of different commercially availableesters substrates (Table 2). This assay may also be used for highthroughput screening, if suitable substrates are available. The pro-ducts released by the hydrolytic activity of lipases initiate a sequenceof chemical reactions that finally result in the formation of a chro-mogenic compound which can be quantified spectrophotometri-cally in a 96-well microtiter plate format.
In general, natural lipase substrates can be used for the adrena-line assay, but they should be polyols, so that the lipolytic activityresults in the formation of 1,2-diols which are subsequently oxi-dised with periodate. The remaining periodate is then back-titratedwith adrenaline to give a red coloured adrenochrome product withan absorption maximum at 490 nm. If both enantiomers of a polyolacetate substrate are available [as, e.g., for (R)-(+)-dihydro-5-(hydroxymethyl)-2(3H)-furanone and (S)-(+)-dihydro-5-(hydro-xymethyl)-2(3H)-furanone (Table 2)], this assay can also be usedfor screening of enantioselective lipases.
1. Set up the temperature of VIS spectrometer at 37�C.
2. Mix 10 μL (R)-substrate with 10 μL NaIO4 and 80 μL ofenzyme solution in microplate and incubate for 60 min at
Screening for Enantioselective Lipases 63

37�C. Prepare the blank (non-enzymatic control) by addingbuffer in which the enzyme is dissolved to the reaction tube ormicroplate well.
3. Mix 10 μL (S)-substrate with 10 μL NaIO4 and 80 μL ofenzyme solution in a microplate and incubate for 60 min at37�C. Prepare the blank (non-enzymatic control) by addingbuffer in which the enzyme is dissolved in the reaction tube orin the microplate well.
4. Add 10 μL adrenaline solution into each well and incubate for5 min at 26�C.
5. Measure the absorbance at 490 nm.
6. Subtract the absorbance of the blank from the measured values.
7. Estimate the apparent E-value for each enzyme by dividing theinitial velocity of the fast enantiomer by the initial velocity of
the slow enantiomer: Eapp ¼ vfast enantiomer
vslow enantiomer(Note 17).
3.5 Quick E
Method [33]
The Quick E method was developed for the fast determination ofenantioselectivity of lipases. It is based on the hydrolysis of a pureenantiomer substrate in the presence of a reference substrate thatmust not be enantiomerically pure [54]. The pure enantiomersubstrate and the reference substrate must be detectable simulta-neously in the same solution. Colorimetric assays with pure (S)- and(R)-p-NP 2-phenylpropanoate, and resorufine tetradecanoate as areference substrate, were performed with several lipases [54]. Thep-nitrophenolate and resorufine can be detected spectrophotomet-rically at 404 nm and 572 nm, respectively, thus providing initialrates of hydrolysis of each enantiomer. Principally, by performingtwo measurements, one with a mixture of (S)-p-NP 2-PP andresorufine tetradecanoate and the second one with (R)-p-NP 2-PP and resorufine tetradecanoate, the enantioselectivity for bothreactions can be calculated using Eqs. (1) and (2) [33]. By dividingthese two enantioselectivities, a Quick E-value can be calculated(Eq. (3); [33]). Such simulated competition between enantiomericand reference substrates results in better agreement of Quick E-values with true E-values than estimated E-values with true E-values, as demonstrated, e.g., for lipases of Pseudomonas cepacia(true and Quick E-values ¼ 29) and Candida rugosa (true andQuick E-values ¼ 3.5) [33]. By combining the pH indicator anda resorufine acetate ester as the reference substrate, the Quick Emethod was successfully used for measuring diastereoselectivity oflipases with methyl trans-2-benzyloxy-1,3-dioxolane-4-carboxyl-ate isomers [33].
E1 ¼ Rð Þ‐substratereference
selectivity ¼reaction rate R‐enantiomerð Þconcentration R‐enantiomerð Þ
reaction rate reference substrateð Þconcentration reference substrateð Þ
ð1Þ
64 Thomas Classen et al.

E2 ¼ Sð Þ‐substratereference
selectivity ¼reaction rate S‐enantiomerð Þconcentration S‐enantiomerð Þ
reaction rate reference substrateð Þconcentration reference substrateð Þ
ð2Þ
EQuick ¼ E1
E2¼
Rð Þ‐substratereference selectivity
Sð Þ‐substratereference selectivity
¼ Rð Þ‐substrateSð Þ‐substrate selectivity ð3Þ
1. Add 0.5 mL of (S)-p-NP 2-PP substrate solution and 0.5 mL ofreference substrate solution into 9 mL of assay buffer drop wiseand vortex 2–3 min until emulsion is clear (Note 20).
2. Add 0.5 mL of (R)-p-NP 2-PP substrate solution and 0.5 mLof reference substrate solution into 9 mL of assay buffer dropwise and vortex 2–3 min until emulsion is clear.
3. Pipette enzyme sample into microplates (10–30 μL). The sameenzyme sample should be pipetted into two wells, one forassaying with (R)- and second for assaying with (S)-enantio-mer. Prepare the blank (non-enzymatic control) by adding thebuffer in which enzyme sample is dissolved to the microplate.Add the assay buffer only (without the substrate) to the micro-plate well with the enzyme sample and measure the intrinsicabsorbance.
4. Set up the temperature of spectrophotometer at 25�C.
5. Add 180 μL substrate emulsion [containing (S)- and referencesubstrates] in microplate and measure the increase in absor-bance at 404 nm and 572 nm at 25�C for 30 min with steps of15 s.
6. Add 180 μL substrate emulsion (containing (R)- and referencesubstrates) in microplate and measure the increase in absor-bance at 404 nm and 572 nm at 25�C for 30 min with steps of15 s.
7. Subtract the absorbance of the blank and intrinsic enzymeabsorbance from the sample. Enantiomeric ratio for (R)- and(S)-enantiomer separately is calculated using Eqs. (1) and (2),respectively. Quick E enantiomeric ratio is calculated usingEq. (3).
4 Notes
1. pH of buffers may change with temperature; hence, for mea-suring temperature optima, use buffers having their pHadjusted accordingly.
Screening for Enantioselective Lipases 65
2. Alternatively, dry argon can be used instead of dry nitrogen.
3. Stock solution is stable at �20�C for at least 2 months
4. NaIO4 solution in water should be prepared freshly.
5. Sodium phosphate buffer may be used depending on optimalstability and activity of enzyme. Do not use buffer that isoxidised with NaIO4, e.g. Tris or triethanol amine buffers.
6. The spontaneous hydrolysis of substrates can result in itsdecreased concentration upon long term storage of plates.
7. To increase the probability to find lipase-producing clones onecan prepare several tributyrin agar plate replicas from one mas-ter plate after overnight incubation. Each replica plate may thenbe incubated at a different temperature, for example, 4�C,37�C and 50�C in order to detect lipases with different tem-perature optima.
8. Bacteria take up and accumulate pink coloured rhodamine Bwhich is not fluorescent in the absence of free fatty acids.
9. To prevent damaging effects of UV light, apply UV radiationonly for a short time (a few sec) if you want to propagate theclones from the same plate afterwards.
10. CAUTION: When adding the dry ice too fast, acetone will bespilled due to the released carbon dioxide.
11. Since the following step has to be carried out under inertconditions, a Schlenk flask can facilitate flushing with drynitrogen.
12. Check the conversion of the starting material by thin layerchromatography.
13. 2-Methyldecanoic acid can hardly be visualised by using ceriumammonium molybdate stain [10 g Ce(SO4)2 · 4 H2O, 25 gmolybdophosphoric acid, 60 mL conc. H2SO4, 940 mL H2O]for thin layer chromatography. For identifying fractions con-taining 2-methyldecanoic acid, GC-MS analysis can be useful.
14. We could observe a higher stability of different p-nitrophenyland methylumbelliferyl esters in buffer in presence of DMSO.
15. Adjust the temperature to the enzymes to be tested. For hightemperatures it is suitable to incubate the reactions in an incu-bator and interrupt the incubation for short measurements atlower temperatures. We incubated reactions at temperatures upto 65�C.
16. By adding enzyme solution to the standard curve mixtures thefluorescence of the enzyme will be included in the measure-ments. If the fluorescence of the enzyme is low also the enzymesolution buffer can be added in order to save enzyme. Further-more, please consider that the fluorescence of 4-MU is pH-dependent. Ensure not to have high pH deviations.
66 Thomas Classen et al.

17. The E-value is defined as E ¼ kcat=KMð Þent�1
kcat=KMð Þent�2under competitive
conditions, while the apparent E-value is determined undernon-competitive conditions. The mere quotient of the initialconversion rates for both enantiomers is a simplification, whichdoes not take into account effects occurring from concentra-tion effects or competition (see Sect. 1.3).
18. The assay can be performed at temperatures up to 80–90�C,although the spontaneous hydrolysis of the substrate at highertemperatures is significant.
19. For the sake of reproducibility the same variant should beassayed with both enantiomers in the same plate.
20. Such an emulsion remains stable for 2–3 h.
References
1. Jaeger K-E, Dijkstra BW, Reetz MT (1999)Bacterial biocatalysts: molecular biology,three-dimensional structures, and biotechno-logical applications of lipases. Annu RevMicro-biol 53:315–351
2. Jaeger K-E, Eggert T (2002) Lipases for bio-technology. Curr Opin Biotechnol 13(4):390–397
3. Hausmann S, Jaeger K-E (2010) Lipolyticenzymes from bacteria. In: Timmis KN (ed)Handbook of hydrocarbon and lipid microbi-ology. Springer, Heidelberg, pp 1099–1126
4. Barbayianni E, Kokotos G (2012) Biocatalyzedregio- and chemoselective ester cleavage: syn-thesis of bioactive molecules. ChemCatChem 4(5):592–608
5. Fischer T, Pietruszka J (2010) Key buildingblocks via enzyme-mediated synthesis. TopCurr Chem 297:1–43
6. Chang SW, Shaw JF (2009) Biocatalysis for theproduction of carbohydrate esters. N Biotech-nol 26(3–4):109–116
7. Lambusta D et al (2003) Application of lipasecatalysis in organic solvents for selective protec-tion–deprotection of bioactive compounds. JMol Catal B: Enzym 22(5):271–277
8. Nicolosi G et al (1999) Biocatalytic process forthe preparation of 3-O-acyl-flavonoids. WOPatent 9966062
9. Pietruszka J, Simon RC (2009) Chemoenzy-matic synthesis of (protected) psymberic acid.Eur J Org Chem 2009(21):3628–3634
10. Bodalo A et al (2009) Screening and selectionof lipases for the enzymatic production of poly-glycerol polyricinoleate. Biochem Eng J 46(2):217–222
11. Steenkamp L, Brady D (2003) Screening ofcommercial enzymes for the enantioselectivehydrolysis of R,S-naproxen ester. EnzymMicrob Technol 32(3–4):472–477
12. Jaeger KE et al (2001) Directed evolution andthe creation of enantioselective biocatalysts.Appl Microbiol Biotechnol 55(5):519–530
13. Liebeton K et al (2000) Directed evolution ofan enantioselective lipase. Chem Biol 7(9):709–718
14. Handelsman J (2004) Metagenomics: applica-tion of genomics to uncultured microorgan-isms. Microbiol Mol Biol Rev 68(4):669–685
15. Lorenz P et al (2002) Screening for novelenzymes for biocatalytic processes: accessingthe metagenome as a resource of novel func-tional sequence space. Curr Opin Biotechnol13(6):572–577
16. Voget S et al (2003) Prospecting for novelbiocatalysts in a soil metagenome. Appl Envi-ron Microbiol 69(10):6235–6242
17. Chow J et al (2012) The metagenome-derivedenzymes LipS and LipT increase the diversity ofknown lipases. PLoS One 7(10), e47665
18. Liebl W et al (2014) Alternative hosts for func-tional (meta)genome analysis. Appl MicrobiolBiotechnol 98(19):8099–8109
19. Chusacultanachai S, Yuthavong Y (2004) Ran-dom mutagenesis strategies for construction oflarge and diverse clone libraries of mutatedDNA fragments. Methods Mol Biol270:319–334
20. Reigstad LJ, Bartossek R, Schleper C (2011)Preparation of high-molecular weight DNAand metagenomic libraries from soils and hotsprings. Methods Enzymol 496:319–344
Screening for Enantioselective Lipases 67

21. Bornscheuer UT (2002) Methods to increaseenantioselectivity of lipases and esterases. CurrOpin Biotechnol 13(6):543–547
22. Hoebenreich S et al (2015) Speeding updirected evolution: combining the advantagesof solid-phase combinatorial gene synthesiswith statistically guided reduction of screeningeffort. ACS Synth Biol 4:317–331
23. Franken B, Jaeger KE, Pietruszka J (2010)Screening for enantioselective enzymes. In:Timmis KN (ed) Handbook of hydrocarbonand lipid microbiology. Springer, Heidelberg,pp 2860–2876
24. Jaeger KE, Kovacic F (2014) Determination oflipolytic enzyme activities. Methods Mol Biol1149:111–134
25. Ganske F, Bornscheuer UT (2005) Lipase-catalyzed glucose fatty acid ester synthesis inionic liquids. Org Lett 7(14):3097–3098
26. Reetz MT et al (2001) A GC-based method forhigh-throughput screening of enantioselectivecatalysts. Catal Today 67(4):389–396
27. Pirkle WH, Hoover DJ (1982) NMR chiralsolvating agents. Top Stereochem 13:263–331
28. Goering HL, Eikenberry JN, Koermer GS(1971) Tris [3-(trifluoromethylhydroxymethy-lene)-D-camphorato] europium (III). Chiralshift reagent for direct determination of enan-tiomeric compositions. J Am Chem Soc 93(22):5913–5914
29. Reetz MT et al (1999) A Method for high-throughput screening of enantioselective cata-lysts. Angew Chem Int Ed Engl 38(12):1758–1761
30. Schrader W et al (2002) Second-generationMS-based high-throughput screening systemfor enantioselective catalysts and biocatalysts.Can J Chem 80(6):626–632
31. Tielmann P et al (2003) A practical high-throughput screening system for enantioselec-tivity by using FTIR spectroscopy. Chem Eur J9(16):3882–3887
32. Reetz MT et al (2002) A practical NMR-basedhigh-throughput assay for screening enantiose-lective catalysts and biocatalysts. Adv SynthCatal 344(9):1008–1016
33. Kazlauskas RJ (2006) Quantitative assay ofhydrolases for activity and selectivity usingcolor changes. In: Reymond J (ed) Enzymeassays. Wiley-VCH Verlag GmbH & Co.KGaA, pp 15–39
34. Trapp O (2007) Boosting the throughput ofseparation techniques by “multiplexing”.Angew Chem Int Ed Engl 46(29):5609–5613
35. Becker S et al (2005) A generic system for theEscherichia coli cell-surface display of lipolyticenzymes. FEBS Lett 579(5):1177–1182
36. Kugimiya W et al (1986) Molecular cloningand nucleotide sequence of the lipase genefrom Pseudomonas fragi. Biochem BiophysRes Commun 141(1):185–190
37. Kouker G, Jaeger K-E (1987) Specific and sen-sitive plate assay for bacterial lipases. Appl Envi-ron Microbiol 53(1):211–213
38. Janes LE, Lowendahl AC, Kazlauskas RJ(1998) Quantitative screening of hydrolaselibraries using pH indicators: identifying activeand enantioselective hydrolases. Chem Eur J 4(11):2324–2331
39. Bottcher D, Bornscheuer UT (2006) High-throughput screening of activity and enantios-electivity of esterases. Nat Protoc 1(5):2340–2343
40. Arnold FH (1998) Design by directed evolu-tion. Acc Chem Res 31(3):125–131
41. Reetz MT et al (1997) Creation of enantiose-lective biocatalysts for organic chemistry byin vitro evolution. Angew Chem Int Ed Engl36(24):2830–2832
42. Dolinsky VW et al (2004) Regulation of theenzymes of hepatic microsomal triacylglycerollipolysis and re-esterification by the glucocorti-coid dexamethasone. Biochem J 378(Pt3):967–974
43. Jacks TJ, Kircher HW (1967) Fluorometricassay for the hydrolytic activity of lipase usingfatty acyl esters of 4-methylumbelliferone. AnalBiochem 21(2):279–285
44. Fluxa VS, Wahler D, Reymond J-L (2008)Enzyme assay and activity fingerprinting ofhydrolases with the red-chromogenic adrena-line test. Nat Protoc 3(8):1270–1277
45. Reetz MT et al (2000) Circular dichroism as adetection method in the screening of enantio-selective catalysts. Chirality 12(5–6):479–482
46. Faber K (2011) Biotransformations in organicchemistry: a textbook. Springer
47. Darley DJ et al (2009) Synthesis and use ofisotope-labelled substrates for a mechanisticstudy on human α-methylacyl-CoA racemase1A (AMACR; P504S). Org Biomol Chem 7(3):543–552
48. Neises B, Steglich W (1978) Simple methodfor the esterification of carboxylic acids.Angew Chem Int Ed Engl 17(7):522–524
49. Wahler D et al (2004) Adrenaline profilingof lipases and esterases with 1,2-diol andcarbohydrate acetates. Tetrahedron 60(3):703–710
50. Reetz MT (2006) High-throughput screeningsystems for assaying the enantioselectivity ofenzymes. In: Reymond J (ed) Enzyme assays.Wiley-VCH Verlag GmbH & Co. KGaA,pp 41–76
68 Thomas Classen et al.

51. Winkler UK, Stuckmann M (1979) Glycogen,hyaluronate, and some other polysaccharidesgreatly enhance the formation of exolipaseby Serratia marcescens. J Bacteriol 138(3):663–670
52. Franken B, Jaeger KE, Pietruszka J (2010)Protocols to screen for enantioselective lipases.In: Timmis KN (ed) Handbook of hydrocar-bon and lipid microbiology. Springer, Heidel-berg, pp 4581–4586
53. Reetz MT et al (2007) Learning from directedevolution: further lessons from theoreticalinvestigations into cooperative mutationsin lipase enantioselectivity. Chembiochem8(1):106–112
54. Janes LE, Kazlauskas RJ (1997) Quick E. A fastspectrophotometric method to measure theenantioselectivity of hydrolases. J Org Chem62(14):4560–4561
Screening for Enantioselective Lipases 69

Use of Bacterial Polyhydroxyalkanoates in Protein DisplayTechnologies
Iain D. Hay, David O. Hooks, and Bernd H.A. Rehm
Abstract
Protein display and immobilization are powerful tools used in industrial biocatalysts, bioremediation,biomolecule screening and purification, as well as biosensor applications. Immobilization can aid in thestability and function of a protein and can allow its recovery and potential reuse. Traditional proteinimmobilization techniques involving entrapment or non-covalent interactions between the protein andsupport materials are susceptible to leaching and often require additional cross-linking steps; which may becostly, potentially toxic and may negatively affect the function of the protein. All of these approaches requiremultiple steps to produce, isolate, and immobilize the protein of interest. Here we present protocols for thein vivo production of a protein of interest covalently immobilized on the surface of a bio-polyester resin in asingle step. The steps involved in vector construction, protein/bead production, and isolation are explainedand outlined.
Keywords: Polyhydroxyalkanoate, Protein immobilization
1 Introduction
Over the past few decades, the immobilization of functionalproteins to solid support materials has become a powerful tech-nique used in various medical and industrial applications. Enzymeimmobilization is widely employed to increase the stability and/orkinetics of enzymes for use in industrial biocatalyst applications aswell as bioremediation applications. The immobilization of ligand-binding domains allows the simple purification of, or removal ofdiverse molecules through affinity chromatography. Furthermorethe immobilization of functional proteins often allows their recov-ery and reuse. More recently the immobilization of enzymes andbinding domains has led to various emerging biosensor and micro-array technologies [1–5].
The manufacture of these immobilized proteins typicallyinvolves multiple discrete steps: the production of the functionalprotein by conventional cell-based techniques; the purification of
T.J. McGenity et al. (eds.), Hydrocarbon and Lipid Microbiology Protocols, Springer Protocols Handbooks, (2017) 71–86,DOI 10.1007/8623_2014_34, © Springer-Verlag Berlin Heidelberg 2014, Published online: 04 December 2014
71

the functional protein from the unwanted cellular material(potentially followed by a refolding step if the protein is producedas inclusion bodies); the production and preparation of the supportmaterial; and finally the immobilization of the protein to the sup-port. Typically a covalent attachment is desirable to prevent leach-ing or enzyme loss, this generally involves chemical cross-linking[4, 6, 7]. This conventional method has several potential draw-backs, primarily the cost and duration of the discrete steps as well asthe potentially costly and toxic chemicals used in the cross-linking/immobilization step. Furthermore, although some immobilizationtechniques can allow for a more defined orientation of a protein,many of the commonly used techniques result in a random distri-bution of protein orientations, which can potentially result in apopulation of the proteins having occluded binding/catalytic sitesand hence decreased functionality [8].
Here we present a technique for the in vivo production offunctional protein covalently attached to the surface of a sub-micrometer (50–500 nm diameter) bio-polyester (polyhydroxyalk-anoate, PHA) beads (Fig. 1). The protein production, supportmaterial (PHA) production, and immobilization occur in a singlebacterial fermentation step. The functional bio-polyester bead canbe isolated from the bacteria by straightforward lysis, centrifuga-tion, and washing steps. This technique exploits a naturally occur-ring process used by many bacterial species for carbon storage.Many bacteria can deposit PHA as spherical inclusions in the cyto-plasm; the key enzyme involved in this accumulation, the polyestersynthase, remains covalently attached to the emerging polyesterchain and the enzyme-polyester molecules self-assemble into grow-ing PHA beads inside the cell [9, 10]. By fusing functional proteinsto the polyester synthase (at the genetic level), it is possible toimmobilize proteins on these PHA beads in vivo. The entire meta-bolic pathway can be easily implemented in the industrial
Fig. 1 (a) Transmission electron microscopy of E. coli cells producing polyester beads. (b) Scanning electronmicroscopy of purified PHA beads. The black bar represents 1 μm
72 Iain D. Hay et al.

workhorse Escherichia coli through the addition of only three genesfrom the natural PHA-producing Ralstonia eutropha (Cupriavidusnecator): phaA, encoding a β-ketothiolase; phaB, encoding anacetoacetyl-CoA reductase; and phaC, the PHA-polyester synthaseto which the protein of interest is genetically fused. PhaA and PhaBdivert acetyl-CoA from the central metabolism to generate (R)-3-hydroxybutyryl-CoA which is subsequently polymerized by PhaCinto PHA [11–13].
This technique has successfully been used for the immobiliza-tion of various enzymes, binding domains, other functional pro-teins [14–28, 33], as well as various proprietary proteins (IDH andBHAR unpublished results). An advantage of this technique is thatPHA is a biodegradable and biocompatible material [29, 30].Where the potential for trace levels of endotoxin in the final prod-uct is a concern, a Gram-positive host can be used [23, 31].
2 Vector Construction
2.1 Notes Before
Commencing
l The vectors used for the generation of PhaC fusion proteins canbe obtained from PolyBatics Ltd. (pPOLY-N and pPOLY-C) orare available to academic research labs from the followingsources: pET14b:ZZ-PhaC [14] for fusion to the N-terminusof PhaC and pET-14b:PhaC-linker-GFP [20] for fusion to theC-terminus of PhaC.
l In order to produce protein-displaying beads, use the NdeI andSpeI sites to add your protein-coding region to the N-terminusof the polyester synthase (i.e., fusion via the C-terminus of yourprotein) (Fig. 1) (NB. If using pET14b:ZZ-PhaC, only NdeIshould be used and the direction of the ligated insert will need tobe checked) and XhoI and BamHI to add your protein-codingregion to the C-terminus of the polyester synthase (i.e., fusionvia the N-terminus of your protein). Utilizing the NdeI siteallows you to use the ATG site within the CATATG recognitionsite as the start codon. If you plan to attach to the C-terminus ofthe synthase (i.e., via the N-terminus of the antigen), it isrecommended to integrate a stop codon (TAA) before theBamHI site when amplifying or synthesizing your target anti-gen. Although there is a stop codon immediately after theBamHI site on the plasmid, utilizing this results in an additionalGly-Ser on the C-terminus.
l To generate a “dual fusion” (i.e., fusion to both the N- and C-termini of PhaC), the antigen should be cloned into the pPOLY-N and pPOLY-C (or pET14b:ZZ-PhaC and pET-14b:PhaC-linker-GFP) vectors independently and then the C-terminalencoding region of the fusion cut from the pPOLY-C (pET-14b:PhaC-linker-GFP) derived plasmid encoding your protein
Use of Bacterial Polyhydroxyalkanoates in Protein Display Technologies 73
via NotI and BamHI and ligated into the corresponding sites ofthe pPOLY-N (or pET14b:ZZ-PhaC) derived plasmid encodingyour protein (see Fig. 2c).
l It is recommended to confirm all final constructs by sequencingthe region of the plasmid containing the inserted antigen-codingregion. Commonly available “T7 promoter” and “T7 termina-tor” primers will sequence the N-terminal encoding andC-terminal encoding regions, respectively.
2.2 Reagents and
Equipment Required
l Plasmids containing phaC under the control of a T7 (or similar)promoter and restriction sites to allow ligation of your gene ofinterest in frame (see Sect. 2.1 for details)
l T4 DNA ligase and associated buffer(s)
l Restriction enzymes and associated buffers (NdeI, SpeI, XhoI,BamHI)
l Equipment for DNA agarose gel electrophoresis
l Commercial kit (or alternative) to isolate DNA fragments fromagarose gels
l Commercial plasmid isolation kit or any alternative
l Competent cells – general-purpose E. coli “cloning strain” (e.g.,XL1Blue, Top10, DH5α™)
l DNA encoding your protein of interest (commercially synthe-sized or amplified via PCR with appropriate restriction sites)
l LB agar plates with 75 μg/ml ampicillin
2.3 Protocol (Fig. 2) 1. Linearize 1–4 μg of the phaC containing vector with appropri-ate restriction enzymes.
l NdeI and SpeI for pPOLY-N (fusion to the N-terminus ofPhaC via the C-terminus of your protein)
l NdeI for pET14b:ZZ-PhaC (fusion to the N-terminus ofPhaC via the C-terminus of your protein)
l XhoI and BamHI for pPOLY-C or pET-14b:PhaC-linker-GFP (fusion to the C-terminus of PhaC via the N-terminusof your protein)
2. Gel purify the linearized vector (according to kit manufac-turer’s instructions).
3. Prepare your gene of interest by hydrolysis with the sameenzymes as above (gel purify if necessary).
74 Iain D. Hay et al.

Fig. 2 (a) Schematic representation of the cloning strategy to generate genetic fusions of enzymes (or otherproteins) to the N-terminus of PhaC using the pPOLY-N vector backbone (if using pET14b:ZZ-phaC, then onlythe NdeI site should be used and the direction of the insert will need to be confirmed). (b) Schematicdescription of the cloning strategy to generate genetic fusions to the C-terminus of PhaC using pPOLY-C orpET14b:PhaC-linker-GFP as backbones. (c) Schematic description of the cloning strategy to generate geneticdual antigenic fusions to PhaC from the constructs generated in A and B

4. Ligate your protein-encoding fragment into the vector accord-ing to the ligase manufacturer’s instructions or use thefollowing:
l 20 ng DNA of interest
l 50 ng of vector from step 1
l 400 cohesive end units of T4 DNA ligase
l T4 DNA ligase buffer diluted to 1�l H2O to final volume 20 μll Incubate for at least 2 h at 16�C
5. Transform 2–10 μl of the ligation mixture into competent cells(general cloning strain) following the manufacturer’sinstructions.
6. Plate transformed cells on LB agar plates containing 75 μg/mlampicillin and incubate at 37�C overnight.
7. Screen colonies for correct ligation by restriction analysis,colony PCR, or sequencing.
8. Create a stock of correct strains and isolate plasmids with acommercial plasmid isolation kit.
3 Protein and PHA Bead Production
3.1 Reagents and
Equipment Required
l Plasmid containing phaA and phaB: pMCS69 [32] or pPOLY-HELP available from PolyBatics Ltd.
l Competent E. coli cells – production strains must be lysogenicfor λ-DE3, which encodes T7 RNA polymerase under the con-trol of the lac UV5 promoter (e.g., BL21(DE3), T7 Express)
l Buffers for making competent or electrocompetent cells (anycommon method will work)
l LB agar plates with 34 μg/ml chloramphenicol
l LB agar plates with 75 μg/ml ampicillin, 34 μg/ml chloram-phenicol, and 1% glucose
l 1 M IPTG
l 75 mg/ml ampicillin and 34 mg/ml chloramphenicol
l LB liquid medium
l Conical flasks (the total volume of the flask should be approxi-mately 5 times the volume of media contained in the flask toallow sufficient aeration)
l Orbital shaker at 25 �Cl Spectrophotometer for OD600nm measurement
76 Iain D. Hay et al.

3.2 Protocol:
Creating Your
Competent Production
Host
1. Transform competent cells (production strain, DE3) with thephaA and phaB containing plasmid.
2. Plate transformants on LB agar containing 34 μg/ml chloram-phenicol and incubate at 37�C overnight.
3. Isolate a single colony, confirm it contains the appropriateplasmid, and make a stock of this colony for long-term storage.
4. Make competent cells with this strain (remembering to includechloramphenicol when growing the cells).
3.3 Protocol: Protein
and PHA Bead
Production
1. Transform the competent cells harboring the phaA and phaBcontaining plasmid with your PhaC fusion protein-encodingvector generated in Sect. 2.
2. Plate on LB agar plates with 75 μg/ml ampicillin, 34 μg/mlchloramphenicol, 1% glucose and incubate overnight.
3. Select a few colonies and inoculate several precultures (LBcontaining 75 μg/ml ampicillin, 34 μg/ml chloramphenicol,and 1% glucose); incubate with shaking overnight at 37�C.
4. Inoculate new flasks (100 ml LB containing 75 μg/ml ampicil-lin, 34 μg/ml chloramphenicol, and 1% glucose in a 500 mlflask) with 1% of the overnight cultures. Incubate these flaskswith shaking (200–250 rpm) at 25�C.
5. When cultures reach an OD600nm of 0.3–0.5, induce them withthe addition of 1 mM IPTG (final concentration in the flask)and return to the 25�C shaker for an additional 40–48 h.
4 Bead Isolation (Fig. 3)
4.1 Notes Before
Commencing
l Several methods can be used for cell lysis. Mechanical methodssuch as French press or microfluidizer based systems tend toyield the best results, though sonication and chemical methodssuch as BugBuster® or B-Per® have been used successfully.
l The addition of 0.5 mg/ml lysozyme and DNase to the lysisbuffer followed by a 30-min incubation before disruption canhelp with cell lysis and separation of beads from cell debris.
l If PBS is not compatible with your protein of interest, then PBScan be substituted by most common buffers (though bufferscontaining strong reducing agents such as DTT should beavoided).
l If possible, best results are obtained by separating polyesterbeads from cellular debris over a glycerol step gradient centri-fuged at 100,000 � g for 2 h. If this high-speed centrifugation isnot feasible (lack of ultracentrifuge), then satisfactory results
Use of Bacterial Polyhydroxyalkanoates in Protein Display Technologies 77

Fig. 3 Schematic representation of the bead isolation strategy
78 Iain D. Hay et al.

have been obtained by using centrifugation at40,000–50,000 � g for 4–5 h. Beads will concentrate betweenthe two glycerol layers.
4.2 Reagents and
Equipment Required
l Centrifuge capable of spinning 100 ml at 5,000 g
l 10� phosphate buffered saline (PBS) (1.37 M NaCl, 27 mMKCl, 100 mM Na2HPO4, 18 mM KH2PO4)
l 1� PBS – sterilize by autoclaving
l 88% glycerol – 88% (v/v) glycerol, 10% 10� PBS, 2% H2O
l 44% glycerol – 44% (v/v) glycerol, 10% 10� PBS, 46% H2O
l Equipment for bacterial cell disruption (see Sect. 4.1)
l Centrifuge capable of spinning 10–30 ml at 100,000 � g (andtubes capable of sustaining 100,000 � g)
4.3 Protocol: Bead
Isolation
1. Harvest cells by centrifugation at 5,000 � g.
2. Resuspend cells in 0.5 volumes of PBS and lyse cells by yourpreferred method (see Sect. 4.1).
3. Centrifuge cell lysate at 4,000 � g for 30 min.
4. Discard supernatant (may be slightly cloudy).
5. Wash insoluble pellet in 40 ml PBS and centrifuge again at4,000 � g for 15 min.
6. Discard supernatant (may be slightly cloudy) and suspend PHAbead containing pellet into PBS to an approximately 10–20%slurry of PHA beads.
7. Fill 1/3 of a centrifuge tube with 88% glycerol and carefully addanother 1/3 of 44% glycerol on top of the 88% layer (youshould see a distinct interface between the layers).
8. Carefully add the bead suspension to the top of the glycerol.NB. To achieve maximum purity, it is advised that you splityour crude bead suspension between several tubes (less beadsper tube generally results in cleaner beads).
9. Centrifuge at 100,000 � g for 2 h (sufficient separation hasalso been achieved at 50,000 � g for 3 h, see Sect. 4.1).
10. You should see a layer of beads at the interface between the 44%and 88% glycerol layer and possibly a layer of un-lysed cells andcellular debris at the bottom of the tube.
11. Carefully pipette or scoop out the bead containing interphasebetween the 44% and 88% layer and add to a new tube.
Use of Bacterial Polyhydroxyalkanoates in Protein Display Technologies 79

12. Resuspend the beads (vortex or pipette) in ~50 ml of PBS andcentrifuge at 4,000 � g for 20 min. Discard the supernatant (itmay be slightly cloudy) and repeat this step twice more.
13. Weigh the resulting bead pellet and resuspend in sufficient PBSto achieve a 20% (w/v) bead suspension.
14. Store at 4�C.
5 Analysis of the Protein-Displaying Beads
5.1 SDS
Polyacrylamide Gel
Electrophoresis of
Beads and Protein
Densitometry (Fig. 4)
The amount of proteins on the beads can be routinely assessed bysubjecting the beads to conventional SDS polyacrylamide gel elec-trophoresis. Typically loading a few microliters of a 5% bead sus-pension on SDS-PAGE should provide a good indication of therelative amount of fusion protein (and contaminating proteins) onthe beads. Determining the specific immobilized PhaC fusion pro-tein concentration is challenging due to the immobilized nature ofthe proteins and the light-scattering effect of PHA granules duringspectroscopy; additionally the potential number of co-purifiedgranule-associated proteins can complicate this.
Fig. 4 An example of an SDS-PAGE analysis of isolated enzymes displaying PHA beads and the subsequentdensitometry, BSA standard, and calculations to determine how much enzyme is present on the beads (beadweights reported here are in wet weight; if dry weights are required, the representative sample can be freezedried and weighed)
80 Iain D. Hay et al.

Densitometry on protein bands resolved by SDS-PAGE allowsfor precise measurement of the PhaC fusion protein mass. Asimmobilization of an enzyme to a solid support matrix often hasan effect on its activity (beneficial or deleterious), it is important toassess enzymatic properties of an immobilized form to the solubleform of the enzyme. Determining an accurate concentration ofPhaC fusion protein allows for calculation of specific enzyme activ-ity which can then be directly compared to the activity of the freeenzyme.
5.1.1 Reagents and
Equipment Required
l 3� protein denaturing solution (800 mg SDS, 3.7 mg EDTA,0.5 mg bromophenol blue all dissolved in 2 ml of β-mercap-toethanol, 4 ml of glycerol, and 4 ml of 100 mM Tris–HCl, pH6.8) – most common SDS-PAGE loading dyes should also work
l BSA stock solution (10 mg of BSA in 1 ml of PBS)
l Equipment for SDS-PAGE
l SDS-PAGE gels (typically 4% stacking and 10% separating gelsthough this can be modified to suit the MW of your fusionprotein)
l Coomassie blue stain (2.5 g Coomassie Brilliant Blue R-250, in450 ml methanol, 100 ml of acetic acid, and 450 ml H2O)
l Destaining solution (10% (v/v) acetic acid and 45 % (v/v)methanol, 45% (v/v) H2O)
l 7% v/v acetic acid in water
l Equipment to capture images of SDS-PAGE gels and software toanalyze gel images (e.g., Bio-Rad’s Gel Doc™ and ImageLab™)
5.1.2 Protocol:
SDS-PAGE and
Densitometry
1. Produce the PHA beads displaying the immobilized enzyme ofinterest and resuspend in PBS at a known concentration, typi-cally 20% (w/v) or 200 mg/ml (wet bead mass).
2. Dilute the PHA bead sample to a final concentration of0.9 mg/ml (wet bead mass) in PBS.
3. Serially dilute BSA stock solution with protein denaturingbuffer (1�) to concentrations of 5, 2, 1, and 0.5 ng/μl BSA.These standards can be stored at �20�C until required.
4. Add protein denaturing buffer (3�) at a ratio of 1:3 to thediluted PHA beads. Then heat PHA bead samples and BSAstandards at 95�C for 15 min to denature surface proteins anddissociate them from the PHA beads.
5. Pipette 10 μl samples containing 2–10 μg of PHA granules (wetweight) into a vertical SDS polyacrylamide mini gel.The amount of protein on the granules can vary markedlyaccording to the fusion partner; highly produced proteins will
Use of Bacterial Polyhydroxyalkanoates in Protein Display Technologies 81

need fewer beads (more dilutions) on the gel, whereas lowlevels of production will need more materials.
6. Pipette 10 μl of 5, 2, 1, and 0.5 ng/μl BSA standards intoseparate wells.
7. Run the SDS-PAGE at 150 V for 1 h.
8. Stain the gel with Coomassie blue stain for at least 30 min andsubsequently destain with destaining solution.
9. To ensure sufficient destaining for accurate densitometry, thegel should be further incubated overnight in 7% acetic acid.
10. Capture the gel image.
11. Measure the protein band intensity of the BSA standards andPhaC fusion protein bands using appropriate imaging software.
12. Create a standard curve of the BSA band intensities and use itto determine PhaC fusion protein concentration. A typicalexample may contain 24 ng protein from 6 μg of beads leadingto a protein density of 4 μg/mg beads. If only the amountof the functional protein is required, then the ratio of themolecular weight of the functional protein component to thetotal molecular weight of the fusion protein (functionalprotein + PhaC (64.3 kDa)) should be used for the calculation.
5.2 Protocol:
Determining Enzyme
Activity
1. Weigh enough 1.7 ml tubes for all samples.
2. Transfer 500 μl of 20% (w/v) PHA beads into 1.7 ml tubes andcentrifuge (3,400 � g, 4 min).
3. Discard the supernatant.
4. Briefly centrifuge (up to 3,400 � g) and discard residualsupernatant.
5. Reweigh the tubes and calculate wet PHA bead mass.
6. Multiply the wet PHA bead mass by the fusion protein propor-tion figure to calculate the fusion protein mass present in eachsample.
7. Samples of the free enzyme can be set up to correspond withthe amount of fusion protein present in the PHA bead samples.
8. Perform the appropriate enzyme activity assay and determineactivity (μmol/min) for both the free and immobilized enzyme(NB. The immobilized enzyme will typically need some kind ofshaking or mixing to prevent the beads from settling).
9. The amount of protein as determined by densitometry(remembering to factor in the molecular weight ratio ofenzyme to enzyme + PhaC) can then be used to determinethe amount of only the fusion partner, i.e., only the enzyme,in order to determine the specific activity. This can be directlycompared to the free enzyme activity.
82 Iain D. Hay et al.

5.3 Assessing the
Levels of PHA
Production and Yield
Fusing additional protein sequence to the N- and/or C-termini ofPhaC can have an effect on the quantity of PHB synthesized by theproduction host. GCMS allows the measurement of PHB produc-tion down to trace amounts. Quantifying the amount of PHAin vivo is a useful indication of PhaC activity and PHA yield.
5.3.1 Reagents and
Equipment Required
l Methanolic sulfuric acid: Measure 85 ml of methanol and placein a beaker on ice to cool. Measure 15 ml of sulfuric acid andslowly add to the methanol while it is on ice. Caution: thisreaction is extremely exothermic.
l Chloroform (containing 105 μg/ml undecane as an internalstandard): Add 14.2 μl of undecane to 100 mL of chloroformand mix.
l Screw-capped glass tubes. The tube, lid, and gasket must be ableto sustain the chloroform and methanolic sulfuric acid at 100�Cwithout any leakage.
l 100�C oil bath or similar.
l Equipment for GCMS analysis. An example setup would be aShimadzu GC-17A gas chromatograph equipped with a RestekRXi-5ms GC column (30 m � 0.25 mm ID � 0.25 μm filmthickness) and a QP5050A quadrupole mass spectrometer todetect the PHA methyl esters. Injection volume is 1 μl, split is20:1, and helium (1 ml/min) is used as the carrier gas. Thetemperature of the injector is set at 220�C and the detectortemperature is 250�C. The temperature program used is 35�Cfor 5 min, a temperature ramp of 5�C/min to 100�C, and finallya ramp of 15�C/min to 285�C. In these conditions the retentiontime of β-hydroxybutyric acid methyl ester is 9.10 min.
5.3.2 Protocol: Assessing
the Levels of PHA
Production and Yield
1. Prepare 50 ml of bacterial PHA bead culture, and after 48 h ofcultivation, pellet the cells by centrifugation (5,000 � g, 20min).
2. Resuspend the cell pellet in 5 ml PBS (pH 7.4) and freeze for atleast 12 h at �80�C or for 10 min in liquid nitrogen.
3. Freeze dry the frozen cell suspension for at least 12 h.
4. Grind the dry cell pellet into a fine powder.
5. Weigh 10–30 mg of the powdered cell pellet into a screw capglass test tube recording the exact weight.
6. Prepare the PHB standards of 1, 2, 5, 10, and 15 mg in thesame way.
7. Add 2 ml chloroform containing internal standard and 2 ml15% methanolic sulfuric acid and vortex mix for 1 min.
8. Place the samples in a 100�C oil bath for 5 h and then cool in anice bath to room temperature. This reaction breaks down thePHB into β-hydroxybutyric acid methyl ester.
Use of Bacterial Polyhydroxyalkanoates in Protein Display Technologies 83
9. Add 2 ml water and vortex mix for 1 min and then leave to sitfor 5 min allowing the phases to separate.
10. Use a glass Pasteur pipette to remove the lower, organic phase.Expel the pipette as it is inserted through the upper layer toensure the aqueous phase does not enter the pipette tip.
11. Filter the collected organic phase containing β-hydroxybutyricacid methyl ester through cotton wool to remove any remain-ing particulates.
12. At this point the sample can be stored at �80�C until requiredfor analysis.
13. Subject the samples to GCMS analysis using the methoddescribed above or similar.
14. Position the standards at the beginning, middle, and end of theGCMS analysis runs.
15. Divide all PHB values by undecane internal standard peak areato account for differences in sample evaporation.
16. Average the standard runs and create a standard curve.
17. Calculate the PHB amount in each of the unknown samplesusing the standard curve and then divide by the initial dry cellweight to determine PHB as a percent of dry cell weight.
18. The deduced level of PHA in your cells can then be related tothe amount of material you recovered to give an idea of theyield of the bead isolation.
6 Troubleshooting
6.1 Excessive
Contaminating Bands
on SDS-PAGE
The immobilization of some proteins can cause cellular proteins to“co-purify” with the beads more than others. In these cases, chang-ing the buffer used for lysis and washing can be beneficial; increas-ing the salt concentration and changing the pH are good startingpoints. The addition of low levels (0.05%) of Tween 20 can also bebeneficial in these cases.
6.2 Low Enzyme
Activity/Protein
Function
Each protein fused to the beads may perform differently. Someproteins will tolerate fusion to one terminus and not the other;thus switching the fusion site (i.e., via the protein’s N- orC-terminus) can often have beneficial effects on function of theimmobilized protein. Structural information (if known) about theprotein can often be used to guide decisions about the optimalfusion point. The addition of polypeptide linkers between thepolyester synthase and the protein of interest may help in optimiz-ing the level of protein function.
84 Iain D. Hay et al.

6.3 No Beads/
Inclusion Bodies at the
Bottom of the Glycerol
Gradient
Occasionally some proteins are so prone to aggregation duringproduction that the formation of inclusion bodies occurs beforethe immobilization of the proteins on growing PHA beads. In thesecases the proteins will typically form a proteinaceous inclusion bodypellet at the bottom of the glycerol gradient (this is easily identifieddue to its typically gray color compared to the typically white colorof the PHA beads). This can often be combated by lowering thetemperature during growth and/or modifying the time of IPTGinduction. Changing the strain of E. coli used for the productioncan also help in these cases (though the strain must still be lysogenicfor λ-DE3 to allow T7 expression). This is particularly useful whenthe protein of interest has disulfide bonds, which will typically notform in the E. coli cytosol. In these cases it is often beneficial to usestrains engineered to have more oxidizing cytosols (e.g., Origami™or SHuffle®) for bead production [33].
References
1. Cretich M, Damin F, Pirri G, Chiari M (2006)Protein and peptide arrays: recent trends andnew directions. Biomol Eng 23:77–88. doi:10.1016/j.bioeng.2006.02.001
2. Mateo C, Palomo JM, Fernandez-Lorente G,Guisan JM, Fernandez-Lafuente R (2007)Improvement of enzyme activity, stability andselectivity via immobilization techniques.Enzyme Microb Technol 40:1451–1463.doi:10.1016/j.enzmictec.2007.01.018
3. Sheldon RA (2007) Enzyme immobilization:the quest for optimum performance. Adv SyntCatal 349:1289–1307. doi:10.1002/adsc.200700082
4. Brena B, Gonzalez-Pombo P, Batista-Viera F(2013) Immobilization of enzymes: a literaturesurvey. Methods Mol Biol 1051:15–31.doi:10.1007/978-1-62703-550-7_2
5. Putzbach W, Ronkainen NJ (2013) Immobili-zation techniques in the fabrication ofnanomaterial-based electrochemical biosen-sors: a review. Sensors (Basel) 13:4811–4840.doi:10.3390/s130404811
6. Hanefeld U, Gardossi L, Magner E (2009)Understanding enzyme immobilisation. ChemSoc Rev 38:453–468. doi:10.1039/b711564b
7. Sheldon RA, van Pelt S (2013) Enzyme immo-bilisation in biocatalysis: why, what and how.Chem Soc Rev 42:6223–6235. doi:10.1039/c3cs60075k
8. Secundo F (2013) Conformational changes ofenzymes upon immobilisation. Chem Soc Rev42:6250–6261. doi:10.1039/c3cs35495d
9. Grage K, Jahns AC, Parlane N, Palanisamy R,Rasiah IA, Atwood JA, Rehm BH (2009)
Bacterial polyhydroxyalkanoate granules: bio-genesis, structure, and potential use as nano-/micro-beads in biotechnological and biomedi-cal applications. Biomacromolecules10:660–669. doi:10.1021/bm801394s
10. Draper JL, Rehm BH (2012) Engineering bac-teria to manufacture functionalized polyesterbeads. Bioengineered 3:203–208. doi:10.4161/bioe.19567
11. Rehm BH (2006) Genetics and biochemistryof polyhydroxyalkanoate granule self-assembly:the key role of polyester synthases. BiotechnolLett 28:207–213. doi:10.1007/s10529-005-5521-4
12. Rehm BH (2010) Bacterial polymers: biosyn-thesis, modifications and applications. Nat RevMicrobiol 8:578–592. doi:10.1038/nrmicro2354
13. Hooks DO, Venning-Slater M, Du J, RehmBH (2014) Polyhydroyxalkanoate synthasefusions as a strategy for oriented enzymeimmobilisation. Molecules 19:8629–8643.doi:10.3390/molecules19068629
14. Brockelbank JA, Peters V, Rehm BH (2006)Recombinant Escherichia coli strain produces aZZ domain displaying biopolyester granulessuitable for immunoglobulin G purification.Appl Environ Microbiol 72:7394–7397.doi:10.1128/AEM. 01014-06
15. Backstrom BT, Brockelbank JA, Rehm BH(2007) Recombinant Escherichia coli producestailor-made biopolyester granules for applica-tions in fluorescence activated cell sorting: func-tional display of the mouse interleukin-2 andmyelin oligodendrocyte glycoprotein. BMCBiotechnol 7:3. doi:10.1186/1472-6750-7-3
Use of Bacterial Polyhydroxyalkanoates in Protein Display Technologies 85

16. Grage K, Rehm BH (2008) In vivo productionof scFv-displaying biopolymer beads using aself-assembly-promoting fusion partner. Bio-conjug Chem 19:254–262. doi:10.1021/bc7003473
17. Jahns AC, Haverkamp RG, Rehm BH (2008)Multifunctional inorganic-binding beads self-assembled inside engineered bacteria. Biocon-jug Chem 19:2072–2080. doi:10.1021/bc8001979
18. Peters V, Rehm BH (2008) Protein engineer-ing of streptavidin for in vivo assembly of strep-tavidin beads. J Biotechnol 134:266–274.doi:10.1016/j.jbiotec.2008.02.006
19. Atwood JA, Rehm BH (2009) Protein engineer-ing towards biotechnological production ofbifunctional polyester beads. Biotechnol Lett31:131–137.doi:10.1007/s10529-008-9836-9
20. Jahns AC, Rehm BH (2009) Tolerance of theRalstonia eutropha class I polyhydroxyalkano-ate synthase for translational fusions to its Cterminus reveals a new mode of functional dis-play. Appl Environ Microbiol 75:5461–5466.doi:10.1128/AEM. 01072-09
21. Rasiah IA, Rehm BH (2009) One-step produc-tion of immobilized alpha-amylase in recombi-nant Escherichia coli. Appl Environ Microbiol75:2012–2016. doi:10.1128/AEM.02782-08
22. Grage K, Peters V, Rehm BH (2011) Recombi-nant protein production by in vivo polymerinclusion display. Appl Environ Microbiol77:6706–6709. doi:10.1128/AEM. 05953-11
23. Parlane NA, Grage K, Lee JW, Buddle BM,Denis M, Rehm BH (2011) Production of aparticulate hepatitis C vaccine candidate by anengineered Lactococcus lactis strain. Appl Envi-ron Microbiol 77:8516–8522. doi:10.1128/AEM. 06420-11
24. Blatchford PA, Scott C, French N, Rehm BH(2012) Immobilization of organophosphohy-drolase OpdA from Agrobacterium radiobacterby overproduction at the surface of polyesterinclusions inside engineered Escherichia coli.Biotechnol Bioeng 109:1101–1108. doi:10.1002/bit.24402
25. Parlane NA, Grage K, Mifune J, Basaraba RJ,Wedlock DN, Rehm BH, Buddle BM (2012)Vaccines displaying mycobacterial proteins on
biopolyester beads stimulate cellular immunityand induce protection against tuberculosis.Clin Vaccine Immunol 19:37–44. doi:10.1128/CVI. 05505-11
26. Hooks DO, Blatchford PA, Rehm BH (2013)Bioengineering of bacterial polymer inclusionscatalyzing the synthesis of N-acetylneuraminicacid. Appl Environ Microbiol 79:3116–3121.doi:10.1128/AEM.03947-12
27. Robins KJ, Hooks DO, Rehm BH, Ackerley DF(2013)Escherichia coliNemA is an efficient chro-mate reductase that can be biologically immobi-lized to provide a cell free system for remediationof hexavalent chromium. PLoS One 8:e59200.doi:10.1371/journal.pone.0059200
28. Chen S, Parlane NA, Lee J, Wedlock DN, Bud-dle BM, Rehm BH (2014) New skin test fordetection of bovine tuberculosis on the basis ofantigen-displaying polyester inclusions pro-duced by recombinant Escherichia coli. ApplEnviron Microbiol 80:2526–2535. doi:10.1128/AEM. 04168-13
29. Chen GQ, Wu Q (2005) The application ofpolyhydroxyalkanoates as tissue engineeringmaterials. Biomaterials 26:6565–6578.doi:10.1016/j.biomaterials.2005.04.036
30. Rehm BH (2007) Biogenesis of microbialpolyhydroxyalkanoate granules: a platformtechnology for the production of tailor-madebioparticles. Curr Issues Mol Biol 9:41–62
31. Mifune J, Grage K, Rehm BH (2009) Produc-tion of functionalized biopolyester granules byrecombinant Lactococcus lactis. Appl EnvironMicrobiol 75:4668–4675. doi:10.1128/AEM.00487-09
32. Amara AA, Rehm BH (2003) Replacement ofthe catalytic nucleophile cysteine-296 by serinein class II polyhydroxyalkanoate synthase fromPseudomonas aeruginosa-mediated synthesis ofa new polyester: identification of catalytic resi-dues. Biochem J 374:413–421. doi:10.1042/BJ20030431
33. Hay ID, Du J, Chen S, Burr N, Rehm BH(2015) Bioengineering bacteria to assemblecustom-made polyester affinity resins. ApplEnviron Microbiol. doi:10.1128/AEM.02595-14
86 Iain D. Hay et al.

Bacterial Secretion Systems for Use in Biotechnology:Autotransporter-Based Cell Surface Displayand Ultrahigh-Throughput Screeningof Large Protein Libraries
Karl-Erich Jaeger and Harald Kolmar
Abstract
In recent years, continuous progress was made in our understanding of bacterial secretion pathways and theapplication of protein secretion for biotechnology. Efficient protein export is a prerequisite for cost-effectivedownstream processing, and secretion of a protein of interest may also be useful for certain enzyme assays,for biotransformation reactions, and, in particular, for screening enzyme variants in libraries generated bydirected evolution. Cells that display a particular enzyme variant can be exposed to a broad spectrum ofdifferent chemical environments, can sustain a broad pH range, and can therefore allow one to probe thedesired target protein under defined conditions. In recent years, fluorescent-activated cell sorting (FACS) incombination with cell surface display has become a powerful tool for the activity-based ultrahigh-throughput screening of mutant proteins from large libraries. The below protocol provides the detaileddescription for the generation of protein libraries, E. coli cell surface display, and library screening usingmagnetic- and fluorescence-activated cell sorting technologies with an emphasis on activity and selectivityscreening of lipases and esterases.
Keywords: Autodisplay, Cell surface display, Esterases, High-throughput screen, Lipases, Proteinsecretion, Type V secretion pathway
1 Introduction
At present, numerous bacterial secretion pathways are known,which illustrate the impressive variety of molecular mechanismsunderlying protein transport. Although they all fulfil the samefunction – secretion of at least one protein across the bacterial cellmembrane(s) – protein export machineries significantly differ instructural complexity and the number of proteins they are com-posed of (for review, see [1–4]). In this article, we will focus on theso-called two-step secretion pathways in Gram-negative bacteria,which have been mainly characterized in pathogenic bacteria suchas Pseudomonas aeruginosa. Two-step secretion pathways are highly
T.J. McGenity et al. (eds.), Hydrocarbon and Lipid Microbiology Protocols, Springer Protocols Handbooks, (2017) 87–103,DOI 10.1007/8623_2015_125, © Springer-Verlag Berlin Heidelberg 2015, Published online: 14 August 2015
87

efficient and catalyse two distinct protein translocation events: oneacross the inner membrane to the periplasmic space and the secondfrom the periplasmic space into the culture medium across theouter membrane. Inner membrane translocation is mediated bythe Sec or Tat pathway depending on whether the target proteinneeds to be folded or provided with co-factors from the cytoplasmprior to its secretion [5, 6]. Efficient direction of the target to thetranslocation machinery in the inner membrane requires specificsignal peptides which share some conserved features. They arelocated at the N-terminus of the secreted protein and are specifi-cally recognized by components of the secretion complex [7, 8].For example, the PelB- or PhoA-leader sequences originating fromthe highly abundant enzymes pectate lyase from Erwinia caroto-vora and the alkaline phosphatase of Escherichia coli are highlyefficient in mediating secretion. The PelB-leader sequence is usedin pET vectors of the commercial Novagen T7-expression system(Novagen, www.novagen.com) and has proved its potential indirecting transport of a variety of recombinant proteins [9]. ThePhoA signal sequence has also been successfully used in E. coli forsecreting homologous and heterologous proteins out of the cyto-plasm [10, 11]. Interestingly, in Gram-positive bacteria with only asingle membrane,N-terminal signal sequences are already sufficientto direct export into the culture medium. Several authors reportedthe production and secretion of recombinant proteins in Gram-positive hosts [12–16]. Unfortunately, the efficiency of secretion ofa heterologously expressed protein even in industrial productionstrains like B. subtilis is still difficult to predict. At this point, thechoice of suitable signal peptide for a particular target protein needsto be evaluated on a case-by-case basis [7, 17, 18].
In contrast to the Sec and Tat pathways, almost nothing isknown about the signals directing proteins through the type IIsecretion apparatus. It has repeatedly been proposed that the signalprobably lies in the three-dimensional structure of the exoproteinand not in a simple amino acid sequence [19–24]. Type II secretionmachineries are highly specific, not only for a certain subgroup ofperiplasmic proteins but also in terms of ‘species’ specificity. This isreflected by the fact that only proteins of closely related bacterialspecies are recognized and secreted by the type II system. The typeII secretion machinery of P. aeruginosa is a complex of 12 different,so-called Xcp proteins [25]. The complex is anchored in the innermembrane, spans the periplasm, and forms a gated channel in theouter membrane. The machinery from P. aeruginosa was success-fully expressed in P. putida and used to co-express and efficientlysecrete a P. aeruginosa lipase [26]. Despite a few successes, the useof the type II secretion system for biotechnological applications ingeneral is still limited, due to the complexity and the lack ofknowledge on the nature of the secretion signal.
In contrast, the type V a secretion pathway has found its wayinto biotechnological applications. This ‘autotransporter’ pathway
88 Karl-Erich Jaeger and Harald Kolmar

is widely used to display polypeptides on the surface of Gram-negative bacterial cells [10, 27–32]. Autotransporter proteins posi-tion themselves in the outer membrane where they produce acomplex-specific pore which is formed by the protein’s own pore-forming domain and mediates secretion (Fig. 1b) [33, 34]. With amolecular mass of about 30 kDa (corresponding to 300–350 aa),the pore-forming domains of autotransporters are relatively con-stant in size, whereas the size of the translocated passenger proteinscan vary largely [35]. The lesson to learn from this is that the size ofthe passenger protein, which one would like to have secreted by theautotransporter, probably is not a limiting factor in this type ofsecretion. In the PFAM database (PF03797; http://pfam.xfam.org) currently over 8,000 sequences of potential autotransporterprotein encoding genes can be found, which originate fromapproximately 1,520 bacterial genera, most of them belonging tothe Proteobacteria [36].
The most thoroughly investigated autotransporters for bio-technological applications are the IgA autotransporter from Neis-seria gonorrhoeae [30, 37–39], AIDA-I (adhesion involved indiffuse adherence) and related autotransporters from E. coli strains[37, 40, 41], and EstA from P. aeruginosa [28, 35, 37, 42].
Fig. 1 (a) Map of the plasmid pEst100. phoA coding sequence for the signal sequence of alkaline phosphataseof Escherichia coli, E-tag coding sequence for the E-epitope (GAPVPYPDPLEPR), and EstA* coding sequence ofthe inactive, truncated esterase A from Pseudomonas aeruginosa. The cloning site for the gene of interest (goi)and the recognition sequences for SfiI endonuclease, which are important to design primers for goi amplifi-cation and cloning, are shown below the plasmid map. For more details, see notes. (b) Schematic represen-tation of the resulting cell surface display construct. OM outer membrane, PP periplasm, CM cytoplasmicmembrane
Bacterial Secretion Systems for Use in Biotechnology: Autotransporter-Based Cell. . . 89

Autotransporter proteins consist of three functional parts: anamino terminal leader sequence that directs protein translocationthrough the inner membrane, a passenger domain, and a C-termi-nal β-barrel domain (also known as translocator domain) thatdirects the passenger domain through the outer membrane. Inthis process, the passenger domain remains at least partiallyunfolded in the periplasm in a complex with periplasmic chaperones[43, 44]. The β-barrel likely acts as a pore with a hydrophilicchannel through which the passenger protein can pass [45].
After secretion, the passenger protein is typically cleaved offproteolytically from the autotransporter at the cell surface, either byautoproteolytic cleavage or by an additional protease located in theouter membrane [46, 47], and is either released from the surface orremains attached to the β-domain via non-covalent interactions[43]. By contrast, the members of a small subfamily of autotran-sporter proteins with the outer membrane esterase EstA fromP. aeruginosa being the prototype protein are not cleaved andremain attached to the autotransporter moiety on the bacterialsurface [48]. The enzymatically active N-terminal domain of thisesterase belongs to the GDSL-hydrolase family motif [49] and isthought to represent an ancient type of hydrolytic enzymes. TheGDSL autotransporters group currently consists of about 1,270proteins (Pfam 00657) in 550 bacterial species. Although it is notclear why these proteins remain intact after translocation withoutbeing processed, this unique property is an obvious intrinsic advan-tage for surface display applications, as described below.
A major application of cell surface display of a passenger proteinis the screening of functional protein variants in libraries generatedby directed evolution. This requires the construction of a genelibrary (genotype), the establishment of a linkage between a proteinand its encoding gene, and the selection of proteins of the desiredfunction (phenotype) from the library. One elegant way of achiev-ing phenotype/genotype coupling is to anchor the target proteindirectly on the surface of the producer cells of E. coli, e.g. by geneticfusion to an autotransporter. Various autotransporters with a widerange of sizes and functions were used for the display of recombi-nant protein passengers [35, 50]. Examples include single-chainantibody domains [51], metal-binding proteins [52], toxins [53,54], engineering binding proteins [37, 55], enzyme inhibitors[56], and enzymes [10, 57]. Because E. coli is easily amenable togenetic manipulation and large-scale library generation, it providesa promising system for large-scale clone production and functionalscreenings, e.g. for enzyme activity or protein–protein interactionsusing single-cell analysis methods as fluorescence-activated cellsorting (FACS).
In this article, we describe a robust surface display and high-throughput screening method based on the autotransporter EstA,which allows one to present proteins on the E. coli cell surface with
90 Karl-Erich Jaeger and Harald Kolmar

high efficiency [10]. We provide detailed guidelines for the genera-tion of peptide/protein libraries via the construction of variantsfused to esterase A, E. coli cell surface display, and library screeningusing magnetic (MACS) and fluorescence-activated cell sorting(FACS).
2 Materials
2.1 Strains and
Vectors
Escherichia coli JM109 [F0 traD36 proAþBþ lacIq Δ(lacZ)M15/Δ(lac-proAB) glnV44 e14� gyrA96 recA1 relA1 endA1 thi hsdR17][58]
Plasmid: pEst100 – the construction of pEst100 has beendescribed in detail in [10] (see also Fig. 1).
2.2 Media and
Buffers
1. Chloramphenicol stock solution: 25 mg/ml in 96% (v/v)ethanol.
2. 2YT medium: 1% (w/v) yeast extract; 1.6% (w/v) Bacto tryp-tone; 0.5% (w/v) NaCl.
3. 2YT-Cm25 medium: 2YT medium supplemented with chlor-amphenicol to a final concentration of 25 μg/ml (added afterautoclaving).
4. 2YT-Cm25 plates: 2YT-Cm25 medium supplemented with 1.5%(w/v) agar.
5. M9 minimal medium plates: 0.7% (w/v) Na2HPO4 · 2H2O,0.3% (w/v) KH2PO4, 0.1% (w/v) NH4Cl, and 1.5% agar. Afterautoclaving, add the following sterilized solutions: 25 ml 20%(w/v) glucose, 1 ml 100 mM CaCl2, 1 ml 1 M MgSO4, 5 ml0.1 mM FeCl3, and 1 ml thiamine solution (1 mg/ml).
6. SOB medium: 2% (w/v) Bacto tryptone, 0.5% (w/v) yeastextract, and 0.05% (w/v) NaCl.
7. SOC medium: 2% (w/v) Bacto tryptone, 0.5% (w/v) yeastextract, 10 mM NaCl, and 2.5 mM KCl. After autoclaving,add the following sterilized solutions at the final concentrationindicated: 10mMMgCl2, 10mMMgSO4, and 20mMglucose.
8. PBS buffer: 140 mM NaCl, 10 mM KCl, 6.4 mM Na2HPO4 ·2H2O, and 2 mM KH2PO4.
9. Reaction buffer: 90 mM potassium phosphate buffer, pH 7.2,9 mM MgSO4; 100 mM imidazole, 0.001% (v/v) H2O2.
10. Sodium borate buffer: 100 mM sodium tetraborate, pH 9.1
11. Sucrose gradient buffer: 100 mM Tris-HCl, pH 8.0, 10 mMEDTA, and 100 mM NaCl.
2.3 Biological and
Chemical Materials
1. Anti-DNP Alexa Fluor 488 antibody conjugate (Life Technol-ogies) (http://www.lifetechnologies.com/).
Bacterial Secretion Systems for Use in Biotechnology: Autotransporter-Based Cell. . . 91

2. IPTG stock, 100 mM in sterile water.
3. Anti-mouse IgG (whole molecule)–biotin conjugate (Sigma-Aldrich, B-7264) (http://www.sigmaaldrich.com).
4. Anti-rabbit IgG (whole molecule)–biotin conjugate (Sigma-Aldrich, B-7389) (http://www.sigmaaldrich.com).
5. Anti-E-epitope antibody (1 mg/ml) (GE Healthcare LifeSciences) (http://www.gelifesciences.com/).
6. Bovine serum albumin, BSA 100�, 10 mg/ml (New EnglandBiolabs) (http://www.NEB.com).
7. Streptavidin-coated super-paramagnetic microbeads (MiltenyiBiotec) (http://www.miltenyibiotec.com/).
8. Streptavidin, R-phycoerythrin conjugate, 1 mg/ml (Life Tech-nologies) (http://www.lifetechnologies.com/).
9. T4 DNA Ligase HC (high concentration), 30 u/ml (MBIFermentas) (http://www.fermentas.com).
10. Horseradish peroxidase (Sigma-Aldrich) (http://www.sigmaaldrich.com).
11. NAP-5 column of Sephadex G-25 (GE Healthcare LifeSciences) (http://www.gelifesciences.com/).
2.4 Equipment 1. Epifluorescence microscope (e.g. Zeiss Axioskop)
2. Gene Pulser® (Bio-Rad) (http://www.biorad.com).
3. MidiMACS columns – MultiStand and separation unit (Milte-nyi Biotec) (http://www.miltenyibiotec.com/).
4. MoFlo FACS (Beckman Coulter) or similar sorter (http://www.beckmancoulter.com).
5. SW 40 Ti Rotor, Swinging Bucket (Beckmann Coulter)(http://www.beckmancoulter.com).
6. Tube, Thinwall, Ultra-Clear™, 14 ml (Beckmann Coulter)(http://www.beckmancoulter.com).
3 Methods
3.1 Examination of
Cell Surface Exposition
of the Passenger
Protein by
Immunofluorescence
Staining of E. coli Cells
It is mandatory to check successful cell surface display of the proteinof interest since rate of success is unpredictable and depends onseveral factors (see Note 1).
1. Inoculate an Erlenmeyer flask containing 50 ml 2YT-Cm25
medium with 50 μl of a fresh overnight culture of E. coli strainJM109 carrying the pEst100 plasmid that contains the geneencoding for the protein to be displayed (see also ‘Notes’ sectionfor cloning considerations). Shake the culture flask at 37�C.
2. At an O.D.600 of 0.5, add 250 μl of IPTG stock solution to theculture medium. Shake at 37�C for another 60 min.
92 Karl-Erich Jaeger and Harald Kolmar

3. Pellet cells (200–500 μl) by centrifugation in a tabletop centri-fuge for 2 min.
4. Remove supernatant, resuspend the cell pellet in 10 μl PBS, andadd 1 μl (1 mg/ml) of an antibody directed against the proteinto be displayed, or if not available, use an anti-E-tag antibody.Leave on ice for 10 min.
5. Wash the cells by the addition of 180 μl PBS and centrifugationas in step 3.
6. Remove the supernatant and resuspend the cells in 10 μl PBScontaining anti-mouse- or anti-rabbit IgG–biotin conjugate asrequired (1:10 dilution). Leave on ice for 10 min and wash thecells by the addition of 180 μl PBS and centrifugation.
7. Resuspend the cell pellet in 10 μl of PBS containing streptavi-din and R-phycoerythrin conjugate (1:10 dilution) and incu-bate on ice again for 10 min.
8. Wash the cells by the addition of 180 μl PBS; centrifuge andresuspend the pellet in 10 μl PBS.
9. Analyse by fluorescence microscopy (Zeiss filter number 15absorption, 565 nm; emission, 578 nm) or by flow cytometry[e.g. MoFlo cell sorter. Parameters are set as follows: sidescatter, 730 (LIN mode, amplification factor 6); FL1 (FITC),600 (LOG mode); FL2 (PE), 600 (LOG mode); triggerparameter, side scatter. No forward scatter measurement isnecessary. The sample flow rate is adjusted to an event rate ofapproximately 10,000 s�1, with similar settings for other cellsorters].
3.2 Preparation of
Vector DNA for Library
Construction
For isolation of pEst100 plasmid DNA (for vector details andcloning considerations, see Notes 2 and 3), any convenient midi-prep purification system (e.g. Qiagen® Plasmid Midi Kit (http://www.qiagen.com)) can be used. It is advisable to extract the pur-ified DNA once with phenol/chloroform and once with chloro-form and precipitate the DNA by the addition of 1/10 volume of7 M ammonium acetate and three volumes of 96% ethanol. Dis-solve the DNA in H2O at approximately 1 μg/ml for further use.The vector DNA should preferable purified by sucrose gradientcentrifugation (see Note 4).
1. Digest 50–100 μg pEst100 vector DNA in a total volume of200 μl with 5 units of SfiI per μg DNA at 50�C for 5 h orovernight in the manufacturer’s recommended buffer.
2. Control SfiI cleavage by agarose gel electrophoresis.
3. Prepare solutions of 40%, 30%, and 10% sucrose (w/v) insucrose gradient buffer. Fill 500 μl of 40% sucrose solutioninto a 14 ml ultra centrifuge tube. Layer a gradient ranging
Bacterial Secretion Systems for Use in Biotechnology: Autotransporter-Based Cell. . . 93

from 10% to 30% sucrose on top of the 40% cushion using agradient mixer.
4. Layer the DNA solution from the restriction digest on top ofthe sucrose gradient. Balance with 10% sucrose solution.
5. Centrifuge at 30,000 rpm for 21 h in a type SW40Ti (Beck-mann, swing-out) or equivalent at 15�C.
6. Fractionate the gradient in 500 μl aliquots by puncturing thebottom of the tube with a needle and collecting drops afterremoval of the needle.
7. Analyse the fractions by agarose gel electrophoresis. Combinethe fractions containing the vector fragment and precipitateDNA with 1/10 volume of 7 M ammonium acetate and threevolumes of 96% (v/v) ethanol.
3.3 Insert Generation
for Library
Construction
The procedures for generating gene libraries of a given protein tobe displayed are well established. For example, DNA shuffling [59],error-prone PCR [60], saturation mutagenesis, or CASTing [61]techniques can be used to generate a variant gene population. Thebasic condition is that the gene library should contain DNA endscompatible with SfiI-restricted pEst100.
3.4 Ligation for
Library Construction
Ligation of digested vector and insert DNA is performed usingstandard procedures. For creating large libraries, it is advisable toset up several ligation reactions in parallel.
1. Set up 12 ligation reactions each containing the following:300 ng of digested vector DNA, threefold molar excess ofinsert DNA, 2 μl 10 � T4 DNA ligase buffer, 0.2 ml BSA(100�), 1 μl T4 DNA ligase, and H2O to 20 μl.
2. Incubate overnight at 15�C.
3. Inactivate ligase by incubation at 65�C for 10 min.
4. Pool the 12 reactions and extract once with one volume ofphenol/chloroform and once with one volume of chloroform.Precipitate DNA with 1/10 vol of 7 M ammonium acetate and3 vol of 96% (v/v) ethanol. Incubate for at least 30 min at�20�C and then centrifuge in a tabletop centrifuge for15–30 min at 13,000 rpm.
5. Discard the supernatant and resuspend the DNA pellet in240 μl H2O and either store at �20�C or use directly forelectroporation.
3.5 Electroporation
for Library
Construction
Transformation is done by electroporation of cells. The use ofchemical competent cells is not recommended because it givesmuch lower yields of transformants.
The following materials have to be prepared in advance: 2 l ofsterile bidistilled H2O, precooled on ice; 36 SOC-Cm25 agar plates
94 Karl-Erich Jaeger and Harald Kolmar

using large petri dishes (15 cm in diameter); 10 SOC-Cm25 agarplates using small petri dishes (9.2 cm in diameter); and two 1 lErlenmeyer flasks each containing 400 ml SOB medium, one flaskcontaining 100 ml SOC medium and one flask containing 100 mlSOB medium.
1. For preparation of electrocompetent cells, inoculate 5 ml SOBmedium with cells grown on a M9 minimal medium plate andshake overnight at 37�C.
2. Inoculate each of the two flasks containing 400 ml SOBmedium with 2 ml of the overnight culture. Shake at 37�Cuntil an O.D.600 of 0.5 has been reached (2–3 h).
3. Partition the cell culture into 50 ml plastic tubes and centrifugeat 4,000 rpm for 10 min at 4�C (Eppendorf 5810R or equiva-lent). Discard the supernatant.
4. Carefully resuspend the cell pellets each in 50 ml precooledH2O (on ice). Incubate on ice for 1 h.
5. Centrifuge at 4,000 rpm for 10 min at 4�C. Discard thesupernatant.
6. Resuspend cells in 25 ml precooled H2O. Incubate on ice for1 h and centrifuge as before. Discard the supernatant.
7. Wash with 10 ml precooled H2O. Distribute the cell suspen-sions equally into 12 tubes. Leave on ice for 1 h and centrifugeas before. Discard the supernatant. Place the tubes on ice foranother 10 min and resuspend the cells in the remaining liquidwhich should not exceed 200 μl.
8. For electroporation, add 20 μl of the ligation reaction to eachof the 12 aliquots of competent cells and incubate for at least30 min on ice, and then transfer into prechilled electroporationcuvettes.
9. Set up a Gene Pulser to give a 2,500 V pulse, using a 25 μFcapacitor and adjust the resistance to 200 Ω. Place the cuvettein the electroporation chamber and pulse once.
10. Immediately add 800 μl SOC medium and transfer the cellsuspension into a test tube. Rinse the cuvette twice with800 ml SOC medium and incubate the cells with agitation at37�C for 45–60 min.
11. Pool the contents of all 12 tubes. Remove 50 μl aliquot andmake a serial dilution (add to 450 μl PBS per dilution step) overseven dilution steps. Plate out 250 μl of each dilution. Plate thedilutions on small SOC-Cm25 agar plates. Streak the remainingcell suspension on 36 large SOC-Cm25 agar plates and incubateovernight at 37�C.
12. Count the colonies on dilution plates with an appropriatenumber of colonies the following day to determine the total
Bacterial Secretion Systems for Use in Biotechnology: Autotransporter-Based Cell. . . 95

number of transformants (106–109 can be expected whensetting up 12 ligation reactions). Harvest the library cells byflooding each of the 36 plates with 4 ml SOC medium anddetach cells by scraping off under sterile conditions. Pool thecell suspension and add DMSO to a final concentration of 9%(v/v). Store at�70�C in 2ml aliquots or use directly for libraryscreening.
3.6 Screening of
Hydrolases Using the
ESCAPED Technology
The identification and isolation of cell-surface-exposed enzymevariants that are able to catalyse a particular reaction requires theidentification of enzymatically proficient cells from inactive ones,preferably by covalent attachment of an easily detectable label to thecell surface [10]. The tyramide signal amplification (TSA) reactionmakes use of the fact that horseradish peroxidase (HRP) can reactwith hydrogen peroxide and the phenolic part of biotin tyramide toproduce a radical. HRP has to be coupled to the cell surface in orderthat the short-lived peroxidase-generated tyramide radical cova-lently attaches to tyrosine residues in close vicinity to HRP. Ideally,attachment occurs onto tyrosine residues of cell-surface-exposedproteins [62]. The phenolic hydroxyl group of tyramide is blockedby esterification and can be activated in situ by cell-surface-exposedlipases and esterases. Using biotin tyramide ester as substrate, onlythose cells become labelled with biotin, which displayed esterolyticactivity on their cell surface. These cells can then be easily isolatedfrom a very large background of inactive cells by using magneticlabelling with biotin-binding streptavidin-coated paramagneticmicrobeads (MACS) or by using biotin-binding streptavidin cou-pled to a fluorescent dye via fluorescence-assisted cell sorting(FACS) [63].
3.6.1 Preparation of HRP Conjugation of periodate-oxidized horseradish peroxidase (HRP)to E. coli cells is performed as follows:
1. Glycosylated horseradish peroxidase (Sigma) (200 μg) is dis-solved in water (200 μl).
2. The terminal sugar residues of HRP are oxidized to aldehydesby adding 20 μl of sodium periodate (0.088 M) and incubatefor 1 h in the dark. HRP changes colour from brown to green.
3. Pre-equilibrate a size exclusion NAP-5 column of Sephadex G-25 (GE Healthcare Life Sciences) with 5 ml sodium boratebuffer.
4. Load the sample to the column and elute the oxidized enzymewith sodium borate buffer by collecting the colored fractions.
5. Green fraction in a final volume of 2 ml.
6. Store if necessary at �20�C in the dark.
96 Karl-Erich Jaeger and Harald Kolmar
3.6.2 Coupling The aldehydes of activated HRP can react with amino groups onthe cell surface to form imines and are thereby covalently coupled:
1. E. coli cells containing the respective plasmid expressing thecorresponding fusion protein are grown at 37�C in dYTmedium to an O.D.600 of 0.5.
2. Add IPTG to a final concentration of 0.5 mM to induce theexpression and incubate for another 60 min.
3. Determine the cell density at O.D.600 and adjust the culture toan O.D.600 of 0.5.
4. Pellet cells (1 ml) by centrifugation in a tabletop centrifuge at13,000 rpm for 2 min.
5. Wash the cells in 500 μl PBS buffer and centrifuge again.
6. Resuspend the cells in 150 μl activated HRP and incubate for1 h in the dark at room temperature.
7. Remove unreacted peroxidase by washing the cells three timesin PBS buffer (500 μl).
3.7 Cell Staining with
Tyramide Esters for
Monitoring Carboxyl
Ester Hydrolase
Activity
For the chemical synthesis of tyramide esters, see [63]:
1. HRP-decorated cells are resuspended in 500 μl reaction buffer(90 mM potassium phosphate buffer, pH 7.2, 9 mM MgSO4;100 mM imidazole, 0.001% (v/v) H2O2) containing thedesired biotin tyramide ester, for example, biotin tyramidecaprylate (2.9 nmol) (see also Note 5) [63].
2. Incubate cells for 15 min at room temperature in the dark.
3. Collect cells by centrifugation in a tabletop centrifuge at13,000 rpm for 2 min.
4. Wash cells with 500 μl PBS
3.7.1 Fluorescence
Analysis and Sorting
1. For fluorescence analysis, resuspend cells in 10 μl streptavidinand (R)-phycoerythrin conjugate (1:10 dilution in PBS) andincubate on ice for 10 min.
2. Again, harvest the cells, wash with 500 μl PBS, resuspendfinally in 10 μl PBS, and subject the sample to microscopy orFACS analysis.
3.7.2 Magnetic Cell
Sorting (MACS)
1. Resuspend the cells in 200 μl PBS plus 20 μl streptavidinmicrobeads (Miltenyi Biotec) and incubate on ice for 10 min.
2. Collect cells by centrifugation in a tabletop centrifuge at13,000 rpm for 1 min.
3. Wash with 500 μl PBS and resuspend cells finally in 1 ml PBS.Take a sample of the cells (1 μl) and determine the cell count byplating different dilutions (10�6–10�8) on selective dYT.
Bacterial Secretion Systems for Use in Biotechnology: Autotransporter-Based Cell. . . 97

4. Equilibrate a MACS LS column (Miltenyi Biotec) three timeswith 3 ml PBS when stacking in the magnet (Midi MACS).Apply the cells to the column and add immediately 3 ml PBS.
5. Let the column flow by gravitation and wash three times with3 ml PBS to discard unbound cells.
6. Take the column out of the magnet and elute bound cells with1 ml PBS under pressure.
7. After magnetic sorting, take again a sample of the cells (1 μl)and determine the cell counts by plating different dilutions(10�4–10�6) on selective dYT.
8. Calculate the enrichment factor.
9. For further selection rounds, grow the enriched cells again andrepeat the steps described above.
10. Check the enrichment by activity or binding assays as required.
3.8 Discrimination
Between (R)- and
(S)-Enantioselectivity
of Esterases
When enantiomeric tyramide conjugates are used for HRP-mediated conjugation, for example, the tyramide ester of (R)- or(S)-2-methyl decanoate, it is possible to correlate the enantioselec-tivity of an esterase variant displayed on the cell surface with theextent of fluorophore labelling (see alsoNote 6). As a consequence,cells with enhanced enantioselectivity can be identified and isolatedby FACS [27, 63].
1. HRP-decorated cells (see above) are resuspended in 1 ml reac-tion buffer containing 1.14 nmol (S)-2-MDA-biotin-tyramideester or (R)-2-MDA 2,4 DNP tyramide ester (for synthesis, see[27, 63]) individually or a 1:1 mixture of both.
2. Cells are incubated for 5 min at room temperature.
3. The conjugation reaction is terminated by the addition of100 μl 500 mM tyramine.
4. Harvest the cells in a tabletop centrifuge at 13,000 rpm for2 min and wash with 500 μl PBS and centrifuge again.
5. Cells are resuspended in 10 μL PBS containing 100 μg/mlstreptavidin, R-phycoerythrin conjugate, and/or anti-DNPAlexa Fluor 488 antibody conjugate.
6. Incubate the mixture for 5 min at room temperature.
7. Add PBS (300 μl) and pellet the cells.
8. Resuspend in PBS (1 ml) for flow cytometry analysis.
9. E. coli cells are analysed/sorted on aMoFlo cell sorter. Parametersare set as follows: side scatter: 730 (LIN mode, amplificationfactor 6); FL1 (FITC), 600 (LOG mode); FL2 (PE), 600(LOG mode); and trigger parameter, side scatter. No forwardscatter measurement is necessary. The sample flow rate is adjustedto an event rate of approximately 15,000–30,000 s�1, with similar
98 Karl-Erich Jaeger and Harald Kolmar

settings for other cell sorters. Make two-dimensional plots withFL1 as X-axis and FL2 as Y-axis. Cells displaying no enantioselec-tivity are expected to be represented as dots along a diagonal.Cellspresenting enzyme variants with enhanced enantioselectivity areexpected to display enhanced FL1 compared with FL2 (indicativeof preferred cleavage of (R)-2-MDA) or enhanced FL2 comparedwithFL1 (indicative of preferred cleavage of (2)-2-MDA), respec-tively, and should therefore appear off-diagonal.
4 Notes
1. It is mandatory to check successful cell surface display (seeSect. 3.1) of the target protein. The protein of interest has tobe translocated through two membranes, the inner and theouter membranes, and for both translocation processes, thepassenger protein has to be at least partially unfolded. Hence,for fast folding proteins, cell surface display may be hampered[64]. In these cases, optimization of bacterial growth condi-tions by reducing growth temperature or addition of com-pounds that interfere with target protein folding (lowconcentrations of detergent, chelator, reducing agents) mayimprove export yields [64]. For passenger proteins that containdisulphide bonds, surface display may be enhanced in an E. colistrain lacking the periplasmic disulphide isomerase DsbA [54,64]. One should also check whether the protein of interestcontains a cleavage site for the E. coli OmpT protease, anouter membrane protein of E. coli that efficiently cleaves attwo adjacent basic residues [54, 55, 65]. In this case, anOmpT-deficient E. coli strain as UT5600 [54] or an E. coli Bstrain as BL21 should be considered, since E. coli B strainsgenerally lack this protease [55]. For detection of successfulcell surface display of the protein of interest, fluorescence stain-ing methods should be applied, since the labelling compounds(antibodies, streptavidin, R-phycoerythrin conjugate, etc.) areunable to enter intact E. coli cells. Surface display can be verifiedby fluorescence staining of the cells using (a) an antibodydirected against the protein to be displayed or (b) an antibodydirected against the E-epitope of the EstA fragment (Fig. 1).
2. For cloning the gene of interest into the expression vectorpEST100 (see Sect. 3.1), a pair of SfiI recognition sites is used(Fig. 1a). The recognition sequence of SfiI comprises 13nucleotides and contains five variable nucleotides in its center.The length of this sequence qualifies the enzyme as a true rarecutter, and, as a consequence of the variable region, directedcloning can be achieved by changing the variable sequence atthe corresponding positions while using only a single enzyme.
Bacterial Secretion Systems for Use in Biotechnology: Autotransporter-Based Cell. . . 99

Therefore, special care is required in designing the respectiveprimers to be used to maintain the reading frame.
3. In expression vector pEST100 a naturally occurring SfiI recog-nition sequence within the estA gene was deleted by truncationof estA (Fig. 1). This generates the so-called estA* variant, whichproduces an esterase inactive protein. Inactivation of EstA wasnecessary to exclude background esterase activity, which woulddisturb screening for heterologous hydrolytic and lipolyticenzymes. Expression of the resulting gene fusion is under lacP/O control in pEst100 and can be induced by the addition ofIPTG. The plasmid is replicated from its ColE1 origin andcarries the chloramphenicol acyl transferase gene (cat) [10].
4. For library generation, sucrose gradient purification of thevector fragment is recommended (Sect. 3.2). Alternatively,the vector fragment can be isolated from a preparative agarosegel using commercially available extraction kits. In our hands,yields are lower and transformation efficiencies compared toDNA purification by sucrose gradient centrifugation may bereduced due to co-purification of ionic impurities of the aga-rose that negatively influence ligation and/or transformation.
5. For application of the ESCAPED technology (Sect. 3.6) forhydrolase-mediated cell staining, it may be required to opti-mize the concentration of biotin-tyramide conjugate. We haveoccasionally observed that higher substrate concentrationsresult in the lack of cell staining.
6. For discrimination between (R)- and (S)-enantioselectivities ofesterases (Sect. 3.8), it is recommended to use a 1:1 mixture oftwo enantiomeric substrates that lead to different types of cellsurface conjugation, as, e.g. biotin and 2,4-DNP [63]. For thesubsequent fluorescent labelling, pairs of fluorophores withnonoverlapping excitation/emission spectra should be prefera-bly used, as, e.g. Alexa Fluor 488®-labelled streptavidin and anallophycocyanin-conjugated anti-DNP antibody that can beselectively excited by a green and a red laser, respectively [66].
References
1. Holland IB (2010) The extraordinary diversityof bacterial protein secretion mechanisms.Methods Mol Biol 619:1–20
2. Ma Q, Zhai Y, Schneider JC et al (2003) Pro-tein secretion systems of Pseudomonas aerugi-nosa and P fluorescens. Biochim Biophys Acta1611:223–233
3. Rosenau F, Jaeger KE (2000) Bacterial lipasesfrom Pseudomonas: regulation of gene expres-sion and mechanisms of secretion. Biochimie82:1023–1032
4. Saier MH Jr (2006) Protein secretion andmembrane insertion systems in gram-negativebacteria. J Membr Biol 214:75–90
5. Natale P, Bruser T, Driessen AJ (2008) Sec-and Tat-mediated protein secretion across thebacterial cytoplasmic membrane–distinct trans-locases and mechanisms. Biochim Biophys Acta1778:1735–1756
6. Kudva R, Denks K, Kuhn P et al (2013) Pro-tein translocation across the inner membraneof Gram-negative bacteria: the Sec and Tat
100 Karl-Erich Jaeger and Harald Kolmar
dependent protein transport pathways. ResMicrobiol 164:505–534
7. Brockmeier U, Caspers M, Freudl R et al(2006) Systematic screening of all signal pep-tides from Bacillus subtilis: a powerful strategyin optimizing heterologous protein secretionin Gram-positive bacteria. J Mol Biol362:393–402
8. Clerico EM,Maki JL, Gierasch LM (2008) Useof synthetic signal sequences to explore theprotein export machinery. Biopolymers90:307–319
9. Sletta H, Tondervik A, Hakvag S et al (2007)The presence of N-terminal secretion signalsequences leads to strong stimulation of thetotal expression levels of three tested medicallyimportant proteins during high-cell-densitycultivations of Escherichia coli. Appl EnvironMicrobiol 73:906–912
10. Becker S, Theile S, Heppeler N et al (2005) Ageneric system for the Escherichia coli cell-surface display of lipolytic enzymes. FEBSLett 579:1177–1182
11. Oka T, Sakamoto S, Miyoshi K et al (1985)Synthesis and secretion of human epidermalgrowth factor by Escherichia coli. Proc NatlAcad Sci U S A 82:7212–7216
12. Anne J, Vrancken K, Van Mellaert L et al(2014) Protein secretion biotechnology inGram-positive bacteria with special emphasison Streptomyces lividans. Biochim BiophysActa 1843:1750–1761
13. Fu LL, Xu ZR, Li WF et al (2007) Proteinsecretion pathways in Bacillus subtilis: implica-tion for optimization of heterologous proteinsecretion. Biotechnol Adv 25:1–12
14. Harwood CR, Cranenburgh R (2008) Bacillusprotein secretion: an unfolding story. TrendsMicrobiol 16:73–79
15. Tjalsma H, Bolhuis A, Jongbloed JD et al(2000) Signal peptide-dependent proteintransport in Bacillus subtilis: a genome-basedsurvey of the secretome. Microbiol Mol BiolRev 64:515–547
16. Westers L, Westers H, Quax WJ (2004) Bacil-lus subtilis as cell factory for pharmaceuticalproteins: a biotechnological approach to opti-mize the host organism. Biochim Biophys Acta1694:299–310
17. Degering C, Eggert T, Puls M et al (2010)Optimization of protease secretion in Bacillussubtilis and Bacillus licheniformis by screeningof homologous and heterologous signal pep-tides. Appl Environ Microbiol 76:6370–6376
18. Kang Z, Yang S, Du G et al (2014) Molecularengineering of secretory machinery compo-nents for high-level secretion of proteins in
Bacillus species. J Ind Microbiol Biotechnol41:1599–1607
19. Hausmann S, Wilhelm S, Jaeger KE et al(2008) Mutations towards enantioselectivityadversely affect secretion of Pseudomonas aeru-ginosa lipase. FEMSMicrobiol Lett 282:65–72
20. Hazes B, Frost L (2008) Towards a systems biol-ogy approach to study type II/IV secretion sys-tems. Biochim Biophys Acta 1778:1839–1850
21. Johnson TL, Abendroth J, Hol WG et al(2006) Type II secretion: from structure tofunction. FEMS Microbiol Lett 255:175–186
22. Korotkov KV, Sandkvist M, Hol WG (2012)The type II secretion system: biogenesis,molecular architecture and mechanism. NatRev Microbiol 10:336–351
23. Pineau C, Guschinskaya N, Robert X et al(2014) Substrate recognition by the bacterialtype II secretion system: more than a simpleinteraction. Mol Microbiol 94:126–140
24. Sandkvist M (2001) Biology of type II secre-tion. Mol Microbiol 40:271–283
25. Filloux A (2004) The underlying mechanismsof type II protein secretion. Biochim BiophysActa 1694:163–179
26. Rosenau F, Jaeger KE (2003) Design of sys-tems for overexpression of Pseudomonas lipases.In: Sevendsen A (ed) Enzyme functionality:design, engineering, and screening. MarcelDecker, New York, pp 617–631
27. Becker S, Hobenreich H, Vogel A et al (2008)Single-cell high-throughput screening to iden-tify enantioselective hydrolytic enzymes.Angew Chem Int Ed Engl 47:5085–5088
28. Becker S, Schmoldt HU, Adams TM et al(2004) Ultra-high-throughput screeningbased on cell-surface display and fluorescence-activated cell sorting for the identification ofnovel biocatalysts. Curr Opin Biotechnol15:323–329
29. Grijpstra J, Arenas J, Rutten L et al (2013)Autotransporter secretion: varying on atheme. Res Microbiol 164:562–582
30. Jose J, Meyer TF (2007) The autodisplay story,from discovery to biotechnical and biomedicalapplications. Microbiol Mol Biol Rev71:600–619
31. van Ulsen P, Rahman S, Jong WS et al (2014)Type V secretion: from biogenesis to biotech-nology. Biochim Biophys Acta1843:1592–1611
32. Wilhelm S, Rosenau F, Becker S et al (2007)Functional cell-surface display of a lipase-specific chaperone. Chembiochem 8:55–60
33. Dautin N, Bernstein HD (2007) Protein secre-tion in gram-negative bacteria via the
Bacterial Secretion Systems for Use in Biotechnology: Autotransporter-Based Cell. . . 101

autotransporter pathway. Annu Rev Microbiol61:89–112
34. Henderson IR, Navarro-Garcia F, Nataro JP(1998) The great escape: structure and func-tion of the autotransporter proteins. TrendsMicrobiol 6:370–378
35. van Bloois E, Winter RT, Kolmar H et al(2011) Decorating microbes: surface displayof proteins on Escherichia coli. Trends Biotech-nol 29:79–86
36. Finn RD, Bateman A, Clements J et al (2014)Pfam: the protein families database. NucleicAcids Res 42:D222–D230
37. Binder U, Matschiner G, Theobald I et al(2010) High-throughput sorting of an Antic-alin library via EspP-mediated functional dis-play on the Escherichia coli cell surface. J MolBiol 400:783–802
38. Mistry D, Stockley RA (2006) IgA1 protease.Int J Biochem Cell Biol 38:1244–1248
39. Pyo HM, Kim IJ, Kim SH et al (2009) Escher-ichia coli expressing single-chain Fv on the cellsurface as a potential prophylactic of porcine epi-demic diarrhea virus. Vaccine 27:2030–2036
40. Jose J (2006) Autodisplay: efficient bacterialsurface display of recombinant proteins. ApplMicrobiol Biotechnol 69:607–614
41. Jose J, Maas RM, Teese MG (2012) Autodis-play of enzymes–molecular basis and perspec-tives. J Biotechnol 161:92–103
42. Yang TH, Kwon MA, Song JK et al (2010)Functional display of Pseudomonas and Bur-kholderia lipases using a translocator domainof EstA autotransporter on the cell surface ofEscherichia coli. J Biotechnol 146:126–129
43. Jong WS, Sauri A, Luirink J (2010) Extracellu-lar production of recombinant proteins usingbacterial autotransporters. Curr Opin Biotech-nol 21:646–652
44. JongWS, tenHagen-Jongman CM, den Blaau-wen T et al (2007) Limited tolerance towardsfolded elements during secretion of the auto-transporter Hbp. Mol Microbiol63:1524–1536
45. Sauri A, Oreshkova N, Soprova Z et al (2011)Autotransporter beta-domains have a specificfunction in protein secretion beyond outer-membrane targeting. J Mol Biol 412:553–567
46. van Ulsen P, van Alphen L, ten Hove J et al(2003) A Neisserial autotransporter NalPmodulating the processing of other autotran-sporters. Mol Microbiol 50:1017–1030
47. Yen YT, Kostakioti M, Henderson IR et al(2008) Common themes and variations in ser-ine protease autotransporters. Trends Micro-biol 16:370–379
48. Wilhelm S, Tommassen J, Jaeger KE (1999) Anovel lipolytic enzyme located in the outermembrane of Pseudomonas aeruginosa. J Bac-teriol 181:6977–6986
49. Upton C, Buckley JT (1995) A new family oflipolytic enzymes? Trends Biochem Sci20:178–179
50. Rutherford N, Mourez M (2006) Surface dis-play of proteins by gram-negative bacterialautotransporters. Microb Cell Fact 5:22
51. Veiga E, de Lorenzo V, Fernandez LA (1999)Probing secretion and translocation of a beta-autotransporter using a reporter single-chainFv as a cognate passenger domain. Mol Micro-biol 33:1232–1243
52. Valls M, Atrian S, de Lorenzo V et al (2000)Engineering a mouse metallothionein on thecell surface of Ralstonia eutropha CH34 forimmobilization of heavy metals in soil. NatBiotechnol 18:661–665
53. Klauser T, Pohlner J, Meyer TF (1990) Extra-cellular transport of cholera toxin B subunitusing Neisseria IgA protease beta-domain:conformation-dependent outer membranetranslocation. EMBO J 9:1991–1999
54. Maurer J, Jose J, Meyer TF (1997) Autodis-play: one-component system for efficient sur-face display and release of soluble recombinantproteins from Escherichia coli. J Bacteriol179:794–804
55. Fleetwood F, Andersson KG, Stahl S et al (2014)An engineered autotransporter-based surfaceexpression vector enables efficient display of Affi-bodymolecules onOmpT-negativeE. coli as wellas protease-mediated secretion inOmpT-positivestrains. Microb Cell Fact 13:985
56. Jose J, Zangen D (2005) Autodisplay of theprotease inhibitor aprotinin in Escherichia coli.Biochem Biophys Res Commun333:1218–1226
57. Yang TH, Pan JG, Seo YS et al (2004) Use ofPseudomonas putida EstA as an anchoringmotif for display of a periplasmic enzyme onthe surface of Escherichia coli. Appl EnvironMicrobiol 70:6968–6976
58. Yanisch-Perron C, Vieira J, Messing J (1985)Improved M13 phage cloning vectors and hoststrains: nucleotide sequences of the M13mp18and pUC19 vectors. Gene 33:103–119
59. Stemmer WP (1994) DNA shuffling by ran-dom fragmentation and reassembly: in vitrorecombination for molecular evolution. ProcNatl Acad Sci U S A 91:10747–10751
60. Cadwell RC, Joyce GF (1992) Randomizationof genes by PCR mutagenesis. PCR MethodsAppl 2:28–33
102 Karl-Erich Jaeger and Harald Kolmar

61. Reetz MT, Carballeira JD, Peyralans J et al(2006) Expanding the substrate scope ofenzymes: combining mutations obtained byCASTing. Chemistry 12:6031–6038
62. McCormick ML, Gaut JP, Lin TS et al (1998)Electron paramagnetic resonance detection offree tyrosyl radical generated by myeloperoxi-dase, lactoperoxidase, and horseradish peroxi-dase. J Biol Chem 273:32030–32037
63. Becker S, Michalczyk A, Wilhelm S et al (2007)Ultrahigh-throughput screening to identify E.coli cells expressing functionally active
enzymes on their surface. Chembiochem8:943–949
64. Adams TM, Wentzel A, Kolmar H (2005) Inti-min-mediated export of passenger proteinsrequires maintenance of a translocation-compe-tent conformation. J Bacteriol 187:522–533
65. Gustavsson M, Backlund E, Larsson G (2011)Optimisation of surface expression using theAIDA autotransporter. Microb Cell Fact 10:72
66. Doerner A, Rhiel L, Zielonka S et al (2014)Therapeutic antibody engineering by high effi-ciency cell screening. FEBS Lett 588:278–287
Bacterial Secretion Systems for Use in Biotechnology: Autotransporter-Based Cell. . . 103
Syngas Fermentation for Polyhydroxyalkanoate Productionin Rhodospirillum rubrum
O. Revelles, I. Calvillo, A. Prieto, and M.A. Prieto
Abstract
Bioconversion of organic waste into value-added products by a process called syngas fermentation is gainingconsiderable interest during the last years. Syngas is a gaseous mixture composed mainly of hydrogen andcarbon monoxide and smaller quantities of other gases like CO2 that can be fermented by Rhodospirillumrubrum, a natural producer of polyhydroxybutyrate (PHB). R. rubrum is a highly versatile, purple, non-sulfur bacterium that can grow in a broad range of anaerobic and aerobic conditions. In anaerobiosis, it canutilize CO as carbon and energy source in the presence or absence of light. When exposed to CO, COdehydrogenase, which catalyzes oxidation of CO into CO2, is induced. Part of the CO2 produced isassimilated into cell material and the remaining CO2, along with the H2, is released into the environment.The protocol below provides detailed information of PHB production during syngas fermentation byR. rubrum at lab scale.
Keywords: Anaerobic culture, Gas analysis, Polyhydroxyalkanoates (PHA), Syngas, Syngasfermentation
1 Introduction
The rapid urban growth and modern lifestyle are generating anenormous amount of municipal and industrial wastes. In develop-ing countries, urban agglomerations are growing at twice the rateof population growth. Organic waste provides a significant resourceof biomass that can be utilized for generating commodity productssuch as chemicals, biofuels, or bioplastics [1, 2] by a bacterialfermentative process. Hence, valorizing and reusing wastes viatheir bioconversion into value-added products offer an interestingstrategy with a high impact in bio-economy. Although some wastesmight be homogeneous, many others (e.g., municipal waste) pres-ent a very complex composition. In this context, one of the proces-sing methods that can be used in biorefineries is the gasificationof organic materials to synthesis gas [3], or syngas, followed bymicrobial fermentation. Gasification is generally defined as a
T.J. McGenity et al. (eds.), Hydrocarbon and Lipid Microbiology Protocols, Springer Protocols Handbooks, (2017) 105–119,DOI 10.1007/8623_2015_168, © Springer-Verlag Berlin Heidelberg 2015, Published online: 15 December 2015
105

thermochemical conversion (750–850�C) of carbonaceouscompounds including biomass and organic wastes into gas mixturesconsisting of carbon monoxide (CO), hydrogen (H2), carbon diox-ide (CO2), methane (CH4), nitrogen (N2), usually named syngas,and smaller liquid (tar) and solid (char) fractions. Basically, tarfraction consists of a mixture of high molecular weight hydrocar-bons and char is mainly charcoal and ashes [2]. Further, syngas is animportant intermediate product in chemical industry, being ofspecial interest for the ammonia industry. Additionally, it is alsothe intermediate energy carrier for the production of second-generation biofuels like methanol, DME (dimethyl ether), cellu-losic ethanol, and Fischer-Tropsch diesel. Furthermore, such gas-eous mixture could potentially be used by bacteria as carbon andenergy sources and converted into fuel and biochemicals, in aprocess known as syngas fermentation. Using bacteria as biocata-lysts for syngas fermentation offers several advantages over tradi-tional mineral-based catalysts used for syngas transformation: (i) itcan operate at temperatures and pressures which are closer tostandard environmental conditions than traditional chemical cata-lysts; (ii) it is less sensitive to the ratio of CO to H2 in syngascompared to traditional/commercial catalysts, and (iii) it is lesssensitive to trace amounts of contaminants in the syngas, such aschar and tar, chlorine, and sulfur [4]. Although syngas is mainlyused in the chemical industry for the production of chemical com-pounds, its fermentation offers an economic alternative for biofueland biochemical synthesis [1, 5].
Gasification allows for the processing of virtually all types oforganic waste (e.g., industrial or municipal) into syngas, which inturn can be fermented to produce a diversity of compounds such ashydrogen, methane, alcohols, carboxylic acids, and specially thebioplastics polyhydroxyalkanoates (PHAs) [6–9]. The potential ofsyngas fermentation is evident by the advent of large-scale projects.LanzaTech is working with steel manufacturers and coal producersto make liquid fuels in China (http://www.lanzatech.com). Cos-kata (http://www.coskata.com) is commercializing the productionof fuels using a wide variety of biomass sources through syngasfermentation, among others. BioMCN is converting glycerine tosyngas to be further fermented into bio-methanol (http://www.biomcn.eu).
PHAs are interesting products obtained from bioconversion ofsyngas via fermentation process. Rhodospirillum rubrum is anorganism particularly attractive for the bioconversion of syngasinto H2 and PHAs, mainly polyhydroxybutyrate (PHB), the proto-type of the short-chain-length PHAs (Fig. 1) [7, 10]. It is one ofthe most versatile bacterial species in terms of metabolism, capableof growing autotrophically or heterotrophically, phototrophically,or chemotrophically, in the presence or absence of oxygen.
106 O. Revelles et al.

R. rubrummetabolism makes it an ideal bacterium for many indus-trial processes.
Under anaerobic conditions, regardless of the presence of lightor other carbon sources, CO induces the synthesis of several pro-teins, including CO dehydrogenase (CODH) [11, 12]. Part of theCO2 produced is assimilated into cell material, and the remainingCO2 along with the H2 is released into the environment [13, 14].
COþH2O ! CO2 þ 2Hþ þ 2e�
Here in this chapter, we provide detailed information about thesyngas fermentation process to produce PHAs using R. rubrum asbiocatalyst; growth conditions and medium for syngas fermenta-tion are detailed. Moreover, the procedure to study the kinetics ofgrowth during this process is also given. The chapter finishes withthe extraction and quantification of the final value-added productof syngas fermentation, such as PHB.
Fig. 1 Pictures of R. rubrum growing in medium syn with and without syngas (a), a TEM (transmission electronmicroscopy) image of R. rubrum containing PHB granules (b), and optical microscopy image of R. rubrum’sspiral-shaped rods (c)
Syngas Fermentation for Polyhydroxyalkanoate Production. . . 107

2 Materials
2.1 Bacterial Strain R. rubrum DSMZ 467T type strain (ATCC 11170) (DSMZ col-lection: http://www.dsmz.de) (see Note 1).
2.2 Bacterial Culture
Media
These may be individually purchased from any supplier of commonbacterial growth components or as pre-preparedmedia. In our lab allproducts are provided by Sigma (http://www.sigmaaldrich.com).The components and amounts for 1 L of medium are given below:
1. 112 Van Niel’s yeast agar medium (ATCC medium: http://www.atcc.org): K2HPO4 1 g, MgSO4 0.5 g, yeast extract 10 g,and agar 20 g. pH 7.0–7.2.
2. Syn medium: MgSO4 � 7H2O 250 mg, CaCl2 � 2H2O132 mg, NH4Cl 1 g, NiCl2 20 μM, MOPS 2.1 g and biotin2 μg, and 10 mL of a chelated iron-molybdenum aqueoussolution (H3BO3 0.28 g/L,, Na2EDTA 2 g/L, ferric citrate0.4 g/L, and Na2MoO4 0.1 g/L) adjusting pH to 7.1. Fol-lowing autoclaving and degasification, the medium was supple-mented with the subsequent anaerobic solutions: 0.05 mL ofpotassium phosphate buffer 1.91 M (pH 7.0), 0.1 mL ofNa2Sx9H2O 1% and 0.25 mL of NaHCO3 0.5 M (pH 8.0)[15], and the carbon source (15 mM fructose or 10 mMacetate).
3. Gassing station for dispensing anoxic gases is needed.Syringes from 1 to 5 mL (Plastipak BD: http://www.bd.com).
2.3 Culture
Preparation for
Anaerobic Growth
1. Nitrogen gas cylinder provided with a gas regulator (AirLiquide: http://www.airliquide.com).Serum bottles (Wheaton glass serum bottle (http://www.sigmaaldrich.com)), lyophilization stopper chlorobutyl20 mm (Wheaton W224100-202: http://www.wheaton.com), and lyophilization clamps with center disk tear-out(http://www.wheaton.com) (Fig. 2).
2.4 Syngas
Fermentation
Start the culture and syngas feeding. Parameter monitoring.
1. R. rubrum anaerobic culture in Syn-Fructose OD600 1.
2. Vacuum pump device (Fisher Scientific vacuum pump: http://www.fishersci.com).
3. CO gas detector (MX6 iBrid-Industrial Scientific: http://www.indsci.com).Syngas cylinder (Air Liquide: http://www.airliquide.com).A personalized syngas mixture was prepared from the provider.Its composition (purity; percentage (v/v) and ppm) is 40% CO,40% H2, 10% N2, and 10% CO2 (see Note 2). ATTENTION.Due to its CO content, syngas is toxic by inhalation and mustbe carefully handled.
108 O. Revelles et al.

2.5 Measurement
of Cell Dry Weight
(CDW)
1. Filter 0.4 μmØ (http://www.millipore.com); filtering flask andwater aspirator device for cell dry weight determination (FisherScientific: http://www.fishersci.com).
2. NaCl solution 0.9% as washing cell solution.
Fig. 2 Bottles and tools used to prepare anaerobic cultures; bottles for culturing anoxygenic R. rubrum,chorobutyl rubber stoppers, and aluminum clamps (a) and hand crimper for crimping aluminum caps onvessels (b). Gas supply equipment. (c) Oxygen purging with nitrogen while putting the needle connected to thegas nozzle directly into the liquid. (d) Vacuum is done inside the bottle for 1 min prior to adding the syngasmixture. (e) The headspace of the vial is refilled with syngas
Syngas Fermentation for Polyhydroxyalkanoate Production. . . 109
3. Oven at 55�C (Memmert: http://www.memmert.com).
4. Precision balance (Denver instrument, now Sartorius: http://www.sartorious.us).
2.6 HPLC Analyses
to Determine Biomass
Specific Rate
of Acetate
Consumption (Qs)
1. HPLC system (GILSON: http://www.gilson.com) equippedwith an Aminex HPX-87H column (http://www.bio-rad.com). Mobile phase: aqueous 2.5 mM H2SO4 solution. Datawere recorded and analyzed using KARAT 32 software (http://www.beckmancoulter.com).
2. Syringe filter 0.2 μm for chromatography (Whatman GD/Xsyringe filters: http://www.sigmaaldrich.com).
3. Screw caps and autosampler vials (http://www.chem.agilent.com).
4. Acetate stock solutions of 0.1 mM, 0.5 mM, 1 mM, 5 mM, and10 mM to calculate acetate standard curve (see Note 3).
2.7 Gas Analysis 1. Headspace (HS) sampler. Our instrument is the Agilent 7697A(http://www.chem.agilent.com) that comprises a 12-vialcarrousel for 10 or 20 mL vials inside an oven, a 1 mL injectionloop, and a 1 m transfer line. Vials are independently pressur-ized and leak-checked before injection and automaticallypurged after analysis using the control software (7697A Head-space Control MSD Data System rev. B.01.0X).
2. Gas chromatograph (GC) equipped with a ten-port valve and athermal conductivity detector (TCD). Our instrument is theAgilent 7890A (http://www.chem.agilent.com). Data wererecorded and analyzed using the instrument’s software GCChemStation rev. B.04.03-SP1 (87) from Agilent Technolo-gies, Inc.
3. Stainless steel columns: 80/100 Porapak Q (6 ft, 1/8 in.2 mm) and 60/80 MolSieve 13X (6 ft, 1/8 in. 2 mm). Thetwo columns are connected in series.
4. 10 mL beveled-neck flat bottom headspace vials, 20 mm alu-minum crimp caps, crimper for seals, and 20 mm PTFE/siliconsepta (PTFE, polytetrafluoroethylene) (http://www.agilent.com).
5. Helium N50 gas cylinder (Air Liquide: http://www.airliquide.com).
6. Gas-tight syringes of different volumes (http://www.sge.com)and disposable needles (25G, 0.5 � 16 mm) (http://www.bd.com).
110 O. Revelles et al.

2.8 PHB
Quantification:
Lyophilization,
Methanolysis, and Gas
Chromato-
graphy–Mass
Spectrometry (GC–MS)
1. Lyophilizer at �56�C and 10�2 mbar (Cryodos-50 Telstar:http://www.telstar.com).
2. Chloroform-methanol solution containing 15% sulfuric acidand 0.5 mg/mL of 3-methylbenzoic acid (IS) (http://www.sigmaaldrich.com).
3. Thermoblock at 80�C (Fisher Scientific dry bath: http://www.fishersci.com).
4. Standard curve from 0.5 to 2 mg of PHB from Sigma (Cat:36,350-2) (http://www.sigmaaldrich.com) (see Note 3).
5. Screw caps and autosampler vials (http://www.chem.agilent.com).
6. Gas chromatograph (GC) with split/splitless injector andquadrupolar mass detector (MS) equipped with a HP-5MScapillary column (30 m � 0.25 mm � 0.25 μm). Our systemis the Agilent 7890A/5975C (http://www.chem.agilent.com), and data are acquired and processed with the softwareMSD ChemStation E.02.00.493 from Agilent Technologies,Inc.
2.9 General
Equipment
1. Centrifuge (Eppendorf Centrifuge 5810R: http://www.eppendorf.com).
2. Spectrophotometer (Shimadzu: http://www.shimadzu.com).
3. Shaker at 30�C (Innova 44: http://www.eppendorf.com).
4. Phase contrast microscope (DM 4000B: http://www.leica-microsystems.com).
5. Gassing station for dispensing anoxic gases.
3 Methods
3.1 Culture
Preparation for
Anaerobic Growth
and Syngas
Fermentation: Tricks
for Keeping Anaerobic
Conditions While
Feeding Syngas
Bottles of any convenient shape are used to cultivate anaerobicbacteria on an intermediate-size scale (from 15 mL up to100 mL). The air must be removed from the culture. Further, theuse of anaerobe culture tubes and serum bottles requires propersealing by special chlorobutyl rubber stoppers that can be punc-tured without causing leaks, purging of the headspace with appro-priate oxygen-free gases, and proper sealing of the bottles withaluminum crimp caps.
1. Dissolve all the ingredients in distilled water, except heat-sensitive components (biotin), precipitate-causing materials(e.g., carbonate), reducing agents (Na2S � 9H2O), and bufferphosphate. Adjust pH to 7.0, and bring the volume up to 1 Lwith water. Heat the mixture to its boiling point and dispense itinto the culture bottles (20 mL medium/100 mL bottle).
Syngas Fermentation for Polyhydroxyalkanoate Production. . . 111

2. Oxygen removal is done by directly bubbling nitrogen into themedium in order to exclude dissolved oxygen (see Note 4). Todo so, a needle connected to the end of the gas nozzle isimmersed into the liquid for 30 min (Fig. 2c). To avoid bub-bling over the bottle, the nitrogen pressure supplied is regu-lated with the gas regulator. Keep the rubber stopper on top ofthe bottle during gassing. The bottle is rapidly sealed with handcrimper while removing the nozzle, leaving no chance foroxygen to enter. Finally, the bottle is tightened sealed withaluminum clamp (Fig. 2a, b).
3. The bottles with the culture medium are autoclaved at 121�Cfor 20 min.
4. After autoclaving and prior to inoculation, the medium issupplemented with the rest of anoxic solutions, and carbonsource different to syngas when needed (e.g., acetate or fruc-tose). Before being added, the supplements and reducingagents should be sterilized by filtration and then oxygen-purged with nitrogen under sterile conditions. The reducingagent (Na2S � 9H2O) should be added last. Sterile needlesand syringes are used to add these solutions to the mediumthrough the rubber stopper. Be sure that no bubbles trapped inthe syringe are injected into the medium.
5. To assure an aseptic and anaerobic handle, the top of the bottleshould be sterilized by wiping with 70% ethanol and flaming.
3.2 Inoculum
Preparation for Syngas
Fermentation
1. With an inoculating needle, take a single colony of R. rubrumfrom a fresh agar plate and transfer it into a screw-capped testtube of 10 mL filled with 5 mL of 112 Van Niel’s yeast mediumand close it (Fig. 3).
2. Incubate shaking at 250 rpm and 30�C. After 4–7 days thegrowth is evident by turbidity. When examinedmicroscopically,the cells appear as spiral-shaped rods, singles, and in chains(Fig. 1c).
3. Put at least 200 μL of the culture suspension into a 100 mLbottle with 20 mL Syn medium, yeast extract 1 g/L, and15 mM fructose, oxygen-free.
4. Incubate the broth culture at 30�C and 250 rpm. Subsequentgrowth should be detected within 48–72 h (Fig. 3).
3.3 Syngas
Fermentation: Start the
Culture and Syngas
Feeding
Syngas fermentation was carried out in 100 mL bottles containing20 mL of Syn medium supplemented with syngas and 10 mMacetate. The complete medium is prepared as follows:
1. Inoculate the bottles for syngas fermentation to an initialOD600 of 0.05 from the well-grown (OD600 ¼ 1–2) syn-Fructose-grown R. rubrum (see above). Prior to its
112 O. Revelles et al.

inoculation, centrifuge and wash out the medium. After wash-ing the culture cells, resuspend the pellet in 0.5 mL of freshmedium.
2. Purge the headspace gas of the bottle by making vacuum for1 min with the vacuum pump (Fig. 2d).
3. Saturate the headspace of the bottle with syngas to 1 atmo-sphere of pressure (Fig. 2e). This step was repeated every dayfor syngas feeding (see Note 5).
4. Grow shaking (250 rpm) at 30�C (see Note 6).
5. Take 1 mL sample every 12 h monitoring the OD600.
6. Spin down the cells by centrifugation at 8,000 � g for 10 minat 4�C, discard the pellet, and store the supernatant at �20�Cfor further analysis (see Subheading 3.5).
3.4 Measurement
of CDW
Measurement of CDW is an important parameter for estimatingbiomass concentration, productivity, and percentages of cell com-ponents. This experiment involves taking aliquots of the culturesuspension, drying samples to a constant weight, and expressingthis value as the weight of the dry cell matter per sample volume:
1. Dry overnight in an oven an empty cellulose acetate filtermembrane, 47 mm in diameter and 0.45 μm in pore size.Weigh and store them in a desiccator lined with Drierite (anhy-drous CaSO4).
Fig. 3 Squeme describing the different steps to perform syngas fermentation. (a) Aerobic growth, (b) anaerobicgrowth, and (c) syngas fermentation
Syngas Fermentation for Polyhydroxyalkanoate Production. . . 113

2. Measure OD600 (seeNote 7) of a syngas-growing fermentationculture in exponential phase. Take out 10 mL of the samecultures and filter them applying vacuum to pull the liquidthrough the membrane. Rinse the filter with 10 mL of NaCl0.9%. Three independent biological replicates of all determina-tions shall be performed. From each culture just one point atmid-exponential phase will be taken.
3. Dry overnight in an oven the filters containing the cell pasteand weigh them (see Note 8). Calculate the weight difference,normalize to the measured OD600, and express the dry weightin g/L per OD600 unit to obtain the conversion factor.
4. Convert the OD600 values to CDWusing the conversion factor.
3.5 HPLC Analysis
to Determine Acetate
(Qs) [16]
During syngas fermentation R. rubrum is consuming acetate andsyngas. In this section the Qs for acetate will be determined alongthe growth. It is important to stress that PHB production reachesits maximum when all the acetate is consumed and thus the impor-tance of this parameter.
1. Prepare standard solutions 0.1 mM, 0.5 mM, 1 mM, 5 mM,and 10 mM of sodium acetate to determine the retentiontime of acetate, as well as to make a standard calibration curve(see Note 3).
2. Filter the standard solutions or the sample supernatants(see Subheading 3.3.6) through 0.2 μm syringe filters into1.8 mL autosampler vials prior to HPLC analysis. A minimumvolume of 500 μL is needed.
3. Analyze the standards and samples by HPLC (see Subheading2.6.1) at 40�C with a mobile phase flow rate of 0.6 mL/min.
4. Determine peak areas by using the integration software of yoursystem.
5. Using the standard curve and the measured areas for theacetate peak in samples, deduce the acetate concentration.
6. Determine the acetate consumption rate(s) as the slope ofacetate consumption curve.
7. Biomass specific rate of substrate consumption, in our caseacetate (Qs), can be calculated from the substrate consumptionand biomass production rate (mmol.g.DW�1h�1).
8. Acetate uptake rate is the slope of the plot of acetate consump-tion versus time.
3.6 Gas Analysis [6] 1. Instrument configuration (HS-GC-TCD). The whole systemcomprised the 7697A HS sampler, coupled to a 7890A GCwith TCD. The GC is equipped with a ten-port valve, used toaddress the carrier flow through the columns in the right pathat different steps of the analytical method. Two stainless steel
114 O. Revelles et al.

columns, 80/100 Porapak Q (6 ft, 1/8 in. 2 mm) and 60/80Molesieve 13X (6 ft, 1/8 in. 2 mm) are connected in seriesinside the oven to achieve separation of all components of thegas mixture (see Note 9). The carrier gas (He) is maintained atconstant pressure (45 psi).
2. Chromatographic parameters:
1. HS sampler: The loop and transfer line temperatures arefixed at 100�C and the HS oven at 70�C. The times for vialequilibration and injection are 1 min and 0.5 min, respec-tively. Using the HS sampler software, the vial size (10 mL)is selected and the vials are programmed to be filled withHe to a final pressure of 14 psi (1 atmosphere). Then, 1 mLof sample is injected (single extraction mode) and each vialis automatically purged after injection. The complete GCcycle was set to 20 min.
2. GC: The initial oven temperature is isothermal for 5 min at30�C and then programmed to rise from 30 to 180�C at25�C min�1. The detector is set to 250�C and the valvebox at 100�C. The ten-port valve is initially set up in theON position, programmed to commute to OFF at 2.2 minfrom injection and again to ON at 10.9 min (see Note 10and Fig. 4). The GC run time is 11 min.
Under these experimental conditions, the elution order of thepotential analytes expected is H2 (detected as a negative peak),CO2, N2, H2O, and CO (see Note 11)
3. Preparation and analysis of syngas standards:
1. Fill with syngas (see Note 6) a 100 mL glass bottle with20 mL of fresh Syn medium closed with a rubber stopper.This bottle will be used as syngas stock.
2
H2
CO2
CO
N2
−500
500
1000
1500
25 µv
0
4 6 8 10 min
Fig. 4 Elution profile of a syngas standard using HS-GC-TCD. The elution order of the expected analytes is H2(detected as a negative peak), CO2, N2, H2O, and CO. The broken arrow indicates the change in the ten-portvalve position, initially set up in ON, and it is commuted to OFF at minute 2
Syngas Fermentation for Polyhydroxyalkanoate Production. . . 115

2. Degasified closed empty HS vials and purge with He (seeNote 12) for 2 min to ensure complete removal of air.
3. Withdraw known volumes (0.1, 0.25, 0.5, 1, 2, 5, and10 mL) of the bottle containing the syngas stock usingthe gas-tight syringe, and add each volume to one of theHS vials prepared. All standards are prepared and analyzedin duplicate.
4. Place the HS vials containing syngas standards in thecarrousel of the HS sampler and analyze standards by HS-GC-TCD to make the calibration curve (see Subheading3.6.2., Chromatographic parameters).
5. Using the GC data analysis software, integrate the chro-matograms corresponding to different calibration points.For each component of the standards mixture, plot con-centration vs. peak area to build its calibration curve. Con-centration is calculated by the ideal gas law PV ¼ nRT,where the letters denote pressure (P) of the system is 1atmosphere, volume (V), amount (n), ideal gas constant(R), and temperature of the gas (T), respectively. Assessresponse linearity in the concentration range assayed forevery standard.
4. Preparation and analysis of samples:1. Using a gas-tight syringe, extract 0.5 mL samples extracted
from the headspace of cultures, from 0 to up to 7 days.
2. Inject the sample in HS vials filled with He. Samples areprepared and analyzed in duplicate.
3. Place the sample vials in the carrousel of the HS samplerand analyze by HS-GC-TCD (see Subheading 3.6.2,Chromatographic parameters).
4. Using the GC data analysis software, integrate the chro-matograms. From the peaks areas, calculate the concentra-tion of each sample’s component using the calibrationcurve.
3.7 PHB
Quantification [17, 18]
The most widely used approach for PHB quantification comprisesbiomass lyophilization, polymer methanolysis followed by GC–MSanalysis of the methylated monomers.
1. Centrifuge at 8,000 � g for 15 min at 4�C.Wash the cells twiceusing MilliQ water.
2. Froze the cells at �80�C for at least 1 h and lyophilize them at�56�C and 10�2 mbar. We use a Cryodos-50 Telstarlyophilizer.
3. Weigh the dry cell pellet to estimate the CDW, expressed inmg/L.
116 O. Revelles et al.

4. Suspend from 5 to 10 mg of lyophilized cells into 0.5 mL ofchloroform and 2 mL of methanol containing 15% sulfuric acidand 0.5 mg/mL of 3-methylbenzoic acid (internal standard).
5. Vortex properly the mixture and incubate the sample at 100�Cfor 4 h in an oil bath.
6. Chill the samples on ice for 5 min.
7. Add 1 mL of MilliQ water and 1 mL of chloroform and vortexthe samples.
8. Centrifuge at 3,500 rpm (Eppendorf Centrifuge 5810R).
9. Recover the organic phase where the methyl esters are andproceed to analyze it by GC–MS as explained in Subheading2.8.6.
10. Apply the previously described procedure on known quantitiesof a commercial PHB standard to prepare a standard curvefrom 0.5 to 2 mg of PHB (see Note 3).
11. For quantification of the sample components, integrate samplepeak areas by using the integration method of your system, andinterpolate these values in the PHB calibration curve.
4 Notes
1. R. rubrum can be stored at �80�C in 15% glycerol (viable for>5 years) or at 4�C on Petri agar plate of Van Niel’s yeast agarmedium (viable for 1 week).
2. Syngas mixture composition (purity; percentage (v/v) andppm) is H2 (Alphagaz range 1; 40%, 400 ppm), N2 (Alphagazrange 1; 10%, 100 ppm), CO (N37; 40%, 20,000 ppm), andCO2 (N38; 10%, 5,000 ppm).
3. A calibration curve should be generated for each analyte in thesample, and the concentrations of the standards should bechosen on the basis of the concentration range expected inthe study. Therefore, to prepare a good calibration curve, ablank and at least six samples covering the expected rangemust be prepared and analyzed.
4. A redox sensitive dye, for instance, resazurin, can be included inthe culture media to monitor the redox potential. Resazurin iscommonly used because it is not toxic and very low concentra-tions (0.5 to 1 mg/L) are needed. It turns pink when oxygen ispresent.
5. Invert the bottle upside down and introduce the needleconnected to the nozzle of gas in the medium through thestopper. Adjust the gas regulators to 1 atm and fill the bottleuntil bubbling ceases.
Syngas Fermentation for Polyhydroxyalkanoate Production. . . 117

6. A high ratio of gas-to-liquid volume and vigorous stirring ofthe cell suspension are needed to enhance gas-liquid masstransfer throughout the growth period.
7. Volume must be adapted to the amount of biomass. We suggestto do a linear regression curve OD versus CDW and estimatingthe conversion factor from the lineal range of the curve.
8. Depending on the oven temperature and the thickness of thecellpaste, it can take between 6 and 24 h to dry the sample. Toensure complete sample dryness, weigh the filters periodicallyuntil constant weight.
9. CO2 and water are retained and separated in Porapak andpermanent gases (H2, O2, N2, and CO) in the MolSievecolumn.
10. The ten-port valve was initially set up in the ON position,allowing the carrier gas and sample to flow through the col-umns in the direction Porapak-MolSieve-TCD. After 2.2 minfrom injection, before CO2 and water enter the molecular sievecolumn, the valve is programmed to commute to the OFFposition, which changes the carrier and sample path flow toMolSieve-Porapak-TCD. Doing this, the entrance of CO2 andwater inside the second column, which would cause their irre-versible retention and then the impossibility of detecting them,is avoided. Just before the end of the chromatographic run(10.9 min), the valve is reset to its initial position.
11. Notice that if the sample is contaminated with air, the order ofanalytes will be H2 (detected as a negative peak), O2, CO2, N2,H2O, and CO.
12. Vials are purged with He via two disposable needles stuckthrough the cap. One is connected through PTFE tubing tothe gas cylinder, and the additional needle allows venting of thegas excess.
Acknowledgments
The design of this protocol was supported by the project EuropeanCommission SYNPOL no. 311815 [http:\crwww.sympol.org]. Weare indebted to Prof. Jose Luis Garcıa, the SYNPOL coordinator,for the helpful discussions about this technology.
References
1. Latif H, Zeidan AA, Nielsen AT, Zengler K(2014) Trash to treasure: production of biofuelsand commodity chemicals via syngas fermentingmicroorganisms.CurrOpinBiotechnol27:79–87
2. Munasinghe PC, Khanal SK (2010) Biomass-derived syngas fermentation into biofuels:opportunities and challenges. Bioresour Tech-nol 101(13):5013–5022
118 O. Revelles et al.

3. Belgiorno V, De Feo G, Della Rocca C, NapoliRMA (2003) Energy from gasification of solidwastes. Waste Manag 23(1):1–15
4. Munasinghe PC, Khanal SK (2010) Syngas fer-mentation to biofuel: evaluation of carbonmonoxide mass transfer coefficient (kLa) indifferent reactor configurations. BiotechnolProg 26(6):1616–1621
5. Beneroso D, Bermudez JM, Arenillas A,Menendez JA (2015) Comparing the compo-sition of the synthesis-gas obtained from thepyrolysis of different organic residues for apotential use in the synthesis of bioplastics. JAnal Appl Pyrolysis 111:55–63
6. Younesi H, Najafpour G,Mohamed AR (2005)Ethanol and acetate production from synthesisgas via fermentation processes using anaerobicbacterium, Clostridium ljungdahlii. BiochemEng J 27(2):110–119
7. Do YS, Smeenk J, Broer KM et al (2007)Growth ofRhodospirillum rubrum on synthesisgas: conversion of CO to H2 and poly-beta-hydroxyalkanoate. Biotechnol Bioeng 97(2):279–286
8. Najafpour GD, Younesi H (2007) Bioconver-sion of synthesis gas to hydrogen using a light-dependent photosynthetic bacterium Rhodos-pirillum rubrum. World J Microbiol Biotech-nol 23(2):275–284
9. Kim Y-K, Park SE, Lee H, Yun JY (2014)Enhancement of bioethanol production in syn-gas fermentation with Clostridium ljungdahliiusing nanoparticles. Bioresour Technol159:446–450
10. Klasson KT, Gupta A, Clausen EC, Gaddy JL(1993) Evaluation of mass-transfer and kineticparameters for Rhodospirillum rubrum in acontinuous stirred tank reactor. Appl BiochemBiotechnol 39–40(1):549–557
11. Kerby RL, Hong SS, Ensign SA et al (1992)Genetic and physiological characterization ofthe Rhodospirillum rubrum carbon monoxidedehydrogenase system. J Bacteriol 174(16):5284–5294
12. Uffen RL (1976) Anaerobic growth of a Rho-dopseudomonas species in the dark with carbonmonoxide as sole carbon and energy substrate.Proc Natl Acad Sci U S A 73(9):3298–3302
13. Buchanan BB, Evans MC (1965) The synthesisof alpha-ketoglutarate from succinate and car-bon dioxide by a subcellular preparation of aphotosynthetic bacterium. Proc Natl Acad SciU S A 54(4):1212–1218
14. Buchanan BB, Evans MC, Arnon DI (1967)Ferredoxin-dependent carbon assimilation inRhodospirillum rubrum. Arch Mikrobiol 59(1):32–40
15. Kerby RL, Ludden PW, Roberts GP (1995)Carbon monoxide-dependent growth of Rho-dospirillum rubrum. J Bacteriol 177(8):2241–2244
16. Revelles O, Millard P, Nougayred JP et al(2013) The carbon storage regulator (Csr) sys-tem exerts a nutrient-specific control over cen-tral metabolism in Escherichia coli strain Nissle1917. PLoS One 8(6):e66386
17. Lageveen RG, Huisman GW, Preusting H,Ketelaar P, Eggink G, Witholt B (1988) For-mation of polyesters by Pseudomonas oleovor-ans: effect of substrates on formation andcomposition of poly-(R)-3-hydroxyalkanoatesand poly-(R)-3-hydroxyalkenoates. Appl Envi-ron Microbiol 54:2924–2932
18. de Eugenio LI, Escapa IF, Dinjaski N et al(2010) The turnover of medium‐chain‐lengthpolyhydroxyalkanoates in Pseudomonas putidaKT2442 and the fundamental role of PhaZdepolymerase for the metabolic balance. Envi-ron Microbiol 12(1):207–221
Syngas Fermentation for Polyhydroxyalkanoate Production. . . 119

Genetic Strategies on Kennedy Pathway to ImproveTriacylglycerol Production in Oleaginous RhodococcusStrains
Martın A. Hernandez and Hector M. Alvarez
Abstract
During the last years, microorganisms (yeasts, fungi, microalgae, and bacteria) have been receiving increas-ing attention as alternative lipid sources (also called single cell oils). Some lipid-accumulating bacteria, inparticular those belonging to actinomycetes, are able to synthesize remarkably high amounts of triacylgly-cerides (TAGs) (up to 70% of the cellular dry weight) from simple carbon sources such as glucose, which areaccumulated as intracellular lipid bodies. The applied potential of bacterial TAG may be similar to that ofvegetable oil sources, such as additives for feed, cosmetics, oleochemicals, lubricants, and other manufac-tured products. In addition, bacterial oils have been recently considered as alternative sources for biofuelproduction. Because the development of an industrial and commercially significant process depends on theoptimization of engineered cells and the technological procedures, several efforts to improve the naturalaccumulation of microbial lipids have been performed around the world. This chapter focuses on somegenetic strategies for improving TAG accumulation in bacteria using oleaginous Rhodococcus strains asmodel. Particularly, protocols focus on the two last enzymatic steps of the Kennedy pathway by over-expression of ro00075 gene and 2 atf genes coding for a phosphatidic acid phosphatase type 2 (PAP2) anddiacylglycerol acyltransferase (WS/DGAT) enzymes, respectively.
Keywords: Biofuels, PAP2, Rhodococcus, Triacylglycerols, WS/DGAT
1 Introduction
Triacylglycerides (TAGs) are neutral lipids commonly found ineukaryotic organisms, including animals, plants, yeasts, and fungi,which constitute an important storage material, used as energyand/or carbon sources. In addition, TAGs also occur frequentlyin certain groups of prokaryotes as storage lipids. Although someGram-negative bacteria are able to accumulate neutral lipids such aswax esters (WEs) and TAG, the ability to synthesize and accumulatesignificant amounts of these last is mainly common in members ofactinobacteria, such as Rhodococcus, Mycobacterium, Nocardia, andStreptomyces, among other genera (Table 1) [1–6]. These
T.J. McGenity et al. (eds.), Hydrocarbon and Lipid Microbiology Protocols, Springer Protocols Handbooks, (2017) 121–139,DOI 10.1007/8623_2015_134, © Springer-Verlag Berlin Heidelberg 2015, Published online: 18 September 2015
121

microorganisms produce variable amounts of TAG during cultiva-tion with different carbon sources, and some species are able toaccumulate these neutral lipids at very high levels. This is the case ofsome Rhodococcus strains, such as R. opacus PD630 and R. jostiiRHA1, which are able to accumulate TAG up to 60% by cellular dryweight with gluconate, glucose, and other carbon sources whengrown under nitrogen-limiting conditions (media with low con-centration or in the absence of the nitrogen source) or in culturemedia with high C/N ratio [1–3, 7]. For this reason, such oleagi-nous microorganisms can be considered good candidates for singlecell oil production. In this context, bacterial oils may be useful forthe production of feed additives, cosmetics, oleochemicals, lubri-cants, and other manufactured products. In addition, bacteriallipids have been proposed as a source for biofuel production(biodiesel) by a chemical process of transesterification [8, 9].Lipid production by bacteria provides some advantage over usingvegetable sources, such as the high variability of fatty acid compo-sition in lipids, according to the use of diverse carbon sources forcell cultivation, as well as the better accessibility of bacterial cells forgenetic manipulations.
In the last years, several research efforts have been focused onthe culture conditions, biochemistry, and genetics of oil-accumulating bacteria, for designing a scalable and commercially
Table 1Occurrence of TAG and WE accumulation in bacteria
Bacteria Type of storage lipidsa
Gram positive
Rhodococcus opacus TAG/WERhodococcus jostii TAG/WERhodococcus fascians TAG/WERhodococcus erythropolis TAG/WERhodococcus ruber TAG/WENocardia asteroides TAGNocardia globerula TAGNocardia restricta TAGMycobacterium tuberculosis TAGMycobacterium smegmatis TAGMycobacterium ratisbonense TAG/WEStreptomyces coelicolor TAGStreptomyces avermitilis TAGGordonia sp. TAGDietzia sp. TAG
Gram negative
Acinetobacter baylyi WE/TAGAlcanivorax borkumensis WE/TAGMarinobacter hydrocarbonoclasticus WE
aThe occurrence of main neutral lipid is highlighted in bold letter
122 Martın A. Hernandez and Hector M. Alvarez

viable oil-producing system from inexpensive feedstocks. Particu-larly, in oleaginous Rhodococcus species, several genes involved inTAG metabolism have been identified and characterized [10–16].Additionally, several cloning/expression vectors for such actinobac-teria have been designed or adapted from related microorganisms asgenetic tools for basic studies or biotechnological purposes(Table 2).
Table 2Genetic tools used in Rhodococcus species
Plasmid Description Reference(s)
Replicative cloning vectors
pNC9503 E. coli/Rhodococcus shuttle vector, KmR, ThioR [17, 18]pNC9501 E. coli/Rhodococcus shuttle vector, KmR, ThioR [17–19]pRHBR71/171 E. coli/Rhodococcus shuttle vector, ApR, TetR [20]pFAJ2574 E. coli/Rhodococcus shuttle vector, CmR [21]pMVS301 E. coli/Rhodococcus shuttle vector, ApR, ThioR [22]pBS305 E. coli/Rhodococcus shuttle vector, ApR, ThioR [23]pDA21 E. coli/Rhodococcus erythropolis shuttle vectors, AsR [24]pDA71 E. coli/Rhodococcus erythropolis shuttle vectors, ApR, CmR [25]pRE-1 E. coli/Rhodococcus equi shuttle vector, ApR, KmR [26]pAL281/pAL298 E. coli/Rhodococcus shuttle vectors, GmR [27]pSRK21 E. coli/Rhodococcus erythropolis shuttle vector, KmR [28]pIAM1484 E. coli/Rhodococcus shuttle vector, ApR, KmR [29]pRF37 E. coli/Rhodococcus fascians shuttle vector, ApR, BlR [30]pK4 E. coli/Rhodococcus shuttle vector, KmR [31]pRESQ E. coli/Rhodococcus shuttle vector, KmR [32]pAL358 E. coli/Rhodococcus shuttle vector, GmR [33, 34]pAL307 E. coli/Rhodococcus shuttle vector, SpcR [34]
Expression vectors
pJAM2 Mycobacterium/Rhodococcus/E. coli shuttle vector withPace, Km
R[35–37]
pTip series vectors Rhodococcus/E. coli shuttle vector with PtipA, Cm/TetR,ThioR
[38, 39]
pNit series vectors Rhodococcus/E. coli shuttle vector with Pnit, Cm/TetR,ThioR
[39]
pDEX Rhodococcus dual-expression vector with PtipA and Pnit,ApR, CmR, ThioR
[40]
pPR27ace Mycobacterium-based vector with Pace, GmR [41, 11]pSM846 Rhodococcus/E. coli shuttle vector with a constitutive Pamy [42]pDPM70 Saccharomyces/Rhodococcus/E. coli shuttle vector with
Psmyc, GmR[14, 16]
(continued)
Genetic Strategies on Kennedy Pathway to Improve Triacylglycerol Production. . . 123

The biosynthesis and accumulation of TAG is a complexprocess that involves several catalytic enzymes participating atdifferent metabolic levels. In rhodococci, the main biosyntheticpathway for TAG biosynthesis, known as Kennedy pathway(Kennedy 1961), involves the sequential esterification of glyc-erol-3-phosphate producing phosphatidic acid (PA) (Fig. 1). PA,a key molecule for the biosynthesis of membrane glyceropho-spholipids in bacteria [52, 53], is dephosphorylated by a phos-phatidic acid phosphatase type 2 enzyme (PAP, EC 3.1.3.4) toyield diacylglycerol (DAG). The occurrence of this enzyme inactinobacteria and its role in TAG metabolism have beenrecently reported [12, 54]. The produced DAG is thencondensed with an acyl-CoA molecule to form TAG during thelast reaction of Kennedy pathway. This reaction is catalyzed bythe bifunctional wax ester synthase/diacylglycerol acyltransferase(WS/DGAT) enzymes encoded by the so-called atf genes. Inter-estingly, in Gram-positive actinomycete group, a high geneticredundancy of these enzymes is found, including 15 putative atfgenes in Mycobacterium tuberculosis [5], 14 atf genes in Rhodo-coccus jostii RHA1 [7], three in Streptomyces coelicolor [55], and atleast 16 in Rhodococcus opacus PD630 [9, 11]. Because PAP andWS/DGAT could catalyze the rate-limiting steps in the TAG forma-tion in oleaginous actinobacteria, the identification of those genesencoding for both types of enzymes is an important aspect not onlyto understand the glycerolipid metabolism but also as a key point tomanipulate TAG accumulation in such microorganisms.
Table 2(continued)
Plasmid Description Reference(s)
Integrative/transposable vectors
pMV306/pMVace Integrative plasmid containing the attachment site (attP)and integrase gene (int) of the L5 mycobacteriophage
[43–45], thischapter
pSET152 Integrative plasmid containing the attachment site (attP)and integrase gene (int) of the phiC31 actinophage, ApR
[46]
pBP5 Integrative plasmid containing the attachment site (attP)and integrase gene (int) of the L1 mycobacteriophage
[47]
pTO1 Integrative plasmid containing the attachment site (attP)and integrase gene (int) of the phiC31 actinophage
[48, 49]
pTNR-KA/pTNR-TA Transposon-based vectors used as protein expressionsystems in Rhodococcus species
[50]
pTip-istAB-sacB/pRTSK-sacB system
Transposon-based vectors for random integration ofmultiple copies of DNA into the Rhodococcus genome
[51]
124 Martın A. Hernandez and Hector M. Alvarez

In this context, the present chapter describes two previouslyreported strategies focused on the Kennedy pathway for improvingTAG accumulation in oleaginous Rhodococcus strains, including:
1. Overexpression of ro00075 gene encoding a PAP2 enzyme(see Fig. 1) in Rhodococcus jostii RHA1 and Rhodococcus opacusPD630 by using the pJAM2 and pTip-QC2 expression vectors
2. Individual overexpression of two atf genes (atf1 and atf2)coding for 2 WS/DGAT enzymes (see Fig. 1) in Rhodococcusopacus PD630 by using the pJAM2, pPR27ace, and pTip-QC2expression vectors
In addition, the integrative plasmid for Mycobacterium(pMVace) is herein used as a genetic tool for introducing an extrasingle copy of the atf2 gene under the Pace promoter into thechromosomal DNA of Rhodococcus opacus PD630. Finally, a briefprotocol for the semiquantitative analysis of TAG content inrecombinant strains is also described.
Fig. 1 Kennedy pathway reactions for the biosynthesis and accumulation of TAG.GPATs glycerol-3-phosphate acyltransferases, AGPATs acyl-glycerol-3-phosphate acyltransferases, PAPs phosphatidic acid phosphatases, DGKsdiacylglycerol kinases, DGATs diacylglycerol acyltransferases
Genetic Strategies on Kennedy Pathway to Improve Triacylglycerol Production. . . 125

2 Materials
2.1 DNA
Amplification, Cloning,
and Sequencing
1. PCR reaction mix: 13.5 μLH2O, 5 μL 5� PCR buffer (50 mMTrisHCl, pH 8.5, MgCl2 7.5 mM), 1 μL dNTP mix (contain-ing 5 mM of each dNTP), 1 μL primer F, 1 μL primer R,1.25 μL DMSO, 0.25 μL Taq polymerase (5 U/ μL), and2 μL of DNA.
2. PCR primers: Synthetic oligonucleotides used in the protocolsdescribed in this chapter are listed in Table 3 (see Note 1).Primers are diluted to 25 pmol/μL from a stock solution of100 pmol/μL.
3. DNA template: Total DNA of R. jostii RHA1 and R. opacusPD630 are used for amplification of ro00075 gene and the twoatf genes, respectively.
4. Bacteria and TA cloning vector: For cloning purposes, use E.coli (JM109 or DH5α strains) and a TA cloning plasmid and itsligation buffer purchased from any supplier.
5. Blue/white colony selection: Use solid LB media supplemen-ted with ampicillin (100 μg/mL), X-Gal (80 μg/mL), andIPTG (0.5 mM).
6. Other reagents: Agarose molecular grade and DNA purifica-tion kit (from enzymatic reaction and agarose gels).
2.2 Subcloning
Strategies
1. Bacteria and expression vectors: E. coli DH5α can be used forsubcloning purposes. Rhodococcus parental strains, expressionplasmids, recombinant plasmids, and resultant recombinantstrains described in this chapter are listed in Table 4. Vectors
Table 3Oligonucleotides for PCR assays described in this chapter
Primers Sequencea
ro00075F 50TGGATCCATGCCCCACACCTCCATCGCCA 30
ro00075R 50GTTCCCCTCTAGAGCCTCCCACTCGGT 30
atf2MHF 50TGGGGCATATGCCGGTTACCGATTC 30
atf2MHR 50AAGCTTTCAGAGCAATGCCGCCTCGA 30
atf1MHF 50ACGAATCAGGGATCCATGACCCAGACGGA 30
atf1MHR 50GTGCGTGTGTCTAGAGCACGAGG 30
aceF 50TCGCAGCGCCGTCAGTCACCAA 30
thioF 50TACATATCGAGGCGGGCTCCCA 30
aRestriction sites used for subcloning purposes are underlined
126 Martın A. Hernandez and Hector M. Alvarez

Table 4Strains and plasmids described in this chapter
Strain or plasmid Description Source
Strains
E. coliDH5α E. coli K-12 F_ lacU169 (ϕ80lacZΔM15) endA1
recA1 hsdR17 deoR supE44 thi-1-l2 gyrA96relA1. Use for cloning and subcloningpurposes
[56]
JM109 endA1 glnV44 thi-1 relA1 gyrA96 recA1 mcrB+
Δ(lac-proAB) e14- [F’ traD36 proAB+ lacIq
lacZΔM15] hsdR17(rK-mK
+). Use for cloningpurposes
Promega
Rhodococcus
R. jostii
RHA1 Parental strain [57]RHA1 pJAM2 RHA1 derivative carrying pJAM2 plasmid, used
as control strain; KmR[12]
RHA1 pJAM2/RO00075 RHA1 derivative carrying pJAM2/ro00075; KmR [12]RHA1 pTip-QC2 RHA1 derivative carrying pTip-QC2 plasmid,
used as control strain; CmR[12]
RHA1 pTip-QC2/RO00075 RHA1 derivative carrying pTip-QC2 /ro00075;CmR, ThioR
[12]
R. opacus
PD630 Parental strain DSM 44193PD630 pJAM2 PD630 derivative carrying pJAM2 plasmid, used
as control strain; KmR[11]
PD630 pJAM2/RO00075 PD630 derivative carrying pJAM2/ro00075;KmR
[12]
PD630 pTip-QC2 PD630 derivative carrying pTip-QC2 plasmid,used as control strain; CmR
[12]
PD630 pTipQC2/RO00075 PD630 derivative carrying pTip-QC2 /ro00075;CmR, ThioR
[12]
PD630 pJAM2/atf1 PD630 derivative carrying pJAM2/atf1; KmR [11]PD630 pPR27ace/atf2 PD630 derivative carrying pPR27ace/atf2; GmR [11]PD630 pMVace/atf2 PD630 derivative carrying integrative plasmid
pMVace/atf2; KmR
[11]
Plasmids
pGEM-T-easy vector Linear plasmid used for cloning PCR products;ApR
Promega
pJAM2 Shuttle E. coli–Mycobacterium–Rhodococcus withPace promoter; KmR
[32]
pJAM2/ro00075 pJAM2 derivatives carrying ro00075 gene undercontrol of Pace ; KmR
[12]
pTip-QC2 Expression vector for Rhodococcus with PtipApromoter, repAB (pRE2895); CmR
[36]
(continued)
Genetic Strategies on Kennedy Pathway to Improve Triacylglycerol Production. . . 127

of DNA are prepared by a commercial mini-prep extraction andstored at �20�C.
2. Restriction endonucleases and other enzymes: BamHI, XbaI,HindIII, NdeI, NotI, T4 DNA ligase, and its buffers.All enzymes may be purchased from any supplier.
3. Other reagents: Agarose molecular grade and DNA purifica-tion kit (from enzymatic reactions and agarose gels).
2.3 Electroporation
of Rhodococcus Cells
1. Electroporator: Electroporation of Rhodococcus cells requires ahigh-voltage electroporator. Good efficiencies have beenobtained with the model 2510 electroporator (Eppendorf-Netheler-Hinz, Hamburg, Germany).
2. Cuvettes of 400 μL with electrode gaps of 2 mm.
3. Cold bidistilled water and ice containers.
4. LBmedia and LBmedia supplemented with glycine (0.85% w/v)and sucrose (1% w/v).
2.4 Bacterial
Cultures
1. For routine growth of E. coli and Rhodococcus strains, use solidor liquid Luria-Broth (LB) media and incubate them at 37�Cand 28�C, respectively. LB medium may be purchased for anysupplier or prepared from individual components as:
(a) 10 g/L peptone, 5 g/L yeast extract, and 5 g/L NaCl indistilled water
Table 4(continued)
Strain or plasmid Description Source
pTip-QC2/ro00075 pTip-QC2 carrying ro0075 gene under control ofPtipA; CmR
[12]
pJAM2/atf1 pJAM2 derivatives carrying atf1 gene undercontrol of Pace ; KmR
[11]
pPR27 E. coli–Mycobacterium shuttle vector, oriMtemps, sacB, XylE; GmR
[39]
pPR27ace/atf2 pPR27 derivatives carrying atf2 gene undercontrol of Pace ; GmR
[11]
pTip-QC2/atf2 pTip-QC2 carrying atf2 gene under control ofPtipA; CmR
[11]
pMVace (pMR22) Integrative plasmid derived from pMV306 andcontaining a Pace promoter; KmR
[45], this chapter
pMVace/atf2 pMVace carrying atf2 gene under control of Pace;KmR
[11]
128 Martın A. Hernandez and Hector M. Alvarez

2. To allow TAG accumulation, use a minimal salt medium(MSM) prepared from individual components as:
(a) 9 g/L Na2HPO4. 12 H2O, 1.5 g/L KH2PO4, 0.1 g/LNH4Cl, 0.2 g/L MgSO4. 7 H2O, 20 mg/L CaCl2.2 H2O, 1.2 mg/L Fe(III)NH4-citrate, and 0.1 mL/L oftrace element solution SL6 (10 mg/L ZnSO4. 7 H2O,3 mg/L MnCl2. 4 H2O, 30 mg/L H3BO3, 20 mg/LCoCl2. 6 H2O, 1 mg/L CuCl2. 2 H2O, 2 mg/L NiCl2.6 H2O, 3 mg/LNa2MoO4. 2 H2O) in distilled water. Useglucose as sole carbon source at a final concentration of 1%(w/v) in MSMmedia (seeNote 2). Use 0.1 g/L of ammo-nium chloride in MSM0.1 culture media. Do not addammonium chloride for preparing MSM0 culture media(see Note 3).
3. Use agar-agar for solid media at a final concentration of 1.4%(w/v). Autoclave under standard condition and adjust the pHto 7. If necessary, add antibiotics after autoclaving at differentfinal concentrations as follows: 100 μg/mL ampicillin (Ap),50 μg/mL kanamycin (Km), 5 μg/mL gentamicin (Gm), and34 μg/mL chloramphenicol (Cm) for both E. coli and Rhodo-coccus cell cultures.
4. For overexpression analysis of genes under the acetamidasepromoter Pace of pJAM2/pPR27ace/pMVace vectors, add0.5% (w/v) of acetamide to cell cultures at time zero. Foroverexpression analysis of genes under the thiostrepton pro-moter PTipA of pTip-QC2 vector, add 1μg/mL of thiostreptonto cell cultures at time zero (see Note 4).
2.5 Lipid Analysis 1. Solvents for lipid extraction: Chloroform andmethanol. HPLCgrade.
2. Solvents for TLC development: Hexane, diethyl ether, andacetic acid. HPLC grade.
3. TLC plates: Silica gel 60 F254 plates (Merck). Activate at 65�Cbefore use for 30 min.
4. Pure iodine crystals (see Note 5).
5. Reference lipids: Use tripalmitin dissolved in chloroform asTAG standard at a final concentration of 1 mg/mL.
3 Methods
This section describes a protocol for TAG overproduction inoleaginous Rhodococcus strains by overexpression of three genes:ro00075, atf1, and atf2. For this, construction of several recom-binant molecules using the vectors pJAM2, pTip-QC2, pPR27ace,and pMVace is described. Some of these constructions contain a
Genetic Strategies on Kennedy Pathway to Improve Triacylglycerol Production. . . 129

C-terminal or N-terminal 6�His-tag fusion, and gene productscan be detected by Western blotting. The resulted recombinantstrains are then subjected to semiquantitative TLC analysis ofTAG content.
3.1 DNA
Amplification, Cloning,
and Sequencing
The first step for construction of recombinant molecules is thecorrect amplification of complete coding sequence of interest. Forspecific DNA amplification of ro00075, atf1, and atf2 genesdescribed in this chapter, perform PCR assays with specific primerslisted in Table 4. Use total DNA of R. jostii RHA1 and R. opacusPD630 as template for amplification of ro00075 and the two atfgenes, respectively. In all cases, use the following thermocyclerparameters: 5 min at 94�C, 30 cycles of 1 min at 94�C, 30 s at60�C, 1 min at 72�C, and finally 5 min at 72�C. After checking on1% agarose gel, clone the PCR products into any TA cloning vector,transform in E. coli, and perform screening of colonies by the blue/white color selection and then by colony PCR. Select positiveclones and verify the correct amplification by DNA sequencing ofpurified plasmid.
3.2 Subcloning
Strategies
3.2.1 Subcloning of
ro00075 Gene in pJAM2
Vector (see Fig. 2)
To achieve overexpression of ro00075 in R. jostii RHA1 andR. opacus PD630 strains under an inducible acetamide promoterPace (also called Pami), proceed as follows:
1. Cut both purified plasmids pJAM2 and pGEM-T-easy/ro00075 with the enzymes BamHI and XbaI. Purify the linear-ized pJAM2 vector directly from the enzymatic reaction. Afterrunning the cut pGEM-T-easy/ro00075 on a 1% agarose gel,purify the ro00075 gene of ~700 bp from TBE agarose gelusing a DNA purification kit.
2. To a 0.5-mL tube, add the cut pJAM2 vector and the ro00075insert at molar ratios ranging from 1:1 to 1:2, 10� ligationbuffer, and dH20 to 10 μL. Add T4 DNA ligase, mix, andincubate overnight at 8�C.
3. Transform in E. coli DH5α and check kanamycin-resistantcolonies by colony PCR using the primers aceF/RO00075R(Table 4).
3.2.2 Subcloning of
ro00075 Gene in pTip-QC2
Vector (see Fig. 2)
To achieve overexpression of ro00075 in R. jostii RHA1 and R.opacus PD630 strains under an inducible thiostrepton promoter(PTipA), proceed as follows:
1. Cut both plasmids pTip-QC2 vector and pJAM2/ro00075obtained above with the enzymes BamHI and HindIII (seeNote 6). Purify the linearized pTip-QC2 vector directly fromthe enzymatic reaction using a DNA purification kit. Afterrunning the cut pJAM2/ro00075 on a 0.8% agarose gel, purifythe fragment of ~2.27 kb carrying the ro00075 gene from thegel using a DNA purification kit.
130 Martın A. Hernandez and Hector M. Alvarez

2. To a 0.5-mL tube, add the cut pTip-QC2 vector and thero00075-carrying fragment at molar ratios ranging from 1:1to 1:2, 10� ligation buffer, and dH20 to 10 μL. Add T4 DNAligase, mix, and incubate overnight at 8�C.
3. Transform in E. coliDH5α and check ampicillin-resistant colo-nies by colony PCR using the primers thioF/RO00075R(Table 4).
3.2.3 Subcloning of atf1
Gene in pJAM2 Vector (see
Fig. 2)
To achieve overexpression of atf1 in Rhodococcus opacus PD630strain under an inducible acetamide promoter Pace, proceed asfollows:
1. Cut both purified plasmids pJAM2 and pGEM-T-easy/atf1with the enzymes BamHI and XbaI. Purify the linearized
Fig. 2 Overview of molecular strategies described in this chapter for ro00075 and atf1 overexpression inpJAM2 and pTip-QC2 vectors. The transferred molecules to Rhodococcus cells are marked with an asterisk.The size of plasmids is not to scale
Genetic Strategies on Kennedy Pathway to Improve Triacylglycerol Production. . . 131

pJAM2 vector directly from the enzymatic reaction. After run-ning the cut pGEM-T-easy/atf1 on a 1% agarose gel, purify theatf1 gene of ~1,460 bp from TBE agarose gel using a DNApurification kit.
2. To a 0.5-mL tube, add the cut pJAM2 vector and the atf1insert at molar ratios ranging from 1:1 to 1:2, 10� ligationbuffer, and dH20 to 10 μL. Add T4 DNA ligase, mix, andincubate overnight at 8�C.
3. Transform in E. coli DH5α and check kanamycin-resistantcolonies by colony PCR using the primers aceF/atf1MHR(Table 4).
3.2.4 Subcloning of atf2
Gene in the Integrative
Plasmid pMVace Vector (see
Fig. 3)
To achieve overexpression of atf2 under an inducible acetamidepromoter Pace as a single extra copy in Rhodococcus opacus PD630strain by using an integrative plasmid, proceed as follows:
1. Cut both purified plasmids pMVace and pGEM-T-easy/atf2with the enzymes NdeI and HindIII. Purify the linearizedpMVace vector directly from the enzymatic reaction. After run-ning the cut pGEM-T-easy/atf2 on a 1% agarose gel, purify theatf2 gene of ~1,380 bp from TBE agarose gel using a DNApurification kit.
2. To a 0.5-mL tube, add the cut pMVace vector and the atf2insert at molar ratios ranging from 1:1 to 1:2, 10� ligationbuffer, and dH20 to 10 μL. Add T4 DNA ligase, mix, andincubate overnight at 8�C.
3. Transform in E. coli DH5α and check kanamycin-resistantcolonies by colony PCR using the primers aceF/atf2MHR(Table 4).
3.2.5 Subcloning of atf2
Gene in pPR27ace Vector
(see Fig. 3)
To achieve overexpression of atf2 in Rhodococcus opacus PD630strain under an inducible acetamide promoter Pace in a replicativeplasmid version with a gentamicin resistance (see Note 7), proceedas follows:
1. Cut both purified plasmids pPR27 and pMVace/atf2 obtainedabove with the enzymes BamHI andNotI. Purify the linearizedpPR27 vector directly from the enzymatic reaction using aDNA purification kit. After running the cut pMVace/atf2 in a0.8% agarose gel, purify the fragment of ~3.6 kb carrying theatf2 gene under Pace promoter from the agarose gel using aDNA purification kit (see Note 8).
2. To a 0.5-mL tube, add the cut pPR27 vector and the atf2-carrying fragment at molar ratios ranging from 1:1 to 1:2, 10�ligation buffer, and dH20 to 10 μL. Add T4 DNA ligase, mix,and incubate overnight at 8�C.
132 Martın A. Hernandez and Hector M. Alvarez

3. Transform in E. coli DH5α and check gentamicin-resistantcolonies by colony PCR using the primers aceF/atf2MHR(Table 4).
3.2.6 Subcloning of atf2
Gene in pTip-QC2 Vector
(See Fig. 3)
To achieve overexpression of atf2 in Rhodococcus opacus PD630strains under an inducible thiostrepton promoter (PTipA), proceedas follows:
1. Cut both purified plasmids pTip-QC2 and pMVace/atf2obtained above with the enzymes NdeI and HindIII (seeNote 9). Purify the linearized pTip-QC2 vector directly fromthe enzymatic reaction using a DNA purification kit. Afterrunning the cut pMVace/atf2 in a 0.8% agarose gel, purify theatf2 fragment of ~1,364 bp from the agarose gel using a DNApurification kit.
2. To a 0.5-mL tube, add the cut pTip-QC2 vector and the atf2insert at molar ratios ranging from 1:1 to 1:2, 10� ligationbuffer, and dH20 to 10 μL. Add T4 DNA ligase, mix, andincubate overnight at 8�C.
3. Transform inE. coliDH5α and check ampicillin-resistant coloniesby colony PCR using the primers thioF/atf2MHR (Table 4).
Fig. 3 Overview of molecular strategies described in this chapter for atf2 overexpression in pMVace, pPR27ace,and pTip-QC2 vectors. The transferred molecules to Rhodococcus cells are marked with an asterisk. The sizeof plasmids is not to scale
Genetic Strategies on Kennedy Pathway to Improve Triacylglycerol Production. . . 133

3.3 Electroporation
of Rhodococcus Cells
Transfer all recombinant plasmids to R. jostii RHA1 and R. opacusPD630 by electroporation based on the method described byKalscheuer et al. (1999) [17]:
1. To obtain electrocompetentRhodococcus cells, inoculate 25 mLof LB medium in a 100 mL Erlenmeyer flask supplementedwith 0.85% (w/v) glycine and 1% (w/v) sucrose with 1 mL ofan overnight LB preculture and grown at 28�C to an opticaldensity of 0.5 at 600 nm.
2. Harvest cells, wash twice with ice-cold bidistilled H2O, andconcentrate 20-fold in ice-cold bidistilled H2O.
3. Immediately before the electroporation, mix 400 μL of com-petent cells with DNA (0.1–1 μg/mL) and preincubate at40�C for 5 min. Perform electroporation in cuvettes withgaps of 2 mm and the following settings: 10 kV/cm, 600 Ω,and 25 μF. Accept time constants of 3–5 ms only. Diluteimmediately pulsed cells with 600 mL of LB and incubate at28�C for 4 h (see Note 10) before plating on appropriateselective media. Check plates after 3–4 days.
Additionally, transfer to R. jostii RHA1 and R. opacus PD630the correspondent empty plasmids to obtain control cells. Performcolony PCR of at least five individual clones to check the presenceof each gene in the recombinant plasmids. For this, use the setprimers aceF/RO00075R, aceF/atf1MHR, and aceF/atf1MHRto check ro00075, atf1, and atf2 genes under Pace and thioF/RO00075R, thioF/atf1MHR, and thioF/atf2MHR to checkro00075, atf1, and atf2 genes under PTipA promoters, respectively(see Table 4). Select one positive clone of each recombinant strainfor further analysis.
3.4 Bacterial
Cultures
After obtaining recombinant strains, the next step is to analyze thephenotype. The next protocol is focused particularly in the cellularconditions for TAG accumulation. For this, proceed as follows:
1. Pick isolated colonies of both recombinant Rhodococcus strainsand its respective controls (cells containing the empty vector)from fresh plates and transfer into 20 mL liquid Luria-Broth(LB) medium and cultivate cells aerobically at 28�C and200 rpm overnight. Use the appropriate antibiotic (see Sect. 2).
2. Inoculate fresh LB media with 2 mL of the overnight precul-tures and incubate again at 28�C and 200 rpm for 24 h.Harvest cells and wash twice with sterile physiological solution(NaCl 0.85% w/v).
3. Inoculate 1 mL of resuspended cells (DO600 4) into 20 mL ofMSM0.1 media or resuspend all harvest cells in 25 mLMSM0.Use glucose as sole carbon source at a final concentration of1% (w/v).
134 Martın A. Hernandez and Hector M. Alvarez
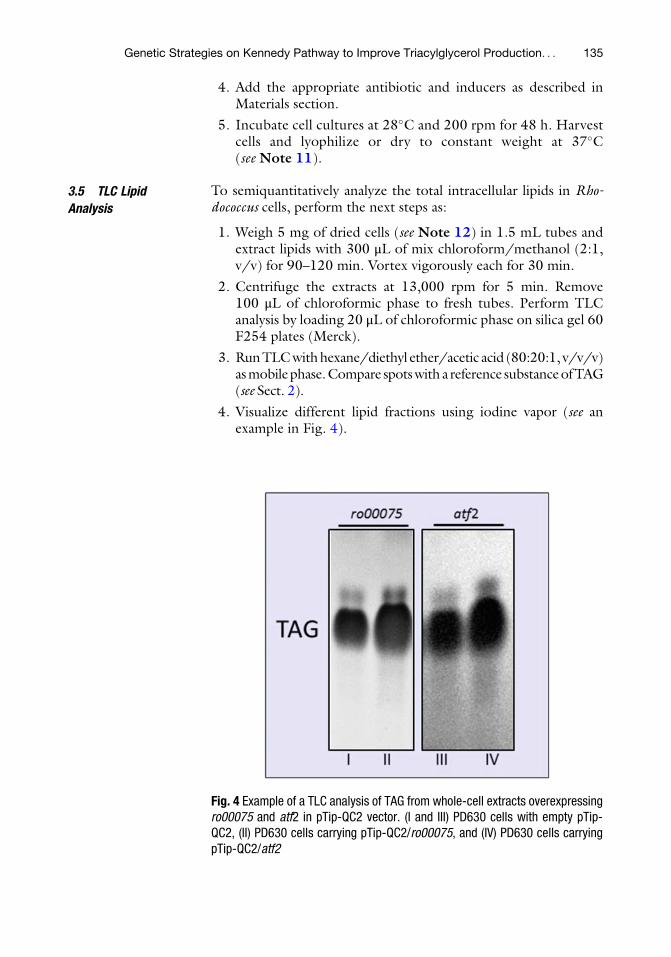
4. Add the appropriate antibiotic and inducers as described inMaterials section.
5. Incubate cell cultures at 28�C and 200 rpm for 48 h. Harvestcells and lyophilize or dry to constant weight at 37�C(see Note 11).
3.5 TLC Lipid
Analysis
To semiquantitatively analyze the total intracellular lipids in Rho-dococcus cells, perform the next steps as:
1. Weigh 5 mg of dried cells (see Note 12) in 1.5 mL tubes andextract lipids with 300 μL of mix chloroform/methanol (2:1,v/v) for 90–120 min. Vortex vigorously each for 30 min.
2. Centrifuge the extracts at 13,000 rpm for 5 min. Remove100 μL of chloroformic phase to fresh tubes. Perform TLCanalysis by loading 20 μL of chloroformic phase on silica gel 60F254 plates (Merck).
3. RunTLCwithhexane/diethyl ether/acetic acid (80:20:1, v/v/v)asmobilephase.Compare spotswith a reference substanceofTAG(see Sect. 2).
4. Visualize different lipid fractions using iodine vapor (see anexample in Fig. 4).
Fig. 4 Example of a TLC analysis of TAG from whole-cell extracts overexpressingro00075 and atf2 in pTip-QC2 vector. (I and III) PD630 cells with empty pTip-QC2, (II) PD630 cells carrying pTip-QC2/ro00075, and (IV) PD630 cells carryingpTip-QC2/atf2
Genetic Strategies on Kennedy Pathway to Improve Triacylglycerol Production. . . 135

Additionally, TAG content can be quantified as total fatty acidsfrom dried Rhodococcus cells by GC analysis or a colorimetricmethod as described in previous works [58, 59].
4 Notes
1. Alternative restriction sites can be used in primers for subclon-ing purposes according to the cloning sites in vector systemsdescribed in this chapter [32, 36, 39].
2. In this chapter, glucose is proposed as carbon source; however,another carbon source can be used at appropriate final concen-tration [2, 3].
3. MSM0 medium is used to analyze more accurately TAG bio-synthesis, independently of the cellular growth. Under theseconditions, cell growth is impaired because the nitrogen sourceis lacking in the medium; thus, cells utilize the available carbonsource principally for TAG biosynthesis and accumulation. Weobserved that the use of MSM0 medium containing an excessof a carbon source promotes more pronounced differences inTAG concentrations between control and recombinant cells.
4. To our experience, we observed a better recombinant proteinproduction when the inducer is added at the beginning of thecell cultivation without a loss of cellular viability; however, varia-tions in the addition times and final concentrations of inducerscan be applied for different genes in the same expression vectors.
5. Because oleaginous Rhodococcus cells are able to accumulatelarge amounts of neutral lipids (mainly TAG and minoramounts of free fatty acids, DAG and MAG), iodine vaporsare sufficient for a rapid and sensitive visualization of them.In addition, the sensibility can be increased putting pre-iodine-stained plates under UV light of a transilluminator.Other techniques can be used to visualize lipids on TLC platesas the cupric-phosphoric staining.
6. Please note that ro00075 gene (~700 bp) can be also directlyamplified and subcloned into pTip-QC2 vector using theappropriate restriction enzymes such as NdeI/HindIII andBamHI/HindIII, among others.
7. Please note that atf2 gene (~1,380 bp) can be directly amplifiedand subcloned into pJAM2 vector (which is also a replicativeplasmid containing the Pace promoter, but with a kanamycinresistance) using the restriction enzymes BamHI/XbaI.
8. At this point, two fragments are visualized in agarose gel: a3.2 kb and a 3.6 kb fragment. Because of the similar size of bothfragments, we recommend using a low-concentration agarosegel to separate them. Purify only the 3.6 kb fragment.
136 Martın A. Hernandez and Hector M. Alvarez

9. Please note that atf2 gene (~1,380 bp) can be also subclonedinto pTip-QC2 vector withNdeI/HindIII from pGEM-T-easy/atf2 directly. Alternatively, other restriction enzymes can be used.
10. Overnight incubation can also be performed with good results.
11. Wet biomass can be also used for a rapid analysis of neutrallipids. For this, normalize cell pellets by OD600 measurementsof cellular cultures by triplicate.
12. The chosen amount of dry biomass depends on the expectedlevels of TAG. For oleaginous strains, 5 mg is sufficient for TLCassays as well as the quantitative analyses. For non-oleaginousstrains or assays under non-accumulation conditions, at least10 mg of dry biomass is required.
References
1. Alvarez HM, Steinb€uchel A (2002) Triacylgly-cerols in prokaryotic microorganisms. ApplMicrobiol Biotechnol 60:367–376
2. Alvarez HM, Mayer F, Fabritius D, Steinb€u-chel A (1996) Formation of intracytoplasmiclipid inclusion by Rhodococcus opacus PD630.Arch Microbiol 165:377–386
3. Alvarez HM, Kalscheuer R, Steinb€uchel A(1997) Accumulation of storage lipids in spe-cies of Rhodococcus and Nocardia and effect ofinhibitors and polyethylene glycol. Fett-Lipid99:239–246
4. Barksdale L, Kim KS (1977) Mycobacterium.Bacteriol Rev 41:217–372
5. Daniel J, Deb C, Dubey VS, Sirakova TD,Abomoelak B, Morbidoni HR, KolattukudyPE (2004) Induction of a novel class of diacyl-glycerol acyltransferases and triacylglycerolaccumulation in Mycobacterium tuberculosis asit goes into a dormancy-like state in culture. JBacteriol 186:5017–5030
6. Olukoshi ER, Packter NM (1994) Importanceof stored triacylglycerols in Streptomyces: possi-ble carbon source for antibiotics. Microbiology140:931–943
7. Hernandez MA, Mohn WW, Martınez E, RostE, Alvarez AF, Alvarez HM (2008) Biosynthe-sis of storage compounds by Rhodococcus jostiiRHA1 and global identification of genesinvolved in their metabolism. BMC Genomics12:600
8. Alvarez HM (2010) Biotechnological produc-tion and significance of triacylglycerols and waxesters. In: Kenneth NT (ed) Microbiology ofhydrocarbons, oils, lipids, and derived com-pounds. Springer, Heidelberg, pp 2995–3002
9. Holder JW, Ulrich JC, DeBono AC, GodfreyPA, Desjardins CA, Zucker J, Zeng Q, Leach
ALB, Ghiviriga I, Dancel C, Abeel T, Gevers D,Kodira CD, Desany B, Affourtit JP, Birren BW,Sinskey AJ (2011) Comparative and functionalgenomics of Rhodococcus opacus PD630 forbiofuels development. PLoS Genet 7(9),e1002219. doi:10.1371/journal.pgen.1002219
10. Alvarez AF, Alvarez HM, Kalscheuer R,W€altermann M, Steinb€uchel A (2008) Cloningand characterization of a gene involved in tria-cylglycerol biosynthesis and identification ofadditional homologous genes in the oleaginousbacterium Rhodococcus opacus PD630. Micro-biology 154:2327–2335
11. Hernandez MA, Arabolaza A, Rodrıguez E,Gramajo H, Alvarez HM (2013) The atf2gene is involved in triacylglycerol biosynthesisand accumulation in the oleaginous Rhodococ-cus opacus PD630. Appl Microbiol Biotechnol97:2119–2130
12. Hernandez MA, Comba S, Arabolaza A, Gra-majo H, Alvarez HM (2014) Overexpressionof a phosphatidic acid phosphatase type2 leads to an increase in triacylglycerol pro-duction in oleaginous Rhodococcus strains.Appl Microbiol Biotechnol. doi:10.1007/s00253-014-6002-2
13. Villalba MS, Alvarez HM (2014) Identificationof a novel ATP-binding cassette transporterinvolved in long-chain fatty acid import andits role in triacylglycerol accumulation in Rho-dococcus jostii RHA1. Microbiology160:1523–1532
14. MacEachran DP, Prophete ME, Sinskey AJ(2010) The Rhodococcus opacus PD630heparin-binding hemagglutinin homologTadA mediates lipid body formation. ApplEnviron Microbiol 76(21):7217–7225
Genetic Strategies on Kennedy Pathway to Improve Triacylglycerol Production. . . 137

15. Ding Y, Yang L, Zhang S, Wang Y, Du Y, Pu J,Peng G, Chen Y, Zhang H, Yu J, Hang H, WuP, Yang F, Yang H, Steinb€uchel A, Liu P(2012) Identification of the major functionalproteins of prokaryotic lipid droplets. J LipidRes 53(3):399–411
16. MacEachran DP, Sinskey AJ (2013) The Rho-dococcus opacus TadD protein mediates triacyl-glycerol metabolism by regulating intracellularNAD(P)H pools. Microb Cell Fact 12:104
17. Kalscheuer R, Arenskotter M, Steinb€uchel A(1999) Establishment of a gene transfer systemfor Rhodococcus opacus PD630 based on elec-troporation and its application for recombinantbiosynthesis of poly(3-hydroxyalkanoic acids).Appl Microbiol Biotechnol 52:508–515
18. Arenskoetter M, Baumeister D, Kalscheuer R,Steinbuechel A (2003) Identification andapplication of plasmids suitable for transferof foreign DNA to members of the genusGordonia. Appl Environ Microbiol 69:4971–4974
19. Matsui T, Saeki H, Shinzato N, Matsuda H(2006) Characterization of Rhodococcus-E. colishuttle vector pNC9501 constructed from thecryptic plasmid of a propene-degrading bacte-rium. Curr microbiol 52:445–448
20. Kostichka K, Tao L, Bramucci M, Tomb JF,Nagarajan V, Cheng Q (2003) A small crypticplasmid from Rhodococcus erythropolis: charac-terization and utility for gene expression. ApplMicrobiol Biotechnol 62(1):61–68
21. De Mot R, Nagy I, De Schrijver A, Pattanapi-pitpaisal P, Schoofs G, Vanderleyden J (1997)Structural analysis of the 6 kb cryptic plasmidpFAJ2600 from Rhodococcus erythropolisNI86/21 and construction of Escherichia coli-Rhodococcus shuttle vectors. Microbiology143:3137–3147
22. Singer ME, Finnerty WR (1988) Constructionof an Escherichia coli-Rhodococcus shuttle vectorand plasmid transformation inRhodococcus spp.J Bacteriol 170:638–645
23. Shao Z, Dick WA, Behki RM (1995) Animproved Esherichia coli–Rhodococcus shuttlevector and plasmid transformation inRhodococ-cus spp. using electropolation. Lett ApplMicrobiol 21:261–266
24. Dabbs ER, Gowan B, Anderson SJ (1990)Nocardioform arsenic resistance plasmid andconstruction of Rhodococcus cloning vectors.Plasmid 23:242–247
25. Dabbs ER (1998) Cloning of genes that haveenvironmental and clinical importance fromrhodococci and related bacteria. Antonie vanLeeuwenhoek 74:155–168
26. Zheng H, Tkachuk-Saad O, Prescott JF (1997)Development of a Rhodococcus equi-Escherichiacoli plasmid shuttle vector. Plasmid 38(3):180–187
27. Lessard PA, O’Brien XM, Currie DH, SinskeyAJ (2004) pB264, a small, mobilizable, tem-perature sensitive plasmid from Rhodococcus.BMC Microbiol 4:15
28. Vesely M, Patek M, Nesvera J, Cejkova A,Masak J, Jirku V (2003) Host-vector systemfor phenol-degrading Rhodococcus erythropolisbased on Corynebacterium plasmids. ApplMicrobiol Biotechnol 61:523–527
29. Rhee J, Cho J, Lee S, Park O (2006) Rhodococ-cus-E. coli vector. PCT WO2006/088307 A1August 2006
30. Desomer J, Dhaese P, Montagu MV (1990)Transformation of Rhodococcus fascians byhigh-voltage electroporation and developmentof R. fascians cloning vectors. Appl EnvironMicrobiol 56(9):2818–2825
31. Masai E, Yamada A, Healy JM, Hatta T, Kim-bara K, Fukuda M, Yano K (1995) Characteri-zation of biphenyl catabolic genes of gram-positive polychlorinated biphenyl degraderRhodococcus sp. strain RHA1. Appl EnvironMicrobiol 61:2079–2085
32. Van der Geize R, Hessels GI, Van Gerwen R,Van der Meijden P, Dijkhuizen L (2002)Molecular and functional characterization ofkshA and kshB, encoding two components of3-ketosteroid 9 α-hydroxylase, a class IAmonooxygenase, in Rhodococcus erythropolisstrain SQ1. Mol Microbiol 45:1007–1018
33. Yang JC, Lessard PA, Sinskey AJ (2007) Char-acterization of the mobilization determinantsof pAN12, a small replicon from Rhodococcuserythropolis AN12. Plasmid 57:71–81
34. Kurosawa K, Wewetzer SJ, Sinskey AJ (2013)Engineering xylose metabolism in triacylgly-cerol producing Rhodococcus opacus for ligno-cellulosic fuel production. Biotechnol Biofuels6:134
35. Triccas JA, Parish T, Britton WJ, Giquel B(1998) An inducible expression system permit-ting the efficient purification of a recombinantantigen fromMycobacterium smegmatis. FEMSMicrobiol Lett 167:151–156
36. H€anisch J, W€altermann M, Robenek H,Steinb€uchel A (2006) The Ralstonia eutrophaH16 phasin PhaP1 is targeted to intracellulartriacylglycerol inclusions in Rhodococcus opacusPD630 and Mycobacterium smegmatismc2155, and provides an anchor to targetother proteins. Microbiology 152:3271–3280
138 Martın A. Hernandez and Hector M. Alvarez

37. Jackson M, Brigitte G (2003) Method ofscreening anti-mycobacterial molecules. USPatent 6,573,064 B1 Jun 2003
38. Nakashima N, Tamura T (2004) A novel sys-tem for expressing recombinant proteins over awide temperature range from 4 to 35�C. Bio-technol Bioeng 86:136–148
39. Nakashima N, Tamura T (2004) Isolation andcharacterization of a rolling-circle-type plasmidfrom Rhodococcus erythropolis and applicationof the plasmid to multiple-recombinant-pro-tein expression. Appl Environ Microbiol70:5557–5568
40. Mitani Y, Nakashima N, Sallam KI, Toriyabe T,Kondo K, Tamura T (2006) Advances in thedevelopment of genetic tools for the genusRhodococcus. Actinomycetologica 20:55–61
41. Pelicic V, Jackson M, Reyrat JM, Jacobs WR Jr,Gicquel B, Guilhot C (1997) Efficient allelicexchange and transposon mutagenesis inMyco-bacterium tuberculosis. Proc Natl Acad Sci USA94:10955–10960
42. Margarit R (2001) Means and methods for theexpression of homologous proteins in strains ofRhodococcus. European patent application EP1127943 A2
43. Stover CK, De la Cruz VF, Fuerst TR, BurleinJE, Benson LA, Bennett LT, Bansal GP, YoungJF, Lee MH, Hatfull GF, Snapper SB, BarlettaRG, Jacobs WR Jr, Bloom BR (1991) New useof BCG for recombinant vaccines. Nature351:456–460
44. Kong D, Kunimoto D (1995) Secretion ofHuman Interleukin 2 by Recombinant Myco-bacterium bovis BCG. Infect Immun 63(3):799–803
45. Salzman V, Mondino S, Sala C, Cole ST, GagoG, Gramajo H (2010) Transcriptional regula-tion of lipid homeostasis in mycobacteria. MolMicrobiol 78(1):64–77
46. Hong Y, Hondalus MK (2008) Site-specificintegration of StreptomycesΦC31 integrase-based vectors in the chromosome of Rhodococ-cus equi. FEMS Microbiol Lett 287:63–68
47. Dotson EM, Plikaytis B, Shinnick TM, Durva-sula RV, Beard CB (2003) Transformation ofRhodococcus rhodnii, a symbiont of the Chagasdisease vector Rhodnius prolixus, with integra-tive elements of the L1 mycobacteriophage.Infect Genet Evol 3(2):103–109
48. Voeykova T, Emelyanova L, Tabakov V,Mkrtumyan N (1998) Transfer of plasmidpTO1 from Escherichia coli to various represen-tatives of the order Actinomycetales by interge-neric conjugation. FEMS Microbiol Lett162:47–52
49. Voeykova T, Tabakov V, Ryabchenko L,Mkrtumyan N, Yanenko A (1994) Conjugativetransfer of plasmid pTO1 from Escherichia colito Rhodococcus spp. FEMS Microbiol Lett16:555–560
50. Sallam KI, Tamura N, Tamura T (2007) Amultipurpose transposon-based vector systemmediates protein expression inRhodococcus ery-thropolis. Gene 386:173–182
51. Sallam KI, Tamura N, Imoto N, Tamura T(2010) New vector system for random, single-step integration of multiple copies of DNA intothe Rhodococcus genome. Appl Environ Micro-biol 2531–2539
52. Zhang YM, Rock CO (2008) Membrane lipidhomeostasis in bacteria. Nat Rev Microbiol6:222–233
53. Parsons JB, Rock CO (2013) Bacterial lipids:metabolism and membrane homeostasis. ProgLipid Res 52(3):249–276
54. Comba S, Menendez-Bravo S, Arabolaza A,Gramajo H (2013) Identification and physio-logical characterization of phosphatidic acidphosphatase enzymes involved in triacylgly-cerol biosynthesis in Streptomyces coelicolor.Microb Cell Fact 12:9
55. Arabolaza A, Rodriguez E, Altabe S, AlvarezH, Gramajo H (2008) Multiple pathways fortriacylglycerol biosynthesis in Streptomyces coe-licolor. Appl Environ Microbiol 74:2573–2582
56. Hanahan D (1983) Studies on transformationof Escherichia coli with plasmids. J Mol Biol166:557–580
57. Seto M, Kimbara K, Shimura M, Hatta T,Fukuda M, Yano K (1995) A novel transforma-tion of polychlorinated biphenyls by Rhodococ-cus sp. strain RHA1. Appl Environ Microbiol61(9):3353–3358
58. Duncombe WG (1963) The colorimetricmicro-determination of long chain fatty acids.Biochem J 88(1):7–10
59. Wawrik B, Harriman BH (2010) Rapid colori-metric quantification of lipid from algal cul-tures. J Microbiol Methods 80(3): 262–266
Genetic Strategies on Kennedy Pathway to Improve Triacylglycerol Production. . . 139

Production of Biofuel-Related Isoprenoids Derivedfrom Botryococcus braunii Algae
William A. Muzika, Nymul E. Khan, Lauren M. Jackson,Nicholas Winograd, and Wayne R. Curtis
Abstract
The colony algae Botryococcus braunii produces large amounts of C30+ triterpene hydrocarbons. Recentdiscovery of the associated biosynthetic genes has facilitated the metabolic engineering of these triterpenehydrocarbons in alternative hosts – where squalene has served as an analytical standard and a closelyassociated model hydrocarbon biosynthetic pathway. An extraction and analysis method is provided forboth the native and heterologous systems. In the case of the native algae, the hydrocarbons are tightlyassociated with a complex wall matrix. In addition to quantification of extracted triterpenes by GC-FID,secondary ion mass spectrometry (SIMS) has also provided an assessment from “in vivo” samples at roomtemperature. For heterologous expression of the triterpene pathway in alternative hosts, the hydrocarbonsare found both intracellularly and extracellularly. The highly hydrophobic nature of these triterpenesprovides for relatively straightforward recovery by extraction into an organic phase. The methylation ofthe Botryococcus braunii race B hydrocarbons (which enhances its fuel precursor value) is readily resolved byGC-FID methods for routine analysis.
Keywords: Botryococcene, Extraction, Heterologous expression, Hydrocarbon, Triterpene
1 Introduction
Botryococcus is a prehistoric alga that produces hydrocarbons whichsurround the colony as a dominant component of the extracellularmatrix [1]. In contrast to lipids for biodiesel, which accumulate asan energy reserve, B. braunii hydrocarbons enable floatation of thealgae to enhance light access. Therefore, the genes encoding forHC production are expressed to result in a level of 25% or more ofthe biomass weight that is independent of the algae rate of growth[2]. Botryococcus has been studied for decades because the hydro-carbon has been recognized as an ideal “drop-in” feedstock forcatalytic cracking and reforming [3]. A particularly unique charac-teristic of the triterpene botryococcene and its methylated deriva-tives is that they are highly persistent in the aerobic extracellular
T.J. McGenity et al. (eds.), Hydrocarbon and Lipid Microbiology Protocols, Springer Protocols Handbooks, (2017) 141–152,DOI 10.1007/8623_2015_187, © Springer-Verlag Berlin Heidelberg 2015, Published online: 31 December 2015
141
environment and are chemically identifiable as a component of oilshales [4].
Because the oil accumulates to be a significant fraction of thealgae weight, there are frequent reports of hydrocarbon productionbased on gravimetric mass change upon organic extraction. Notsurprisingly, other hydrophobic cellular components co-extractwith the triterpene hydrocarbons. On the other hand, extensivesample preparation to remove contaminants before precise analyti-cal measurements results in loss of triterpene material. These twoapproaches represent over- and under-estimations of biomasshydrocarbon content. We recently made an effort to distinguishthese differences by clarifying units as mg oil-EG (extracted gravi-metric oil) and mg oil-AH (analytically determined hydrocarbon)to provide less ambiguous comparisons [2].
A recent development which increases the breadth of applica-tion for analytics is the identification of the hydrocarbon biosyn-thetic enzymes. Most notably, the generation of a chimeric enzymeto catalyze the conversion of the common isoprene precursorfarnesyl pyrophosphate (FPP) to botryococcene in a single step[5]. This provides a means to genetically engineer this pathwayinto alternative hosts with a subsequent need for analysis to evaluateproductivity. C15 and C30 production has been reported in theheterologous systems of bacteria [6] and plants [7] with botryo-coccene being expressed in yeast [8] and Rhodobacter [9], andexpression in Ralstonia eutropha is also noted in a recent thesisfrom our lab [10]. This focus on botryococcenes as a biofuelprecursor will invariably result in much more research to achieveheterologous expression. As an example, we have recently demon-strated a consortium bioprocessing approach to ethanol productionusing a yeast in combination with a biomass degrading Clostridium[11], and our lab is currently implementing the oxygen-mediatedsymbiotic consortium process using yeast which is engineered forhydrocarbon production.
It is interesting to note that the productivity of the native algaeis quite high by comparison to typical carbon fluxes in the terpenoidpathway [2] and is “on par,” or significantly greater than produc-tion achieved thus far for heterologous hosts – even those growingheterotrophically [12]. This illustrates that there is much to learnabout how these high hydrocarbon metabolic fluxes are achieved.
2 Materials
2.1 Native Algae
Botryococcus
Hydrocarbons
Cultures of Botryococcus are available from nearly every algae culturecollection, and we have tabulated references to more than 150published strains (www.botryococcus.org).
142 William A. Muzika et al.

2.1.1 Botryococcus
Hydrocarbons
Confusion still exists in these collections as there are very differentstrains of Botryococcus with substantially different hydrocarbonprofiles and even different metabolic pathways leading to the pro-duction of the hydrocarbons. B. braunii Race A produces C25–C31
n-alkadienes. Race B (the focus of the majority of our work) pro-duces C30–C34-methylated triterpenes, and minimally studied RaceL produces a C40 lycopadiene [13]. Hydrocarbon analysis has beensuggested as a means of definition of speciation rather than 18SrRNA [14].
2.1.2 Botryococcus
Growth Media
Chu-13 media [15], or minor modifications thereof [16], arecommonly utilized for the growth of Botryococcus. We utilize aWFAM media designed for better pH control in the absence ofCO2 buffering; however, this introduces considerations for nitro-gen feeding strategy [17]. These media are inorganic salt formula-tions and are therefore not prone to degradation; nonetheless, weprepare fresh liquid media for periods of 3–4 months. The handlingof Ca2+ and Mg2+ in media can require special consideration asthese promote precipitate formation which is particularly problem-atic if efforts include more concentrated media to achieve higheralgae cell concentration growth (see Note 1).
2.2 Metabolic
Pathway Engineered
Triterpenes
Terpenoid hydrocarbons have been extensively studied as possiblenext-generation biofuels [18]. This involves manipulation of eitherthe predominantly prokaryotic methylerythritol (MEP) or the pre-dominantly eukaryotic mevalonate (MVA) pathways. Our labora-tory has worked with constructs generated in collaboration withDr. Joe Chappell (U. Kentucky) as part of a DOE-sponsoredARPA-e project. Vector construction is dependent on the host,and details are available in a wide range of papers examining thebasic flux of the isoprene pathway [19, 20]. In our work withRhodobacter and Ralstonia, broad host range plasmids such aspBBR and pIND are typically used (see Note 2). Transformationof the isoprene metabolic pathways into alternative platforms canbe challenging, and we have recently reviewed aspects of transfor-mation methods in a recent assessment of the status of chemo-lithoautotrophic metabolic engineering [12]. The key aspect ofproducing botryococcene is to express the botryococcene synthasechimeric gene in the presence of the C15 precursor farnesyl pyro-phosphate (FPP) which is derived from isopentenyl diphosphate(IPP) and its isomer dimethylallyl diphosphate (DMAP) [21].Those interested in the details of metabolic engineering can findthose details in the associated references.
The method described below for GC-FID analysis was used tomeasure the intracellular and extracellular botryococcene triterpenelevel during autotrophic bioreactor runs of transgenic Rhodobactercapsulatus growing on gas mixture of H2, CO2, and O2 [9]. Sur-prisingly, a significant fraction of the botryococcene was found
Production of Biofuel-Related Isoprenoids Derived from Botryococcus braunii Algae 143

outside the cells in Fig. 1 – more than half at stationary phase [10].The mechanism by which this highly hydrophobic lipid exits cells isnot clear, particularly for the high fluxes of hydrocarbon observedin the extracellular matrix of the native Botryococcus braunii algae.
3 Methods
3.1 Growth of Algae
and Metabolically
Engineered Hosts
3.1.1 Growth of Algae
Botryococcus braunii algae can be grown in a range of lighting, CO2,and temperature levels (see Note 3). Nominal conditions of 25 �C,lighting PAR ¼ 100 μE/m2/s, and 2% CO2 are reasonable withvery large natural variations: 20–30�C, darkness to full sun (PAR¼ 2,000 μE/m2/s). While CO2 does not vary greatly in nature, therole of CO2 concentrations can relate to buffering rather than thesimplistic interpretation of CO2 availability (see Note 3).
3.1.2 Growth of Bacteria E. coli harboring plasmids for triterpene production follows stan-dard growth methods. We recently demonstrated that vastly differ-ent trophic modes of growth of Rhodobacter (aerobicheterotrophic, anaerobic photoheterotrophic, and chemolithoau-totrophic) all yielded surprisingly similar levels of triterpene hydro-carbon [9]. Recent unpublished work using Ralstonia eutrophaexpressing these pathways yielded similar levels of expression
1.7
4.4
6.5
6.7
4.0
10.6
Supernatant
Pellet
Total culture
Late Lag Phase Stationary Phase
Trite
rpen
e (m
g/L)
12
10
8
6
4
2
0
Fig. 1 Analysis of hydrocarbon production by Rhodobacter capsulatus geneticallyengineered with botryococcene synthase and enhanced flux through theisoprene pathway. Cultures are grown autotrophically on CO2, H2, and O2during late lag and stationary phase. Error bars represent analysis fromindependent batch cultures
144 William A. Muzika et al.

which was surprisingly unaffected by utilizing wild-type or PHBknockout strains (where the knockout is often presumed as theapproach to increase heterologous flux by eliminating this domi-nant storage biopolymer flux).
3.2 Extraction of
Hydrocarbon
In the native algae host, hydrocarbon can be gently extracted fromthe extracellular matrix with minimal reduction in cell growth rates[22]; however, a careful analysis of this data can reveal that there isnot a net increase in cellular productivity. We have used hexanerinses to establish axenic lines of Botryococcus [23] but focus here ona disruptive whole culture extraction procedure. This can beapplied to both native and heterologous triterpene productionand on culture fractions to assess location of hydrocarbon withinthe culture. The hydrophobic nature of isoprenes makes themamenable to integrated extraction which involves extraction duringbioreactor operation (see Note 4).
Extraction materials are acetone, n-hexane, hexanes, nitrogengas, silica gel, silane-treated glass wool, glass pasture pipettes,1.5 mL glass GC vial, 2 mL glass HPLC vial, and 2 mL HPLCvial screw caps with PFTE septum (plastic can introduce plasticizersthat adversely affect chromatogram; see Note 5).
3.2.1 Disrupt Cells
with Acetone
Place 0.5 mL of culture and 0.5 mL of acetone in a 2 mL glassHPLC vial and vortex for 30 s. Let it sit for 5–10 min to allow cellsto be fully permeabilized.
3.2.2 Extract
Hydrocarbons into
a Hexane Phase
Add an additional 0.5 mL of hexane and vortex vigorously for1 min to partition hydrocarbons into the organic phase. Let it sitfor 5–10 min.
3.2.3 Isolate Hexane
Layer for Analysis of
the Hydrocarbons
Centrifuge the extraction mixture at moderate speed(>2,000 RCF) for 10 min. Carefully remove the hexane phaseand place it in a new, clean vial. Take care not to touch the phaseinterface.
3.2.4 Purification of
Hydrocarbons by Removal
of Oxidized Species
The hexane phase can be poured over a column of silica gel. This isreadily constructed from ~0.4 g of silica placed within 5 ¾00 Pasteurpipette and pre-wetted with hexane before use. Triterpene is flushedfrom the column with three column volume washes and nitrogen topush the interstitial hexane into a 1.5 mL vial and dried under N2 toavoid further oxidation. This purification step can introducereduced yield and reproducibility for analysis (seeNote 6).
l Add a pinch of silane-treated glass wool to a Pasteur pipette andstuff it into the taper of the pipette.
l Add 0.4 g of 230–240 mesh silica gel.
l Wet the column with n-hexane until the first drop exits thecolumn.
Production of Biofuel-Related Isoprenoids Derived from Botryococcus braunii Algae 145

l Add an additional 1 mL of hexane and purge with nitrogen; donot allow the column to dry.
l Place a new collection vial below the column and add the hexanelayer to the top of the column.
l Purge the column with nitrogen.
l Wash the column twice with 1 mL of hexane. Collect this washin the same vial.
l Evaporate the collected hexane with a gentle stream of nitrogen.
l Once dried down, resuspend the eluted oil in 500 μL ofisooctane.
l Transfer the extract into a 2 mL sampling vial with a PTFE linedlid.
3.2.5 Hydrocarbon
Analysis by GC-FID
A 1 μL aliquot of the organic phase of the extraction mixture wasmeasured by GC-FID for analysis. The injection port is equippedwith an inlet liner having silica wool (deactivated) to trap thenonvolatile components. GC-FID analysis was conducted on anAgilent 7820A GC using a Restek, Rxi-5sil MS fused silica capillarycolumn (30 m � 0.25 mm � 0.25 μm film thickness). Squalenestandard was analyzed in concentrations ranging from 1 ng to100 ng to generate standard curves. 1 μL containing about 25 ngtriterpene oil is injected into the GC. The initial oven temperaturewas set to 100oC, ramped to 250oC at 15oC/min, and thenramped to 300oC at 5oC/min. Reported variations are given inthe table of Note 7.
The chromatogram of Fig. 2 demonstrates resolution of themethylated forms of botryococcene that occur in the B-race ofBotryococcus braunii which occurs at locations C-3, 7, 16, and 30through the actions of methyltransferases [8]. Many different per-mutations of columns and operational conditions have been used toachieve run times less than 10 min, which may result in reducedresolution of methylated forms; however, loss of resolutionmay notbe a major concern for measurements of total triterpene productionor in the case of genetically engineered hosts where only one form ispresent (e.g., Fig. 1). Standards for GC analysis to resolve differentmethylated forms have typically been isolated by HPLC withnumerous references in the literature with varying degrees of sepa-ration [8, 24, 25]. Mass spectra and additional spectroscopy havebeen utilized to further examine details of methylation in bothnative and heterologous hosts [25, 26].
3.2.6 Hydrocarbon
Analysis by Secondary Ion
Mass Spectroscopy (SIMS)
SIMS provides a means to measure hydrocarbons within biomasswithout requiring an extraction by vaporizing the sample usingbombardment with buckminsterfullerene (buckyball) ions [27]. A5 mL aliquot of algal suspension was deposited onto an 11 μm
146 William A. Muzika et al.

nylon filter mesh (Millipore) held at a vacuum of approximately1 torr. The algae were gently washed three times with 150 mMammonium formate (Alfa Aesar, 97%) solution to remove excessmedia materials. The vacuum was turned off and 0.5 mL of deio-nized water was immediately deposited onto the algae on the filterand mixed gently. A silicon shard (Ted Pella, Inc.) was cleaned bysonication 3x with methanol and water solutions, respectively.10 μL of the algae/water was deposited on the shard and dried ina desiccator for 10 min before introduction into the mass spec-trometer for analysis.
The SIMS analysis was done on the J105 Chemical Imager atroom temperature. A 0.5 pA 40 keV C60
+ primary ion current witha 75% duty cycle on a 100 � 100 μm2 area at 32 � 32 pixels2 wasused to depth profile through the B. braunii cells at a total ion doseof 2.35 � 1013 C60
+/cm2. Each SIMS image was collected over a100 � 100 μm2 field of view at 256 � 256 pixels.
The surface of the Botryococcus braunii race A is observed to berich in wax esters as noted in the top panel of Fig. 3. This invariablygives Botryococcus tremendous resistance to desiccation [28],similar to the role in of these hydrocarbons in human skin.
120
200
240
160
80
40
pA
Minutes14 15 16 17 18 19
C30
Botryococcene3
8 14 20
22
Increasing methylation atC-3, 7, 16, and 20
Fig. 2 Chromatogram of triterpene hydrocarbons extracted from Botryococcus braunii B algae cultures.Botryococcene elutes at 15.92 min for the conditions and column described in this work
Production of Biofuel-Related Isoprenoids Derived from Botryococcus braunii Algae 147

The triterpene hydrocarbons are found deeper within the coloniesof cells and characterized by small lipid bodies, consistent withultrastructural microscopic studies of these colony algae [29].
4 Notes
1. We routinely prepare autoclave sterilized magnesium and cal-cium solutions separately and add these inorganics immediatelybefore algae inoculation to minimize issues of precipitation:1 mL/L media of 0.51 mM MgCl2, 0.49 mM MgSO4;0.88 mL/L media of 0.9 mM CaCl2. Iron is added in chelatedform with EDTA, where historically Na2-EDTA and FeSO4
were prepared as a separate stock; it is now more typical touse the FeNa-EDTA even though the hydration state can bevariable. Care should be made to avoid variation in hydrationstate during storage and different chemical lots.
Fig. 3 Chemical images and mass spectra of Botryococcus braunii race A using secondary ion massspectrometry. Depth profiling is achieved by etching away the sample using C60 ion bombardment with thechemical images being reconstructed from the mass spectra of the secondary ions that are dislodged from thesurface due to ion impact: (a) Image of wax monoester region, (b) hydrocarbon region. Although raceA produces alkadiene hydrocarbons, the procedure is equally applicable for isoprene hydrocarbons ofB. braunii race B which will be described elsewhere
148 William A. Muzika et al.

2. While pIND has been shown to be stable in Rhodobactersphaeroides [30], in our hands, it was highly unstable in theclosely related species (R. capsulatus) which is of particularinterest due to robust chemolithoautotrophic growth. Thisemphasizes the potential difficulty of extending methods acrossplatform organisms that are less well characterized.
3. Botryococcus is often viewed as being a relatively difficult alga togrow. Where some have had trouble growing under high light(Chappell, personal communication), we have found that it canbe slowly adapted to light levels > 300 PAR (μE/m2/s).Growth on elevated CO2 seems to be particularly importantand may well be due to overcoming diffusional transport lim-itations of CO2/O2 and associated effects on photorespiration[31]. CO2 dissolves into water to produce carbonic acid andassociated equilibrium with carbonate species:
CO2 gð Þ↔CO2 aqð Þ þH2O↔H2CO3↔HCO�3 þHþ↔CO2�
3 þ 2Hþ
This can result in buffering pH when used in conjunction withcarbonate media components (as with mammalian cell culture)or more typically in algae to offset the effects of media basifica-tion during assimilation of nitrate [17, 32].
4. The integrated extraction of biologically produced productsduring production has long been recognized to have advan-tages in protecting the product of interest or facilitating greaterproduction rates by reducing “feedback inhibition” [33].Based on our prior work with sesquiterpene extraction andrecovery, the use of hydrophobic resins such as XAD-16might be an ideal way to “trap” and enhance extracellularproduction [34].
5. Glass vials must be used for all steps of the extraction. Thehydrocarbon extractants will dissolve components of the plasticvials, leading to excess baseline noise when the sample is runthrough the GC.
6. Although we report the silica gel purification step in our mostrecent work [9], we have subsequently found that the silica geltreatment decreases reproducibility in measurements, and wehave subsequently opted for routine analysis to avoid this stepand alternatively make more frequent changes to the GC septaand column regeneration by baking to accommodate for theslightly increased rate of fouling. We have also found that theuse of resuspension in isooctane instead of hexane provides aless volatile extract and, therefore, has reduced issues of evapo-rative concentration of the extracted samples. The culture acet-one–isooctane mixture is then centrifuged for 5 min at>2000 rcf. Cell debris pellets at the bottom and liquid phases
Production of Biofuel-Related Isoprenoids Derived from Botryococcus braunii Algae 149

separate into acetone–water (bottom) and the predominantlyisooctane (top) layers.
7. Many permutations of GC columns and conditions have beenused for Botryococcus braunii hydrocarbon analysis, even in ourown lab, with collaborators and in the literature. The tablebelow provides a sample of variations with associated referencesfrom which one can find more details.
Chromatograph Column details References
Agilent 7820A Restek, Rxi-5Sil MS fused silica(30 m � 0.25 mm � 0.25 μm film)1,4-bis(dimethylsiloxy)phenylene dimethylpolysiloxane
Here
ShimadzuGC-2014
J & W Science, DB-1(60 m � 0.25 mm � 0.25 μm film),dimethylpolysiloxane
[25]
Varian CP-3800 Supelco, SLB-5MS fused silica,(30 m � 0.25 mm � 0.25 μm film),cross-linked silphenylene
[8]
HP 5890 Restek, Rtx-5 ms fused silica(30 m � 0.25 mm � 0.25 μm film),diphenyl dimethyl polysiloxane
[2]
-na- Macherey-Nagel fused silica, OPTIMA 5,SE 52
(25 m � 0.31 mm � 0.19 μm film), 5%diphenyl – 95% dimethlypolysiloxane
[35]
Acknowledgments
We acknowledge the generous efforts of Dr. Joe Chappell through-out our development of algae and heterologous production oftriterpenes, including “in-house/hands-on” training on initialextraction and GC analytical methods. Amalie Tuerk and JustinYoo are acknowledged for their extensive efforts in the culturingof Botryococcus braunii strains and various growth and hydrocarbonproduction studies. This collaborative work with W. R. C. wassupported by US Department of Energy. Grant Number: ARPA-eElectrofuels, DE-AR0000092, and the National Science Founda-tion Collaborative Grant No. CBET-0828648 titled “Develop-ment of a Sustainable Production Platform for RenewablePetroleum Based Oils in Algae.” Any opinions, findings, and con-clusions or recommendations expressed in this material are those ofthe authors and do not necessarily reflect the views of the NationalScience Foundation.
150 William A. Muzika et al.

References
1. Wolf FR, Nonomura AM, Bassham JA (1985)Growth and branched hydrocarbon in a strainof Botryococcus braunii (Chlorophyta). J Phy-col 21:388–396
2. Khatri W, Hendrix R, Niehaus T, Chappell J,Curtis WR (2014) Hydrocarbon production inhigh density Botryococcus braunii race B contin-uous culture. Biotechnol Bioeng 111:493–503
3. Hillen LW, Pollard G, Wake LV, White N(1982) Hydrocracking of the oils of Botryococ-cus braunii to transport fuels. BiotechnolBioeng 24:193–205
4. Glikson M, Lindsay K, Saxby J (1989)Botryococcus—A planktonic green alga, thesource of petroleum through the ages: trans-mission electron microscopical studies of oilshales and petroleum source rocks. Org Geo-chem 14:595–608
5. Niehaus TD, Okada S, Devarenne TP, WattDS, Sviripa V, Chappell J (2011) Identificationof unique mechanisms for triterpene biosyn-thesis in Botryococcus braunii. Proc Natl AcadSci U S A 108:12260–12265
6. Kirby J, Romanini DW, Paradise EM, KeaslingJD (2008) Engineering triterpene productionin Saccharomyces cerevisiae-beta-amyrinsynthase from Artemisia annua. FEBS J275:1852–1859
7. Wu S, Jiang Z, Kempinski C, Eric Nybo S,Husodo S, Williams R, Chappell J (2012)Engineering triterpene metabolism in tobacco.Planta 236:867–877
8. Niehaus TD, Kinison S, Okada S, Yeo Y, BellSA, Cui P, Devarenne TP, Chappell J (2012)Functional identification of triterpene methyl-transferases from Botryococcus braunii race B. JBiol Chem 287:8163–8173
9. Khan NE, Nybo SE, Chappell J, Curtis WR(2015) Triterpene hydrocarbon productionengineered into a metabolically versatile host– Rhodobacter capsulatus. Biotechnol Bioeng112:1523–1532
10. Khan N (2015) Development of biologicalplatform for the autotrophic production ofbiofuels. The Pennsylvania State University,State College
11. Zuroff TR, Barri Xiques S, Curtis WR (2013)Consortia-mediated bioprocessing of celluloseto ethanol with a symbiotic Clostridium phyto-fermentans/yeast co-culture. Biotechnol Bio-fuels 6:59
12. Nybo SE, Khan N, Woolston BM,Curtis WR (2015) Metabolic engineering inchemolithoautotrophic hosts for the productionof fuels and chemicals. Metab Eng 30:105–120
13. Eroglu E, Okada S, Melis A (2011) Hydrocar-bon productivities in different Botryococcusstrains: comparative methods in product quan-tification. J Appl Phycol 23:763–775
14. Kawachi M, Tanoi T, Demura M, Kaya K,Watanabe MM (2012) Relationship betweenhydrocarbons and molecular phylogeny ofBotryococcus braunii. Algal Res 1:114–119
15. Largeau C, Casadevall E, Berkaloff C, Index-botryococcus KW (1980) Sites of accumulationand composition of hydrocarbons in Botryococ-cus braunii. Phytochemistry 19:1043–1051
16. Grung M, Metzger P, Liaaen-Jensen S (1989)Primary and secondary carotenoids in two racesof the green alga Botryococcus braunii. Bio-chem Syst Ecol 17:263–269
17. Scherholz ML (2012) Achieving pH controlthrough stoichiometrically balanced media inalgae photobioreactors. The PennsylvaniaState University, State College
18. Maury J, Asadollahi MA, Formenti LR, SchalkM, Nielsen J (2013) Metabolic engineering ofisoprenoid production: reconstruction of mul-tistep heterologous pathways in tractable hosts.In: Bach TJ, Rohmer M (eds) Isoprenoid syn-thesis in plants and microorganisms: new con-cepts and experimental approaches. Springer,New York, pp 73–89
19. Yang J, Xian M, Su S, Zhao G, Nie Q, Jiang X,Zheng Y, Liu W (2012) Enhancing productionof bio-isoprene using hybridMVA pathway andisoprene synthase in E. coli. PLoS One 7,e33509
20. Chandran SS, Kealey JT, Reeves CD (2011)Microbial production of isoprenoids. ProcessBiochem 46:1703–1710
21. Okada S, Devarenne T, Murakami M, Abe H,Chappell J (2004) Characterization of botryo-coccene synthase enzyme activity, a squalenesynthase-like activity from the green microalgaBotryococcus braunii, Race B. Arch BiochemBiophys 422:110–118
22. Choi SP, Bahn SH, Sim SJ (2013) Improve-ment of hydrocarbon recovery by spouting sol-vent into culture of Botryococcus braunii.Bioprocess Biosyst Eng 36:1977–1985
23. Yoo J (2013) Establishment and maintenance ofaxenic Botryococcus braunii race B algae culture.The Pennsylvania State University, State College
24. Wolf FR, Nemethy EK, Blanding JH, BasshamJA (1985) Biosynthesis of unusual acyclic iso-prenoids in the alga Botryococcus braunii. Phy-tochemistry 24:733–737
25. Weiss TL, ChunHJ, Okada S, Vitha S, Holzen-burg A, Laane J, Devarenne TP (2010) Raman
Production of Biofuel-Related Isoprenoids Derived from Botryococcus braunii Algae 151
spectroscopy analysis of botryococcene hydro-carbons from the green microalga Botryococcusbraunii. J Biol Chem 285:32458–32466
26. Metzger P, Casadevall E, Pouet M, Pouet Y(1985) Structures of some botryococcenes:branched hydrocarbons from the b-race of thegreen alga Botryococcus braunii. Phytochemis-try 24:2995–3002
27. Jackson L (2014) New analytical approaches tounderstand biological systems with SecondaryIon Mass Spectrometry (SIMS). The Pennsyl-vania State University, State College
28. Demura M, Ioki M, Kawachi M, Nakajima N,WatanabeMM (2014) Desiccation tolerance ofBotryococcus braunii (Trebouxiophyceae,Chlorophyta) and extreme temperature toler-ance of dehydrated cells. J Appl Phycol26:49–53
29. Weiss TL, Roth R, Goodson C, Vitha S, BlackI, Azadi P, Rusch J, Holzenburg A, DevarenneTP, Goodenough U (2012) Colony organiza-tion in the green alga Botryococcus braunii(Race B) is specified by a complex extracellularmatrix. Eukaryot Cell 11:1424–1440
30. Ind AC, Porter SL, Brown MT, Byles ED, deBeyer JA, Godfrey SA, Armitage JP (2009)Inducible-expression plasmid for Rhodobactersphaeroides and Paracoccus denitrificans. ApplEnviron Microbiol 75:6613–6615
31. Eckardt NA (2005) Photorespiration revisited.Plant Cell 17(August):2139–2141
32. Wang J, Curtis WR (2015) Proton stoichio-metric imbalance during algae photosyntheticgrowth on various nitrogen sources: towardsmetabolic pH control. J Appl Phycol,pp 1–10. doi: 10.1007/s10811-015-0551-3
33. Daugulis AJ (1994) Integrated fermentationand recovery processes. Curr Opin Biotechnol5:192–195
34. Corry JP, Reed WL, Curtis WR (1993)Enhanced recovery of solavetivone from Agro-bacterium transformed root cultures of Hyos-cyamus muticus using integrated productextraction. Biotechnol Bioeng 42:503–508
35. Metzger P, Berkaloff C, Casadevall E, Coute A(1985) Alkadiene-and botryococcene-producing races of wild strains of Botryococcusbraunii. Phytochemistry 24:2305–2312
152 William A. Muzika et al.

Protocols for Monitoring Growth and Lipid Accumulationin Oleaginous Yeasts
Jean-Marc Nicaud, Anne-Marie Crutz-Le Coq, Tristan Rossignol,and Nicolas Morin
Abstract
Oleaginous yeasts can synthesize and store lipids up to 20% of their dry weight and have emerged asresources of choice for biotechnological applications, such as bio-lipid production. The number of speciesand mutant libraries consequently available for screening is exponentially growing. Cultivation strategiesand growth media for bio-lipid production need to be optimized to accelerate screening and identificationof production strains. In this chapter we describe methods for high-throughput cell growth in 96 microtiterplates in various media including opaque broth by using a fluorescent reporter, carbon/nitrogen ratiodetermination for optimal lipid accumulation, and in vivo real-time detection of lipid accumulation using aneutral lipid fluorescent dye. We provide examples using two well-established oleaginous yeasts, Yarrowialipolytica and Rhodosporidium toruloides. These methods can be extended to other oleaginous yeast speciesfor high-throughput screening of bio-lipid accumulation.
Keywords: Lipid accumulation, Oleaginous yeast, Rhodosporidium, Single cell oil, Yarrowia
1 Introduction
Oleaginous yeasts are naturally able to synthesize and accumulatelipids above 20% of their dry weight. Among the large number ofknown yeasts, few are referred as such so far. They were found bothin the Basidiomycota and Ascomycota phyla, mainly in the generaCryptococcus, Lipomyces, Rhodosporidium, Rhodotorula, Trichos-poron, and Yarrowia [1–3]. Within these genera, few species canaccumulate lipids to a high proportion exceeding 65% of biomass,i.e.,Rhodotorula glutinis, Trichosporon pullulans, Cryptococcus albi-dus, and Rhodosporidium toruloides. Like most other oleaginousspecies, Yarrowia lipolytica accumulates lipids at a slightly lowerlevel, yet still around ca. 40% of its dry weight [1]. It has howeverreached a status of model organism [4], especially for lipid metabo-lism. Thus far, the prominent advantage of Y. lipolytica for bothbasic research and biotechnology resides in its fully sequenced and
T.J. McGenity et al. (eds.), Hydrocarbon and Lipid Microbiology Protocols, Springer Protocols Handbooks, (2017) 153–169,DOI 10.1007/8623_2014_40, © Springer-Verlag Berlin Heidelberg 2014, Published online: 18 December 2014
153

manually annotated genome [5], combined with efficientgenetic tools developed over decades [6–8]. A metabolic modelfor this oleaginous yeast has been published by two different groups[9, 10].
Despite being critical for biotechnological applications, geneticinformation on other species remains scarce. Only few oleaginousyeast species have been sequenced over the last few years, includingstrains of the Rhodosporidium, Rhodotorula, or Lipomyces genera.Rhodosporidium toruloides, accumulating high level of lipids andable to assimilate economically attractive C5 sugars, has been thesubject of fruitful research efforts leading to the recent publicationof the complete genome sequence of two strains [11, 12] supple-mented for one of them with transcriptomic and proteomic data[12]. In parallel, appropriate genetic tools for related species areemerging [13] but proved to be difficult to optimize [14].
Due to the great industrial interest in discovering and adaptingoleaginous microorganisms for specific applications, it is likely thatnew oleaginous yeast species and many other physiological, genetic,and omic studies will be continuously published.
Yeasts greatly differ in their ability to metabolize various sub-strates for growth and lipid storage. For example, sugars derivedfrom diverse raw materials such as xylose or arabinose may beinteresting to test as carbon sources. Conditions of lipid accumula-tion also need to be investigated. Lipid storage is triggered by anutrient limitation other than carbon, usually nitrogen. The C/Nratio has a strong impact on the optimal routing of carbon towardlipid synthesis instead of being directed to other metabolites such ascitric acid in the case of Y. lipolytica [1]. This ratio must thereforebe well defined to set up proper culture conditions for lipidaccumulation.
In yeasts, lipids are mainly stored as triacylglycerols in specificstructures called lipid bodies. The nature of esterifying fatty acidswas observed to follow a distribution varying for each species inchain length (usually between C16 and C24) and degree of unsa-turation [3]. As a result, not only lipid accumulation levels but alsolipid profiles may differ from species to species.
When selecting a strain for a bioconversion process, all theseparameters need to be taken into account, depending on the mole-cule to be produced and the carbon sources available.
Such studies are used to be carried out in several experimentsusing batch cultures in “traditional” or baffled Erlenmeyer flasksand multiple sampling. A high-throughput cell growth systemcoupled to a detection system represents a valuable alternative.This is particularly helpful for setting up growth and lipid produc-tion conditions or to screen libraries of strains or mutants for theircapacity to grow and accumulate lipids on various substrates.
The use of standard microtiter plates is very attractive due tothe compatibility with standard commercial microtiter plate readers
154 Jean-Marc Nicaud et al.

and robots. It has the advantages of being automatable, fast,standard, and of using small volumes (i.e., less than 200 μL),which can be a strong advantage when testing expensive com-pounds as substrate or inhibitors, for example. Such a system allowsto perform multiple cultures in parallel and to replicate them easilyto generate robust data.
Moreover, high-throughput methods using a microtiter platereader provide the advantage of monitoring various parametersalmost continuously, in real time, by rapid scanning with shorttime interval without human intervention (e.g., stopping culture,sampling). This is particularly suited for identifying changes in thegrowth rate μ, as it can be precisely estimated all along the experi-ment. The precision level of the μ calculation can even be adjustedover time, using a user-defined sliding window, which would oth-erwise be difficult to perform using standard cultivation methods.
In this chapter, we describe a general protocol for growingoleaginous yeasts in microtiter plates. We also propose two meth-ods for evaluating growth aspects more related to the oleaginouscharacter of these yeasts, that is, assimilation of hydrophobic com-pounds (e.g., fatty acids sometimes used as substrates for biocon-version into more valuable lipids) and determination of the C/Nratio of the broth optimized for lipid accumulation. We finallypropose a method to monitor real-time lipid accumulation. Allthese methods use microtiter plates. As for any culture method,scaling up to flask and/or fermentor will need optimization andadaptation. The choice of the plate reader and of microtiter plateshape could be important parameters. One of the distinctive fea-tures of oleaginous yeasts, i.e., identifying the fatty acid profile,could not be accommodated in this miniaturized system and hasstill to rely on sampling, extraction, and analysis with gas chroma-tography, for example.
This chapter will include four methods that we have applied toat least one of the yeasts Y. lipolytica and R. toruloides:
1. Growth in microtiter plates. This is the general protocol forobtaining and analyzing growth in microtiter plates.
2. Growth kinetics on hydrophobic substrates using a fluorescentreporter. Broths opaque to light, such as those containing lipidemulsions, do not enable to follow growth directly by theoptical density. Alternative reporter systems must be imple-mented in order to monitor growth in such media. Here weuse a red fluorescent protein.
3. Definition of C/N ratio for optimum lipid accumulation inmicrotiter plates. This section will describe how to vary theamount of nitrogen source in the medium and to check theeffect on lipid accumulation.
Protocols for Monitoring Growth and Lipid Accumulation in Oleaginous Yeasts 155

4. Real-time detection of lipid accumulation by fluorescentmethods. In this section we describe the concurrent use ofthe green dye BODIPY largely used to detect neutral lipidsand a quencher.
2 Materials
General materials for growth in microtiter plates are listed in sub-heading 2.1. Additional reagents and/or equipments required forspecific applications are described in the relevant subheadings.
2.1 Growth in
Microtiter Plates
1. Media compounds can be purchased from any commongrowth media supplier.YNB: Yeast nitrogen base without amino acids and ammoniumsulfate 1.7 g, NH4Cl 5 g, phosphate buffer KH2PO4-Na2HPO4 pH 6,8 (50 mM final) per liter. Carbon source(e.g., glucose, glycerol, oleic acid) is added accordingly to thedesired final concentration (e.g., 0.1–3%).YPD: Bacto yeast extract 10 g, Bacto peptone 20 g, glucose20 g per liter.
2. Strains: the strains used as examples in this chapter are Yarro-wia lipolytica wild-type strain W29 (CBS 7504, CLIB 89) orderivatives and Rhodosporidium toruloides wild-type strainCECT 1137.
3. Microtiter plates: 96-well polystyrene culture plate GreinerBio-One sterile flat bottom with lid (see Note 1).
4. Multichannel pipettes from any suppliers, electronic, arerecommended.
5. Microtiter plate reader: we routinely use two apparatus fromBioTek instruments (http://www.biotek.com), Synergy 2 andSynergy MX, both adapted for OD and fluorescence. The firstone is equipped with filters (i.e., fixed wavelength and band-pass), while the second one is provided with a double mono-chromator system allowing a fine tuning of both wavelengthand bandpass (i.e., 1 nm increment). Both models are equippedwith agitation and temperature controls. Other microtiter platereaders with equivalent specificities can be used. Measurementsfor each wavelength are generally performed every 20 minduring cultivation (see Note 2 for graphical representation).
2.2 Growth Kinetics
on Hydrophobic
Substrates Using
a Fluorescent Reporter
1. Delivery vectors for intracellular expression of fluorescent pro-tein, to be constructed for your application. See Note 3 for Y.lipolytica.
2. Oleic acid. We usually do not use high purity grade. Oleic acidfrom Sigma (ref: 27728) is a solution at 70%.
3. Sonicator.
156 Jean-Marc Nicaud et al.

2.3 Definition of C/N
Ratio for Optimum
Lipid Accumulation
in Microtiter Plates
1. For lipid production, YNB medium described in 2.1 can beadapted with various C/N ratios. The C/N ratio (or carbon-to-nitrogen ratio) is a ratio of the mass of carbon to the mass ofnitrogen. In our experiments, we generally fix the carbonsource in the medium and reduce the amount of nitrogen inorder to increase the C/N ratio. We use glucose as a carbonsource, with a final concentration of 30 g/L (ca. 166 mM).Under these conditions, the concentration of C within everymedium is fixed at ca. 12 g/L (ca. 1 M). Nitrogen is suppliedby the NH4Cl stock solution (250 g/L, ca. 4.67 M), whichcontains ca. 65.4 g/L of nitrogen (ca. 4.67 M). Knowing theseconcentrations, the volume of NH4Cl added to the medium isadapted to define the C/N ratio (see Table 1).
2. Stock solution of BODIPY D-3922 4,4-difluoro-1,3,5,7,8-pentamethyl-4-bora-3a,4a-diaza-s-indacene (BODIPY® 493/503) from Life Technologies (http://www.lifetechnologies.com) at 1 mg/mL (3.8 mM) in DMSO, referred here asBODIPY. Store at �20�C and protect from light.
3. Microscope equipped with a YFP filter. We use a Zeiss ImagerM2 microscope equipped with filter set 46 and with an HXP120 C lamp (http://www.zeiss.com).
2.4 Real-Time
Detection of Lipid
Accumulation by
Fluorescent Methods
1. Medium: YNB C/N 30 (see subheading 2.3).
2. Potassium iodide stock solution at 4 M (Sigma ref: 60400).When resuspended in water, store at �20�C and protect fromlight.
3. BODIPY 493/503 at 1 mg/mL (see subheading 2.3).
2.5 Software
and Analytical Tools
1. Microtiter plate reader software, e.g., Gen5 2.0 from BioTek(http://www.biotek.com).
2. R statistical software for data analysis and visualization [15].
Table 1Composition for 100 mL YNB medium with a C/N ratio varying from 1 to 120. Glucose is used as afixed carbon source (final concentration 3%, ca. 12 g/L of C). The C/N ratio is adapted by reducing theamount of NH4Cl (stock solution 25%, ca. 65.4 g/L of N)
Stock solutions
Volume (mL) required for a C/N of
1 10 20 30 60 90 120
YNB 50 g/L 3.4 3.4 3.4 3.4 3.4 3.4 3.4
Glucose 500 g/L 6 6 6 6 6 6 6
NH4Cl 250 g/L 18 1.8 0.9 0.6 0.3 0.2 0.15
KH2PO4 Na2HPO4 0.5 M 10 10 10 10 10 10 10
H2O qs 100 mL
Protocols for Monitoring Growth and Lipid Accumulation in Oleaginous Yeasts 157

3 Methods
Different methods to evaluate growth of Y. lipolytica andR. toruloides and their capacity of lipid accumulation are describedbelow. Each method could be easily adapted to a wide variety ofyeasts and/or substrates.
3.1 Growth in
Microtiter Plates
When measuring OD in a microtiter plate, one should always keepin mind the fact that the optical path length is usually shorter thanthe 1 cm standard. A correction factor can however be applied tothe data after measurement (see Note 4).
1. Prepare your experimental design (i.e., location of samples/blanks, number of replicates), taking into account that outerwells should be avoided for your samples when running long-term experiments (see Note 5). Include technical replicateswhenever possible. When testing for carbon source utilization(seeNote 6), make sure to include a “no growth” standard (i.e.,minimal medium without the carbon source under investiga-tion, inoculated with the yeast).
2. Using the microtiter plate reader software, set up a protocol forrunning your experiment. A typical protocol for growth moni-toring should at least include the following parameters: (i)agitation (e.g., continuous and vigorous; seeNote 7), (ii) wave-length for OD measurement (e.g., 600 nm), (iii) periodicity ofmeasurement (e.g., 20 min), (iv) duration of cultivation (e.g.,12–72 h), and (v) temperature. Additional information (e.g.,description of the experimental design, sample coordinates) canalso be included at this step, but are not mandatory.
3. Grow a preculture, according to the growth characteristics ofyour yeast/strain. Typically, grow cells for 24 h in a test tube bypicking a fresh colony in 4 mL YPD medium and incubating at28�C with agitation (e.g., 160 rpm).
4. Before inoculating the microtiter plate, control growth of yourpreculture by measuring OD at 600 nm. A typical Yarrowia orRhodosporidium preculture should have reached an OD600 ofca. 10–16 with 1 cm light path cuvette and spectrophotometer(Novaspec II, LKB).
5. Centrifuge 0.2 mL of cell suspension, eliminate supernatantcarefully, and resuspend cells in the appropriate volume ofYNB medium to reach a cell concentration of OD600 ¼ 4. Forhigh-throughput studies, an alternative method for growingmultiple precultures in a microtiter plate is detailed in Note 8.
6. Fill each well with the appropriate medium according to yourplanned scheme. It is advisable to test filling volumes for samplewells from 0.1 to 0.2 mL in preliminary experiments. ForYarrowia and Rhodosporidium, we routinely use 100 μL.
158 Jean-Marc Nicaud et al.

7. Inoculate the samples to obtain an initial OD600 of ca. 0.2 (i.e.,5 μL of standardized cell suspension at OD600 ~ 4 in each100 μL-filled sample well).
8. Once the plate is ready, place it immediately into the reader andrun your protocol for the planned time course.
9. After the run, data can be extracted as a spreadsheet andimported in conventional statistical software for analysis.Whenever necessary, preprocessing methods can be applied atthis stage, such as background correction and optical pathcorrection (see Notes 9 and 4).
10. Besides traditional growth curves, an interesting way to look atthe data is to calculate the evolution of the growth rate μ duringthe experiment, using a sliding window. Growth rate betweensampling points i and j can be assessed using the equation:
μij ¼ LN xj� � � LN xið Þ� �
= t j � t i� �
(v)
where xj and xi are the OD values measured at time tj and ti,respectively. Monitoring of the growth rate can be helpful tounderstand the behavior of a sample or a strain during thedifferent stages of the cultivation, especially when comparingcarbon source utilization (see Fig. 1).
3.2 Growth Kinetics
on Hydrophobic
Substrates Using a
Fluorescent Reporter
In opaque media such as emulsion of oleic acid, optical densitycannot be measured accurately. In such conditions, constitutiveexpression of a fluorescent protein provides an alternative for mon-itoring the growth.
Red fluorescent proteins (RFP) have maxima of fluorescenceemission above 560 nm. They represent a valuable alternative or acomplement to the widely used green fluorescent proteins (GFP),to which they are structurally related (for review see [16]). Due tolonger wavelength excitation, in vivo use of RFP benefits from alower autofluorescence background and a reduced cellular photo-toxicity. drFP583, better known as DsRed, was the first availableRFP, isolated from a coral Discosoma species in 1999 [17]. Noknown cofactors or external conditions other than oxidation arerequired for chromophore maturation. The process relies onmolecular oxygen, but only rigorous anoxia prevents fluorescence[18]. DsRed is insensitive to pH from 5 to 12, is relatively resistantto photobleaching, and is stable [17, 19]. In its original form,DsRed had several shortcomings, including the severe drawbackof very slow maturation (t1/2 ~ 24 h). Many improved versions orproteins from different sources have however been obtained bydifferent teams [18]. We use RedStar2, a combination of twovariants of DsRed (i.e., RedStar [20] and T4 DsRed), cumulatingoptimized codon usage for yeast, brightness, fast maturation, andsolubility [21]. In our experiments, RedStar2 gave robust fluores-cence and allowed to easily compare growth of different strains of
Protocols for Monitoring Growth and Lipid Accumulation in Oleaginous Yeasts 159

Yarrowia lipolytica on non-translucent media which usually preventdirect read of OD or scatter light (see Note 10). However, one hasto consider the fact that emulsions of hydrophobic substrates, suchas oleic acid, may give a high background signal that changes overtime. This is especially true for concentrations above 0.4% that mayhamper correct detection of slow-growing strains. We thus encour-age preliminary experiments to validate the conditions of growth in
Fig. 1 Growth kinetics of R. toruloides on glucose and glycerol at variousconcentrations (0.1 and 2%). (a) Optical density and (b) growth rate μ(h�1). μwas calculated using a sliding window of 1 h. Calculating μ with sliding windowsallows to detect easily a two-phase growth in the 2% glucose medium. Datawere acquired using a Synergy MX microplate reader
160 Jean-Marc Nicaud et al.

the plate reader and the measurement of the fluorescence signalwith appropriate controls.
1. Construct strains “labeled” with the fluorescent protein usingappropriate genetic tools for your organism. The RFP geneshould be expressed from a strong and constitutive promoter.See Note 3 for a summarized description of the procedure wefollow for Y. lipolytica.
2. Check transformants for proper growth, correct expression,and possible multiple integration of the RFP cassette. This isreadily performed by comparing the fluorescence level of sev-eral transformants during a preliminary experiment in whichgrowth in glucose allows measurement of both OD600 andfluorescence intensity. Figure 2 shows characteristic growthcurves obtained with a RFP-producing strain of Y. lipolyticaby OD or fluorescence measurement, varying the sugarconcentration.
3. Prepare an emulsion of fatty acid at 20%. Mix the solution ofoleic acid with water and 0.5% (v/v) Tween 40 (see Note 11).Sonicate for three cycles of 1 min, interrupted by 1 min incu-bation on ice. Use this stock solution to prepare the YNBmedium supplemented with oleic acid at the desired concen-tration (usually in the range of 0.1–1%).
Fig. 2 Assessment of RedStar2 fluorescence, as a growth indicator for Y.lipolytica. A Y. lipolytica WT strain, constitutively expressing the RFP, wasgrown in YNB medium supplemented with glucose at different concentrations.For each condition, the kinetics obtained through the traditional measurement ofOD600 and the fluorescence intensity both produced a similar growth curve. Datawere acquired using a Synergy 2 microplate reader
Protocols for Monitoring Growth and Lipid Accumulation in Oleaginous Yeasts 161

4. Prepare your experiment as described in subheading 3.1.The preculture can be grown in YPD medium.
5. In the microtiter plate reader, add a step for fluorescencemeasurement, including excitation and emission wavelengths(e.g., for RedStar2 monitoring using the BioTek Synergy MX,we routinely use 545 nm for the excitation wavelength and585 nm for the emission). To further optimize signal detec-tion, set bandpass relatively wide for emission (e.g., 13.5) andnarrower for excitation (e.g., 9), if the apparatus allows it. SeeNote 12 for a complement on setting up filter-based apparatus.
6. Inoculate the microtiter plate and start culture, as described insteps 4 to 8 of subheading 3.1.
7. Display curves of fluorescence versus time for each sample, sothat you can compare growth of different strains as in Fig. 3.Subtracting the background signal of the medium may not berecommended, as this will amplify the variability of the signal,due to the different evolution of the medium being a substratefor a growing strain or not.
Fig. 3 Comparative growth of two strains of Y. lipolytica showing different abilityto use oleic acid as a carbon source. WT strain efficiently uses oleic acid viaperoxisomal β-oxidation and therefore grows rapidly. Mutant strain is affected inseveral POX genes, decreasing the efficiency of the β-oxidation pathway. Growthof both strains is followed through the expression and fluorescence of the redfluorescent protein RedStar2. The inherent autofluorescence of Y. lipolyticaduring growth is measured by the WT strain not expressing the RFP. Datawere acquired using a Synergy 2 microplate reader
162 Jean-Marc Nicaud et al.

3.3 Definition of C/N
Ratio for Optimum
Lipid Accumulation
in Microtiter Plates
As described in the literature, lipid accumulation in oleaginousyeasts can be triggered by a nutrient limitation, usually nitrogen.The mass ratio of carbon versus nitrogen molecules in the mediumhas been shown to play a critical role on the optimal routing ofcarbon fluxes toward lipid synthesis, instead of other metabolism(e.g., citric acid synthesis in Y. lipolytica) [1].
By parallelizing multiple growth conditions on a single micro-titer plate, one can easily set up an experimental design to identifythe best C/N ratio(s) for lipid accumulation.
1. Prepare your experimental design and protocol according tosteps 1 and 2 of subheading 3.1. Include replicates usingvarious YNB C/N media, prepared as described in subhead-ing 2.3 (see Note 13).
2. Grow a preculture as described in step 3 of subheading 3.1.
3. Proceed with inoculation and cultivation, as described in steps4 to 8 of subheading 3.1.
4. Harvest samples in late exponential phase to assess their lipidcontent. Do not wait until stationary phase, as cells will start toassimilate their own lipid stocks to compensate with the lack ofcarbon source in the medium.
5. For 100 μL sample, add 1 μL of a 0.1� BODIPY stock solution.
6. Evaluate the lipid content using fluorescence microscopy with aYFP filter. Imaging parameters (e.g., excitation intensity, expo-sure time) must be set up on a sample showing an intermediateaccumulation level (e.g., C/N 30) and applied to all samples.Combining fluorescence with illumination techniques such asdifferential interference contrast (i.e., DIC, Nomarski) can beuseful to distinguish the lipid bodies (see Fig. 4). Alternatives tofluorescence microscopy are discussed in Note 14.
3.4 Real-Time
Detection of Lipid
Accumulation by
Fluorescent Methods
Another advantage of growing oleaginous yeast in microtiterplates is the possibility to follow lipid accumulation during thegrowth by measuring the time course of the fluorescence intensityof a dye specific for neutral lipids. Here we use the BODIPY 493/503 as a specific dye for lipid bodies (Nile red can be used as analternative). Adding BODIPY directly to the medium duringgrowth generates fluorescent background not specific to the stain-ing of lipid bodies. Background fluorescence can however easily beavoided by using a quencher such as potassium iodide (KI). Beingexcluded from cells, KI will solely quench BODIPY fluorescencein the medium, thus making fluorescent detection specific tointracellular lipids [22]. The protocol can be used to identifystrains with lipid accumulation defect/improvement and to followkinetics of accumulation.
Protocols for Monitoring Growth and Lipid Accumulation in Oleaginous Yeasts 163

1. Grow precultures, as described in step 3 of subheading 3.1.
2. Prepare YNB medium with a C/N of 30, as described insubheading 2.3, or with the appropriate C/N accordingto the species tested. Complement the medium with KI(see Note 15) at a final concentration of 0.4 M and BODIPYat a final concentration of 3.8 μM (1 μg/mL).
3. Inoculate the microtiter plate and start culture, as described insteps 4 to 8 of subheading 3.1. Monitor the cultivation every20 min at 600 nm for absorbance and for fluorescence at 480/501 nm for excitation and emission, respectively, with a band-pass of 9 and a gain setup at 80. Gain must be set up for eachmedium/species/equipment to stay in the range of detection(without saturation of the signal) at the maximum accumula-tion stage (see Note 16).
4. Display graphically the growth kinetics (i.e., relative OD600)and fluorescence (i.e., relative fluorescence unit) to visualizegrowth and lipid accumulation (Fig. 5). If growth (i.e., bio-mass) in the different wells is not comparable (e.g., growthdifferences between strains/conditions), it is necessary to cal-culate the fluorescence/OD ratio in order to normalize fluo-rescent data.
Fig. 4 Cells of Rhodosporidium toruloides CECT1137, grown on media with C/N ratio of (a) 10, (b) 20, (c) 30,(d) 60, (e) 90, (f) 120. Lipids are stained with BODIPY. Pictures were taken by microscopy, using a YFPfluorescence filter and a Nomarski illumination
164 Jean-Marc Nicaud et al.

Fig. 5 Four Y. lipolytica strains with various levels of lipid accumulation, from very low accumulation (Q4),wild-type accumulation, high accumulation (Q4-DGA2), and very high accumulation (Q4-DGA2�2, GPD1). SeeNote 17 for description of the strains. Cultivation was performed in YNB glucose 0.5% with C/N ¼ 30. (a)Relative OD600 kinetics of the four strains tested. (b) Relative fluorescence kinetics of the four strains testedcorresponding to lipid accumulation kinetics. Data were acquired using a Synergy MX microplate reader
Protocols for Monitoring Growth and Lipid Accumulation in Oleaginous Yeasts 165

4 Notes
1. For fluorescent detection, we did not find necessary to useblack plates (with clear bottom for OD600 measurement) asinterference in fluorescence signals between wells is not signifi-cant in our hand. However, this must be checked for eachspecies/conditions/apparatus.
2. Depending on the experimental setup (e.g., duration ofcultivation, frequency of measurement), a microtiter platereader can produce a large amount of data. To enhance clarityand readability, it might prove useful not to plot every spotwhen drawing a growth curve. As an example, the growthcurves illustrating subheadings 3.1, 3.2, and 3.4 have beengenerated using a combined method: for each figure, the com-plete dataset was used to draw the line of each curve, while onlya subset of the same data was used to draw the spots (e.g., 1 outof 3 spots).
3. Chromosomal integration of the gene coding for RedStar2 iseasily done in Yarrowia for which efficient transformation andnumerous genetic tools exist. In this case, we used randomintegration [7] of cassettes in which the RedStar2 gene is placedunder the pTEF1 promoter associated with a choice of threeselective markers. These cassettes are cut from vectorsJMP1394 (carrying the LEU2 prototrophic marker),JMP1491 (carrying the URA3 prototrophic marker), orJMP1492 (conferring resistance to hygromycin), availableupon request.
4. When using a microtiter plate instrument, OD measurement istaken vertically. Consequently, the optical path length (i.e., thedistance light travels through the sample) varies depending onthe volume of cultivation and the shape of the well (i.e., dimen-sions of the wells may differ, depending on the brand of themicrotiter plate). A correction factor can be applied to the dataafter measurement, based on Beer-Lambert’s law of lightabsorption (i.e., absorbance is proportional to the distancethat light travels through the sample). This factor can be calcu-lated mathematically: if the shape (e.g., cylindrical, cubic) anddimensions of the well are known, one can directly calculate thepath length depending on the volume of the sample. Alterna-tively, the path length can be calculated experimentally by usingthe absorbance properties of water at 900 and 977 nm wave-lengths. At room temperature, in a 1 cm cuvette, the differencebetween OD977 and OD900 of a water sample is ca. 0.18. Bymeasuring in a microtiter plate the absorbance of a water sam-ple at 900 and 977 nm, one can calculate the path length (incm) of a sample using the equation: (OD977 � OD900)watersample/0.18 ¼ path length.
166 Jean-Marc Nicaud et al.

5. When preparing an experimental design (i.e., location ofsamples/blanks, on the plate, number of replicates), oneshould take into account evaporation. For long-term experi-ments (i.e., 24 h and more), we strongly recommend not to usethe wells located on the outer lines/columns of the microtiterplate. Instead, we fill these outer wells with 200 μL water (orblank medium) to act as a buffer against evaporation of theinner wells. By doing so, we limit the number of wells availablefor sample to 60 in a 96-well plate, but we improve the consis-tency of the measurement over long period.
6. Sample dilution before OD measurement is not possible.Nevertheless, OD linearity is generally certified by the manu-facturers, with less than 1% error for OD values ranging from0 to ca. 3 units. Consequently, it is recommended not to add anexcess of carbon source in order to limit biomass.
7. Shaking is an important parameter affecting both aeration andcell sedimentation (e.g.,Y. lipolytica has a tendency to sedimenteasily). Limitation of oxygen transfer rate could be a particularproblem for strictly aerobic microorganism. Usually, lowervolume and intense shaking increase oxygen rate transfer withincell suspensions.
8. When inoculating numerous different strains on the same plate(e.g., screening of various clones/species in the same medium),one can perform the preculture in 96-well microtiter plateinstead of individual test tubes. This allows rapid inoculationof the experimental plate by using multichannel pipette. Toavoid fastidious per well inoculum standardization, we recom-mend to grow the precultures for at least 36 h, so that all thestrains reach stationary phase and a similar OD. This proved toreduce variability between inoculated wells. Preculture time hasto be adapted according to the yeasts and/or strains used.
9. When preparing an experimental design, one can use nonsam-ple wells to measure the background absorption of a blankmedium. When processing the data, background can then besubtracted from the signal, but is not mandatory. Whensubtracting background, we recommend to use a mean back-ground value calculated over the experiment, rather than sub-tracting a background measured point by point. The latterapproach might induce more noise than correction in the pro-cessed data.
10. According to [23], dense/turbid suspensions can interferewith excitation light and emission signal. While this may poten-tially lead to lower absolute fluorescence measurements forcultures in stationary phase, it does not affect the reliability ofcomparative analyses.
Protocols for Monitoring Growth and Lipid Accumulation in Oleaginous Yeasts 167

11. Alternative emulsifying agents may be used (e.g., Tween 80),although Tween 40 happened to be the most efficient forcreating a stable emulsion in our experience. You can storethe emulsion at room temperature for 1 week.
12. For BioTek Synergy 2, wavelength and bandpass are deter-mined by the chosen filters, 530/25 for emission and 620/40 for excitation.
13. C/N media can be prepared by either fixing the concentrationof the carbon and/or the nitrogen source. To induce lipidstorage, it is however recommended to fix the carbon sourceand to modify the nitrogen concentration, rather than theopposite, as described in subheading 2.3. Reducing nitrogenconcentration to increase C/N ratio will be a better mimic of anitrogen limitation.
14. Fluorescent microscopy, as described in subheading 3.3, is anefficient and relatively cheap method to compare the lipidcontent of cells grown using different C/N ratio, qualita-tively. Flow cytometry could be an interesting alternative. Itcombines the advantages of working with limited sampleamount, measuring data at a single cell scale, and extrapolat-ing information at the population scale. Furthermore, it com-bines the qualitative aspect of microscopy, with a quantitativemeasure of fluorescence. Alternatively, one can also combinethe methods described in subheadings 2.3 and 2.4, for con-tinuous monitoring of lipid accumulation under various C/Nconditions.
15. Quenching of external BODIPY fluorescence by KI is notsuited for oleic acid-containing broth, at least for Y. lipolytica,for which no growth was observed under these conditions.
16. For proper measurement of BODIPY in microtiter platereader, we recommend to test several gains in conditionswhere accumulation reaches its maximum in order to definethe maximum level of fluorescence to be detected. Set up thegain to be under the saturating level of the detection system ofthe apparatus.
17. The Y. lipolytica strain Q4 is deleted for all the acyltransferasesand therefore is not able to store lipids in lipid bodies [24]. TheQ4-DGA2 strain corresponds to the Q4 strain overexpressingthe acyltransferase gene DGA2, which increases storage capac-ity [24]. The Q4-DGA2�2 GPD1 strain (unpublished data)overexpresses two copies of DGA2 and 1 copy of the glycerol-3-phosphate dehydrogenase gene GPD1 which increases lipidaccumulation [25]. All strains have been transformed to beprototroph.
168 Jean-Marc Nicaud et al.

References
1. Beopoulos A, Cescut J, Haddouche R,Uribelarrea JL, Molina-Jouve C, Nicaud JM(2009) Yarrowia lipolytica as a model for bio-oil production. Prog Lipid Res 48:375–387
2. Ratledge C, Wynn JP (2002) The biochemistryand molecular biology of lipid accumulation inoleaginous microorganisms. Adv Appl Micro-biol 51:1–51
3. Thevenieau F, Nicaud JM (2013) Microorgan-isms as sources of oils. OCL 60:D603
4. Nicaud JM (2012) Yarrowia lipolytica. Yeast29:409–418
5. Dujon B, Sherman D, Fischer G et al (2004)Genome evolution in yeasts. Nature430:35–44
6. Le Dall MT, Nicaud JM, Gaillardin C (1994)Multiple-copy integration in the yeast Yarro-wia lipolytica. Curr Genet 26:38–44
7. Pignede G, Wang HJ, Fudalej F, Seman M,Gaillardin C, Nicaud JM (2000) Autocloningand amplification of LIP2 in Yarrowia lipoly-tica. Appl Environ Microbiol 66:3283–3289
8. Fickers P, Le Dall MT, Gaillardin C, Thonart P,Nicaud JM (2003) New disruption cassettesfor rapid gene disruption and marker rescuein the yeast Yarrowia lipolytica. J MicrobiolMethods 55:727–737
9. Loira N, Dulermo T, Nicaud JM, Sherman DJ(2012) A genome-scale metabolic model of thelipid-accumulating yeast Yarrowia lipolytica.BMC Syst Biol 6:35
10. Pan P, Hua Q (2012) Reconstruction and insilico analysis of metabolic network for an ole-aginous yeast, Yarrowia lipolytica. PLoS One7:e51535
11. Kumar S, Kushwaha H, Bachhawat AK,Raghava GP, Ganesan K (2012) Genomesequence of the oleaginous red yeast Rhodos-poridium toruloidesMTCC 457. Eukaryot Cell11:1083–1084
12. Zhu Z, Zhang S, Liu H et al (2012) A multi-omic map of the lipid-producing yeast Rhodos-poridium toruloides. Nat Commun 3:1112
13. Lin X, Wang Y, Zhang S et al (2014) Func-tional integration of multiple genes into thegenome of the oleaginous yeast Rhodospori-dium toruloides. FEMS Yeast Res. doi:10.1111/1567-1364.12140
14. Abbott EP, Ianiri G, Castoria R, Idnurm A(2013) Overcoming recalcitrant
transformation and gene manipulation in Puc-ciniomycotina yeasts. Appl Microbiol Biotech-nol 97:283–295
15. R-Core-Team (2014) R: a language and envi-ronment for statistical computing. R Founda-tion for Statistical Computing, Vienna, Austria
16. Piatkevich KD, Efremenko EN, Verkhusha VV,Varfolomeev DD (2010) Red fluorescent pro-teins and their properties. Russ Chem Rev79:243–258
17. Matz MV, Fradkov AF, Labas YA et al (1999)Fluorescent proteins from nonbioluminescentAnthozoa species. Nat Biotechnol 17:969–973
18. Shaner NC, Steinbach PA, Tsien RY (2005) Aguide to choosing fluorescent proteins. NatMethods 2:905–909
19. Baird GS, Zacharias DA, Tsien RY (2000) Bio-chemistry, mutagenesis, and oligomerization ofDsRed, a red fluorescent protein from coral.Proc Natl Acad Sci U S A 97:11984–11989
20. Knop M, Barr F, Riedel CG, Heckel T, ReichelC (2002) Improved version of the red fluores-cent protein (drFP583/DsRed/RFP).Biotechniques 33:592, 594, 596–598 passim
21. Janke C, Magiera MM, Rathfelder N et al(2004) A versatile toolbox for PCR-based tag-ging of yeast genes: new fluorescent proteins,more markers and promoter substitution cas-settes. Yeast 21:947–962
22. Bozaquel-Morais BL, Madeira JB, Maya-Monteiro CM, Masuda CA, Montero-LomeliM (2010) A new fluorescence-based methodidentifies protein phosphatases regulating lipiddroplet metabolism. PLoS One 5:e13692
23. Lakowicz JR (2006) Principles of fluorescencespectroscopy, 3rd edn. Springer, New York
24. Beopoulos A, Haddouche R, Kabran P,Dulermo T, Chardot T, Nicaud JM (2012)Identification and characterization of DGA2,an acyltransferase of the DGAT1 acyl-CoA:diacylglycerol acyltransferase family in the ole-aginous yeast Yarrowia lipolytica. New insightsinto the storage lipid metabolism of oleaginousyeasts. Appl Microbiol Biotechnol93:1523–1537
25. Dulermo T, Nicaud JM (2011) Involvement ofthe G3P shuttle and beta-oxidation pathway inthe control of TAG synthesis and lipid accumu-lation in Yarrowia lipolytica. Metab Eng13:482–491
Protocols for Monitoring Growth and Lipid Accumulation in Oleaginous Yeasts 169

Protocol for Start-Up and Operation of CSTR BiogasProcesses
A. Schn€urer, I. Bohn, and J. Moestedt
Abstract
There is currently a lack of consensus on how biogas processes should be started and run in order to obtainstable, efficient operation. Agreement on start-up and operating parameters would increase the quality ofresearch, allow better comparison of scientific results and increase the applicability of new findings in ageneral perspective. It would also help full-scale operators avoid common costly mistakes during start-upand operation of biogas processes. The biogas protocol presented in this paper describes appropriateapproaches for characterisation of substrate, determination of methane potential, formulation of a suitablesubstrate, start-up of reactors and monitoring and operation of the biogas process in CSTR reactors.
Keywords: Biogas, BMP, CSTR, Monitoring, Operation, Start-up, Substrate composition
1 Introduction
Anaerobic digestion (AD) is a biological treatment method forreducing and stabilising various types of organic matter in theabsence of oxygen, while at the same time producing biogas. Inthe past this technology has mainly been applied in waste treatmentand management, but recently the focus has shifted to energygeneration and nutrient recovery, including not only organic wastesbut also dedicated energy crops in some countries [1, 2]. Biogas is aversatile renewable energy source that can be used for replacementof fossil fuels in power and heat production and can also be con-verted to vehicle fuel [3]. Methane-rich biogas can also replacenatural gas as a feedstock for production of other biochemicals[3, 4]. Moreover, during the process nutrients are retained, makingthe digestion residue suitable as an organic fertiliser that can replacefossil energy-requiring mineral fertilisers [5, 6]. Materials used forbiogas production include sewage and industrial organic wastewa-ter, waste from the food and animal feed industries, source-sortedmunicipal solid waste, livestock and poultry manure and stillagefrom ethanol production [3, 7, 8]. Typical crops for biogas include,
T.J. McGenity et al. (eds.), Hydrocarbon and Lipid Microbiology Protocols, Springer Protocols Handbooks, (2017) 171–200,DOI 10.1007/8623_2016_214, © Springer-Verlag Berlin Heidelberg 2016, Published online: 23 June 2016
171

for example, maize and grass silage [2, 3, 9]. The AD technologycan be implemented on either small or large scale, making it inter-esting when designing flexible and sustainable energy solutions forindustrial applications and also for farms and even single house-holds, as typically seen in developing countries [10, 11]. In anumber of studies, production of biogas has been shown to offersignificant advantages over other forms of bioenergy productionand it has been rated one of the most energy-efficient and environ-mentally beneficial technologies for bioenergy production [11, 12].
Anaerobic digestion of organic material to biogas is a complexmicrobiological process requiring the combined activity of severalgroups of microorganisms with different metabolic capacities andgrowth requirements [13]. The degradation process can be dividedinto four main steps; hydrolysis, acidogenesis, acetogenesis andmethanogenesis. In the latter steps many organisms operate inintricate and sometimes obligate relationships, e.g. syntrophy, inwhich neither organism can thrive without the other and togetherthey exhibit metabolic activities that they could not accomplish ontheir own [14]. To obtain a stable and efficient biogas process, allthese conversion steps and microorganisms must work in a syn-chronised manner and it is important to fulfil the requirements ofall microorganisms involved. In order to achieve a stable, efficientprocess, the material added to the degradation process must have agood balance of both macro- and micronutrients [13]. Some mate-rials work well as a single substrate, while others can only be usedduring co-digestion with other substrates that result in favourablenutrient and water content and dilution of potential inhibitors [7].To ensure sufficient microbial activity, some materials and mixturesof materials may also have to be complemented with process addi-tives such as iron, trace metals or buffering chemicals [15–17, 136].In addition to the nutrient composition, operating parameters suchas pre-treatment method, load of input material, duration of deg-radation, process temperature and stirring are of critical importanceand have to be set properly to ensure high activity and gas yieldswith minimised risk of inhibition or washout of critical functionsand microorganisms [18–21]. In conclusion, many differentaspects need to be taken into consideration to reach optimal degra-dation and gas production. In addition, consideration must begiven to achieving good digestate quality not only regarding nutri-ent content, but also regarding the content of chemical inhibitorsor biological contaminants such as different pathogens [5, 22, 23].It should be borne in mind that many operating and biologicalparameters are interlinked, sometimes with counteracting effects.
Prior to start-up of a full-scale process or as a tool to optimiseand evaluate a specific biogas process or substrate, evaluation atlaboratory scale may be advisable. By performing such studies,different factors can be evaluated alone or in combination undercontrolled conditions, without risking loss of stability and/or loss
172 A. Schn€urer et al.

of gas production in the full-scale process. It has been shown thatsuch laboratory experiments result in similar gas yields and processperformance as full-scale processes [24–27]. However, large-scaleprocesses typically exhibit a variability regarding substrate compo-sition and operating parameters that is difficult to replicate in alaboratory-scale scenario. Moreover, some parameters of a technicaland logistics character are difficult to evaluate at laboratory scale.Thus in order to fully evaluate and comprehend all parameters ofimportance for starting up and operating an AD process, resultsfrom both small-scale and large-scale studies need to be considered[28]. Furthermore, in order to obtain reliable results for practicalfull-scale applications, the set-up of laboratory-scale experiments interms of start-up and operation, preparation of substrate, applica-tion of process additives, etc., and monitoring and evaluation of thebiogas process is critical. This protocol provides guidance onsetting up, operating and monitoring biogas processes in a uniformmanner.
2 Materials
For start-up and operation of laboratory-scale biogas processes,materials and equipment are needed for the process itself and forthe preparation of substrates, monitoring and evaluation of theprocess. Many different set-ups are possible and can be used aslong as some basic principles are observed, such as airtight con-tainer, efficient stirring, temperature regulation and appropriatedimensioning. The concept can be rather simple and low cost,requiring operation mainly by manual mode, or more advancedand highly automated. Thus this protocol does not suggest anyparticular equipment, but merely refers to different studies wheresuch information is available. The equipment and materials neededfor different analytical methods are given in the protocol whenmentioned. The most frequently used design is the continuouslystirred tank reactor (CSTR), which compared with many otherconfigurations is rather simple to construct and operate [24, 29].A schematic diagram of a CSTR reactor is presented in Fig. 1. Thereactor has a stirrer and an inlet/outlet for substrate/digestate.Depending on the character of the material, the influent streamcan either be pumped continuously or fed manually in semi-continuous mode. The inlet tube is typically placed under thesurface of the liquid to minimise oxygen entry during feeding. Infull-scale plants the material is inserted directly to the reactor orindirectly via a circulation circuit. Material is usually taken outthrough a separate outlet, typically placed in line with the liquidlevel, allowing excess material to flow over or alternatively activelypumped out. In lab-scale mode material can also be taken outfrom the reactor through the inlet tube (by use of a vacuum
Protocol for Start-Up and Operation of CSTR Biogas Processes 173

pump). The gas is taken out from headspace at the top and passesthrough a gas volume counter. The gas can also be measuredthrough water displacement or by collection to a gas bag for latervolume measurement.
3 Methods
This section provides information concerning the start-up andoperation of a continuous anaerobic digestion process forlaboratory-scale or large-scale application. The type of processdescribed is a one-stage CSTR, the digestion system most com-monly used in full-scale biogas plants in Europe [3], but many ofthe factors listed in the protocol are also applicable to other type ofprocesses. The protocol focuses on parameters important for thefunctioning and stability of the biological biogas process and can beused as guidelines for large-scale operation and/or for evaluation/operation of processes in laboratory reactors used in research.
3.1 Chemical
Characterisation of
the Organic Substrate
The chemical composition of the substrate has a strong impact onthe process and needs to be considered when determining theindividual proportion of different materials to be used in a substratemixture and the need for process additives, and when setting
Fig. 1 Schematic diagram of continuously stirred tank reactors for laboratory or full-scale application. Left:A simpler design of reactor typically operated in manual mode. Right: A more advanced reactor typicallydesigned to allow automatic adjustment to the desired volume, completely air-free operation and sometimescontinuous pumping of substrate
174 A. Schn€urer et al.

operating conditions. Optimally, the substrate should have a com-position that meets the nutrition requirements of the microorgan-isms involved and also results in high biogas and methane yield anda high quality digestate in terms of high nutrient composition andlow levels of contaminants. Different analyses can be used to deter-mine the composition of the substrate, depending on the purpose(industrial plant or research process) and available equipment.Below are some suggestions of relevant analyses and procedures.
1. Sampling for chemical analysis should be performed to ensurethat a representative sample of the substrate can be taken (seeNote 1). Thus it is important that the sample is well mixed andthat the sample size is adjusted to ensure that a representativesample can be obtained. Each sample should also be analysed atleast in triplicate.
2. Determination of the dry matter, organic content and ash. Thisanalysis can be performed by different methods (see Note 2),but one common procedure is to analyse the content of totalsolids (TS) and volatile solids (VS) by initial drying at 105�Cfor 20 h, followed by incineration at 550�C for 3 h (APHA,1998). The material left after drying and burning representsthe TS and ash content, respectively. The weight loss after theinitial drying and incineration corresponds to the water and VScontent, respectively (see Note 2).
3. Analysis of total ammonium-nitrogen and total organic nitro-gen (see Note 3). Here, the Kjeldahl method is standard. Theprocedure for total organic nitrogen (Kjeldahl-nitrogen) con-sists of three basic steps: (1) digestion of the sample in sulphu-ric acid with a catalyst, which results in conversion of nitrogento ammonia; (2) distillation of the ammonia in boric acidand (3) quantification of the ammonium by titration withhydrochloric acid (Kjeltec application subnote 3502). Forammonium-nitrogen (NH4
+-N), determination steps 2 and 3of the Kjeldahl procedure are applied.
4. pH analysis. Some substrate streams can have low/high pH.Low alkalinity can potentially affect the process negatively (seeNote 4).
5. Volatile fatty acid (VFA) analysis. For easily degradable mate-rial, fatty acid production can be induced during transporta-tion/storage by activation of hydrolysis and fermentation. Iflevels are high, there are potential risks of underestimating theTS and VS content and of acidification of the process. Methodsof analysis are described in the section on monitoring (seeNotes 2 and 5 and Subheading 3.5).
6. Analysis of phosphate and phosphorus is of interest regardingfertiliser quality, but also as too low levels can cause deficiencyand hence process instability. Phosphate phosphorus (PO4-P)
Protocol for Start-Up and Operation of CSTR Biogas Processes 175

can be spectrophotometrically determined after acidificationwith sulphuric acid (H2SO4) and reaction with antimony potas-sium tartates, ammonium molybdate and ascorbic acid (ISO15923-1:2013). For total phosphorus (P-tot), extraction isperformed at 30 min and 120�C with potassium peroxidemonosulphate according to SS-EN ISO 6878:2005 and thenaccording to the method for phosphate phosphorus.
7. Metal analysis is performed in order to determine the levelsof heavy metals for fertiliser quality and trace elements (seeNote 6). Metals are typically extracted from sludge using con-centrated nitric acid (HNO3) and heating for 15 min at 150�C.The extracted samples can be analysed with ICP-AES (ISO11885:2009 edition 2).
8. Determination of component and element composition (seeNote 7). In order to compose a suitable substrate mixture,regarding both gas production and estimation of biogas poten-tial and biogas production rate, it can be of interest to know thecontent of protein, lipids, carbohydrates and lignin (see Subhead-ing 3.2). The analysis can be performed as, e.g. for animal feeds[30]. Alternatively, an elemental composition analysis to deter-mine the composition of C, H, O and N can be of value [31].
9. The sulphur and sulphate content in the substrate mixture isimportant due to the effect on gas quality, e.g. hydrogensulphide (H2S), gas yield and the performance of the microbialdegradation process (see Note 8). Analysis of sulphur can beperformed with ICP-AES after acidification and heating to120�C for 2 h [32]. Sulphate can be measured indirectlyusing simple cuvette tests measuring turbidity or spectrometricanalyses according to, e.g., ISO 22743.
3.2 Determination of
Biogas Potential
Determination of the methane potential is of great importance notonly for economic calculations during planning and operation ofindustrial biogas plants, but also for evaluation of process perfor-mance, i.e. comparison of expected yield and that obtained inpractice (see Subheading 3.5). The chemical composition of thematerial used as substrate affects the biogas yield and the methanecontent of the gas [30, 33]. Moreover, the composition influencesthe biodegradability and degradation kinetics [34, 35]. Differentmethods can be used to estimate the biogas potential and biogasproduction rate in a material of interest for biogas production,either by using the chemical composition for theoretical calcula-tions (1 and 2 below) or by using a practical method (3 below). Thetheoretical calculations usually give an overestimate of the methanepotential as they do not consider that some carbon compounds arerecalcitrant to degradation and that part of the material is used forformation of new biomass.
176 A. Schn€urer et al.

1. Calculation with the Buswell formula: This formula can beused for calculating the theoretical methane production of aspecific material if the composition regarding C, H, O and N isknown [36];
CnHaOb þ n � a=4� b=2ð ÞH2O ! n=2� a=8 þ b=4ð ÞCO2
þ n=2þ a=8� b=4ð ÞCH4
2. Calculation based on the component composition. By assum-ing the elemental composition (C6H12O5)n, C57H104O6 andC5H7NO2 for carbohydrates, lipids and proteins, respectively,and applying the Buswell formula, the methane potential ofthese materials is estimated to be 0.415, 1.014 and 0.496CH4 m3/kg VS, respectively [37].
3. Biochemical methane potential (BMP) test. In this test, aninoculum containing a variety of anaerobic microorganisms isincubated with the substrate in a suitable medium and temper-ature. The biogas and methane production is determined overtime and an accumulated methane curve is constructed, givingthe methane potential. There are many parameters with animpact on the outcome of a BMP, including the character ofthe material and the set-up of the experiment, as reviewed inRaposo, De la Rubia, Fernandez-Cegrı and Borja [33]. Atypical set-up of a BMP-test is as follows:
(a) Selection of an appropriate inoculum (see Note 9).
(b) Pre-incubation of the inoculum for about 2–7 days at thetemperature of interest to decrease the amount of gasarising from endogenous materials present in the inocu-lum (see Note 9).
(c) Mixing of inoculum and substrate in anaerobic bottles,preferably in triplicate, to a substrate:inoculum ratio ofbetween 1:2 and 1:4, based on VS content (see Note10). A suitable load of substrate in the test is 3 g VS/L,thus resulting in an inoculum corresponding to 6–12 gVS/L. The mixing should be performed under flushingwith N2/CO2 (80:20) to ensure anaerobic conditions.
(d) Dilution of the substrate/inoculum mixture with a suit-able medium to reach the same volume in all test bottles.This medium can either be tap water or a buffer, depend-ing on the alkalinity of the mixture and the character of theinoculum and substrate. It is important to ensure that thefinal pH is around 7–8 (see Note 11).
(e) Preparation of triplicate controls without substrate, sothat gas production from the endogenous material presentin the inoculum alone can be accounted for.
Protocol for Start-Up and Operation of CSTR Biogas Processes 177

(f) Preparation of triplicate control bottles using a compoundwith knownmethane potential as a substrate (seeNote 12).
(g) Incubation of the experimental bottles under shaking atthe desired temperature (see Note 11).
(h) Sampling of the bottles for analysis of gas production overtime considering both volume produced and methanecontent of the gas (see Note 13). The incubation periodis typically around 20–40 days and the gas analysis can beperformed either in automatic mode, continuously moni-toring both gas volume and methane content [38], or bymanual sampling (see Note 13).
(i) Construction of an accumulated methane productioncurve. The methane potential is reached when the produc-tion rate levels off to a plateau. The value obtained afterdeducting the gas production from the endogenous mate-rial in the inoculum represents the methane potential. Thevolumetric methane value should be normalised accordingto standard temperature (273.15 K) and pressure (1 bar),which can be done using the ideal gas law, and expressed asNml CH4/g VS [38].
3.3 Composing a
Suitable Substrate
Many different types of organic material can potentially be used forbiogas production and the material selected should have a compo-sition that meets the nutrient requirements of the microorganisms.However, as already mentioned, the substrate should optimally alsoresult in high biogas and methane yield, as well as a digestate ofgood quality regarding high nutrient composition and low levels ofcontaminants. Sometimes these different requirements are difficultto meet, for example, some materials with high methane potentialtypically also cause problems in the biogas process due to formationof inhibitory components such as long chain fatty acids from fat orammonia and sulphides from proteins [20]. In addition, somematerials, such as plant-based materials, are restricted by low con-tent of trace metals or low buffering capacity, [39]. Moreover, inlarge-scale applications the choice of material may be restricted toavailability in the vicinity of the biogas plant. To overcome thedrawbacks of a single material, simultaneous co-digestion usingtwo or more substrates in a mixture is a feasible option to mono-digestion [7, 40, 41]. For full-scale applications it is also importantto consider additional parameters such as availability, cost, legisla-tion/regulations and need for pre-treatments (see Note 14). Someselected typical materials and some parameters of importance withregard to biogas production are as follows:
1. Protein-rich materials, for example, slaughterhouse waste, foodwaste, fish waste, swine and chicken manure and stillage, typi-cally give good biogas yield but have a low C/N ratio, and thus
178 A. Schn€urer et al.

may result in ammonia inhibition [42–46] (see Notes 3,8 and 15). In addition, these materials result in high levels ofhydrogen sulphide (see Note 23), influencing gas quality andthe overall process [20, 47].
2. Materials rich in lipids, such as fat, oils, fish waste, slaughter-house waste and sometimes food wastes have high biogaspotential, but can cause process inhibition and foaming dueto release of long chain fatty acids [43, 44, 48] (see Note 5).
3. Materials with a high degree of lignocellulose, such as straw andcrop residues, give somewhat restricted biogas production andresult in low biogas potential and slow degradation [49]. Someplant-based materials in this category also contain low levels oftrace metals and alkalinity [19, 50].
4. Materials with a high level of easily accessible carbon, such asfruit residues, potato and sugar beets, undergo rapid initialconversion rate and can cause acidification in the process ifadded in high amounts [51].
3.4 Start-Up and
Operation of the
Reactor
Laboratory-scale operation of a biogas process provides the oppor-tunity for setting up experiments for evaluation of substrates andoperating parameters under more controlled conditions than thosein large-scale plants. However, each process is unique and candevelop somewhat differently. A factor to consider during set-up isthat two parallel, identically operated processes can still differ interms of performance and microbiology [52]. On the other hand,there are examples in the literature of parallel reactors maintainingexactly the same performance over a long time [53, 54]. Anotherparameter to take into consideration is the evaluation period. Aminimum operating period is three retention times after reachingthe target operating parameters. This is the theoretical time neededto reach complete washout of non-active microorganisms and toreach steady state of the chemical composition. However, the timeneeded to reach a stable microbial community can be longer thanthree retention times [55].Consequently, to secure good and reliableresults, it might be appropriate to initiate more than one reactor andalso to operate the process over a longer period than three retentiontimes. If changes in process parameters are being evaluated, it is alsorecommended to have a control reactor not subjected to thesechanges, thus ensuring that the results obtained from the changescan be distinguished from changes caused just by time [53, 54].
1. Select a suitable inoculum. As with the BMP test, it is recom-mended to use inoculum taken from a well-functioning biogasprocess preferably using a similar substrate and operating para-meters as planned for the new process (see Note 16).
2. Inoculate the reactor with a desired volume (typically about70% of the total reactor volume) of the selected inoculum.
Protocol for Start-Up and Operation of CSTR Biogas Processes 179

Optimally, the inoculum volume should be added on oneoccasion, but if there is not enough inoculum available add asmuch as possible and start feeding to reach the full volume (seeNote 17)
3. Set the operating temperature and stirring frequency. Biogasproduction can proceed at different temperatures, but inindustrial production is typically set to mesophilic (35–42�C)or thermophilic (46–60�C). Biogas production can alsoproceed at psychrophilic temperature (15–25�C) [56]. Thetemperature and stirring mode chosen depend on the type ofprocess, substrate and other operating parameters (see Notes18 and 19).
4. Set feeding amount. To ensure stable operation, the organicloading rate (OLR), defined as the amount of organic materialadded per reactor volume (active) and day, should be graduallyincreased. The organic content is typically defined as volatilesolids (VS) or chemical oxygen demand (COD). The optimalinitial and final load and the increase rate of OLR depend onseveral factors (see Note 20). If the process is operating withthe same substrate or a substrate similar to that treated by theprocesses from which the inoculum was taken, the OLR canimmediately be set as similar to that in the original process.Otherwise, a guideline is to start feeding with an initial load ofaround 0.5–1 g VS/L/day and to increase the load by 0.5 gVS/L/day every week until full load is reached (see Note 20).To ensure that the increase in OLR is not too high, monitoringis recommended (see Subheading 3.5).
5. Decide the feeding frequency. Feeding frequency in full-scaleapplications varies depending on the character of the substrateand can either be continuous or semi-continuous, the latterwith a feeding frequency of approximately 1–10 times per day(see Note 21).
6. Set the hydraulic retention time (HRT). This time should besufficiently long to allow efficient degradation of the inputmaterial at a minimum volume (seeNote 22). The HRT shouldtypically be set to 15–40 days, but can also be shorter or longerdepending on substrate availability and operating parameterssuch as temperature and OLR [19] (see Notes 18 and 20).
3.5 Monitoring/
Evaluation
It is important to carefully monitor the biogas process, as manydifferent parameters can result in instability and failure of theprocess [49]. Monitoring makes it possible to detect problems ina timely manner and rectify them before things have gone so farthat the process deteriorates. Some microorganisms, such as meth-ane producers, are extremely sensitive and may stop growing and/or are washed out of the process if they do not thrive. For example,the process temperature must be closely monitored because
180 A. Schn€urer et al.
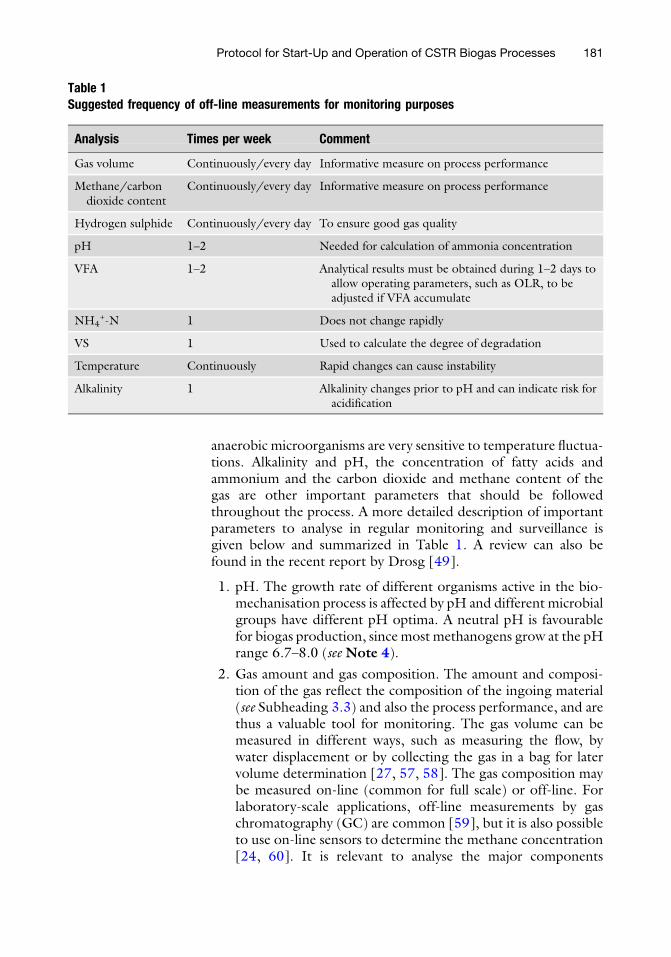
anaerobic microorganisms are very sensitive to temperature fluctua-tions. Alkalinity and pH, the concentration of fatty acids andammonium and the carbon dioxide and methane content of thegas are other important parameters that should be followedthroughout the process. A more detailed description of importantparameters to analyse in regular monitoring and surveillance isgiven below and summarized in Table 1. A review can also befound in the recent report by Drosg [49].
1. pH. The growth rate of different organisms active in the bio-mechanisation process is affected by pH and different microbialgroups have different pH optima. A neutral pH is favourablefor biogas production, since most methanogens grow at the pHrange 6.7–8.0 (see Note 4).
2. Gas amount and gas composition. The amount and composi-tion of the gas reflect the composition of the ingoing material(see Subheading 3.3) and also the process performance, and arethus a valuable tool for monitoring. The gas volume can bemeasured in different ways, such as measuring the flow, bywater displacement or by collecting the gas in a bag for latervolume determination [27, 57, 58]. The gas composition maybe measured on-line (common for full scale) or off-line. Forlaboratory-scale applications, off-line measurements by gaschromatography (GC) are common [59], but it is also possibleto use on-line sensors to determine the methane concentration[24, 60]. It is relevant to analyse the major components
Table 1Suggested frequency of off-line measurements for monitoring purposes
Analysis Times per week Comment
Gas volume Continuously/every day Informative measure on process performance
Methane/carbondioxide content
Continuously/every day Informative measure on process performance
Hydrogen sulphide Continuously/every day To ensure good gas quality
pH 1–2 Needed for calculation of ammonia concentration
VFA 1–2 Analytical results must be obtained during 1–2 days toallow operating parameters, such as OLR, to beadjusted if VFA accumulate
NH4+-N 1 Does not change rapidly
VS 1 Used to calculate the degree of degradation
Temperature Continuously Rapid changes can cause instability
Alkalinity 1 Alkalinity changes prior to pH and can indicate risk foracidification
Protocol for Start-Up and Operation of CSTR Biogas Processes 181

methane and carbon dioxide, but also the level of hydrogensulphide (see Note 23).
3. Alkalinity. Biogas processes typically operate at neutral pH orslightly above neutral (pH 7.0–8.5). Maintaining neutral andstable pH values is critical for the functioning of the microbialprocess and requires relatively high and constant alkalinity.Combined with VFA and pH analysis, alkalinity gives a goodmeasure of process endurance and the risk of instability. Onecommon method to measure alkalinity is by titration [49]. Forthis, a reactor sample is centrifuged and the supernatant istitrated to pH 5.75 for partial alkalinity (PA) and to pH 4.3for total alkalinity (TA) [75] (see Note 4).
4. Degradation intermediates. Degradation intermediates such asVFA typically accumulate when there is an imbalance in thedifferent microbial degradation steps. This imbalance can becaused by a number of different factors, such as overloading,temperature fluctuations and toxicity. VFA analysis is one of themost common parameters used for monitoring biogas pro-cesses and numerous studies have shown that VFA contentcorrelates well with process performance [61–63]. VFA canbe analysed as total concentration of carboxylic acids, or asconcentration of each of the individual acids (see Note 5).Typical methods used include GC [64] and high pressureliquid chromatography (HPLC) or titration [62, 65], or on-line measurement techniques [63].
5. Temperature. Biogas production can proceed at a wide range oftemperatures (see Subheading 3.4), but to avoid process insta-bility the temperature should not vary too much from thatselected for a specific process (see Note 18).
6. Ammonium-nitrogen, i.e. the sum of ammonium and ammo-nia. Ammonium is released during the degradation of protein-aceous materials and exists in equilibrium with ammonia. Highlevels are often associated with reactor instability, indicated byreduced methane production rate and high effluent concentra-tion of VFA [20, 42]. The concentration that results ininhibition varies from one process to the next and depends onthe prevailing operating conditions. Ammonia is consideredto be the inhibitory component and a range of values(53–1,100 mg/L) have been reported to result in instability[42] (see Note 15). Methods of analysis are described inSubheading 3.1.
7. Specific methane yield and degree of degradation. The volumeof gas produced and the methane concentration in the gas givethe methane production from the reactor. Together with theamount of VS fed to the reactor, this allows the specific meth-ane yield to be calculated as m3CH4 per kg VS fed to thereactor. The methane yield obtained can be compared against
182 A. Schn€urer et al.

the measured biogas potential of the substrate (see Subhead-ing 3.2). Yield corresponding to 70–90% of that determined bythe BMP test can be expected, but the results also depend onthe time allowed for degradation, i.e. the hydraulic retentiontime. Specific methane yield is calculated as:
m3CH4 kgVS�1 ¼ V g �%CH4
Q s � VSin � TSin
where Qs is flow into the reactor/day, VSin is VS content inincoming substrate, TSin is TS content in incoming substrateand Vg is volume gas produced/day.
8. Degree of degradation or VS reduction. This is a measure of theproportion of organic matter fed to the reactor that has beendigested, i.e. converted into biogas. A high degree of VSreduction suggests a higher degree of degradation and hencea more efficient biogas process (see Note 24).VS reduction is calculated as:
VSred ¼ Q s � VSin �Q r � VSrQ s � VSin
where Qs is flow into the reactor, Qr is flow out of the reactorand VSr is VS content in effluent.
3.6 Implementation
of Monitoring Results
As listed above, many different parameters can affect the efficiencyof a biogas process, as well as its stability and risk of failure. Thus itis difficult to give direct advice on measures to be taken when theprocess is going towards values outside the stability limits and/orhas low efficiency regarding gas production and degree of degrada-tion. However, using the protocol given above and consideringNotes 1–24, a good understanding of the process and its limita-tions and possibilities, as well as reasons for instability or failure, canbe achieved. With this knowledge it is also possible to take actionsto manage the process towards high efficiency and stability.
4 Notes
1. During characterisation of a specific material, it is important tobear in mind that the composition may vary from batch tobatch and thus multiple random sampling must be performedover time to ensure that reliable data are obtained. Repeatedanalysis over time gives information not only on the time-specific composition, but also on the variability of the material,which can be taken into consideration later when composingfeedstock mixtures. One way to minimise errors caused bysample heterogeneity is to pool subsamples from different
Protocol for Start-Up and Operation of CSTR Biogas Processes 183

batches and grind the bulk sample prior to sampling, as sug-gested by Hansen et al. [66]. Taking out rather large samples(>1 L) can also decrease errors. Sample storage is anothercritical parameter, as it can sometimes change the compositionof the material. To avoid biological decomposition before anal-ysis, freezing at�20�C is recommended if the sample cannot beanalysed directly after sampling.
2. The content of water, mineral and organic material is importantwhen setting operating parameters such as OLR and HRT (seeSubheading 3.4). In addition, this is a critical parameter forjudging the capacity for efficient pumping and stirring and alsofor evaluating the biogas potential (see Subheading 3.2). Acommon TS value for the ingoing substrate of a CSTR processis around 2–15%. Analysis of TS and VS by drying and inciner-ation is a simple and low-cost analysis. In addition, TS contentis sometimes analysed on-line in full-scale biogas plants andused as an estimate of the load to the reactor. During analysisof VS/TS content, it is important to take into considerationpossible loss of volatile organic matter during the drying pro-cess [33, 67]. This loss needs to be estimated for correctdetermination of the organic load (see Note 20), as well as forcalculation of specific methane yield (see Subheading 3.5, item7). The organic matter content can also be determined by othermethods, such as Chemical Oxygen Demand (COD, APHA1997). COD is a general measure of the amount of solubleorganic compounds present in the sample that could give rise tomethane and is often used as a standardised method for moredilute samples, such as wastewater and sludge. COD analysis issomewhat more complicated for samples with high TS content,although by homogenisation and dilution good results can alsobe obtained with solid samples [33, 68]. For analysis of drymatter and water content, a recent publication also suggestsKarl Fisher titration as a method giving high accuracy and asbeing particularly suitable for pre-treated lignocellulosic mate-rial, where oven drying typically underestimates the dry mattercontent due to loss of volatiles [69].
3. Analysis of total nitrogen and total ammonium-nitrogen is ofrelevance for composing a suitable feedstock mixture and alsoduring evaluation of the process, e.g. calculation of degree ofmineralisation (see Note 24). Organically bound nitrogen willduring the degradation process be released as ammonium andammonia (see Note 15). pKa (9.25) for NH4/NH3
+ is higherthan a typical pH (<8) for an anaerobic digestion process andthus this release will contribute with an increase in the buffercapacity (e.g. alkalinity, see Note 4) further on increasing alsothe level of dissolved bicarbonate (HCO3
�) [70]. In this sensehigh nitrogen in the feedstock can be beneficial for the process.
184 A. Schn€urer et al.

However, as described below as well as in Note 15 it can alsohave negative effects. For the feedstock, the C/N ratio (totalorganic carbon and nitrogen) is of great importance.For optimal degradation in an AD process, this ratio has beensuggested to be set between 15 and 25 [19, 71], but biogasproduction at C/N ratios outside this range has also beenreported [53]. If the ratio is too low, the process risks sufferingfrom ammonia inhibition, while if it is too high the bacteriamight experience nitrogen limitation [19, 71]. Another factorto consider in this regard is the carbon source. A high C/Nratio poses a greater risk of process problems arising if themajority of the carbon is easily accessible, e.g. that in starch.In that case the carbon is quickly degraded and there is a risk ofacidification. On the other hand, excessively high levels ofnitrogen typically result in high levels of ammonia, which isspecifically inhibitory for the methanogens, also typically result-ing in process instability [42]. The C/N ratio can be adjustedby co-digesting materials that are complementary in this regard[7]. Studies have also shown that adjustment of the C/N ratioby addition of glucose or urea has positive effects on the meth-ane potential [19].
4. pH is an important parameter influencing methane productionefficiency [72]. The optimal range of pH for methane produc-tion is 6.5–7.5, but the range varies with different substratesand operating parameters [73, 74]. With an acid substrate or aneasily degradable substrate resulting in rapid acid production, apH change can occur in the reactor. The degree of such a pHchange depends on the available alkalinity in the reactor, whichalso regulates how fast the pH is restored to optimal levels.Alkalinity is a measure of the buffer capacity, i.e. the ability of asolution to neutralise acids, and can be expressed in differentways. The total alkalinity (TA) gives a measure of the combinedeffect of several different buffering systems [76] The partialalkalinity (PA) represents the buffering capacity of the carbon-ate system, and includes in addition the ammonium–ammoniasystem. The intermediate alkalinity (IA) is the differencebetween TA and PA and includes mainly the buffering capacityof the VFA [75, 76]. The stability of the process can be eval-uated by calculating the IA/PA ratio where a ratio of 0.3 or lessindicates a stable process [75, 77]. A value between 0.3 and 0.8indicates, on the other hand, a risk of instability and a valueabove 0.8 suggests instability [49]. The VFA to alkalinity ratiois also known as the FOS/TAC ratio and is commonly analysedat full-scale biogas plants by the use of an automatic titrationequipment [49]. If necessary, alkalinity and pH can be adjustedin the biogas process by adding various stabilising agents suchas carbonates and bicarbonates combined with sodium or
Protocol for Start-Up and Operation of CSTR Biogas Processes 185

potassium, calcium carbonate (lime) andHCl [78, 79]. Sodiumcarbonate, sodium bicarbonate, potassium carbonate andpotassium bicarbonate are common stabilising agents forlarge-scale applications as they are easy to apply and difficultto overdose. Other alkaline substances, such as lime, ammonia,lye and urea, can be used but are more easily overdosed andmaynot always contribute to increased alkalinity in the process. Inaddition, urea and ammonia can have toxic effects on micro-organisms (seeNotes 3 and 15). The exact amount of bufferingsubstance that must be added to alter the alkalinity may varybetween different biogas processes and is dependent on severalfactors, such as the bicarbonate content, temperature, pH, fattyacid concentration and ammonia content [80]. Therefore, itcan be difficult to calculate exactly what should be added toadjust the alkalinity. It is best to add small doses repeatedly andtest between additions to see how the process is responding.Examples of how various stabilisers may be added in order toincrease alkalinity are provided in Capri and Marais [80].
5. Accumulation of VFA and other degradation intermediates,such as long chain fatty acids (LCFA), is highly undesirable asit is a sign of an inefficient process and also represents a signifi-cant loss of biogas. These compounds represent intermediatesfrom the acidogenesis and acetogenesis steps and typically thedegradation proceeds through syntrophic reactions involvingacid degraders and methanogens [14, 81]. Accumulation isbelieved to be a consequence of lower activity of methanogenscompared with acid producers and to be caused either byorganic overloading or inhibition of the methanogenic micro-bial communities. Alternatively, accumulation can be a conse-quence of direct inhibition of the acid-degrading community.The feedstock itself can also have high levels of acids, often dueto initiation of the degradation process during transportationand storage. Irrespective of the origin, VFA and LCFA cancause a drop in pH, foaming and, at high levels, toxicity tothe microbial community [7, 20, 48]. Acclimatisation to inhib-itory levels of LCFA has, however, been shown possible bysubsequent exposure of the process followed by periods ofrecovery [82, 83]. An alternative strategy to access the highbiogas potential in lipid rich waste is to use a step-wise start-upstrategy in order to allow development of a specialised micro-bial community [84]. For monitoring, the propionate:acetateratio is reported to be a useful early indicator of imminentprocess failure [85], with an increasing ratio suggesting ahigher risk. With increasing VFA concentration there is also asignificant risk of a pH drop, particularly in processes with lowbuffering capacity (see Note 4).
186 A. Schn€urer et al.

6. Trace metals are essential for enzymatic activity and for optimaldegradation efficiency it is important that the substrate containssufficient amounts. Trace element deficiency is suggested to bea limiting factor for achieving high biogas production, espe-cially at high OLR, and addition of trace elements has beenshown to circumvent accumulation of degradation intermedi-ates and lower the risk of process instabilities due to, e.g.ammonia inhibition [39, 86, 137]. Addition of trace metalshas given positive results with various types of substrate, such asfood waste [16, 43], crop material [87] and stillage [88].Cobalt, nickel, molybdenum and selenium are suggested tobe critical to process performance, but other metals can alsobe important [89]. To overcome nutrient deficiency, a broadspectrum of commercial supplementation products is availableon the market. It is important to bear in mind that the exactlevels needed for stable and efficient degradation are notcompletely clear and also that some forms of trace metals havelow bioavailability and are thus difficult for microorganisms toaccess [90]. The elements may be kept soluble by chelation(combination with another molecule), but may bind stronglywith the chelating agent forming complexes that again renderthem unavailable [17]. On analysing metals, the bioavailablenutrients represent only a fraction of the total amountmeasured in the material [91]. Moreover, addition of tracemetals also carries the risk of overdosing with heavy metalsand causing toxicity to the microbial consortium involved inanaerobic digestion [92]. Elevated heavy metal concentrationsmay also limit the subsequent use of digestate as fertiliser andcan cause environmental pollution [93]. With materials result-ing in sulphide formation, such as protein-rich materials, metalscan also be precipitated in the form of metal sulphides. Inclu-sion of iron chloride in addition to trace metals has been shownto give positive effects in such cases, primarily due to removal ofsulphide by the iron to levels <50 ppm in the gas phase,allowing higher bioavailability of trace elements [15, 88, 94,136].
7. Component and element analysis can be of interest for severalreasons, but is typically not performed in full-scale applicationsbut rather for research purposes. Information on the composi-tion can be used not only for theoretical calculation of themethane potential (see Subheading 3.3) but also to judge thebiodegradability of a specific material and limitations or risks ofcomplications as regards substrate specific features. Differentmaterials have different characteristics not only regardingmethane potential, but also concerning biodegradability andrisks for process failure or problems (see Subheading 3.3). As
Protocol for Start-Up and Operation of CSTR Biogas Processes 187

mentioned, co-digestion if applicable can be one way to over-come issues related to specific materials [7, 40].
8. Anaerobic degradation of proteins typically results in the releaseof both ammonia (see Note 3) and sulphides, the latter origi-nating from the amino acids cysteine and methionine. Reduc-tion of sulphate by sulphate-reducing bacteria representsanother source of sulphides. High levels of sulphate are com-monly detected in industrial waste streams, typically from dis-tilleries or the pulp and paper industry. Sulphate-reducingbacteria effectively consume substrates otherwise destined formethane, hence presence of sulphate can result in lower gasyields [95]. Sulphides are undesired in methanogenic processesdue to reduced bioavailability of trace metals caused by precipi-tation (seeNote 6), direct toxic effects [96] and contaminationof the biogas, causing bad odour, negative health effects andcorrosive effects on pipes and gas engines. Sulphides can bereduced by iron addition (see Note 6).
9. There are many parameters with an impact on the outcome of aBMP test, as reviewed by Raposo, De la Rubia, Fernandez-Cegrı and Borja [33], but one of the most important is theactivity of the inoculum. The inoculum should best be takenfrom a well-functioning biogas process preferably operating ona mixed substrate to ensure high functional diversity of themicrobial community and operating at the temperature ofinterest for the test. Alternatively, inoculum from differentplants operating with different feedstocks can be mixed. If asubstrate is to be evaluated for an existing biogas plant, theinoculum should be taken from this specific plant. The inocu-lum should be used fresh and not stored for a long time. Pre-incubation of the inoculum for a maximum of around 1 weekgives an optimum decrease in background gas production.Longer pre-incubation times risk decreasing the microbialactivity, but may still be possible depending on the inoculum.
10. The ratio between inoculum and substrate has been shown tobe of high importance, as it is critical that the inoculum con-tains a sufficient amount of microbial cells with high activity toreach maximum rate and methane potential in the test [97].The optimal ratio differs between different studies and todevise an optimised test for a specific inoculum it is recom-mended that different ratios be evaluated. One common andeasy method for estimating the biomass concentration in thesample is to analyse the content of volatile suspended solids(VSS) or total VS content. Note, however, that this analysisdoes not distinguish between microbial biomass and otherparticulate organic matter, such as lignocellulosic residues,resulting in uncertainties. Another consideration when settingup the experiment is that using too high an amount ofinoculum might result in high background production of
188 A. Schn€urer et al.

biogas and lag periods caused by potential toxicants present inthe inoculum.
11. The environmental conditions in the test vials are vital for thetest outcome and the dilution medium is one parameter ofparticular importance. For biodegradation to proceed, allnutrients required by the microorganisms, including tracemetals, need to be available. In addition, the environmentalconditions regarding pH and temperature need to be in a rangeallowing microbial growth. Moreover, stirring and the flushinggas used are influential parameters. The optimal pH for the testis around 7–8, set according to levels optimal for methanogenicactivity. Regarding temperature, this parameter strongly regu-lates the growth rate and sometimes also the efficiency of thedegradation. Anaerobic digestion typically proceeds in themesophilic, thermophilic or sometimes psychrophilic tempera-ture range (see Subheading 3.4). In the BMP test, using thesame temperature as the biogas plant from which the inoculumis taken is recommended. Flushing to avoid introduction ofoxygen in the test can be performed with different gases, but arecent publication showed that N2/CO2 is preferable to N2
alone [98]. Mixing increases the contact between substrate andmicroorganisms and thus stirring, manually or automatically,typically increases the degradation rate (see Note 19). If theinoculum/substrate mixture lacks important trace metals and/or other nutrients, those can be supplied using a mineralgrowth medium as a dilution agent. In a test system with lowinitial pH or low alkalinity, a buffer is recommended as thedilution medium. Using a buffer decreases the risk of a pHdecrease during the course of the experiment due to the for-mation of degradation intermediates (VFA). However, suffi-cient amounts of nutrient and buffering capacity may already besupplied by the inoculum, in which case tap water can be usedas a dilution medium.
12. It is recommended that the activity of the inoculum be evalu-ated by preparing experimental bottles using a compound withknown methane potential as a substrate. Different chemicalscan be used depending on the activity of interest to measure,but it is best to use a component that needs all the microbialdegradation steps to be converted into biogas, i.e. hydrolysis,acidogenesis, acetogenesis and methanogenesis. Cellulose isone such commonly used compound, with a theoretical meth-ane yield of 415 Nml/g.
13. In a BMP test it is important to have a procedure consideringthe actual volume of the gas produced and to analyse themethane content of the gas. This can be done in differentways. The gas can, for example, constantly be released and thecarbon dioxide produced removed by letting the outflow gas
Protocol for Start-Up and Operation of CSTR Biogas Processes 189

pass through an alkali solution and finally a flow measurementdevice [49]. The gas produced can also be collected in a gas-tight bag followed by analysis of gas volume and composition.Alternatively a pressure is allowed to build up and a fixedvolume of gas can either be sampled with the same actualpressure as in the bottles, e.g. using a syringe with a pressurelock [66] or by sampling at atmospheric pressure combinedwith measuring the pressure in the bottles [59]. The gas sam-ples can then be analysed by gas chromatography. The samplinginterval depends on the type of material tested, but is typicallyevery day/every other day in the first week of incubation, afterwhich the time between sampling occasions can be expanded.
14. The selection of appropriate substrates for full-scale applicationdepends on several complex factors, such as the availability andlogistic feasibility of particular materials [99]. Regulations andlegislation regarding the use and quality of digestate (heavymetals, contamination with, e.g. plastics, potential patho-gens/need for substrate sanitisation, etc.) are other factorsthat need to be considered. The need for dilution of the sub-strate, which also affects the amount of digestate to allocate,might also be a limiting factor. In addition, different substratesrequire different mechanical pre-treatments [100–102].Finally, requirements on gas quality may also affect selectionof substrates, for example, avoidance of sulphate-containingmaterials, which lead to sulphide production, or determinethe need for iron addition to the process to reduce sulphideproduction (see Notes 6 and 8).
15. Ammonium is released during degradation of proteins but canalso be present in the feedstock from the beginning, e.g. inmanure. The level of ammonium-nitrogen in the processdepends on the substrate composition and on the degree ofmineralisation of the process, i.e. the proportion of organicmaterial converted to methane. A smaller proportion of theorganic nitrogen in the substrate is mineralised to ammonium-nitrogen at a low compared with a higher degree of decompo-sition, which in turn is dependent on sludge retention time,temperature and the microbial community [24]. A high con-tent of ammonium provides the process with alkalinity andincreases the value of the digestate as a fertilising agent, butunfortunately it also causes inhibition of the process, specifi-cally of the methanogenic community [42]. Temperature andpH indirectly affect the level of inhibition, since these para-meters shift the equilibrium of ammonium (NH4
+) and ammo-nia (NH3) towards the latter, which has been shown to be theactual cause of the inhibition [42, 103, 104]. Inhibition hasbeen reported to occur at varying concentrations ranging from53 to 1,450 mg NH3/L [42, 105]. This wide span is probably
190 A. Schn€urer et al.

the result of differences in substrate composition, reactordesign and operating parameters, such as HRT and tempera-ture, as reviewed in Moestedt [95]. In addition, adaptation tohigh ammonia levels has long been emphasised in the literature[105–108]. Allowing the microbial community to acclimatiseto the prevailing conditions can allow efficient biogas produc-tion at ammonia levels up to around 1,000 mg/L [95]. Adap-tation to high ammonia levels has been shown to be correlatedwith a shift in the methane-producing pathway, with significantcontributions by syntrophic acetate oxidation (SAO) to meth-ane formation [57, 109].Free ammonia is calculated as:
NH3 ¼ NH4 1þ 10�pH
10� 0:09018þ2729:92Tð Þ
� �
where NH4 is the total ammonia nitrogen and T is temperatureexpressed in Kelvin.
16. Some materials and/or conditions typically need long periodsof microbial adaptation and thus by selecting an inoculumalready adapted to the material/conditions, the start-up canbe faster and initial instability periods can be avoided. More-over, for an optimal process it is desirable to have an inoculumwith high microbial diversity, which is considered to be corre-lated with high functional redundancy, i.e. a high number ofspecies performing similar functions so that failure of onespecies can be compensated for by another, with little impacton essential processes [110]. The importance of inoculumselection has been illustrated for different processes, such asbiogas production at elevated total ammonium-nitrogen(TAN) levels [111] and for biogas production from straw andparagrass [112, 113]. However, while the initial microbialcomposition affects the start-up and initial phase of reactoroperation, its long-term importance is still unclear.
17. For start-up of a full-scale reactor from which the digestateleaves the tank by overflow, the reactor may have to be filledwith more than 70% of the total volume in order to supply thewater-lock and the gas may have to be collected before initia-tion of feeding. If heat is supplied with the substrate andinternal heating is not yet in operation, the associated differ-ence in temperature might also need to be considered whendetermining the feeding rate.
18. Temperature, together with substrate, is the most stronglydetermining parameter for stability and process performance.Temperature impacts strongly on community structure anddiversity, as well as on the degradation pathways and rates[17, 19, 43, 114]. When optimising an AD system for net
Protocol for Start-Up and Operation of CSTR Biogas Processes 191

energy production, the additional energy required to raise andmaintain feedstock and digester contents at this temperaturemust also be taken into account [35]. In general, anaerobicdigestion at thermophilic temperatures gives higher methaneproduction rates and methane yield, but this is not always thecase [53, 115–117]. Moreover, thermophilic digestion resultsin comparatively higher reduction of pathogens [22, 118], so itcan be used as the sole sanitisation method [26], and giveslower viscosity, resulting in less energy consumption for stirring[119]. Disadvantages with higher temperatures include lowermicrobial diversity [109, 116, 120], with an accompanying riskof a less stable process and less efficient degradation of certainchemical compounds, such as phenols [3, 120]. Moreover, ahigher process temperature needs a higher energy input in theform of heating. Processes operating at mesophilic temperatureare generally considered to be more stable and less sensitive toinhibitory components such as ammonia. Furthermore, theeffects of LCFA are less pronounced at mesophilic temperature[115]. The microbial community, specifically the methano-gens, is sensitive to temperature variations and experiencefrom large-scale operation shows that temperature fluctuationsshould not exceed �2–3�C for best results and to avoid insta-bility [49]. However, biogas production is possible at a widerange of temperatures, even in the range between mesophilicand thermophilic temperatures, and it is also possible to shiftfrom mesophilic to thermophilic temperature and vice versa[24, 53, 121, 122]. To allow the microbial community todevelop in line with a change in temperature a slow increase/decrease is recommended, with a guideline of 1�C change perday. However, there are examples in the literature of a higherrate of temperature increase being successful [122, 123].
19. The reactor can either be mixed continuously, using an inter-mittent mixing mode, or not mixed at all. Mixing mode andmixing intensity have been shown to have direct effects onbiogas yield [124]. Mixing ensures even distribution of thesubstrate, which is particularly important with feedstocks form-ing floating layers, e.g. straw, and good nutrient supply to themicroorganisms active in the biogas process. However, if tooharsh, mixing can also disrupt microbial aggregates resulting inless efficient degradation. Mixing is also essential to secureuniform temperature distribution in the reactor.
20. Parameters affecting the optimal initial OLR and rate of loadincrease include: (1) inoculum origin, i.e. whether themicrobial community is already adapted to the conditionsapplied regarding process operating parameters and substratecomposition. With similar conditions as in the original process,the start-up can be rather fast [24, 26]; (2) the time between
192 A. Schn€urer et al.

collection of inoculum and start-up of the process. If theinoculum has been transported under non-strictly anaerobicconditions and/or stored for some time it is recommendedthat feeding be initiated slowly; and (3) temperature of theinoculum. If the inoculum temperature is lower than that ofthe original process and/or will be changed in the new processcompared with the original process, it is important to allowtime for acclimatisation of the microbial community at thecorrect temperature and to increase the OLR slowly whilecarefully monitoring the process (see Note 18). OLR valuescommonly range between 2 and 6 g VS/L day, but lower/higher values have been reported [19, 125]. Note that anincrease in OLR is typically followed by a decrease in HRT,giving less time for degradation.Organic loading rate is calculated as:
OLR ¼ Q s � VSin � TSinV R
where Qs is flow into the reactor/day, VSin is VS content inincoming substrate, TSin is TS content in incoming substrateand VR is reactor volume.
21. The feeding frequency is often set based on practical considera-tions, i.e. how often the operator can feed the system, but alsodepends on the character of the feeding material. Materialswith low TS content are typically pumped into the reactorand allow more continuous feeding than, e.g. solid materials,which sometimes need to be put into the reactor in batches,e.g. semi-continuous feeding. The feeding approach affects thedegradation kinetics, formation of intermediates and biogasproduction, but usually does not affect the final biogas yield[126]. Dynamic feeding has lately been suggested as anapproach to allow flexible electricity supply from biogas[126]. The feeding regime has also been shown to affect theactivity and structure of the microbial community and its func-tional stability [127, 128].
22. The retention time should be sufficiently long to ensure gooddegradation of a specific material under specific operating para-meters. Substrates rich in sugar and starch are typically easilybroken down and require shorter retention times. For the deg-radation of these materials no hydrolysis is necessary and thedegradation starts directly at the second degradation step, fer-mentation.However, much longer times are required formicro-bial degradation of fibre- and cellulose-rich plant matter. Forsuch materials, it is often the hydrolysis step, and not methano-genesis, that limits the rate of decomposition. A typical sign oftoo low HRT is either accumulation of degradation intermedi-ates or a low degree of degradation (see Subheading 3.5).Hydraulic retention time is calculated as:
Protocol for Start-Up and Operation of CSTR Biogas Processes 193

HRT ¼ V R
Q s
whereQs is flow into the reactor/day and VR is reactor volume.
23. The composition of the gas is highly interesting for aproduction plant aiming to produce an energy-rich gas ofhigh quality, i.e. high level of methane and low level of hydro-gen sulphide [129]. Using carbohydrate feedstocks results inlower levels of methane and hydrogen sulphide and higherlevels of carbon dioxide compared with proteinaceous materi-als. An increase in the CO2 concentration of the biogas pro-duced may thus be a result of a change in feedstock. However, achange in gas composition may also be a sign of process insta-bility [130]. In a laboratory-scale reactor operating with ahomogeneous substrate, analysis of the carbon dioxide levelcan be an early warning of instability. In such cases, dailyanalysis of the carbon dioxide level by, e.g. a simple saccharom-eter can allow detection of instability from 1 day to another,shown as an increase in the level of a few per cent. In produc-tion plants, the input material typically varies over time andthus also the gas composition. In order to detect a deviationfrom the ‘normal’ variation, it is thus important to consider thegas composition and carbon dioxide content over a longerperiod and look for increasing/decreasing trends. In the caseof an increase in carbon dioxide caused by instability, measuresshould be taken to counteract a further increase and to recoverthe process. The measures that should be taken depend on thesubstrate and operating parameters used, but typically adecrease in OLR is required. Analysis of H2S is important forevaluating the gas quality, specifically in full-scale plants as theconcentration in the gas should be kept low for further use ofthe gas in combustion engines and boilers of upgrading plants[129]. The level should optimally be below 50 ppm.Moreover,analysis of hydrogen sulphide is also of interest, as it formscomplexes with metals, which can decrease the bioavailabilityof trace elements essential for microbial activity (see Notes 6and 8) [20, 131]. The level of H2S can be lowered in differentways. One common strategy is to add iron to the process,binding the sulphide ions. Iron can be added directly to thereactor liquid in different forms in order to precipitate thesulphides and hence also reduce the undesired precipitation oftrace elements [129, 132]. Sulphides can also be reduced inbiogas by aeration of headspace, resulting in oxidation ofreduced sulphides to elemental sulphur, or by biological oxida-tion of sulphides by, e.g. Thiobacillus species in a separate gas-upgrading unit [133, 134]. However, these downstream pro-cesses do not affect the precipitation of trace elements ormicrobial sulphide toxicity.
194 A. Schn€urer et al.

24. Reducing VS content is a measure with a long response time, solower degradation rate of the ingoing material cannot bedetected until a considerate fraction of the reactor fluid hasbeen replaced. Furthermore, part of the VS representsnon-degradable material and thus a small reduction does notalways result in inefficient degradation. Materials typically result-ing in a low degree of degradation are fibre-richmaterials such asmanure and straw, which typically has 30–70% VS reduction [53,135].Othermore easily degradablematerials can give a degree ofdegradation as high as 80–90% [25, 26]. An alternative way ofevaluating the degree of degradation is to analyse the mineralisa-tion of total nitrogen to ammonium-nitrogen [24].
References
1. Hamawand I (2015) Anaerobic digestionprocess and bio-energy in meat industry: areview and a potential. Renew Sust EnergRev 44:37–51
2. Murphy J, Braun R, Weiland P, Wellinger A(2011) Biogas from crop digestion. IEA Bioe-nergy Task 37
3. Weiland P (2010) Biogas production: currentstate and perspectives. Appl Microbiol Bio-technol 85:849–860
4. Vanholme B, Desmet T, Ronsse F, Rabaey K,Van Breusegem F, De Mey M, Soetaert W,Boerjan W (2013) Towards a carbon-negativesustainable bio-based economy. Front PlantSci 4:1–17
5. Alburquerque JA, de la Fuente C, Ferrer-Costa A, Carrasco L, Cegarra J, Abad M,Bernal MP (2012) Assessment of the fertiliserpotential of digestates from farm and agroin-dustrial residues. Biomass Bioenergy40:181–189
6. Nkoa R (2014) A comparison of microbialcharacteristics between the thermophilic andmesophilic anaerobic digesters exposed to ele-vated food waste loadings. Agron Sustain Dev34:473–492
7. Mata-Alvarez J, Dosta J, Romero-G€uiza MS,Fonoll X, Peces M, Astals S (2014) A criticalreview on anaerobic co-digestion achieve-ments between 2010 and 2013. Renew SustEnerg Rev 36:412–427
8. Appels L, Baeyens J, Degreve J, Dewil R(2008) Principles and potential of the anaero-bic digestion of waste-activated sludge. ProgEnergy Combust Sci 34:755–781
9. Amon T, Amon B, Kryvoruchko V,Machm€ul-ler A, Hopfner-Sixt K, Bodiroza V, Hrbek R,Friedel J, Potsch E, Wagentristl H et al (2007)Methane production through anaerobic
digestion of various energy crops grown insustainable crop rotations. Bioresour Technol98:3204–3212
10. Rajendran K, Aslanzadeh S, Taherzadeh MJ(2015) Household biogas digesters—areview. Energies 5:2911–2942
11. Lozanovski A, Lindner JP, Bos U (2014)Environmental evaluation and comparison ofselected industrial scale biomethane produc-tion facilities across Europe. LCAWaste Man-age Syst 19:1823–1832
12. Borjesson P, Tufvesson LM (2011) Agriculturalcrop-based biofuels - resource efficiency andenvironmental performance including directland use changes. J Clean Prod 19:108–120
13. Angelidaki I, Karakashev D, Batstone DJ,Plugge CM, Stams AJM (2011) Biomethana-tion and its potential. In: Rosenzweig AC,Ragsdale SW (eds) Methods in enzymology:methods in methane metabolism, vol 494.Elsevier Academic Press, San Diego, pp327–351
14. Worm P, M€uller N, Plugge CM, Stams AJM,Schink B (2010) Syntrophy in methanogenicdegradation. In: Hackstein JHP (ed) (Endo)symbiotic methanogenic archaea, vol 19.Springer, Berlin/Heidelberg, pp 149–173
15. Nordell E, Nilsson B, Nilsson Paledal S, Kar-isalmi K, Moestedt J (2015) Co-digestion ofmanure and industrial waste - the effects oftrace element addition. Waste Manage (InPress)
16. Moestedt J, Nordell E, Shakeri Yekta S,Lundgren J, Marti M, Sundberg C, EjlertssonJ, Svensson BH, Bjorn A (2015) Effects oftrace elements addition on process stabilityduring anaerobic co-digestion of OFMSWand slaughterhouse waste. Waste Manage (InPress)
Protocol for Start-Up and Operation of CSTR Biogas Processes 195

17. Banks CJ, Zhang Y, Jiang Y, Heaven S (2012)Trace element requirements for stable foodwaste digestion at elevated ammonia concen-trations. Bioresour Technol 104:127–135
18. Ward AJ, Hobbs PJ, Holliman PJ, Jones DL(2008) Optimisation of the anaerobic diges-tion of agricultural resources. Bioresour Tech-nol 99:7928–7940
19. Mao C, Feng Y, Wang X, Ren G (2015)Review on research achievements of biogasfrom anaerobic digestion. Renew Sust EnergRev 45:540–555
20. Chen JL, Ortiz R, Steele TWJ, Stuckey DC(2014) Toxicants inhibiting anaerobic diges-tion: a review. Biotechnol Adv 32:1523–1534
21. Divya D, Gopinath LR, Christy M (2015) Areview on current aspects and diverse pro-spects for enhancing biogas production in sus-tainable means. Renew Sust Energ Rev42:690–699
22. Sahlstrom L (2003) A review of survival ofpathogenic bacteria in organic waste used inbiogas plants. Bioresour Technol 87:161–166
23. Risberg K (2015) Quality and function ofanaerobic digestion residues. Swedish Univer-sity of Agricultural Sciences, Uppsala
24. Moestedt J, Nordell E, Schn€urer A (2014)Comparison of operating strategies forincreased biogas production from thin stil-lage. J Biotechnol 175:22–30
25. Moestedt, J, Nordell E, Hallin S, Schn€urer A(2016) Two stage anaerobic digestion forreduced hydrogen sulphide production. JChem Technol Biotechnol 91(4):1055–1062
26. Grim J, Malmros P, Schn€urer A, Nordberg A(2015) Comparison of pasteurization andintegrated thermophilic sanitation at a full-scale biogas plant – heat demand and biogasproduction. Energy 79:419–427
27. McLeod JD, Othman MZ, Beale DJ, Joshi D(2015) The use of laboratory scale reactors topredict sensitivity to changes in operatingconditions for full-scale anaerobic digestiontreating municipal sewage sludge. BioresourTechnol 189:384–390
28. Ruffino B, Fiore S, Roati C, CampoG, Novar-ino D, Zanetti M (2015) Scale effect of anaer-obic digestion tests in fed-batch andsemi-continuous mode for the technical andeconomic feasibility of a full scale digester.Bioresour Technol 182:302–313
29. Usack JG, Spirito CM, Angenent LT (2012)Continuously-stirred anaerobic digesters toconvert organic wastes into biogas: systemsetup and basic operation. J Vis Exp 65,e3978
30. Dandikas V, Heuwinkel H, Lichti F, DrewesJE, Koch K (2014) Correlation between bio-gas yield and chemical composition of energycrops. Bioresour Technol 174:316–320
31. Cabbai V, Ballico M, Aneggi E, Goi D (2013)Bmp tests of source selected ofmsw to evalu-ate anaerobic codigestion with sewage sludge.Waste Manag 33:1626–1632
32. Moestedt J, Nilsson Paledal S, Schn€urer A(2013) The effect of substrate and operationalparameters on the abundance of sulphate-reducing bacteria in industrial anaerobic bio-gas digesters. Bioresour Technol 132:327–332
33. Raposo F, De la Rubia MA, Fernandez-CegrıV, Borja R (2012) Anaerobic digestion ofsolid organic substrates in batch mode: anoverview relating to methane yields andexperimental procedures. Renew Sust EnergRev 16:861–877
34. Li Y, Zhang R, Liu G, Chen C, He Y, Liu X(2013) Comparison of methane productionpotential, biodegradability, and kinetics of dif-ferent organic substrates. Bioresour Technol149:565–569
35. Banks CJ, Heaven S (2013) Optimisation ofbiogas yields from anaerobic digestion byfeedstock type. In: Wellinge A, Murphy J,Baxter D (eds). The Biogas hand book:Sci-ence an, production and applications. Wood-head publishing series in energy (Cambridge,UK). Issue 52, pp 131–165
36. Buswell AM, Mueller HF (1952) Mechanismof methane fermentation. Ind Eng Chem44:550–552
37. Sanders W, Angelidaki I (2004) Workshop onharmonization of anaerobic biodegrdation,activity and inhibition assays. Rev EnvironSci Biotechnol 3:91–158
38. Stromberg S, Nistor M, Liu J (2014) Towardselimination systematic errors caused by theexperimental conditions in biochemichalmethane potential (bmp) tests. Waste Manag34:1939–1948
39. Demirel B, Scherer P (2011) Trace elementrequirements of agricultural biogas digestersduring biological conversion of renewablebiomass to methane. Biomass Bioenergy35:992–998
40. Astals S, Nolla-Ardevol V, Mata-Alvarez J(2012) Anaerobic co-digestion of pig manureand crude glycerol at mesophilic conditions:biogas and digestate. Bioresour Technol110:63–70
41. Braun R, Wellinger A (2003) Potential of co-digestion. IEA Bioenergy Task 37, Technicalbrochure
196 A. Schn€urer et al.

42. Rajagopal R, Masse DI, Sing G (2013) Acritical review on inhibition of anaerobicdigestion process by excess ammonia. Biore-sour Technol 143:632–641
43. Zhang C, Su H, Baeyens J, Tan T (2014)Reviewing the anaerobic digestion of foodwaste for biogas production. Renew SustEnerg Rev 38:383–392
44. Hejnfelt AAI (2009) Anaerobic digestion ofslaughterhouse by-products. Biomass Bioe-nergy 33:1046–1054
45. Solli L, Bergersen O, Sørheim R, Briseid T(2014) Effects of a gradually increased loadof fish waste silage in co-digestion with cowmanure on methane production. WasteManag 34:1553–1559
46. Nie H, Jacobi HF, Strach K, Xu C, Zhou H,Liebetrau J (2015) Mono-fermentation ofchicken manure: ammonia inhibition andrecirculation of the digestate. Bioresour Tech-nol 178:238–246
47. Jansen S, Gonzalez-Gil G, van Leeuwen HP(2007) The impact of Co and Ni speciationon methanogenesis in sulfidic media - bioup-take versus metal dissolution. Enzym MicrobTechnol 40:823–830
48. Rasit N, Idris A, Harun R, Ghani WAWAK(2015) Effects of lipid inhibition on biogasproduction of anaerobic digestion from oilyeffluents and sludges: an overview. RenewSust Energ Rev 45:351–358
49. Drosg B (2013) Process monitoring in biogasplants. IEA Bioenergy Task 37, TechnicalBrochure
50. Sawatdeenarunat C, Surendra KC, Takara D,Oechsner H, Khanal SK (2015) Anaerobicdigestion of lignocellulosic biomass: chal-lenges and opportunities. Bioresour Technol178:178–186
51. Bouallagui H, Touhami Y, Ben Cheikh R,Hamdi M (2005) Bioreactor performance inanaerobic digestion of fruit and vegetablewastes. Process Biochem 40:989–995
52. Hagen LH, Vivekanand V, Linjordet R, PopePB, Eijsink VH, Horn SJ (2014) Microbialcommunity structure and dynamics duringco-digestion of whey permeate and cowmanure in continuous stirred tank reactor sys-tems. Bioresour Technol 171:350–359
53. Risberg K, Sun L, Leven L, Horn SJ, Schn€urerA (2013) Biogas production fromwheat strawand manure – impact of pretreatment andprocess operating parameters. BioresourTechnol 149:232–237
54. Sun L, Pope PB, Eijsink VH, Schn€urer A(2015) Characterization of microbial com-munity structure during continuous
anaerobic digestion of straw and cow manure.Microb Biotechnol 8:815
55. Vanwonterghem I, Jensen PD, Dennis PG,Hugenholtz P, Rabaey K, Tyson GW (2014)Deterministic processes guide long-term syn-chronised population dynamics in replicateanaerobic digesters. ISME J 8:2015–2028
56. Dhaked RK, Singh P, Singh L (2010) Bio-methanation under psychrophilic conditions.Waste Manag 30:2490–2496
57. Westerholm M, Leven L, Schn€urer A (2012)Bioaugmentation of syntrophic acetate-oxidising culture in biogas reactors exposedto increasing levels of ammonia. Appl EnvironMicrobiol 78:7619–7625
58. Estevez MM, Sapci Z, Linjordet R, Schn€urerA, Morken J (2014) Semi-continuous anaero-bic co-digestion of cow manure and steam-exploded salix with recirculation of liquiddigestate. J Environ Manag 136:9–15
59. Westerholm M, Hansson M, Schn€urer A(2012) Improved biogas production fromwhole stillage by co-digestion with cattlemanure. Bioresour Technol 114:314–319
60. Moestedt J, Malmborg J, Nordell E (2015)Determination of methane and carbon diox-ide formation rate constants for semi-continuously fed anaerobic digesters. Ener-gies 8:645–655
61. Boe K, Angelidaki I (2012) Pilot-scale appli-cation of an online VFA sensor for monitoringand control of a manure digester. Water SciTechnol 66:2496–2503
62. Madsen M, Holm-Nielsen JB, Esbensen KH(2011) Monitoring of anaerobic digestionprocesses: a review perspective. Renew SustEnerg Rev 15:3141–3155
63. Falk HM, Reichling P, Andersen C, Benz R(2015) Online monitoring of concentrationand dynamics of volatile fatty acids in anaero-bic digestion processes with mid-infraredspectroscopy. Bioprocess Biosyst Eng 38:237–249
64. Jonsson S, Boren H (2002) Analysis of mono-and diesters of o-phthalic acid by solid-phaseextractions with polystyrene-divinylbenzene-based polymers. J Chromatogr A 963:393–400
65. L€utzhøft H-CH, Boe K, Fang C, Angelidaki I(2014) Comparison of vfa titration proce-dures used for monitoring the biogas process.Water Res 54:262–272
66. Hansen TL, Schmidt JE, Angelidaki I, MarcaE, Jansen JC, Mosbæk H, Christensen TH(2004) Method for determination of methanepotentials of solid organic waste. WasteManag 24:393–400
Protocol for Start-Up and Operation of CSTR Biogas Processes 197

67. Vahlberg C, Nordell E, Wiberg L; Schn€urer A(2013) Method for correction of vfa loss indetermination of dry matter in biomass.Swedish Gas Technology Centre: Malmo,1102–7371
68. Zupancic GD, Ros M (2012) Determinationof chemical oxygen demand in substrates fromanaerobic treatment of solid organic waste.Wase Biomass Valor 3:89–98
69. Agger J, Nilsen P, Eijsink VH, Horn S (2014)On the determination of water content in bio-mass processing. Bioenergy Res 7:442–449
70. Vannecke TPW, Lampens DRA, Ekarna GA,Volcke EIP (2014) Evaluation of the 5 and8 ph point titration methods for monitoringanaerobic digesters treating solid waste. Envi-ron Technol 36:861–869
71. Esposito G, Frunzo L, Giordano A, Liotta F,Panico A, Pirozzi F (2012) Anaerobic co-digestion of organic wastes. Rev Environ SciBiotechnol 11:325–341
72. Liu DW, Zeng RJ, Angelidaki I (2008) Effectsof ph and hydraulic retention time on hydro-gen production versus methanogenesis dur-ing anaerobic fermentation of organichousehold solid waste under extreme-thermophilic temperature (70 degrees c). Bio-technol Bioeng 100:1108–1114
73. Zhai N, Zhang T, Dongxue Y, Yang G, WangX, Ren G, Feng Y (2015) Effect of initial phon anaerobic co-digestion of kitchen wasteand cow manure. Waste Manag 38:126–131
74. Jiang J, Zhang Y, Li K, Wang Q, Gong C, LiM (2013) Volatile fatty acids production fromfood waste: effects of ph, temperature, andorganic loading rate. Bioresour Technol143:525–530
75. Ripley LE, Boyle WC, Converse JC (1986)Improved alkalimetric monitoring for anaero-bic digestion of high-strength wastes. J WaterPollut Control Fed 58(5):406–411
76. Lahav O, Morgan BE (2004) Titration meth-odologies for monitoring of anaerobic diges-tion in developing countries - a review. JChem Technol Biotechnol 79:1331–1341
77. Martın-Gonzalez L, Font X, Vincent T(2013) Alkalinity ratios to identify processimbalances in anaerobic digesters treatingsource-sorted organic fraction of municipalwastes. Biochem Eng J 76:1–5
78. Karlsson A, Ejlertsson J (2012) Addition ofHCL as a means to improve biogas produc-tion from protein-rich food industry waste.Biochem Eng J 61:43–48
79. Kleybocker A, Liebrich M, Verstraete W,Kraume M, W€urdemann H (2012) Earlywarning indicators for process failure due to
organic overloading by rapeseed oil in one-stage continuously stirred tank reactor, sew-age sludge and waste digesters. BioresourTechnol 123:534–541
80. Capri MG, Marais GVR (1975) Ph adjust-ment in anaerobic digestion. Water Res9:307–313
81. McInerney MJ, Struchtemeyer CG, Sieber J,Mouttaki H, Stams AJ, Schink B, Rohlin L,Gunsalus RP (2008) Physiology, ecology,phylogeny, and genomics of microorganismscapable of syntrophic metabolism. Ann N YAcad Sci 1125:58
82. Palatsi J, Laureni M, Andres MV, Flotats X,Nielsen HB, Angelidaki I (2009) Strategiesfor recovering inhibition caused by longchain fatty acids on anaerobic thermophilicbiogas reactors. Bioresour Technol100:4588–4596
83. Silva SA, Cavaleiro AJ, Pereira MA, StamsAJM, Alves MM, Sousa DZ (2014) Long-term acclimation of anaerobic sludges forhigh-rate methanogenesis from LCFA. Bio-mass Bioenergy 67:297–303
84. Cavaleiro AJ, Salvador AF, Alves JI, Alves M(2009) Continuous high rate anaerobic treat-ment of oleic acid based wastewater is possibleafter a step feeding start-up. Environ SciTechnol 43:2931–2936
85. Marchaum U, Krause C (1993) Propionic toacetic acid ratios in overloaded anaerobicdigestion. Bioresour Technol 43:195–203
86. Browne JD, Allen E, Murphy JD (2014)Assessing the variability in biomethane pro-duction from the organic fraction of munici-pal solid waste in batch and continuousoperation. Appl Energy 128:307–314
87. Lebuhn M, Liu F, Heuwinkel H, Gronauer A(2008) Biogas production from mono-digestion of maize silage-long-term processstability and requirements. Water Sci Technol58:1645–1651
88. Gustavsson J, Svensson BH, Karlsson A(2011) The feasibility of trace element supple-mentation for stable operation of wheatstillage-fed biogas tank reactors. Water SciTechnol 64:320–325
89. Schattauer A, Abdoun E, Weiland P, PlochlM, Heiermann M (2011) Abundance of traceelements in demonstration biogas plants. Bio-syst Eng 108:57–65
90. Gustavsson J, Yekta SS, Karlsson A, SkyllbergU, Svensson BH (2013) Potential bioavail-ability and chemical forms of co and ni in thebiogas process-an evaluation based onsequential and acid volatile sulfide extractions.Eng Life Sci 13(6):572–579
198 A. Schn€urer et al.

91. Oleszkiewicz JA, Sharma VK (1990) Stimula-tion and inhibition of anaerobic processes byheavy metals: a review. Biol Wastes 31:45–67
92. Facchin V, Cavinato C, Fatone F, Pavan P,Cecchi F, Bolzonella D (2013) Effect oftrace element supplementation on the meso-philic anaerobic digestion of foodwaste inbatch trials: the influence of inoculum origin.Biochem Eng J 70:71–77
93. Ortner M, Rachbauer L, Somitsch W, FuchsW (2014) Can bioavailability of trace nutri-ents be measured in anaerobic digestion? ApplEnergy 126:190–198
94. Karlsson A, Einarsson P, Schn€urer A, Sund-berg C, Ejlertsson J, Svensson BH (2012)Impact of trace element addition on degrada-tion efficiency of volatile fatty acids, oleic acidand phenyl acetate and on microbial popula-tions in a biogas digester. J Biosci Bioeng114:446–452
95. Moestedt J (2015) Biogas production fromthin stillage - exploring the microbial responseto sulphate and ammonia. Swedish Universityof Agricultural Sciences, Uppsala
96. Stams AJM, Oude Elferink SJWH, Wester-mann P (2003) Metabolic interactionsbetween methanogenic consortia and anaero-bic respiring bacteria. Adv Biochem Eng Bio-technol 81:31–56
97. Raposo F, Fernandez-Cegri V, De la RubiaMA, Borja R, Beline F, Cavinato C, DemirerG, Fernandez B, Fernandez-Polanco M, Fri-gon JC et al (2011) Biochemical methanepotential (bmp) of solid organic substrates:Evaluation of anaerobic biodegradabilityusing data from an international interlabora-tory study. J Chem Technol Biotechnol86:1088–1098
98. Koch K, Bajon Fernandez Y, Drewes JE(2015) Influence of headspace flushing onmethane production in biochemical methanepotential (bmp) tests. Bioresour Technol186:173–178
99. Wellinger A, Murphy J, Baxter D (2013) Bio-gas handbook: science, production and appli-cation, vol 52. Woodhead PublishingLimited, Cambridge
100. Naegele H-J, Monch-Tegeder M, Haag NL,Oechsner H (2014) Effect of substrate pre-treatment on particle size distribution in afull-scale research biogas plant. BioresourTechnol 172:396–402
101. Behera S, Arora R, Nandhagopal N, Kumar S(2014) Importance of chemical pretreatmentfor bioconversion of lignocellulosic biomass.Renew Sust Energ Rev 36:91–106
102. Montgomery LFR, Bochmann G (2014) Pre-treatment of feedstock for enhanced biogas
production. IEA Bioenergy Task 37, Techni-cal brochure
103. Chen Y, Cheng JJ, Creamer KS (2008) Inhi-bition of anaerobic digestion process: areview. Bioresour Technol 99:4044–4064
104. Hansen KH, Angelidaki I, Ahring BK (1998)Anaerobic digestion of swine manure: inhibi-tion by ammonia. Water Res 32:5–12
105. Yenig€un O, Demirel B (2013) Ammonia inhi-bition in anaerobic digestion: a review. Pro-cess Biochem 48:901–911
106. de Baere LA, Devocht M, van Assche P, Ver-straete W (1984) Influence of high NaCL andNH4CL salt levels on methanogenic associa-tions. Water Res 18:543–548
107. Hashimoto AG (1986) Ammonia inhibitionof methanogenesis from cattle wastes. AgricWastes 17:241–261
108. van Velsen AFM (1979) Adaption of metha-nogenic sludge to high ammonia-nitrogenconcentrations. Water Residue 13:995–999
109. Sun L, M€uller B, Westerholm M, Schn€urer A(2014) Syntrophic acetate oxidation in indus-trial CSTR biogas digesters. J Biotechnol171:39–44
110. Rosenfeld JS (2002) Functional redundancyin ecology and conservation. Oikos98:156–162
111. De Vrieze J, Gildemyn S, Vilchez-Vargas R,Jauregui R, Pieper D, Verstraete W, Boon N(2015) Inoculum selection is crucial to ensureoperational stability in anaerobic digestion.Appl Microbiol Biotechnol 99:189–199
112. Gu Y, Chen X, Liu Z, Zhou X, Zhang Y(2014) Effect of inoculum sources on theanaerobic digestion of rice straw. BioresourTechnol 158:149–155
113. Nuchdan S, Khemkhao M, TechkarnjanarukS, Phalakornkule C (2015) Comparative bio-chemical methane potential of paragrass usingan unacclimated and an acclimated microbialconsortium. Bioresour Technol 183:111–119
114. Labatut RA, Angenent LT, Scott NR (2011)Biochemical methane potential and biode-gradability of complex organic substrates.Bioresour Technol 102:2255–2264
115. Labatut RA, Angenent LT, Scott NR (2014)Conventional mesophilic vs. thermophilicanaerobic digestion: a trade-off between per-formance and stability? Water Res53:249–258
116. Moset V, Bertolini E, Cerisuelo A, CambraM, Olmos A, Cambra-Lopez M (2014)Start-up strategies for thermophilic anaerobicdigestion of pig manure. Energy 74:389–395
117. Golkowska K, Greger M (2013) Anaerobicdigestion of maize and cellulose under
Protocol for Start-Up and Operation of CSTR Biogas Processes 199

thermophilic and mesophilic conditions - acomparative study. Biomass Bioenergy56:545–554
118. Bagge E, Sahlstrom L, Albihn A (2005) Theeffect of hygienic treatment on the microbialflora of biowaste at biogas plants. Water Res39:4879–4886
119. Brambilla M, Romano E, Cutini M, Pari L,Bisaglia C (2013) Rheological properties ofmanure/biomass mixtures and pumping stra-tegies to improve ingestate formulation: areview. Trans ASABE 56:1905–1920
120. Leven L, Nyberg K, Schnurer A (2013) Con-version of phenols during anaerobic digestionof organic solid waste–a review of importantmicroorganisms and impact of temperature. JEnviron Manage 95(Suppl):S99–S103
121. Lindorfer H, Waltenberg R, Koller K, BraunR, Kirchmayr R (2008) New data on temper-ature optimum and temperature changes inenergy crop digesters. Bioresour Technol99:7011–7019
122. Ziembinska-Buczynska A, Banach A, Bacza T,Pieczykolan M (2014) Diversity and variabil-ity of methanogens during the shift frommesophilic to thermophilic conditions whilebiogas production. World J Microbiol Bio-technol 30:3047–3053
123. Dinsdale RM, Hawkes FR, Hawkes DL(1997) Comparison of mesophilic and ther-mophilic upflow anaerobic sludge blanketreactors treating instant coffee productionwastewater. Water Res 31:163–169
124. Lindmark J, Thorin E, Fdhila RB, DahlquistE (2014) Effects of mixing on the result ofanaerobic digestion: review. Renew SustEnerg Rev 40:1030–1047
125. Li C, Champagne P, Anderson BC (2013)Biogas production performance of mesophilicand thermophilic anaerobic co-digestion withfat, oil, and grease in semi-continuous flowdigesters: Effects of temperature, hydraulicretention time, and organic loading rate.Environ Technol 34:2125–2133
126. Mauky E, Jacobi HF, Liebetrau J, Nelles M(2015) Flexible biogas production fordemand-driven energy supply – feeding stra-tegies and types of substrates. BioresourTechnol 178:262–269
127. De Vrieze J, Verstraete W, Boon N (2013)Repeated pulse feeding induces functionalstability in anaerobic digestion. Microb Bio-technol 6:414–424
128. Lv Z, Leite AF, Harms H, Richnow HH,Liebetrau J, Nikolausz M (2014) Influencesof the substrate feeding regime on methano-genic activity in biogas reactors approachedby molecular and stable isotope methods.Anaerobe 29:91–99
129. Moestedt J, Nilsson Paledal S, Schnurer A,Nordell E (2013) Biogas production fromthin stillage on an industrial scale—experienceand optimisation. Energies 6:5642–5655
130. Boe K, Batstone DJ, Steyer J-P, Angelidaki I(2010) State indicators for monitoring theanaerobic digestion process. Water Res44:5973–5980
131. van der Veen A, Fermoso FG, Lens PNL(2007) Bonding form of metals and sulfurfractionation in methanol-grown anaerobicgranular sludge. Eng Life Sci 7:480–489
132. Ek A, Hallin S, Vallin L, Schn€urer A, KarlssonM (2011) Slaughterhouse waste co-digestion- experiences from 15 years of full-scale oper-ation. In: Proceedings of World RenewableEnergy Congress. Linkoping
133. Van der Zee F, Villaverde S, Garcia PA,Fdz-Polanco M (2007) Sulfide removal bymoderate oxygenation of anaerobic sludgeenvironments. Bioresour Technol98:518–524
134. Ramirez M, Fernandez M, Granada C, LeBorgne S, Gomez JM, Cantero D (2011)Biofiltration of reduced sulphur compoundsand community analysis of sulphur-oxidizingbacteria. Bioresour Technol 102:4047–4053
135. Ruile S, Schmitz S, Monch-Tegeder M,Oechsner H (2015) Degradation efficiencyof agricultural biogas plants – a full-scalestudy. Bioresour Technol 178:341–349
136. Romero-G€uiza MS, Vila J, Mata-Alvarez M,Chimenos JM, Astal S (2016) The role ofadditives on anaerobic digestion: a review.Renew Sustain Energy Rev 58:1486–1499
137. Choong YY, Norli I, Abdullah AZ, Yhaya MF(2016) Impacts of trace element supplemen-tation on the performance of anaerobic diges-tion process: a critical review. Biores Technol209:369–379
200 A. Schn€urer et al.

Protocols for the Isolation and Preliminary Characterizationof Bacteria for Biodesulfurization and Biodenitrogenationof Petroleum-Derived Fuels
Marcia Morales and Sylvie Le Borgne
Abstract
The use of microorganisms to improve fuel quality has been proposed, and in this chapter we describe basicexperimental procedures for the isolation and characterization of bacteria for biodesulfurization andbiodenitrogenation with dibenzothiophene and carbazole as model compounds for each application,respectively. The presented protocols should be considered as a starting point and adapted to otherproblematic compounds and conditions. Basic protocols for the evaluation of the treatment of real oilfractions are also presented.
Keywords: 4S pathway, Biodegradation, Biodenitrogenation, Biodesulfurization, Carbazole,Dibenzothiophene, Heteroatom, Nitrogen, Sulfur
1 Introduction
The use of microorganisms to improve the refining of problematicpetroleum feedstocks has been proposed [1]. The main target hasbeen the precombustion removal of sulfur (desulfurization) indiesel oils in a process called biodesulfurization (BDS) [2]. Hydro-desulfurization (HDS) is the technology currently used in refineriesfor the precombustion desulfurization of fuels. It involves the useof metallic catalysts at high pressures and temperatures to removeorganic sulfur compounds from petroleum fractions. Precombus-tion removal of sulfur-containing compounds is important in orderto limit SOx emissions into the atmosphere during the combustionof petroleum-derived fuels and therefore avoid the formation ofacid rain. Stringent restrictions on the levels of sulfur in transporta-tion fuels now exist in most countries [1]. Dibenzothiophene(DBT) and DBT with alkyl substituents in the 4- and 6-positionflanking the sulfur atom (Fig. 1) are more resistant to the HDStreatment than mercaptans and sulfides [3]. DBT is the model
T.J. McGenity et al. (eds.), Hydrocarbon and Lipid Microbiology Protocols, Springer Protocols Handbooks, (2017) 201–218,DOI 10.1007/8623_2014_41, © Springer-Verlag Berlin Heidelberg 2014, Published online: 30 December 2014
201

compound of polyaromatic sulfur heterocyclic compounds. Asignificant portion of the hydrocarbon present in diesel oil is DBTand its derivatives; it is therefore important that hydrocarbonsassociated to sulfur are not lost during desulfurization [4]. It hasbeen possible to isolate aerobic bacteria able to selectively extractthe sulfur atom from DBT and its derivatives through the 4Spathway (Fig. 2) [5]. These bacteria use DBT as sole source ofsulfur but not as source of carbon. DBT is not degraded in theprocess but only desulfurized by specific cleavage of its C–S bonds,leading to the formation of 2-hydroxybiphenyl (2-HBP) whichpartitions to the hydrocarbon phase (the fuel), while the sulfur iseliminated as inorganic sulfate in the aqueous phase containing thebiocatalyst. This transformation does not destroy the hydrocarbonskeleton and the thermal value of fuels is conserved. A number of“desulfurizing” bacteria have been described as Rhodococcus ery-thropolis IGTS8 [6], Rhodococcus sp. [7–9], Gordonia sp. [10],Nocardia sp.[11], Sphingomonas sp. [12], Pantoea agglomerans[13], Stenotrophomonas sp. [14], Sphingomonas subarctica [15],Brevibacillus invocatus [16] and the moderate thermophiles orthermotolerant Paenibacillus sp. [17], Bacillus subtilis [18], Myco-bacterium sp. [19], and Klebsiella sp. [20]. Mesophilic and moder-ately thermophilic desulfurizing microorganisms operate at 30 and45–60�C, respectively. Mining of genomic databases indicates thatpotential “desulfurizing” bacteria from different genera are still tobe isolated [21].
The higher the sulfur content in petroleum fractions, thehigher is the nitrogen content [22]. So another proposed applica-tion has been the biodenitrogenation (BDN) of fuels. Carbazole(CAR) and its alkylated derivatives (Fig. 3) typically comprise70–75% of the total nitrogen in crude oils [23]. These non-basicnitrogen compounds can be converted into basic compounds dur-ing the catalytic cracking process, which are strong inhibitors of
DBT
4,6-dimethyl-DBT
S
S
Fig. 1 Dibenzothiophenes
202 Marcia Morales and Sylvie Le Borgne

hydrodesulfurization (HDS) catalysts. It is therefore importantto remove CAR-like compounds before HDS in order to obtainhigh yields of desulfurized transportation fuels and reduce NOxemissions after combustion. No microorganisms able to selectivelyextract the nitrogen atom from CARs have been isolated till now
S
S
O
S
O O
OH
HO OS
OH
O2, NADH
NAD-, OH-
O2, 2NADH, H+
2NAD-, H2O
HSO3-
DBT
DBT sulfoxide
DBT monooxygenaseNADH:FMN oxidoreductaseNADH, FMNH2, O2
O2, NADHNAD-, OH-
DBT sulfone
DBT sulfone monooxygenaseNADH:FMN oxidoreductaseNADH, FMNH2, O2
HPB sulfinate
H2O
HSO4-
HPB sulfinatedesulfinase
Fig. 2 4S pathway for DBT desulfurization
NH
NH
NH
CAR
1-methyl-CAR 1,5-dimethyl-CAR
Fig. 3 Carbazoles
Protocols for the Isolation and Preliminary Characterization of Bacteria. . . 203

[24]. The removal of the nitrogen atom from CAR leads to thecomplete degradation of the carbon skeleton leading to the loss offuel value [25]. Some of the most studied CAR-utilizing micro-organisms are Pseudomonas [26–33], Xanthomonas, Bacillus, Ral-stonia [34], Klebsiella [35], Alteromonas, Neptunomonas,Cycloclasticus [36], Janthinobacterium [37], Acinetobacter [38],Marinobacterium, Achromobacter, Nocardioides [39], Burkholderia[40, 41], Sphingomonas [42–44], Stenotrophomonas, Gordonia[45], Enterobacter [46], and Methylobacterium [47]. The biodeg-radation of mono- and dimethyl-CAR is influenced by the positionsof the methyl substitutions [28]. Monomethyl-CARs are degradedmore easily than CAR and dimethyl-CARs (Fig. 3). Dimethyl-CARisomers with substitutions on the same benzo-nucleus are moresusceptible to degradation especially when harboring one substitu-tion in position 1. The 1-methyl CAR and the 1,5-dimethyl-CARare the most susceptible and recalcitrant isomers, respectively [28].In the case of physicochemical catalysis, it has been shown that ahigher energy is required to break C–N bonds as compared to C–Sbonds and that nitrogen removal requires the hydrogenation ofaromatic rings prior to the attack of the C–N bonds [48]. Inmicrobiological catalysis (Fig. 4), CAR is first dihydroxylated byangular dioxygenation before the C–N bond is broken and thenitrogen atom liberated after extensive degradation of the aromaticrings. In contrast, the sulfur atom in DBT has a lower electronega-tivity compared to the nitrogen atom in CAR [49] and is firstoxidized before the C–S bond is broken to liberate sulfate withoutaromatic ring degradation.
Here, the basic techniques for the isolation and characteriza-tion of microorganisms for BDS and BDN applications are pre-sented. For BDS, the isolation of microorganisms able to selectivelyextract the sulfur atom from DBT-like compounds without C–Cbond cleavage is described. The enrichment and isolation proce-dure is based on the use of DBT as unique source of sulfur, and theculture medium is supplemented with glycerol as a carbon source(seeNotes 1 and 2). For BDN, the isolation of microorganisms ableto degrade CAR-like compounds is described with CAR being usedas sole source of carbon and nitrogen for the enrichment andisolation procedure (see Note 3). The procedures used to charac-terize the metabolites produced during BDS and BDN reactionsare included, and basic protocols for the evaluation of the treatmentof diesel oil and gas oil are also presented. Diesel oil and gas oil aremiddle-distillate fractions that are well suited for microbial treat-ment since they concentrate significant amounts of organosulfurcompounds and problematic basic nitrogen compounds asmentioned above.
204 Marcia Morales and Sylvie Le Borgne

Fig. 4 Pathway for CAR degradation by Pseudomonas sp. CarA: carbazole 1,9a dioxygenase; CarB: 2’-aminophenyl-2,3-diol,1,2-dioxygenase; CarC: 2-hydroxy-6-oxo-6-(20amino.phenyl) hexa 2,4-dienoic acidhydroxylase. Taken from Morales et al. [24]

2 Biodesulfurization
2.1 Materials and
Equipment
2.1.1 Isolation and
Identification of Bacteria
1. Minimal salt medium (MSM): 4.33 g of Na2HPO4, 2.65 g ofKH2PO4, 2 g of NH4Cl, and 0.64 g of MgCl2 � 6H2O in 1 Lof ddH2O [50]. Autoclave at 121�C for 20 min. Add 200 μL ofvitamin mixture and 5 mL of metal solution per liter of MSMmedium after autoclaving [51].
2. Vitamin mixture: 400 mg of calcium pantothenate, 200 mg ofinositol, 400 mg of niacin, 400 mg of pyridoxine hydrochlo-ride, 200 mg of p-aminobenzoic acid, and 0.5 mg of cyanoco-balamin in 1 L ddH2O. Sterilize by filtration with a celluloseacetate membrane filters with a 0.45 μm pore size.
3. Metal solution: 0.5 g of ZnCl2, 0.5 g of FeCl2, 0.5 g of MnCl2� 4H2O, 0.1 g of Na2MoO4 � 2H2O, 0.05 g of CuCl2 � 2H2O, and 0.05 g of Na2WO4 � 2H2O in 1 L of 100 mMHClprepared in ddH2O. Sterilize by filtration with a cellulose ace-tate membrane filter with a 0.45 μm pore size.
4. MSM liquid medium with glycerol as carbon source(Gly-MSM): add 10 g L�1 of glycerol as an autoclaved concen-trated solution to the MSM.
5. Gly-MSM liquid medium with DBT (DBT-Gly-MSM): add1.5 mM of DBT to the Gly-MSM from a 50 mM stock solutionprepared in hexane. The hexane is then allowed to evaporate inthe laminar flow hood.
6. DBT-Gly-MSM solid medium: add 15 g L�1 of Difco Nobleagar to the MSM before autoclaving. The vitamin mixture,metal solution, and glycerol are added after autoclaving asdescribed below. The DBT is spread on the solidified mediumusing sterile glass beads (3 mm diameter) that are shaken on topof the medium to evenly spread the DBT solution on the top ofthe agar. 1 mL of DBT stock solution is used for a 90 mmdiameter petri dish. The hexane is then allowed to evaporate inthe laminar flow hood.
7. NaHCO3 1 M (pH 8.0): 84 g of NaHCO3 in 1 L ddH2O.
8. Gibbs reagent (2,6-dichloroquinone-4-chloroimide, Fluka35620): freshly prepared by dissolving 20 mg of reagent in1 mL of ethanol.
9. Materials, reagents, and thermal cycler for polymerase chainreaction (PCR) including standard Taq DNA polymerase and10� buffer containing 15 mM MgCl2, dNTPs, and the Bac8f(50-AGA GTT TGA TCC TGG CTC AG-30) and 1492r(50-GGT TAC CTT GTT ACG ACT T-30) primers specific tothe 16S rRNA genes from bacteria [52, 53].
206 Marcia Morales and Sylvie Le Borgne

10. Materials, reagents, and apparatus for ion-exchangehigh-performance liquid chromatography (HPLC) includinga 250 � 4.5 mm IonoSpher A anion-exchange column(Varian), a photodiode array detector (PDAD), a potassiumhydrogen phthalate buffer (40 mM, pH 4), and sulfate stan-dards prepared in MSM to generate a standard curve withconcentrations under 10 mM.
2.1.2 Analysis of
Organosulfur Compounds
and Metabolites
1. DBT-Gly-MSM liquid medium.
2. 50 mL Oak Ridge Teflon centrifuge tubes (Nalgene), centri-fuge, and rotor capable of spinning up to 10,000g.
3. Materials, reagents, and apparatus for gas chromatography(GC) including a GC chromatograph coupled to mass spec-trometry (MS) with a 30 m � 250 μm � 0.25 μm 5%phenylmethyl polysiloxane nonpolar capillary column(Hewlett-Packard), helium as carrier gas (see Note 4), and aflame ionization detector (FID) (see Note 5) to detecthydrocarbon-containing molecules, DBT sulfoxide, DBTsulfone, and 2-hydroxybiphenyl (2-HBP) (see Note 6) stan-dards (0.2–1.2 mg mL�1) prepared in heptane, naphthaleneas internal standard.
2.1.3 BDS of a Diesel Oil 1. DBT-Gly-MSM liquid medium.
2. NaCl 0.85% (wt/v) prepared in dd H2O and autoclaved at121�C for 20 min.
3. MSM salts: MSM without vitamin mixture and metal solution.
4. Anhydrous Na2SO4 (reagent grade).
5. Materials, reagents, and apparatus for GC including an FIDand a sulfur chemiluminescence detector (SCD) (see Note 7)and a dimethylsiloxane column (30 m � 320 μm � 0.25 μm)(Hewlett-Packard).
6. Materials, reagents, and apparatus for sulfur-in-oil analysisincluding a sulfur-in-oil analyzer and corresponding commer-cial sulfur standard (Horiba) (see Note 8), reagent grade com-mercial mineral oil, or low sulfur content isooctane.
2.2 Methods
2.2.1 Isolation and
Identification of Bacteria
1. Inoculate 100 mL of DBT-Gly-MSM with 10 g of a soil samplecollected in an area contaminated with heavy crude oil in a500 mL Erlenmeyer flask. Grow for 14 days at 30�C (seeNote 9) in an orbital shaker with an agitation of 200 rpm.
2. Use 10 mL of this culture (let the soil settle before sampling theculture) to inoculate 100 mL of the same medium in a 500 mLErlenmeyer flask. Grow for 14 days at 30�C in an orbital shakerwith an agitation of 200 rpm.
3. Repeat the same procedure twice.
Protocols for the Isolation and Preliminary Characterization of Bacteria. . . 207

4. Spread 150 μL of serial dilutions of the obtained culture onDBT-Gly-MSM plates. Grow until visible colonies areobtained.
5. At this stage, several different microorganisms can be observedbased on colony morphology.
6. Purify the obtained colonies by repeated streaking on DBT-Gly-MSM plates.
7. Inoculate individual purified colonies in 5 mL of DBT-Gly-MSM in screw-capped 25 mL culture tubes. Grow for 7 daysor until significant growth is observed at 30�C in an orbitalshaker with an agitation of 200 rpm.
8. Centrifuge 1.5 mL of the obtained cultures and save the rest ofthe culture at +4�C. Recover the supernatants, filter through0.45 μmnylon filters, transfer to new tubes, and store at�20�Cfor further analysis (see Sect. 2.2.2. Analysis of organosulfurcompounds and metabolites).
9. Transfer 1 mL of the filtered supernatant to a glass tube con-taining 200 μL of NaHCO3 (1 M) and vortex to mix. Add100 μL of the Gibbs reagent and incubate for 1 h at 30�C underagitation. The Gibbs reagent reacts with aromatic hydroxylgroups (phenolic compounds) such as 2-HBP to form a blueto purple-colored complex (see Note 10) [54]. Use 1 mL ofnon-inoculated DBT-Gly-MSM as negative control. At thisstage, cultures developing a blue to purple color are consideredpositive for further analysis.
10. Determine the release of sulfur in the form of sulfate in thepositive culture supernatants by ion-exchange HPLC using aPDAD at 308 nm and elution with potassium hydrogenphthalate buffer at 0.8 mL min�1. Inject the filtered culturesupernatant obtained in step 8 and use the DBT-Gly-MSM asnegative control. At this stage, cultures that both developed ablue color and released sulfate in the culture medium areconsidered positive for further analyses.
11. Identify the isolates by sequencing the 16S rRNA gene usingthe Bac8f and Univ1492r bacterial primers (seeNote 11) understandard reaction conditions with the following amplificationconditions: one cycle of 2 min at 95�C; 35 cycles of 45 s at94�C, 30 s at 56�C, and 1 min at 72�C; and one cycle of finalextension at 72�C for 5 min.
12. Store the cultures at +4�C in DBT-Gly-MSM agar slants or at�80�C in the presence of 25% (v/v) of sterile glycerol.
2.2.2 Analysis of
Organosulfur Compounds
and Metabolites
1. Inoculate 25 mL of DBT-Gly-MSM with 2.5 mL of a previouspositive culture and grow for 7 days at 30�C in an orbital shakerwith an agitation of 200 rpm.
208 Marcia Morales and Sylvie Le Borgne

2. Acidify the cultures to pH 2 with concentrated HCl.
3. Extract three times with an equal volume of toluene, discardthe aqueous phase, and filter the extracts through a 0.45 μmnylon membrane. Dry by passing the obtained solutionthrough a column of anhydrous Na2SO4 and concentrate byevaporation with a rotavapor.
4. Analyze the sulfur compounds (DBT) and the produced meta-bolites (DBT sulfoxide and DBT sulfone) by GC–MS. Programthe injector temperature at 250�C and the FID at 250�C. ForDBT and its metabolites, program the oven temperature at100�C (initial temperature) for 2 min, then increase the tem-perature from 100 to 200�C at a rate of 10�Cmin�1, and finallyhold for 2 min at 200�C. For quantification of DBT, alkylatedDBTs, and their metabolites, prepare 0.2–1.2 mg mL�1 stan-dard curves and use naphthalene as internal standard. Deter-mine the molecular structure of the metabolites produced fromDBT alkylated derivatives by MS by comparing the obtainedspectrographs with mass spectrograph libraries data preparedfrom known standard compounds.
2.2.3 BDS of a Diesel Oil 1. Culture the microorganisms as described above in DBT-Gly-MSM liquid medium, harvest the cells in mid-exponentialphase of growth, wash twice with NaCl 0.85%, and suspendthe cells in MSM salts.
2. Prepare 100 mL of Gly-MSM in a 500 mL Erlenmeyer flaskand add 10% (v/v) of diesel oil. Inoculate with the suspendedbiomass in order to achieve a wet biomass concentration of5 g L�1. Incubate for 7 days at 30�C in an orbital shaker withan agitation of 200 rpm. Prepare control diesel oil withoutbiomass and incubate under the same conditions.
3. Separate the oil by centrifugation at 10,000g for 10 min anddry over anhydrous Na2SO4 to eliminate all the residual water.
4. Analyze the quantity and distribution of total hydrocarbonsand organosulfur compounds in treated and non-treated dieseloil by GC coupled to an FID and an SCD. Set the injector anddetector temperatures to 280 and 300�C, respectively. Figure 5shows an example of the distribution of hydrocarbons in dieseloil submitted to BDS [9].
5. Analyze the total sulfur content of the treated and non-treatedoil with a sulfur-in-oil analyzer. If required, the samples can bediluted with commercial mineral oil or isooctane with lowsulfur content. The sulfur content of the diluent must also beanalyzed.
Protocols for the Isolation and Preliminary Characterization of Bacteria. . . 209

3 Biodenitrogenation
3.1 Materials and
Equipment
3.1.1 Isolation and
Identification of Bacteria
1. Minimal medium (MM) (see Note 12): 2.2 g of Na2HPO4
� 12H2O, 0.8 g of KH2PO4, 0.015 g of FeSO4 � 7H2O,0.015 g of CaCl2 � 2H2O, 0.015 g of MgSO4 � 7H2O, and0.025 g of yeast extract [26] in 1 L of ddH2O.
2. MM liquid medium with CAR as carbon source (CAR-MM):add 0.1% of CAR (wt/v) to the MM after autoclaving from a10 mg mL�1 stock solution prepared in dimethyl sulfoxide andsterilized by filtration with a 0.2 μm pore-size PTFEmembranefilter.
3. CAR-MM solid medium: add 15 g L�1 of Difco Noble agar tothe MM before autoclaving. After autoclaving, cool themedium to about 60�C before adding the CAR at a finalconcentration of 0.1% (wt/v) and pour into 90 mm diameterpetri dishes.
4. Materials and reagents for polymerase chain reaction (PCR) asdescribed above (Sect. 2.1.1).
5. Materials, reagents, and apparatus for HPLC including a C-18column (4.6 � 150 mm, Hewlett-Packard) and a photodiodearray detector (PDAD), a mobile phase of (86:14) (v/v)methanol–water mixture, and CAR standards prepared in ace-tonitrile (ACN) with CAR concentrations under 2 mM.
Fig. 5 GC-SCD chromatographs of diesel oil (a) before and (b) after BDS treatment with strainRhodococcus sp. IMP-S02. The DBT and 4,6-DMDBT peaks are indicated by arrows. Taken from Castorenaet al. [9]. Reproduced with the permission of the publisher, “John Wiley and Sons”
210 Marcia Morales and Sylvie Le Borgne
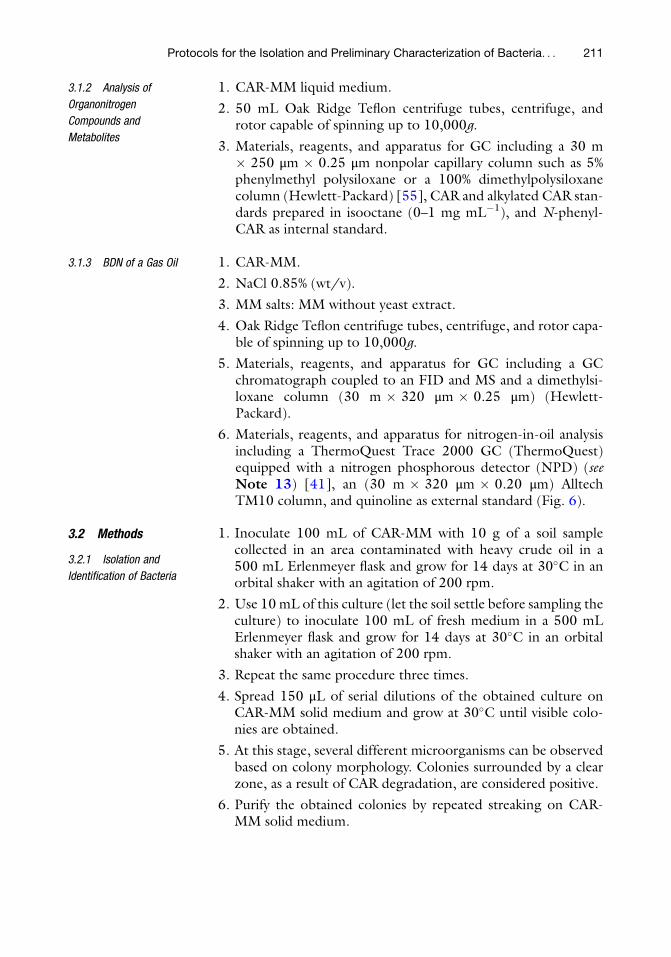
3.1.2 Analysis of
Organonitrogen
Compounds and
Metabolites
1. CAR-MM liquid medium.
2. 50 mL Oak Ridge Teflon centrifuge tubes, centrifuge, androtor capable of spinning up to 10,000g.
3. Materials, reagents, and apparatus for GC including a 30 m� 250 μm � 0.25 μm nonpolar capillary column such as 5%phenylmethyl polysiloxane or a 100% dimethylpolysiloxanecolumn (Hewlett-Packard) [55], CAR and alkylated CAR stan-dards prepared in isooctane (0–1 mg mL�1), and N-phenyl-CAR as internal standard.
3.1.3 BDN of a Gas Oil 1. CAR-MM.
2. NaCl 0.85% (wt/v).
3. MM salts: MM without yeast extract.
4. Oak Ridge Teflon centrifuge tubes, centrifuge, and rotor capa-ble of spinning up to 10,000g.
5. Materials, reagents, and apparatus for GC including a GCchromatograph coupled to an FID and MS and a dimethylsi-loxane column (30 m � 320 μm � 0.25 μm) (Hewlett-Packard).
6. Materials, reagents, and apparatus for nitrogen-in-oil analysisincluding a ThermoQuest Trace 2000 GC (ThermoQuest)equipped with a nitrogen phosphorous detector (NPD) (seeNote 13) [41], an (30 m � 320 μm � 0.20 μm) AlltechTM10 column, and quinoline as external standard (Fig. 6).
3.2 Methods
3.2.1 Isolation and
Identification of Bacteria
1. Inoculate 100 mL of CAR-MM with 10 g of a soil samplecollected in an area contaminated with heavy crude oil in a500 mL Erlenmeyer flask and grow for 14 days at 30�C in anorbital shaker with an agitation of 200 rpm.
2. Use 10 mL of this culture (let the soil settle before sampling theculture) to inoculate 100 mL of fresh medium in a 500 mLErlenmeyer flask and grow for 14 days at 30�C in an orbitalshaker with an agitation of 200 rpm.
3. Repeat the same procedure three times.
4. Spread 150 μL of serial dilutions of the obtained culture onCAR-MM solid medium and grow at 30�C until visible colo-nies are obtained.
5. At this stage, several different microorganisms can be observedbased on colony morphology. Colonies surrounded by a clearzone, as a result of CAR degradation, are considered positive.
6. Purify the obtained colonies by repeated streaking on CAR-MM solid medium.
Protocols for the Isolation and Preliminary Characterization of Bacteria. . . 211

7. Inoculate individual purified colonies in 5 mL of CAR-MM inscrew-capped 25 mL culture tubes and grow for 7 days or untilsignificant growth is observed at 30�C in an orbital shaker withan agitation of 200 rpm.
Fig. 6 GC-NPD chromatograms of gas oil: light cycle oil (85:15) during BDNtreatment. The first chromatogram corresponds to the sample before treatment,while the other chromatograms correspond to samples treated with aPseudomonas sp. The CAR peak is marked in dashed line (unpublished data)
212 Marcia Morales and Sylvie Le Borgne

8. Re-inoculate the 5 mL in 50 mL of the same medium in a250 mL Erlenmeyer flask. Grow for 7 days at 30�C in an orbitalshaker with an agitation of 200 rpm.
9. Acidify the cultures to pH 2 with 4 N H2SO4 [56].
10. Extract 25 mL of the culture with an equal volume of ACN andsave the rest of the culture at +4�C. Filter the extract through a0.2 μm PTFE filter.
11. Analyze the degradation of CAR by reverse phase HPLC usinga PDAD at 230 nm and an elution flow rate of 0.5 mL min�1.Inject the filtered culture supernatant obtained in step 10 anduse an extract of CAR-MM as negative control.
12. At this stage, cultures that both show the halo zone in solidmedium and present a decrease of the CAR peak in HPLC areconsidered positive for further analysis.
13. Identify the isolates by sequencing the 16S rRNA gene asdescribed below (Sect. 2.2.1).
14. Store the cultures at +4�C in CAR-MM agar slants or at�80�Cin the presence of 25% (v/v) of glycerol.
3.2.2 Analysis of
Organonitrogen
Compounds and
Metabolites
1. Inoculate 25 mL of CAR-MM with 2.5 mL of a previouspositive culture and grow for 7 days at 30�C in an orbital shakerwith an agitation of 200 rpm.
2. Extract the culture three times with an equal volume of ethylacetate, discard the aqueous phase, and filter the extractsthrough a 0.2 μm PTFE membrane. Dry over anhydrousNa2SO4 and concentrate by evaporation.
3. Analyze the nitrogen compounds and the produced metabolitesby GC–MS. Program the column temperature from 50 (held3 min) to 220�C with an increasing rate of 10�C min�1. Set theinjector, detector, and oven temperatures at 200, 220, and100�C, respectively. CAR metabolites include 1-hydro-1,9a-dihydroxycarbazole, 2-hydroxy-6-oxo-(2aminobiphenyl)-hexa-2,4 dienoic acid, anthranilic acid, 2-hydroxypenta-2,4 dienoicacid, and catechol (Fig. 4) [24]. For quantification of CAR andalkylated CARs, prepare 0–1 mg mL�1 standard curves and useN-phenylCAR as internal standard. The molecular structure ofthe metabolites produced from CAR alkylated derivatives can bedetermined by MS by comparing the obtained spectrographswithmass spectrograph libraries data prepared from known stan-dard compounds.
Protocols for the Isolation and Preliminary Characterization of Bacteria. . . 213

3.2.3 BDN of a Gas Oil 1. Culture the microorganisms as described above in CAR-MMliquid medium, harvest the cells in mid-exponential phase ofgrowth, wash twice with NaCl (0.85%), and suspend the cells inMM salts.
2. Prepare 100 mL of MM in a 500 mL Erlenmeyer flask and addan equal volume of gas oil. Inoculate with the suspendedbiomass in order to achieve a concentration of 2 g L�1 ofbiomass and incubate for 7 days at 30�C in an orbital shakerwith an agitation of 200 rpm. Prepare control gas oil withoutbiomass and incubate under the same conditions.
3. Separate the oil by centrifugation at 10,000g for 10 min anddry over anhydrous Na2SO4 to eliminate all the residual water.
4. Analyze the quantity and distribution of total hydrocarbons intreated and non-treated gas oil by GC coupled to FID. Set theinjector and detector temperatures to 280 and 300�C.
5. Analyze the quantity and distribution of organonitrogen com-pounds in treated and non-treated gas oil using a Thermo-Quest Trace 2000 GC equipped with an NPD (see Note 13)[41]. Set the injector temperature at 250�C and the detectortemperature at 275�C. Keep the oven temperature at 100�C for1 min, increase the temperature up to 156�C at a rate of4�C min�1, increase the temperature up to 198�C at a rate of2�Cmin�1, and finally increase the temperature up to 250�C ata rate of 4�C min�1. Set the airflow at 50 mL min�1, the H2
flow at 2 mL min�1, and the makeup flow (N2) at10 mL min�1.
6. Analyze the total nitrogen content of the treated and non-treated gas oil using the ASTM D4649 method (see Note 14)[23].1
4 Notes
1. Alkylated derivatives of DBT may also be used and are in factrecommended if heavier fractions are to be treated; these com-pounds will be more abundant in fractions derived fromheavy oils.
2. The isolation of microorganisms able to selectively cleave C–Sbonds within alkyl chains and release sulfate by using the syn-thetic compound bis-(3-pentafluorophenylpropyl)-sulfide assole source of sulfur has been reported [57].
1ASTM D4629-08 Standard test method for trace nitrogen in liquid petroleum hydrocarbons by syringe/inletoxidative combustion and chemiluminescence detection
214 Marcia Morales and Sylvie Le Borgne

3. Alkylated derivatives of CAR may also be used and are in factrecommended if heavier fractions are to be treated; these com-pounds will be more abundant in fractions derived from heavyoils.
4. HPLC can be used when DBT is the substrate. In this case, thecultures are extracted with an equal volume of acetonitrile(ACN), filtered and injected onto a C18 reverse phase column.Elution is performed at 1 mLmin�1 with a 80/20 (v/v) ACN/water mobile phase, and detection is realized with an UVdetector at 225 nm. DBT and 2-HBP standards are preparedin ACN to generate a standard curve for concentrationsbetween 0.02 and 0.10 mg mL�1
5. FIDs are used to detect total hydrocarbons (not only sulfur-containing hydrocarbons). So both the organosulfur com-pounds and their desulfurized metabolites will be detected.
6. Different temperature conditions must be used for the analysisof alkylated DBT derivatives and their metabolites.
7. The SCD is a sulfur-specific detector in which the sulfur-containing compounds are burned at a very high temperature(>1,800�C) to form sulfur monoxide (SO). A photomultipliertube detects the light produced by the chemiluminescent reac-tion of SO with ozone.
8. For low sulfur levels (5–20 ppm), the detection is performed byX-ray fluorescence. For ultralow sulfur levels (30 ppb), thedetection can be performed through combustion ultravioletfluorescence.
9. If thermophilic desulfurizing microorganisms are targeted, ahigher temperature should be used.
10. DBT alkylated derivatives may produce a purple rather thanblue color.
11. If thermophilic microorganisms were targeted, the archaealprimers PRA46f and PREA1100r may be used as describedby [58].
12. Other similar or more concentrated mineral medium composi-tions have been used [27, 40].
13. The NPD (also called thermionic detector) is a very sensitivedetector that responds almost exclusively to nitrogen and phos-phorus compounds. Nitrogen- or phosphorus-containingmolecules exiting the column collide with a hot rubidium orcesium silicate glass bead located near the FID and undergo acatalytic surface chemistry reaction. The resulting ions areattracted to a collector electrode and amplified.
14. Briefly, fuel samples are injected into a high-temperature com-bustion tube where the fuel is vaporized and organically bound
Protocols for the Isolation and Preliminary Characterization of Bacteria. . . 215

nitrogen is converted to nitric oxide (NO) in an oxygen-richatmosphere. The water produced during the sample combus-tion is removed, and the sample combustion gases are thenexposed to ultraviolet (UV) light. The NO contacts ozoneand is converted to excited nitrogen oxide (NO2). The lightis emitted as the excited NO2 decays and a photomultipliertube detects it and the resulting signal is a measure of thenitrogen contained in the sample. CAR or pyridine can beused as standard.
References
1. Morales M, Ayala M, Vazquez-Duhalt R, LeBorgne S (2010) Application of microorgan-isms to the processing and upgrading of crudeoil and fractions. In: Timmis KN, McGenityTJ, Meer JR, de Lorenzo V (eds) Conse-quences of microbial interactions with hydro-carbons, oils and lipids, vol 4, Handbook ofhydrocarbon and lipid microbiology. Springer,Berlin, pp 2768–2785
2. Mohebali G, Ball AS (2008) Biocatalytic desul-furization (BDS) of petrodiesel fuels. Microbi-ology 154:2169–2183
3. Kabe T, Akamatsu K, Ishihara A, Otsuki S,Godo M, Zhang Q, Qian W (1997) Deephydrodesulfurization of light gas oil. 1. Kinet-ics and mechanisms of dibenzothiophenehydrodesulfurization. Ind Eng Chem Res36:5146–5152
4. Monticello DJ, Finnerty WR (1985) Microbialdesulfurization of fossil fuels. Annu RevMicro-biol 39:371–389
5. Le Borgne S, Ayala M (2010) Microorganismsutilizing sulfur-containing hydrocarbons. In:Timmis KN, McGenity TJ, Meer JR, de Lor-enzo V (eds) Microbes and communities utiliz-ing hydrocarbons, oils and lipids, vol 3,Handbook of hydrocarbon and lipid microbi-ology. Springer, Berlin, pp 2130–2141
6. Kilbane JJ (1992)Mutant microorganisms use-ful for cleavage of organic C-S bonds. US Pat-ent No. 5,104,801
7. Denis-Larose C, Labbe D, Bergeron H, JonesAM, Creer CW, Al-Hawari J, Grossman MJ,Sankey BM, Lau PCK (1997) Conservation ofplasmid-encoded dibenzothiophene desulfuri-zation genes in several Rhodococci. Appl Envi-ron Microbiol 63:2915–2919
8. Izumi Y, Ohshiro T, Ogino H, Hine Y, ShimaoM (1994) Selective desulphurization of diben-zothiophene by Rhodococcus erythropolis D-1.Appl Environ Microbiol 60:223–226
9. Castorena G, Suarez C, Valdez I, Amador G,Fernandez L, Le Borgne S (2002) Sulfur-
selective desulfurization of dibenzothiopheneand diesel oil by newly isolated Rhodococcussp. strains. FEMSMicrobiol Lett 215:157–161
10. Rhee SK, Chang JH, Chang YK, Chang HN(1998) Desulfurization of dibenzothiopheneand diesel oils by a newly isolated Gordoniastrain, CYKS1. Appl Environ Microbiol64:2327–2331
11. Chang JH, Rhee SK, Chang YK, Chang HN(1998) Desulfurization of diesel oils by a newlyisolated dibenzothiophene-degrading Nocar-dia sp. strain CYKS2. Biotechnol Prog14:851–855
12. Darzins A, Mrachko GT (2000) Sphingomonasbiodesulfurization catalyst. US Patent No.6,133,016
13. Bhatia S, Sharma DK (2010) Biodesulfuriza-tion of dibenzothiophene, its alkylated deriva-tives and crude oil by a newly isolated strainPantoea agglomerans D23W3. Biochem Eng J50:104–109
14. Papizadeh M, Ardakani MR, Motamedi H,Rasouli I, Zarei M (2011) C-S targeted bio-degradation of dibenzothiophene by Stenotro-phomonas sp. NISOC-04. Appl BiochemBiotechnol 165:938–948
15. Gunam IB, Yamamura K, Sujaya IN, AntaraNS, Aryanta WR, Tanaka M, Tomita F, SoneT, Asano K (2013) Biodesulfurization ofdibenzothiophene and its derivatives usingresting and immobilized cells of Sphingomonassubarctica T7b. J Microbiol Biotechnol23:473–482
16. Nassar HN, El-Gendy NS, Abo-State MA,Mostafa YM, Mahdy HM, El- Temtamy SA(2013) Desulfurization of dibenzothiopheneby a novel strain Brevibacillus invocatus C19isolated from Egyptian coke. Biosci BiotechnolRes Asia 10:29–46
17. Konishi J, Ishii Y, Onaka T, Okumura K,Suzuki M (1997) Thermophilic carbon-sul-fur-bond-targeted biodesulfurization. ApplEnviron Microbiol 63:3164–3169
216 Marcia Morales and Sylvie Le Borgne

18. Kirimura K, Furuya T, Nishii Y, Ishii Y, Kino K,Usami S (2001) Biodesulfurization of diben-zothiophene and its derivatives through theselective cleavage of carbon-sulfur bonds by amoderately thermophilic bacterium Bacillussubtilis WU-S2B. J Biosci Bioeng 91:262–266
19. Furuya T, Kirimura K, Kino K, Usami S (2001)Thermophilic biodesulfurization of diben-zothiophene and its derivatives by Mycobacte-rium phlei WU-F1. FEMS Microbiol Lett204:129–133
20. Bhatia S, Sharma DK (2012) Thermophilicdesulfurization of dibenzothiophene and dif-ferent petroleum oils by Klebsiella sp. 13T.Environ Sci Pollut Res Int 19:3491–3497
21. Bhatia S, Sharma DK (2010) Mining of geno-mic databases to identify novel biodesulfuriz-ing microorganisms. J Ind MicrobiolBiotechnol 37:425–429
22. Eigenson AS, Ivchenko EG (1977) Distribu-tion of sulfur and nitrogen in fractions fromcrude oil and residues. Chem Technol FuelsOils 13:542–544
23. Laredo GC, Leyva S, Alvarez R, Mares MT,Castillo JJ, Cano JL (2002) Nitrogen com-pounds characterization in atmospheric gas oiland light cycle oil from a blend of Mexicancrudes. Fuel 81:1341–1350
24. Morales M, Le Borgne S (2010) Microorgan-isms utilizing nitrogen-containing hydrocar-bons. In: Timmis KN, McGenity TJ, Meer JR,de Lorenzo V (eds) Microbes and communitiesutilizing hydrocarbons, oils and lipids, vol 3,Handbook of hydrocarbon and lipid microbi-ology. Springer, Berlin, pp 4554–4562
25. Yu B, Xu P, Zhu S, Cai X, Wang Y, Li L, Li F,Liu X, Ma C (2006) Selective biodegradationof S and N heterocycles by a recombinant Rho-dococcus erythropolis strain containing carbazoledioxygenase. Appl Environ Microbiol72:2235–2238
26. Ouchiyama N, Zhang Y, Omori T, Kodama T(1993) Biodegradation of carbazole by Pseudo-monas spp. CA06 and CA10. Biosci BiotechnolBiochem 57:455–460
27. Hisatsuka K, Sato M (1994) Microbial trans-formation of carbazole to anthranilic acid byPseudomonas stutzeri. Biosci Biotechnol Bio-chem 58:213–214
28. Li L, Li Q, Li F, Shi Q, Yu B, Liu F, Xu P(2006) Degradation of carbazole and its deri-vatives by a Pseudomonas sp. Appl MicrobiolBiotechnol 73:941–948
29. Larentis AL, Sampaio HCC, Carneiro CC,Martins OB, Alves TLM (2011) Evaluation ofgrowth, carbazole biodegradation and
anthranilic acid production by Pseudomonasstutzeri. Braz J Chem Eng 28(01):37–44
30. Singh GB, Srivastava A, Saigal A, Aggarwal S,Bisht S, Gupta S, Srivastava S, Gupta N (2011)Biodegradation of carbazole and dibenzothio-phene by bacteria isolated from petroleum-contaminated sites. Biorem J 15(4):189–195
31. Zhao C, Zhang Y, Li X, Wen D, Tang X (2011)Biodegradation of carbazole by the seven Pseu-domonas sp. strains and their denitrificationpotential. J Haz Mat 190:253–259
32. Nojiri H (2012) Structural and moleculargenetic analyses of bacterial carbazole degrada-tion system. Biosci Biotechnol Bochem76:1–18
33. Singh GB, Gupta S, Gupta N (2013) Carba-zole degradation and biosurfactant productionby newly isolated Pseudomonas sp. strainGBS.5. Int Biodeterior Biodegradation84:35–43
34. Schneider J, Grosser RJ, Jayasimhulu K, XueW, Kinkle B, Warshawsky D (2000) Biodegra-dation of carbazole byRalstonia sp. RJGII.123isolated from hydrocarbon contaminated soil.Can J Microbiol 46:269–277
35. Li YW, Li WL, Huang JX, Xiong XCH, GaoHSH, Xing JM, Liu HZ (2008) Biodegrada-tion of carbazole in oil/water biphasic systemby a newly isolated bacterium Klebsiella sp.LSSE-H2. Biochem Eng J 41:166–170
36. Fuse H, Takimura O, Murakami K, Inoue H,Yamaoka Y (2003) Degradation of chlorinatedbiphenyl, dibenzofuran, and dibenzo-p-dioxinby marine bacteria that degrade biphenyl, car-bazole, or dibenzofuran. Biosci BiotechnolBiochem 67:1121–1125
37. Yamazoe A, Yagi O, Oyaizu H (2004) Bio-transformation of fluorene, diphenyl ether,dibenzo-p-dioxin and carbazole by Janibactersp. Biotechnol Lett 26:479–486
38. Singh GB, Gupta S, Srivastava S, Gupta N(2011) Biodegradation of carbazole by newlyisolated Acinetobacter spp. Bull Environ Con-tam Toxicol 87:522–526
39. Inoue K, Habe H, Yamane H, Omori T, NojiriH (2005) Diversity of carbazole-degradingbacteria having the car gene cluster: isolationof a novel gram-positive carbazole-degradingbacterium. FEMS Microbiol Lett245:145–153
40. Castorena G, Mugica V, Le Borgne S, AcunaME, Bustos- Jaimes I, Aburto J (2006) Carba-zole biodegradation in gas oil/water biphasicmedia by a new isolated bacterium Burkhol-deria sp. strain IMP5GC. J Appl Microbiol100:739–745
Protocols for the Isolation and Preliminary Characterization of Bacteria. . . 217

41. Castorena G, Acuna MA, Aburto J,Bustos-Jaimes I (2008) Semi-continuousbiodegradation of carbazole in fuels bybiofilm-immobilised cells of Burkholderia sp.strain IMP5GC. Process Biochem43:1318–1321
42. Habe H, Ashikawa Y, Saiki Y, Yoshida T, NojiriH, Omori T (2002) Sphingomonas sp. strainKA1, carrying a carbazole dioxygenase genehomologue, degrades chlorinated dibenzo-p-dioxins in soil. FEMS Microbiol Lett211:43–49
43. Kilbane JJ II, Daram A, Abbasian J, Kayser KJ(2002) Isolation and characterization of Sphin-gomonas sp. GTIN11 capable of carbazolemetabolism in petroleum. Biochem BiophysRes Commun 297:242–248
44. Shepherd JM, Lloyd-Jones G (1998) Novelcarbazole degradation genes of SphingomonasCB3: sequence analysis, transcription, andmolecular ecology. Biochem Biophys ResCommun 247:129–135
45. Santos SC, Alviano DS, Alviano CS, Padula M,Leitao AC, Martins OB, Ribeiro CM, SassakiMY, Matta CP, Bevilaqua J, Sebastian GV, Sel-din L (2006) Characterization of Gordonia sp.strain F.5.25.8 capable of dibenzothiophenedesulfurization and carbazole utilization. ApplMicrobiol Biotechnol 71:355–362
46. Singh GB, Srivastava S, Gupta S, Gupta N(2011) Evaluation of carbazole degradationby Enterobacter sp. isolated from hydrocarboncontaminated soil. Recent Res Sci Technol3:44–48
47. Pasternak G, Kolwzan B (2013) Surface ten-sion and toxicity changes during biodegrada-tion of carbazole by newly isolatedmethylotrophic strain Methylobacterium sp.GPE1. Int Biodeterior Biodegradation84:143–149
48. Szymanska A, Lewandowski M, Sayag C,Djega- Mariadassou G (2003) Kinetic studyof the hydrodenitrogenation of carbazole overbulk molybdenum carbide. J Catal 218:24–31
49. Bressler DC, Fedorak PM (2000) Bacterialmetabolism of fluorene, dibenzofuran,
dibenzothiophene, and carbazole. Can JMicrobiol 46:397–409
50. Oldfield C (1998) Microorganisms which candesulphurise benzothiophenes. Patent WO/1998/004678
51. Li FL, Xu P, Ma CQ, Luo LL, Wang XS (2003)Deep desulfurization of hydrodesulfurizationtreated diesel oil by a facultative Thermophilicbacterium Mycobacterium sp. X7B. FEMSMicrobiol Lett 223:301–307
52. Johnson JL (1994) Similarity analysis ofrRNAs. In: Gerhardt P, Murray RGE, WoodWA, Krieg NR (eds) Methods for general andmolecular microbiology. ASM Press, Washing-ton, pp 683–700
53. Baker GC, Smith JJ, Cowan DA (2003) Reviewand re-analysis of domain-specific 16S primers.J Microbiol Methods 55:541–555
54. Kayser KJ, Bielaga-Jones BA, Jackowski K,Odusan O, Kilbane JJ (1993) Utilization oforganosulfur compounds by axenic and mixedcultures of Rhodococcus rhodochrous IGTS8. JGen Microbiol 139:3123–3129
55. Kirimura K, Nakagawa H, Tsuji K, Matsuda K,Kurane R, Usami S (1999) Selective and con-tinuous degradation of carbazole contained inpetroleum oil by resting cells of Sphingomonassp. CDH-7. Biosci Biotechnol Biochem63:1563–1568
56. Gieg L, Otter A, Fedorak P (1996) Carbazoledegradation by Pseudomonas sp. LD2: meta-bolic characteristics and the identification ofsome metabolites. Environ Sci Technol30:575–585
57. Van Hamme JD, Fedorak PM, Foght JM, GrayMR, Dettman HD (2004) Use of a novelfluorinated organosulfur compound to isolatebacteria capable of carbon-sulfur bond cleav-age. Appl Environ Microbiol 70:1487–1493
58. Ovreas SL, Forney L, Daae FL, Torsvik V(1997) Distribution of bacterioplankton inmeromictic Lake Saelenvannet, as determinedby denaturing gradient gel electrophoresis ofPCR-amplified gene fragments coding for 16SrRNA. Appl Environ Microbiol63:3367–3373
218 Marcia Morales and Sylvie Le Borgne

Protocol for the Application of Bioluminescence Full-CellBioreporters for Monitoring of Terrestrial Bioremediation
Sarah B. Sinebe, Ogonnaya I. Iroakasi, and Graeme I. Paton
Abstract
Microbial full-scale bioreporters are associated with a variety of names that include biosensors, bio-indicators and bio-reactive agents. The role of such microbial agents is to respond to the bioavailablefraction of a given analyte under “near environmental conditions”. Making use of appropriate assays withrelevant and biologically compatible extraction procedures means that such techniques can be applied todevelop site specific risk and hazard assessments, an appraisal of constraints inhibiting biodegradation and aprediction of potential for biodegradation. The effectiveness of an assay requires: (1) the comprehensivecharacterisation of the marker gene (the reporter gene) and the isolate, (2) the collection of an environ-mentally relevant sample in a suitable matrix and (3) a technique to integrate the bioreporters with thesample to generate focussed and relevant data. This technology is ideally placed for high throughput, rapidscreening of samples from a range of environmental matrices.
Keywords: Bioassay, Bioavailability, Biodegradability, Bioreporters, Degradation, Fingerprint,Hydrocarbon, Non-exhaustive extraction techniques (NEETs)
1 Introduction
When exhaustive extraction techniques are applied to hydrocarboncontaminated matrices, the measured value reflects what is oftenreferred to as the “total concentration”. This can be fractionated tomore fairly represent the component parts present in the matrix.Although risk assessment models can be used to relate this “totalvalue” to relevant ecological and human exposure values, it is not adirect measure of “bioavailability”. The development of “non-exhaustive extraction techniques” (NEETs) enables the user todetermine the portion of hydrocarbons that could be termed “bio-available”. A confusing point is that “bioavailable” has been usedboth to define toxicity and biodegradation. Regardless of this,microbial bioreporters enable a quantitative assessment of the bio-available fraction if appropriate extractions are conducted and themicrobial/environmental interface is appropriate [1]. In this
T.J. McGenity et al. (eds.), Hydrocarbon and Lipid Microbiology Protocols, Springer Protocols Handbooks, (2017) 219–231,DOI 10.1007/8623_2016_226, © Springer-Verlag Berlin Heidelberg 2016, Published online: 19 October 2016
219

chapter, the term bioavailability represents the fraction of thechemical that is toxic to the bioreporter and/or the fraction thatis degradable.
Many of the earliest manuscripts that championed the use ofbioreporters acknowledged both the speed of application and theirrelatively low cost of deployment [1]. Yet as chromatographictechniques have evolved to offer more automated and low costanalysis, this point is less relevant, and the true value of the bior-eporter is based on its status as a biological agent. Examples of theirsuccessful use include monitoring bioremediation of hydrocarbon[2, 3], toxicity measurement of chlorophenols in soil water extract[4], bioavailability assessments of chlorinated solvents [5], mea-surement of toxicity of TPH during bioremediation [6] and mea-surement of the extractable fraction of naphthalene [7]. There are,however, few examples of researchers having made use of more thana single bioreporter when interrogating an environmental matrix.
The extraction of the bioavailable fraction of hydrocarbonsthrough the use of NEETs has made use of reagents such asTenax, hydroxypropyl-β-cyclodextrin (HPCD), ethanol, methanoland butanol. The fractions extracted by HPCD [8–10], ethanol[11], methanol [9, 12] and Tenax [13] have been correlated withthe bioavailable or biodegradable fraction in a broad range of soils.NEETs have also been used to derive an estimation of bioaccessi-bility [14]. Recently, to complement the array of synthetic extrac-tion solvents deployed, the use of biosurfactants has been proposedbecause of their ease of application, low toxicity and ability to workwithin biological systems [15].
It is pertinent to consider the integration of bioreporters andNEETs. In an early study of such an approach, five soils wereamended with naphthalene and incubated for 2 days. The soil wasextracted with Amberlite XAD-4 and HPCD. The response of thebiosensor Pseudomonas fluorescens HK44 (pUTK21) to the naph-thalene in the soil solution was linear [7] enabling an estimation ofthe concentration of the bioavailable fraction to be made. Laterwork confirmed that if optimal bioremediation techniques weredeployed, this integrated approach could diagnose a remediationend-point [9]. In practice, remedial constraints imposed by thephysiochemical environment can be overcome through the use ofappropriate irrigation regimes and some osmotic buffering. Theaddition of nutrients and the augmentation of samples with acharacterised degrader inoculum also serve to remove biologicaland physiological constraints. This leaves the variable of bioavail-ability to be considered. It has been proposed that microbial bior-eporters can underpin our understanding of bioavailability and theenvironmental parameters that regulates this [16, 17].
Bioavailability studies have confirmed that hydrocarbon degra-dation is rarely enhanced by microbial inoculation intimating thatthe indigenous population is often composed of active degraders
220 Sarah B. Sinebe et al.

[3, 6, 18]. Such studies can be routinely monitored through themeasurement of the response of a combination of constitutive andhydrocarbon induced sensors using appropriate NEETs [3, 6, 18].Such analysis has been performed across laboratory amended andfield collected samples from a wide variety of international sourceswith matrices impacted by a broad suite of hydrocarbons [6]. If thetechnology is to be successful, then the response must aid in fulfill-ing the successful management of a bioremediation programmemainly:
1. Monitor the microbial performance of the indigenous or aug-mented population
2. Assess the physiochemical environment
3. Determine pollutant/hydrocarbon bioavailability
In this case study, the constitutively marked bioreportersEscherichia coli HB101 (pUCD607) and Pseudomonas putidaF1Tn5 which are “lights off” system [19] and four hydrocarboninduced marked bioreporters that are “lights on” system [19] P.fluorescens OS8(pDNdmpRlux), P. putida TVA8, P. fluorescensHK44 (pUTK21) and E. coli HMS174 (pOS25) were used tomonitor changes in the bioavailable fraction of a Libyan crude oil(and inferred toxicity) to samples undergoing control and nutrientamended treatments during a biodegradation period of 42 days.
2 Materials
2.1 Antibiotics 1. Tetracycline hydrochloride (Sigma: http://www.sigmaaldrich.com): prepare in 100% ethanol. Light sensitive. Store below0�C. Stock concentration of 50 mg l�1.
2. Kanamycin sulphate (Sigma: http://www.sigmaaldrich.com):prepare in water. Store between 2 and 8�C. Stock concentra-tion of 50 mg l�1.
3. Ampicillin sodium salt (Sigma: http://www.sigmaaldrich.com): prepare in water. Store between 2 and 8�C. Stock con-centration of 30 and 14 mg l�1.
2.2 Bacteria Strain:
Biosensor
2.3 Equipment 1. Spectrophotometer – Camspec M107
2. Shaking incubator – Gallenkamp
3. Jouan MR1822 centrifuge
4. Jade luminometer (Labtech International, Uckfield)
5. LB 962 CentroLIApc (Berhold Technologies) microtitre plateluminometer
Protocol for the Application of Bioluminescence Full-Cell Bioreporters. . . 221

2.4 Media A great deal of the optimisation work in managing the bioreportersis to refine and optimise both the growth characteristics and media.Being able to grow a range of bioreporters on the same mediummakes procedures simpler and easier to execute but this could be atthe expense of sensitivity and responsiveness to target analytes. Thishas been the focus of two decades of work in Aberdeen and it isacknowledged that the adopted methods are often different tothose in published manuscripts detailing construction.
2.4.1 Luria-Bertani
(Lennox) Growth Media
These may be purchased from any supplier of common bacterialgrowth medium components or pre-prepared media. In our lab, weuse products of Sigma: (http://www.sigmaaldrich.com) 10 g/ltryptone, 5 g/l yeast extract and 5 g/l NaCl prepared in water.
2.4.2 Nutrient Broth
Growth Media
These may be purchased from any supplier of common bacterialgrowth medium components or pre-prepared media. In our lab, weuse products of Sigma: (http://www.sigmaaldrich.com) 1 g/l D(+)-glucose, 15 g/l peptone, 6 g/l NaCl and 3 g/l yeast extractprepared in water.
To prepare solid media, Bacteriological Agar No. 1 (Oxoid) atthe final concentration of 15 g/l was added to the solutions.Following the autoclaving, the media were supplemented withantibiotics (see Table 1).
2.5 Non-Exhaustive
Extraction Techniques
Many authors are very critical about the excessive use of plastics inroutine procedures for hydrocarbon analysis. Plastic can sorb keyhydrocarbon fractions and components may also dissolve intoaggressive solvents causing considerable artefacts. For this study,the objective is to achieve a high level of replication with a consid-erably large sample throughput and glass vials with Teflon-linedscrew caps were used. The selected NEETs were:
1. Water (double reverse osmosis)
2. HPCD (http://www.sigmaaldrich.com) (25 mM). Dissolvedin water
3. Methanol (100%)
4. Purified biosurfactants of Bacillus licheniformis. (Overnightcultures of the isolate were grown in nutrient broth for 16 hat 30�C and 180 rpm. The cells were harvested by centrifuga-tion in 50 ml Corning centrifuge tubes at 2,500 � g (JouanMR1822) and 4�C for 30 min. The supernatant was collectedin sterile 500 ml Duran bottles and acidified to a pH of2.0 � 0.2 with 1 M HCl and then kept at 4�C overnight.The acidified supernatant was centrifuged at 2,500 � g andthe supernatant discarded. The resultant pellet was re-suspended in sterile reverse osmosis water and the pH adjustedto 7.0 � 0.2 with 1 M NaOH. The final volume of the extract
222 Sarah B. Sinebe et al.
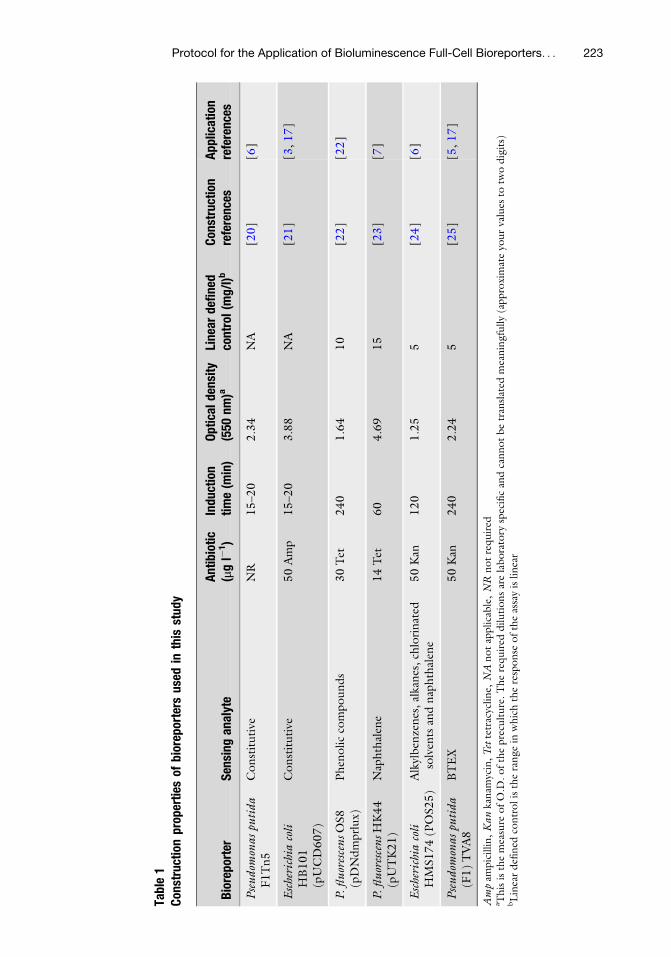
Table1
Constructionproperties
ofbioreporters
used
inthis
study
Bioreporter
Sensing
analyte
Antibiotic
(μgl�
1)
Induction
time(m
in)
Optical
density
(550
nm)a
Linear
defined
control(m
g/l)b
Construction
references
Application
references
Pseudom
onaspu
tida
F1Tn5
Constitutive
NR
15–2
02.34
NA
[20]
[6]
Escherichia
coli
HB101
(pUCD607)
Constitutive
50Amp
15–2
03.88
NA
[21]
[3,17]
P.fluorescensOS8
(pDNdmprlux)
Phen
oliccompounds
30Tet
240
1.64
10
[22]
[22]
P.fluorescensHK44
(pUTK21)
Naphthalen
e14Tet
60
4.69
15
[23]
[7]
Escherichia
coli
HMS174(POS25)
Alkylben
zenes,alkanes,chlorinated
solven
tsandnaphthalen
e50Kan
120
1.25
5[24]
[6]
Pseudom
onaspu
tida
(F1)TVA8
BTEX
50Kan
240
2.24
5[25]
[5,17]
Ampam
picillin,Kankanam
ycin,Tettetracycline,
NA
notapplicable,NR
notrequired
a Thisisthemeasure
ofO.D
.ofthepreculture.Therequired
dilutionsarelaboratory
specificandcannotbetranslated
meaningfully(approximateyo
urvalues
totw
odigits)
bLineardefined
controlistherangein
whichtheresponse
oftheassayislinear
Protocol for the Application of Bioluminescence Full-Cell Bioreporters. . . 223

was 10% of the starting culture volume. Surface tension mea-surements of the extract were 27 mN m�1. Surfactin fromSigma-Aldrich was used as the calibration standard
To initially validate purity performance of the procedure andresultant analyte, high resolution mass spectral data were obtainedfrom a Thermo Instruments ESI-MS system (LTQ XL/ LTQOrbitrap Discovery) coupled to a Thermo Instruments HPLCsystem (Accela PDA detector, Accela PDA autosampler and AccelaPump). The following conditions were used: capillary voltage 45 V,capillary temperature 260�C, auxiliary gas flow rate 10–20 arbitraryunits, sheath gas flow rate 40–50 arbitrary units, spray voltage4.5 kV, mass range 100–2,000 amu (maximum resolution30,000). HPLC separations were carried out using a Phenomenexreversed-phase (C18, 250 10 mm, L i.d.) column connected to anAgilent 1100 series binary pump and monitored using an Agilentphotodiode array detector. Surfactin and C13-lichenysin A (Fig. 1)was identified in the exogenous biosurfactants extracted from theBacillus species. Analysis by LC-MS confirmed that C13-lichenysinA is structurally similar to surfactin but with a higher surfactantpower [26].
3 Methods
3.1 Analytical
Extraction
1. Weigh 0.25 g of soil and add 0.75 ml of the NEETs (seeSect. 2.5) in a microcentrifuge tube and vortexed for 4 min.This is routinely done as three independent replicates.
2. Place the mixture in an over-end-over shaker for 1 h.
Fig. 1 C13-lichenysin A. Chemical formula: C51H90N8NaO12. Exact mass:1029.657. The actual composition of the biosurfactant used in the assay wasconfirmed to be a mixture of C13-lichenysin A, C14-lichenysin A and C15-lichenysin A
224 Sarah B. Sinebe et al.

3. Sonicate in a water bath for 15 min.
4. Place the mixture in an over-end-over shaker for a further 1 h.
5. Centrifuge at 1,734 � g for 30 s.
6. Remove supernatant carefully by pipetting into 4 ml glass vialsto await assay. Perform a tenfold (v/v) dilution of the methanolextract with water before conducting the bioassay.
3.2 Lyophilization of
Cells
Batch cultures of the biosensors were grown in 100 ml LB mediumwith appropriate antibiotics in 250 ml Erlenmeyer flasks. The bio-sensors were harvested at the mid-exponential phase. The concen-tration of biosensors in the media was estimated by OD andconfirmed by plate count (CFU). The harvested biosensors werecentrifuged in 50 ml Corning sterile centrifuge tubes at 1,734 � gat 4�C for 30 min (Jouan GR422 refrigerated floor centrifuge).Mist Dessicans was prepared by mixing freshly defrosted 100 mlhorse serum (Oxoid) and 15 ml of 0.66 g of LB and 18 ml of 10 gglucose.
The supernatant was decanted and the pellets re-suspended inMist Dessicans. Using a Distriman pipette, 1 ml aliquot of cellsuspension was aseptically transferred to 5 ml glass freeze-dryingvials; this was loosely closed with rubber stoppers and placed inliquid nitrogen for 90 min. The glass vials were then transferred to afreeze-dryer (Edwards Modulyo EF4 freeze-dryer) at pressure0.1 mmHg, �70�C overnight (between 16 and 18 h). Afterfreeze-drying, the stoppers were closed under vacuum and labeledbefore storing at �20�C. Quality control was confirmed by select-ing 5 vials randomly for CFU and their bioluminescence responseto Cu and Zn measured.
3.3 Activation of
Bioreporter
1. Many of the constitutive bioreporters can be lyophilised andthis allows resuscitation and activation with a high level ofconsistency. However some induced bioreporters performpoorly after preservation and are best used in batch culturesdespite the associated time constraints that this imposes.Detailed growth curves will have been established for eachbioreporter, for the given medium at defined growth condi-tion. Light emission (on activation), colony forming units andoptical density (550 nm) will have been established andconfirmed.
2. A suspension of sensors can be generated from either growth ofan overnight culture from a single colony [to the pre-definedoptical density (as specified in Table 1)]. This will typicallyrequire a colony of the biosensor cultured on a media platetransferred to a 10 ml medium with 10 μl of specified antibioticas required (Table 1). Incubate the culture using an orbitalshaking incubator at 25�C [P. putida F1Tn5, P. fluorescensOS8(pDNdmprlux), P. fluorescens HK44 (pUTK21) and P. putida
Protocol for the Application of Bioluminescence Full-Cell Bioreporters. . . 225

(F1) TVA8] or 30�C [E. coli HB101 (pUCD607) and E. coliHMS174 (POS25)] for 14–16 h (overnight), aseptically trans-fer 1 ml of the homogenised overnight culture into a 100 mlmedium with 100 μl of antibiotic (when necessary) and incu-bate at the same temperature as the overnight.
Lyophilised E. coli HB101 (pUCD607) biosensors are resusci-tated by re-suspending the cells in sterile 10 ml of 0.1 M KCl in a30 ml Universal bottle, incubated for 1 h in a rotary incubator andthen used for the bioassay. Lyophilised P. putida F1Tn5 was resus-citated by re-suspending the cells in sterile 10 ml of Luria-Bertanimedia for 1 h in a rotary incubator, cells are washed, pellet re-suspended sterile 10 ml of 0.1 M KCl in a 30 ml Universal bottleand then used for the bioassay.
3.4 Performing the
Bioassay with the
Bioreporter
1. Both microtitre and single cuvettes can be used. The formerhas high throughput capabilities but can suffer both from edgeeffects, high surface area sorption and evaporation during lon-ger incubation periods. Regardless of which device is usedthere should be one part of bioreporters cell suspension tonine parts of test medium. So for the microtitre plate reader,this is typically 20 μl of suspension to 180 μl of test solution.For the standard glass or polypropylene cuvette (with a maxi-mum capacity of 4 ml), this would be 100 μl of cell suspensionand 900 μl of test solution.
2. Positive (spiked) and negative controls should be establishedfor each of the bioreporters. The negative control is deionisedwater. A second control, an environmental negative control,composed of either a non-contaminated soil extract or anosmotically matched sample is required. These are requiredfor both constitutive and induced bioreporters. The inducedbioreporters also require the use of a positive control, a con-centration of a relevant analyte that causes a predictableamount of induction. In Table 1, the “linear defined control”is the concentration used for the positive control.
3. The suspension of bioreporters must be aliquoted into themicrotitre plate or cuvette at a pre-defined time interval toallow equal exposure duration for all samples and controls.
4. Bioluminescence measurements are measured in relative lightunits (RLU).
5. The user can select to study the response of the bioreportersacross a pre-defined temporal period should data processingcapabilities be available.
3.5 Calculation of
Bioluminescence
Bioluminescence of the constitutively marked bioreporters is calcu-lated as a percentage of negative controls (reverse osmosis waterwith no pollutant or equivalent), while for inducible marked
226 Sarah B. Sinebe et al.

bioreporters, it is calculated as a percentage of positive control (theresponse of bioluminescence to the pre-defined concentration).
3.6 Data Processing
and Results
A key aspect of the use of bioreporters is that they generate aconsiderable amount of data. It is not uncommon to be over-whelmed with data if a microtitre plate has undergone dozens ofreadings and the data compilation seems unclear. To this end, it isessential that the user has an expectation of what the results may beand this is particularly important for induced bioreporters wherethe optimal time response may vary considerably between biore-porters. The use of web-graphs (Fig. 2) enables a rapid appraisal ofthe response of the different types of sensors allowing the user torapidly view trend. In this example, using Libyan soils, only a singletemporal response of the individual bioreporters has been recordedbut it should be acknowledged that each of the four inducibleresponses varied by up to 90 min (Figs. 3 and 4).
0
Low toxicity and low induction Low toxicity and high induction
High toxicity and low induction High toxicity and high induction
F1TN5
HB101HMS174
HK44
OS8 TVA8
0 20 40 60 80 100 120 100 120F1TN5
HB101HMS174
HK44
OS8 TVA8
F1TN5
HB101HMS174
HK44
OS8 TVA8
0 20 40 60 80 100 120F1TN5
HB101HMS174
HK44
OS8 TVA8
20 40 60 80 100 120
Fig. 2 Web-graphs for data generated using multiple bioreporters: theoretical interpretation of data(percentage)
Protocol for the Application of Bioluminescence Full-Cell Bioreporters. . . 227

F1TN5
HB101HMS174
HK44
OS8 TVA8
0 20 40 60 80 100 120F1TN5
HB101HMS174
HK44
OS8 TVA8
0 20 40 60 80 100 120F1TN5
HB101HMS174
HK44
OS8 TVA8
0 20 40 60 80 100 120
F1TN5
HB101HMS174
HK44
OS8 TVA8
0 20 40 60 80 100 120 F1TN5
HB101HMS174
HK44
OS8 TVA8
0 20 40 60 80 100 120 F1TN5
HB101HMS174
HK44
OS8 TVA8
0 20 40 60 80 100 120
F1TN5
HB101HMS174
HK44
OS8 TVA8
0 20 40 60 80 100 120 F1TN5
HB101HMS174
HK44
OS8 TVA8
0 20 40 60 80 100 120
F1TN5
HB101HMS174
HK44
OS8 TVA8
0 20 40 60 80 100 120F1TN5
HB101HMS174
HK44
OS8 TVA8
0 20 40 60 80 100 120F1TN5
HB101HMS174
HK44
OS8 TVA8
0 20 40 60 80 100 120
F1TN5
HB101HMS174
HK44
OS8 TVA8
0 20 40 60 80 100 120
Methanol
Water
HPCD
B. licheniformis
Fig. 3 Response (percentage of control) of six different bioreporters to Libyan soils undergoing controltreatment (only incubation) sampled at days 5 (left column), 20 (central column) and 42 (right column). TheNEETs that were performed were water, methanol (with 1:10 dilution), HPCD and biosurfactants derived fromBacillus licheniformis
228 Sarah B. Sinebe et al.
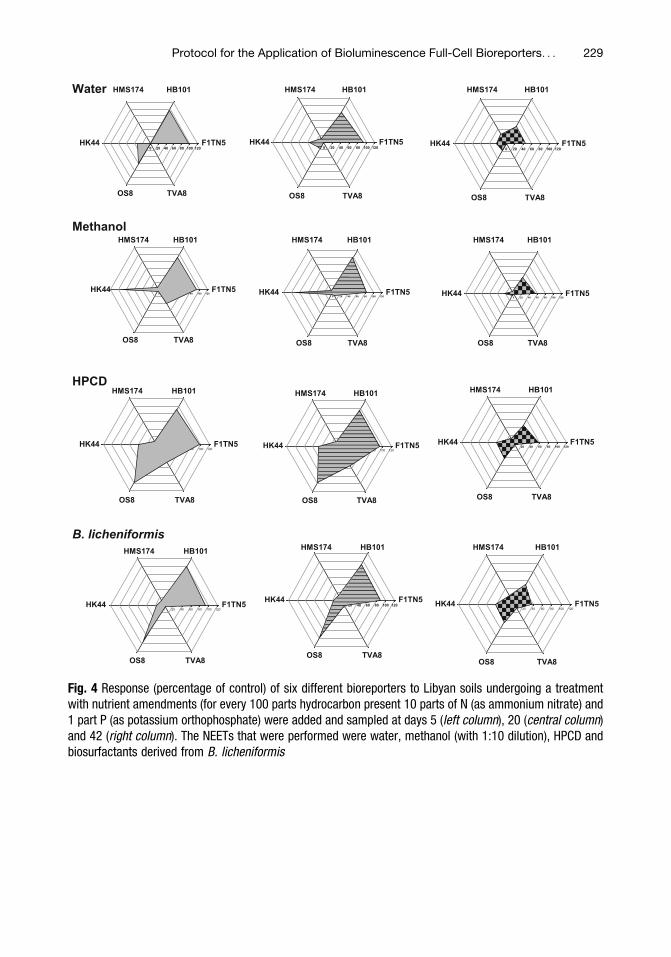
F1TN5
HB101HMS174
HK44
OS8 TVA8
0 20 40 60 80 100 120F1TN5
HB101HMS174
HK44
OS8 TVA8
0 20 40 60 80 100 120F1TN5
HB101HMS174
HK44
OS8 TVA8
0 20 40 60 80 100 120
F1TN5
HB101HMS174
HK44
OS8 TVA8
0 20 40 60 80 100 120 F1TN5
HB101HMS174
HK44
OS8 TVA8
0 20 40 60 80 100 120 F1TN5
HB101HMS174
HK44
OS8 TVA8
0 20 40 60 80 100 120
F1TN5
HB101HMS174
HK44
OS8 TVA8
0 20 40 60 80 100 120 F1TN5
HB101HMS174
HK44
OS8 TVA8
0 20 40 60 80 100 120
F1TN5
HB101HMS174
HK44
OS8 TVA8
0 20 40 60 80 100 120F1TN5
HB101HMS174
HK44
OS8 TVA8
0 20 40 60 80 100 120F1TN5
HB101HMS174
HK44
OS8 TVA8
0 20 40 60 80 100 120
F1TN5
HB101HMS174
HK44
OS8 TVA8
0 20 40 60 80 100 120
Methanol
Water
HPCD
B. licheniformis
Fig. 4 Response (percentage of control) of six different bioreporters to Libyan soils undergoing a treatmentwith nutrient amendments (for every 100 parts hydrocarbon present 10 parts of N (as ammonium nitrate) and1 part P (as potassium orthophosphate) were added and sampled at days 5 (left column), 20 (central column)and 42 (right column). The NEETs that were performed were water, methanol (with 1:10 dilution), HPCD andbiosurfactants derived from B. licheniformis
Protocol for the Application of Bioluminescence Full-Cell Bioreporters. . . 229

References
1. Xu TT, Close DM, Sayler GS, Ripp S (2013)Genetically modified whole-cell bioreportersfor environmental assessment. Ecol Indic28:125–141
2. Dawson JJC, Godsiffe EJ, Thompson IP,Ralebitso-Senior TK, Killham KS, Paton GI(2007) Application of biological indicators toassess recovery of hydrocarbon impacted soils.Soil Biol Biochem 39(1):164–177
3. Bundy JG, Campbell CD, Paton GI (2001)Comparison of response of six different lumi-nescent bacterial bioassays to bioremediationof five contrasting oils. J Environ Monit 3(4):404–410
4. Tiensing T, Strachan N, Paton GI (2002) Eval-uation of interactive toxicity of chlorophenolsin water and soil using lux-marked biosensors.J Environ Monit 4(4):482–489
5. Bhattacharyya J, Read D, Amos S, Dooley S,Killham K, Paton GI (2005) Biosensor-baseddiagnostics of contaminated groundwater:assessment and remediation strategy. EnvironPollut 134(3):485–492
6. Diplock EE, Mardlin DP, Killham KS, PatonGI (2009) Predicting bioremediation ofhydrocarbons: laboratory to field scale. Envi-ron Pollut 157(6):1831–1840
7. Patterson CJ, Semple KT, Paton GI (2004)Non-exhaustive extraction techniques(NEETs) for the prediction of naphthalenemineralisation in soil. FEMS Microbiol Lett241(2):215–220
8. Doick KJ, Dew NM, Semple KT (2005) Link-ing catabolism to cyclodextrin extractability:determination of the microbial availability ofPAHs in soil. Environ Sci Tech 39(22):8858–8864
9. Paton GI, Reid BJ, Semple KT (2009) Appli-cation of a luminescence-based biosensor forassessing naphthalene biodegradation in soilsfrom a manufactured gas plant. Environ Pollut157(5):1643–1648
10. Dandie CE, Weber J, Aleer S, Adetutu EM,Ball AS, Juhasz AL (2010) Assessment of fivebioaccessibility assays for predicting the efficacyof petroleum hydrocarbon biodegradation inaged contaminated soils. Chemosphere 81(9):1061–1068
11. Kilbane JJ II (1998) Extractability andsubsequent biodegradation of PAHs from con-taminated soil. Water Air Soil Pollut 104(3–4):285–304
12. Puglisi E, Patterson CJ, Paton GI (2003) Non-exhaustive extraction techniques (NEETs) for
bioavailability assessment of organic hydropho-bic compounds in soils. J Agron 23(8):755–756
13. Bernhardt C, Derz K, Kordel W, Terytze K(2013) Applicability of non-exhaustive extrac-tion procedures with Tenax and HPCD. J Haz-ard Mater 261:711–717
14. Oleszczuk P (2009) Application of three meth-ods used for the evaluation of polycyclic aro-matic hydrocarbons (PAHs) bioaccessibility forsewage sludge composting. Bioresour Technol100(1):413–420
15. Sinebe BS (2015) Application of microbial bio-sensors for groundwater and wastewater moni-toring. PhD thesis, University of Aberdeen
16. Bundy JG, Maciel H, Cronin MTD, Paton GI(2003) Limitations of a cosolvent for ecotoxi-city testing of hydrophobic compounds. BullEnviron Contam Toxicol 70(1):1–8
17. Dawson JJC, Iroegbu CO, Maciel H, Paton GI(2008) Application of luminescent biosensorsfor monitoring the degradation and toxicity ofBTEX compounds in soils. J Appl Microbiol104(1):141–151
18. Sousa S, Duffy C, Weitz H, Glover LA, B€ar E,Henkler R, Killham K (1998) Use of a lux-modified bacterial biosensor to identify con-straints to bioremediation of btex-contaminated sites. Environ Toxicol Chem 17(6):1039–1045
19. van der Meer JR, Belkin S (2010) Wheremicrobiology meets microengineering: designand applications of reporter bacteria. Nat RevMicrobiol 8:511–522
20. Weitz HJ, Ritchie JM, Bailey DA, HorsburghAM, Killham K, Glover LA (2001) Construc-tion of a modified mini-Tn5 luxCDABE trans-poson for the development of bacterialbiosensors for ecotoxicity testing. FEMSMicrobiol Lett 197(2):159–165
21. Rattray EA, Prosser JI, Killham K, Glover LA(1990) Luminescence-based nonextractivetechnique for in situ detection of Escherichiacoli in soil. Appl Environ Microbiol 56(11):3368–3374
22. Leedj€arv A, Ivask A, Virta M, Kahru A (2006)Analysis of bioavailable phenols from naturalsamples by recombinant luminescent bacterialsensors. Chemosphere 64(11):1910–1919
23. King JMH, Digrazia PM, Applegate B, BurlageR, Sanseverino J, Dunbar P, Larimer F, SaylerGS (1990) Rapid, sensitive bioluminescentreporter technology for naphthalene exposure
230 Sarah B. Sinebe et al.

and biodegradation. Science 249(4970):778–781
24. Selifonova OV, Eaton RW (1996) Use of anipb-lux fusion to study regulation of the iso-propylbenzene catabolism operon of Pseudo-monas putida RE204 and to detecthydrophobic pollutants in the environment.Appl Environ Microbiol 62(3):778–783
25. Applegate BM, Kehrmeyer SR, Sayler GS(1998) A chromosomally based tod-lux-CDABE whole-cell reporter for benzene, tolu-ene, ethybenzene, and xylene (BTEX) sensing.Appl Environ Microbiol 64(7):2730–2735
26. Grangemard I, Wallach J, Maget-Dana R, Pey-poux F (2001) Lichenysin: A more efficientcation chelator than surfactin. Appl BiochemBiotechnol 90(3):199–210
Protocol for the Application of Bioluminescence Full-Cell Bioreporters. . . 231

Protocols for the Use of Gut Models to Study the PotentialContribution of the Gut Microbiota to Human NutritionThrough the Production of Short-Chain Fatty Acids
Andrew J McBain, Ruth Ledder, and Gavin Humphreys
Abstract
The colonic microbiota influences human energy status through the metabolic activity of the taxonomicallydiverse prokaryotic residents that number up to 1012 cells per gram. The principal means by which thishappens is probably via short-chain fatty acids (SCFAs) (mainly acetate, propionate and butyrate), which arecontinually produced by fermentation of dietary fibre, absorbed through the colonic epithelium, trans-ported via the hepatic portal vein to the liver and then converted to glucose and other lipids. SCFAs mayalso regulate appetite via G protein-coupled receptor (GPR43) activation and signalling. Since the colonicmicrobiota is inaccessible for routine investigation, microbiologists have used human faeces as a surrogatefor intestinal contents, animal models and various in vitro systems. These range in complexity from batchcultures of isolated gut bacteria through defined consortia grown in batch and continuous culture tomultistage continuous culture models that reproduce features of the proximal and distal colons. Suchsystems have been used to investigate the metabolism of gut bacteria for several decades and can be adoptedfor studies specifically focussing on SCFA production in the context of nutrition/obesity. SCFAs generatedby bacterial fermentation can be analysed using gas chromatography, or more inclusive data can be obtainedvia metabonomics/metabolomics. Whilst culture and FISH provide a useful means of bacteriologicalanalysis, next-generation sequencing (NGS) has facilitated major advances in our understanding of thiscomplex ecosystem. The following protocol details the establishment of a three-stage continuous culturemicrocosm of the human colon and outlines options for bacteriological and metabolite analyses.
Keywords: Gas chromatography, Gut model, Short-chain fatty acid (SCFA) fermentation
1 Introduction
The human large bowel hosts a complex bacterial microbiota (ormicrobiome) estimated to comprise up to 1012 cells per gram [1].The functions of this bacterial community are diverse, and it is nowbelieved to play a significant role in immune modulation(as reviewed in [2]), intestinal epithelial repair/development [3]and the breakdown of indigestible dietary substrates, such as resis-tant starches and fibre [4].
T.J. McGenity et al. (eds.), Hydrocarbon and Lipid Microbiology Protocols, Springer Protocols Handbooks, (2017) 233–245,DOI 10.1007/8623_2015_127, © Springer-Verlag Berlin Heidelberg 2015, Published online: 14 August 2015
233

1.1 The Gut
Microbiome
and Obesity
The deep sequencing of samples representative of the distal regionsof the gut has shown ca. 90% of the bacterial phylotypes residing atthis site are represented by two phyla: the Firmicutes and theBacteroidetes [5]. Recent research indicates that an imbalance inthese phyla may be associated with the development of metabolicdisorders, in particular obesity, in which the gut microbiome ofobese individuals has been shown to exhibit marked differences inbacterial composition when compared to lean individuals. Pioneer-ing studies in genetically obese mice, carrying a mutation in theleptin gene (ob/ob), were the first to propose an obesity-associatedmicrobiota, characterised by a reduction in Bacteroidetes abun-dance in comparison to lean kin (ob/+ and +/+) [6]. Furtherstudies suggest that this effect was transmissible, i.e. the transferof gut microbiota from ob/ob mice to germ-free wild-type miceresulted in increased fat accumulation and subsequent developmentof the obesity phenotype [7]. In a separate investigation, differ-ences in body composition were shown to correlate with increasedintestinal short-chain fatty acid production in lean animals, in con-trast to obese mice, which exhibited increased production ofbranched chain amino acids by the gut microbiota which principallyresults from bacterial protein degradation [8]. Surprisingly, thecohousing of obese and lean mice resulted in protection againstobesity, possibly due to increased Bacteroidetes abundance in the obgut microbiota following coprophagy [9].
The apparent association of gut microbiome composition andobesity has not been limited to animal studies. Similar observationshave been made in human volunteers, in particular profiling studiesof lean/obese twins, in which a shift in favour of Firmicutes abun-dance has been associated with the obese phenotype [10]. Similarly,in infants under 1 year of age, Kalliom€aki et al. [11] reported thatthe composition of the gut microbiome was predictive for obesity.Despite purported associations between obesity and microbiome,the topic remains controversial, and the exact role of bacteria in thepathophysiology of metabolic disease, assuming this putative asso-ciation is real, remains unclear. It has however been hypothesisedthat certain shifts in microbiome composition could be associatedwith an increased capacity to harvest energy from ingested foodstuffs and that SCFA may regulate host metabolic physiology.
1.2 Bacterial
Fermentation
and Short-Chain Fatty
Acid Production
The fermentation of dietary fibre by the gut microbiome is acomplex process that results in the production of SCFAs, predomi-nantly acetate, propionate and butyrate. In individuals consuming a“Western” diet, these products have been estimated to account forup to 10% of the body’s total calorific daily requirement [12].Butyrate is an essential source of energy for colonocytes, whilstpropionate is principally involved in gluconeogenesis in hepatocytes[13]. SCFAs have also been shown to be ligands for G protein-coupled receptors (e.g. GPR41 as a receptor for butyrate and
234 Andrew J McBain et al.

isobutyrate) which occur in the distal regions of the gastrointestinaltract [14]. Importantly, GPR41 may be associated with leptinexpression and subsequent effects on appetite mediated by anorec-tic hormone production [15]. In this study, GPR41-deficient micewere characterised by reduced expression of peptide YY andreduced gut motility [15]. Oral dosing with an inulin-propionateester in overweight human volunteers (n ¼ 60) was shown to causeincreased circulating levels of glucagon-like peptide 1 and peptideYY and reduced energy intake [16]. In the longer term (24 weeks),increasing colonic concentrations of this SCFA through dietarysupplementation reportedly reduced weight gain and intrahepato-cellular lipid content. Interestingly, Frost et al. recently demon-strated intraperitoneal acetate to have similar effects on appetitesuppression, potentially as a result of altered expression of regu-latory neuropeptide profiles [17].
1.3 In Vitro Models
for Gut Microbiome
Investigations
Investigations of the human gut microbiome are complicated byinaccessibility and ethical considerations associated with any directmeans of access. Faeces are commonly used as a substitute forintestinal contents, but investigations into the effects of interven-tions on bacterial metabolism can be most readily achieved usingin vitro models. Considerable knowledge has previously beengleaned through the use of such systems into activities includingprotein degradation [8], breakdown of complex carbohydrates[18], gas metabolism [19], biofilm formation [20, 21], bile acidmetabolism and capacity to produce mutagens [22]. Such modelscan be as simple as batch incubations of faecal slurries in serum orUniversal bottles through to various stirred systems andmodels thatutilise pH control with continuous culture. Gut microbial processescan be modelled in a reductionist manner, utilising pure culturesand relatively simple media, which is often the best approach wherethe aim is to elucidate mechanisms, or alternatively, models can beused to broadly simulate the microbial and substrate complexity ofthe large bowel. Such microcosms are generally inoculated withfreshly voided human faeces and utilise growth medium that iscompositionally similar to digesta that enters the large bowel. Allmodel systems have inherent advantages and disadvantages, andmuch of the challenge associated with their use is selecting thebest model for a particular application (reviewed in [23]). Forexample, multiple Universal bottle batch cultures can run at thesame time, enabling replication and the testing of multiple variablesindependently. However, since pH is uncontrolled, nutrients maybe rapidly depleted (often in under 24 h) and metabolic productsaccumulate, so such systems are not compositionally stable overtime and are probably less representative of the in situ conditionsthan continuous culture models.
Whilst mucous, sloughed cells and other potential bacterialgrowth substrates are endogenous to the colon, the majority ofsubstrates enter the large bowel via the small intestine and then
Protocols for the Use of Gut Models to Study the Potential. . . 235

transit through the lumen to the rectum where they are voided.From a microbial perspective, the colon therefore functions in amanner similar to a continuous culture system [24]. Thus, chemo-stats, which have proved so useful for general microbial physiologystudies are also a useful tool for the gut microbiologist since steadystates can be established, nutrient availability and growth rate canbe controlled and pH can be varied. In order to reproduce thesequential depletion of nutrients that occurs with transit of digestathrough the colon, however, multiple vessel continuous culturemodels have proven utility. Such systems are fed from a mediumreservoir into the primary vessel which functions as an independentfermentation vessel and then, with continuous feeding, spent cul-ture fluid transits into further vessel(s). The most common config-uration for such systems involves three vessels [25, 26] (Fig. 1), butdual vessel systems have also been used to good effect [27] as havemodels comprising up to five vessels [26]. Investigations on gutcontents from humans [28] have enabled the validity of such sys-tems to be confirmed.
In this chapter we describe protocols associated with establish-ing a continuous culture model of the human large intestine andoptions for SCFA and NGS analyses.
2 Materials
2.1 In Vitro Gut
Model
1. Fermentation vessels (chemostat type) with water jackets(Fig. 1a). Volume can be varied but commonly 280 ml (vessel l),280ml (vessel 2) and 320ml (vessel 3).
2. pH controllers 3� (Fig. 1b). For example, pH 1,000 pHsystem (New Brunswick Scientific, St. Albans, Herts., UK)coupled to CW711/EXT/250 pH electrodes (Thermo-Russell, Auchterarder, UK).
3. NaOH (1.0 M) for pH controllers (Fig. 1c).
4. Recirculating incubating water pump (Fig. 1d; e.g. Haake B3).
5. Peristaltic medium pump (Fig. 1e).
6. Stands for fermentation vessels (3�).
7. Peristaltic pump tubing.
8. Gas tubing for sparging gas.
9. Gas filters (0.2 μm).
10. Magnetic stirrers and stir bars (4�).
11. Medium (Fig. 1f) and waste (Fig. 1g) reservoirs (10 L) withdrilled silicon rubber bungs.
12. Growth medium (Fig. 1h) (see Table 1).
13. Oxygen-free nitrogen gas.
14. Freshly voided human faeces (inoculum; see Note 2).
236 Andrew J McBain et al.

Fig. 1 A three-stage continuous culture simulator of the human large intestine. Since all three vessels areinoculated with human faecal material and a large proportion of the bacterial diversity present establishes in
Protocols for the Use of Gut Models to Study the Potential. . . 237
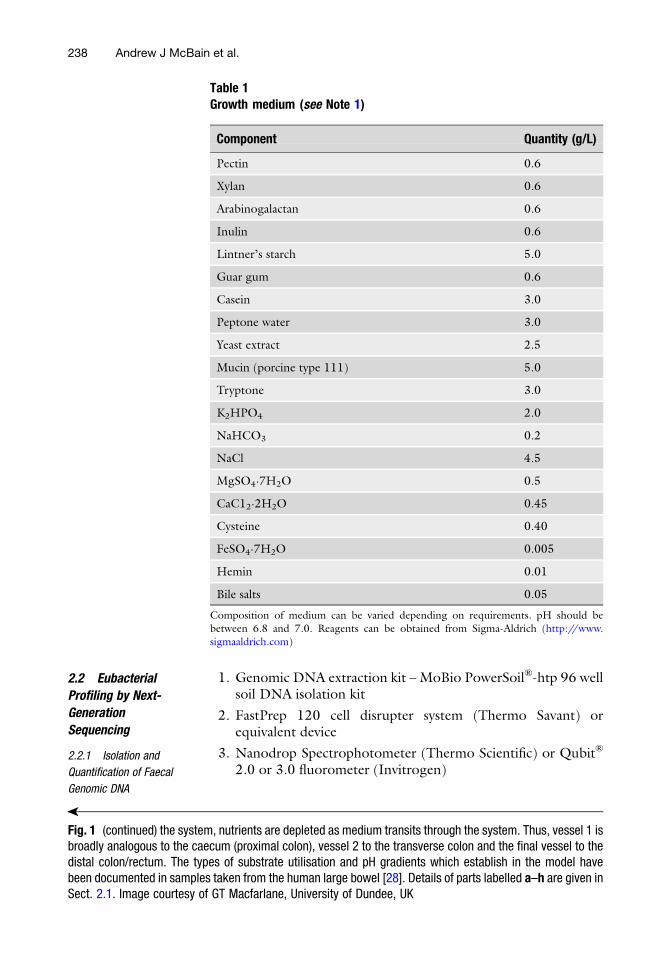
2.2 Eubacterial
Profiling by Next-
Generation
Sequencing
2.2.1 Isolation and
Quantification of Faecal
Genomic DNA
1. Genomic DNA extraction kit – MoBio PowerSoil®-htp 96 wellsoil DNA isolation kit
2. FastPrep 120 cell disrupter system (Thermo Savant) orequivalent device
3. Nanodrop Spectrophotometer (Thermo Scientific) or Qubit®
2.0 or 3.0 fluorometer (Invitrogen)
�
Fig. 1 (continued) the system, nutrients are depleted as medium transits through the system. Thus, vessel 1 isbroadly analogous to the caecum (proximal colon), vessel 2 to the transverse colon and the final vessel to thedistal colon/rectum. The types of substrate utilisation and pH gradients which establish in the model havebeen documented in samples taken from the human large bowel [28]. Details of parts labelled a–h are given inSect. 2.1. Image courtesy of GT Macfarlane, University of Dundee, UK
Table 1Growth medium (see Note 1)
Component Quantity (g/L)
Pectin 0.6
Xylan 0.6
Arabinogalactan 0.6
Inulin 0.6
Lintner’s starch 5.0
Guar gum 0.6
Casein 3.0
Peptone water 3.0
Yeast extract 2.5
Mucin (porcine type 111) 5.0
Tryptone 3.0
K2HPO4 2.0
NaHCO3 0.2
NaCl 4.5
MgSO4·7H2O 0.5
CaC12·2H2O 0.45
Cysteine 0.40
FeSO4·7H2O 0.005
Hemin 0.01
Bile salts 0.05
Composition of medium can be varied depending on requirements. pH should be
between 6.8 and 7.0. Reagents can be obtained from Sigma-Aldrich (http://www.sigmaaldrich.com)
238 Andrew J McBain et al.

2.2.2 Construction
of MiSeq Sequencing
Libraries
1. Standard desalting purified oligonucleotide primers containingadditional Illumina adaptor overhang nucleotide sequences(italicised): F515 (50-TCG TCG GCA GCG TCA GATGTG TAT AAG AGA CAG GTG CCA GCM GCC GCGGTA A – 30) and R806 (50-GTC TCG TGG GCT CGG AGATGT GTA TAA GAG ACA GGG ACTACH VGG GTW TCTAAT – 30) [29]. Prepare 5 μM primer stocks for use in PCRmaster mix using nuclease-free, PCR grade water (see Note 3).
2. MyTaqTM HS Mix DNA polymerase (BioLine).
3. Agencourt AMPure XP PCR purification kit (BeckmanCoulter). Other methodologies, such as the QIAquick PCRpurification kit (Qiagen), offer an alternative methodologywith comparable DNA yields post clean-up.
4. Nextera XT Index kit (Illumina).
5. Qubit® 2.0 or 3.0 fluorometer (Invitrogen).
6. Illumina MiSeq system (Illumina, available commercially andvia sequencing core facilities).
3 Methods
3.1 In Vitro Gut
Model
1. Construct the model as outlined in Fig. 1 such that vessel 1 isplaced above vessel 2 and vessel 2 above vessel 3. Connect thevessels with a minimal length of marprene tubing, the mediumreservoir to vessel 1 and vessel 3 to the waste vessel. Add amagnetic stir bar to each fermentation vessel and to the emptymedium reservoir.
2. Calibrate the pH controllers and connect to pH probes placedin each fermentation vessel and to the 1 M NaOH vessel.Set pH controllers such that vessels 1, 2 and 3 are maintainedat pH 5.5, 6.2 and 6.8, respectively.
3. Sterilise the vessels and probes by autoclaving at 121�C for15 min. Add sufficient distilled water to the vessels such thatthe pH probe tips are immersed during autoclaving.
4. Connect the oxygen-free nitrogen to the three fermentationvessels and the medium reservoirs through the air filters asindicated in Fig. 1.
5. Prepare the growth medium (normally 10 L) by adding theingredients listed in Table 1 to ca. 9 L of deionised water in the10 L medium reservoir vessel. Sterilise by autoclaving for15 min. for volumes of less than 1 L. The holding time shouldbe increased for larger volumes (see Note 1).
Protocols for the Use of Gut Models to Study the Potential. . . 239

6. Taking precautions due to risks associated with hot medium,cool medium under a headspace of oxygen-free nitrogen(achieved by sparging at 2 L/h).
7. Connect medium via peristaltic tubing to the peristaltic pumpand fill all three vessels to approximately half capacity withsterile growth medium.
8. Sparge (2 L/h) the fermentation vessels with oxygen-freenitrogen.
9. Switch on magnetic stirrers and incubating water pump toregulate temperature at 37�C.
10. Inoculate each fermentation vessel twice using 30 ml volumesof a 40% w/v slurry prepared from freshly voided faeces from ahealthy donor with an interval of 48 h between (see Note 4).
11. For the first 2 days, maintain anaerobic conditions by continu-ous sparging with oxygen-free nitrogen (2 L/h). Thereafter,the system can be run without external gassing.
12. Pump sterile medium continuously into vessel 1, whichsequentially feeds the other two vessels via a series of weirs, togive a total system retention time of between 30 and 60 h.
13. Dynamic states are achieved after several total system turnovers(approximately nine).
14. Remove samples at appropriate intervals depending on theexperimental design using a sterile pipette, directly from thefermentation vessels.
3.2 SCFA/Metabolite
Analyses
Samples should be collected directly from the fermenter vesselsimmediately spun down and supernatants should rapidly be frozenat �80�C prior to analyses (pelleted cells can be separately pro-cessed and stored for other analyses). Submit samples to analyticalfacility to quantify SCFAs by LC–UV, as described in [30], NMR[31], GC [32] or GC–MS [33].
4 Eubacterial Profiling by Next-Generation Sequencing
4.1 Isolation and
Quantification of
Genomic DNA
1. Thoroughly clean all surfaces in order to remove potentialsources of DNA contaminants (see Note 5).
2. Perform DNA extraction using the MoBio PowerSoil®-htp 96well soil DNA isolation kit as described in DNA extractionprotocol (Version 4_13) of the Earth Microbiome Project(http://www.earthmicrobiome.org).
3. Quantify the DNA yield (ng/μl) using a NanoDrop Spectro-photometer or Qubit fluorometer prior to preparation of PCRreaction mixtures.
240 Andrew J McBain et al.

4.2 MiSeq
Sequencing Analysis
1. This methodology is based on the 16S metagenomicsprotocol described by Illumina (http://support.illumina.com)(see Note 6).
2. Set up a PCR reaction mixture stock so that each reactioncomprises the following: 12.5 ng extracted DNA, 1 μl forwardand reverse primer stock and 25 μl Hot Start ready mix taq.Adjust to a final volume of 50 μl using PCR grade water.
3. Perform PCR amplification reactions in triplicate usingthe following programme settings: 95�C (3 min) followed by30 cycles of 95�C (30 s), 55�C (30 s) and 72�C (30 s). Thefinal cycle should incorporate a 5 min chain elongation step(72�C).
4. Pool PCR reactions by sample name and investigate the qualityand quantity of amplified 16S rDNA through electrophoresison a 0.8 % agarose gel. For large sample sizes, a randomselection of 12 samples may be used.
5. Purify the amplified 16S rDNA using the AMPure XP PCRpurification kit according to the manufacturer’s protocol.Whilst this PCR clean-up methodology is recommended byIllumina, the QIAquick PCR purification kit (Qiagen) may beapplied at this stage and offers comparable DNA yields for thisamplicon length (<800 bp).
6. Attach Illumina sequencing adapters and dual indices using theNextera XT Index kit (Illumina, Inc.) according to the manu-facturer’s instructions.
7. Perform a second PCR clean-up using the AMPure XP PCRpurification kit. Perform the purification process according tothe manufacturer’s protocol.
8. Quantify the concentration of DNA per sample (ng/μl) usingthe Qubit fluorometer.
9. Proceed to follow the MiSeq 16S metagenomics protocol inorder to perform library normalisation and sample pooling (seeNote 7).
10. Sequence the purified samples using the MiSeq system bypaired end sequencing. This system is typically available at anycore or commercial sequencing facility.
4.3 Processing
Next-Generation
Sequencing Data
1. Sequencing results are typically provided in a compressed for-mat (fastq.gz).
2. Analyse the metagenome files using a dedicated high-throughput software package. Numerous software packagesare available for the interpretation of metagenome files. Forthe inexperienced user, MG-RAST (https://metagenomics.anl.gov) and the ribosomal database project (https://pyro.cme.msu.edu) offer online pipelines for the analysis of
Protocols for the Use of Gut Models to Study the Potential. . . 241

sequencing data. Alternatively, for the experienced users,QIIME (Quantitative insights into microbial ecology) andMOTHUR are open-source software package for the in-depth analysis of next-generation sequencing data (seeNote 8).
5 Notes
1. Prepare in a 10 L vessel. Add 5 L deionised water and addingredients sequentially with magnetic stirring, make to finalvolume and ensure that it is well mixed before autoclaving andthat the mucin is fully dispersed in the growth medium.
2. The inoculum comprises slurries (40% [wt/vol]) preparedusing faeces stored at room temperature and processed within1 h of defecation by homogenising in a stomacher bag inanaerobic phosphate-buffered saline (0.1 M; pH 6.8). Slurriesshould then be passed through a 500 μmmesh sieve to removelarge food particles and used immediately.
3. Illumina recommend standard desalting purification. Primerscan be ordered from an online supplier of custom nucleic acids(e.g. Integrated DNA Technologies (www.idtdna.com).
4. Human faecal samples will contain human tissue, and as such,ethical approval may be required from a local research ethicscommittee prior to sample collection. Further information isavailable from the health research authority (NHS) or institu-tional ethics committee.
5. Appropriate measures should be taken to reduce contamina-tion of the samples with exogenous DNA which can lead to anoverestimation of species diversity. DNA awayTM surfacedecontaminant or 10% bleach solution is suitable for thispurpose.
6. The protocol outlined describes use of primers specific for theV4 region of the 16S rRNA gene, whilst the Illumina protocolgenerates a greater amplicon length, targeting V3-V4. Despitecompromising on amplicon length, amplification of the V4region offers greater overlap between R1 and R2 sequencesand reduced error when performing the merging of mate pairs.
7. A total of 96 samples can be multiplexed per MiSeq run usingthis methodology. However, this is at the discretion of the userand should be assessed following validation runs.
8. Extensive tutorials for QIIME (qiime.org/tutorials/index.html) and MOTHUR (http://www.mothur.org/wiki/Main_Page) are available for these software packages from thedeveloper’s website.
242 Andrew J McBain et al.

Acknowledgement
AJM gratefully acknowledges Professor George TennantMacfarlane (1958–2015) for permission to use his designs anddiagrams in this article, for inspiration and insight and for hissignificant contributions to intestinal microbiology over morethan 30 years.
References
1. Leser TD, Molbak L (2009) Better livingthrough microbial action: the benefits of themammalian gastrointestinal microbiota on thehost. Environ Microbiol 11(9):2194–2206.doi:10.1111/j.1462-2920.2009.01941.x
2. Kau AL, Ahern PP, Griffin NW, Goodman AL,Gordon JI (2011) Human nutrition, the gutmicrobiome and the immune system. Nature474:327–336. doi:10.1038/nature10213
3. Stappenbeck TS, Hooper LV, Gordon JI(2002) Developmental regulation of intestinalangiogenesis by indigenous microbes viaPaneth cells. Proc Natl Acad Sci U S A99:15451–15455. doi:10.1073/pnas.202604299202604299
4. Macfarlane GT, Englyst HN (1986) Starch uti-lization by the human large intestinal micro-flora. J Appl Bacteriol 60(3):195–201
5. ArumugamM, Raes J, Pelletier E, Le Paslier D,Yamada T, Mende DR, Fernandes GR, Tap J,Bruls T, Batto JM, Bertalan M, Borruel N,Casellas F, Fernandez L, Gautier L, HansenT, Hattori M, Hayashi T, KleerebezemM, Kur-okawa K, Leclerc M, Levenez F, Manichanh C,Nielsen HB, Nielsen T, Pons N, Poulain J, QinJ, Sicheritz-Ponten T, Tims S, Torrents D,Ugarte E, Zoetendal EG, Wang J, Guarner F,Pedersen O, de Vos WM, Brunak S, Dore J,Meta HITC, Antolin M, Artiguenave F, Blot-tiere HM, Almeida M, Brechot C, Cara C,Chervaux C, Cultrone A, Delorme C, DenariazG, Dervyn R, Foerstner KU, Friss C, van deGuchte M, Guedon E, Haimet F, Huber W,van Hylckama-Vlieg J, Jamet A, Juste C, KaciG, Knol J, Lakhdari O, Layec S, Le Roux K,Maguin E, Merieux A, Melo Minardi R,M’Rini C, Muller J, Oozeer R, Parkhill J,Renault P, Rescigno M, Sanchez N, SunagawaS, Torrejon A, Turner K, VandemeulebrouckG, Varela E, Winogradsky Y, Zeller G, Weis-senbach J, Ehrlich SD, Bork P (2011) Entero-types of the human gut microbiome. Nature473(7346):174–180. doi:10.1038/nature09944
6. Ley RE, Backhed F, Turnbaugh P, LozuponeCA, Knight RD, Gordon JI (2005) Obesityalters gut microbial ecology. Proc Natl AcadSci U S A 102(31):11070–11075. doi:10.1073/pnas.0504978102
7. Turnbaugh PJ, Ley RE, Mahowald MA,Magrini V, Mardis ER, Gordon JI (2006) Anobesity-associated gut microbiome withincreased capacity for energy harvest. Nature444(7122):1027–1031. doi:10.1038/nature05414
8. Macfarlane GT, Cummings JH, Allison C(1986) Protein degradation by human intesti-nal bacteria. J Gen Microbiol 132(6):1647–1656
9. Ridaura VK, Faith JJ, Rey FE, Cheng J, Dun-can AE, Kau AL, Griffin NW, Lombard V,Henrissat B, Bain JR, Muehlbauer MJ, IlkayevaO, Semenkovich CF, Funai K, Hayashi DK,Lyle BJ, Martini MC, Ursell LK, ClementeJC, Van Treuren W, Walters WA, Knight R,Newgard CB, Heath AC, Gordon JI (2013)Gut microbiota from twins discordant for obe-sity modulate metabolism in mice. Science 341(6150):1241214. doi:10.1126/science.1241214
10. Turnbaugh PJ, Hamady M, Yatsunenko T,Cantarel BL, Duncan A, Ley RE, Sogin ML,Jones WJ, Roe BA, Affourtit JP, Egholm M,Henrissat B, Heath AC, Knight R, Gordon JI(2009) A core gut microbiome in obese andlean twins. Nature 457(7228):480–484.doi:10.1038/nature07540
11. Kalliom€aki M, Collado MC, Salminen S, Iso-lauri E (2008) Early differences in fecal micro-biota composition in children may predictoverweight. Am J Clin Nutr 87(3):534–538
12. Bergman EN (1990) Energy contributions ofvolatile fatty acids from the gastrointestinaltract in various species. Physiol Rev 70(2):567–590
13. Bloemen JG, Venema K, van de Poll MC, OldeDamink SW, Buurman WA, Dejong CH
Protocols for the Use of Gut Models to Study the Potential. . . 243
(2009) Short chain fatty acids exchange acrossthe gut and liver in humans measured at sur-gery. Clin Nutr 28(6):657–661. doi:10.1016/j.clnu.2009.05.011
14. Le Poul E, Loison C, Struyf S, Springael JY,Lannoy V, Decobecq ME, Brezillon S, DupriezV, Vassart G, Van Damme J, Parmentier M,DetheuxM (2003) Functional characterizationof human receptors for short chain fatty acidsand their role in polymorphonuclear cell acti-vation. J Biol Chem 278(28):25481–25489.doi:10.1074/jbc.M301403200
15. Engelstoft MS, Egerod KL, Holst B, SchwartzTW (2008) A gut feeling for obesity: 7TMsensors on enteroendocrine cells. Cell Metab8(6):447–449. doi:10.1016/j.cmet.2008.11.004
16. Chambers ES, Viardot A, Psichas A, MorrisonDJ, Murphy KG, Zac-Varghese SE, MacDou-gall K, Preston T, Tedford C, Finlayson GS,Blundell JE, Bell JD, Thomas EL, Mt-Isa S,Ashby D, Gibson GR, Kolida S, Dhillo WS,Bloom SR, Morley W, Clegg S, Frost G(2014) Effects of targeted delivery of propio-nate to the human colon on appetite regula-tion, body weight maintenance and adiposity inoverweight adults. Gut. doi:10.1136/gutjnl-2014-307913
17. Frost G, Sleeth ML, Sahuri-Arisoylu M,Lizarbe B, Cerdan S, Brody L, Anastasovska J,Ghourab S, Hankir M, Zhang S, Carling D,Swann JR, Gibson G, Viardot A, Morrison D,Louise Thomas E, Bell JD (2014) The short-chain fatty acid acetate reduces appetite via acentral homeostatic mechanism. Nat Commun5:3611. doi:10.1038/ncomms4611
18. Degnan BA, Macfarlane S, Quigley ME,Macfarlane GT (1997) Starch utilization byBacteroides ovatus isolated from thehuman large intestine. Curr Microbiol 34(5):290–296
19. Gibson GR, Cummings JH, Macfarlane GT(1988) Competition for hydrogen betweensulphate-reducing bacteria and methanogenicbacteria from the human large intestine. J ApplBacteriol 65(3):241–247
20. Macfarlane S, McBain AJ, Macfarlane GT(1997) Consequences of biofilm and sessilegrowth in the large intestine. Adv Dent Res11(1):59–68
21. Macfarlane S, Woodmansey EJ, Macfarlane GT(2005) Colonization of mucin by human intes-tinal bacteria and establishment of biofilmcommunities in a two-stage continuous culturesystem. Appl Environ Microbiol 71(11):7483–7492. doi:10.1128/AEM.71.11.7483-7492.2005
22. McBain AJ, Macfarlane GT (2001) Modula-tion of genotoxic enzyme activities by non-digestible oligosaccharide metabolism inin-vitro human gut bacterial ecosystems.J Med Microbiol 50(9):833–842
23. McBain AJ (2009) Chapter 4: in vitro biofilmmodels: an overview. Adv Appl Microbiol69:99–132
24. Macfarlane GT, Macfarlane S (2007) Modelsfor intestinal fermentation: associationbetween food components, delivery systems,bioavailability and functional interactions inthe gut. Curr Opin Biotechnol 18(2):156–162. doi:10.1016/j.copbio.2007.01.011
25. Gibson GR, Cummings JH, Macfarlane GT(1988) Use of a three-stage continuousculture system to study the effect of mucin ondissimilatory sulfate reduction and methano-genesis by mixed populations of human gutbacteria. Appl Environ Microbiol 54(11):2750–2755
26. Allison C, McFarlan C, Macfarlane GT (1989)Studies on mixed populations of human intes-tinal bacteria grown in single-stage and multi-stage continuous culture systems. ApplEnviron Microbiol 55(3):672–678
27. Macfarlane GT, Gibson GR (1991) Co-utilization of polymerized carbon sources byBacteroides ovatus grown in a two-stage contin-uous culture system. Appl Environ Microbiol57(1):1–6
28. Macfarlane GT, Gibson GR, Cummings JH(1992) Comparison of fermentation reactionsin different regions of the human colon. J ApplBacteriol 72(1):57–64
29. Caporaso JG, Lauber CL, Walters WA, Berg-Lyons D, Lozupone CA, Turnbaugh PJ, FiererN, Knight R (2011) Global patterns of 16SrRNA diversity at a depth of millions ofsequences per sample. Proc Natl Acad Sci U SA 108(Suppl 1):4516–4522. doi:10.1073/pnas.1000080107
30. Huda-Faujan N, Abdulamir AS, Fatimah AB,Anas OM, Shuhaimi M, Yazid AM, Loong YY(2010) The impact of the level of the intestinalshort chain Fatty acids in inflammatory boweldisease patients versus healthy subjects. OpenBiochem J 4:53–58
31. Furusawa Y, Obata Y, Fukuda S, Endo TA,Nakato G, Takahashi D, Nakanishi Y, UetakeC, Kato K, Kato T, Takahashi M, Fukuda NN,Murakami S, Miyauchi E, Hino S, Atarashi K,Onawa S, Fujimura Y, Lockett T, Clarke JM,Topping DL, Tomita M, Hori S, Ohara O,Morita T, Koseki H, Kikuchi J, Honda K,Hase K, Ohno H (2013) Commensal
244 Andrew J McBain et al.

microbe-derived butyrate induces the differen-tiation of colonic regulatory T cells. Nature504(7480):446–450. doi:10.1038/nature12721
32. Bourriaud C, Robins RJ, Martin L, KozlowskiF, Tenailleau E, Cherbut C, Michel C (2005)Lactate is mainly fermented to butyrate byhuman intestinal microfloras but inter-individual variation is evident. J Appl Microbiol
99(1):201–212. doi:10.1111/j.1365-2672.2005.02605.x
33. Zheng X, Qiu Y, Zhong W, Baxter S, Su M, LiQ, Xie G, Ore BM, Qiao S, Spencer MD, ZeiselSH, Zhou Z, Zhao A, Jia W (2013) A targetedmetabolomic protocol for short-chain fattyacids and branched-chain amino acids. Meta-bolomics 9(4):818–827. doi:10.1007/s11306-013-0500-6
Protocols for the Use of Gut Models to Study the Potential. . . 245