tertiary education financing models around the world: conceptual basis, policy implications and...
TRANSCRIPT

Tertiary Education Financing Models Around the World:
Conceptual basis, policy implications and recent international experience
Bruce ChapmanCrawford School of Economics and Government
The Australian National UniversityCanberra ACT 0200
Public and Private Mechanisms for Financing Higher Education Santiago, November 24, 2009

OUTLINE
1.- The Shared International Challenge
2.- Costs and Benefits for Students
3.- Loans: The Need for Government Intervention
4.- The Problems with Government Guaranteed Bank Loans
5.- The Costs and Benefits of Income Contingent Loans
6.- An ICL Case Study: Australia`s HECS 1989-2005
7.- The Critical Role of Collection
8.- Changes Internationally Towards ICL
9.- Conclusions

1.- The Shared International Challenge
• unmet demand for places
• inequitable access
• shortage of finances
• an emerging concensus for student contributions
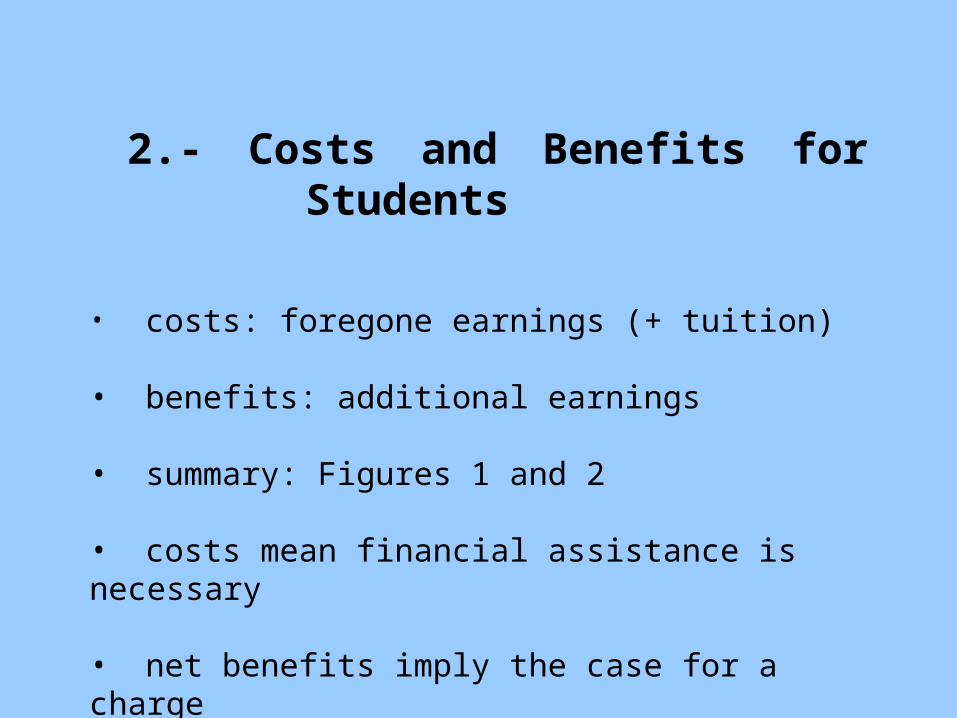
2.- Costs and Benefits for Students
• costs: foregone earnings (+ tuition)
• benefits: additional earnings
• summary: Figures 1 and 2
• costs mean financial assistance is necessary
• net benefits imply the case for a charge

Figure 1Typical Female Age-Earnings Profiles: 2001
0
10
20
30
40
50
60
18 20 22 24 26 28 30 32 34 36 38 40 42 44 46 48 50 52 54
Age
Ps/Hr
High School Complete
University Complete
0
10
20
30
40
50
60
18 20 22 24 26 28 30 32 34 36 38 40 42 44 46 48 50 52 54
Age
Ps/Hr
High School Complete
University Complete
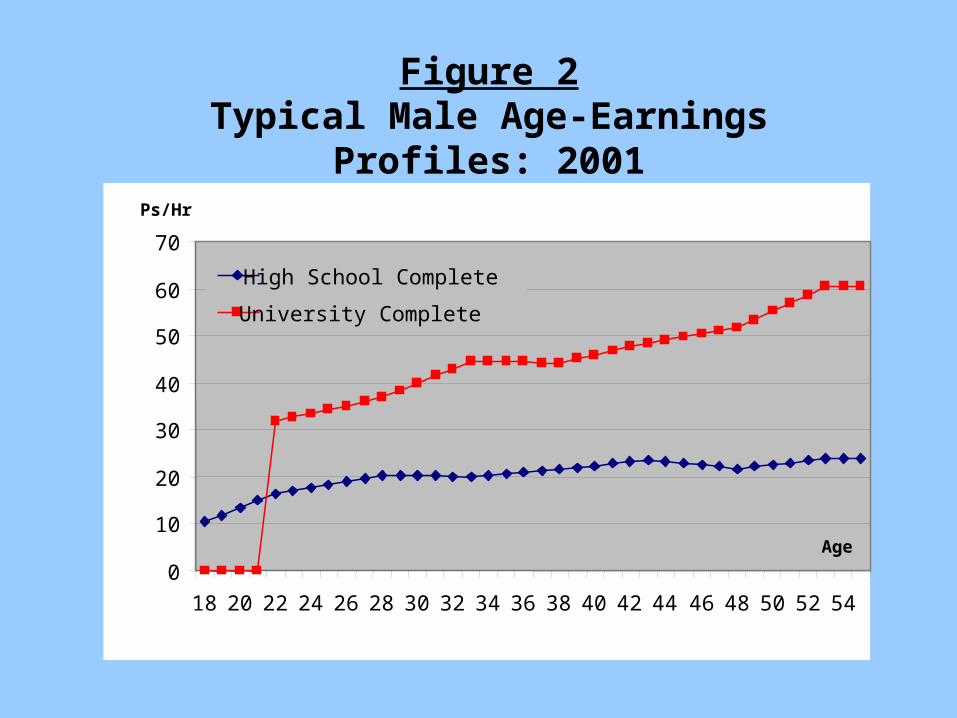
Figure 2Typical Male Age-Earnings Profiles: 2001
0
10
20
30
40
50
60
70
18 20 22 24 26 28 30 32 34 36 38 40 42 44 46 48 50 52 54
Age
Ps/Hr
High School Complete
University Complete

Figure 3 Typical Male Age-Earnings Profiles: The UK 2003
0
2
4
6
8
10
12
14
16
18 19 20 21 22 23 24 25 26 27 28 29 30 31 32 33 34 35 36 37 38 39 40 41 42 43 44 45 46 47 48 49 50
Age
Poun
ds/H
r
Bachelor A Level

Figure 4Typical Female Age-Earnings Profiles: The UK 2003
0
2
4
6
8
10
12
14
16
18 19 20 21 22 23 24 25 26 27 28 29 30 31 32 33 34 35 36 37 38 39 40 41 42 43 44 45 46 47 48 49 50
Age
Poun
ds/H
r
Bachelor A Level

2.- Costs and Benefits for Students
• costs: foregone earnings (+ tuition)
• benefits: additional earnings
• summary: Figures 1 and 2
• costs mean financial assistance is required
• an implication of the data: high private rates of return to HE
• low tuition charges are socially inequitable

3.- Loans: The Need for Government Intervention
• human capital investment is very uncertain for lenders and for borrowers – completion
• human capital investment is very uncertain for lenders and for borrowers – ability
• human capital investment is very uncertain for lenders and for borrowers – the future labor market
• uncertainty leads to default
• the problem for banks: no saleable collateral
• the problem for students: no access to loans
• government intervention is required

4.- The Problems with Government Guaranteed Bank Loans
• the usual solution: government guaranteed commercial bank loans.
• benefit 1: solves the lender default problem
• benefit 2: provides commercial finance simply
BUT cost 1 - defaults expensive for taxpayers
cost 2 - some hardship when repaying (no consumption smoothing)
cost 3 - some credit risk of default (no insurance)
cost 4 - collection can be administratively expensive
cost 5 - collection can be administratively expensive
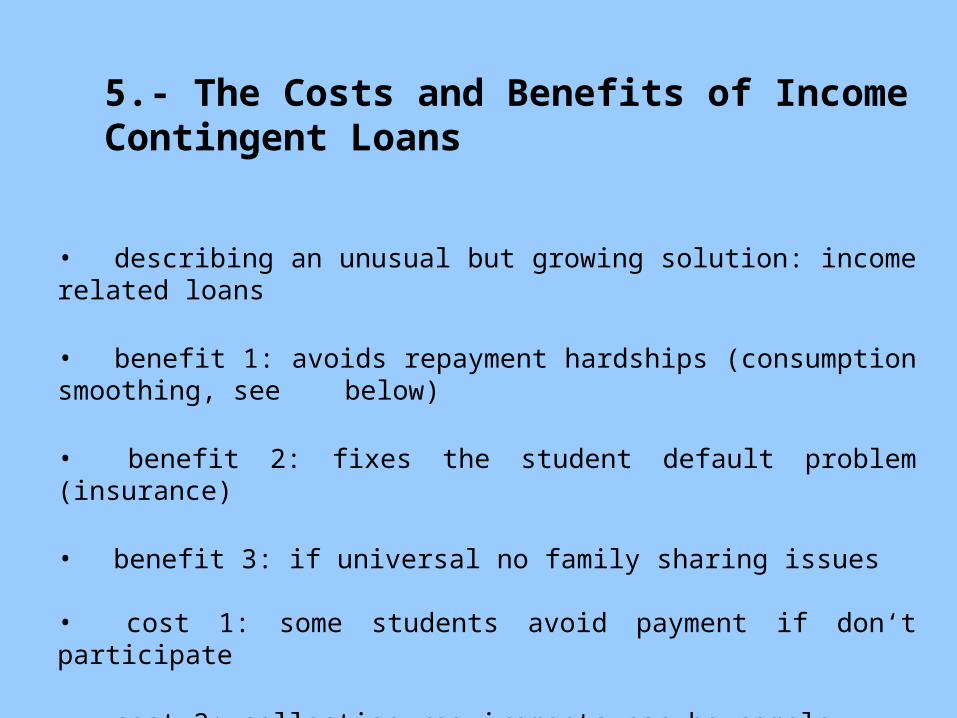
5.- The Costs and Benefits of Income Contingent Loans
• describing an unusual but growing solution: income related loans
• benefit 1: avoids repayment hardships (consumption smoothing, see below)
• benefit 2: fixes the student default problem (insurance)
• benefit 3: if universal no family sharing issues
• cost 1: some students avoid payment if don‘t participate
• cost 2: collection requirements can be complex

6.- An ICL Case Study: Australia`s HECS 1989-2005
• HECS charges described: $3,000-$6,000 pa, different by course. A typical debt is $16,000.
• HECS in operation: recording the tuition debt with the Tax Office
• HECS collection parameters: Table 1
• HECS typical repayments: Figures 5 and 6

Table 1HECS Income Thresholds and Repayment Rates: 2004/05
Below $35,000 Nil
$35,001–$38,987 4
$38,988–$42,972 4.5
$42,973–$45,232 5
$45,233–$48,621 5.5
$48,622–$52,657 6
$52,658–$55,429 6.5
$55,430–$60,971 7
$60,972–$64,999 7.5
HECS repayment incomes in the range: (A$) per year
Per cent of income applied to repayment
$65,000 and above 8

$20,000.00
$25,000.00
$30,000.00
$35,000.00
$40,000.00
$45,000.00
$50,000.00
$55,000.00
$60,000.00
20 21 22 23 24 25 26 27 28 29 30 31 32 33 34 35
Age
Dol
lars
Gross Income
After HECS
Figure 5. Typical male repayments: Full time graduates

$20,000.00
$25,000.00
$30,000.00
$35,000.00
$40,000.00
$45,000.00
$50,000.00
$55,000.00
$60,000.00
20 21 22 23 24 25 26 27 28 29 30 31 32 33 34 35
Age
Dol
lars
Gross Income
After HECS
t
Figure 6. Typical female repayments: Full time graduates

0.00%
1.00%
2.00%
3.00%
4.00%
5.00%
6.00%
7.00%
22 23 24 25 26 27 28 29 30 31 32
AGE
Pe
rce
nta
ge
Figure 7 Bank loan repayments compared to HECS : Full time graduates
Illustrating the benefits of income contingent loans compared to bank loans: consumption
smoothing
• Compare bank loans of same amount with HECS
• Assume graduate is unemployed from age 24 to 27
• Assume graduate is in part-time work from 28 to 32
• Showing consumption smoothing: Figures 6 and 7

$-
$500.00
$1,000.00
$1,500.00
$2,000.00
$2,500.00
$3,000.00
$3,500.00
22 23 24 25 26 27 28 29 30 31 32 33 34 35 36 37 38 39 40
Age
Inco
me,
Loa
n P
aym
ents
Bank Payment HECS Payment Male HECS Payment Female
Figure 8 Bank loan repayments compared to HECS :
Unemployed and Part time graduates

0.00%
5.00%
10.00%
15.00%
20.00%
25.00%
22 23 24 25 26 27 28 29 30 31 32 33 34 35 36 37 38 39
AGE
Pe
rce
nta
ge
HECS BANK
UnemployedFull Time Full TimePart Time
Figure 9 Bank loan repayments compared to HECS as a proportion of income:
(females, same as males)

• The effect of HECS on revenue:
Figure 10
Actual and Projected HECS Revenue: 1989–2005 (A$)
0
200
400
600
800
1000
1200
1400$m Up Front and Voluntary Repayments
Compulsory Repayments
Total
• The effect of HECS on domestic student numbers: an increase of 55-70 %

• The effect of HECS on access:Figure 11
Proportion of 18 year olds Undertaking a Degree by Family Wealth
0%
10%
20%
30%
40%
50%
60%
1988 1998
% Lowest quartile Middle quartiles Top quartile
Source: Chapman and Ryan (2002).

7.- The Critical Role of Collection
Minimum Requirements in Summary:
• a reliable, preferably universal, system of unique identifiers;
• accurate record-keeping of the liabilities of students (while studying);
• a collection mechanism with a sound and, if possible, a computerised record-keeping system; and
• an efficient way of determining with accuracy, over time, the actual incomes of former students.

8.- Changes Internationally Towards ICL
. Yale (1970s) (failed)
. Sweden (mid-1980s) (blunt form)
. Australia (1989) (first to use tax office)
. New Zealand (1992)
. the US (1994, modified 2007)
. South Africa (1994)
. the UK (1997, expanded considerably in 2006)
. Thailand, 2007 (only)
. Hungary, 2003
. Canada (?), 2009
. Malaysia, 2010
. Ireland, 2010
. Under consideration in many other countries: Germany, Colombia, EU, Israel, PNG
9.- Conclusions• the economically and socially advantaged derive large benefits
from higher education
• thus, charging low or no tuition is socially inequitable
• tuition revenue can provide extra finances for higher education efficiency and growth (or assisting other areas of education)
• Intervention is needed, but there are important problems with bank loans
• ICL provide an equitable system: only pay when you are able
• thus ICL provides default insurance and consumption smoothing
• ICL can be used for income support as well as tuition
• many countries currently have adopted or are adopting ICL, but not all
BUT: the collection mechanism of ICL is critical to success and these approaches cannot be used in many countries

Thank you