tesco plc annual report and financial statements … cover front cover tesco plc annual report and...
TRANSCRIPT

BACK COVER FRONT COVER
Tesco PLC Annual Report and Financial Statements 2014
Tesco PLC Tesco House Delamare Road Cheshunt Hertfordshire EN8 9SL
www.tescoplc.com/ar2014
IFC Tesco at a glanceIFC Highlights 01 Chairman’s statement03 Report from the Chief Executive08 Market overview10 Business model12 Financial review16 Key performance indicators19 Other statutory disclosures20 Principal risks and uncertainties
26 Board of Directors28 Executive Committee30 Corporate governance report41 Directors’ remuneration report62 Directors’ report
64 Statement of Directors’ responsibilities65 Independent auditors’ report to the members
of Tesco PLC69 Group income statement70 Group statement of comprehensive income71 Group balance sheet72 Group statement of changes in equity73 Group cash flow statement73 Reconciliation of net cash flow to movement
in net debt note74 Notes to the Group financial statements122 Tesco PLC – Parent Company balance sheet123 Notes to the Parent Company financial statements131 Independent auditors’ report to the members of
Tesco PLC (Parent Company financial statements)
132 Supplementary information (unaudited)143 Financial calendar143 Glossary144 Five-year record
Strategic report
Corporate governance
Financial statements
Other information
There’s a lot more content online
Go online to find out more about our performance, hear from our leadership team and explore our business in more detail.
You’ll find PDF and Excel downloads of our financial statements too. Visit www.tescoplc.com/ar2014
Contents
OUTSIDE FLAP
Tesco PLC
Annu
al Rep
ort and Financial S
tatements 2014

IFC Tesco at a glanceIFC Highlights 01 Chairman’s statement03 Report from the Chief Executive08 Market overview10 Business model12 Financial review16 Key performance indicators19 Other statutory disclosures20 Principal risks and uncertainties
26 Board of Directors28 Executive Committee30 Corporate governance report41 Directors’ remuneration report62 Directors’ report
64 Statement of Directors’ responsibilities65 Independent auditors’ report to the members
of Tesco PLC69 Group income statement70 Group statement of comprehensive income71 Group balance sheet72 Group statement of changes in equity73 Group cash flow statement73 Reconciliation of net cash flow to movement
in net debt note74 Notes to the Group financial statements122 Tesco PLC – Parent Company balance sheet123 Notes to the Parent Company financial statements131 Independent auditors’ report to the members of
Tesco PLC (Parent Company financial statements)
132 Supplementary information (unaudited)143 Financial calendar143 Glossary144 Five-year record
Strategic report
Corporate governance
Financial statements
Other information
There’s a lot more content online
Go online to find out more about our performance, hear from our leadership team and explore our business in more detail.
You’ll find PDF and Excel downloads of our financial statements too. Visit www.tescoplc.com/ar2014
Contents

INSIDE FRONT COVER
AsiaUK Europe Tesco Bank
68% 16% 14% 2%66% 21% 7% 6%
Highlights
Our strategic priorities
£43.6bnRevenue±
313,923colleagues◊
£10.3bnRevenue±
96,085colleagues◊
£9.3bnRevenue±
91,788colleagues◊
3,748colleagues◊
£1.0bnRevenue±
0.0%Revenue growth±
3,378stores
+2.6%Revenue growth±
2,417stores
(0.6)%Revenue growth±
1,510 stores
7mcustomer accounts
(1.8)%Revenue growth±
£2,191mTrading profit
1st market position
£692mTrading profit
1st or 2ndin three markets
£238mTrading profit
1st or 2nd in five markets
£6bnsavings deposits
£194mTrading profit
(3.6)%Trading profit growth
16m loyalty scheme members
(5.6)%Trading profit growth
14m loyalty scheme members
(27.7)%Trading profit growth
8mloyalty scheme members
86%of product sales are online
+1.6%Trading profit growth
•Trading profit grew by 19% excluding income from the legacy insurance distribution agreement and fair value release•Good growth in core banking products
with customer accounts for credit cards, loans, mortgages and savings up 14%•Despite challenging market conditions
for our insurance business, strong growth in Home Insurance following its relaunch• In its first full year, our mortgage
product has made good progress with balances reaching £0.7 billion•On track to launch current accounts in
the first half of 2014/15, designed to strengthen loyalty and engagement as part of our multichannel offer
•Trading profit reflects challenging conditions, particularly for large stores, and decision to invest in a more compelling offer for customers across the region•Significantly reduced new store
openings and any future investment will be focused on convenience and grocery home shopping•Completed roll-out of grocery home
shopping to all international operations, with the exception of India• Invested in the customer offer across
the region, with improved trading through the second half of the year• In Ireland launched Price Promise, helping
to drive improved customer trust in prices. Worked to emphasise the breadth of our offer and points of differentiation
•Regulatory restrictions on opening hours in South Korea, combined with political disruption in Thailand, held back overall performance in Asia•Continued with refresh programme and
store opening programme focused on Thailand and South Korea. Plan to open 1.2 million square feet in Asia in 2014/15, whilst continuing to grow our convenience and grocery home shopping operations•Forming a partnership with China
Resources Enterprise Ltd. giving Tesco a 20% ownership stake in the largest food retail business in China•Entered into an agreement with Trent
Limited, part of the Tata Group, to form a 50:50 joint venture with Trent Hypermarket Limited which operates the Star Bazaar retail business in India
•Strengthened the foundations of the business, in a weakening grocery market•Launched Price Promise, relaunched
finest* range and completed around 300 store refreshes•Tailored the ranges in our Express stores
to local catchments and trialled the ingredients to make our destination stores worth the trip•Large stores and general merchandise
transformation weighed on top-line performance•Extended Click & Collect to 1,750 general
merchandise and 260 grocery locations, helping to build our multichannel offer•Now accelerating plans to deliver the
most compelling offer for customers with sharper prices, improved quality, stronger ranges and better service, in addition to accelerating growth in new channels
Group sales
£70.9bn
Group profit before tax
£2.3bn
Group sales growth
+0.3%
Underlying profit before tax**
(6.9)%
Full-year dividend
14.76p
Underlying diluted earnings per share**†
(7.3)%
* All figures reported on a continuing operations basis, excluding China and the United States which have been treated as discontinued.
± Excludes the accounting impact of IFRIC 13.◊ Based on the number of colleagues at year end.** These figures reflect a year-on-year movement.
See glossary on page 143 for full accounting definitions.
† Calculated on a constant tax rate basis; (5.0)% at actual tax rates.
We are a team of over 500,000 people in 12 markets dedicated to providing the most compelling offer to our customers. With retail operations in the UK, Asia and Europe, we strive to bring the best value, choice and service to millions of customers each week.
Our strategy has been developed to drive sustainable growth through three priorities:
1. Continuing to invest in a strong UK business
2. Establishing multichannel leadership in all of our markets
3. Pursuing disciplined international growth
Tesco at a glance*
Designed and produced by Addison Group
www.addison-group.net
This Report is printed on Revive 100 Pure White Silk paper and has been independently certified on behalf of the Forest Stewardship Council® (FSC). The inks used are all vegetable oil based.
INSIDE FLAP
The future: strategic developments in retailThe backdrop of technology-driven change in the retail sector becomes a more insistent drumbeat every day. Boundaries between the online and offline world are becoming blurred. The challenge, and opportunity, for retailers is not just to have (and be able to operate across) multiple channels. It is to meet the rapid changes in consumer behaviour that we are seeing as technology opens up new horizons for them. The capacity for consumers to communicate instantly with each other, with us and with other retailers is driving completely different expectations for service levels, choice, convenience, indeed the whole shopping experience. A level of customisation and personalisation, unthinkable a decade ago is becoming the norm.
Consequently, being a leading retailer today is not a guarantee of value creation tomorrow. We need to ensure that we are tomorrow’s leading retailer. We had already set ourselves on the path to becoming a leading multichannel retailer to meet this challenge. The accelerating evolution of customer behaviours reinforces us in this choice of direction and has led us in the past year progressively to intensify our actions to deliver this end. This includes not only ensuring a more seamless service for customers but also a business which matches more closely what they want, for example by making our larger stores more compelling destinations in their own right as well as ensuring we offer more convenience stores.
Strategic change requires investment. Our task is to allocate resources to compete effectively in today’s market while giving priority to ensuring that we emerge as winners in the coming multichannel, customer-centric market. Your Board is extremely focused on the need to manage this balance between current and future returns with great care, optimising both without imperilling either. The business is taking decisive steps to free up capital and operational resources, but for the time being the imperative of securing the longer-term future means that our current financial performance remains constrained.
Other business prioritiesIn my foreword last year, I said:
“ Our strategic choices are defined by three parameters: the strength of the Tesco brand; the internet and all the associated developments it is driving; and the potential to leverage our skill and scale internationally…”
I have remarked on the fundamental re-orientation of the business to meet the changes being driven by the internet. Let me say a word about brand; and about how we view our international businesses.
Sir Richard BroadbentChairman
Continuity and change This has been an important year for Tesco. There has been a great deal to occupy us in relation to current trading as weak markets and intense competition persist. At the same time, we continue to reshape the business to address the fundamental changes taking place in the retail market.
The challenging trading conditions of the past year have impacted profits and necessarily remain a focus of management attention. We continue to devote a lot of energy and creativity to creating products and services which customers want to buy at prices they find attractive, through whichever channel they choose and which leave them wanting to visit us again. We have continued to focus on improving the experience for customers with continued investment in colleagues, a big programme of store refurbishment, significant investment in quality and a renewal of product ranges, including the entire finest* range, and a continued emphasis on Building a Better Tesco in the widest sense of the term.
More broadly, however, it has been a year when your company has moved from addressing existing business issues to driving our strategy for future growth and value. There is never a year in which a business focuses solely on one or the other. But it is fair to say that at some point in the past year the balance of where our energies and resources are focused tipped from addressing past issues to investing in the future. We remain focused on the present but we are starting to quicken our pace into the future.
“ Being a leading retailer today is not a guarantee of value creation tomorrow. We need to ensure that we are tomorrow’s leading retailer.”
Visit www.tescoplc.com/ar2014 to hear more from Sir Richard Broadbent and other members of the leadership team
Oth
er info
rmatio
nG
overnan
ceFin
ancial statem
ents
Strateg
ic repo
rt
Tesco PLC Annual Report and Financial Statements 2014 01
Chairman’s statement

through levels of transparency and disclosure which are undoubtedly now world-leading.
We were pleased to welcome Mark Armour to the Board in September last year and the expertise, rooted in a long business career, that he brings to our discussions.
We announced on 4 April that Laurie McIlwee had resigned from his position as Chief Financial Officer. I would like to thank Laurie for his contribution to Tesco over the last 14 years. Together with Philip and the wider team, Laurie has played an important role in our process to transform Tesco and position it to be a winner in the new era of retailing. I and the Board wish him every success for the future.
Financial resultsOur task is to deliver value to our shareholders and we hold this goal in mind in all our deliberations. The trade-offs at the present time are not straightforward and we continually track the balance between future value and current return, seeking to ensure an optimum balance between the two in the context of the rapid changes which the retail sector is experiencing. This is reflected in a number of one-off write-offs associated with significant business or market developments and in our results generally which have again been held back by the factors I have described. Revenues from continuing operations were broadly flat and underlying profit fell by (6.9)%. We understand the importance of the dividend to our shareholders and our confidence in the strategic choices we are making is reflected in an unchanged dividend.
Conclusion In pursuing our goals, the most important resource we have is our colleagues who are the ones who work unfailingly to anticipate and meet the needs of customers, and I and the whole Board are grateful to each and every one of them for all that they do.
The future is a retail world where retailers will need to operate across multiple channels while meeting wholly different customer expectations for service levels, choice, convenience and overall experience. You may be assured that we will compete hard in the current market but the bigger prize we seek on your behalf is to utilise the unique assets and resources of Tesco to ensure we emerge as leaders in the future world of retailing.
Sir Richard BroadbentChairman
The Tesco brandRe-building the Tesco brand to become synonymous again with value, choice and quality, to be seen again as unerringly on the customers’ side, is central to our future. In the multichannel world we are moving into, what you are known for will be as important as the channels through which you sell. We have and will continue therefore the patient work to strengthen trust in our brand. This is not without its cost but we believe it is as important an investment as any other part of our strategy.
Values are central to any brand and last year we took the major step of introducing a new Value: we use our scale for good. This is evidently a long-term project but the year has seen the first steps taken to embed this sentiment as a touchstone of the business. These are reported in more detail in our separate update of “Tesco and Society” which is being published alongside this report.
International Our priority is to deliver value to our shareholders. The last two years or so have seen us address tough decisions in relation to the international business. That said, we continue to see opportunity to create value internationally by leveraging our skills and scale in relatively rapidly growing economies with less developed modern retail sectors where the rate of economic growth coupled with switching to modern retail outlets can generate attractive returns.
Such opportunities need to be taken with focus, flexibility and care. The completion in the past year of our exit from the US underpins the importance of piloting new ventures; of being open to partnership especially in new markets; to selecting rigorously those markets that meet tightly-drawn criteria for investment; and to ensure close management and control of the investments. Many of our choices this year, to enter partnerships in China and India or to invest modestly in an internet start-up in South East Asia, reflect this philosophy of establishing a position of opportunity and testing returns against our criteria as a basis for building long-term, value-enhancing positions.
GovernanceIn common with other public companies, we are meeting this year new standards of disclosure. Our Remuneration Policy is set out on pages 41 to 61 for shareholders to consider. Our accounts as a whole have been considered by the Board in the light of the new test to be “fair, balanced and understandable.” We have taken seriously the spirit as well as the letter of the new Regulations, which are seeking to build trust between the corporate sector and society generally
“ The future is a retail world where retailers will need to operate across multiple channels while meeting wholly different customer expectations for service levels, choice, convenience and overall experience.”
02 Tesco PLC Annual Report and Financial Statements 2014
Chairman’s statement continued

experiencing and we have focused our resources on building on these strengths.
Two years ago, I also outlined plans to deal with the more Tesco-specific issues by improving our offer for customers in the UK through a programme of investment in improved service, quality and price. It was important that we started when we did, and this programme of improvement continues and is being accelerated as competitive conditions intensify. With our strategy already in place, we know what we need to do, and we know that we have to do it even more quickly.
These issues do mean that our headline numbers are not where we want or planned for them to be. We have taken decisive action to improve performance, but the issues we face cannot all be fixed overnight. We need to do more, we need to go faster. I am, however, confident that we have the right strategies and the right team to compete effectively in the current market and to ensure that we emerge a leader in the multichannel world of retailing.
Progress in 2013/14We laid out our three strategic priorities for the business in April 2013:
1. Continuing to invest in a strong UK business2. Establishing multichannel leadership in all
of our markets3. Pursuing disciplined international growth
These priorities are even more relevant today than they were when I announced them and we have made progress on each of them. 1. Continuing to invest in a strong UK business We launched the Building a Better Tesco plan in the UK two years ago and invested £1 billion in six key areas of the business: Service & Staff, Stores & Formats, Range & Quality, Price & Value, Brand & Marketing and Clicks & Bricks. As I made clear at the time, we had been running our stores ‘too hot’ for too long and this investment was long-overdue. I have described below some of the progress we have made under each of the areas of the plan.
(i) Service & StaffHaving taken on 8,000 more colleagues in our stores, this year we’ve focused on providing further customer service training. We have delivered training to more than 250,000 colleagues in the UK, helping them to make every moment with customers matter. We have rescheduled 300,000 hours in the last year with the aim of having the right number of colleagues in our stores, in the right departments and at times of the day that customers need them most.
We are seeing improvements in customer perceptions and the proportion of customers
IntroductionThis year marks my 40th year at Tesco. I have found every single one of those years exciting and challenging, but I have never seen such a pace of change within the industry as I have over the past year, driven by both structural and cyclical forces.
Consumer behaviours are changing more quickly than ever before and that means we have to accelerate our rate of change too. Customers are increasingly using technology in all aspects of their everyday lives and the pace of transition to online shopping has been even faster than we expected. Since taking over as Chief Executive of your business in 2011, I have been clear of the need to transform Tesco to be a leader in the multichannel retail environment. The way the market has developed since then has underlined the importance of this strategic choice.
At the same time, consumer behaviours continue to be strongly influenced by economic conditions which have continued to be tough in the markets in which we operate. Overall, consumers are spending more carefully. They are increasingly choosing to shop online or in smaller convenience stores rather than in large stores, which presents a particular challenge for Tesco given the number of large stores we have around the world.
So we face a mix of Tesco-specific issues and broader issues affecting the whole sector and it is important that we tackle both. This is a large agenda and has kept us fully occupied over the past year.
Thanks to the foresight of my predecessors, over the course of more than 17 years, we’ve already developed strong online and convenience businesses. This has ensured we are well-positioned to address the industry-wide changes we are
Philip ClarkeChief Executive
Our strategy has been developed to drive sustainable growth through three priorities:
1. Continuing to invest in a strong UK business
2. Establishing multichannel leadership in all of our markets
3. Pursuing disciplined international growth
Further discussion around each of these priorities is provided within my report on the following pages.
Our strategic priorities
Visit www.tescoplc.com/ar2014 to hear more from Philip Clarke and other members of the leadership team
Oth
er info
rmatio
nG
overnan
ceFin
ancial statem
ents
Strateg
ic repo
rt
Tesco PLC Annual Report and Financial Statements 2014 03
Report from the Chief Executive

Whilst the direct impact of the meat contamination issue last year was limited to just four of our products, we have made marked improvements in the supply chain, shortening its length and focusing on provenance, greater control and traceability. Through our world-class testing programme, we have tested over 5,300 products and we are the first major retailer to offer two-year direct contracts for beef and lamb farmers right back to the farm gate. More than 300 farmers have signed up already.
(iv) Price & ValueCustomers are actively seeking the best value, and this is more important than ever in a market which has become even more competitive over recent months. It is essential that customers can trust our prices. We want prices to be stable, we want them to be logical and, of course, we want them to be competitive. Our Price Promise has now been in place for over a year and provides instant reassurance to customers that on fresh foods, on own-label and on branded products they will not lose out at Tesco.
Every customer perception measure on price has improved over the last 12 months, but there is still more to do on pricing. We know how important it is to customers that they get the best possible prices on lines that matter most to them. That is why in February, we announced that we are accelerating the pace of change including an initial investment of £200 million in bringing down, and keeping down, prices of key lines, starting with milk, carrots, onions and eggs. You can be sure that we will continue to focus relentlessly on ensuring we are competitive in the marketplace and where we need to do more, we will do more. (v) Brand & MarketingClubcard is more important now than it has ever been before. It is at the core of providing a differentiated, personalised offer and it allows customers to choose how to unlock greater value for themselves. It is at the heart of our unique relationship with our customers and we need to use the power of Clubcard to personalise how we communicate with and serve our customers, providing them with offers and services which are relevant and tailored to how they live their lives. We are using Clubcard to deliver more value for customers and have delivered almost 60 million personalised mailings this year for products that customers buy week in, week out.
A good example of the power of Clubcard and of the advocacy that it can drive is the launch of Clubcard Fuel Save. It is a completely new concept for the UK retail industry. Customers can earn money off their fuel, just by doing their normal shopping. It is inclusive – every penny counts towards the level of saving whether customers are shopping online for their
rating customer service and staff helpfulness as excellent has improved by 40% since 2012. We know we need to do more in order to make service a point of difference for us and to deliver excellent customer service for every customer on every shopping trip. This will remain a key priority for the UK business in the coming year.
(ii) Stores & FormatsOver the last two years, we have refreshed over a third of our UK stores in some way. This work has involved improvements to store environments and has prioritised the departments that matter most to customers, primarily fresh food. We have applied the learnings from each phase of the refresh programme to the next, enhancing our approach as the programme has evolved. As a result, there are some newer initiatives that we will seek to introduce to some of the stores that formed the early part of the refresh programme.
Following the trial stores we completed in 2012/13, our refresh programme to date has been more focused on our Express format and on our smaller Superstores. Given the change in shopping behaviours I mentioned above, our larger stores have been a drag on performance and this is one of the most important areas that we need to address. Therefore, the focus of our refresh programme will now be on reinventing our largest stores to ensure that they are worth the trip for customers.
This year we have tested a number of ingredients for our Extra refresh programme, and begun to roll out a range of components to help make these stores relevant destinations that customers actively choose to visit. In 2014/15 we will refresh 110 of our Extra stores, aiming to make them even stronger destinations. More of the ingredients will appear in these larger stores and typically they will feature strong clothing and general merchandise as well as tailored new food experiences, such as Giraffe, Euphorium, Harris+Hoole and Decks dependent upon the local customer. We will also be working hard to put ‘Food First’ and create the best ranges of fresh foods. We are looking forward to accelerating the appearance of these new features in our stores over the next three years. While this refresh work causes some short-term disruption, the resulting uplifts will be long-lasting.
(iii) Range & QualityThis year, we completed the work to materially improve our 8,000 core Tesco products. Following the relaunch of our finest* range in October, we relaunched our Healthy Living range in January. The customer response to the improvements we have made across our Tesco products has been pleasing, and our own-label sales account for around half of our total UK sales (excluding petrol).
This year, we completed the work to materially improve our 8,000 core Tesco products.
“ It is essential that customers can trust our prices. We want prices to be stable, we want them to be logical and, of course, we want them to be competitive.”
04 Tesco PLC Annual Report and Financial Statements 2014
Report from the Chief Executive continued

T
matter most, more product innovation and quality improvements that delight, new and improved general merchandise ranges and more Extra stores becoming destinations worth a trip in their own right, while our convenience stores will be best in class. Our attention to service levels will intensify and we will deliver exceptional value for customers through Clubcard, just as we are doing through the recent launch of Clubcard Fuel Save.
It is this combination of accelerating growth in new channels while investing in sharper prices, improved quality, stronger ranges and better service that places a strain on short-term results. But it is also this combination of actions and strategic choice that will deliver sustainable long-term value. Where we have moved – for example in ending the UK space race, in focusing on cash and capital discipline, in developing grocery home shopping – others in the sector have followed. Our aim is to continue to lead, recognising that structural change on this scale is a long game and it is in our interest – and your interest – to be a long-term winner.
2. Establishing multichannel leadership in all of our marketsAgainst the backdrop of an accelerating shift to online shopping, our priority of establishing multichannel leadership in all of our markets has never been more relevant. Customers’ behaviours are changing, their expectations of retailers continue to rise and they want to be able to shop however, whenever and wherever they want. We are moving from the first curve of retailing – one of bricks and mortar – to the second curve built around a seamless blend of bricks and clicks.
Establishing multichannel leadership is about putting the customer at the centre of our offer and building a seamless experience around them, whether they want to shop in store, online, in our restaurants, at the Bank or across a combination of them all. Customer journeys are becoming more complex. Customers bounce between channels and devices in whichever way they choose and they expect a seamless experience. Our goal is to provide a zero-defect, end-to-end experience however our customers want to shop. While this presents challenges, it brings lots of opportunities too. Our scale, and our existing strengths from the first curve world, mean we are uniquely placed to lead in this new world.
It is clear to us that those customers who choose to shop across more channels with us spend more and are more loyal to Tesco. Identifying our most valuable customers and enabling them to shop with us however, whenever and wherever they want is our opportunity.
We have some ambitious goals and bold plans for our multichannel business in
weekly shop or popping in store for a sandwich, and they are in control of when they redeem their saving too. In just the first few weeks, more than three million customers saved money on fuel.
Clubcard Fuel Save is one example of the things we are doing to improve loyalty. Loyalty has always been important to Tesco because greater loyalty delivers greater lifetime value.
(vi) Clicks & BricksAs I have already referenced, the pace of the transition to online is rapid. This creates challenges for the industry but we have a market-leading, profitable grocery home shopping business that already generates £2.5 billion of sales in the UK. By any measure our service is industry-leading, and it represents a world-class platform from which to build our position of leadership in the multichannel world. Our Delivery Saver subscription service, which only launched in May 2012, is used by over 200,000 customers. We offer one-hour delivery slots in over 98% of the UK and Grocery Click & Collect is available at 260 locations.
Tesco has always been about making products previously seen as unattainable more accessible. So we were especially proud of the launch of Hudl – our very own tablet – which made tablet devices much more accessible to more families across the UK. It proved extremely popular with customers, exceeding our own expectations, and earned outstanding reviews from the technology press. It was recently named ‘ReThink Retail Technology Initiative of the Year’ at the Retail Week Awards and we plan to launch a second device later this year.
Accelerating our plans for customers in the UKI am clear that we have strengthened the foundations of the UK business, but I am also clear that we need to do more. Above all else, we are focused on delivering the most compelling offer for customers and we are accelerating our plans. Consequently, over the coming months you will see a continuing focus on every day low prices on the lines that
“ The pace of the transition to online is rapid. This creates challenges for the industry but we have a market-leading, profitable grocery home shopping business.”
“ A good example of the power of Clubcard and of the advocacy that it can drive is the launch of Clubcard Fuel Save.”
Establishing multichannel leadership is about putting the customer at the centre of our offer and building a seamless experience around them, whether they want to shop in a store, online, in our restaurants, at the Bank or across a combination of them all.
Oth
er info
rmatio
nG
overnan
ceFin
ancial statem
ents
Strateg
ic repo
rt
Tesco PLC Annual Report and Financial Statements 2014 05

Our work, however, to refresh seven of our largest stores, including our stores in Dongsuwon and Yuseong, has delivered encouraging results. We also continued to grow our convenience portfolio, with the opening of 71 ‘365 plus’ franchise stores.
We have had a challenging year in Thailand, reflecting the impact of the recessionary conditions on consumers and the political unrest. Thailand is one of our largest international markets and we have implemented a strong plan to improve our offer. We have continued to build a strong multichannel business, growing our grocery home shopping and convenience businesses to almost 1,400 convenience stores.
In Malaysia, our performance has been more resilient. We opened two new stores during the year and grew our grocery home shopping business in its first year of operation.
In Europe, we faced weak momentum running into the start of the year and the challenges were common across our markets with larger stores under-performing. Addressing these challenges we have tailored our plans in each market to provide a more compelling fresh offer, focusing on seasonal events and leveraging our sourcing scale and supply chain capability. We have also used our strengths in Clubcard and F&F to drive further improvements in our offer for customers. Turkey in particular has faced very challenging economic and competitive conditions and our focus is on finding a profitable model for a country with excellent long-term potential. We are in early stage discussions with potential partners and, should that not prove successful, we also have a range of realistic alternative options.
An excellent example of our strategy in action is our partnership with China Resources Enterprise Ltd. Subject to the usual regulatory approvals, it will give Tesco a 20% ownership stake of the largest food retail business in China. The joint venture, which will be self-funding going forward, will secure significant cost and operational synergies, and will move us more quickly to profitability in what is one of the world’s most exciting retail markets alongside an expert local partner.
We have entered into an agreement with Trent Limited, part of the Tata Group, to form a 50:50 joint venture with Trent Hypermarket Limited, developing our presence in the Indian market.
We firmly believe that our partnerships in both China and India will allow us to capitalise on these enormously exciting markets in a way which is disciplined in our use of capital and focused on profitable growth.
2014/15: to provide market-leading delivery pricing, twice the number of Click & Collect locations, including alternative locations such as London tube stations, and added-value products and services, including Tesco Bank’s current account and digital wallet.
In the medium term, we will offer one-hour delivery slots to the whole of the UK, for non-food as well as food, and for third-party sellers as well as our own products. By doing so, we will effectively create an e-commerce infrastructure not just for Tesco but for others as well. It is because we have the potential to innovate on this scale that we believe your company will emerge a winner in the coming multichannel world of retailing.
3. Pursuing disciplined international growthLast year, I described our international markets in three cohorts:
•South Korea, Malaysia and Thailand – markets with significant future potential• Ireland, Czech Republic, Hungary,
Poland and Slovakia – markets where we are focused on holding our position and improving returns•China, India and Turkey – markets where
we know we must refocus on a more profitable approach to growth
Through our international businesses we have the opportunity to create value for customers and shareholders by leveraging the know-how that we have gained from nine decades of retailing in addition to using our scale to better effect across the Group. As well as doing even more to improve our customer offer across all our markets, we’ve taken action to ensure that this value is realised across each of these three cohorts.
In line with our third strategic priority, we have applied an even greater level of capital discipline. While we continue to allocate capital to markets where we see greatest potential for growth, our investment is lower than previous years and will fall even further as part of our commitment that Group-wide capital expenditure will be no more than £2.5 billion for at least the next three financial years. We are spending more on our existing space due to our accelerated refresh programme, we are maintaining our level of spend on technology and we’re spending significantly less on new space.
Taking our Asian businesses first, we have a strong position in South Korea and it remains a high-returning business for us, but the sales trends have not been as we would have wanted them to be in the last two years. The regulatory restrictions on store opening hours have continued to impact our sales.
“ Through our international businesses we have the opportunity to create value for customers and shareholders by leveraging the know-how that we have gained from nine decades of retailing.”
06 Tesco PLC Annual Report and Financial Statements 2014
Report from the Chief Executive continued
throughout the business. One of the biggest changes we have made over the last year is in the scale of our engagement. We are joining the global conversation around each of the issues and are working hard to move to a more open, transparent conversation, sharing details of our activities, progress and challenges through our different channels.
We want to make significant, lasting changes, not launch short-term superficial initiatives, and that’s why the focus of this year has been gathering the best possible insights to set long-term direction.
This insight-to-action approach holds the key to our success for the future. It’s the theme of this year’s Tesco and Society report, which is published alongside this report. I’m confident that if we continue down this path over the coming years, we can use our scale for good across society and make what matters better, together.
ManagementI would like to thank Laurie McIlwee for his contribution as CFO over the last five years, in particular to the progress we have made on our strategic priorities in the last three years, and before that his very good work on UK distribution. I wish him all the best for the future. Our Executive Committee has grown stronger this year, welcoming Steve Rigby and David Hobbs, and I am confident that we have the right team to deliver our strategy.
ConclusionWhile we do face short-term challenges, I am excited about the future. We see many more opportunities for the medium term and beyond. As customers’ expectations of retailers evolve and we move into the new era of retail, we believe we are uniquely placed to lead.
Tesco has always innovated for its customers. We have the building blocks which will be essential for us to lead in the future: an industry-leading online offer, unrivalled customer insight through Clubcard, a first-class portfolio of stores, and an outstanding team of over 500,000 colleagues around the world who are working harder every day to deliver for our customers. In a rapidly changing market, retaining flexibility is essential and we are confident that we have a business plan which is right for today’s market, and that we are making the strategic decisions to deliver leadership in tomorrow’s market.
Philip ClarkeChief Executive
Measuring our progressThe single most important theme running through all the developments I have discussed is that stores are no longer necessarily the central point of our relationship with customers. Consequently we are re-orientating the indicators we use to measure and judge our progress to centre them firmly on the customer.
Our customers are at the centre of all our strategic decisions. Quite simply, everything we are doing is designed to retain our loyal customers and attract more new ones who shop across our channels and brands. That is how companies build enduring like-for-like sales. We are prioritising five key performance indicators which will help us measure and communicate our progress against our strategy. These measures place customers, and how they want to shop today right at the heart of everything we do. Focusing on driving customer loyalty and improving sales will lead to sustainable profits, returns and growth over the medium term.
You can read more about our new key performance indicators and how we are measuring performance of the business on pages 16 to 18.
Tesco BankOur vision is to be the bank for Tesco customers and to offer simple, transparent and convenient products which reward our customers’ loyalty and strengthen their bond with our business.
This year we have seen good growth in our core banking products with customer accounts for credit cards, loans, mortgages and savings up 14%. In its first full year of trading, our mortgage product has made good progress with balances reaching £0.7 billion. We remain on track to launch current accounts in the first half of 2014/15.
Using our scale for goodLast year we embraced a new Value for the business, recognising that when you are a large company, there is a particular responsibility to be aware of how your actions affect others. This Value is: we use our scale for good. It is based on the recognition that if we harness the breadth of our skills and scale and work together with our partners in the supply chain, we can make a major contribution to some of the biggest challenges facing the communities in which we operate, across the world. As part of this, we chose to take a lead in addressing three challenges which are particularly relevant to us as a large global retailer and are important to our colleagues and customers: reducing food waste globally, improving health and providing opportunities for millions of young people.
We have started the journey of tackling these issues and we are embedding this new Value
For more information about our new key performance indicators and how we are measuring our progress, see pages 16 to 18.
“ We firmly believe that our partnerships in both China and India will allow us to capitalise on these enormously exciting markets in a way which is disciplined in our use of capital and focused on profitable growth.”
Oth
er info
rmatio
nG
overnan
ceFin
ancial statem
ents
Strateg
ic repo
rt
Tesco PLC Annual Report and Financial Statements 2014 07

%
50
40
30
20
10
Jan‘11
Jan‘14
Jan‘12
Jan‘13
Jan‘09
Jan‘10
Macro trends
Consumer trends
29% in 2009
49% in 2013
£
Get better Get worse
of UK customers use a mobile phone to compare prices or look up customer reviews while in store
As customers increasingly choose to shop across different store formats and online, they are looking to retailers to provide a truly seamless, multichannel offer. These changes to customer behaviour and shopping habits come in the context of continuing economic pressure on household budgets and competitive environments in all 12 of our markets.
Technology is changing the way we consume. The role that it plays in customers’ lives has changed as it becomes a fundamental, essential part of everyday life – a way to stay connected, to manage banking and bills, a part of education and often essential for work. While the pace of adoption of online shopping, particularly for groceries, across our markets is unclear, the transition is certainly well underway. It is not just transactional – consumers are increasingly using the internet to research purchases. In the UK, for example, over half of purchases are influenced by digital channels, 63% of shoppers use their smartphone in store and 43% of customers use a mobile phone to compare prices or look up customer reviews while shopping in store. The influence of the internet is rising across all our markets; two thirds of Malaysians have access to the internet, for example, while almost half of Czechs own a smartphone.
Technology is changing the way we consume. The role that it plays in customers’ lives has changed from being a practical tool to becoming a much more fundamental and essential part of life.
UK consumers: how do you expect the financial position of your household to change over the next few months? Will it...
The rise of technology
Proportion of UK customers shopping three or more times a week for food and groceries
43%
More frequent shopping
In the UK, we use our unique insight from dunnhumby to track how British consumers feel about the economy in general, as well as their own individual situations. Our latest quarterly Consumer Today report shows that although some consumers are starting to feel more upbeat about an improving economy, they are yet to feel the benefit in their own pockets. That is why we remain very focused on helping customers to manage their budgets by offering them great value for money across their shop.
In Central Europe, after a prolonged period of economic pressure, employment levels and consumer confidence are rising, albeit from historically low levels, and real incomes are starting to benefit from lower inflation. Nonetheless, household expenditure is yet to improve significantly.
Although some economies in Asia are rapidly expanding, Thailand fell into recession during the year and consumers struggled with higher levels of debt. Thai consumer confidence was further affected by the escalation of political unrest in the second half of the year. In South Korea consumer confidence has been on a marked upward trend through the year but household debt has reached record highs. Consumer confidence in Malaysia has fallen due to concerns over inflation, low wage growth and a proposed sales tax.
Populations are ageing and household sizes are declining across our markets. In Asia for example, 50% of South Korean households
comprise one or two people – a trend also seen in Thailand, in part due to rapid urbanisation. This changing household composition is one factor leading to an increasing preference for convenience shopping.
We believe that in the longer term rising populations, rapid urbanisation and a growing demand for agricultural products present a risk to global food security and highlight the importance of building sustainable supply chains.*
* More information about our work to increase the sustainability of our supply chain is available in the Tesco and Society Report.
Source: ‘The Consumer Today’, dunnhumby, February 2014
The economic environment has continued to be challenging in all of our markets. Although there are signs of improvement beginning to appear, we don’t yet see consumers spending more.
08 Tesco PLC Annual Report and Financial Statements 2014
Market overview

2009
Source: IGD Datacentre
6,000
5,000
4,000
3,000
2,000
1,000
0
‘000 sq ft
2010 2011 2012 2013
In-store only
In-store + online grocery
In-store + online grocery + general merchandise online
Average annual spend with Tesco
In-store General merchandise online
Online grocery
2.98x
2.04x
Multichannel
Net new space
Industry trends
38%less new space than in 2009
Multichannel cuts across the digital and the physical. It is transactional and non-transactional. It is not just about selling products but also about the way we interact with and engage customers. Being truly multichannel is not just about having a website – it is about putting the customer at the heart of our business and giving them one seamless, joined-up relationship, be that through media, social media or even a customer service desk in store.
Customers value retailers who get it right
In the UK, food retail sales growth has remained subdued over the last year, reflecting the challenging economic environment and continuing pressure on consumers. Although new space has been a key driver of top-line growth for many in the industry, we have seen a reduction in large store openings. In the UK net new space among the largest four grocery retailers in 2013 was 38% lower than in 2009. In many of our markets performance of larger stores has been more challenged.
In response to a consumer desire to shop more frequently and closer to home, many retailers are focusing their opening programmes on the convenience market and smaller format stores. An acceleration in openings of small format stores is something we have also observed in our European and Asian markets.
In the UK the online grocery market has continued to grow strongly, with all the major UK food retailers now operating a grocery home shopping service. We have also seen a rapid growth in Click & Collect over the last year, including trials of non-store collection locations. While online grocery is still in its infancy in Central Europe and Asia we expect it to continue to grow. In Poland, for example, the value of the online food market doubled in size from 2008 to 2011, and is expected to have more than doubled again by 2014.
Across our markets the industry remains highly competitive. In the UK and Europe the discounters continue to grow market share and open new stores. Promotional intensity has remained elevated in the UK and couponing has been a feature in many of our markets.
We have seen continued development of own-brand products by retailers across the globe as they seek to appeal to broader groups of consumers and respond to demand for better value.
In the UK, food retail sales growth has remained subdued over the last year, reflecting the challenging economic environment and continuing pressure on consumers.
With this rise of technology and digital capabilities, consumers are changing the way they shop. Customers want to be able to shop however, whenever and wherever they want. They want to shop across store formats, on smartphones and on tablets. They are no longer choosing just a simple trip to a store, but are making much more dynamic and complex journeys to purchase. They are bouncing between channels, placing an order online and picking it up in store, for example. They are combining fewer big shopping trips with more frequent, top-up shops at convenience stores. As their behaviour is changing their expectations
UK largest four grocery retailers
of retailers are changing too and they are looking to retailers to provide a truly multichannel offer – one that joins up all the different channels to give them a seamless experience.
Value continues to be a priority for consumers across our markets and they are changing the way they shop in order to find the best value for money. They are on the look-out for the best prices, promotions and deals. The sharp rises in fuel prices across the world coupled with pressure on disposable income has amplified a shift to smaller, more frequent, convenience shopping missions. In the UK,
the proportion of customers shopping three or more times a week for food and groceries is up from 29% in 2009 to 49% in 2013.
Health and wellbeing is also a growing trend. Over half of the UK population worry about their health and food is at the centre. Quality fresh food and provenance are priorities for customers across our regions. In Europe and the UK, interest in and awareness of provenance have intensified since the meat contamination issues last year. In Asia wet-markets continue to be a popular choice for fresh meat, fish and poultry.
Oth
er info
rmatio
nG
overnan
ceFin
ancial statem
ents
Strateg
ic repo
rt
Tesco PLC Annual Report and Financial Statements 2014 09

Develop economies of scale
Invest in our offer for custom
ers
Drive customer loyalty
Gro
w s
ales
Innovating our offer Establishing a multichannel
Operating responsi bly
Dev
elop
ing
our p
eopl
e
Building the Tesco brand Using our scale for good
sk
ill an
d sc
ale
Levera
ging
Gro
up
for customers offer for customers
Sell
Insight
Move
Buy
We m
ake what matters better, t
ogeth
er
Core Purpose
Our business model explains what we do and how we deliver our core purpose for customers. It is built up around four core retail activities, insight, buy, move and sell. Our key enablers make us unique and help us to continually do these things better.
Visit www.tescoplc.com/businessmodel to watch a short animation explaining how our business model works
10 Tesco PLC Annual Report and Financial Statements 2014
Business model

The key enablers
T
As a retailer, our business model is based on four core activities. Using our unrivalled insight to understand what customers want, we buy products and services from suppliers, move them through our distribution network and sell them to customers. Most importantly, our core purpose is at the heart of these activities. It is by improving these activities for customers each time they shop with us that we make what matters better, together.
Across the Group, our customers visit us in store, online, or through a combination of different formats and channels. They come to buy their groceries, clothing, general merchandise and services such as telecoms, digital entertainment and banking. We are focused on providing customers with the most compelling offer and the best shopping trip. We work with our suppliers to offer an excellent range of products and services. We move the products through our modern and efficient supply chain into our well-located, multi-format store network, ready for customers to shop with us 24 hours a day.
The core activities form a cycle. To keep customers coming back, we are constantly strengthening our operation. This starts with insight. We listen to customers in a number of ways, including through our monthly Customer Viewpoint surveys in UK stores, in-depth focus groups with our Tesco Families and dedicated Customer Question Time sessions. Combining this feedback with our data, including the unique insight we gain from Clubcard, and acting on it is crucial to our success.
Our seven key enablers are our business strengths. They help us to sustain and improve our core activities. These elements are what make us different and it’s because of these that we are uniquely placed to win.
For example, establishing multichannel leadership and building a seamless offer will enable customers to shop however, whenever and wherever they want, which will mean that we stand out for customers.
Another example is leveraging our Group skill and scale, which is all about sharing our experiences across our operations. We trial in one area of the business and transfer the learnings to another, whether it’s sharing the loyalty scheme blueprint internationally or building capital-efficient grocery home shopping businesses in new markets. Being able to leverage our Group skill and scale makes us unique and helps us to perform the core activities even better.
The momentum of our business model comes from the virtuous circle. By developing economies of scale and investing in an ever-improving customer offer, we drive loyalty and grow sales.
Developing and using economies of scale across our business all over the world, enables us to improve the customer offer by investing in areas such as price, range, quality and service. This year, for example, we completed the roll-out of grocery home shopping to all of our markets (except India). It is a service we developed in the UK and have rolled out in a capital-efficient way to our international businesses, with a great customer response.
Doing the right thing for customers is central to the business model. It’s why one of our Values is ‘no-one tries harder for customers’; we know that if we do the right thing for customers, they will reward us with their loyalty. The more pleased customers are with the shopping trip, the more loyal they will be and the more we will grow our sales. This combination of scale and growth is the driving force of the business model.
38 millionClubcard customers shopping in our 7,300 stores across the Group give us unrivalled insight into consumer habits, trends and preferences.
59.7%of our UK customers shop across two or more channels, including stores and online.
12 marketswith retail operations delivering 85 million customer shopping trips each week.
Oth
er info
rmatio
nG
overnan
ceFin
ancial statem
ents
Strateg
ic repo
rt
Tesco PLC Annual Report and Financial Statements 2014 11
Our core activities
The virtuous circle

Group results 2013/14 (on a continuing operations basis)
52 weeks ended 22 February 2014 2013/14
Growth (actual exchange rates)
Growth (constant exchange rates)
Group sales (inc. VAT)* £70,894m 0.3% (0.2)%
Sales growth excluding petrol 0.9% 0.4%
Group trading profit £3,315m (6.0)% (6.7)%
– UK £2,191m (3.6)% (3.6)%
– Asia £692m (5.6)% (6.8)%
– Europe £238m (27.7)% (32.8)%
– Tesco Bank £194m 1.6% 1.6%
Underlying profit before tax £3,054m (6.9)% (7.7)%
Underlying diluted earnings per share 32.05p (7.3)%** n/a
ROCE (pro-forma inc. China)*** 12.1% (64)bp n/a
Capex £2.7bn 0.9% 0.6%
Statutory profit before tax includes:
– One-off items (inc. Europe asset impairment of £(734)m)
£(801)m
Statutory profit before tax £2,259m 9.8% n/a
China treated as discontinued, including a charge of £(540)m relating to the write-down of goodwill
* Group sales (inc. VAT) exclude the accounting impact of IFRIC 13.** Underlying diluted EPS growth calculated on a constant tax rate basis;
(5.0)% at actual tax rates.*** From an accounting point of view, our existing business in China has to be treated
as a discontinued operation, prior to the planned completion of our partnership with CRE. The pro-forma Group ROCE of 12.1% includes our Chinese business to provide a comparable f igure to the previously disclosed 2012/13 f igure. It is otherwise calculated on a continuing operations basis, excluding one-off charges. Excluding our Chinese business, Group ROCE for 2013/14 was 13.6%.
Group results and strategic updateGroup sales for the year were £70.9 billion, an increase of 0.3% at actual exchange rates. Full-year trading profit for our continuing operations declined (6.0)% to £3.3 billion. This was driven by a decline in UK profits and challenges overseas; specifically, the regulatory impact in South Korea, political disruption in Thailand and continuing challenging conditions in Central Europe. Underlying profit before tax1, which excludes the contribution from property-related items, declined (6.9)% to £3.1 billion. Underlying diluted earnings per share was 32.05 pence.
During the year, we concluded our strategic review in the United States with the sale of the substantive part of Fresh & Easy’s operating business to Yucaipa. We also announced our partnership with China Resources Enterprise Ltd. (CRE), which when completed will give Tesco a 20% ownership stake in the largest food retail business in China. Both of those operations are therefore shown as discontinued.
Reflecting the challenging trading conditions and rapidly changing environments, we have also announced a number of one-off charges. £(801) million2 of these are in continuing operations. These include:
•A non-cash impairment of £(734) million to the carrying values of some stores in the Europe segment.
•An additional £(63) million provision for payment protection insurance and other customer redress at the Bank.
Our statutory profit before tax for the year was £2.3 billion. Despite these charges and a lower contribution from profits and losses on property-related items, Group profit before tax increased by 9.8%, primarily reflecting higher one-off charges last year.
Laurie McllweeChief Financial Officer†
Group sales
£70.9bnUnderlying diluted earnings per share
32.05p
Group trading profit
£3,315mFull-year dividend per share maintained
14.76p
† After 14 years’ service at Tesco, Laurie resigned as Chief Financial Officer on 4 April 2014. He will continue to work with us until October 2014 while a successor is appointed.
1 See Note 1 on page 79 in the Annual Report and Financial Statements 2014 for the definition of underlying profit before tax.
2 See Note 2 on page 81 in the Annual Report and Financial Statements 2014 for the analysis of restructuring and other one-off items.
12 Tesco PLC Annual Report and Financial Statements 2014
Financial review

There is a £(540) million write-down of goodwill in our Chinese business included in discontinued operations. This prudently reflects the lower end of a range of independent valuations of the proposed combination carried out in the second half of the year for accounting purposes. These valuations were, as required by the relevant accounting standards, produced on a standalone existing basis for each business. As such, they do not take account of the strategic value and significant synergies available once the businesses are merged.
Segmental results
UKFull-year sales in the UK declined by (0.1)% and grew by 0.8% excluding petrol. Like-for-like sales declined by (1.3)% including VAT and excluding petrol. This reflects the weaker grocery market, lower inflation across the industry, a continuing drag from our large stores and the work to transform our general merchandise.
UK results
£m % growth
UK sales £48,177m (0.1)%
UK revenue (exc. VAT, exc. impact of IFRIC 13) £43,570m 0.0%
UK trading profit £2,191m (3.6)%
Trading margin (trading profit/revenue) 5.03% (18)bp
Total sales for the year included a 2.1% contribution from new space, lower than last year as we reduced our new store opening programme. We expect it to be lower again next year.
Our full-year trading margin was 5.03%, a reduction of (18) basis points. Trading margin in the first half increased by 2 basis points, but declined by (28) basis points in the second half. This is reflective of our trading performance and our determination to improve and strengthen the customer offer.
AsiaAlthough we have strong high-returning businesses in Asia with leading market positions, their performance this year reflects a number of challenges. Sales grew by 1.4% at constant rates, including a 5.9% contribution from new stores as we continue to invest in these growth markets. Like-for-like sales declined by (4.5)% and our trading margin declined by almost 60 basis points to 6.71%.
Asia results*
£mActual rates
% growthConstant rates
% growth
Asia sales £10,947m 2.7% 1.4%
Asia revenue (exc. VAT, exc. impact of IFRIC 13) £10,309m 2.6% 1.4%
Asia trading profit £692m (5.6)% (6.8)%
Trading margin (trading profit/revenue) 6.71% (59)bp (59)bp * Exc. China, with our subsidiary there now treated as a discontinued operation
following our agreement to partner with CRE.
Although we have annualised the introduction of the DIDA opening hours regulations in South Korea, year-on-year changes in the days and hours of the closures have continued to impact sales. We have worked hard to mitigate the residual effects of the regulation by fully aligning our operations to the current pattern of trading.
In Thailand, our performance has been held back by our own execution as well as external pressures. We implemented a strong plan, including steps to address some parts of our offer which underperformed in the first half. This included the remerchandising and remarketing of our ‘Clubpack’ range of bulk buy products,
a particularly important category for small traders who shop with us. The Thai economy also fell into recession during the year and this has since been compounded by the recent political unrest.
The full-year numbers for Asia benefited from currency, but in the fourth quarter we saw a negative impact, driven by the Thai Baht. Whilst it is difficult to predict currency movements going forward, this impact has continued into the new financial year.
South Korea, Malaysia and Thailand remain markets in which we see significant future potential and opportunities to invest in high-returning stores. We have opened 2.1 million square feet of new space in these markets this year, a reduction compared to the 2.3 million we opened last year. In the coming year we intend to be even more focused with plans to open 1.2 million square feet, with much of it in convenience.
EuropeConditions in Europe have remained challenging this year, particularly for our large stores. Sales declined (2.0)% at constant rates. Like-for-like sales declined by (3.5)% excluding petrol. Our trading profit for the region declined by (27.7)% at actual exchange rates to £238 million, resulting in a 2.57% trading margin. Our decision to invest in the shopping trip through price, quality, range and service resulted in a stronger second half performance. The region’s like-for-like sales have improved through the year, from (5.5)% in the first quarter to (0.6)% in the fourth quarter.
Reflecting the year-on-year decline in the profits of our European businesses, we revised our long-term budgets. These revisions have resulted in the asset impairment of £(734) million to the carrying value of these businesses.
Europe results
£mActual rates
% growthConstant rates
% growth
Europe sales £10,767m (0.4)% (2.0)%
Europe revenue (exc. VAT, exc. impact of IFRIC 13) £9,267m (0.6)% (2.2)%
Europe trading profit £238m (27.7)% (32.8)%
Trading margin (trading profit/revenue) 2.57% (96)bp (111)bp
Poland was a particular focus for us in the year and we are pleased with the customer response to our plans, with an improved like-for-like sales trend through the year.
Ireland has continued to be a difficult market this year with severe pressure on consumer spending, strong competition from the discounters and aggressive couponing activity. Although the launch of Price Promise in the second half has helped improve customer trust in our prices, and we have been working hard to show customers the breadth and points of difference in our offer, our weaker trading performance in this market has impacted on the profitability of our European segment.
We have continued to focus on the heartland of our business in Turkey and the stores there have contributed to a gradual improvement in like-for-like sales over the year. Nevertheless, addressing our position in Turkey is very much a priority.
We continue to be very disciplined in our allocation of capital to Europe. We have reduced capital expenditure in the region by nearly 40% this year, and expect to maintain a similar or lower level of spend in 2014/15. Going forward, new investment will be scarce and focused only on targeted opportunities, primarily in convenience and online.
Oth
er info
rmatio
nG
overnan
ceFin
ancial statem
ents
Strateg
ic repo
rt
Tesco PLC Annual Report and Financial Statements 2014 13
We are spending significantly less on new space. In the UK we have already reduced our investment from 2.5 million square feet at peak. In the coming year, we will open just 0.9 million square feet of net new space. This includes almost 200,000 square feet of franchise space in One Stop. In Europe, we will open just 275,000 square feet of net new space and focus more of our investment on high-returning opportunities in Asia.
PropertyThe market value of our property across the Group currently exceeds £34 billion, with the most significant driver of the reduction since last year being the impact of foreign exchange rates.
Historically, by acquiring and developing high-quality stores we grew the value of our property significantly and unrealised property profits built up. We have had an active programme of releasing value from our property portfolio over many years. We continue to look at our property portfolio in order to maximise value in the most appropriate way for the business as a whole. Excluding one-off items, profits arising from property-related items declined to £180 million this year, in line with the reduction of our sale and leaseback programme outlined last year. This year we have focused on South Korea and we completed a sale-and-leaseback in January comprising four Homeplus stores and accompanying mall space.
PensionOur pension is an extremely valuable benefit for colleagues and one we are proud to offer. IFRS accounting gives a marked-to-market measure of our pension liabilities, based on market conditions which of course can be volatile in the short term, whereas the liabilities are clearly long-term in nature.
Our after-tax IAS 19 pension deficit this year has risen to £2.6 billion, mainly due to a reduction in real corporate bond yields with a subsequent fall in the discount rate used to measure our liabilities. A triennial actuarial valuation will be carried out to measure our liabilities as at 31 March 2014 and this will be completed in 2015.
Return on capital employedWhen we complete our partnership with CRE, our Group return on capital employed will reflect our share of the partnership’s assets and profits or losses. Given that we expect to complete the partnership in the first half of 2014/15 we have given a pro-forma Group ROCE including our Chinese business. On this basis, our Group ROCE was 12.1%, which is a comparable figure to the 12.7% we reported last year. Excluding our Chinese business based on its current accounting treatment as a discontinued operation, our Group ROCE would be 13.6%.
The UK continues to earn the highest returns in the Group and our businesses in Asia are high-returning. Europe’s returns remain below cost of capital. We will continue to limit capital expenditure in this region and focus our efforts on improving our offer for customers in existing stores.
Tesco BankTesco Bank generated £194 million trading profit this year. Excluding income from the legacy insurance distribution agreement which terminated in 2012/13 and fair value releases resulting from the unwind of an acquisition accounting adjustment, it grew by 19%.
We have seen good growth in our core banking products with customer accounts for credit cards, loans, mortgages and savings up 14%. After the first full year of trading, mortgage balances have grown to £0.7 billion and we have helped over 4,000 customers to own their homes. Those customers have borrowed an average of just under £170,000 with a loan-to-value ratio of just over 50%. Reflecting the challenging market conditions, with increased competition driving a marked reduction in premiums across the industry, the profit contribution of our Insurance business was down (17)% this year (excluding legacy income).
Tesco Bank results
£m % growth
Tesco Bank revenue (exc. VAT, exc. impact of IFRIC 13) £1,003m (1.8)%
Tesco Bank trading profit £194m 1.6%
Tesco Bank trading margin (trading profit/revenue) 19.34% 63bp
The Bank will soon complete its suite of products with a current account launching in the first half. We expect the growth in underlying trading profit in 2014/15 to be broadly offset by the investment in current accounts.
Within one-off items, the Bank has made a further increase to the provision for payment protection insurance of £(20) million and a provision of £(43) million for other customer redress.
The Bank’s balance sheet remains strong with good levels of liquidity. Although customer deposits remain the primary source of funding, the funding base was diversified during the year with a credit card securitisation and participation in the Funding for Lending scheme.
Group balance sheet and cash flowNet debt has remained stable year-on-year at £6.6 billion. In the context of declining underlying profit, lower property proceeds and a maintained dividend, this demonstrates our discipline and focus on cash.
Two metrics that we use to guide our internal decisions and which support our discipline to maintain a strong investment grade credit rating are net indebtedness and fixed charge cover. This year net indebtedness rose slightly to 3.16 times and fixed charge cover remained stable at 3.4 times. This year we spent £2.7 billion of capex, or £3.0 billion including China. We are reducing our capital expenditure to no more than £2.5 billion for at least the next three years. A greater proportion of this reduced overall spend is devoted to our existing stores. We are accelerating our refresh programme in the UK and we are also maintaining our level of spend on technology to ensure that we have the necessary capabilities for a truly multichannel offer.
14 Tesco PLC Annual Report and Financial Statements 2014
Financial review continued

* After 14 years’ service at Tesco, Laurie resigned as Chief Financial Officer on 4 April 2014. He will continue to work with us until October 2014 while a successor is appointed.
Our approach to growth and returnsWe laid out this financial framework in April 2013 and it continues to inform our decisions. The framework helps ensure an appropriate balance of growth, returns and cash generation, and outlines what shareholders can expect from Tesco from a financial perspective in the medium term.
The changes we have announced to capital expenditure underpin our commitment to this framework. This moves capital expenditure to the bottom of our 4% down to 3.5% of sales guiderail. This even greater focus on capital discipline will help maintain the commitment to generate positive free cash flow, maintain a strong balance sheet, and continue to maintain a strong dividend.
I wish Philip and the team well and am absolutely confident that Tesco will emerge from this period of unprecedented change in the industry stronger than ever.
Laurie Mcllwee Chief Financial Officer*
Generate positive free cash flow
Trading profit growth
Sustainable ROCE
Dividend growth
•Mid-singledigit
•12%to15%range
•InlinewithunderlyingEPS•Targetcoverofmorethan2times
Allocate capital within range of 4% down to 3.5% of sales
Maintain a strong investment grade credit rating
Financial disciplines Guiderails
Our approach to growth and returns
Oth
er info
rmatio
nG
overnan
ceFin
ancial statem
ents
Strateg
ic repo
rt
Tesco PLC Annual Report and Financial Statements 2014 15

1. Our customers come back time and again 2. New customers choose us
70.0% retained loyal customers
29.1% of new loyal customers
Definition: Percentage of last year’s loyal customers* who are still loyal to TescoCommentary: Doing the right thing for our loyal customers and retaining their loyalty is our first priority. The more we get it right for them, the more all customers will benefit.
Definition: New loyal customers* as a percentage of last year’s loyal customer base Commentary: We want to build our loyal customer base so in addition to retaining our existing loyal customers, we want to attract new ones. Our investments in the customer offer are designed to create long-term value for new customers too.
3. Our customers can shop how they want 4. Our customers use us for more
59.7% customers shopping across channels
64.3% shop the family brands
Definition: Percentage of loyal customers* who in the last 13 weeks have shopped two or more channels**
Commentary: This measure helps us to monitor whether we are providing the truly multichannel offer that customers want in the new era of retailing. We know that customers who shop across channels spend more with us and this measure tracks whether they are shopping between different sized stores, grocery online and services.
Definition: Percentage of loyal customers* who in the last 13 weeks have bought / held products from Bank, Telecoms, Clothing***
Commentary: Our multichannel, multibrand strategy is founded in the belief that the whole is more than the sum of the parts. This measure tracks whether we are building loyalty and value across our brands and channels.
5. Loved by customers
Our final measure is one of customer advocacy. Whilst the first four are functional measures, we know that for our brand to be loved, liked or actively chosen, our emotional connection with our customers must get stronger. Emotionally loyal customers, advocates and fans become brilliant ambassadors and drive
word of mouth, as well as engaging more broadly and deeply with the business. There are many different ways of measuring advocacy, not least using a net promoter score, but they all add up to something similar – do customers like you enough to recommend you to others?
With our strategy now focused on delivering even greater loyalty from our customers, we place even greater emphasis across the business on improving five customer-focused key performance indicators. Whilst we continue to track a range of financial and non-financial measures, it is these five which each of our businesses now uses to gauge progress.
Key performance indicators of our strategic performance We have entered the new, multichannel world of retail and customers’ expectations have changed. Customers have increased access to more and more retailers simply at their search bar on their smartphone and our success will be a result of more customers choosing Tesco in preference to others.
As a result of this fundamental change, we have prioritised our customer-focused measures to track and communicate our progress against the strategy. We believe these five KPIs are more relevant today, during this time of transition and transformation, than some of our historical and short-term measures.
Everything we are doing to create the most compelling offer is designed to retain our most loyal customers, attract new ones and allow them to shop however, whenever and wherever they want to. These measures both allow us to monitor our progress and to create value because they are entirely focused on customers and how they choose to shop. Greater loyalty delivers greater lifetime value so we are tracking the behaviours of our loyal Clubcard customers – those who are most engaged and typically spend more with us. Focusing on our loyal customers is how we are driving the transformation we are going through and is how we will build enduring like-for-like sales.
The measures contained in this section are for our core UK business where they are particularly relevant. They do however apply to every part of our business – whether it’s a store, a category, a country or a department – and we are using them across the Group to drive the behaviours that we believe will lead to long-term success.
* Loyal customers are defined based on their frequency of spend and average weekly spend.** Channels include: large stores, convenience stores, grocery home shopping, Tesco Direct and Wine by the case.*** Current results do not include Blinkbox, Clothing online, Nutricentre, Dobbies and our new coffee shops and restaurants. These will be tracked going forward.
16 Tesco PLC Annual Report and Financial Statements 2014
Key performance indicators
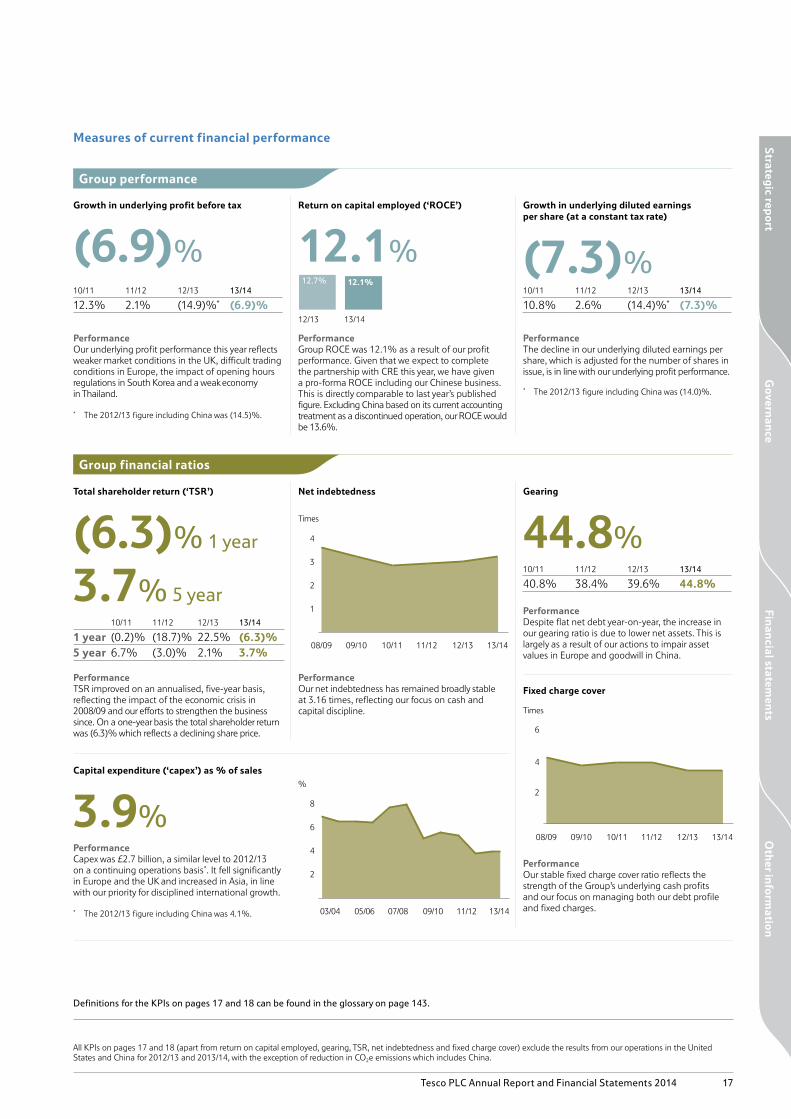
Times
6
4
2
12/1311/1210/1109/1008/09 13/14
11/1209/1005/06 07/0803/04 13/14
%
8
6
4
2
12/13 13/14
12.7% 12.1%
Times
4
3
2
1
12/1311/1210/1109/1008/09 13/14
Group performance
Group financial ratios
Measures of current financial performance
Growth in underlying profit before tax
(6.9)%
Return on capital employed (‘ROCE’)
12.1%
Growth in underlying diluted earnings per share (at a constant tax rate)
(7.3)%10/11 11/12 12/13 13/14
10.8% 2.6% (14.4)%* (7.3)%10/11 11/12 12/13 13/14
12.3% 2.1% (14.9)%* (6.9)%
PerformanceOur underlying profit performance this year reflects weaker market conditions in the UK, difficult trading conditions in Europe, the impact of opening hours regulations in South Korea and a weak economy in Thailand.
* The 2012/13 figure including China was (14.5)%.
PerformanceGroup ROCE was 12.1% as a result of our profit performance. Given that we expect to complete the partnership with CRE this year, we have given a pro-forma ROCE including our Chinese business. This is directly comparable to last year’s published figure. Excluding China based on its current accounting treatment as a discontinued operation, our ROCE would be 13.6%.
PerformanceThe decline in our underlying diluted earnings per share, which is adjusted for the number of shares in issue, is in line with our underlying profit performance.
* The 2012/13 figure including China was (14.0)%.
Total shareholder return (‘TSR’)
(6.3)% 1 year
3.7% 5 year
Net indebtedness Gearing
44.8%10/11 11/12 12/13 13/14
40.8% 38.4% 39.6% 44.8%
PerformanceDespite flat net debt year-on-year, the increase in our gearing ratio is due to lower net assets. This is largely as a result of our actions to impair asset values in Europe and goodwill in China.
10/11 11/12 12/13 13/14
1 year (0.2)% (18.7)% 22.5% (6.3)%5 year 6.7% (3.0)% 2.1% 3.7%
PerformanceTSR improved on an annualised, five-year basis, reflecting the impact of the economic crisis in 2008/09 and our efforts to strengthen the business since. On a one-year basis the total shareholder return was (6.3)% which reflects a declining share price.
PerformanceOur net indebtedness has remained broadly stable at 3.16 times, reflecting our focus on cash and capital discipline.
Capital expenditure (‘capex’) as % of sales
3.9%PerformanceCapex was £2.7 billion, a similar level to 2012/13 on a continuing operations basis*. It fell significantly in Europe and the UK and increased in Asia, in line with our priority for disciplined international growth.
* The 2012/13 figure including China was 4.1%.
Fixed charge cover
PerformanceOur stable fixed charge cover ratio reflects the strength of the Group’s underlying cash profits and our focus on managing both our debt profile and fixed charges.
All KPIs on pages 17 and 18 (apart from return on capital employed, gearing, TSR, net indebtedness and fixed charge cover) exclude the results from our operations in the United States and China for 2012/13 and 2013/14, with the exception of reduction in CO2e emissions which includes China.
Definitions for the KPIs on pages 17 and 18 can be found in the glossary on page 143.
Oth
er info
rmatio
nG
overnan
ceFin
ancial statem
ents
Strateg
ic repo
rt
Tesco PLC Annual Report and Financial Statements 2014 17
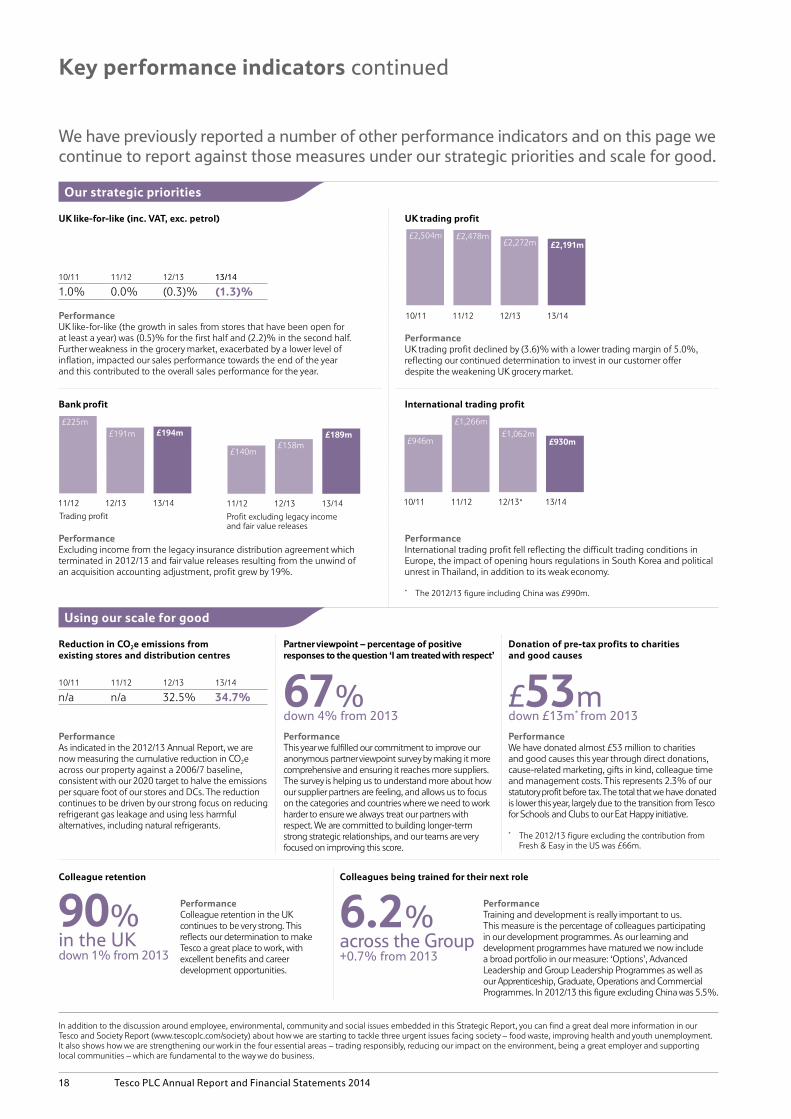
14.7%†
12.7%
10/11 11/12 12/13 13/14
£2,504m £2,478m£2,272m £2,191m
12.7%
10/11 11/12 12/13* 13/14
£946m
£1,266m£1,062m
£930m
14.7%†
11/12 12/13 13/14
Trading profit
£194m£191m£225m
Profit excluding legacy incomeand fair value releases
11/12 12/13 13/14
£189m£158m
£140m
We have previously reported a number of other performance indicators and on this page we continue to report against those measures under our strategic priorities and scale for good.
UK like-for-like (inc. VAT, exc. petrol) UK trading profit
10/11 11/12 12/13 13/14
1.0% 0.0% (0.3)% (1.3)%
PerformanceUK like-for-like (the growth in sales from stores that have been open for at least a year) was (0.5)% for the first half and (2.2)% in the second half. Further weakness in the grocery market, exacerbated by a lower level of inflation, impacted our sales performance towards the end of the year and this contributed to the overall sales performance for the year.
PerformanceUK trading profit declined by (3.6)% with a lower trading margin of 5.0%, reflecting our continued determination to invest in our customer offer despite the weakening UK grocery market.
International trading profitBank profit
PerformanceInternational trading profit fell reflecting the difficult trading conditions in Europe, the impact of opening hours regulations in South Korea and political unrest in Thailand, in addition to its weak economy.
* The 2012/13 figure including China was £990m.
PerformanceExcluding income from the legacy insurance distribution agreement which terminated in 2012/13 and fair value releases resulting from the unwind of an acquisition accounting adjustment, profit grew by 19%.
Reduction in CO2e emissions from existing stores and distribution centres
Partner viewpoint – percentage of positive responses to the question ‘I am treated with respect’
Donation of pre-tax profits to charities and good causes
PerformanceAs indicated in the 2012/13 Annual Report, we are now measuring the cumulative reduction in CO2e across our property against a 2006/7 baseline, consistent with our 2020 target to halve the emissions per square foot of our stores and DCs. The reduction continues to be driven by our strong focus on reducing refrigerant gas leakage and using less harmful alternatives, including natural refrigerants.
10/11 11/12 12/13 13/14
n/a n/a 32.5% 34.7%
PerformanceThis year we fulfilled our commitment to improve our anonymous partner viewpoint survey by making it more comprehensive and ensuring it reaches more suppliers. The survey is helping us to understand more about how our supplier partners are feeling, and allows us to focus on the categories and countries where we need to work harder to ensure we always treat our partners with respect. We are committed to building longer-term strong strategic relationships, and our teams are very focused on improving this score.
PerformanceWe have donated almost £53 million to charities and good causes this year through direct donations, cause-related marketing, gifts in kind, colleague time and management costs. This represents 2.3% of our statutory profit before tax. The total that we have donated is lower this year, largely due to the transition from Tesco for Schools and Clubs to our Eat Happy initiative.
* The 2012/13 figure excluding the contribution from Fresh & Easy in the US was £66m.
£53mdown £13m* from 2013
Colleague retention
90%in the UKdown 1% from 2013
PerformanceColleague retention in the UK continues to be very strong. This reflects our determination to make Tesco a great place to work, with excellent benefits and career development opportunities.
6.2%across the Group+0.7% from 2013
67%down 4% from 2013
PerformanceTraining and development is really important to us. This measure is the percentage of colleagues participating in our development programmes. As our learning and development programmes have matured we now include a broad portfolio in our measure: ‘Options’, Advanced Leadership and Group Leadership Programmes as well as our Apprenticeship, Graduate, Operations and Commercial Programmes. In 2012/13 this figure excluding China was 5.5%.
Colleagues being trained for their next role
Our strategic priorities
Using our scale for good
In addition to the discussion around employee, environmental, community and social issues embedded in this Strategic Report, you can find a great deal more information in our Tesco and Society Report (www.tescoplc.com/society) about how we are starting to tackle three urgent issues facing society – food waste, improving health and youth unemployment. It also shows how we are strengthening our work in the four essential areas – trading responsibly, reducing our impact on the environment, being a great employer and supporting local communities – which are fundamental to the way we do business.
18 Tesco PLC Annual Report and Financial Statements 2014
Key performance indicators continued

GHG emissions data for period 24 February 2013 to 22 February 2014Greenhouse gas (‘GHG’) emission reportingThis year our carbon footprint was 6.37 million tonnes of CO2e. Our overall carbon intensity has decreased by 35% since 2006/07.
Global tonnes of CO2e
Base year 2006/07 2012/13 2013/14
Scope 1 1,346,077 1,434,788 1,370,726Scope 2 2,692,216 3,489,248 3,409,319
Scope 1 and 2 carbon intensity (kg CO2e/sq ft of stores and DCs) 49.89 32.38 30.89Scope 3 370,406 581,701 497,422Scope 3 T&D/WTT emissions 761,213 817,657 1,094,852Total gross emissions 5,169,912 6,323,394 6,372,319CO2e from renewable energy exported to grid – 829 163.63Total net emissions 5,169,912 6,322,565 6,372,155Overall net carbon intensity (total net emissions kg CO2e/sq ft of stores and DCs) 63.88 41.58 41.17
Respecting human rightsAs a global multichannel retailer we buy, move and sell products through our stores and online and our business interacts with millions of people every day. We have a responsibility to respect the human rights of our colleagues, our customers, the communities we operate in and the people who work throughout our supply chain.
Our approachWe are committed to upholding basic human rights and support in full the UN Universal Declaration of Human Rights and the International Labour Organization Core Conventions. We were a founding member of the Ethical Trading Initiative and expect all our suppliers to work towards fully implementing the base code. We investigate allegations of human rights infringements and take appropriate action where necessary. To review our policy visit www.tescoplc.com/society/resources.
In addressing human rights we consider our potential impacts on the following groups as a priority:
•Our colleagues: Our people policies are designed to make Tesco a great place to work where everyone is welcome•Our supply chain: Building strong partnerships with trusted
suppliers will ensure that we deliver high-quality and safe products that are responsibly produced•Our customers and the communities in which we operate:
Our customers want to buy high-quality products that are produced safely and responsibly. We want to be a good neighbour wherever we operate.
Through our scale for good strategy we are addressing some of the key challenges that societies are facing which are closely aligned to specific human rights as defined by the UN. For example:
•Right to education – we are working to provide opportunities for millions of young people•Right to be free from hunger – we are building close
relationships with food banks and food surplus charities who are helping to feed people in need•Right to the enjoyment of the highest attainable standards
of physical and mental health – we are helping our colleagues and customers to lead healthier lives.
The complexity of addressing human rights risks and concerns should not be underestimated. We believe that openness and responsiveness are essential in the identification and remedy of issues. We also understand we can not always address issues alone
and so are committed to working in partnership with relevant stakeholders to make improvements.
Governance and monitoringOur governance committees consider financial and non-financial risks to our business and the Compliance and Social Responsibility Committees in particular consider risks related to our Human Rights Policy, which are maintained on our company risk register. Key elements of our Human Rights Policy are incorporated into our Code of Business Conduct which is reviewed by our senior managers once a year.
Our established ‘protector line’ is primarily used by colleagues and contractors to report suspected breaches of our Code of Business Conduct or internal company policies. Next year we are launching an independent ‘protector line’ service for use by any of our suppliers. Their employees will be able to raise confidentially concerns of wrongdoing in the provision of either goods or services for or on behalf of Tesco. Issues will be recorded, investigated and where necessary action will be taken.
ImprovementIn 2013, we commissioned PricewaterhouseCoopers to carry out an analysis of our Human Rights Policy. Based on these findings we are revising our policy. This includes putting more emphasis on our human rights responsibilities in a revised Code of Business Conduct.
DiversityWe approach diversity in its broadest sense, recognising that successful world-class businesses flourish through embracing intellectual, experiential, geographical and skills diversity as well as other factors such as age, disability, gender, race and sexual orientation. The ratio of male to female colleagues, based on the number of employees at year end, is outlined below:
Male Female
Board of Directors 8 73% 3 27%Senior managers – Directors
667 78% 193 22%
Senior managers – Directors and managers
3,994 70% 1,739 30%
All employees 216,763 43% 288,781 57%
Senior roles are demanding for all – regardless of gender – and we are determined to develop a culture and environment where people can advance. We introduced a ‘Women in Leadership’ development programme in 2011 and so far a total of 440 female colleagues have completed or are currently on the programme.
Greenhouse gas emissions
We have calculated our carbon footprint according to the WRI/WBCSD Greenhouse Gas (‘GHG’) Protocol. We follow the operational control approach and use emission factors from Defra/DECC’s GHG Conversion Factors for Company Reporting 2013. For more information on our carbon targets and how we calculate our carbon footprint, including reporting standards, the definition of Scope 1, 2 and 3 emissions, and ERM CVS’s Independent Assurance Statement, see www.tescoplc.com/society/resources.
Oth
er info
rmatio
nG
overnan
ceFin
ancial statem
ents
Strateg
ic repo
rt
Tesco PLC Annual Report and Financial Statements 2014 19
Other statutory disclosures

A key challenge for any business is to identify the principal risks it faces and to develop and monitor appropriate controls. A successful risk management process balances risks and rewards and relies on sound judgement of their likelihood and impact. The Group maintains a Key Risk Register of the principal risks faced by the Group, including the likelihood and impact of risks and the controls and procedures implemented to mitigate them. Our process for identifying and managing risks is set out in more detail on page 40 of the Annual Report and Financial Statements 2014.
The table below sets out the principal risks faced by the Group, and examples of relevant key controls and mitigating factors. The Board considers these to be the most significant risks faced by the Group. They do not comprise all the risks associated with the Group and they are not set out in any order of priority. Additional risks not presently known to management, or currently deemed to be less material, may also have an adverse effect on the business.
As customers’ disposable income remains stretched, the competitive intensity of the retail marketplace also continues to grow. It is against this backdrop that there has been a trend towards increasing net risk during the year.
Whilst the economic situation in our principal market, the UK, is beginning to show some improvement, there are increased levels of economic, political and regulatory volatility in the wider global marketplace which have increased the assessed level of net risk that the business faces in these areas. The ongoing austerity programmes in Asia and Europe and the fiscal and regulatory measures that apply to the retail sector, for example the DIDA Act in South Korea, have continued to challenge the business. An increase in the rating of economic, political and regulatory risks since last year is principally driven by a revised view of the likely impact of these risks on the business, particularly in the context of the global marketplace and the financial and trading position of the Group.
The ongoing delivery of our multichannel vision, combined with a growing focus on customer data, has also heightened our sensitivity to the impact of technology risks. The impact assessment of technology has therefore increased and this remains a key area of focus.
Significant efforts by management to mitigate risks and strengthen controls have reduced the assessment of the likelihood of certain risks occurring. Notable examples include: product safety and ethical trading, reputation and property. Changes to the Group’s property strategy in the year have also reduced the overall property net risk rating.
Principal risks Key controls and mitigating factors
Business strategy
If our strategy follows the wrong direction or is not effectively communicated or implemented, the business may suffer
The retail industry is undergoing a transformational change in this digital age. The challenge is in balancing investment and the emphasis between traditional and new
Investor support may be impacted if it takes longer than expected to demonstrate that our strategy is the right one, or if we cannot make the investments required
An unclear or unsuccessful strategy against the growth of budget retailers could adversely impact our market share and profitability
Our ability to operate successfully in international markets may be restricted if we do not follow the right strategy in each market, which in turn could adversely impact the Group’s profitability
•Strategic matters are regularly reviewed by the Board and Executive Committee; the Board dedicates two full days a year to testing and challenging Group strategy•Our plan is clear and focused on our three priorities: a strong UK business;
multichannel leadership; and disciplined international growth•A disciplined approach is taken with underperforming assets and decisive
action is taken on strategy as appropriate, including the recent decisions regarding operations in the US, China and India. See the Chairman’s statement and the Report from the Chief Executive on pages 1 to 7 for more details•We continue to invest in the customer offer through initiatives such as Price
Promise, which aim to improve customer perception of our relative price position •The structure of our executive sub-committees is designed to focus
on key risks through the work of the Group Commercial, Compliance, Multichannel, Technology, People Matters Group, Property Strategy and Social Responsibility Committees•Significant resource is invested to communicate strategy effectively to
those delivering it•Consistent operational plans are developed throughout the Group
to ensure delivery•A Steering Wheel balanced scorecard system helps to monitor delivery •Structured stakeholder engagement programmes are conducted; an
investor and analyst seminar was hosted in February 2014 to reiterate our strategic priorities
Financial strategy
Risks relate to an incorrect or unclear financial strategy and the failure to achieve financial plans
There are risks that our financial guiderails will not be achieved, or if achieving them means that the business is stretched in the short-term at the expense of investment in our long-term strategy
Weak performance could put pressure on free cash flow and credit metrics and affect our credit rating
•Financial strategy risks and performance are regularly reviewed by the Board and Executive Committee, with external advice obtained as required •We have set clear expectations for the market with our financial disciplines
and guiderails: improving capital discipline; greater focus on balancing growth with returns; and being more focused on cash rather than margins. See the Financial review on pages 12 to 15 for more details•The Balance Sheet Committee regularly reviews gearing and net
debt management•Consistent operational plans and budgets are developed throughout the
Group to help drive delivery•A Steering Wheel balanced scorecard system helps to monitor delivery•Structured stakeholder engagement programmes are conducted so that
expectations are clear
20 Tesco PLC Annual Report and Financial Statements 2014
Principal risks and uncertainties
Principal risks Key controls and mitigating factors
Competition and consolidation
Failure to compete on areas including price, product range, quality and multichannel service in increasingly competitive UK and overseas retail markets could impact our market share and adversely affect the Group’s financial results
New entrants to the market and the consolidation of competitors through mergers or trade agreements in key markets or geographical areas could adversely impact our market share
•Our strategy to have broad appeal on price, range and format and to take the lead as a multichannel business, allows us to compete in different markets•A more diversified portfolio, such as our new food experience investments
in Giraffe, Harris and Hoole and Euphorium, allows us to take advantage of new retailing opportunities•Our Executive and Multichannel Committees and Trading Groups
regularly review markets, trading opportunities and competitor activities, including discounter growth, convenience and online activities •We continue to innovate and invest in online and multichannel activities,
including our grocery, clothing and general merchandise offerings in the UK and internationally• Increased global marketing efforts aim to maximise the impact of our brand
and intellectual property•Performance is tracked against relevant KPIs and measures that customers
tell us are critical to their shopping experience•Customer perceptions of Tesco and competitors are constantly monitored to
allow us to respond quickly and appropriatelyReputational risk
Failure to protect the Group’s reputation and brand in the face of ethical, legal, moral or operational challenges could lead to a loss of trust and confidence and a decline in customer base, and also affect our ability to recruit and retain good people
If we do not make positive contributions to society and effectively communicate these, this may adversely impact our ability to win and retain customer trust and loyalty
•Tesco Values are at the heart of how we do business to help us to consistently and transparently do the right thing for customers, colleagues and society as a whole•Through our newest Value – ‘we use our scale for good’ – we are tackling
some of the most important issues for society: creating opportunities for young people, improving health, and reducing food waste. These ambitions build on the essential work we do every day as a responsible business: trading responsibly, reducing our impact on the environment, being a great employer and supporting local communities •We have established an external advisory panel of experts to challenge
and help shape the strategic direction of this important work. See our Tesco and Society Report 2014 for more details•Communication and engagement programmes help us to understand
stakeholder views and reflect them in our strategy and policies•Building strong relationships with our trading partners (suppliers) allows
us to recognise and anticipate changes in our industry so we can continue to provide quality, affordable products at a great price and which are sourced responsibly•Our embedded Group Code of Business Conduct, Bribery Act and UK
Groceries Supply Code of Practice guidelines guide our behaviour in dealing with customers, employees, suppliers and other stakeholders•Comprehensive and improved supplier auditing and product surveillance
programmes are in place to minimise the risks associated with product integrity and labour standards•Governance committees, including the Executive, Corporate Responsibility,
Group Commercial, Social Responsibility, Compliance, Multichannel and Technology Committees, guide and monitor policies
Performance
If business units (including the UK) underperform against plan and against competitors, our business may fail to meet the stated strategy in full and impairment of asset values may result
The delivery of long-term goals and sustainable performance may be impaired if the business focuses too heavily on short-term targets
•Our Board, Executive Committee and various operational committees, including the UK Operating Board, meet regularly to review performance risks•All business units have stretching targets based on a Steering Wheel
balanced scorecard system; performance against budgets and KPIs are monitored continually and reported regularly to the Board•Clear budgets, goals and objectives are set for subsidiary CEOs, with a
high proportion of reward based on the achievement of stretching targets•Our diversification strategy minimises the impact of changes in the
economic climate•The regional alignment of shared opportunities leverages skill and scale to
maximise performance•Clear and regular communications ensure that colleagues have confidence
and belief in our long-term strategy and perform at their best without undue focus on short-term performance targets
Oth
er info
rmatio
nG
overnan
ceFin
ancial statem
ents
Strateg
ic repo
rt
Tesco PLC Annual Report and Financial Statements 2014 21
Principal risks Key controls and mitigating factors
Property
The acquisition, development and management of property sites carry inherent risk. Challenges may arise in relation to obtaining planning or other consents; compliance with varying country safety, design and construction standards; tenant management; and maintaining a cost-effective estate with the right balance of freehold and leasehold sites
•Calling an end to the ‘space race’ and our change of strategy in markets such as China has reduced property acquisition and development risk. There is now greater focus on repurposing space and managing our freehold and leasehold balance wisely and profitably •Group Property Strategy, Property Acquisition and related committees
regularly review, and closely control, property acquisition, planning, construction and repurposing processes to ensure standards are met and risks are minimised•Group Property Blueprints are adopted to ensure consistency of approach•Group and country Compliance Committees monitor legal and
regulatory compliance in property activities•Mall management systems are in place to assist site management
Economic
In each country where we operate, we are impacted by the underlying economic environment, the impact of austerity programmes on consumer spending and the fiscal measures that apply to the retail sector
•The external economic outlook is carefully considered when developing strategy and is continuously monitored through the Executive Committee’s review of performance•Country developments are continuously monitored through local CEOs•A central Euro Disaster Committee monitors developments in the Eurozone•We try to anticipate and contribute to important changes in public policy
wherever we operatePolitical and regulatory
In each country where we operate, we may be impacted by legal and regulatory changes, increased scrutiny by competition authorities and political developments relevant to domestic trade and the retail sector
The regulatory landscape is becoming more restrictive in many markets, which may impact how we trade. Examples include stricter rules regarding opening hours, customer, supplier and data protection, corporate crime and heightened banking regulation
•Engagement with governmental and non-governmental organisations in a positive and supportive way allows us to represent the views of our customers and employees and to manage the impact of political and regulatory changes. We try to anticipate and contribute to important changes in public policy wherever we operate •Country developments are continuously monitored through local CEOs•Group and country Compliance Committees, with support from our
Regulatory Ethics and Compliance Team, monitor and guide legal and regulatory compliance •The Tesco Bank Executive and Treating Customers Fairly Board oversee
Tesco Bank’s compliance with regulatory requirements•Compliance with the UK Groceries Supply Code of Practice (‘Code’) is
carefully monitored by our Code Compliance OfficerProduct safety and ethical trading
Failures could damage customer trust and confidence, impacting our customer base and therefore financial results
•Our Group Product Policy is implemented and monitored across the business by Group technical teams•We have changed the way we work, following the horsemeat crisis,
to be more vigilant and to improve our capabilities on anticipating and managing emerging issues; we have also appointed an Incident Management expert to build expertise across the business•Appropriate controls are in place around key risks including product
development; the approval and management of supplier sites; standards in distribution; the monitoring of labour standards in our supplier base; the competency of our people; and management of crises, emerging issues and changes in regulatory standards•Detailed, established procedures are operating globally to ensure
product integrity•Product surveillance programmes are in place, including DNA
traceability programmes•Group and country Compliance Committees monitor the management
of risks associated with products, suppliers and operations
22 Tesco PLC Annual Report and Financial Statements 2014
Principal risks and uncertainties continued

Principal risks Key controls and mitigating factors
Technology
Any significant failure in the IT processes of our retail operations, online and in stores, would impact our ability to trade
As the digital marketplace grows, a lack of investment in technology, or investment in the wrong areas, may constrain multichannel growth and impact our competitiveness
Insufficient investment in, or ineffective implementation of, controls over our online presence could increase the likelihood of a successful cyber-attack
Whilst investment is made in new technologies, there is a risk that investment is not made to maintain the controls over the existing technology, which may impact systems availability and security, including the security of personnel, supplier or customer data
As customers and colleagues become increasingly sensitive to matters of data usage, storage and security, the inherent reputational risks of the IT control environment have increased, in conjunction with the financial and regulatory risks
•Our IT strategy is approved and reviewed by the Executive Committee to ensure that investments in IT systems and innovations improve business efficiency and customers’ shopping experience•We continue to invest in IT to respond to the growing range of IT-related
threats and risks•The Group Technology Committee monitors controls to maintain the
integrity and efficiency of our IT infrastructure and data •The Information Security Committee meets regularly to review the
development and implementation of policies•Rigorous governance processes must be followed for new systems
implementations and ongoing change management of existing IT•The reporting lines of our Group Information Security and IT Security
teams have been merged to allow for better integration and efficiencies in addressing IT security risks•Processes are in place to monitor and deal with significant IT
security incidents• Improved Group Wide Area Network infrastructure and the
standardisation and centralisation of systems across international operations will help to improve the availability and consistency of technology
People
Failure to attract, retain, develop and motivate the best people with the right capabilities at all levels could limit our ability to succeed
The world of multichannel retail is increasingly people-focused and demands new technical and social skills. Our leaders must play a critical role in helping to model the organisation we want to be
•Our People Matters Group (‘PMG’) regularly meets to review and monitor people policies, procedures and risks•Clear processes are in place to ensure we understand and respond to
employees’ needs through our PMG, colleague surveys, regular performance reviews, the involvement of trade unions in relevant markets and the regular communication of business developments•Talent planning and people development is a key objective for each
member of the Executive Committee•Significant investment is made in training, development and incentives,
including through our Executive Committee Talent Cycle, talent planning, leadership development and succession planning for the future needs of the business•The Employment Policy Committee is responsible for the development
of our Employment Policy Blueprint to ensure we have appropriate pay, pension and share plan arrangements to attract and retain good people across the business
Treasury
Effective cash and debt management is critical to the running of the business. Failure to ensure the availability of funds to meet the needs of the business or to manage interest or exchange rate fluctuations or credit risks could limit our ability to trade profitably
•An annual Finance Plan and General Board Authority set out the controls and authority limits for Treasury matters•We expect our financial disciplines and guiderails to have a positive
impact on cash and debt management•The Balance Sheet Committee meets regularly to monitor Treasury risks
and manage the liquidity needs of the business•An annual Treasury Review is carried out by the Executive Committee•Comprehensive Treasury policies set out processes and controls around
the use of financial instruments, hedging, liquidity, bank account management and the segregation of duties required between our back and front offices•Further detail on the management of financial risks can be found in the
‘Financial risks review’ table on page 25 and in Note 22 on page 104 of the Annual Report and Financial Statements 2014
Oth
er info
rmatio
nG
overnan
ceFin
ancial statem
ents
Strateg
ic repo
rt
Tesco PLC Annual Report and Financial Statements 2014 23
Principal risks Key controls and mitigating factors
Tesco Bank
Financial risks taken by Tesco Bank (the ‘Bank’) could adversely impact the Group. The key financial risks relating to the Bank include interest rate, liquidity, credit and insurance risks which are detailed in Note 22 on page 107 of the Annual Report and Financial Statements 2014
Changes to financial regulations, including in relation to credit card interchange fees, could impact banking profitability
A vote in favour of Scottish independence from the UK in September 2014 could impact the fiscal, monetary and regulatory environment within which the Bank, which is headquartered in Edinburgh, operates
•The Bank has a defined ‘Risk Appetite’, approved and regularly reviewed by both the Bank’s Board and the Tesco PLC Board, which sets out the key risks, their optimum ranges, alert limits and the controls required to manage them within their approved tolerance limits•The Bank has formed good working relationships with the Prudential
Regulation Authority and Financial Conduct Authority •There is a comprehensive structure of governance and oversight in place,
including through the Bank’s Governance and Conduct Committees, to help ensure the Bank’s compliance with applicable laws and regulations•The Group remains politically neutral and carefully monitors developments
to enable it to respond to whatever decision is reached on Scottish independence
Pensions
The IAS 19 deficit could increase if there is a fall in corporate bond yields which is not offset by an increase in the pension scheme’s assets
Other risks affecting the deficit are detailed in Note 26 on page 112 of the Annual Report and Financial Statements 2014 and include investment, inflation and life expectancy risks
There are also increasing risks of legal and regulatory changes introducing more burdensome requirements
•We have a diversified investment strategy with internal controls and visibility through our in-house investment team at Tesco Pension Investments•We regularly review our pension risks and changes were introduced in 2012
to reduce the scheme’s life expectancy and inflation risks•The dedicated Pensions Audit and Risk Committee continues to monitor
and scrutinise the internal controls around pension and investment risks•Pensions and Treasury Directors review pension risks on a monthly basis•External expert advisors and Pension Fund Trustees are fully engaged to
consider the funding position and fund performance as well as the impact of legislative and regulatory changes
Fraud, compliance and control
As the business develops new platforms and grows in size, geographical scope and complexity, the potential for fraud and dishonest activity by our suppliers, customers and employees increases
•Procedures and controls are set out across the business to reduce fraud and compliance risks, including our Group Accounting Policy, key financial controls, IT access controls and segregation of duties•Compliance Committees monitor the implementation of, and compliance
with, relevant laws, policies and procedures•Training is provided to help colleagues comply with policies and procedures•Clear behavioural guidance is given to employees through training on Tesco
Values, the Group Code of Business Conduct, the UK Bribery Act and our Whistleblowing service – Protector Line• Internal Audit undertakes a risk-based programme with detailed
investigations into all business areas and reports its findings to management and the Audit Committee•Group Loss Prevention & Security monitors fraud, bribery and business
continuity risks across the Group and reports its findings to the Audit Committee•Store and distribution compliance and technical law and trading reviews
are conducted regularly to reinforce compliance across the Group•A comprehensive compliance programme is in place to promote, monitor
and review compliance with the UK Groceries Supply Code of Practice •The Information Security Committee regularly reviews IT incidents•External Audit rotates its coverage of areas and assessment of controls
Business continuity and crisis management
A major incident, from a natural disaster to a system failure, could impact colleague safety or the Group’s ability to trade
•Appropriate business continuity plans and crisis management plans are in place for each business area and we continue to create and test them for eventualities•Disaster recovery plans are in place for key IT systems and data centres•We have security systems and processes that reflect best practice to review
the risks of incidents or activism across the Group, including liaison with the UK National Co-ordinator for Counterterrorism
24 Tesco PLC Annual Report and Financial Statements 2014
Principal risks and uncertainties continued

Financial risks reviewThe main financial risks faced by the Group relate to the availability of funds to meet business needs, fluctuations in interest and foreign exchange rates and credit risks relating to the risk of default by parties to financial transactions. Further explanation of these risks is set out in Note 22 on page 104 of the Annual Report and Financial Statements 2014. An overview of the management of these risks is set out below for ease of reference and to support a further understanding of the principal treasury risks described in the table above. Details of the main financial risks relating to Tesco Bank and the management of those risks can be found in Note 22 on page 107 of the Annual Report and Financial Statements 2014.
Financial risks Key controls and mitigating factors
Funding and liquidity risk
The risk of being unable to continue to fund our operations on an ongoing basis
•The Group finances its operations by a combination of retained profits, disposals of property assets, debt capital market issues, commercial paper, bank borrowings and leases •New funding of £1.4 billion was raised during the year, including £0.8 billion
from long term debt and £0.6 billion from property disposals. At the year end, net debt was £6.6 billion (2013: £6.6 billion)•The policy is to smooth the debt maturity profile, to arrange funding
ahead of requirements and to maintain sufficient undrawn committed bank facilities and a strong credit rating so that maturing debt may be refinanced as it falls due. At the year end, the Group had a long-term credit rating of BBB+ (negative) from Fitch, Baa1 (negative) from Moody’s and BBB+ (stable) from Standard & Poor’s
Interest rate risk
The risk to our profit and loss account resulting from rising interest rates
•Forward rate agreements, interest rate swaps, caps and floors may be used to achieve the desired mix of fixed and floating rate debt •Our policy is to fix interest rates for the year on a minimum of 40% of
actual and projected debt interest costs of the Group excluding Tesco Bank. At the year end, the percentage of interest-bearing debt at fixed rates was 84% (2013: 75%). The remaining balance of our debt is in floating rate form. The average rate of interest paid on an historic cost basis this year, excluding joint ventures and associates, was 4.5% (2013: 4.8%)
Foreign exchange risk
The risk that exchange rate volatility may have an adverse impact on our balance sheet or profit and loss account
•Transactional currency exposures that could significantly impact the Group Income Statement are managed, typically using forward purchases or sales of foreign currencies and purchased currency options. At the year end, forward foreign currency transactions, designated as cash flow hedges, equivalent to £2,862 million were outstanding (2013: £1,835 million) as detailed in Note 21 on page 99 of the Annual Report and Financial Statements 2014. We translate overseas profits at average foreign exchange rates •We only hedge a proportion of the investment in our international
subsidiaries as well as ensuring that each subsidiary is appropriately hedged in respect of its non-functional currency assets. During the year, currency movements decreased the net value, after the effects of hedging, of the Group’s overseas assets by £1,102 million (last year increase of £420 million)
Credit risk
The risk of loss arising from default by parties to financial transactions
•The Group holds positions with an approved list of counter parties of good credit quality and these counterparties and their credit ratings are routinely monitored
Insurance risk
The risk of being inadequately protected from liabilities arising from unforeseen events
•We purchased assets, earnings and combined liability protection from the open insurance market for higher value losses only•The risk not transferred to the insurance market is retained within the
business with some cover being provided by our captive insurance companies, ELH Insurance Limited in Guernsey and Valiant Insurance Company Limited in the Republic of Ireland. ELH Insurance Limited covers Assets, Earnings and Combined Liability, while Valiant Insurance Company Limited covers Combined Liability only
This Strategic report, which has been prepared in accordance with the requirements of the Companies Act 2006, has been approved and signed on behalf of the Board
Jonathan Lloyd Company Secretary2 May 2014
Oth
er info
rmatio
nG
overnan
ceFin
ancial statem
ents
Strateg
ic repo
rt
Tesco PLC Annual Report and Financial Statements 2014 25
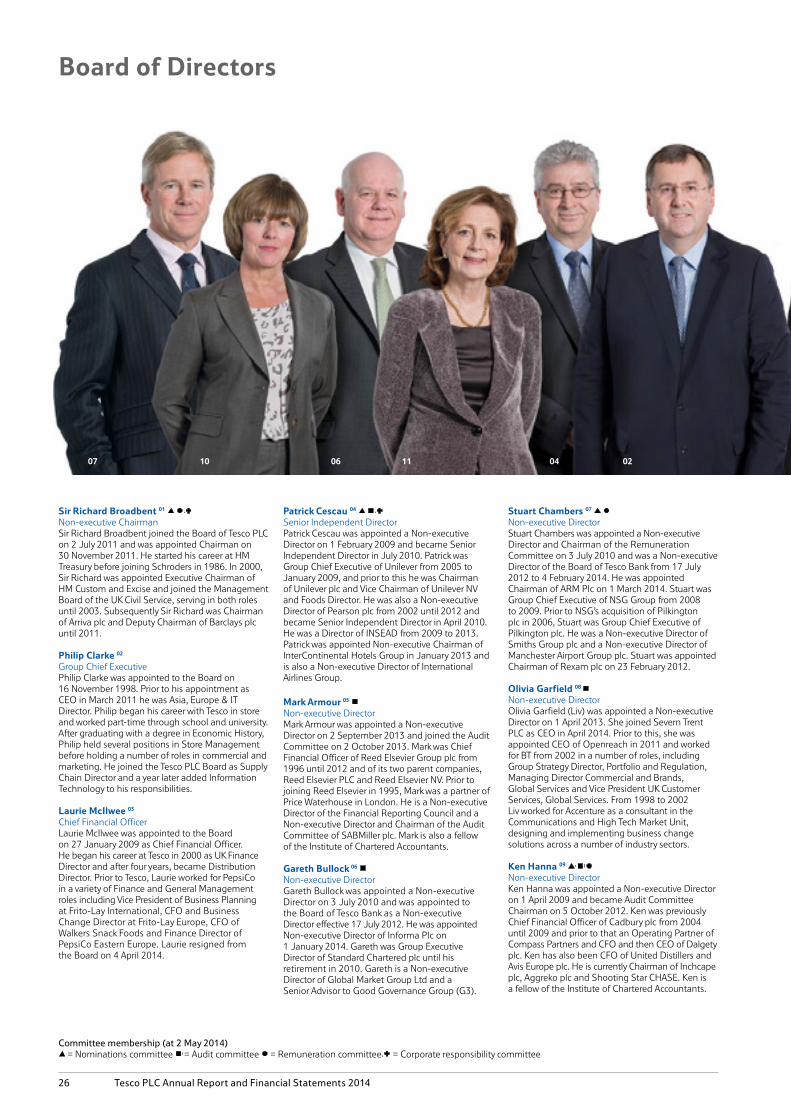
Patrick Cescau 04 Senior Independent DirectorPatrick Cescau was appointed a Non-executive Director on 1 February 2009 and became Senior Independent Director in July 2010. Patrick was Group Chief Executive of Unilever from 2005 to January 2009, and prior to this he was Chairman of Unilever plc and Vice Chairman of Unilever NV and Foods Director. He was also a Non-executive Director of Pearson plc from 2002 until 2012 and became Senior Independent Director in April 2010. He was a Director of INSEAD from 2009 to 2013. Patrick was appointed Non-executive Chairman of InterContinental Hotels Group in January 2013 and is also a Non-executive Director of International Airlines Group.
Mark Armour 05 Non-executive DirectorMark Armour was appointed a Non-executive Director on 2 September 2013 and joined the Audit Committee on 2 October 2013. Mark was Chief Financial Officer of Reed Elsevier Group plc from 1996 until 2012 and of its two parent companies, Reed Elsevier PLC and Reed Elsevier NV. Prior to joining Reed Elsevier in 1995, Mark was a partner of Price Waterhouse in London. He is a Non-executive Director of the Financial Reporting Council and a Non-executive Director and Chairman of the Audit Committee of SABMiller plc. Mark is also a fellow of the Institute of Chartered Accountants.
Gareth Bullock 06 Non-executive DirectorGareth Bullock was appointed a Non-executiveDirector on 3 July 2010 and was appointed to the Board of Tesco Bank as a Non-executive Director effective 17 July 2012. He was appointed Non-executive Director of Informa Plc on 1 January 2014. Gareth was Group Executive Director of Standard Chartered plc until his retirement in 2010. Gareth is a Non-executive Director of Global Market Group Ltd and a Senior Advisor to Good Governance Group (G3).
Stuart Chambers 07 Non-executive DirectorStuart Chambers was appointed a Non-executive Director and Chairman of the Remuneration Committee on 3 July 2010 and was a Non-executive Director of the Board of Tesco Bank from 17 July 2012 to 4 February 2014. He was appointed Chairman of ARM Plc on 1 March 2014. Stuart was Group Chief Executive of NSG Group from 2008 to 2009. Prior to NSG’s acquisition of Pilkington plc in 2006, Stuart was Group Chief Executive of Pilkington plc. He was a Non-executive Director of Smiths Group plc and a Non-executive Director of Manchester Airport Group plc. Stuart was appointed Chairman of Rexam plc on 23 February 2012.
Olivia Garfield 08
Non-executive DirectorOlivia Garfield (Liv) was appointed a Non-executive Director on 1 April 2013. She joined Severn Trent PLC as CEO in April 2014. Prior to this, she was appointed CEO of Openreach in 2011 and worked for BT from 2002 in a number of roles, including Group Strategy Director, Portfolio and Regulation, Managing Director Commercial and Brands, Global Services and Vice President UK Customer Services, Global Services. From 1998 to 2002 Liv worked for Accenture as a consultant in the Communications and High Tech Market Unit, designing and implementing business change solutions across a number of industry sectors.
Ken Hanna 09 Non-executive DirectorKen Hanna was appointed a Non-executive Director on 1 April 2009 and became Audit Committee Chairman on 5 October 2012. Ken was previously Chief Financial Officer of Cadbury plc from 2004 until 2009 and prior to that an Operating Partner of Compass Partners and CFO and then CEO of Dalgety plc. Ken has also been CFO of United Distillers and Avis Europe plc. He is currently Chairman of Inchcape plc, Aggreko plc and Shooting Star CHASE. Ken is a fellow of the Institute of Chartered Accountants.
Sir Richard Broadbent 01 Non-executive ChairmanSir Richard Broadbent joined the Board of Tesco PLC on 2 July 2011 and was appointed Chairman on 30 November 2011. He started his career at HM Treasury before joining Schroders in 1986. In 2000, Sir Richard was appointed Executive Chairman of HM Custom and Excise and joined the Management Board of the UK Civil Service, serving in both roles until 2003. Subsequently Sir Richard was Chairman of Arriva plc and Deputy Chairman of Barclays plc until 2011.
Philip Clarke 02
Group Chief ExecutivePhilip Clarke was appointed to the Board on 16 November 1998. Prior to his appointment as CEO in March 2011 he was Asia, Europe & IT Director. Philip began his career with Tesco in store and worked part-time through school and university. After graduating with a degree in Economic History, Philip held several positions in Store Management before holding a number of roles in commercial and marketing. He joined the Tesco PLC Board as Supply Chain Director and a year later added Information Technology to his responsibilities.
Laurie McIlwee 03
Chief Financial OfficerLaurie McIlwee was appointed to the Board on 27 January 2009 as Chief Financial Officer. He began his career at Tesco in 2000 as UK Finance Director and after four years, became Distribution Director. Prior to Tesco, Laurie worked for PepsiCo in a variety of Finance and General Management roles including Vice President of Business Planning at Frito-Lay International, CFO and Business Change Director at Frito-Lay Europe, CFO of Walkers Snack Foods and Finance Director of PepsiCo Eastern Europe. Laurie resigned from the Board on 4 April 2014.
Committee membership (at 2 May 2014) = Nominations committee = Audit committee = Remuneration committee = Corporate responsibility committee
26 Tesco PLC Annual Report and Financial Statements 2014
Board of Directors
0204111007 06

Personalqualities
Relevantskills
Diversity
Experience
Jonathan Lloyd 12
Company SecretaryJonathan Lloyd was appointed Company Secretary to the Board in December 2006. He joined Tesco as Deputy Company Secretary and Corporate Secretariat Director in April 2005 from Freshfields Bruckhaus Deringer. Jonathan is also Company Secretary of Tesco Bank.
Deanna Oppenheimer 10 Non-executive DirectorDeanna Oppenheimer was appointed a Non-executive Director on 1 March 2012 and was appointed to the Board of Tesco Bank as a Non-executive Director effective from 17 July 2012. Deanna held various senior roles at Barclays, including Vice Chair of Global Retail Banking and also as Chief Executive of Europe Retail and Business Banking. She has also served as a Non-executive Director of Catellus and Plum Creek Timber. Deanna is currently CEO of CameoWorks LLC and a Non-executive Director at NCR Corporation and at The AXA Group.
Jacqueline Tammenoms Bakker 11 Non-executive DirectorJacqueline Tammenoms Bakker was appointed a Non-executive Director on 1 January 2009. She was Director General at the Ministry of Transport in The Netherlands from 2001-2007. Previously she held senior positions at Quest International and McKinsey & Co. Jacqueline is also a Non-executive Director of Vivendi, CNH Industrial and TomTom (from 1 May 2014). Jacqueline chairs the Van Leer Group Foundation and is Vice Chair of the Advisory Board to the Rotterdam School of Management.
“ Managing and developing the Board is a continuous process. We seek to achieve an effective balance over time of relevant skills, experience, personal qualities and diversity. Our priority is to foster trust and respect among all Directors supporting them to bring their particular skills and experience together for the benefit of the company.” – Sir Richard Broadbent
Relevant skills
Our Board members bring together extensive experience from technology, retail, finance, banking, HR and strategy.
Experience
Our Board members have broad corporate experience such as being a CEO, CFO or other Executive Director serving on PLC Boards, as well as specific experience in a consumer facing business or international experience.
Personal qualities
Personal qualities are the innate qualities that ensure skills can be applied effectively. They include self-awareness, respect, independence of mind, being a team player and the capacity to function effectively in challenging situations.
Diversity
Our Board represents diversity in its broadest sense. This relates to intellectual and emotional diversity as well as to diversity of age, gender and outlook, bringing together multiple perspectives.
90% of our Board members have previous retail or consumer goods experience.
81% of our Board have served for at least 5 years on PLC Boards or international equivalents.
27% of our Board members are women.
5 new leadership skills were introduced in the business in 2013: empathy, resilience, collaboration, innovation, and responsiveness.
Tesco PLC Annual Report and Financial Statements 2014 27
Oth
er info
rmatio
nG
overnan
ceFin
ancial statem
ents
Strateg
ic repo
rt
Board diversity and experience
01 03 08 09 05 12

Philip ClarkeGroup Chief ExecutivePhilip Clarke was appointed to the Board in 1998 as Supply Chain Director. Prior to his appointment as CEO in March 2011 he was Asia, Europe & IT Director. Philip began his career with Tesco in store during 1974 and worked part-time through school and university. Philip held several positions in Store Management before holding a number of roles in commercial and marketing.
David HobbsGroup Business Planning DirectorDavid joined Tesco in 2002 as UK Operations Development Director and has since held various positions including UK & Ireland Support Office Director, UK Business Planning Director and International Operations Development Director. His international roles included COO in Malaysia and China. He was promoted to Group Business Planning Director in November 2013.
Laurie McIlweeChief Financial OfficerLaurie McIlwee was appointed to the Board in 2009 as Chief Financial Officer*, having joined Tesco in 2000 as UK Finance Director and later Distribution Director. Prior to Tesco, Laurie worked for PepsiCo in a variety of roles including Vice President of Business Planning at Frito-Lay International, as well as CFO and Finance Director roles at a number of PepsiCo subsidiaries.
Benny HigginsCEO Tesco BankBefore joining Tesco Bank, Benny served as Chief Executive Officer of Retail Business at HBOS PLC. Between 1997 and 2005 Benny was Chief Executive of Retail Banking at the Royal Bank of Scotland. Prior to joining RBS, Benny was at Standard Life for 14 years. He has been Chief Executive of Tesco Bank since 2008.
Rebecca ShelleyGroup Corporate Affairs DirectorRebecca joined Tesco in May 2012 as Group Corporate Affairs Director. Prior to Tesco, Rebecca was a partner at Brunswick LLP where she advised a range of companies on financial and corporate reputation issues. From 2000 to 2007, Rebecca worked at Prudential as Group Communications Director and was a member of its Executive Committee.
Matt AtkinsonChief Marketing OfficerMatt joined Tesco in 2011 as Group Marketing and Chief Digital Officer. Before joining Tesco, Matt was the Global CEO of HAVAS’s digital and data businesses. Prior to this, Matt had a diverse background in marketing, brand and agency management.
Steve RigbyGroup Property DirectorSteve joined Tesco in 1995 as Assets and Estates Director, and became European Property Director in 2001. He was promoted to UK Property Acquisition and Estates Director in 2007 and appointed to the UK Leadership Team in 2011. In 2012 he was appointed Chief Property Officer for China. Steve was appointed to the Executive Committee on 1 November 2013 as Group Property Director.
Alison HornerGroup Personnel DirectorAlison joined Tesco in 1999 as a Personnel Manager and was later promoted to Personnel Director for Tesco’s UK operations. After eight years in stores and general merchandise roles she joined the Executive Committee in 2011 as Group Personnel Director, with responsibility for the development of our 500,000 colleagues.
Robin TerrellGroup Multichannel DirectorRobin joined Tesco in February 2013 as Group Multichannel Director. From 1999 Robin worked at Amazon, ultimately as VP & Managing Director, with responsibility for Amazon’s UK and French businesses. Robin has also held senior e-commerce and multichannel roles at Figleaves.com, John Lewis and House of Fraser.
With extensive UK, international and digital experience, our Executive Committee oversees the implementation of the strategy set by the Board and is chaired by the CEO.
* Laurie Mcllwee resigned from the Board on 4 April 2014.
28 Tesco PLC Annual Report and Financial Statements 2014
Executive Committee

Chris BushManaging Director – UKChris joined Tesco in 1982 and has held various positions including Store Manager, Store Director and International Support Office Director. Between 2004 and 2012, he worked abroad as COO Tesco Homeplus, CEO Tesco Malaysia and CEO Tesco Lotus. Chris returned in March 2012 as COO UK and was appointed UK Managing Director in January 2013.
Kevin GraceGroup Commercial DirectorKevin joined Tesco in 1982 and has held a number of roles including Support Office Director, COO of South Korea, CEO of Poland and UK Property Director. Kevin joined the Executive Committee in 2011 and has responsibility for commercial practice across our markets and sourcing from over 70 countries worldwide.
Trevor MastersCEO AsiaTrevor joined Tesco in 1979, starting his Tesco career as a Store Manager, and later a Store Director. Trevor held the role of Operations Director for Extras in the UK during a period which saw the expansion of the Extra estate from 9 to 200 stores. He has also served as CEO Central Europe and became CEO Asia in 2011.
Ken TowleManaging Director – Central Europe and TurkeyKen joined Tesco in 1985 and has held a number of roles including various UK operations roles and CEO of Tesco China. Ken joined the Executive Committee as Internet Retailing Director in 2011, before taking up his current role as Managing Director of Central Europe and Turkey in February 2013.
Jill EasterbrookManaging Director – Developing BusinessesJill joined Tesco in 2001 and has held leadership roles across the Group including Retail Operations, Group Strategy, Corporate Affairs and Clothing (stores and online). As Managing Director – Developing Businesses since January 2013, Jill leads a portfolio of diverse businesses including Ireland, Telecoms, One Stop and Blinkbox.
Mike McNamaraChief Information OfficerMike joined Tesco in 1998, having previously worked at Accenture and BT. He sat on the Board of Tesco.com from its inception in 1999 through to 2006 and led the transition of Tesco.com onto a fully online platform, as well as the national roll-out of the service. Mike is also the Chairman of Tesco’s Hindustan Service Centre.
Jonathan LloydCompany SecretaryJonathan Lloyd was appointed Company Secretary to the Board in December 2006. He joined Tesco as Deputy Company Secretary and Corporate Secretariat Director in April 2005 from Freshfields Bruckhaus Deringer. Jonathan is also Company Secretary of Tesco Bank.
Adrian MorrisGroup General CounselAdrian joined Tesco in September 2012 as Group General Counsel. Prior to Tesco, Adrian worked at BP plc as Associate General Counsel for Refining and Marketing. From 2002 to 2009, Adrian was with Centrica PLC, initially as European General Counsel and then as General Counsel for British Gas.
Tesco PLC Annual Report and Financial Statements 2014 29
Oth
er info
rmatio
nG
overnan
ceFin
ancial statem
ents
Strateg
ic repo
rt
In this sectionThis Corporate Governance Report is intended to provide shareholders with a clear and comprehensive view of the Group’s governance arrangements and how they have operated over the past year.
This year, to improve transparency, we have structured the report as follows:
p30 Introduction from the Chairman
p31 Our corporate governance framework
p31 Corporate governance highlights
p33 Audit Committee Report
p37 Corporate Responsibility Committee Report
p38 Nominations Committee Report
p39 Compliance with the UK Corporate Governance Code
Introduction from the ChairmanThis section of our Report sets out how we manage Tesco to ensure as far as possible that the values you would expect us to operate by are in place and adhered to, that commercial and operational risks are identified and controlled, that we have strategies and plans in place to optimise shareholder value over an appropriate time period and that a proper system of checks and balances is in place without inhibiting the efficient running of the Company.
Our approach to governance remains unchanged. It begins with the recognition that governance is not simply a set of rules but the framework supporting core values which define what is and what is not acceptable. It is an expression of the way we want to conduct ourselves which informs actions and decisions whether or not there is a specific rule for the situation, and which supports the culture and behaviours that we wish to foster.
I remarked last year that the governance framework, and perhaps more importantly the corporate culture and human relationships that underpin all governance frameworks, are operating as we hoped and that we felt that further material changes were unlikely. I am glad to confirm this assessment and consequently there are few new developments to report as the changes I reported on this time last year have settled in and the Board has focused on its task of balancing the short-term competitive and economic pressures with the need to invest to ensure the business is a leader in the world of multichannel retailing.
Sir Richard BroadbentChairman
The Board itself has evolved substantially over the past two years from its historical structure of broadly balanced Executive and Non-executive representation to its current shape of the Chief Executive and Chief Financial Officer being the only Executive members of the Board. It is important to view these changes in the context of management development generally and in particular the development of a strong Executive Committee under Philip Clarke, the individual members of which generally attend Board discussions of matters reflecting their responsibilities. This allows the Board to operate as a smaller group, supporting real, robust and penetrating debate while ensuring continued contact with a range of senior business executives.
Board structure is not set in stone. At any point in time it must reflect the requirements and state of development of the business in order to be effective. The Tesco Board will continue to evolve to best match the needs of the business.
Sir Richard BroadbentChairman
30 Tesco PLC Annual Report and Financial Statements 2014
Corporate governance report

Nominations Committee
Audit Committee
Remuneration Committee
Corporate Responsibility
Committee
Disclosure Committee*
Tesco PLC Board
Commercial Committee
Multichannel Committee
Property Strategy
Committee
Compliance Committee
People Matters Group
Social Responsibility
Committee
Technology Committee
Executive Committee
The work of the Board is supported by five key Committees: the Audit, Corporate Responsibility, Nominations, Remuneration and Disclosure Committees.
The role of the Disclosure Committee includes to assist and inform the Board in making decisions concerning the identification of inside information and make recommendations about how and when the Company should disclose the information in accordance with the Company’s Disclosure Policy. The Committee meets as necessary to consider all relevant matters relating to inside information. It will in particular meet in advance of the release of all trading statements and other announcements of inside information to ensure that they are true, accurate and complete. The Committee met 11 times during the year.
The Committee’s terms of reference can be found at www.tescoplc.com. The Group Chief Financial Officer (‘CFO’) chairs the meetings. Other members of the Committee consist of relevant senior management and Executive Committee members.
Further details on the other Board Committees can be found on pages 33 to 36 (Audit); 37 (Corporate Responsibility); 38 (Nominations); and 41 to 61 (Remuneration). All the Committees report back to the Board after each meeting.
The Board delegates to the Group Chief Executive (‘CEO’) the responsibility for formulating and, after approval, implementing the Group’s strategic plan and for management of the day-to-day operations of the Group.
The Group Executive Committee, which the CEO chairs, supports the CEO in carrying out his role and manages the day-to-day operations of the Group’s business. The Group Executive Committee comprises the CEO and CFO and a number of senior executives. The Group Executive Committee has established a number of sub-committees which assist in its work and ensure:
•Strategic choices are properly considered•New growth opportunities are fully discussed•Progress against the Group’s priorities is reviewed
The membership of the sub-committees comprises a mix of Group Executive Committee members and senior management from relevant functions. The sub-committees report to the Group Executive Committee after each meeting on their work and issues are escalated for discussion and/or decision to the Group Executive Committee or the Board as appropriate.
* Meets when required
Our corporate governance framework
Executive Committee
Corporate governance highlights
Board focus during the yearDuring the year the Board spent its time considering a wide range of matters. These included:
•Strategy•Performance overall and of individual businesses and
functions in the Group•Budgets and long-term plans for the Group•Financial statements and announcements•Reviewing reports from its Committees, notably on
management development, succession and remuneration•Corporate and social responsibility•Pensions•Health and safety•Shareholder feedback and reports from brokers and analysts•Risk management and controls in the Group•Delegated authorities
The Board also had two offsite meetings dedicated to strategy.
In addition to its regular programme of activities, the Board made a number of strategic decisions in the year, which included:
•Divestment of the US-based Fresh & Easy business to Yucaipa•Entry into a joint venture with China Resources Enterprise
Limited in China•Entry into a joint venture with Tata Group in India•Acquisition of 100% of the restaurant group Giraffe in the UK
Changes to the BoardThe Board was pleased to announce the appointment of two new Non-executive Directors during the year. Olivia Garfield joined the Board on 1 April 2013 and Mark Armour joined on 2 September 2013. Both Olivia and Mark bring a wealth of skills and experience to the Board which are detailed in their biographies on page 26. Laurie Mcllwee, Group CFO stepped down from the Board as an Executive Director on 4 April 2014. The Board is commencing a process to find a new Group CFO. We do not anticipate further substantial changes to the size of the Board in the foreseeable future, although, as noted in the Chairman’s introduction, the number of Directors may change with the normal process of Board development.
Changes to the Board since 23 February 2013
Olivia Garfield Non-executive Director Appointed to the Board with effect from 1 April 2013
Mark Armour Non-executive Director Appointed to the Board with effect from 2 September 2013
Laurie Mcllwee Executive Director Resigned from the Board with effect from 4 April 2014
Board
Oth
er info
rmatio
nG
overnan
ceFin
ancial statem
ents
Strateg
ic repo
rt
Tesco PLC Annual Report and Financial Statements 2014 31

The results of the review were considered by the Board, which agreed that the Board had continued to develop and mature and had performed well against the criteria defined in 2012. Some examples of the themes and agreed actions from the 2013/2014 evaluation are summarised below:
Themes Agreed actions
Management information and analysis Certain improvements in the composition, timing and analytic commentary on business and competitor information would be implemented. Arrangements for briefing Directors on commercial business initiatives would be enhanced.
Board meetings, agendas and time allocation
The Board programme would be re-structured to add one additional meeting to ensure adequate time and focus of discussion.
Sustaining contact with the business The Non-executive Directors would have additional opportunities to spend time in different business units and have increased contact with senior management.
A ‘re-induction’ programme would be organised for those Directors appointed more than three years ago.
Board meetingsLast year the Board moved to a pattern of six formal meetings annually, plus a strategy meeting and ad hoc meetings were also arranged to deal with matters between scheduled meetings as appropriate. Board meetings were preceded by a day of Committee meetings and by a dinner the previous evening. Board meetings themselves lasted the majority of the day in most cases. This pattern of meetings was intended to support the Board’s focus on strategic and long-term matters, while ensuring it could discharge its monitoring and oversight role effectively through intensive high-quality discussions and high-quality information flows. The effectiveness of this approach was reviewed at the end of last year and the Board will plan to have seven formal meetings annually henceforth.
Board attendance
Number of possible meetings attended
Actual meetings attended
Non-executive Directors
Sir Richard Broadbent (Chairman) 6 6
Mark Armour† 3 3
Gareth Bullock 6 6
Patrick Cescau 6 6
Stuart Chambers 6 6
Olivia Garfield 6 6
Ken Hanna 6 6
Deanna Oppenheimer 6 5
Jacqueline Tammenoms Bakker 6 6
Executive Directors
Philip Clarke 6 6
Laurie McIlwee 6 6
† Appointed to the Board 2 September 2013
Changes to the Board CommitteesTo ensure appropriate balance and succession potential in the Board’s Committees, a number of changes have been made as detailed in the table below:
Changes to the Board Committees since 23 February 2013
Mark Armour Audit Committee Appointed as a member with effect from 2 October 2013
Olivia Garfield Audit Committee Appointed as a member with effect from 1 April 2014
Jacqueline Tammenoms Bakker
Corporate Responsibility Committee
Appointed as chair with effect from 1 March 2014
Deanna Oppenheimer
Remuneration Committee
Appointed as a member with effect from 1 March 2014
Length of service and independence of Non-executive DirectorsThe length of service and independence of each Non-executive Director is shown below:
Length of service and independence of each Non-executive Director
Non-executive Director
Date of appointment
Full years in post at 2014 AGM
Considered to be independent by the Board
Sir Richard Broadbent
2 July 2011 3 *
Mark Armour 2 September 2013 – ⎷
Jacqueline Tammenoms Bakker
1 January 2009 5 ⎷
Patrick Cescau 1 February 2009 5 ⎷
Ken Hanna 1 April 2009 5 ⎷
Gareth Bullock 3 July 2010 4 ⎷
Stuart Chambers 3 July 2010 4 ⎷
Deanna Oppenheimer
1 March 2012 2 ⎷
Olivia Garfield 1 April 2013 1 ⎷
* Considered independent upon appointment
Board evaluationThis year the Board evaluation was conducted internally and led by the Chairman with the support of the Company Secretary. The Senior Independent Director (‘SID’) led the review of the Chairman’s performance. The evaluation combined the use of a questionnaire completed by each Board member and in-depth interviews with each of the Directors. The scope of the review covered a range of factors relevant to the effectiveness of the Board, including the balance of skills, experience, independence and knowledge of the Board, its diversity and how the Board works together as a unit.
In accordance with the provisions of the Code, the Board last conducted an externally facilitated Board evaluation in 2011/2012, which was facilitated by Egon Zehnder. The intention is to continue with the three-year cycle whereby the Board will conduct an externally led review in one year, followed by internally led reviews in the subsequent two years, one led by the SID and one led by the Chairman.
32 Tesco PLC Annual Report and Financial Statements 2014
Corporate governance report continued

Audit Committee responsibilitiesThe Committee’s terms of reference can be found at www.tescoplc.com. Ken Hanna, Mark Armour, Patrick Cescau and Gareth Bullock all have recent and relevant financial experience.
The key responsibilities of the Committee are to:
•Consider the appointment of the external auditors, their reports to the Committee and their independence, including an assessment of their appropriateness to conduct any non-audit work•Review the financial statements and announcements
relating to the financial performance of the Company•Review the internal audit programme and ensure that the
Internal Audit function is adequately resourced and has appropriate standing within the Company•Discuss with the external auditors the nature and scope
of the audit•Review, and challenge where necessary, the actions and
judgements of management, in relation to the interim and annual financial statements before submission to the Board•Review formally the effectiveness of the external and internal
audit processes•Consider management’s response to any major external or
internal audit recommendations•Review the Company’s plans for business continuity •Review the Company’s plans for the prevention and detection
of fraud, bribery and corruption•Report to the Board on how it has discharged its responsibilities
Audit Committee attendance
MembersNumber of possible meetings attended
Actual meetings attended
Ken Hanna (Chairman) 5 5
Mark Armour* 2 2
Patrick Cescau 5 5
Gareth Bullock 5 5
* Appointed to the Audit Committee on 2 October 2013
The Audit Committee has an integral role in providing confidence in the integrity of the Company’s processes and procedures in relation to internal control, risk management and corporate reporting. The Committee’s role continues to be increasingly challenging due to the changes and uncertainty in the regulatory, economic and political environment in which the business operates.
This year, pursuant to the new requirements under the UK Corporate Governance Code (the ‘Code’) the Committee was requested by the Board to support it in assessing whether the report and accounts were fair, balanced and understandable and provide sufficient information to allow an assessment of the Company. The Code also required new specific disclosures to be made on the work of the Committee, including significant issues which it has considered in relation to the financial statements and how these have been addressed.
During the year the Committee was pleased to welcome Mark Armour as a member. He brings with him a wealth of financial and wider experience gained over many years in business. The Committee is also pleased to welcome Olivia Garfield as a member with effect from 1 April 2014.
Ken HannaAudit Committee Chairman
Audit Committee Report
Ken HannaAudit Committee Chairman
Oth
er info
rmatio
nG
overnan
ceFin
ancial statem
ents
Strateg
ic repo
rt
Tesco PLC Annual Report and Financial Statements 2014 33

Activities during the yearDuring the year the Committee received update reports from a number of businesses, including Tesco Bank, and also from the Disclosure Committee and Compliance Committee. It also received updates from Internal Audit on its work, including findings from its internal audit programme. The Committee considered a variety of matters including the Group Finance Risk Register; fraud, bribery and corruption; business continuity management; the Grocery Supply Chain Compliance Code; whistleblowing arrangements; and non-audit fees.
In relation to the financial statements the Committee: reviewed and recommended approval of the half-yearly results and annual financial statements; conducted impairment reviews; reviewed and recommended dividend levels; reviewed corporate governance disclosures and monitored the statutory audit. The Committee also advised the Board on whether the financial statements, taken as a whole, were fair, balanced and understandable and provide the necessary information to assess the Company’s performance, business model and strategy.
The Committee assessed the effectiveness of the external audit process by means of a detailed questionnaire completed by key stakeholders, including the Board, the Executive Committee,
Significant financial statement reporting issues
Issue How the issue was addressed by the Committee
Going concern basis for the financial statements
The Committee reviewed management’s assessment of going concern with consideration of forecast cash flows, including sensitivity to trading and expenditure plans and potential mitigating actions. The Committee also considered the availability of financing facilities and the capital and liquidity plans of Tesco Bank. Based on this the Committee confirmed that the application of the going concern basis for the preparation of the financial statements continued to be appropriate.
Fixed asset impairment
The Committee assessed management’s impairment testing of property assets, considering the appropriateness of key assumptions and methodologies for both value in use models and fair value measurements. This included review of cashflows, growth rates and discount rates and the use of independent third party valuers. The Group has recognised a £(734)m charge for the impairment of European stores in the year.
China disposal group valuation
The China disposal group is measured at the lower of cost and fair value less costs to sell. The Committee considered the methodology and assumptions used in the valuation including review of cashflows, growth rates and discount rates used, valuation multiples for similar transactions and companies and the appropriate level of synergies to include in the valuation. As part of this procedure, the Committee met with the independent expert valuers engaged by management to assist in the valuation process. A £(540)m write-down to fair value less costs to sell was recognised at year end. See Note 7 to the financial statements.
Goodwill impairment The Committee reviewed management’s process for testing goodwill for potential impairment. This review included consideration of key assumptions, principally cash flow forecasts, long-term growth rates and discount rates. The Committee concurred with management's judgement that no impairment was required. See Note 10 to the financial statements, ‘Goodwill and other intangible assets’ for more details.
Tesco Bank judgemental matters
The Committee reviewed management’s judgements made in relation to Tesco Bank’s provisions for customer redress, loan impairment provisions and insurance reserves. The Committee received detailed reports from management regarding these judgements and interfaced directly with the Bank’s own audit committee and board to develop a detailed understanding of the matters. During the year, an additional £(63)m of provisions for customer redress were recognised. See Note 24 of the financial statements.
Income statement non-GAAP measure presentation
The Committee considered the presentation of the Group financial statements and, in particular, the appropriateness of the presentation of one-off items in the calculation of underlying profit in light of the latest FRC guidance on the matter. It reviewed the nature of items identified and whether treatment was even-handed, consistent across years and appropriately presented movements on items which have an effect over a number of years. The total restructuring and other one-off charge for the year was £(801)m.
The Committee notes that commercial income was an area of focus for the external auditors based on their assessment of gross risks. It is the Committee’s view that whilst commercial income is a significant income for the Group and involves an element of judgement, management operates an appropriate control environment which minimises risks in this area. As a result, the Committee does not consider that this is a significant issue for disclosure in its report.
members of senior management and Internal Audit. The questionnaire assessed external audit in the following areas: qualification; expertise and resources; operational effectiveness; independence and leadership. The results are rated against an ideal standard and compared to prior years to assess the consistency of performance.
The effectiveness of the Internal Audit function was assessed by means of a detailed questionnaire which was also completed by key stakeholders. The assessment covered the Internal Audit function’s understanding of its role and responsibility, its charter, the quality of its communications, its performance and the skills and expertise of the team.
The Committee carried out a review of its effectiveness during the year via the Committee Chairman conducting interviews with key stakeholders and the use of a questionnaire. The Committee concluded that it continues to be effective and has sufficient resources to carry out its duties.
The Committee considered a number of significant issues in the year taking into account in all instances the views of the Company’s external auditors. The issues and how they were addressed by the Committee are detailed below:
34 Tesco PLC Annual Report and Financial Statements 2014
Corporate governance report continued

TrainingThe Committee continually assesses the need for training and the annual agenda provides substantial time for technical updates which are generally provided by external experts. During the year, training was provided on corporate governance developments and accounting and tax developments. Training is also provided on an ongoing basis to meet the specific needs of individual Committee members.
Internal and External AuditIt is essential for the Committee to be able to have an honest and open relationship with both its external and internal auditors. This relationship is developed and maintained through regular private meetings with both PwC and the Head of Internal Audit. Further information regarding the roles of both Internal Audit and External Audit can be found below.
Internal Audit The Internal Audit function is independent of business operations and has a Group-wide mandate. It undertakes a continuous programme to review the internal control and risk management processes with particular reference to the Code. It operates a risk-based methodology, ensuring that the Group’s key risks receive appropriate examination each year. Its responsibilities include:
•Maintaining the Group Key Risk Register•Facilitating oversight of risk management arrangements
across the Group through structured reviews with senior management teams in the UK, Europe and Asia covering our operating businesses and joint ventures •Using the results of these reviews to assist the Executive
Committee to refresh and update the Group Key Risk Register•Reviewing and reporting on the effectiveness of risk
management systems and internal controls to senior management, the Executive Committee, the Audit Committee and ultimately to the Board
External AuditThe Company’s external auditor PricewaterhouseCoopers LLP (‘PwC’) contribute a further independent perspective on certain aspects of the Company’s financial control systems arising from its work, and report both to the Board and the Audit Committee.
PwC have served as the Company’s auditor since 1983 and the last audit tender was carried out in that year. The partner engaged on the audit is changed regularly. The current partner is due to rotate after the year ended February 2017. The Audit Committee keeps under review the ongoing legislative proposals on audit tendering and rotation from the EU and the Competition Commission, now the Competition and Markets Authority, and will implement them in accordance with the suggested timescales.
The engagement and independence of PwC is considered annually by the Audit Committee before it recommends its selection to the Board. The Committee is satisfied that PwC remain independent and are best placed to conduct the Company’s audit for 2014/2015. The Committee therefore recommends that PwC be reappointed as auditors.
The Company has a Non-audit Service Policy for work carried out by PwC. This is split into three categories as explained below:
•Pre-approved work for external auditors – this is predominantly the audit of subsidiary undertakings’ statutory accounts and is audit-related in nature•Work for which Committee approval is specifically required –
this includes transaction work and corporate tax services, and certain advisory services•Work from which the external auditor is prohibited
Oth
er info
rmatio
nG
overnan
ceFin
ancial statem
ents
Strateg
ic repo
rt
Tesco PLC Annual Report and Financial Statements 2014 35

Business area Work undertaken Rationale for use of PwC Amount
Group PwC carried out due diligence work related to the CRE transaction in China.
PwC’s detailed knowledge and understanding of our business and retailing in China meant they were uniquely placed to assist us in this key task. The Committee considered the proposal carefully to ensure that the independence of the due diligence team from the ongoing audit relationship was preserved.
£1.8m
UK PwC carried out consultancy work in the UK around organisational development.
PwC were evaluated against other potential consultants for this work and won the engagement based on the quality of their service offering. Their role was one of facilitation. All reorganisation design decisions were taken by management.
£1.2m
UK, Europe and Asia In Asia PwC carried out tax consultancy principally related to the tax implications of the CRE transaction in China and legislative compliance in South Korea; and, in Europe and the UK, the advice centred around compliance with VAT regulations.
PwC’s understanding of the structure of our business ensured that they were well placed to carry out this work cost effectively.
£0.6m
The fees paid to the auditors in the year are disclosed in Note 3 of the financial statements.
To safeguard auditor objectivity and independence the Committee oversees the process for the approval of all non-audit services provided by PwC. Prior to approval, consideration is given to whether it is in the interests of the Company that the services are purchased from PwC, rather than another supplier.
This year the Committee approved PwC to complete £1.2m of audit-related services. These services principally related to the audit of the accounts of the Tesco China business in relation to the preparation of the China Resources Enterprise Limited (‘CRE’)
shareholder circular required to approve the formation of our joint venture. PwC were best placed to conduct this work as they had previously conducted the audit work for Tesco and were fully aware of the history of our business in China.
Where any significant non-audit related work is required (fee value £300k), the pre-approval of the Committee is specifically required. In total £4.7m (2013: £2.9m) was spent on non-audit fees (being 46% of the total spent with our external auditors) and details of the significant items are shown in the table below:
36 Tesco PLC Annual Report and Financial Statements 2014
Corporate governance report continued
Corporate Responsibility Committee attendance
MembersNumber of possible meetings attended
Actual meetings attended
Sir Richard Broadbent (Chairman) 3 3
Patrick Cescau 3 3
Deanna Oppenheimer 3 3
Jacqueline Tammenoms Bakker 3 3
Corporate responsibility is an integral part of how our business operates. It reflects the inescapable reality that if the values of a business fail to resonate with the values of society, it is endangering long-term prosperity. Tesco is committed to identifying and living the values which are important to our colleagues and customers and the Corporate Responsibility Committee provides a forum to ensure the Board gives adequate attention to this.
Last year we introduced a new Value: we use our scale for good, and during the year we have made considerable progress in embedding that Value into our business. Some of the highlights of our work are described below. The full ambit of the Committee’s work can be gauged by reading the Tesco and Society Report 2014 which accompanies our Annual Report and Financial Statements.
After chairing the Committee for the last two years it has been agreed that I should rotate off as the Chairman of the Committee and that Jacqueline Tammenoms Bakker would take over the chair with effect from 1 March 2014.
Sir Richard Broadbent Corporate Responsibility Committee Chairman
Corporate Responsibility Committee responsibilitiesThe Corporate Responsibility Committee was established in 2012 to ensure that the Board maintains an adequate focus on corporate responsibility in its widest sense. The Committee’s terms of reference are available at www.tescoplc.com.
The key responsibilities of the Committee are to:
•Define the Group’s corporate and social obligations as a responsible citizen and oversee its conduct in the context of those obligations•Approve a strategy for discharging the Group’s corporate
and social responsibilities in such a way as to command respect and confidence
• Identify and monitor those external developments which are likely to have a significant influence on the Group’s reputation and/or its ability to conduct its business appropriately as a good citizen and review how best to protect that reputation or that ability•Oversee the creation of appropriate policies and
supporting measures•Monitor the Group’s engagement with external stakeholders
and other interested parties•Ensure that appropriate communications policies are in place
and working effectively to build and protect the Group’s reputation both internally and externally
Activities during the yearLast year we introduced a new core purpose: we make what matters better, together. We also articulated a new Value to help us achieve our core purpose: we use our scale for good. It’s based on the recognition that by using our skills and scale, we can make a significant contribution to major challenges facing society.
We chose to take a lead in tackling three challenges which were particularly relevant to us as a large global retailer and are important to our colleagues, customers and communities.
Our three big ambitions are:
•To lead in reducing food waste globally•To improve health and through this help to tackle the global
obesity crisis•To create new opportunities for millions of people around
the world
These three ambitions build on our essential responsibilities as a good corporate citizen – in terms of trading responsibly, reducing our impact on the environment, being a great employer and supporting local communities.
Over the last 12 months we’ve worked hard to embed our new Value through the business. We want to help deliver significant, long-term change and so our focus has been on examining the problems and developing clear and focused plans of action: insight-to-action. We have engaged with experts in the different areas. We have held roundtable discussions on a range of subjects including health, young people, food sourcing and food waste.
In tackling food waste we have published our own operations waste data which has been independently assured by KPMG. We have also developed profiles of some of our most frequently purchased products showing where most food waste occurs in the value chain from farm to fork. Identifying these hotspots means that we can focus our action plans where we can make the biggest difference. In improving health, our new Healthy Little Differences Tracker will map the health profile of our customers’ shopping trips over time. In providing opportunities, we have carried out extensive research with young people to find out their ambitions, the challenges they face and the support that they need.
During the year, the Committee was updated on the progress made on our three big ambitions and discussed the performance measures for this work. The Committee was briefed on the development of an advisory panel which would share views and insights from outside the business, look at best practice and emerging trends, challenge current thinking and collaborate to help find solutions. The Committee also discussed the results of the latest research on reputation.
Further information is available in our Tesco and Society Report 2014, which can be found on our website at www.tescoplc.com/society.
Corporate Responsibility Committee Report
Sir Richard BroadbentCorporate Responsibility Committee Chairman
Oth
er info
rmatio
nG
overnan
ceFin
ancial statem
ents
Strateg
ic repo
rt
Tesco PLC Annual Report and Financial Statements 2014 37

Activities during the yearThe Committee divides its time broadly between reviewing executive management development and succession planning; and reviewing Board development and governance matters. This year the Committee discussed the progress which had been made on culture and capability in the past 24 months, including rolling out new leadership skills and developing the capability of business leaders, and advancements in succession planning and diversity.
The Committee also reviewed succession planning for senior roles and the management development programmes which are in place to ensure adequate bench strength and appropriate skills are developed across the business.
With regard to Board development and governance, the Committee identified and recommended two appointments to the Board. Olivia Garfield joined the Board as a Non-executive Director on 1 April 2013 and Mark Armour joined the Board as a Non-executive Director on 2 September 2013. Both Olivia and Mark bring a wealth of skills and experience to the Board which are detailed in their biographies on page 26.
The Committee considers a number of factors when making new appointments, including what the new Director will add to the balance of skills and experience on the Board, and whether the Director will be able to allocate sufficient time to the Company to discharge his or her responsibilities. We worked with the external search consultancy Lygon Group, which does not have any connection with the Company, as well as using our own networks, to identify candidates.
The Committee also considered a number of changes to the composition of the Board’s Committees to ensure appropriate balance and succession potential. These are detailed on page 32.
In addition, the Committee reviewed the key themes which had emerged from governance meetings with shareholders in the run-up to the AGM and agreed the proposed approach for this year’s Board evaluation to recommend to the Board.
DiversityTesco approaches diversity in its broadest sense, recognising that successful world-class businesses flourish through embracing intellectual, experiential, geographical and skills diversity as well as other factors such as age, disability, gender, race and sexual orientation. With regard to gender diversity, which is the focus of significant current attention, we accept the spirit and aspirations of the Davies Report, including the representation of women at the highest levels in the organisation.
There are currently three women on our Board (27%), three women on the Executive Committee (19%) and women in senior management positions across the Group account for 30% as a whole. We believe that the focus must remain firmly on understanding what it takes to develop women and to retain them in senior positions. Senior roles are very demanding for all, regardless of gender, and we are determined to develop a culture and an environment where our people can advance whilst having the time to be good parents, partners and active members of their local community.
Our policy is to find, develop and keep a diverse workforce at all levels within our Company and we are committed to increasing the percentage of female leaders. We set a target in September 2011 for women to represent 32% of senior management and 20% of business leaders and Directors. We are close to our target with 30% of senior managers and we have exceeded our target with 22% of business leaders and Directors being women.
Nominations Committee attendance
MembersNumber of possible meetings attended
Actual meetings attended
Sir Richard Broadbent (Chairman) 2 2
Patrick Cescau 2 2
Stuart Chambers 2 2
Ken Hanna 2 2
The Nominations Committee divides its time broadly between reviewing executive bench strength and succession and overseeing Board succession and governance. The year was marked by a continued focus on executive bench strength and succession reflecting the priority being given to building talent development and succession options at all levels. The Committee also devoted time to reviewing Board development over the short and medium term.
The Group CEO and Group Personnel Director are regular attendees at Committee meetings which provide a valuable opportunity for in-depth and candid discussion in a small group on human and governance issues.
Sir Richard Broadbent Nominations Committee Chairman
Nominations Committee responsibilitiesThe Committee’s terms of reference are available at www.tescoplc.com. Where matters discussed relate to the Chairman, the Senior Independent Non-executive Director chairs the meeting.
The key responsibilities of the Committee include:
•Reviewing the Board’s structure, size and composition• Identifying, nominating and reviewing candidates for
appointment to the Board•Putting in place plans for succession•Reviewing the leadership needs of the organisation,
both Executive and Non-executive•Reviewing the Group’s talent planning programmes•Reviewing Board succession over the longer term, in order
to maintain an appropriate balance of skills and experience and to ensure progressive refreshment of the Board•Monitoring of the Group’s compliance with corporate
governance guidelines
Nominations Committee Report
Sir Richard BroadbentNominations Committee Chairman
38 Tesco PLC Annual Report and Financial Statements 2014
Corporate governance report continued

Compliance with the UK Corporate Governance CodeThe UK Corporate Governance Code (the ‘Code’) sets out principles and specific provisions on how a company should be directed and controlled to achieve standards of good corporate governance. In September 2012 the Financial Reporting Council made changes to the Code which focused on reporting. The 2012 version of the Code applies to the Company for the year ended 22 February 2014. A copy of the Code is available at www.frc.org.uk.
The Board considers that the Company complied in all material respects with the Code for the whole of the year ended 22 February 2014 except with regards to Code provision E.2.3, as Ken Hanna was unable to attend the AGM due to a long-standing prior engagement. Also, with regard to the new Code provision C.3.7, which requires external audit contracts to be put out to tender at least every ten years, the Company has not re-tendered within that period, but the Audit Committee keeps under review the ongoing legislative proposals on audit tendering and rotation from the EU and the Competition Commission, now the Competition and Markets Authority, and will implement them in accordance with the suggested timescales. Further details are provided on page 35.
The notes below are intended to facilitate the assessment of the Company’s compliance with the Code for the year ended 22 February 2014 but they should be read in conjunction with the Corporate Governance Report as a whole.
A. Leadership B. Effectiveness
A.1 The Board’s roleThe Board is the custodian of the Company’s values and of its long-term vision, and provides strategic direction and guidance for the Company. The matters reserved to the Board for its decisions are detailed in a formal schedule. Matters which must be considered by the Board include: the Group’s strategy; annual budgets; oversight of risk management processes; changes to the capital structure; and material transactions or litigation.
The Board held six scheduled meetings in the year ended 22 February 2014 and ad hoc meetings were also arranged to deal with matters between scheduled meetings as appropriate. It is expected that all Directors attend scheduled Board and relevant Committee meetings and the Annual General Meeting. Details of Board and Committee membership and attendance can be found on pages 32 and 33, 37 and 38.
All Directors are covered by the Group’s Directors’ and Officers’ Insurance policy.
A.2 A clear division of responsibilitiesThere is a clear delineation between the role of the Chairman and CEO. Their role descriptions were agreed by the Board in 2012 and are summarised below:
Chairman’s responsibilities:Ensuring the Directors receive accurate, timely and clear informationFacilitating the effective contribution of Non-executive Directors and engagement between Executive and Non-executive DirectorsEnsuring an annual evaluation of the Board is conducted and leading the performance evaluation of the CEO and Non-executive Directors, plus ensuring that the Committee Chairmen conduct evaluations of their CommitteesBuilding an effective BoardThe induction of new Directors and further training for all Directors as requiredCommunicating effectively with shareholders and other stakeholders and ensuring the Board develops an understanding of the view of the stakeholders
Group CEO’s responsibilities:Leading the development of the Company’s strategic direction and implementing the agreed strategyIdentifying and executing new business opportunitiesManaging the Group’s risk profile and implementing and maintaining an effective framework of internal controlsBuilding and maintaining an effective top management teamEnsuring effective communication with shareholders and key stakeholders and regularly updating institutional shareholders on the business strategy and performance
A.3 Role of the ChairmanThe Chairman was independent upon his appointment to the Board. He leads the Board, ensuring its effectiveness while taking account of the interests of the Group’s various stakeholders, and promoting high standards of corporate governance.
A.4 Non-executive DirectorsPatrick Cescau was the Senior Independent Director (‘SID’) throughout the year ending 22 February 2014. Patrick was selected in July 2010 for the role because of his experience and expertise, both as an Executive and Non-executive Director. A biography is available on page 26. In his role as SID, Patrick Cescau is available to assist in resolving shareholder concerns should alternative channels be exhausted. The SID’s role also includes responsibility for the Chairman’s appraisal and succession; and to hold at least one meeting each year with the Non-executive Directors without the Chairman present.
The Chairman also has one-to-one and group meetings with the Non-executive Directors without the Executive Directors being present.
During the year, there were no unresolved concerns about the running of the Company or a proposed action.
B.1 The Board’s compositionLast year the Board was intentionally managed to a smaller size with proportionally greater Non-executive representation relative to Executive.
The Board reviewed the overall balance of skills, experience, independence and knowledge of the Board and Committee members and a number of changes were made to the Non-executive representation as detailed on pages 31 and 32.
During the year the Board comprised of the Non-executive Chairman, two Executive Directors and eight Non-executive Directors. All the Non-executive Directors are considered to be independent under the criteria set out in the Code.
B.2 Board appointmentsThe appointment of new Directors is led by the Nominations Committee. Further details of the appointments process can be found in the Nominations Committee section on page 38 and biographies of our Directors can be found on pages 26 and 27.
B.3 Time commitmentsThe Board makes a careful assessment of the time commitments required from the Chairman and Non-executive Directors to discharge their roles properly. This is discussed with candidates as part of the recruitment process and a commitment to the appropriate time requirements is included in their engagement letter.
B.4 Training and developmentAll new Directors receive a personalised induction programme, tailored to their experience, background and particular area of focus, which is designed to develop their knowledge and understanding of the Group’s culture and operations. The programme has evolved over time to take into account feedback from new Directors and the development of best practice and incorporates a wide-ranging programme of meetings with the senior management across the Group, attending results and broker briefings, comprehensive briefing materials and opportunities to visit the Group’s operations across the world including spending time in-store and in our distribution network. The Chairman agrees a personalised induction plan with each new Director and ensures that it meets the individual needs of that Director.
The Chairman reviews each Director’s development needs as part of the annual performance evaluation process and puts appropriate arrangements in place for specific training. The Nominations Committee reviews the Directors’ skills and experience as a group against those needed to continue to enable the Board to oversee and support the Group’s diverse operations in the future and identifies any gaps. This informs the approach to ongoing refreshment of the Board as well as the training plan for the current Board. Training is arranged to help develop the knowledge and skills of the Directors in a variety of areas relevant to the Group’s business. All Directors have the opportunity to refresh and increase their knowledge of the Group through visits to Group Operations and meeting with senior executives across the business.
B.5 Provision of information and supportBoard papers are circulated a week before each meeting to give the Directors and Committee members sufficient time to fully consider the information.
All Directors have access to the services of the Company Secretary and may take independent professional advice at the Company’s expense in conducting their duties.
B.6 Board and committee performance evaluationDuring the year the Board undertook a thorough review of its performance and that of its Committees and individual Directors. Further information can be found on page 32.
B.7 Re-election of DirectorsAll Directors were subject to shareholder re-election at the 2013 AGM and this will be the case at the 2014 AGM.
Information about the Directors can be found in their biographies on pages 26 and 27.
Oth
er info
rmatio
nG
overnan
ceFin
ancial statem
ents
Strateg
ic repo
rt
Tesco PLC Annual Report and Financial Statements 2014 39
C. AccountabilityWhilst no internal control system can guarantee that losses will not occur, the Board is satisfied that management have remained diligent in their efforts to ensure that an appropriate level of control remains in place.
C.3 Role and responsibilities of the Audit CommitteeThe Audit Committee supports the Board in its responsibilities in relation to corporate reporting and risk management and internal controls, and with maintaining a relationship with the Company’s auditors.
The Audit Committee’s report on pages 33 to 36 sets out a description of the work of the Committee.
D. Remuneration
D.1 Level and elements of remunerationThe Directors’ Remuneration Report on pages 41 to 61 explains the level of remuneration received by the Directors and how the Company has aligned the remuneration received to corporate and individual performance.
D.2 Development of remuneration policyThe development of our remuneration policy and our rationale for the level and structure of the remuneration for our senior management is set out in the Directors’ Remuneration Report on pages 56 to 61.
E. Relations with shareholders
E.1 Shareholder engagementWe are committed to conducting constructive dialogue with shareholders to ensure that we understand what is important to them and enable clear communication of our position. The Chairman, CEO and CFO hold regular meetings with shareholders and update the Board on the outcome of those meetings. Investor Relations keep the Board informed of broker and analyst views and report and present formally to the Board twice a year. In addition we carry out a survey each year of a cross-section of shareholders in order to assess shareholder perception of the Company.
We support greater engagement with institutional shareholders as envisaged by the Stewardship Code. We are also keen to develop engagement with private shareholders through various channels of communication, including the AGM, the Company’s website and social media.
E.2 Constructive use of the AGMOur 2014 AGM will be held in London on 27 June 2014. The whole Board is expected to attend the AGM and be available to answer questions from shareholders present.
In 2013 Ken Hanna was unable to attend the AGM due to a long-standing prior engagement. All other Directors were present and talked to a number of shareholders before and after the meeting.
To encourage shareholder participation, we offer electronic proxy voting and voting through the CREST electronic proxy appointment service. At our AGM all resolutions are proposed and voted upon individually by shareholders or their proxies. All votes taken during the AGM are by way of electronic poll. This follows best practice guidelines and allows the Company to count all votes, not just those of shareholders attending the meeting.
C.1 Financial and business reportingThe Directors’ statement of responsibilities for the preparation of the Annual Report and Financial Statements 2014 can be found on page 64. Information on the Company’s business model can be found on pages 10 and 11 and its strategy can be found on pages 3 to 7.
The Directors’ confirmation that the business is a going concern can be found on page 63.
C.2 Risk management and internal control systemsThe Board has overall responsibility for ensuring the Group has appropriate risk management and internal controls in place and that they continue to work effectively.
There is a comprehensive process for the review and consideration of risk at Tesco. Risk Registers are in place for all businesses and some key Group functions also maintain a specific Risk Register. The Group also maintain a Group Key Risk Register which describes key risks faced by the Group and their likelihood and impact, as well as the controls and procedures implemented to mitigate them. Group risks are determined by discussion with senior management and are reviewed by the Group Executive Committee and then agreed by the Board. In addition to reviewing the Group Risk Register, the Board carries out in-depth reviews of key risk areas each year.
The Company maintains a comprehensive framework of internal controls addressing the key strategic, financial, legal, reputational and operational risks to the business and the accountability for operating these controls rests with senior management as a first line of defence.
Colleagues are required to confirm annually that they complied with the Code of Business Conduct which sets out individual obligations and responsibilities for anyone working at Tesco.
Group Finance is responsible for preparing the Group’s financial statements. Last year it took steps to make the processes more robust by developing a key financial control framework to describe a mandatory suite of controls across key business processes. Compliance is monitored by an annual self-assessment.
A number of key management committees play a role in monitoring compliance with internal controls. The Group Compliance Committee is responsible for monitoring legal compliance across the Group, including receiving reports from the individual business unit compliance committees.
The Audit Committee reports each year on its assessment of the effectiveness of the risk management and internal controls systems. Throughout the year the Committee receives regular reports from the external auditor covering topics such as quality of earnings and technical accounting developments. Internal Audit and senior management also regularly provide updates to the Committee and any significant breaches of control, together with the appropriate remediation arrangements are discussed.
The Board conducted a review of the effectiveness of the Company’s risk management and internal controls during the year. To support the Board in their annual assessment, a summary report is prepared which describes the arrangements that the Board has put in place for internal control and risk management systems and summarises the key issues or non-compliances arising from those processes.
These arrangements include:
1. The Annual Risk Management Process (as described in the principal risks and uncertainties section on pages 20 to 25) – there is a comprehensive process for the review and consideration of risk at Tesco. Risk Registers are in place for all Business Units and for some key Group Functions, including Group Finance. These are considered regularly by subsidiary boards to assess their control systems and have all been reviewed at least once in the last year. The Group Key Risk Register was reviewed by the Executive Committee in January 2014 and the Board in February 2014. During the reviews all the Group risks were challenged and refreshed.
2. The Internal Audit Programme – a risk-based programme of Internal Audit is conducted annually and the findings of those audits, together with the monitoring of the progress of management’s remediation programmes is reviewed by the Board.
3. Evaluation of the Control Findings from External Audit – PwC are not a part of Tesco’s internal control system. However, they do form an assessment on the financial control environment as they conduct their audit work and this is another point of reference and information for the Board and senior management to consider on the operation of our controls.
4. Assessment of Compliance Activities at a Group and Business Unit Level – the results of a number of other key compliance activities are also considered during the review of the effectiveness of risk management and internal control arrangements. These include: the outputs from the Group and Business Unit Compliance Committee processes; the returns from the Annual Code of Business Conduct declaration process; the results of the Key Financial Controls Self-Assessment process; the results of store-based compliance reviews of stock, cash and price integrity processes; the results of the Group Technical and Trading Law assessments including ethical audits; the outputs from the Tesco Bank Risk Assurance and Compliance process; reports from the Fraud and Code of Conduct Investigations; and, the results from the Information Security reviews and incidents that occurred in the year.
40 Tesco PLC Annual Report and Financial Statements 2014
Corporate governance report continued

In this sectionp41 Introduction from Stuart Chambers,
Chairman of the Remuneration CommitteeSubject to an advisory vote at the 2014 AGM
p42 Annual remuneration report
p56 Directors’ remuneration policy Subject to a binding vote at the 2014 AGM
Dear ShareholdersNew remuneration reporting framework The new remuneration reporting regulations came into force on 1 October 2013 and apply to Tesco for the 2013/14 financial year. To reflect this, the Committee has restructured the Directors’ Remuneration Report for 2013/14 and split it into two parts.
The Policy Report will be submitted to shareholders for a binding vote for the first time at the 2014 AGM and the policy will be effective from that date. The Annual Remuneration Report will also be submitted to shareholders for an advisory vote at the same meeting. The Committee hopes that the new form of report is clear and informative and would welcome feedback from shareholders.
Incentive payouts for 2013/14In 2013/14 we shifted our focus from addressing existing business issues to driving our strategy for future growth. The progress we have made to date in Building a Better Tesco has strengthened our business’s foundations, positioning the Company to create value for our shareholders. Our store refresh programme continues, where we are updating our stores to make them more contemporary, improving the shopping environment and making them more compelling for our customers. We are now accelerating our growth in new channels and investing in sharper prices, improved quality, stronger ranges and better service. The area where change has been most significant however is in the acceleration of the development of our multichannel strategy, evolving our offering as the way customers shop evolves.
Management have been working hard to deliver this business transformation, making difficult decisions today to position Tesco to be the leading retailer of tomorrow. This strategy is starting to yield results: Group internet sales increased by 15% and we are getting better feedback from customers and colleagues across the Group.
Stuart ChambersChairman of the Remuneration Committee
Despite strong progress against strategic objectives during the year and the exceptional effort management have put in to achieve this, the bonus profit underpin was not met and therefore the Executive Directors will not receive a bonus in respect of 2013/14.
Performance Share Plan awards granted in 2011 will lapse in July 2014 as challenging three-year EPS and ROCE targets were not met.
Reward changes for 2014/15No changes are being made to our reward framework in 2014/15.
Board changesLaurie McIlwee resigned as CFO and as an Executive Director of Tesco PLC on 4 April 2014. Laurie remains an employee of Tesco and, for a period of six months from 4 April 2014, will be employed as CFO Emeritus performing transition activities and supporting handover with colleagues as we recruit a replacement CFO. Details of Laurie’s leaving arrangements are set out on page 51.
Review of remuneration arrangements for 2015/16 and beyondThe world of retail is evolving rapidly as customers embrace technology to help them shop in different ways, and Tesco is changing to make the most of the opportunities this presents. To ensure that we continue to operate a remuneration framework which reflects this rapidly changing market, is fully aligned with our strategy and provides competitive rewards to management for the creation of shareholder value, the Committee plans to undertake a review of executive remuneration during 2014/15. We will consult with shareholders in relation to any changes we would propose to make, and it is anticipated that we will bring a revised remuneration approach to shareholders at the 2015 AGM.
Stuart ChambersChairman of the Remuneration Committee
Oth
er info
rmatio
nG
overnan
ceFin
ancial statem
ents
Strateg
ic repo
rt
Tesco PLC Annual Report and Financial Statements 2014 41
Directors’ remuneration reportRemuneration Committee Chairman’s introduction

Remuneration policy for Executive Directors
Fixed element (c.20% of total reward assuming maximum performance)
Salary + pension + benefits
Performance related element (c.80% of total reward assuming maximum performance)
Short-term performance Long-term performance
Cash bonus Deferred share bonus
Performance Share Plan
Financial measures (76%):Profitability (50%) and strategic
financial measures (26%)
Strategic non-financialmeasures (24%)
Matrix of EPS growth and return on capital employed (‘ROCE’)
The following report outlines our remuneration strategy and philosophy, how remuneration policy was implemented in 2013/14 and how the Committee intends to apply policy in 2014/15. This Annual Remuneration Report will be submitted to an advisory shareholder vote at the AGM on 27 June 2014.
Remuneration strategyTesco’s most important asset is its people. Business success depends on the performance and contribution of each individual colleague but outstanding performance comes from teamwork. Our approach to remuneration throughout Tesco is guided by a framework of common objectives and principles which are outlined in the table below.
Reward objectives Reward principles
Attract• Enable Tesco to recruit the
right people
Motivate• Incentivise colleagues to deliver
our business goals together
Recognise• Acknowledge individual
contribution and performance
Align• Create shareholder value and
support the achievement of the business’ core purpose by focusing colleagues on making what matters better
Retain• Foster loyalty and pride in Tesco so
that colleagues want to stay with us and strive to do their best
Competitive• We assess competitiveness on
a total reward basis including financial and non-financial rewards
• Reward reflects an individual’s role, experience, performance and contribution
• Reward is set with reference to external market practice and internal relativity
Simple• Reward is simple, clear, and easy
to understand• We avoid unnecessary complexity• Reward is delivered accurately
Total Reward
Com
petitive
FairFair
Sustain
able
Fair
Sim
ple
Fair• Policies are transparent, and
applied consistently and equitably• Reward decisions are trusted and
properly governed• Reward is legal and compliant
Sustainable• Reward is aligned to the business
strategy, reflects our performance, and is affordable
• Our reward framework is flexible to meet the changing needs of the business
• We reward in a responsible way
Linking executive pay with strategy
•Alignment with strategy Our strategic focus is to build a stronger business that is sustainable and equipped to compete in the future. The majority of our reward is linked to the delivery of stretching performance over the short and long term aligned with the achievement of our business vision and our strategy (see the Report from the Chief Executive on pages 3 to 7). The majority of reward is delivered in shares.Our short-term performance is measured in relation to profit growth and the delivery of other strategic financial and non-financial objectives. Our long-term performance is measured by assessing the growth in our earnings per share and the level of our return on capital. These metrics are a key measure of the success of the delivery of shareholder value.
•Simple, collegiate approach to remuneration Our remuneration arrangements are designed to be simple to provide clarity to our Executives and to shareholders. Executive Directors and other management participate in a common incentive framework to ensure teamwork in delivering our key strategic goals.
•Creating alignment with shareholders by building a shareholding in our business We believe that it is important that our colleagues are shareholders in the business to create alignment with other shareholders. The CEO’s shareholding guideline is to hold shares with a value of four times salary, the CFO is required to hold shares with a value of three times salary and other senior managers are required to hold shares with a value of one times salary.
The following chart and accompanying table provide a summary of how remuneration policy will be applied in 2014/15.
42 Tesco PLC Annual Report and Financial Statements 2014
Directors’ remuneration report continuedAnnual remuneration report
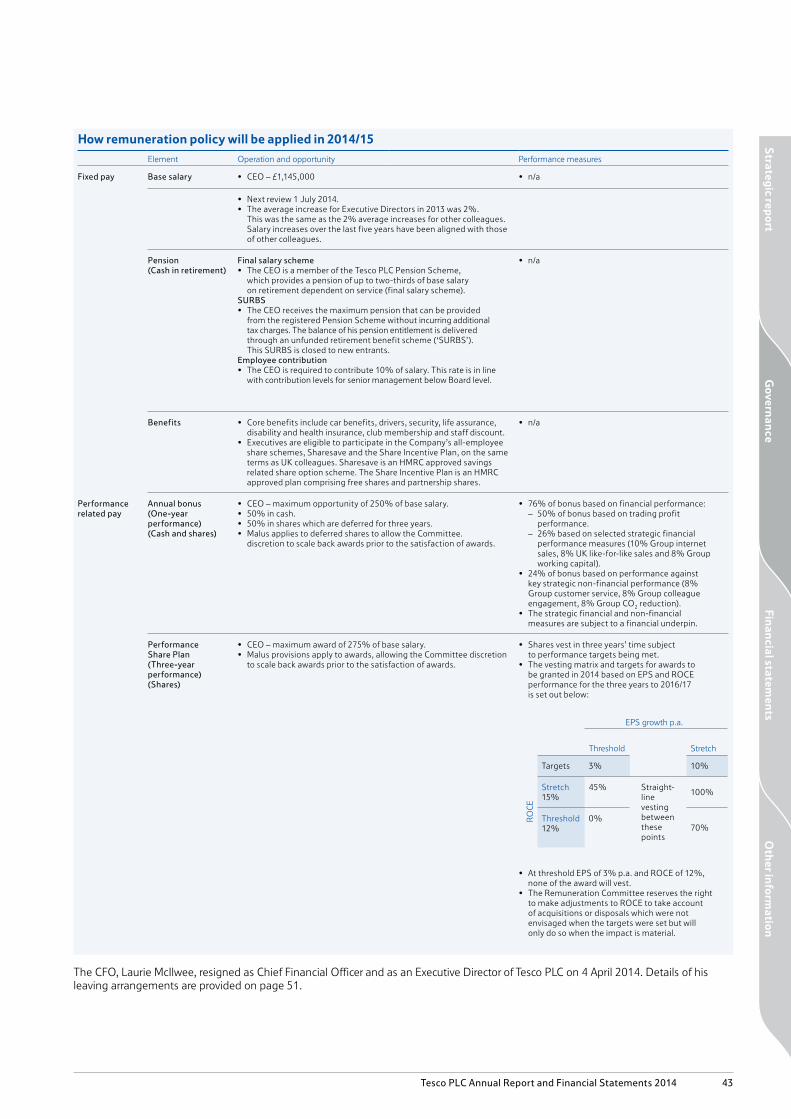
How remuneration policy will be applied in 2014/15
Element Operation and opportunity Performance measures
Fixed pay Base salary • CEO – £1,145,000 • n/a
• Next review 1 July 2014.• The average increase for Executive Directors in 2013 was 2%.
This was the same as the 2% average increases for other colleagues. Salary increases over the last five years have been aligned with those of other colleagues.
Pension(Cash in retirement)
Final salary scheme• The CEO is a member of the Tesco PLC Pension Scheme,
which provides a pension of up to two-thirds of base salary on retirement dependent on service (final salary scheme).
SURBS• The CEO receives the maximum pension that can be provided
from the registered Pension Scheme without incurring additional tax charges. The balance of his pension entitlement is delivered through an unfunded retirement benefit scheme (‘SURBS’). This SURBS is closed to new entrants.
Employee contribution• The CEO is required to contribute 10% of salary. This rate is in line
with contribution levels for senior management below Board level.
• n/a
Benefits • Core benefits include car benefits, drivers, security, life assurance, disability and health insurance, club membership and staff discount.
• Executives are eligible to participate in the Company’s all-employee share schemes, Sharesave and the Share Incentive Plan, on the same terms as UK colleagues. Sharesave is an HMRC approved savings related share option scheme. The Share Incentive Plan is an HMRC approved plan comprising free shares and partnership shares.
• n/a
Performance related pay
Annual bonus(One-year performance)(Cash and shares)
• CEO – maximum opportunity of 250% of base salary.• 50% in cash.• 50% in shares which are deferred for three years.• Malus applies to deferred shares to allow the Committee.
discretion to scale back awards prior to the satisfaction of awards.
• 76% of bonus based on financial performance: – 50% of bonus based on trading profit
performance. – 26% based on selected strategic financial
performance measures (10% Group internet sales, 8% UK like-for-like sales and 8% Group working capital).
• 24% of bonus based on performance against key strategic non-financial performance (8% Group customer service, 8% Group colleague engagement, 8% Group CO2 reduction).
• The strategic financial and non-financial measures are subject to a financial underpin.
Performance Share Plan(Three-year performance)(Shares)
• CEO – maximum award of 275% of base salary. • Malus provisions apply to awards, allowing the Committee discretion
to scale back awards prior to the satisfaction of awards.
• Shares vest in three years’ time subject to performance targets being met.
• The vesting matrix and targets for awards to be granted in 2014 based on EPS and ROCE performance for the three years to 2016/17 is set out below:
• At threshold EPS of 3% p.a. and ROCE of 12%, none of the award will vest.
• The Remuneration Committee reserves the right to make adjustments to ROCE to take account of acquisitions or disposals which were not envisaged when the targets were set but will only do so when the impact is material.
The CFO, Laurie McIlwee, resigned as Chief Financial Officer and as an Executive Director of Tesco PLC on 4 April 2014. Details of his leaving arrangements are provided on page 51.
RO
CE
EPS growth p.a.
Threshold Stretch
Targets 3% 10%
Stretch 15%
45% Straight-line vesting between these points
100%
Threshold 12%
0%70%
Oth
er info
rmatio
nG
overnan
ceFin
ancial statem
ents
Strateg
ic repo
rt
Tesco PLC Annual Report and Financial Statements 2014 43

How do performance measures link to strategy?The balance of short-term performance measures is illustrated in the chart below:
Short-term performance
Performance measure Link to strategy
Profitability (50% of short-term)• Trading profit
The profit measure incentivises the delivery of our strategy by encouraging the creation of shareholder value through bottom-line financial results. Trading profit is used as it is widely understood throughout the business, and does not include property profits. This reflects our fundamentally different approach to space going forward.
Strategic financial performance (26% of short-term)• Group internet sales (10%)• UK like-for-like sales (8%)• Group working capital (8%)
The selected strategic financial measures allow for the Company to more specifically incentivise the delivery of key elements of our strategy.
Establishing multichannel leadership is an important and exciting dimension of our strategy and continues to be a key focus for 2014/15.
Another key priority for 2014/15 is delivering on our commitments to continue to invest in a strong UK business. A focus on improving like-for-like performance will support this.
A working capital metric is included to focus Executives on the effective management of stock, cash and suppliers.
Strategic non-financial performance (24% of short-term)• Group customer service (8%)• Group colleague engagement (8%)• Group CO2 reduction (8%)
At Tesco we believe that a focus on the enablers of business performance will help us build a much more successful, sustainable business for the long term which will ultimately yield financial returns for all stakeholders.
The Committee therefore decided it remained important to focus the annual bonus framework on:
• Improving our service to our customers.• Improving the engagement of all of our colleagues – if our colleagues smile, our customers smile too.• Being a business that puts back into our community.
Group customer service and Group colleague engagement is objectively measured through our management Steering Wheel which ensures that we manage in a balanced way across our business.
Bonus targets are considered by the Board to be commercially sensitive as they would give away details of our budgeting to our competitors. We therefore do not publish the details of targets. However, targets are considered to be measurable and appropriately stretching. If they are achieved the Committee considers that value will have been added for shareholders.
The Committee will provide an explanation of the rationale for the level of any bonus paid in the 2014/15 Directors’ Remuneration Report including details of where performance fell within the target range to ensure transparency for shareholders regarding the level of reward paid in the context of performance delivered. The Committee will disclose performance targets when they are no longer considered to be commercially sensitive.
Long-term performance
Performance measure Link to strategy
Earnings per share and return on capital employed (matrix)
The ultimate goal of our strategy is to provide long-term sustainable returns for all of our shareholders. Tesco believes that the best way to deliver enhanced value is to grow earnings over the long term while maintaining a sustainable level of return on capital employed – in other words to keep growing the size of the business in an efficient way.
2014 Performance Share Plan awards will continue to be subject to performance against a matrix of stretching earnings growth targets and sustainable return on capital performance. The Committee believes that this combination of EPS growth and ROCE performance is strongly aligned with our strategic objectives and also reflects the drivers of long-term shareholder value.
Performance targets are outlined in the table on page 43 and are unchanged from the 2013 awards.
Balance of measures for short-term bonus (%)
50%
26%
24%
Profitability
Strategic financial
Strategic non-financial
44 Tesco PLC Annual Report and Financial Statements 2014
Directors’ remuneration report continuedAnnual remuneration report

What did we pay Executive Directors in 2013/14?The table below provides a ‘single figure’ of remuneration. Where necessary, further explanations of the values provided are included below.
This table and the relevant explanation has been audited.
Single total figure of remuneration – Executive Directors
Salary£000
Benefits1
£000Short-term bonus£000
Long-term incentives£000
Pension2
£000Total£000
Philip Clarke 2013/14 1,136 107 0 0 391 1,634
2012/13 1,114 166 0 0 0 1,280
Laurie Mcllwee3 2013/14 880 119 0 0 537 1,536
2012/13 863 142 0 0 360 1,365
1 Benefits include car benefits (for 2013/14 Philip Clarke – £45k, Laurie McIlwee – £33k), drivers (for 2013/14 Philip Clarke – £27k, Laurie McIlwee – £31k), security (for 2013/14 Philip Clarke – £13k, Laurie McIlwee – £29k), taxable travel, disability and health insurance, membership at clubs, Shares in Success awarded under the all-employee Share Incentive Plan and the value of the discount for shares awarded under the Sharesave during the year. Philip Clarke’s benefits for 2012/13 now include fuel costs which were not known when the report was published. The benefit costs shown have been grossed up for tax.
2 Pension is calculated as the difference between the end of year defined benefit accrued pension and the beginning of year accrued pension increased by the September CPI in the preceding tax year, multiplied by a factor of 20. The pension figure for 2012/13 has been set to nil where the increase in pension earned over the year was lower than the CPI increase to the pension built up at the beginning of the year.
3 Laurie McIlwee resigned and ceased to be a director on 4 April 2014. Details of his leaving arrangements are provided on page 51.
Short-term bonus 2013/14This table has been audited.
Performance measures Maximum opportunity 2013/14 payout
50% based on profitability • Trading profit performance • CEO – maximum bonus opportunity of 250% of base salary
• CFO – maximum bonus opportunity of 200% of base salary
0% payout
26% based on strategic financial performance • Group internet sales (10%)• UK like-for-like sales growth (8%)• Group working capital (8%)
24% based on strategic non-financial performance
• Group customer service (8%)• Group colleague engagement (8%)• Group CO2 reduction – 8%
The following illustrates performance against targets:
Measures Performance
Below Threshold Target Stretch
Profitability Trading profit (50%) ■
Strategic financial Group internet sales (10%) ■
UK like-for-like sales growth (8%) ■
Group working capital (8%) ■
Strategic non-financial Group customer service (8%) ■
Group colleague engagement (8%) ■
Group CO2 reduction (8%) ■
The business has made good progress this year against our key strategic objectives designed to strengthen our underlying business. We have increased internet sales by 15% reflecting our focus on our multichannel strategy. We are getting better feedback from customers and colleagues and have significantly reduced the level of CO2 used across the Group. Despite this progress the bonus profit underpin was not met and therefore the Executive Directors will not receive a bonus in respect of 2013/14.
Bonus targets are considered by the Board to be commercially sensitive. We have therefore not published the details of targets.
Oth
er info
rmatio
nG
overnan
ceFin
ancial statem
ents
Strateg
ic repo
rt
Tesco PLC Annual Report and Financial Statements 2014 45

Underlying diluted earnings per share – continuing operations (p)
Underlying profit before tax – continuing operations(£million)
Return on capital employed (‘ROCE’) − continuing operations(%)
Total shareholder return
(%)
0
5
10
15
20
25
30
35
40
45
0
500
1,000
1,500
2,000
2,500
3,000
3,500
4,000
4,500
13/1412/1311/1210/1109/10
0.0
2.0
4.0
6.0
8.0
10.0
12.0
14.0
16.0
13/1412/1311/1210/1109/10 Feb 14Feb 13Feb 12Feb 11Feb 10Feb 09
FTSE 100
Tesco
Val
ue o
f £10
0 in
vest
ed 2
Mar
ch 2
009
09/10 10/11 11/12 12/13 13/14
240
220
200
180
160
140
120
100
80
60
Long-term incentives
Vesting of 2011/12 to 2013/14 awardsAwards granted in 2011 which were subject to performance to the end of 2013/14 were the first cycle of awards under the current long-term incentive framework to vest under which awards were made entirely in performance shares (rather than a mix of performance shares and market value share options). Performance targets for these awards were set as a matrix of stretching earnings growth and sustainable return on capital employed targets.
This table has been audited.
Performance targets Award level 2013/14 payout
% of initial awards vesting were subject to the following performance targets:
EPS growth p.a.
Threshold Target Stretch
7% 10% 12%
RO
CE
Stretch14·6% 45% 75% 100%
Threshold13·6% 20% 60% 85%
• CEO – 275% of base salary.• CFO – 225% of base salary.
• The increase in underlying diluted EPS over the three years from 2011/12 to 2013/14 was below threshold.
• ROCE performance for 2013/14 was below threshold.
• Performance against these targets has led to a payout of 0%.
• EPS growth is assessed based on the growth in underlying diluted EPS p.a. over the 2011/12 to 2013/14 financial years.• ROCE performance is assessed based on ROCE in 2013/14.• The Remuneration Committee reserves the right to make adjustments to performance measures to take into account acquisitions or disposals,
but will only do so when the impact is material. No such discretion was applied in respect of 2011 awards which were subject to performance in 2013/14.
Awards granted in 2011 will therefore lapse in July 2014.
Information regarding remuneration outcomes for 2012/13 is set out in the 2012/13 Directors’ Remuneration Report.
Aligning pay with performanceThe following charts illustrate performance at Tesco against key performance indicators over the past five years. 2012/13 financial information has been restated for retrospective changes to an accounting standard (IAS 19), a change in definition to underlying profit and to exclude China which is now treated as a discontinued operation. See notes to the accounts for more information.
The FTSE 100 index has been selected to compare Tesco’s TSR against as it is a broad market index of which Tesco is a constituent.
46 Tesco PLC Annual Report and Financial Statements 2014
Directors’ remuneration report continuedAnnual remuneration report

Philip Clarke(£million)
Laurie McIlwee(£million)
PensionBase salary
Benefits*Annual bonus – cash
Annual bonus – deferred shares awarded
PSP (value on vesting date)
£3.4m£3.8m
£4.6m
£1.3m£1.6m
£3.3m£3.6m
£2.5m
£1.4m £1.5m
13/1412/1311/1210/1109/10
CEOExecutive Director
5.0
4.5
4.0
3.5
3.0
2.5
2.0
1.5
1.0
0.5
0.0
5.0
4.5
4.0
3.5
3.0
2.5
2.0
1.5
1.0
0.5
0.013/1412/1311/1210/1109/10
The table below lays out the historical single figure data for the role of CEO as well as bonus and long-term incentive payout levels as a percentage of maximum opportunity for the CEO.
Five year remuneration history
2009/10 2010/11 2011/121 2012/13 2013/14
Sir Terry Leahy Sir Terry Leahy Philip Clarke Philip Clarke Philip Clarke
CEO single figure of remuneration 7,1002 7,150 4,595 1,280 1,634
Annual bonus vesting (% of maximum award) 89% 75% 0% 0% 0%
PSP vesting (% of maximum award) 82.7% 75% 46.5% 0% 0%
Share option vesting (% of maximum award) 100% 100% 100% 0% n/a
1 The CEO elected not to take a bonus for 2011/12. Other Executive Directors received a bonus of 13.54% of maximum.2 Includes additional shares earned under the legacy bonus scheme.
In each year the award is shown based on the final year of the performance period, i.e. the year in which it is included in the single figure.
The following charts illustrate remuneration arrangements paid to Executive Directors over the last five years:
* Benefits includes car, fuel and driver, security, taxable travel, medical insurance, membership at clubs, Shares in Success and Sharesave awards.
Philip Clarke was promoted to the role of CEO with effect from 1 March 2011 and therefore the value of his pension for 2011/12 increased to reflect his new salary in relation to the role of CEO.
Laurie McIlwee was promoted to the role of CFO with effect from 27 January 2009 and therefore the value of his pension for 2009/10 increased to reflect his new salary in relation to the role of CFO. Laurie McIlwee resigned from the role of CFO on 4 April 2014.
Oth
er info
rmatio
nG
overnan
ceFin
ancial statem
ents
Strateg
ic repo
rt
Tesco PLC Annual Report and Financial Statements 2014 47

Shareholding guidelines and share ownership
Share ownership guidelines
•FourtimesbasesalaryfortheCEO
•ThreetimesbasesalaryfortheCFO
•Thepurposeistocreatealignmentwiththeinterestsof shareholders
•Thisrequirementisattheupperendoftypicalmarketpractice forsimilar-sizedcompanies
TheRemunerationCommitteebelievesthatasignificantshareholdingbyExecutiveDirectorsalignstheirinterestswithshareholdersanddemonstratestheirongoingcommitmenttothebusiness.
Policy for calculating shareholding•Shares included–SharesheldoutrightwillbeincludedinthecalculationofshareholdingguidelinesaswillsharesheldbyanExecutive’sspouse.Sharesheldinplanswhicharenotsubjecttoforfeiturewillbeincluded(onanetoftaxbasis)forthepurposesofcalculatingExecutiveDirectors’shareholdings.Vestedbutunexercisedmarketvalueshareoptionsarenotincludedinthecalculation.•Five years for new appointees to build shareholdings–Newappointeeswillbeexpectedtoachievethisminimumlevelofshareholdingwithinfiveyearsofappointment.Whentheshareholdingguidelineswereincreasedin2011,ExecutivesweregivenaperiodoffiveyearstomeetthisenhancedrequirementandthereforeshouldmeettherequirementbyJune2016.•PSP participation may be subject to maintaining holding–Fullparticipationinthelong-termPerformanceSharePlanwillgenerallybeconditionaluponmaintainingtheminimumshareholding.•Holding of 50% of vesting awards until requirement met –WhereanExecutiveDirectordoesnotmeettheshareholdingrequirementtheywillberequiredtohold,andnotdisposeof,atleast50%ofthenetnumberofshareswhichvestunderincentivearrangementsuntiltheymeetthisrequirement.
Giventheimportanceofowningshares,theExecutiveCommitteeandover100otherseniormanagersarealsorequiredtobuildaholdingofTescoshares.
ThechartbelowillustratesthevalueofExecutiveDirectors’shareholdings,basedonthethree-monthaveragesharepriceto22February2014of330.3ppersharecomparedtotheshareholdingguideline.
Philip Clarke
Laurie McIIwee
EIP shares(vested and unvested)
Shares and unexercised vested PSP awards
Shareholding guideline
£million0 1.0 2.0 3.0 4.0 5.0 6.0 7.0 8.0
Shares held by Executive Directors at 22 February 2014Thistablehasbeenaudited.
Director
Shareholdingguideline(%ofsalary)
Shareholdingguideline(numberofshares)
Number/valueofsharescountedtowardsshareholdingguideline1
Guidelinemet?
OrdinarySharesheldat22February20142
Interestsinshareincentiveschemes,thataresubjecttonofurtherperformanceconditionsat22February20143
InterestinmarketvalueandSharesaveshareoptionsat22February20144
Interestsinshareincentiveschemes,subjecttoperformanceconditions,at22February20145
OrdinaryShares23February20132
PhilipClarke 400% 1,386,673 2,288,591£7.56m(6.6xsalary)
Yes 1,832,038 893,874 1,909,112 2,737,611 1,829,467
LaurieMcllwee 300% 805,136 344,756£1.14m(1.3xsalary)
No 81,219 517,851 498,140 1,734,605 76,390
1 Basedonathree-monthaveragesharepriceto22February2014of330.3p.2 Includessharesheldundertheall-employeeShareIncentivePlanandsharesheldbyconnectedpersons.3 IncludesvestedbutunexercisedandunvestednilcostoptionsheldunderthedeferredbonusplanaswellasvestedbutunexercisednilcostoptionsunderthePerformanceSharePlan.4 IncludesawardsundertheDiscretionaryShareOptionPlan(‘DSOP’)andundertheTescoSharesave.OptionsgrantedundertheSharesavemaybegrantedatupto20%discountonthemarketpriceatgrant.ThelastawardsundertheDSOPweregrantedtoExecutiveDirectorsin2010.Nofurtherawardswillbemadeunderthisplan.
5 IncludesunvestedawardsunderthePSPwhichremainsubjecttoperformance.
48 Tesco PLC Annual Report and Financial Statements 2014
Directors’ remuneration report continuedAnnual remuneration report

Between22February2014and24April2014PhilipClarkeacquired71partnershipsharesundertheall-employeeShareIncentivePlan.Therewerenootherchangesinshareinterests.
Share dealing policyTescohasasharedealingpolicyinplaceforExecutiveDirectorsandformembersoftheExecutiveCommittee.ThispolicypreventsExecutiveDirectorsandExecutiveCommitteemembersandtheirconnectedpersonsdealinginsharesattimeswhenthiswouldbeprohibitedbytheUKListingAuthority’sListingRules.Atalltimes,ExecutiveDirectorsandExecutiveCommitteemembersmustseekadvanceclearancebeforedealinginsharesontheirownbehalforinrespectoftheirconnectedpersons.
Share awards awarded during 2013/14Thistablehasbeenaudited.
Plan TypeofawardDateofawards
Numberofshares Facevalue1
Thresholdvesting(%ofschemeinterest)
Maximumvesting(%ofschemeinterest)
Performanceperiod
Dividendsharesawardedinyear
Outstandingawardsat22February2014
PhilipClarkePerformanceSharePlan
Nilcostoptionssubjecttoperformance
23July2013
863,049 £3,148,748
0% 100%24February2013to27February2016
12,371 875,420
LaurieMcllwee 546,662 £1,994,442 7,836 554,498
1 Facevaluehasbeencalculatedusingtheaveragemid-marketclosingsharepriceoverthefivedaysprecedingtheawardof364.84pwhichwasthesharepriceusedtodeterminethenumberofsharessubjecttotheawardinaccordancewiththerules.
Thepercentageofawardvestingforawardsgrantedin2013isbasedonEPSgrowthandROCEasoutlinedbelow:
ROCE
EPSgrowthp.a.
Threshold Stretch
Targets 3% 10%
Stretch15%
45%Straight-linevestingbetweenthesepoints
100%
Threshold 12%
0%70%
Noawardsweregrantedduringtheyearunderthedeferredbonusplan.
Outstanding share awards subject to performance conditionsAwardsgrantedinpreviousyearswhichremainsubjecttoperformance
Director Dateofaward
Sharepriceonaward/grant(pence)
Outstandingawards23February2013
Dividendsharesawardedinyear
Outstandingawardsat22February2014 Performanceperiod
PhilipClarke11July2011 407.19
791,946 36,052 827,998 27February2011to22February2014LaurieMcllwee 501,872 22,847 524,719
PhilipClarke30July2012 317.10
989,162 45,031 1,034,193 26February2012to28February2015LaurieMcllwee 626,851 28,537 655,388
Theseawardsaregrantedintheformofnilcostoptionswithanexercisepriceof0p.Awardsvestonthethirdanniversaryofgrantandcannormallybeexerciseduntilthetenthanniversaryofgrant.Followinghisresignationon2April2014,expirydatesforLaurieMcllwee’sawardswillbeearlierassetoutonpage51.
Performancetargetsforawardsgrantedin2011werenotmetandawardswilllapseinJuly2014.
Thepercentageofawardvestingforawardsgrantedin2012isbasedonEPSgrowthp.a.andROCE,asoutlinedbelow:
ROCE
EPSgrowthp.a.
Threshold Stretch
Targets 5% 12%
Stretch14·6%
45%Straight-linevestingbetweenthesepoints
100%
Threshold 13·6%
20%85%
Oth
er info
rmatio
nG
overnan
ceFin
ancial statem
ents
Strateg
ic repo
rt
Tesco PLC Annual Report and Financial Statements 2014 49

Outstanding share awards not subject to performance conditionsShareawardsheldattheyearendwhicharenotsubjecttoperformancearesummarisedbelow.Awardsthatarenotyetexercisablehavebeenshaded.
Thesetableshavebeenaudited.
Philip Clarke
Plan
Dateofaward/grant
Sharepriceonaward/
grant(pence)
Outstandingawards23February2013
Sharesawarded/optionsgrantedinyear1
Sharesreleased/optionsexercisedinyear2
Awardslapsedinyear
Outstandingawardsat22February2014
Exerciseprice
(pence)
Datefromwhich
exercisableExpirydate
DiscretionaryShareOptionPlan
22.04.200508.05.200608.05.200712.05.200806.05.200907.05.2010
312.75318.60473.75427.00338.40419.80
379,856404,896298,844353,114467,848386,850
––––––
––––––
–––––
386,850
379,856404,896298,844353,114467,848
–
312.75318.60473.75427.00338.40419.80
22.04.200808.05.200908.05.201012.05.201106.05.201207.05.2013
22.04.201508.05.201608.05.201712.05.201806.05.201907.05.2020
2,291,408 – – 386,850 1,904,558
SavingsRelatedOptionScheme(SAYE)
07.11.200705.11.2008
469.50360.13
8191,077
––
–1,077
819–
––
410.00311.00
01.02.201301.02.2014
01.08.201301.08.2014
11.11.200910.11.201016.11.201107.11.201206.11.2013
377.56435.08403.65312.88356.98
9487888241,063
––––
931
–––––
–––––
9487888241,063931
328.00386.00364.00282.00322.00
01.02.201501.02.201601.02.201701.02.201801.02.2019
01.08.201501.08.201601.08.201701.08.201801.08.2019
5,519 931 1,077 819 4,554
Long-termPerformanceSharePlan(PSP)
08.07.200815.10.200914.10.2010
353.76374.00433.90
299,839173,527318.607
13,6497,898–
–––
––
318,607
313,488181,425
–
0.000.000.00
08.07.201115.07.201214.07.2013
08.07.201815.10.201914.10.2020
791,973 21,547 – 318,607 494,913
ExecutiveIncentivePlan(EIP)
22.06.2010 388.05 217,886 9,918 – – 227,804 0.00 22.05.2013 22.06.2020
27.05.2011 411.75 163,706 7,451 – – 171,157 0.00 13.05.2014 27.05.2021
381,592 17,369 – – 398,961
Laurie McIlwee
Plan
Dateofaward/grant
Sharepriceonaward/
grant(pence)
Outstandingawards23February2013
Sharesawarded/optionsgrantedinyear1
Sharesreleased/optionsexercisedinyear2
Awardslapsedinyear
Outstandingawardsat22February2014
Exerciseprice
(pence)
Datefromwhich
exercisableExpirydate3
DiscretionaryShareOptionPlan
08.05.200712.05.200806.05.200907.05.2010
473.75427.00338.40419.80
77,19291,335325,059290,138
––––
––––
–––
290,138
77,19291,335325,059
–
473.75427.00338.40419.80
08.05.201012.05.201106.05.201207.05.2013
08.05.201712.05.201806.05.201907.05.2020
783,724 – – 290,138 493,586
SavingsRelatedOptionScheme(SAYE)
07.11.200705.11.2008
469.50360.13
8191,077
––
–1,077
819–
––
410.00311.00
01.02.201301.02.2014
01.08.201301.08.2014
11.11.200910.11.201016.11.201107.11.201206.11.2013
377.56435.08403.65312.88356.98
9487888241,063
––––
931
–––––
–––––
9487888241,063931
328.00386.00364.00282.00322.00
01.02.201501.02.201601.02.201701.02.201801.02.2019
01.08.201501.08.201601.08.201701.08.201801.08.2019
5,519 931 1,077 819 4,554
Long-termPerformanceSharePlan(PSP)
15.10.200914.10.2010
374.00433.90
130,144318,607
5,923–
––
–318,607
136,067–
0.000.00
15.07.201214.07.2013
15.10.201914.10.2020
448,751 5,923 – 318,607 136,067
ExecutiveIncentivePlan(EIP)
22.06.2010 388.05 163,414 7,438 – – 170,852 0.00 22.05.2013 22.06.202027.05.201125.05.2012
411.75308.25
163,70638,044
7,4511,731
––
––
171,15739,775
0.000.00
13.05.201425.05.2015
27.05.202125.05.2022
365,164 16,620 – – 381,784
1 Includesdividendequivalentsaddedtoawardsduringtheyear.2 PhilipClarkeandLaurieMcIlweeexercisedtheir2008SAYEoptionson3February2014whenthemarketsharepricewas318.95p.3 Followinghisresignationon4April2014,expirydatesforLaurieMcllwee’sawardswillbeearlierassetoutonpage51.
50 Tesco PLC Annual Report and Financial Statements 2014
Directors’ remuneration report continuedAnnual remuneration report

PensionsPhilipClarkeandLaurieMcIlweearemembersoftheTescoPLCPensionScheme,whichprovidesapensionofuptotwo-thirdsofbasesalaryonretirement,normallyatage60,dependentonservice(finalsalaryscheme).
Eachyear’spensionearnedbefore1June2012willbeincreasedwithRPIuptoamaximumof5%,andpensionearnedafter1June2012withCPIuptoamaximumof5%.
Pensionaccruedbefore1June2012anddrawnbeforeage60willbeactuariallyreducedtoreflectearlyretirement.Pensionaccruedfrom1June2012willbeactuariallyreducedifitisdrawnbeforetheageatwhichafullpensionispaid(originallyage62butsubjecttoadjustmentupordowntoreflectunexpectedchangesinlifeexpectancy).
SinceApril2006,followingimplementationoftheregulationscontainedwithintheFinanceAct2004,ExecutiveDirectorshavebeeneligibletoreceivethemaximumpensionthatcanbeprovidedfromtheregisteredPensionSchemewithoutincurringadditionaltaxcharges.ThebalanceofanypensionentitlementforExecutiveDirectorsisdeliveredthroughanunfundedretirementbenefitscheme(‘SURBS’).TheSURBSissecuredbyusingafixedandfloatingchargeoveracashdepositinadesignatedaccount.
ExecutiveDirectorswhoaremembersofthefinalsalaryschemearerequiredtocontribute10%ofsalary.
DetailsoftherightsundertheTescopensionschemearesetoutbelow.
Thistablehasbeenaudited.
(a)Ageat22February2014
(b)YearsofCompanyservice
(c)Total
accruedpensionat22February
20141,2£000
(d)Increaseinaccruedpension
duringtheyear3
£000
(e)Increaseinaccruedpension
duringtheyear(netofinflation)4
£000
(f)Transfer
valueof(e)at22
February2014(lessDirector’s
contributions)£000
(gi)Transfer
valueoftotalaccruedpensionat23February
2013(oldbasis)4
£000
(gii)Transfer
valueoftotalaccruedpensionat23February2013(newbasis)4
£000
(h)Transfervalueoftotal
accruedpensionat22
February2014£000
(i)Increaseintransfervalue(lessDirector’s
contributions)£000
PhilipClarke 53 39 633 33 17 216 10,738 9,988 11,482 1,494
LaurieMcllwee 51 13 360 34 25 307 5,217 4,673 5,669 996
1 Theaccruedpensionisthatwhichwouldbepaidannuallyonretirementat60(pre-June2012service)andfromfullpensionage(post-June2012service),basedonserviceto22February2014.
2 SomeofPhilipClarkeandLaurieMcIlwee’sbenefitsarepayablefromanunfundedpensionarrangement.Thisissecuredbyafixedandfloatingchargeonacashdeposit.3 Theincreaseinaccruedpensionovertheyearisadditionalpensionaccruedduringtheyear.4 ThetransfervaluebasiswasupdatedduringtheyearfollowingareviewoftheScheme’sfactors.
InflationovertheyearhasbeenallowedforusingtheSeptember2013CPIinflationof2.7%.
Payments to former directorsThisinformationhasbeenaudited.
TherewerenopaymentsmadetoformerDirectorswhichexceededthedeminimisthresholdof£10,000setbytheCompany.
FollowingthesaleofFresh&Easy,theawardof2,500,000sharesplusassociateddividendequivalentsgrantedin2007totheformerCEO,SirTerryLeahy,undertheGroupNewBusinessIncentivePlanlapsedon14April2014.
Loss of office paymentsThisinformationhasbeenaudited.
Therewerenopaymentsforlossofofficeduringtheyear.
Leaving arrangements for Laurie McIlweeLaurieMcIlweeresignedasCFOandasanExecutiveDirectorofTescoPLCon4April2014.LaurieremainsanemployeeofTescoand,foraperiodofsixmonthsfrom4April2014,willbeemployedasCFOEmeritusperformingtransitionactivitiesandsupportinghandoverwithcolleaguesaswerecruitareplacementCFO.Duringthisperiod,Lauriewillcontinuetoreceivehissalaryof£886,420andwillremaineligibletoreceiveabonusofuptoamaximumof200%ofsalaryfor2014/15.Anybonuswillbebasedonperformanceagainsttargetsandwillbepro-ratedfortimeinemployment.
Attheendofthissixmonthperiodon3October2014(terminationdate)LauriewillceasetobeemployedbyTesco.Onterminationofemployment,inaccordancewiththetermsofhiscontract,Lauriewillreceiveaterminationpaymentof£970,800consistingof12monthsbasesalary(£886,420)andbenefits(£84,460consistingofstaffdiscount,privatehealthcareandhealthinsuranceandcarandcarrelatedbenefits).Noadditionalamountwillbepaidinrespectofpension.
Outstandingdeferredshare(EIP)awardswillcontinueuntilthenormalvestingdateinaccordancewiththerulesoftheplan.Lauriewillhave12monthsfromthisdatetoexerciseawards.2011awardsveston14May2014.The2012awardwillveston25May2015.Nodeferredshareawardwasmadein2013andnoawardwillbemadein2014.Thenumberofsharessubjecttoeachawardissetoutinthetableonpage50.
Oth
er info
rmatio
nG
overnan
ceFin
ancial statem
ents
Strateg
ic repo
rt
Tesco PLC Annual Report and Financial Statements 2014 51
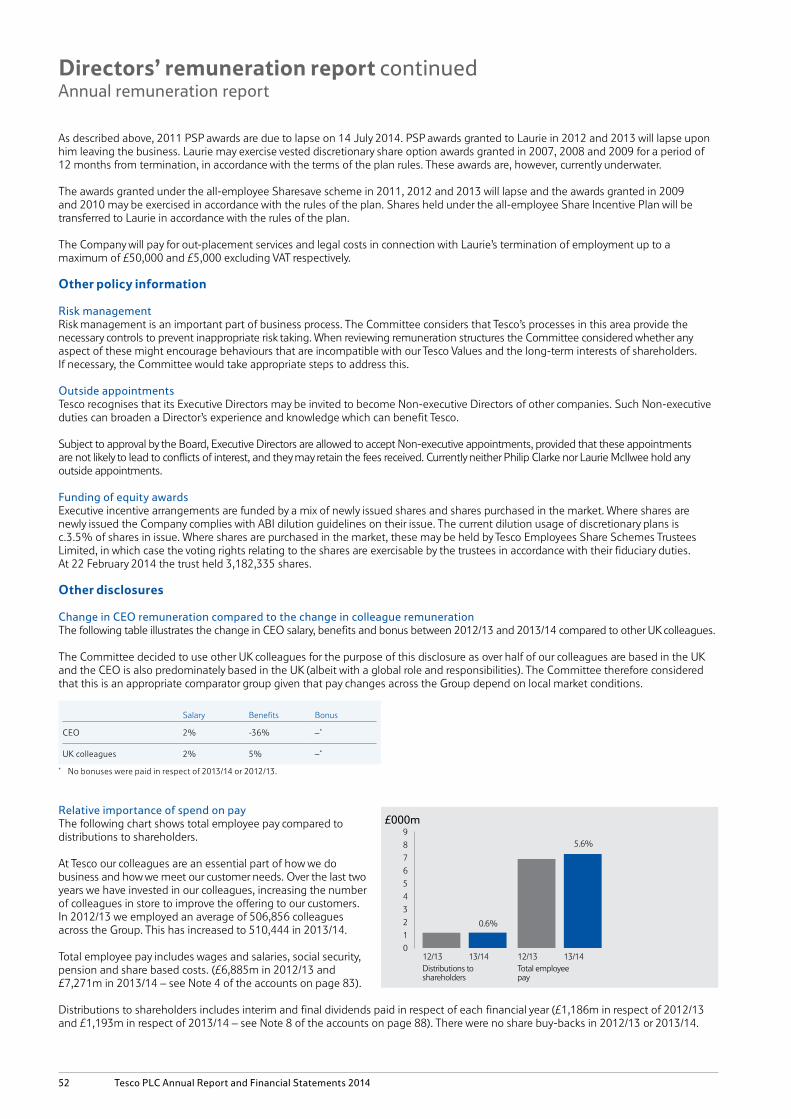
£000m
0.6%
5.6%
Distributions toshareholders
Total employee pay
12/13 13/14 12/13 13/14
9
8
7
6
5
4
3
2
1
0
Asdescribedabove,2011PSPawardsareduetolapseon14July2014.PSPawardsgrantedtoLauriein2012and2013willlapseuponhimleavingthebusiness.Lauriemayexercisevesteddiscretionaryshareoptionawardsgrantedin2007,2008and2009foraperiodof12monthsfromtermination,inaccordancewiththetermsoftheplanrules.Theseawardsare,however,currentlyunderwater.
Theawardsgrantedundertheall-employeeSharesaveschemein2011,2012and2013willlapseandtheawardsgrantedin2009and2010maybeexercisedinaccordancewiththerulesoftheplan.Sharesheldundertheall-employeeShareIncentivePlanwillbetransferredtoLaurieinaccordancewiththerulesoftheplan.
TheCompanywillpayforout-placementservicesandlegalcostsinconnectionwithLaurie’sterminationofemploymentuptoamaximumof£50,000and£5,000excludingVATrespectively.
Other policy information
Risk managementRiskmanagementisanimportantpartofbusinessprocess.TheCommitteeconsidersthatTesco’sprocessesinthisareaprovidethenecessarycontrolstopreventinappropriaterisktaking.WhenreviewingremunerationstructurestheCommitteeconsideredwhetheranyaspectofthesemightencouragebehavioursthatareincompatiblewithourTescoValuesandthelong-terminterestsofshareholders.Ifnecessary,theCommitteewouldtakeappropriatestepstoaddressthis.
Outside appointmentsTescorecognisesthatitsExecutiveDirectorsmaybeinvitedtobecomeNon-executiveDirectorsofothercompanies.SuchNon-executivedutiescanbroadenaDirector’sexperienceandknowledgewhichcanbenefitTesco.
SubjecttoapprovalbytheBoard,ExecutiveDirectorsareallowedtoacceptNon-executiveappointments,providedthattheseappointmentsarenotlikelytoleadtoconflictsofinterest,andtheymayretainthefeesreceived.CurrentlyneitherPhilipClarkenorLaurieMcIlweeholdanyoutsideappointments.
Funding of equity awardsExecutiveincentivearrangementsarefundedbyamixofnewlyissuedsharesandsharespurchasedinthemarket.WheresharesarenewlyissuedtheCompanycomplieswithABIdilutionguidelinesontheirissue.Thecurrentdilutionusageofdiscretionaryplansisc.3.5%ofsharesinissue.Wheresharesarepurchasedinthemarket,thesemaybeheldbyTescoEmployeesShareSchemesTrusteesLimited,inwhichcasethevotingrightsrelatingtothesharesareexercisablebythetrusteesinaccordancewiththeirfiduciaryduties.At22February2014thetrustheld3,182,335shares.
Other disclosures
Change in CEO remuneration compared to the change in colleague remunerationThefollowingtableillustratesthechangeinCEOsalary,benefitsandbonusbetween2012/13and2013/14comparedtootherUKcolleagues.
TheCommitteedecidedtouseotherUKcolleaguesforthepurposeofthisdisclosureasoverhalfofourcolleaguesarebasedintheUKandtheCEOisalsopredominatelybasedintheUK(albeitwithaglobalroleandresponsibilities).TheCommitteethereforeconsideredthatthisisanappropriatecomparatorgroupgiventhatpaychangesacrosstheGroupdependonlocalmarketconditions.
Salary Benefits Bonus
CEO 2% -36% –*
UKcolleagues 2% 5% –*
* Nobonuseswerepaidinrespectof2013/14or2012/13.
Relative importance of spend on payThefollowingchartshowstotalemployeepaycomparedtodistributionstoshareholders.
AtTescoourcolleaguesareanessentialpartofhowwedobusinessandhowwemeetourcustomerneeds.Overthelasttwoyearswehaveinvestedinourcolleagues,increasingthenumberofcolleaguesinstoretoimprovetheofferingtoourcustomers.In2012/13weemployedanaverageof506,856colleaguesacrosstheGroup.Thishasincreasedto510,444in2013/14.
Totalemployeepayincludeswagesandsalaries,socialsecurity,pensionandsharebasedcosts.(£6,885min2012/13and£7,271min2013/14–seeNote4oftheaccountsonpage83).
Distributionstoshareholdersincludesinterimandfinaldividendspaidinrespectofeachfinancialyear(£1,186minrespectof2012/13and£1,193minrespectof2013/14–seeNote8oftheaccountsonpage88).Therewerenosharebuy-backsin2012/13or2013/14.
52 Tesco PLC Annual Report and Financial Statements 2014
Directors’ remuneration report continuedAnnual remuneration report
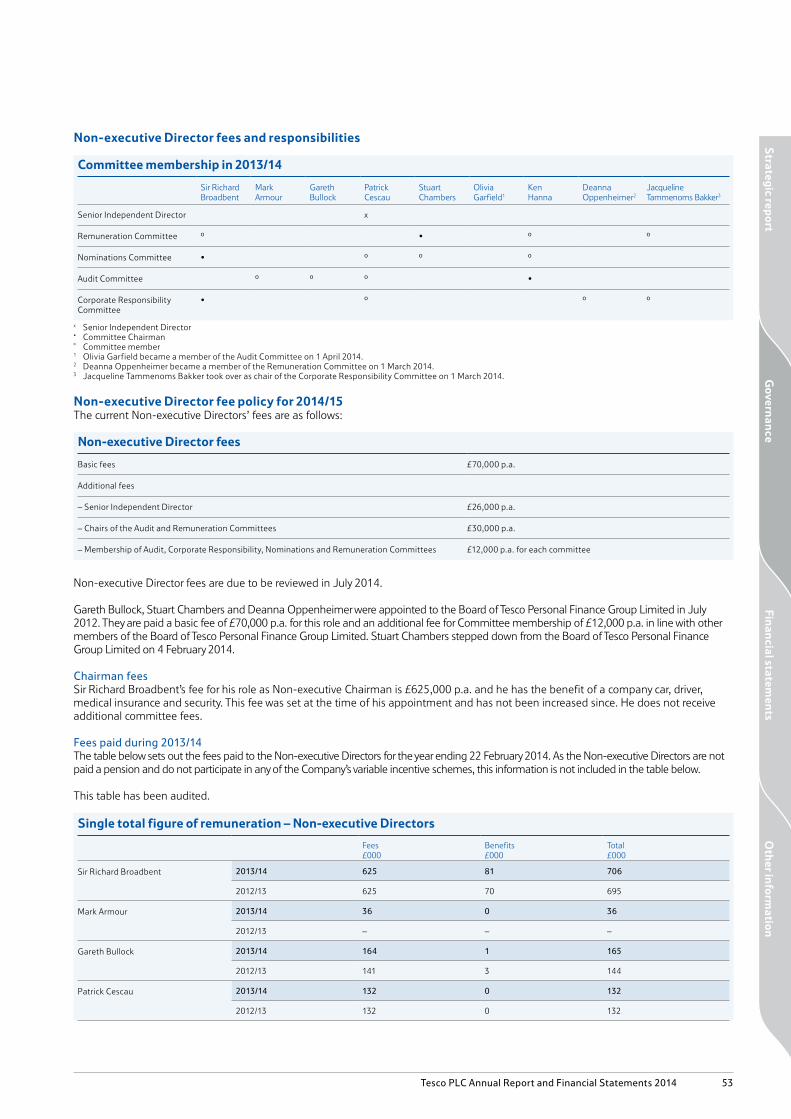
Non-executive Director fees and responsibilities
Committee membership in 2013/14
SirRichardBroadbent
MarkArmour
GarethBullock
PatrickCescau
StuartChambers
OliviaGarfield1
KenHanna
DeannaOppenheimer2
JacquelineTammenomsBakker3
SeniorIndependentDirector x
RemunerationCommittee º • º º
NominationsCommittee • º º º
AuditCommittee º º º •
CorporateResponsibilityCommittee
• º º º
x SeniorIndependentDirector• CommitteeChairmanº Committeemember1 OliviaGarfieldbecameamemberoftheAuditCommitteeon1April2014.2 DeannaOppenheimerbecameamemberoftheRemunerationCommitteeon1March2014.3 JacquelineTammenomsBakkertookoveraschairoftheCorporateResponsibilityCommitteeon1March2014.
Non-executive Director fee policy for 2014/15ThecurrentNon-executiveDirectors’feesareasfollows:
Non-executive Director fees
Basicfees £70,000p.a.
Additionalfees
–SeniorIndependentDirector £26,000p.a.
–ChairsoftheAuditandRemunerationCommittees £30,000p.a.
–MembershipofAudit,CorporateResponsibility,NominationsandRemunerationCommittees £12,000p.a.foreachcommittee
Non-executiveDirectorfeesareduetobereviewedinJuly2014.
GarethBullock,StuartChambersandDeannaOppenheimerwereappointedtotheBoardofTescoPersonalFinanceGroupLimitedinJuly2012.Theyarepaidabasicfeeof£70,000p.a.forthisroleandanadditionalfeeforCommitteemembershipof£12,000p.a.inlinewithothermembersoftheBoardofTescoPersonalFinanceGroupLimited.StuartChamberssteppeddownfromtheBoardofTescoPersonalFinanceGroupLimitedon4February2014.
Chairman feesSirRichardBroadbent’sfeeforhisroleasNon-executiveChairmanis£625,000p.a.andhehasthebenefitofacompanycar,driver,medicalinsuranceandsecurity.Thisfeewassetatthetimeofhisappointmentandhasnotbeenincreasedsince.Hedoesnotreceiveadditionalcommitteefees.
Fees paid during 2013/14ThetablebelowsetsoutthefeespaidtotheNon-executiveDirectorsfortheyearending22February2014.AstheNon-executiveDirectorsarenotpaidapensionanddonotparticipateinanyoftheCompany’svariableincentiveschemes,thisinformationisnotincludedinthetablebelow.
Thistablehasbeenaudited.
Single total figure of remuneration – Non-executive Directors
Fees£000
Benefits£000
Total£000
SirRichardBroadbent 2013/14 625 81 706
2012/13 625 70 695
MarkArmour 2013/14 36 0 36
2012/13 – – –
GarethBullock 2013/14 164 1 165
2012/13 141 3 144
PatrickCescau 2013/14 132 0 132
2012/13 132 0 132
Oth
er info
rmatio
nG
overnan
ceFin
ancial statem
ents
Strateg
ic repo
rt
Tesco PLC Annual Report and Financial Statements 2014 53
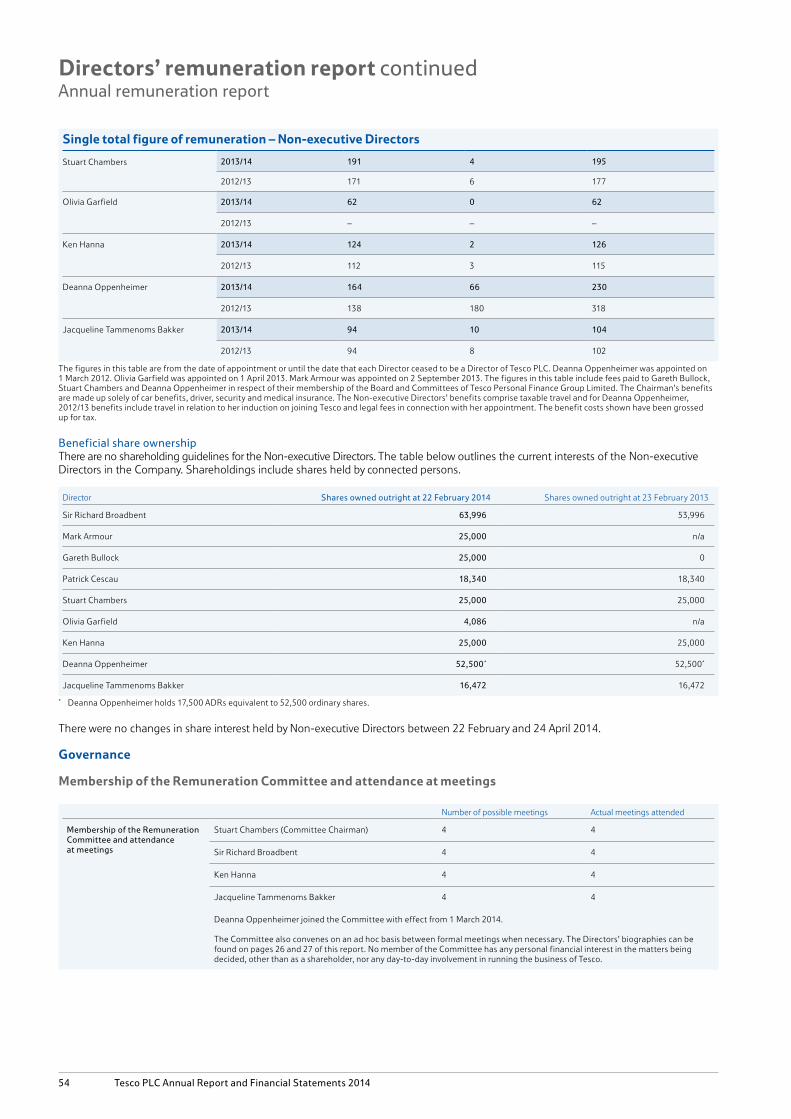
Single total figure of remuneration – Non-executive Directors
StuartChambers 2013/14 191 4 195
2012/13 171 6 177
OliviaGarfield 2013/14 62 0 62
2012/13 – – –
KenHanna 2013/14 124 2 126
2012/13 112 3 115
DeannaOppenheimer 2013/14 164 66 230
2012/13 138 180 318
JacquelineTammenomsBakker 2013/14 94 10 104
2012/13 94 8 102
ThefiguresinthistablearefromthedateofappointmentoruntilthedatethateachDirectorceasedtobeaDirectorofTescoPLC.DeannaOppenheimerwasappointedon1March2012.OliviaGarfieldwasappointedon1April2013.MarkArmourwasappointedon2September2013.ThefiguresinthistableincludefeespaidtoGarethBullock,StuartChambersandDeannaOppenheimerinrespectoftheirmembershipoftheBoardandCommitteesofTescoPersonalFinanceGroupLimited.TheChairman’sbenefitsaremadeupsolelyofcarbenefits,driver,securityandmedicalinsurance.TheNon-executiveDirectors’benefitscomprisetaxabletravelandforDeannaOppenheimer,2012/13benefitsincludetravelinrelationtoherinductiononjoiningTescoandlegalfeesinconnectionwithherappointment.Thebenefitcostsshownhavebeengrossedupfortax.
Beneficial share ownershipTherearenoshareholdingguidelinesfortheNon-executiveDirectors.ThetablebelowoutlinesthecurrentinterestsoftheNon-executiveDirectorsintheCompany.Shareholdingsincludesharesheldbyconnectedpersons.
Director Shares owned outright at 22 February 2014 Sharesownedoutrightat23February2013
SirRichardBroadbent 63,996 53,996
MarkArmour 25,000 n/a
GarethBullock 25,000 0
PatrickCescau 18,340 18,340
StuartChambers 25,000 25,000
OliviaGarfield 4,086 n/a
KenHanna 25,000 25,000
DeannaOppenheimer 52,500* 52,500*
JacquelineTammenomsBakker 16,472 16,472
* DeannaOppenheimerholds17,500ADRsequivalentto52,500ordinaryshares.
TherewerenochangesinshareinterestheldbyNon-executiveDirectorsbetween22Februaryand24April2014.
Governance
Membership of the Remuneration Committee and attendance at meetings
Numberofpossiblemeetings Actualmeetingsattended
Membership of the Remuneration Committee and attendance at meetings
StuartChambers(CommitteeChairman) 4 4
SirRichardBroadbent 4 4
KenHanna 4 4
JacquelineTammenomsBakker 4 4
DeannaOppenheimerjoinedtheCommitteewitheffectfrom1March2014.
TheCommitteealsoconvenesonanadhocbasisbetweenformalmeetingswhennecessary.TheDirectors’biographiescanbefoundonpages26and27ofthisreport.NomemberoftheCommitteehasanypersonalfinancialinterestinthemattersbeingdecided,otherthanasashareholder,noranyday-to-dayinvolvementinrunningthebusinessofTesco.
54 Tesco PLC Annual Report and Financial Statements 2014
Directors’ remuneration report continuedAnnual remuneration report

Role of the Remuneration Committee
TheCommittee’skeyresponsibilitiesare:
• TodetermineandrecommendtotheBoardtheremunerationpolicyforExecutiveDirectorsandtheChairman.• Toensurethelevelandstructureofremunerationisdesignedtoattract,retain,andmotivatetheExecutiveDirectorsneededtoruntheCompanywhileremainingappropriateinthecontextoftheremunerationarrangementsthroughouttheGroup.
• ToensurethatthestructureofremunerationarrangementsisalignedwiththecreationofsustainablereturnsforshareholdersandthatthelevelofrewardreceivedbyExecutivesreflectsthevaluedeliveredforshareholders.
• AsrequiredbytheFinancialConductAuthority(‘FCA’),TescoBankhasaseparateindependentremunerationcommittee.TheGroupRemunerationCommitteeisconsultedon,andmakesrecommendationsinrelationtotheremunerationarrangementsforTescoBankcolleagues,withtheaimofencouragingconsistencywithGroupremunerationpolicy,butitdoesnotmakedecisionsinrelationto,ordirect,howremunerationismanagedwithinTescoBank.
TheCommittee’stermsofreferenceareavailablefromtheCompanySecretaryuponrequestorcanbeviewedatwww.tescoplc.com.
Remuneration Committee activities 2013/14ThefollowingprovidesasummaryofthekeyareasoffocusateachoftheCommittee’smeetingsduringtheyearandshortlyfollowingtheendofthefinancialyear:
April2013 July2013 September2013 February2014April2014(followingyearend)
• Agreerewardoutcomes• Approvetargets• ApprovetheDRR• AGMpreparation
• Considershareholderfeedback
• Reviewbasesalaries• ReviewChairman’sfees
• ReportfromTescoBankRemunerationCommittee
• ReviewbelowBoardreward• Reviewmarkettrends• Remunerationstrategy
• Reviewperformance• Remunerationstrategy• ReviewtheDRR• Committeeeffectivenessreview
• Agreerewardoutcomes• Approvetargets• ApprovetheDRR• AGMpreparation
Committee advisorsRemunerationCommitteeadvisorsareappointedbytheCommitteefollowingaselectionprocessandtheirrolesarekeptunderreview.Duringtheyear,DeloitteLLPhavebeenretainedbytheCommitteeintheircapacityasindependentRemunerationCommitteeAdvisors.FeesforadviceprovidedtotheRemunerationCommitteefortheyearwere£151,646.Feesarechargedonatimeandmaterialsbasis.DeloittealsoprovidedadvicetomanagementinrelationtotheinterpretationoftheRemunerationReportingRegulations,belowboardremunerationandimplementationofshareplans.SeparateteamswithinDeloitteprovidedunrelatedadvisoryservicesinrespectofcorporatetaxplanning,technologyconsulting,riskmanagement,shareschemes,internationaltaxation,corporatefinanceandtreasurytotheGroupduringtheyear.
DeloitteisoneofthefoundingmembersoftheRemunerationConsultantsCodeofConductandadherestothisCodeinitsdealingswiththeCommittee.TheCommitteeissatisfiedthattheadviceprovidedbyDeloitteisobjectiveandindependent.TheCommitteeiscomfortablethattheDeloitteLLPengagementpartnerandteam,thatprovideremunerationadvicetotheCommittee,donothaveconnectionswithTescoPLCthatmayimpairtheirindependence.TheCommitteereviewedthepotentialforconflictsofinterestandjudgedthattherewereappropriatesafeguardsagainstsuchconflicts.
TowersWatsonalsoprovidedtheCommitteewithbenchmarkinginformationduringtheyearandfeesonatimespentbasisforthiswere£32,700.
JonathanLloyd,theCompanySecretary,isSecretarytotheCommittee.PhilipClarke(ChiefExecutiveoftheGroup)andtheGroupCFOattendmeetingsattheinvitationoftheCommittee.Theyarenotpresentwhentheirownremunerationisbeingdiscussed.TheCommitteeissupportedbyAlisonHomer(GroupPersonnelDirector),DrewMatthews(GroupRemunerationDirector)andCorporateSecretariatandFinancefunctions.
ComplianceIncarryingoutitsduties,theRemunerationCommitteegivesfullconsiderationtobestpractice.TheCommitteewasconstitutedandoperatedthroughouttheperiodinaccordancewiththeprinciplesoutlinedintheListingRulesoftheFinancialConductAuthorityderivedfromtheUKCorporateGovernanceCode.Theauditors’report,setoutonpages65to68,coversthedisclosuresreferredtointhisreportthatarespecifiedforauditbytheFinancialConductAuthority.
ThereporthasbeendrawnupinaccordancewiththeUKCorporateGovernanceCode,Schedule8oftheLargeandMedium-sizedCompaniesandGroups(AccountsandReports)Regulations2008(asupdatedin2013)andtheFinancialConductAuthorityListingRules.
Shareholder votingTescoremainscommittedtoongoingshareholderdialogueandcarefullyreviewsvotingoutcomesonremunerationmatters.IntheeventofasubstantialvoteagainstaresolutioninrelationtoDirectors’remuneration,Tescowouldseektounderstandthereasonsforanysuchvote,andwoulddetailanyactionsinresponsetoitintheDirectors’RemunerationReport.
Thefollowingtablesetsoutactualvotinginrespectofourremunerationreportin2013.
%ofvotes For Against
2012/13Directors’RemunerationReport(2013AGM) 95.2% 4.8%
124,199,537voteswerewithheld(1.54%ofsharecapital).
Oth
er info
rmatio
nG
overnan
ceFin
ancial statem
ents
Strateg
ic repo
rt
Tesco PLC Annual Report and Financial Statements 2014 55

Policy tableThe following sets out our Directors’ Remuneration Policy (the ‘Policy’). This Policy will be put forward for shareholder approval at the 2014 AGM on 27 June 2014 and will apply to payments made from this date.
Further details regarding the operation of the Policy for the 2014/15 financial year can be found on pages 43 to 44 of this report.
Policy table
Element
Purpose and link to strategy
Operation
Maximum opportunity Performance measures
Fixe
d
Base salary • The role of base salary is to support the recruitment and retention of Executive Directors of the calibre required to develop and deliver the strategy.
• Base salary provides fixed remuneration for the role, which reflects the size and scope of the Executive Directors’ responsibilities and their experience.
• The Committee sets base salary taking into account:
– The individual’s skills and experience and their performance.
– Salary levels at leading FTSE companies and other large consumer business companies in the UK and internationally.
– Pay and conditions elsewhere in the Group.
• Base salary is normally reviewed annually with changes effective from 1 July but may be reviewed more frequently if the Committee determines this is appropriate.
• While there is no maximum salary, increases will normally be in line with the typical level of increase awarded to other employees in the Group.
• However, increases may be above this level in certain circumstances such as:
– Where a new Executive Director has been appointed to the Board at a lower than typical market salary to allow for growth in the role then larger increases may be awarded to move salary positioning closer to typical market level as the Executive gains experience.
– Where an Executive Director has been promoted or has had a change in responsibilities, salary increases in excess of the above limit may be awarded.
– Where there has been a significant change in market practice.
• For details of salary levels from 1 July 2013 see page 43 of the Annual Remuneration Report.
n/a
Pension • To provide a market-leading retirement benefit that will foster loyalty and retain experienced Executive Directors, which supports our culture of developing talent internally.
• A key incentive and retention tool throughout the organisation.
• The CEO participates in a defined benefit pension plan.
• This is provided through registered arrangements up to approved HMRC limits, with the remainder provided through a secured unfunded arrangement.
• The Committee may determine that alternative pension provisions will operate for new appointments to the Board. When determining pension arrangements for new appointments the Board will give regard to the cost of the arrangements, market practice and the pension arrangements received elsewhere in the Group.
• Up to two-thirds of base salary at retirement with a minimum 10% of salary per annum employee contribution.
• In the event that an Executive Director retires early there will be no augmentation of pension benefits.
n/a
Benefits • To provide a market-competitive level of benefits for our Executive Directors.
• The Committee policy is to set benefit provision at an appropriate market competitive level taking into account the individual’s home jurisdiction, the jurisdiction in which the individual is based, typical practice and the level of benefits provided for other employees in the Group.
• Core benefits – Benefits currently include but are not limited to a company car or car allowance, fuel, private use of a chauffeur, life assurance, disability and health insurance (for the Executive Director and his family), health screening, Directors’ and Officers’ liability insurance and provision of indemnity, security, club membership and staff discount on the same basis as other employees.
• The Committee may remove benefits that Executive Directors receive or introduce other benefits if it is considered appropriate to do so.
• Executive Directors shall be reimbursed for all reasonable expenses and the Company may settle any tax incurred in relation to these.
• The overall level of benefits will depend on the cost of providing individual items and the individual’s circumstances and therefore there is no maximum level of benefit.
• When determining the level of benefits the Committee will consider the factors outlined in the ‘Operation’ column.
n/a
56 Tesco PLC Annual Report and Financial Statements 2014
2013/14 Policy ReportDirectors’ remuneration report continued

Policy table
Element
Purpose and link to strategy
Operation
Maximum opportunity Performance measures
Fixe
d
Benefits continued
• All-employee share plans – Executive Directors are eligible to participate in the Company’s all-employee share schemes on the same terms as UK colleagues.
• Mobility policy – Where an Executive Director is required to relocate to perform their role our policy is that they may be offered some or all of the following: a relocation allowance, location allowance, cost of living allowance, disturbance allowance, housing benefit, flight budget, assistance with school fees, international family heathcare, pension allowance, spousal allowance and tax advice, assistance and equalisation. The level of such benefits would be determined based on the circumstances of the individual and typical market practice.
Perf
orm
ance
rela
ted
pay
Annual bonus • The role of the annual bonus is to incentivise Executive Directors to deliver our annual financial and strategic goals.
• The performance measures have been selected as they are considered to be closely aligned to the delivery of our strategy, building a stronger underlying business and long-term shareholder value creation.
• Deferral into Company shares provides alignment with shareholders.
• The malus provision enables the Company to mitigate risk (see page 58).
• The annual bonus is normally delivered: – 50% in cash. – 50% in shares which are deferred.
• Awards will be calculated based on a percentage of base salary and the market share price at grant in accordance with the rules.
• The Committee may determine that a different balance of cash and deferred shares may apply.
• Performance is assessed over a financial year.
• The Committee determines the level of bonus taking into account performance against targets and the underlying performance of the business.
• The deferred shares will normally vest after three years (or an alternative period determined by the Committee).
• Deferred shares are normally awarded in the form of nil cost options but may be awarded in other forms (such as conditional share awards or forfeitable shares). Vested nil cost options may normally be exercised until the tenth anniversary of the date of grant.
• Maximum annual bonus opportunity of 250% of base salary.
• For details of award levels for 2014/15 see page 43 of the Annual Remuneration Report.
• The annual bonus is based on a mix of financial and strategic performance measures. At least 70% of the bonus will be based on financial performance.
• Any portion of the bonus based on non-financial measures will be subject to meeting a financial underpin.
• The Committee determines the exact metrics each year depending on the key goals for the forthcoming year.
• Normally around 30% of the bonus is paid for threshold performance, around 50% of the bonus is paid if target levels of performance are delivered with the full bonus being paid for delivering stretching levels of performance. These vesting levels may vary each year depending on the stretch of targets set.
• The Committee sets bonus targets each year to ensure that they are appropriately stretching in the context of the business plan.
Performance Share Plan
• The role of the PSP is to reward Executive Directors for achieving Tesco’s long-term strategy and creating sustainable shareholder value.
• To enhance shareholder value by motivating Executives to grow earnings over the long term while maintaining a sustainable level of capital efficiency.
• To align the economic interests of Executive Directors and shareholders.
• To act as a retention tool.• The malus provision
enables the Company to mitigate risk (see page 58).
• Awards normally vest based on performance over a period of not less than three years (unless the Committee determines otherwise).
• Awards will be calculated based on a percentage of base salary and the market share price at grant in accordance with the rules.
• The Committee has the discretion to amend the final vesting level if it does not consider that it reflects the underlying performance of the Company.
• PSP awards are normally awarded in the form of nil cost options over shares but may be awarded in other forms (such as conditional share awards or forfeitable shares). Vested nil cost options may normally be exercised until the tenth anniversary of the date at grant.
• The maximum annual award that can be granted under the PSP is 350% of base salary.
• For details of award levels for 2014/15 see page 43 of the Annual Remuneration Report.
• Awards vest based on an earnings and a capital efficiency performance measure (the satisfaction of which is determined by the Committee).
• For threshold levels of performance 0% of the award vests, increasing to 100% of the award for stretching performance.
• The Committee sets targets each year so that targets are stretching and represent value creation for shareholders while remaining motivational for management.
Oth
er info
rmatio
nG
overnan
ceFin
ancial statem
ents
Strateg
ic repo
rt
Tesco PLC Annual Report and Financial Statements 2014 57

Selection of performance measuresAnnual bonusThe annual bonus performance measures have been selected to provide an appropriate balance between incentivising Executive Directors to meet financial targets for the year and incentivising them to achieve specific strategic objectives. This allows the Company to more specifically incentivise the delivery of key elements of our strategy. The particular bonus metrics are selected by the Committee each year to ensure that Executive Directors are appropriately focused on the key objectives for the next 12 months.
Performance share planThe ultimate goal of our strategy is to provide long-term sustainable returns for all of our shareholders. Tesco believes that the best way to deliver enhanced value is to grow earnings over the long term while maintaining a sustainable level of capital efficiency – in other words to keep growing the size of the business in an efficient way. The measures used in the PSP reflect this.
Performance targets for both the annual bonus and Performance Share Plan are set taking into account internal budget forecasts, external expectations and the need to ensure that targets remain motivational.
Remuneration arrangements throughout the GroupRemuneration arrangements are determined throughout the Group based on the same principle; that reward should be sufficient to attract and retain high calibre talent without paying more than is necessary and that reward should support the delivery of the business strategy.
Tesco is one of the largest public company employers in the world. Our colleagues undertake a variety of roles reflecting the countries we operate in and the range of skills we need to run our various businesses (from stores to banking to telecoms). Reward packages therefore differ taking into account location, seniority and level of responsibility but they are all built around the common reward objectives and principles outlined above. The following is based on current practice which may change during the life of the policy.
•Annual bonus – Annual bonuses throughout the Group are linked to local business performance, Group success and, where appropriate, individual contribution in a structure that is consistent with the Executive Directors’ annual bonus with a focus on financial and strategic measures.•Share incentives – Currently our 5,000 strong management
team across the Group participates in share incentives to create alignment with shareholder interests. The management team also receives some of their bonus in Tesco shares deferred for a period of two or three years.•Pensions – Pensions across the Group vary widely according
to local market practice. In the UK all Tesco colleagues currently have the opportunity to participate in a career average defined benefit scheme up to tax approved limits. This benefit is unique in comparison with our key retail peers.•Colleagues as shareholders – It is an important part of the
Tesco Values that all colleagues, not just management, have the opportunity to become Tesco shareholders. Over 200,000 of our colleagues participate in our all-employee schemes and hold over 119 million shares in our Share Incentive Plan and over 127 million options over shares in our Sharesave scheme.
When determining Executive Director remuneration arrangements the Committee takes into account pay conditions throughout the Group to ensure that the structure and quantum of Executive Directors’ pay remains appropriate in this context.
Information supporting the policy tableTesco also operates shareholding guidelines. See page 48 of the Annual Remuneration Report for further details.
Awards may incorporate the right (in cash or shares) to receive the value of dividends between grant and exercise in respect of the number of shares that vest. The calculation of dividend equivalents may assume reinvestment of those dividends in Company shares on a cumulative basis.
The Committee has the discretion to scale back deferred share awards and performance share awards prior to the satisfaction of awards in the event that results are materially misstated or the participant has contributed to serious reputational damage of the Company or one of its business units or his conduct has amounted to serious misconduct, fraud or misstatement. Other elements of remuneration are not subject to clawback or malus.
If the Committee considers it to be appropriate, it may determine that share awards may be settled in cash.
The Committee may amend the terms of awards or the rules of share plans within the scope defined in the rules of the plans.
For share awards, in the event of a variation of the Company’s share capital or a demerger, delisting, special dividend, rights issue or other event, which may, in the Remuneration Committee’s opinion affect the current or future value of awards, the number of shares subject to an award may be adjusted.
The Committee may amend performance targets in accordance with the terms of an award or if a transaction occurs which causes the Committee to consider (taking into account the interest ofshareholders) that an amended performance condition would be more appropriate and would continue to achieve the original purpose.
The Committee reserves the right to make any remuneration payments and payments for loss of office (including exercising any discretions available to it in connection with such payments) notwithstanding that they are not in line with the Policy set out in this report where the terms of the payment were agreed (i) before the policy came into effect or (ii) at a time when the relevant individual was not a Director of the Company and, in the opinion of the Committee, the payment was not in consideration for the individual becoming a Director of the Company. For these purposes ‘payments’ includes the Committee satisfying awards of variable remuneration, and an award over shares is ‘agreed’ at the time the award is granted.
The Committee may make minor changes to this Policy for regulatory, exchange control, tax or administrative purposes or to take account of a change in legislation without seeking shareholder approval for that amendment.
Prior to 2011 Executive Directors were granted market value options under the Company’s 2004 Discretionary Share Option plan. Outstanding awards are no longer subject to performance and may be exercised until the 10th anniversary of the date of award. No further awards will be made under this plan.
58 Tesco PLC Annual Report and Financial Statements 2014
Directors’ remuneration report continued2013/14 Policy Report

CEO
100%
£1.6m
35% 22%
31%
34%37%
£4.6m
41%
£7.7m
Fixed pay
Threshold Target Maximum
8
7
6
5
4
3
2
1
0
Annual bonus Long-term incentive
(£million)
Minimum • No bonus payout• No vesting under the Performance Share Plan
On target performance • 50% annual bonus payout• 50% vesting under the Performance Share Plan
Maximum performance • 100% annual bonus payout• 100% Performance Share Plan vesting
No share price growth or the payment of dividend equivalents has been assumed. Potential benefits under all-employee share schemes have not been included.
Fixed pay is based on current values as set out in the table below.
Salary Benefits Pension Total fixed pay
From 1 July 2013
Value for 2013/14
Value for 2013/14
CEO (Philip Clarke)
£1,145k £107k £391k £1,643k
Remuneration outcomes in different performance scenariosTesco remuneration arrangements have been designed to ensure that a significant proportion of pay is dependent on the delivery of short-term and long-term goals that are aligned with our short-term and long-term strategic objectives and the creation of shareholder value. The Committee considers the level of remuneration that may payout in different performance scenarios to ensure that this is considered appropriate in the context of the performance delivered and the value added for shareholders. The charts below show hypothetical values of the remuneration package for Executive Directors under three assumed performance scenarios:
Maximum award opportunities (% of salary)
CEO
Annual bonus 250%
PSP 275%
Remuneration policy for new hiresThe Committee would generally seek to align the remuneration package offered to new executives with our remuneration policy outlined in the table above. When determining appropriate remuneration arrangements the Committee will take into account all relevant factors including the experience and calibre of the candidate, the candidate’s current reward opportunity, and the jurisdiction the candidate was recruited from.
In respect of an Executive Director’s appointment the Committee may offer variable remuneration arrangements that it considers appropriate and necessary to recruit and retain the individual (subject to the maximum variable limit outlined below).
Variable remuneration awarded in respect of an Executive Director’s appointment shall be limited to the current aggregate annual and PSP award policy of 600% of base salary. This limit includes awards granted under the normal policy outlined above but excluding any awards made to compensate the Executive Director for awards forfeited from their previous employer.
The Committee may make awards when appointing an Executive Director to ‘buy out’ remuneration terms forfeited on leaving a previous employer. In doing so the Committee will take account of relevant factors including any performance conditions attached to these awards, the form in which they were granted (e.g. cash or shares) and the time over which they would have vested. The Committee’s key principle is that generally buy-out awards will be made on a comparable basis to those forfeited.
To facilitate buy-out awards outlined above, in the event of recruitment, the Committee may grant awards to a new Executive Director under the Listing Rule 9.4.2 which allows for the granting of awards, to facilitate, in unusual circumstances, the recruitment of an Executive Director, or under other relevant company incentive plans.
In the event that an internal candidate was promoted to the Board legacy terms and conditions would normally be honoured, including pension entitlements and any outstanding incentive awards.
In the event of the appointment of a new Chairman or Non-executive Director remuneration arrangements will normally reflect the policy outlined on page 61 for Chairmen and Non-executive Directors.
Executive Director service contracts and policy on Executive Directors leaving TescoWhen determining leaving arrangements for an Executive Director the Committee takes into account any contractual agreements including the provisions of any incentive arrangements, typical market practice and the performance and conduct of the individual.
The following table summarises our policy in relation to Executive Director service contracts and payments in the event of loss of office. O
ther in
form
ation
Govern
ance
Finan
cial statemen
tsS
trategic rep
ort
Tesco PLC Annual Report and Financial Statements 2014 59

Provision Current service contracts
Notice period • 12 months’ notice by the Company and six months’ notice by the Executive Director.• For new appointments the Committee reserves the right to vary this period to 24 months for the initial period of appointment
and for the notice period to then revert to 12 months after the initial 12 months of employment.
Expiry date • Philip Clarke and Laurie McIlwee entered into service agreements with Tesco PLC on 31 May 2011 and 27 January 2009 respectively.• These are rolling service contracts with no fixed expiry date.
Termination payments (does not apply if notice is provided, as per the service agreement, or for termination by reason of resignation or unacceptable performance or conduct)
• If the Company terminates a Director’s contract without full notice or it is terminated by an Executive Director in response to a serious contractual breach by the Company then the Executive has the right to a termination payment to reflect the unexpired term of the notice.
• For Philip Clarke any termination payment in lieu of notice will be based on base salary and benefits only.• For Laurie McIlwee his termination payment in lieu of notice is based on base salary, benefits and the average annual bonus
paid for the last two years.• Our policy for new appointments is that termination payments in lieu of notice will be based on base salary and benefits only.• Benefits comprise car related benefits, healthcare and health insurance and staff discount.• No account will be taken of pension when determining termination payments.• Termination payments will normally be subject to mitigation and paid in instalments to facilitate this (other than for long-serving
Executive Directors or in the event of a change of control of the Company where the termination payment is made in full on departure). For details of Laurie’s termination payment please see page 51. Where an Executive Director has less than eight years of continuous service then any termination payment will normally be made in 13 equal four-weekly payments. Where an Executive Director has more than 15 years’ continuous service then the termination payment is made in full on departure. For periods of continuous service between eight years and 15 years termination payments will normally be split between initial payments and phased payments.
• Payment in full on termination on change of control arises if company terminates or gives notice within 12 months after a change of control.
• Where an Executive Director retires from the business they will not normally receive a termination payment.• The Company’s obligation to continue making phased termination payments will cease when the Executive Director
commences alternative employment.• In the event of termination an Executive Director may have an entitlement to compensation in respect of statutory rights under
employment protection legislation in the UK and potentially elsewhere.
Other information • The Committee may determine that an Executive Director may remain eligible to receive a pro-rata bonus for the financial year in respect of the period they remained in employment. The Committee will determine the level of bonus taking into account time in employment and performance. Where an Executive leaves by reason of death, disability or ill-heath they are entitled to a pro-rata performance based bonus for the year of leaving.
• In the event that an Executive Director retires from the Company they shall be entitled to retain their private medical cover and annual medical examinations in retirement. Any Executive Directors appointed from 24 February 2013 will not be entitled to this benefit.
• Under the employment contracts, while in employment Executive Directors are also entitled to sick pay, paid holiday, maternity and paternity leave.
• Where appropriate the Company will meet an Executive Director’s reasonable legal fees in connection with the termination of his employment and/or the reasonable cost of out-placement services.
The service agreements are available to shareholders to view at the Company’s registered office.
Share plan rules – leaver provisionsThe treatment of outstanding share awards in the event that an Executive Director leaves is governed by the relevant share plan rules. The following table summarises leaver provisions under the executive share plans. In specific circumstances the Committee may exercise its discretion to modify the policy outlined to the extent that the rules of the share plan allow such discretion. The Committee will not exercise discretion to allow awards to vest where the participant is dismissed for gross misconduct.
Death‘Good leavers’ as determined by the Committee in accordance with the plan rules
Leavers in other circumstances (other than summary dismissal)
‘Good leavers’ are: injury, ill-heath or disability, redundancy, retirement, the entity which employs the Executive ceasing to be part of the group or any other reason determined by the Committee taking into account the circumstances of departure and performance.
Executive Incentive Plan 2014(deferred bonus shares)
• Unvested awards vest at cessation.• Normally 12 months to exercise
(if options).
• Unvested awards vest at cessation (Committee discretion to defer vesting to normal vesting date).
• Normally 12 months to exercise (if options).
• Awards normally lapse.
Performance Share Plan 2011
• Unvested awards normally vest on death. The level of vesting is determined by the Committee taking into account performance and the time elapsed between grant and death.
• If awards are in the form of options, participants normally have 12 months from vesting (or cessation for vested options) to exercise or a longer period as determined by the Committee of up to 10 years from grant.
• Awards granted in the 12 months prior to leaving normally lapse (where more than one award has been made in the 12 month period in respect of different financial years the most recent award will lapse).
• If a participant leaves holding three unvested awards (in respect of different financial years) the most recent granted award shall normally lapse.
• Other unvested awards normally continue until the normal vesting date. The Committee will determine the level of vesting taking into account performance.
• If awards are in the form of options participants normally have 12 months from vesting (or leaving for vested options) to exercise or a longer period determined by the Committee of up to 10 years from grant.
• Unvested awards normally lapse unless the Committee determines otherwise.
• If awards are in the form of options participants normally have 12 months from cessation to exercise vested options or a longer period as determined by the Committee of up to 10 years from grant.
All-employee share plans
• Leaver provisions under all-employee share plans are as determined in accordance with HMRC approved provisions.
Legacy plansDeferred shares awarded prior to 2014 were granted under the 2004 Executive Incentive Plan. Under this plan in the event that a participant leaves for ‘good leaver’ reasons (death, injury, ill-heath, disability, redundancy, retirement, the entity which employs the Executive Director
60 Tesco PLC Annual Report and Financial Statements 2014
Directors’ remuneration report continued2013/14 Policy Report

ceasing to be part of the group or any other reason determined by the Committee) awards will vest at leaving and participants will normally have 12 months from cessation to exercise awards in the form of options. If a participant leaves in other circumstances (other than in circumstances of gross misconduct) awards will normally vest at the normal vesting date and participants will normally have 12 months from vesting to exercise awards in the form of options. Executive Directors hold vested options under the 2004 Discretionary Share Option Plan. When an Executive Director leaves they would have 12 months from leaving to exercise options (three years in the case of ‘good leavers’ as set out above).
Other vesting circumstancesAwards may also vest early if: (i) a participant is transferred to a country, as a result of which the participant will suffer a tax disadvantage or become subject to
restrictions on his award; or(ii) in the event of a takeover, winding-up or other corporate event affecting the Company, which may affect the value of share awards
(such as a demerger or special dividend).
The number of shares under an award which vest in these circumstances will be determined by the Committee. In the case of the PSP when determining the level of vesting the Committee will consider performance and the time elapsed since grant. In the case of the deferred bonus shares (under the 2004 and 2014 EIP) awards will vest in full.
Where an Executive Director leaves as a result of summary dismissal they will forfeit outstanding share incentive awards.
Remuneration policy for Non-executive Directors
Approach to setting fees Basis of fees Other items
• Fees for the Non-executive Chairman and Non-executive Directors are set at an appropriate level to recruit and retain Directors of a sufficient calibre to guide and influence Board level decision making without paying more than is necessary to do so.
• Fees are set taking into account the following factors: – The time commitment required to fulfil the role. – Typical practice at other companies of a similar
size and complexity to Tesco.• Non-executive Directors’ fees are set by the Board
and the Chairman’s fee is set by the Committee (the Chairman does not take part in any discussion about his fees).
• Fees are reviewed by the Board at appropriate intervals (normally once every two years).
• Fees paid to the Non-executive Chairman and Non-executive Directors may not exceed the aggregate limit of £2m set out in the Company’s articles of association.
• Non-executive Director fees policy is to pay: – A basic fee for membership of the Board. – An additional fee for the Chairman of a Committee
and the Senior Independent Director to take into account the additional responsibilities and time commitment of the role.
– An additional fee for membership of a Committee to take into account the additional responsibilities and time commitment of the role.
• Additional fees may be paid to reflect additional Board or committee responsibilities as appropriate.
• Non-executive Directors of Tesco PLC may also serve on the Board of Tesco Personal Finance Group Limited. Such Non-executive Directors also receive a basic fee for serving on this Board and additional fees for Committee membership in line with other members of this Board. Fees for membership of the Board of Tesco Personal Finance Group Limited are determined by the Board of Tesco Personal Finance Group Limited and are reviewed at appropriate intervals.
• The Non-executive Chairman of Tesco PLC receives an all-inclusive fee for the role.
• Where significant travel is required to attend Board meetings, additional fees may be paid to reflect this additional time commitment.
• The Non-executive Directors are not entitled to participate in annual bonus or long-term incentive arrangements.
• The Non-executive Directors have the benefit of Directors’ and Officers’ liability insurance and provision of indemnity and staff discount on the same basis as other employees. The Board may introduce additional benefits for Non-executive Directors if it is considered appropriate to do so.
• The Non-executive Chairman has the benefit of a company car and driver, home security, staff discount and healthcare for himself and his partner. The Committee may introduce additional benefits for the Chairman if it is considered appropriate to do so.
• The Company reimburses the Chairman and Non-executive Directors for reasonable expenses in performing their duties and may settle any tax incurred in relation to these.
• The Company will pay for reasonable legal fees for advice in relation to terms of engagement.
• If a Non-executive Director was based overseas then the Company would meet travel and accommodation expenditure as required to fulfil Non-executive duties.
Non-executive Director letters of appointmentNon-executive Directors have letters of appointment setting out their duties and the time commitment expected. Appointments are for an initial period of three years after which they are reviewed. In line with the UK Corporate Governance Code, all Non-executive Directors submit themselves for re-election by shareholders every year at the Annual General Meeting. All Non-executive Directors’ appointments can be terminated by either party without notice. Non-executive Directors have no entitlement to compensation on termination.
The letters of appointment are available for shareholders to view at the Company’s registered office.
Considering colleagues viewsThe Committee does not consider that it is appropriate to consult directly with colleagues when developing the Directors’ remuneration policy. A significant portion of our colleagues are shareholders so are able to express their views in the same way as other shareholders.
The Company undertakes an annual viewpoint survey for all Group employees to understand their views on working for Tesco and how this can be improved. Feedback on employee reward is provided as part of this survey.
The Committee reviews information regarding the typical remuneration structure and reward levels for other UK based employees to provide context when determining executive remuneration policy.
Considering shareholders’ viewsThe Committee believes that it is very important to maintain open dialogue with shareholders on remuneration matters. The Committee regularly consults with significant shareholders regarding potential changes to remuneration arrangements and the views of shareholders are important in determining any final changes. Going forward the Committee will continue to liaise with shareholders regarding remuneration matters more generally and Tesco arrangements as appropriate. It is the Committee’s intention to consult with major shareholders in advance of making any material changes to remuneration arrangements.
Approved by the Board on 2 May 2014Stuart Chambers, Chairman of the Remuneration Committee
Oth
er info
rmatio
nG
overnan
ceFin
ancial statem
ents
Strateg
ic repo
rt
Tesco PLC Annual Report and Financial Statements 2014 61

The Directors present their report, together with the audited accounts for the year ended 22 February 2014. Other information that is relevant to the Directors’ report, and which is incorporated by reference into this report, can be located as follows:
Page
Future developments 1 to 25
Greenhouse gas emissions 19
Financial instruments and financial risk management 25, 99 to 108
Corporate governance report 26 to 40
The Company has chosen, in accordance with Section 414 C(ii) of the Companies Act 2006, and as noted in this Directors’ report, to include certain matters in its Strategic report that would otherwise be required to be disclosed in this Directors’ report. The Strategic report can be found on pages 1 to 25 of the Annual Report and Financial Statements 2014.
Group results*
Group revenue (excluding VAT) rose by £151 million to £63.6 billion, representing an increase of 0.2%. Group profit before tax increased by £202 million to £2,259 million. Profit for the year including discontinued operations was £970 million, of which £974 million was attributable to equity holders of the parent company.
DividendsThe Directors recommend the payment of a final dividend of 10.13p per ordinary share, to be paid on 4 July 2014 to members on the Register at the close of business on 2 May 2014. Together with the interim dividend of 4.63p per ordinary share paid in December 2013, the full-year dividend will be maintained at 14.76p per ordinary share (2012/13: 14.76p).
Fixed assets*
Capital expenditure (excluding business combinations) amounted to £2.7 billion compared with £2.7 billion the previous year.
Share capital and control of the Company and significant agreementsDetails of the Company’s share capital, including changes during the year in the issued share capital and details of the rights attaching to the Company’s ordinary shares, are set out in Note 27 on page 116 of the Annual Report and Financial Statements 2014. No shareholder holds securities carrying special rights with regards to control of the Company. There are no restrictions on voting rights or the transfer of securities in the Company and the Company is not aware of any agreements between holders of securities that result in such restrictions.
The Company was authorised by shareholders at the 2013 AGM to purchase its own shares in the market up to a maximum of approximately 10% of its issued share capital. No shares were purchased under that authority during the financial year. The Company is seeking to renew the authority at the forthcoming AGM, within the limits set out in the notice of that meeting.
Shares held by the Company’s Employee Share Incentive Plan Trust, International Employee Benefit Trust, Tesco Ireland Share Bonus Scheme Trust and Tesco Employee Share Scheme Trust rank pari passu with the shares in issue and have no special rights. Voting rights and rights of acceptance of any offer relating to the shares held in these trusts rests with the trustees, who may take account of any recommendation from the Company. Voting rights are not exercisable by the employees on whose behalf the shares are held in trust.
The Company is not party to any significant agreements that would take effect, alter or terminate following a change of control of the Company. The Company does not have agreements with any Director or Officer that would provide compensation for loss of office or employment resulting from a takeover, except that provisions of the Company’s share plans may cause options and awards granted under such plans to vest on a takeover.
Company’s shareholdersThe Company has been notified of the following significant holdings of voting rights in its shares as at 22 February 2014 and as at the date of this report:
% of issued share capital as at
22 February 2014
% of issued share capital as at the date
of this report
Berkshire Hathaway Inc. 3.98 3.98
Norges Bank 6.09 7.002
Articles of AssociationThe Company’s Articles of Association may only be amended by special resolution at a general meeting of the shareholders.
Directors and their interestsThe Directors who served during the year were: Mark Armour; Sir Richard Broadbent; Gareth Bullock; Patrick Cescau; Stuart Chambers; Philip Clarke; Olivia Garfield; Ken Hanna; Laurie McIlwee; Deanna Oppenheimer; and Jacqueline Tammenoms Bakker. Laurie McIlwee stepped down as CFO and from the Board with effect from 4 April 2014. The biographical details of the Directors are set out on pages 26 and 27 of this Annual Report.
The interests of Directors and their immediate families in the shares of Tesco PLC, along with details of Directors’ share options, are contained in the Directors’ Remuneration Report set out on pages 41 to 61.
At no time during the year did any of the Directors have a material interest in any significant contract with the Company or any of its subsidiaries. A qualifying third-party indemnity provision as defined in Section 234 of the Companies Act 2006 is in force for the benefit of each of the Directors and the Company Secretary (who is also a Director of certain subsidiaries of the Company) in respect of liabilities incurred as a result of their office, to the extent permitted by law. In respect of those liabilities for which directors may not be indemnified, the Company maintained a directors’ and officers’ liability insurance policy throughout the financial year.
Employment policies Our core purpose is at the heart of our business: ‘we make what matters better, together’ applies to our colleagues as well as our customers and communities.
We believe it is essential for our colleagues to have a voice. Listening and connecting with colleagues enables us to understand what matters to them and to respond by taking action to make what matters better. We use a variety of communication channels to regularly engage, consult, inform and connect with our teams so that the views of our colleagues can be taken into account when key decisions are made that affect them.
Our Values underpin our development of fair and inclusive policies and encourage advocacy, engagement and loyalty so that our colleagues can be their best and help to deliver a fantastic customer experience. Collaboration and working as one team means we make a greater difference collectively rather than as individuals.
* Unless otherwise stated, all figures are reported on a continuing operations basis and exclude China and the United States which have been treated as discontinued.
62 Tesco PLC Annual Report and Financial Statements 2014
Directors’ report

We are committed to improving the skills, knowledge and wellbeing of our colleagues. Our selection, training, development and promotion policies ensure equal opportunities for all colleagues regardless of factors such as gender, marital status, race, age, sexual preference and orientation, colour, creed, ethnic origin, religion or belief, disability or trade union affiliation. All decisions are based on merit.
We actively encourage colleagues to become involved in the financial performance of our business through a variety of voluntary share schemes.
Political donationsThe Group did not make any political donations (2012/13: £nil) or incur any political expenditure during the year (2012/13: £33,583).
Compliance with the Groceries (Supply Chain Practices) Market Investigation Order 2009 and the Groceries Supply Code of Practice (‘Code’)The Code places obligations on grocery retailers with a turnover greater than £1 billion to maintain a Code compliance programme, which includes training staff and providing information to the Competition and Markets Authority. In addition, the Code sets out a number of provisions which relate to different aspects of the relationship between a retailer and supplier.
We are committed to treating our suppliers fairly and work in collaboration with them wherever possible. We have in place a Code Compliance Officer supported by a compliance team including a Code auditor. We have an audit plan and our approach enables us to identify any gaps in our processes so they can be quickly fixed. We also have in place an ongoing compliance training programme for our buying teams, with comprehensive training for relevant new starters and annual refresher training. We have strengthened our compliance in this area through the improvement of our e-learning tool to provide interactive online training for staff. We have also generated new mechanisms to improve our paperwork and agreements with our suppliers.
In the past year we have actively engaged and co-operated with the recently created Groceries Code Adjudicator (GCA), Christine Tacon, and her office. We have also focused on communication and dialogue with our suppliers.
Twelve Code-related complaints were raised by suppliers this year, all of which were resolved through discussion with the suppliers concerned. We have had two instances where complaints were referred to the Code Compliance Officer, although in neither of those instances was a formal dispute raised as both matters were resolved with the suppliers concerned. There was one instance in which an alleged breach was raised by a third party in relation to requests to a limited number of suppliers for funding associated with shelf positioning. The requests from suppliers were withdrawn and the matter was openly discussed with the GCA. Consequently, the GCA issued a GSCOP clarification in March 2014 on the issue. This provided guidance for suppliers and retailers on the interpretation of the GSCOP provisions relating to shelf positioning. The Code Compliance Officer regularly reports to our Compliance Committees and Audit Committee, which retain effective oversight of our compliance with the Code.
Going concernThe Directors consider that the Group and the Company have adequate resources to remain in operation for the foreseeable future and have therefore continued to adopt the going concern basis in preparing the financial statements.
Events after the Balance Sheet dateOn 21 March 2014, the Group entered into an agreement with Trent Limited, part of the Tata Group, to form a 50:50 joint venture in Trent Hypermarket Limited which operates the Star Bazaar retail business in India. The Group’s investment is £85 million.
On 2 April 2014, the Group, through its subsidiary dunnhumby Limited, acquired Sociomantic Labs (‘Sociomantic’), a Berlin-based global leader in digital advertising solutions, for £124 million. Sociomantic operates in 14 countries worldwide, with clients in retail, financial services and travel services.
AuditorsA resolution to reappoint PricewaterhouseCoopers LLP as auditors of the Company and the Group will be proposed at the 2014 AGM.
Directors’ statement of disclosure of information to auditorsHaving made the requisite enquiries, the Directors in office at the date of this Annual Report and Financial Statements have each confirmed that, so far as they are aware, there is no relevant audit information (as defined by Section 418 of the Companies Act 2006) of which the Group’s auditors are unaware, and each of the Directors has taken all the steps he/she ought to have taken as a Director to make himself/herself aware of any relevant audit information and to establish that the Group’s auditors are aware of that information. This confirmation is given and should be interpreted in accordance with the provisions of Section 418 of the Companies Act 2006.
Cautionary statement regarding forward-looking informationWhere this document contains forward-looking statements, these are made by the Directors in good faith based on the information available to them at the time of their approval of this report. These statements should be treated with caution due to the inherent risks and uncertainties underlying any such forward-looking information. The Group cautions investors that a number of factors, including matters referred to in this document, could cause actual results to differ materially from those contained in any forward-looking statement. Such factors include, but are not limited to, those discussed under ‘Principal risks and uncertainties’ on pages 20 to 25 of this Annual Report.
By order of the BoardJonathan Lloyd Company Secretary2 May 2014
Oth
er info
rmatio
nG
overnan
ceFin
ancial statem
ents
Strateg
ic repo
rt
Tesco PLC Annual Report and Financial Statements 2014 63

The Directors are required by the Companies Act 2006 to prepare financial statements for each financial year which give a true and fair view of the state of affairs of the Group and the Company as at the end of the financial year and of the profit or loss of the Group for the financial year. Under that law the Directors are required to prepare the Group financial statements in accordance with International Financial Reporting Standards (‘IFRS’) as adopted by the European Union (‘EU’) and have elected to prepare the Company financial statements in accordance with UK Accounting Standards.
In preparing the Group and Company financial statements, the Directors are required to:
• select suitable accounting policies and then apply them consistently;•make reasonable and prudent judgements and estimates;• for the Group financial statements, state whether they have
been prepared in accordance with IFRS, as adopted by the EU;• for the Company financial statements, state whether applicable
UK Accounting Standards have been followed; and• prepare the financial statements on the going concern basis,
unless it is inappropriate to presume that the Group and the Company will continue in business.
The Directors, whose names and functions are set out on pages 26 and 27 confirm that, to the best of their knowledge:
• the Group financial statements, which have been prepared in accordance with IFRS, as adopted by the EU, give a true and fair view of the assets, liabilities, financial position and profit of the Group; and• the Strategic report contained within this document includes a
fair review of the development and performance of the business and the position of the Group, as well as a description of the principal risks and uncertainties that it faces.
The Directors consider that the Annual Report and Financial Statements, taken as a whole, is fair, balanced and understandable and provides the information necessary for shareholders to assess the Company’s and Group’s performance, business model and strategy.
The Directors are responsible for keeping proper accounting records, which disclose with reasonable accuracy at any time the financial position of the Group and the Company and which enable them to ensure that the financial statements and the Directors’ remuneration report comply with the Companies Act 2006 and, as regards the Group financial statements, Article 4 of the IAS Regulation.
The Directors are responsible for the maintenance and integrity of the Company’s website. Legislation in the UK concerning the preparation and dissemination of financial statements may differ from legislation in other jurisdictions.
The Directors have general responsibility for taking such steps as are reasonably open to them to safeguard the assets of the Group and of the Company and to prevent and detect fraud and other irregularities.
64 Tesco PLC Annual Report and Financial Statements 2014
Statement of Directors’ responsibilities

Report on the Group financial statementsOur opinion In our opinion the Group financial statements, defined below:
• give a true and fair view of the state of the Group’s affairs as at 22 February 2014 and of the Group’s profit and cash flows for the 52 weeks then ended;• have been properly prepared in accordance with International
Financial Reporting Standards (IFRSs) as adopted by the European Union; and• have been prepared in accordance with the requirements of
the Companies Act 2006 and Article 4 of the IAS Regulation.
This opinion is to be read in the context of what we say in the remainder of this report.
What we have auditedThe Group financial statements, which are prepared by Tesco PLC, comprise:
• the Group balance sheet as at 22 February 2014;• the Group income statement and statement of comprehensive
income for the 52 weeks then ended;• the Group statement of changes in equity and cash flow
statement for the 52 weeks then ended; and• the notes to the Group financial statements, which include
a summary of significant accounting policies and other explanatory information.
The financial reporting framework that has been applied in their preparation comprises applicable law and IFRSs as adopted by the European Union.
Certain disclosures required by the financial reporting framework have been presented elsewhere in the Annual Report and Financial Statements (the ‘Annual Report’), rather than in the notes to the financial statements. These are cross-referenced from the financial statements and are identified as audited.
What an audit of financial statements involves We conducted our audit in accordance with International Standards on Auditing (UK and Ireland) (‘ISAs (UK & Ireland)’). An audit involves obtaining evidence about the amounts and disclosures in the financial statements sufficient to give reasonable assurance that the financial statements are free from material misstatement, whether caused by fraud or error. This includes an assessment of:
• whether the accounting policies are appropriate to the Group’s circumstances and have been consistently applied and adequately disclosed;• the reasonableness of significant accounting estimates made
by the directors; and • the overall presentation of the financial statements.
In addition, we read all the financial and non-financial information in the Annual Report to identify material inconsistencies with the audited Group financial statements and to identify any information that is apparently materially incorrect based on, or materially inconsistent with, the knowledge acquired by us in the course of performing the audit. If we become aware of any apparent material misstatements or inconsistencies we consider the implications for our report.
Overview of our audit approachMaterialityWe set certain thresholds for materiality. These helped us to determine the nature, timing and extent of our audit procedures and to evaluate the effect of misstatements, both individually and on the financial statements as a whole.
Based on our professional judgement, we determined materiality for the Group financial statements as a whole to be £150 million. This represents approximately 5% of profit before tax adjusted for restructuring and one-off items.
We agreed with the Audit Committee that we would report to them misstatements identified during our audit above £7 million as well as misstatements below that amount that, in our view, warranted reporting for qualitative reasons.
Overview of the scope of our auditThe Group is primarily structured as three geographic regions, being UK, Asia and Europe, and Tesco Bank. The Group financial statements are a consolidation of nineteen reporting units, comprising the Group’s operating businesses and centralised functions, within these regions.
In establishing the overall approach to the Group audit, we determined the type of work that needed to be performed at reporting units by us, as the Group engagement team, or component auditors within PwC UK and from other PwC network firms operating under our instruction. Where work was performed by component auditors, we determined the level of involvement we needed to have in the audit work at those reporting units to be able to conclude whether sufficient appropriate audit evidence had been obtained as a basis for our opinion on the Group financial statements as a whole.
Accordingly, we identified three reporting units which, in our view, required an audit of their complete financial information, either due to their size or their risk characteristics. These three reporting units accounted for 92% of the Group’s profit before tax adjusted for restructuring and one-off items, of which the main UK trading business contributed 73%. Audits of their complete financial information were also performed for a further eight overseas reporting units where there are local statutory reporting requirements and specific audit procedures on certain balances and transactions were performed at a further two reporting units. Our audit work at these reporting units, together with additional procedures performed at the Group level, gave us the evidence we needed for our opinion on the Group financial statements as a whole.
Oth
er info
rmatio
nG
overnan
ceFin
ancial statem
ents
Strateg
ic repo
rt
Tesco PLC Annual Report and Financial Statements 2014 65
Independent auditors’ report to the members of Tesco PLC

Area of focus How the scope of our audit addressed the area of focus
Recognition of commercial income
Commercial income (promotional monies, discounts and rebates receivable from suppliers) recognised during the year is material to the income statement and amounts accrued at the year end are judgemental.
We focused on this area because of the judgement required in accounting for the commercial income deals and the risk of manipulation of these balances.
We tested the controls management has in place, focusing on controls over price changes and margin reviews.
We agreed commercial income recognised to contractual evidence with suppliers, with particular attention to the period in which the income was recorded and the appropriateness of the accrual at the year end.
We compared movements year on year in margins for product categories based on an expectation derived from our sample testing of contracts with suppliers.
Impairment of property, plant and equipment
We focused on this area because the determination of whether or not an impairment charge for property, plant and equipment is necessary involves significant judgements by the Directors about the future results of the business and assessment of future plans for the Group’s property portfolio in a number of territories.
We evaluated the Directors’ impairment calculations in local territories, assessing the future cash flow forecasts used in the models, and the process by which they were drawn up, including comparing them to the latest Board approved budgets, and testing the underlying calculations. We challenged:
• the key assumptions for long-term growth rates in the forecasts by comparing them to historical results, and economic and industry forecasts; • the discount rate by assessing the cost of capital for the Company
and comparable organisations; and • the alternative use value for land not expected to be developed.
We also performed sensitivity analysis around the key drivers of growth rates of the cash flow forecasts, including revenue growth and expected changes in margins. Having ascertained the extent of change in those assumptions that either individually or collectively would be required for the assets to be impaired, we considered the likelihood of such a movement in those key assumptions arising.
Areas of particular audit focusIn preparing the financial statements, the Directors made a number of subjective judgements, for example in respect of significant accounting estimates that involved making assumptions and considering future events that are inherently uncertain. We primarily focused our work in these areas by assessing the Directors’ judgements against available evidence, forming our own judgements, and evaluating the disclosures in the financial statements.
In our audit, we tested and examined information, using sampling and other auditing techniques, to the extent we considered necessary to provide a reasonable basis for us
to draw conclusions. We obtained audit evidence through testing the effectiveness of controls, substantive procedures or a combination of both.
We considered the following areas to be those that required particular focus in the current year. This is not a complete list of all risks or areas of focus identified by our audit. We discussed these areas of focus with the Audit Committee. Their report on those matters that they considered to be significant issues in relation to the financial statements is set out on page 33.
66 Tesco PLC Annual Report and Financial Statements 2014
Independent auditors’ report to the members of Tesco PLC continued

Area of focus How the scope of our audit addressed the area of focus
Valuation of assets held for sale
We focused on this area due to the significant and complex judgements required over determining the fair value of the Group’s operations in China, which are disclosed in the financial statements within assets held for sale.
We assessed and challenged the valuation techniques and assumptions in the third party valuation report commissioned by management. This included assessing and challenging:
• the independence, scope of work and findings of management’s third party valuation expert; and• the cashflow forecasts and key assumptions over growth and
discount rates.
We also assessed the valuation against available entity specific and similar transaction market data.
Provisions and reserves in Tesco Bank
We focused on this area because of the significant judgement required by the Directors in determining the level of provision for the following areas:
•Loan, credit card and mortgage impairments•Provisions of customer redress • Insurance reserving
We assessed the overall control environment at Tesco Bank and performed a combination of internal controls testing and substantive testing. We tested the year end product reconciliations, the impairment provisions recognised and the level of suspended interest.
We have assessed and challenged the assumptions made by management in calculating the provisions for redress. We have reviewed historical data to assess whether trends in customer claims have been accurately reflected in the provisions.
We evaluated the work performed by independent actuaries and challenged the key assumptions the Directors have made for insurance reserving by using our market knowledge of the UK Motor and Household insurance products to perform corroborative analytics.
Risk of management override of internal controls
ISAs (UK & Ireland) require that we consider this. We assessed the overall control environment of the Group, including the arrangements for staff to “whistleblow” inappropriate actions, and interviewed senior management and the Group’s internal audit function. We examined the significant accounting estimates and judgements relevant to the financial statements for evidence of bias by the Directors that may represent a risk of material misstatement due to fraud. We also tested manual journal entries and incorporated an element of unpredictability in the timing of our work into our testing plans.
Risk of fraud in revenue recognition
ISAs (UK & Ireland) presume there is a risk of fraud in revenue recognition because of the pressure management may feel to achieve the planned results. Therefore we focused on the occurrence of transactions and whether they were recorded in the period in which the Group became entitled to record revenue.
We tested controls over the recording of revenue in the relevant IT systems and performed substantive testing of revenue recorded during the year. We tested that retail sales transactions are supported by cash receipts and also tested journal entries posted to revenue accounts to identify unusual or irregular items.
Oth
er info
rmatio
nG
overnan
ceFin
ancial statem
ents
Strateg
ic repo
rt
Tesco PLC Annual Report and Financial Statements 2014 67

Going ConcernUnder the Listing Rules we are required to review the Directors’ statement, set out on page 64, in relation to going concern. We have nothing to report having performed our review.
As noted in the Directors’ statement, the Directors have concluded that it is appropriate to prepare the Group’s financial statements using the going concern basis of accounting. The going concern basis presumes that the Group has adequate resources to remain in operation, and that the Directors intend it to do so, for at least one year from the date the financial statements were signed. As part of our audit we have concluded that the Directors’ use of the going concern basis is appropriate.
However, because not all future events or conditions can be predicted, these statements are not a guarantee as to the Group’s ability to continue as a going concern.
Opinion on other matter prescribed by the Companies Act 2006In our opinion the information given in the Strategic Report and the Directors’ Report for the financial year for which the Group financial statements are prepared is consistent with the Group financial statements.
Other matters on which we are required to report by exceptionAdequacy of information and explanations receivedUnder the Companies Act 2006 we are required to report to you if, in our opinion we have not received all the information and explanations we require for our audit. We have no exceptions to report arising from this responsibility.
Directors’ remunerationUnder the Companies Act 2006 we are required to report to you if, in our opinion, certain disclosures of directors’ remuneration specified by law have not been made. We have no exceptions to report arising from this responsibility.
Corporate Governance StatementUnder the Listing Rules we are required to review the part of the Corporate Governance Statement relating to the Company’s compliance with nine provisions of the UK Corporate Governance Code (‘the Code’). We have nothing to report having performed our review.
On page 64 of the Annual Report, as required by the Code Provision C.1.1, the Directors state that they consider the Annual Report taken as a whole to be fair, balanced and understandable and provides the information necessary for members to assess the Group’s performance, business model and strategy. On page 34, as required by C.3.8 of the Code, the Audit Committee has set out the significant issues that it considered in relation to the financial statements, and how they were addressed. Under ISAs (UK & Ireland) we are required to report to you if, in our opinion:
• the statement given by the Directors is materially inconsistent with our knowledge of the Group acquired in the course of performing our audit; or• the section of the Annual Report describing the work of the
Audit Committee does not appropriately address matters communicated by us to the Audit Committee.
We have no exceptions to report arising from this responsibility.
Other information in the Annual ReportUnder ISAs (UK & Ireland), we are required to report to you if, in our opinion, information in the Annual Report is:
•materially inconsistent with the information in the audited Group financial statements; or• apparently materially incorrect based on, or materially
inconsistent with, our knowledge of the Group acquired in the course of performing our audit; or• is otherwise misleading.
We have no exceptions to report arising from this responsibility.
Responsibilities for the financial statements and the auditOur responsibilities and those of the directors As explained more fully in the Directors’ Responsibilities Statement set out on page 64, the directors are responsible for the preparation of the Group financial statements and for being satisfied that they give a true and fair view.
Our responsibility is to audit and express an opinion on the Group financial statements in accordance with applicable law and ISAs (UK & Ireland). Those standards require us to comply with the Auditing Practices Board’s Ethical Standards for Auditors.
This report, including the opinions, has been prepared for and only for the Company’s members as a body in accordance with Chapter 3 of Part 16 of the Companies Act 2006 and for no other purpose. We do not, in giving these opinions, accept or assume responsibility for any other purpose or to any other person to whom this report is shown or into whose hands it may come save where expressly agreed by our prior consent in writing.
Other matter We have reported separately on the Parent Company Financial statements of Tesco PLC for the 52 weeks ended 22 February 2014.
Mark Gill (Senior Statutory Auditor)for and on behalf of PricewaterhouseCoopers LLPChartered Accountants and Statutory Auditors
London 2 May 2014
68 Tesco PLC Annual Report and Financial Statements 2014
Independent auditors’ report to the members of Tesco PLC continued

Year ended 22 February 2014 Notes
52 weeks2014
£m
52 weeks2013
(restated*)£m
Continuing operations
Revenue 2 63,557 63,406
Cost of sales (59,547) (59,252)
Gross profit 4,010 4,154
Administrative expenses (1,657) (1,482)
Profits/losses arising on property-related items 278 (290)
Operating profit 2,631 2,382
Share of post-tax profits of joint ventures and associates 13 60 72
Finance income 5 132 120
Finance costs 5 (564) (517)
Profit before tax 3 2,259 2,057
Taxation 6 (347) (529)
Profit for the year from continuing operations 1,912 1,528
Discontinued operations
Loss for the year from discontinued operations 7 (942) (1,504)
Profit for the year 970 24
Attributable to:
Owners of the parent 974 28
Non-controlling interests (4) (4)
970 24
Earnings per share from continuing and discontinued operationsBasic 9 12.07p 0.35p
Diluted 9 12.06p 0.35p
Earnings per share from continuing operationsBasic 9 23.75p 19.07p
Diluted 9 23.72p 19.06p
Non-GAAP measure: underlying profit before tax
Notes
52 weeks2014
£m
52 weeks2013
(restated*)£m
Profit before tax from continuing operations 2,259 2,057
Adjustments for:
IAS 32 and IAS 39 ‘Financial Instruments’ – fair value remeasurements 1/5 11 15
IAS 19 ‘Employee Benefits’ – non-cash Group Income Statement charge for pensions 1 117 69
IAS 17 ‘Leases’ – impact of annual uplifts in rent and rent-free periods 1 22 17
IFRS 3 ‘Business Combinations’ – intangible asset amortisation charges and costs arising from acquisitions 1 14 19
IFRIC 13 ‘Customer Loyalty Programmes’ – fair value of awards 1 10 28
Restructuring and other one-off costs: 1
Impairment of PPE and onerous lease provisions included within cost of sales 734 161
Impairment of PPE and onerous lease provisions included within profits/losses arising on property-related items (98) 709
Impairment of goodwill – 495
Provision for customer redress 63 115
Other restructuring and one-off items 102 14
Other profits/losses arising on property-related items 1 (180) (419)
Underlying profit before tax from continuing operations 1 3,054 3,280* Restated for amendments to IAS 19 as explained in Note 1.
The notes on pages 74 to 121 form part of these financial statements.
Oth
er info
rmatio
nG
overnan
ceFin
ancial statem
ents
Strateg
ic repo
rt
Tesco PLC Annual Report and Financial Statements 2014 69
Group income statement
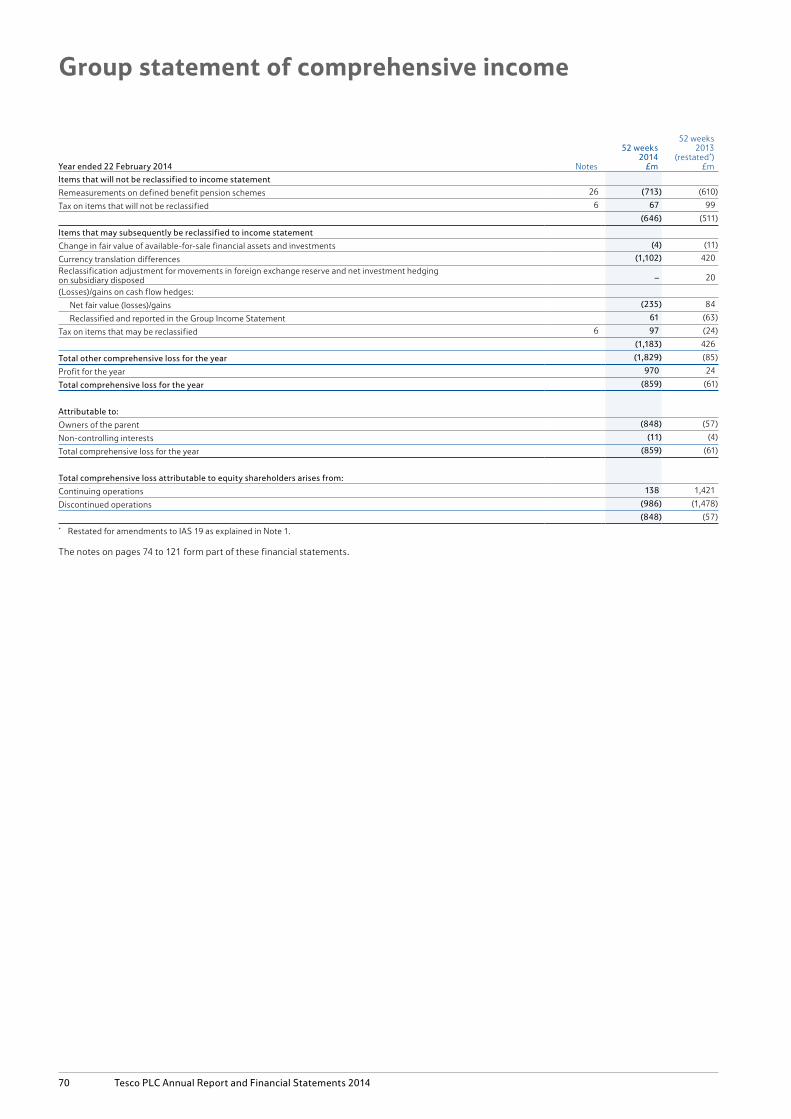
Year ended 22 February 2014 Notes
52 weeks2014
£m
52 weeks2013
(restated*)£m
Items that will not be reclassified to income statement
Remeasurements on defined benefit pension schemes 26 (713) (610)
Tax on items that will not be reclassified 6 67 99
(646) (511)
Items that may subsequently be reclassified to income statement
Change in fair value of available-for-sale financial assets and investments (4) (11)
Currency translation differences (1,102) 420
Reclassification adjustment for movements in foreign exchange reserve and net investment hedging on subsidiary disposed – 20
(Losses)/gains on cash flow hedges:
Net fair value (losses)/gains (235) 84
Reclassified and reported in the Group Income Statement 61 (63)
Tax on items that may be reclassified 6 97 (24)
(1,183) 426
Total other comprehensive loss for the year (1,829) (85)
Profit for the year 970 24
Total comprehensive loss for the year (859) (61)
Attributable to:
Owners of the parent (848) (57)
Non-controlling interests (11) (4)
Total comprehensive loss for the year (859) (61)
Total comprehensive loss attributable to equity shareholders arises from:
Continuing operations 138 1,421
Discontinued operations (986) (1,478)
(848) (57)* Restated for amendments to IAS 19 as explained in Note 1.
The notes on pages 74 to 121 form part of these financial statements.
70 Tesco PLC Annual Report and Financial Statements 2014
Group statement of comprehensive income

Notes
22 February2014
£m
23 February2013
£m
Non-current assets
Goodwill and other intangible assets 10 3,795 4,362
Property, plant and equipment 11 24,490 24,870
Investment property 12 227 2,001
Investments in joint ventures and associates 13 286 494
Other investments 14 1,015 818
Loans and advances to customers 17 3,210 2,465
Derivative financial instruments 21 1,496 1,965
Deferred tax assets 6 73 58
34,592 37,033
Current assets
Inventories 15 3,576 3,744
Trade and other receivables 16 2,190 2,525
Loans and advances to customers 17 3,705 3,094
Derivative financial instruments 21 80 58
Current tax assets 12 10
Short-term investments 1,016 522
Cash and cash equivalents 18 2,506 2,512
13,085 12,465
Assets of the disposal group and non-current assets classified as held for sale 7 2,487 631
15,572 13,096
Current liabilities
Trade and other payables 19 (10,595) (11,094)
Financial liabilities:
Borrowings 20 (1,910) (766)
Derivative financial instruments and other liabilities 21 (99) (121)
Customer deposits and deposits from banks 23 (6,858) (6,015)
Current tax liabilities (494) (519)
Provisions 24 (250) (188)
(20,206) (18,703)
Liabilities of the disposal group classified as held for sale 7 (1,193) (282)
Net current liabilities (5,827) (5,889)
Non-current liabilities
Financial liabilities:
Borrowings 20 (9,303) (10,068)
Derivative financial instruments and other liabilities 21 (770) (759)
Post-employment benefit obligations 26 (3,193) (2,378)
Deferred tax liabilities 6 (594) (1,006)
Provisions 24 (183) (272)
(14,043) (14,483)
Net assets 14,722 16,661
Equity
Share capital 27 405 403
Share premium 5,080 5,020
All other reserves (498) 685
Retained earnings 9,728 10,535
Equity attributable to owners of the parent 14,715 16,643
Non-controlling interests 7 18
Total equity 14,722 16,661
The notes on pages 74 to 121 form part of these financial statements.
Philip Clarke
DirectorsThe financial statements on pages 69 to 121 were authorised for issue by the Directors on 2 May 2014 and are subject to the approval of the shareholders at the Annual General Meeting on 27 June 2014.
Oth
er info
rmatio
nG
overnan
ceFin
ancial statem
ents
Strateg
ic repo
rt
Tesco PLC Annual Report and Financial Statements 2014 71
Group balance sheet

All other reserves
Issuedshare
capital£m
Sharepremium
£m
Otherreserves
£m
Capitalredemption
reserve £m
Hedging reserve
£m
Translationreserve
£m
Treasury shares
£m
Retained earnings
£mTotal
£m
Non-controlling
interests £m
Total equity
£m
At 23 February 2013 403 5,020 40 16 91 547 (9) 10,535 16,643 18 16,661
Profit for the year – – – – – – – 974 974 (4) 970
Other comprehensive loss
Change in fair value of available-for-sale financial assets and investments – – – – – – – (4) (4) – (4)
Currency translation differences – – – – – (1,095) – – (1,095) (7) (1,102)
Remeasurement losses on defined benefit pension schemes – – – – – – – (713) (713) – (713)
Losses on cash flow hedges – – – – (174) – – – (174) – (174)
Tax relating to components of other comprehensive income – – – – 39 58 – 67 164 – 164
Total other comprehensive loss – – – – (135) (1,037) – (650) (1,822) (7) (1,829)
Total comprehensive loss – – – – (135) (1,037) – 324 (848) (11) (859)
Transactions with owners
Purchase of treasury shares – – – – – – (12) – (12) – (12)
Share-based payments – – – – – – 1 58 59 – 59
Issue of shares 2 60 – – – – – – 62 – 62
Dividends authorised in the year – – – – – – – (1,189) (1,189) – (1,189)
Tax on items charged to equity – – – – – – – – – – –
Total transactions with owners 2 60 – – – – (11) (1,131) (1,080) – (1,080)
At 22 February 2014 405 5,080 40 16 (44) (490) (20) 9,728 14,715 7 14,722
All other reserves
Issuedshare
capital£m
Sharepremium
£m
Otherreserves
£m
Capitalredemption
reserve £m
Hedging reserve
£m
Translationreserve
£m
Treasury shares
£m
Retained earnings
(restated*) £m
Total(restated*)
£m
Non-controlling
interests £m
Total equity
(restated*) £m
At 25 February 2012 402 4,964 40 16 73 134 (18) 12,164 17,775 26 17,801
Profit for the year – – – – – – – 28 28 (4) 24
Other comprehensive loss
Change in fair value of available-for-sale financial assets and investments – – – – – – – (11) (11) – (11)
Currency translation differences – – – – – 420 – – 420 – 420
Reclassification adjustment on subsidiaries disposed – – – – – 20 – – 20 – 20
Remeasurement losses on defined benefit pension schemes – – – – – – – (610) (610) – (610)
Gains on cash flow hedges – – – – 21 – – – 21 – 21
Tax relating to components of other comprehensive income – – – – (3) (27) – 105 75 – 75
Total other comprehensive loss – – – – 18 413 – (516) (85) – (85)
Total comprehensive loss – – – – 18 413 – (488) (57) (4) (61)
Transactions with owners
Share-based payments – – – – – – 9 44 53 – 53
Issue of shares 1 56 – – – – – – 57 – 57
Purchase of non-controlling interests – – – – – – – 4 4 (4) –
Dividends authorised in the year – – – – – – – (1,184) (1,184) – (1,184)
Tax on items charged to equity – – – – – – – (5) (5) – (5)
Total transactions with owners 1 56 – – – – 9 (1,141) (1,075) (4) (1,079)
At 23 February 2013 403 5,020 40 16 91 547 (9) 10,535 16,643 18 16,661* Restated for amendments to IAS 19 as explained in Note 1.
The notes on pages 74 to 121 form part of these financial statements.
72 Tesco PLC Annual Report and Financial Statements 2014
Group statement of changes in equity

Year ended 22 February 2014 Notes
52 weeks2014
£m
52 weeks2013
£m
Cash flows from operating activities
Cash generated from operations 29 4,316 3,873
Interest paid (496) (457)
Corporation tax paid (635) (579)
Net cash generated from operating activities 3,185 2,837
Cash flows from investing activities
Acquisition/disposal of subsidiaries, net of cash acquired/disposed (13) (72)
Proceeds from sale of joint ventures and associates – 68
Proceeds from sale of property, plant and equipment, investment property and non-current assets classified as held for sale 568 1,351
Purchase of property, plant and equipment, investment property and non-current assets classified as held for sale (2,489) (2,619)
Proceeds from sale of intangible assets 2 –
Purchase of intangible assets (392) (368)
Net decrease/(increase) in loans to joint ventures 61 (43)
Investments in joint ventures and associates (12) (158)
Net (investments in)/proceeds from sale of short-term investments (494) 721
Net (investments in)/proceeds from sale of other investments (268) 706
Dividends received from joint ventures and associates 62 51
Interest received 121 85
Net cash used in investing activities (2,854) (278)
Cash flows from financing activities
Proceeds from issue of ordinary share capital 27 62 57
Increase in borrowings 3,104 1,820
Repayment of borrowings (1,912) (3,022)
Repayment of obligations under finance leases (9) (32)
Purchase of non-controlling interests – (4)
Dividends paid to equity owners 8 (1,189) (1,184)
Net cash from/(used in) financing activities 56 (2,365)
Net increase in cash and cash equivalents 387 194
Cash and cash equivalents at beginning of the year 2,531 2,311
Effect of foreign exchange rate changes (105) 26
Cash and cash equivalents including cash held in disposal group at the end of the year 2,813 2,531
Cash held in disposal group 7 (307) (19)
Cash and cash equivalents at the end of the year 18 2,506 2,512
Reconciliation of net cash flow to movement in net debt noteYear ended 22 February 2014 Notes
52 weeks2014
£m
52 weeks 2013
£m
Net increase in cash and cash equivalents 387 194
Elimination of net decrease/(increase) in Tesco Bank cash and cash equivalents 570 (475)
Investment in Tesco Bank – (45)
Debt acquired on acquisition – (1)
Net cash (inflow)/outflow from Retail debt and lease financing (914) 1,589
Dividend received from Tesco Bank 100 105
Increase/(decrease) in Retail short-term investments 494 (721)
(Decrease)/increase in Retail joint venture loan receivables (54) 36
Other non-cash movements (412) (430)
Elimination of other Tesco Bank non-cash movements (171) (11)
Decrease in net debt for the year – 241
Opening net debt 30 (6,597) (6,838)
Closing net debt 30 (6,597) (6,597)
NB. The reconciliation of net cash flow to movement in net debt is not a primary statement and does not form part of the cash flow statement but forms part of the notes to the financial statements.
The notes on pages 74 to 121 form part of these financial statements.
Oth
er info
rmatio
nG
overnan
ceFin
ancial statem
ents
Strateg
ic repo
rt
Tesco PLC Annual Report and Financial Statements 2014 73
Group cash flow statement

Use of assumptions and estimatesThe preparation of the consolidated Group financial statements requires management to make judgements, estimates and assumptions that affect the application of policies and reported amounts of assets and liabilities, income and expenses. The estimates and associated assumptions are based on historical experience and various other factors that are believed to be reasonable under the circumstances. Actual results may differ from these estimates. The estimates and underlying assumptions are reviewed on an ongoing basis.
Critical estimates and assumptions that are applied in the preparation of the consolidated financial statements include:
Depreciation and amortisationThe Group exercises judgement to determine useful lives and residual values of intangibles, property, plant and equipment and investment property. The assets are depreciated down to their residual values over their estimated useful lives.
Impairmenti) Impairment of goodwillThe Group tests annually whether goodwill has suffered any impairment. The recoverable amount of the cash-generating units has been determined based on value in use calculations. These calculations require the use of estimates as set out in Note 10.
ii) Impairment of assetsThe Group has determined each store as a separate cash-generating unit for impairment testing. Where there are indicators for impairment, the Group performs an impairment test. Recoverable amounts for cash-generating units are based on the higher of value in use and fair value less costs of disposal. Value in use is calculated from cash flow projections for generally five years using data from the Group’s latest internal forecasts. These calculations require the use of estimates as set out in Note 11.
iii) Impairment of loans and advances to customers and banksThe Group’s loan impairment provisions are established to recognise incurred impairment losses in its portfolio of loans classified as loans and receivables and carried at amortised cost. These calculations require the use of estimates as set out in the accounting policy note for financial instruments.
ProvisionsProvisions have been made for onerous leases, dilapidations, restructuring, pensions, and customer redress. These provisions are estimates and the actual costs and timing of future cash flows are dependent on future events. The difference between expectations and the actual future liability will be accounted for in the period when such determination is made.
The Group has provisions for potential customer redress. In 2010/11, the Financial Conduct Authority (‘FCA’) formally issued Policy Statement 10/12 (‘PS 10/12’), which introduced new guidance in respect of Payment Protection Insurance (‘PPI’) customer redress and evidential provisions to the FCA Handbook with an implementation date of 1 December 2010. The Group continues to handle complaints and redress customers in accordance with PS 10/12.
During the course of the year the Group identified historic operational issues that had resulted in instances where certain of the requirements of the Consumer Credit Act (‘CCA’) for post contract documentation had not been fully complied with. While there is no evidence that these issues have caused particular detriment to customers, it is the Group’s intention to provide redress to impacted customers in order to reflect the operation of the CCA in respect of the customers’ liability.
Provision has been recognised for the CCA documentation redress and represents management’s best estimate at the reporting date of the cost of providing redress to certain loan and credit card customers. The Office of Fair Trading (‘OFT’) has been advised of the Group’s approach to determining the proposed customer redress. Oversight of CCA-related matters passed from the OFT to the FCA on 1 April 2014 and the Group expects to formally advise the FCA of the approach.
It is not clear what regulatory position, if any, the FCA will take and as highlighted above, there is no judicial certainty in the legal position. The actual cost of customer redress could therefore differ materially from this estimate. Refer to Note 24 for further details.
The Group is part of an industry wide Scheme of Arrangement established with the support of the relevant regulatory and customer protection bodies to address customer redress relating to the historic sale of certain cardholder protection products (‘CPP’) to credit card customers.
Note 1 Accounting policies
General informationTesco PLC (‘the Company’) is a public limited company incorporated and domiciled in the United Kingdom under the Companies Act 2006 (Registration number 445790). The address of the registered office is Tesco House, Delamare Road, Cheshunt, Hertfordshire, EN8 9SL, UK.
The financial year represents the 52 weeks ended 22 February 2014 (prior financial year 52 weeks ended 23 February 2013). For the UK, the Republic of Ireland and the US, the results are for the 52 weeks ended 22 February 2014 (prior financial year 52 weeks ended 23 February 2013). For all other operations, the results are for the calendar year ended 28 February 2014 (prior financial year ended 28 February 2013).
The main activities of the Company and its subsidiaries (together, ‘the Group’) are those of retailing and retail banking.
Basis of preparationThe consolidated Group financial statements have been prepared in accordance with International Financial Reporting Standards (‘IFRS’) and IFRS Interpretations Committee (‘IFRIC’) interpretations as endorsed by the European Union, and those parts of the Companies Act 2006 applicable to companies reporting under IFRS. The consolidated Group financial statements are presented in Pounds Sterling, generally rounded to the nearest million. They are prepared on the historical cost basis, except for certain financial instruments, share-based payments, customer loyalty programmes and pensions that have been measured at fair value.
Discontinued operationsDuring the period, the Group entered into definitive agreements, subject to the usual regulatory approvals, with China Resources Enterprise, Limited to combine respective Chinese retail operations. The definitive agreements allow for the exchange of the Group’s Chinese retail and property interests plus cash of HK$4,325m for a 20% interest in the combined businesses.
On 27 November 2013 the Group completed a sale of the substantive part of its US operations to YFE Holdings, Inc. with the remaining assets of the US operations being disposed of as part of an orderly restructuring process. In addition, the exit of the Japanese operations was successfully completed on 1 January 2013.
In accordance with IFRS 5 ‘Non-current assets held for sale and discontinued operations’, the net results of these operations for the year are presented within discontinued operations in the Group Income Statement (for which the comparatives have been restated) and the assets and liabilities of the operations are presented separately in the Group Balance Sheet. See Note 7 for further details.
The accounting policies set out below have been applied consistently to all periods presented in these consolidated financial statements.
Basis of consolidationThe consolidated Group financial statements consist of the financial statements of the ultimate Parent Company (‘Tesco PLC’), all entities controlled by the Company (its subsidiaries) and the Group’s share of its interests in joint ventures and associates.
SubsidiariesThe financial statements of subsidiaries are included in the consolidated financial statements from the date that control commences until the date that control ceases.
Intragroup balances and any unrealised gains and losses or income and expenses arising from intragroup transactions are eliminated in preparing the consolidated financial statements.
Joint ventures and associatesThe Group’s share of the results of joint ventures and associates is included in the Group Income Statement using the equity method of accounting. Investments in joint ventures and associates are carried in the Group Balance Sheet at cost plus post-acquisition changes in the Group’s share of the net assets of the entity, less any impairment in value. The carrying values of investments in joint ventures and associates include acquired goodwill.
If the Group’s share of losses in a joint venture or associate equals or exceeds its investment in the joint venture or associate, the Group does not recognise further losses, unless it has incurred obligations to do so or made payments on behalf of the joint venture or associate.
Unrealised gains arising from transactions with joint ventures and associates are eliminated to the extent of the Group’s interest in the entity.
74 Tesco PLC Annual Report and Financial Statements 2014
Notes to the Group financial statements

Note 1 Accounting policies continued
The calculation of the provision is based on a series of assumptions including the number and value of cases for which compensation may be paid. In arriving at these assumptions management have exercised their judgement based on earlier redress programmes and the redress estimates provided independently as part of the industry wide Scheme of Arrangement. Refer to Note 24 for further details.
The calculation of these provisions involves estimating a number of variables, principally the level of customer complaints which may be received and the level of any compensation which may be payable to customers. The number of cases on which compensation is ultimately payable may also be influenced by the outcome of the analysis of historical claims referred to above. A change in the estimate of any of the key variables in this calculation could have the potential to significantly impact the provisions recognised.
Post-employment benefit obligationsThe present value of the post-employment benefit obligations depends on a number of factors that are determined on an actuarial basis using a number of assumptions. The assumptions used in determining the net cost (income) for pensions include the discount rate. Any changes in these assumptions will impact the carrying amount of post-employment benefit obligations. Key assumptions for post-employment benefit obligations are disclosed in Note 26.
Adoption of new and amended International Financial Reporting StandardsThe Group has adopted the following new and amended standards as of 24 February 2013:
• IAS 1 (amended) ‘Financial statement presentation’ changes the grouping of items presented in the Group’s Statement of Comprehensive Income so that items which may be reclassified to income statement in the future are presented separately from items that will never be reclassified. The amendment affects presentation only and has no impact on the Group’s financial position or performance.
• IAS 19 ‘Employee benefits (Revised 2011)’ amends the accounting for employment benefits. The standard replaces the interest costs and expected return on plan assets with a net interest amount that is calculated by applying the discount rate to the net defined benefit liability/asset. The amendment has reduced profit for the year (net of deferred tax) by £86m for the year ended 22 February 2014 (year ended 23 February 2013: a reduction of £96m). The comparative financial information has been restated accordingly.
• IFRS 13 ‘Fair value measurement’ establishes a single source of guidance under IFRS for all fair value measurements. IFRS 13 does not change when an entity is required to use fair value, but rather provides guidance on how to measure fair value under IFRS when fair value is required or permitted. The application of IFRS 13 has not materially impacted the fair value measurements carried out by the Group. IFRS 13 also requires specific disclosures on fair values, some of which replace existing disclosure requirements in other standards, including IFRS 7 ‘Financial Instruments: Disclosures’.
• IFRS 7 (amended) ‘Financial instruments: Disclosures’ requires the disclosure on rights of offset and related arrangements for financial instruments under an enforceable master netting agreement or similar arrangements.
• Annual Improvements 2009 – 2011 which includes changes to IAS 1 ‘Financial Statement Presentation’, IAS 32 ‘Financial Instruments: Presentation, IAS 34 ‘Interim Financial Reporting’ and IAS 16 ‘Property, plant and equipment’. The adoption of these has not had any significant impact on the amounts reported in the Group financial statements.
RevenueRevenue comprises the fair value of consideration received or receivable for the sale of goods and services in the ordinary course of the Group’s activities.
Sale of goodsRevenue is recognised when the significant risks and rewards of ownership of the goods have transferred to the buyer and the amount of revenue can be measured reliably.
Revenue is recorded net of returns, discounts/offers and value added taxes.
Provision of servicesRevenue from the provision of services is recognised when the service is provided and the revenue can be measured reliably, based on the terms of the contract.
Where the Group acts as an agent selling goods or services, only the commission income is included within revenue.
Financial servicesRevenue consists of interest, fees and income from the provision of insurance.
Interest income on financial assets that are classified as loans and receivables is determined using the effective interest rate method.
Calculation of the effective interest rate takes into account fees receivable that are an integral part of the instrument’s yield, premiums or discounts on acquisition or issue, early redemption fees and transaction costs.
Fees in respect of services (credit card interchange fees, late payment and ATM revenue) are recognised as the right to consideration accrues through the provision of the service to the customer. The arrangements are generally contractual and the cost of providing the service is incurred as the service is rendered.
The Group generates commission from the sale and service of motor and home insurance policies underwritten by Tesco Underwriting Limited, or in a minority of cases by a third party underwriter. This is based on commission rates which are independent of the profitability of underlying insurance policies. Similar commission income is also generated from the sale of white label insurance products underwritten by other third party providers.
Clubcard, loyalty and other initiativesThe cost of Clubcard and loyalty initiatives is part of the fair value of the consideration received and is deferred and subsequently recognised over the period that the awards are redeemed. The deferral is treated as a deduction from revenue.
The fair value of the points awarded is determined with reference to the fair value to the customer and considers factors such as redemption via Clubcard deals versus money-off-in-store and redemption rate.
Rental incomeRental income is recognised in the period in which it is earned, in accordance with the terms of the lease.
Finance incomeFinance income, excluding income arising from financial services, is recognised in the period to which it relates using the effective interest rate method.
Finance costsFinance costs directly attributable to the acquisition or construction of qualifying assets are capitalised. Qualifying assets are those that necessarily take a substantial period of time to prepare for their intended use. All other borrowing costs are recognised in the Group Income Statement in finance costs, excluding those arising from financial services, in the period in which they occur. For Tesco Bank, finance cost on financial liabilities is determined using the effective interest rate method and is recognised in cost of sales.
Oth
er info
rmatio
nG
overnan
ceFin
ancial statem
ents
Strateg
ic repo
rt
Tesco PLC Annual Report and Financial Statements 2014 75

Note 1 Accounting policies continued
Business combinations and goodwillThe Group accounts for all business combinations by applying the purchase method. All acquisition-related costs are expensed.
On acquisition, the assets (including intangible assets), liabilities and contingent liabilities of an acquired entity are measured at their fair value. Non-controlling interest is stated at the non-controlling interest’s proportion of the fair values of the assets and liabilities recognised.
Goodwill arising on consolidation represents the excess of the consideration transferred over the net fair value of the Group’s share of the net assets, liabilities and contingent liabilities of the acquired subsidiary, joint venture or associate and the fair value of the non-controlling interest in the acquiree. If the consideration is less than the fair value of the Group’s share of the net assets, liabilities and contingent liabilities of the acquired entity (i.e. a discount on acquisition), the difference is credited to the Group Income Statement in the period of acquisition.
At the acquisition date of a subsidiary, goodwill acquired is recognised as an asset and is allocated to each of the cash-generating units expected to benefit from the business combination’s synergies and to the lowest level at which management monitors the goodwill. Goodwill arising on the acquisition of joint ventures and associates is included within the carrying value of the investment. On disposal of a subsidiary, joint venture or associate, the attributable amount of goodwill is included in the determination of the profit or loss on disposal.
Intangible assetsAcquired intangible assetsSeparately acquired intangible assets, such as software, pharmacy licences, customer relationships, contracts and brands are measured initially at cost. Intangible assets acquired in a business combination are recognised at fair value at the acquisition date. Intangible assets with finite useful lives are carried at cost and are amortised on a straight-line basis over their estimated useful lives, at 2%-100% of cost per annum. Internally generated intangible assets – Research and development expenditureResearch costs are expensed as incurred. Development expenditure incurred on an individual project is capitalised only if specific criteria are met including that the asset created will probably generate future economic benefits.
Following the initial recognition of development expenditure, the cost is amortised over the asset’s estimated useful life at 10%–25% of cost per annum.
Property, plant and equipment Property, plant and equipment is carried at cost less accumulated depreciation and any recognised impairment in value.
Property, plant and equipment is depreciated on a straight-line basis to its residual value over its anticipated useful economic life. The following depreciation rates are applied for the Group:
• Freehold and leasehold buildings with greater than 40 years unexpired – at 2.5% of cost;
• Leasehold properties with less than 40 years unexpired are depreciated by equal annual instalments over the unexpired period of the lease; and
• Plant, equipment, fixtures and fittings and motor vehicles – at rates varying from 9%-50%.
Assets held under finance leases are depreciated over their expected useful lives on the same basis as owned assets or, when shorter, over the term of the relevant lease.
Impairment of non-financial assetsGoodwill is reviewed for impairment at least annually by assessing the recoverable amount of each cash-generating unit to which the goodwill relates. The recoverable amount is the higher of fair value less costs of disposal, and value in use. When the recoverable amount of the cash-generating unit is less than the carrying amount, an impairment loss is recognised. Any impairment is recognised immediately in the Group Income Statement and is not subsequently reversed.
For all other non-financial assets (including intangible assets and property, plant and equipment) the Group performs impairment testing where there are indicators of impairment. If such an indicator exists, the recoverable amount of the asset is estimated in order to determine the extent of the impairment loss (if any). Where the asset does not generate cash flows that are independent from other assets, the Group estimates the recoverable amount of the cash-generating unit to which the asset belongs.
The recoverable amount is the higher of value in use and fair value less costs of disposal. If the recoverable amount of an asset (or cash-generating unit) is estimated to be less than its carrying amount, the carrying amount of the asset (or cash-generating unit) is reduced to its recoverable amount. An impairment loss is recognised immediately in the Group Income Statement.
Where an impairment loss subsequently reverses, the carrying amount of the asset (or cash-generating unit) is increased to the revised estimate of the recoverable amount, but so that the increased carrying amount does not exceed the carrying amount that would have been determined if no impairment loss had been recognised for the asset (or cash-generating unit) in prior years. A reversal of an impairment loss is recognised immediately as a credit to the Group Income Statement.
Investment propertyInvestment property assets are carried at cost less accumulated depreciation and any recognised impairment in value. The depreciation policies for investment property are consistent with those described for owner-occupied property.
Short-term and other investmentsShort-term and other investments in the Group Balance Sheet comprise receivables, loan receivables and available-for-sale financial assets.
Receivables and loan receivables are recognised at amortised cost. Available-for-sale financial assets are recognised at fair value.
Refer to the financial instruments accounting policy for further detail.
InventoriesInventories comprise goods and properties held for resale and properties held for, or in the course of, development with a view to sell. Inventories are valued at the lower of cost and fair value less costs to sell using the weighted average cost basis.
Cash and cash equivalentsCash and cash equivalents in the Group Balance Sheet consist of cash at bank, in hand, demand deposits with banks, loans and advances to banks, certificate of deposits and other receivables together with short-term deposits with an original maturity of three months or less.
Non-current assets held for sale and discontinued operationsNon-current assets (or disposal groups) are classified as assets held for sale when their carrying amount is to be recovered principally through a sale transaction and a sale is considered highly probable. They are stated at the lower of carrying amount and fair value less costs to sell.
LeasingLeases are classified as finance leases whenever the terms of the lease transfer substantially all the risks and rewards of ownership to the lessee. All other leases are classified as operating leases.
76 Tesco PLC Annual Report and Financial Statements 2014
Notes to the Group financial statements continued

Note 1 Accounting policies continued
Deferred tax assets are recognised to the extent that it is probable that taxable profits will be available against which deductible temporary differences can be utilised.
The carrying amount of deferred tax assets is reviewed at each balance sheet date and reduced to the extent that it is no longer probable that sufficient taxable profits will be available to allow all or part of the assets to be recovered.
Deferred tax assets and liabilities are offset against each other when there is a legally enforceable right to set off current taxation assets against current taxation liabilities and it is the intention to settle these on a net basis.
Foreign currenciesTransactions in foreign currencies are translated at the exchange rate on the date of the transaction. At each balance sheet date, monetary assets and liabilities that are denominated in foreign currencies are retranslated at the rates prevailing on the balance sheet date. All differences are taken to the Group Income Statement.
The assets and liabilities of overseas subsidiaries denominated in foreign currencies are translated into Pounds Sterling at exchange rates prevailing at the date of the Group Balance Sheet; profits and losses are translated at average exchange rates for the relevant accounting periods. Exchange differences arising are recognised in the Group Statement of Comprehensive Income and are included in the Group’s translation reserve. Such translation differences are recognised as income or expenses in the period in which the operation is disposed of.
Goodwill and fair value adjustments arising on the acquisition of a foreign entity are treated as assets and liabilities of the foreign entity and translated at the closing rate.
Financial instrumentsFinancial assets and financial liabilities are recognised on the Group Balance Sheet when the Group becomes a party to the contractual provisions of the instrument.
Trade receivablesTrade receivables are non interest-bearing and are recognised initially at fair value, and subsequently at amortised cost using the effective interest rate method, less provision for impairment. InvestmentsInvestments are recognised at trade date. Investments are classified as either held for trading or available-for-sale, and are recognised at fair value. For available-for-sale investments, gains and losses arising from changes in fair value are recognised directly in other comprehensive income, until the security is disposed of or is determined to be impaired, at which time the cumulative gain or loss previously recognised in other comprehensive income is included in the Group Income Statement for the period. Interest calculated using the effective interest rate method is recognised in the Group Income Statement. Dividends on an available-for-sale equity instrument are recognised in the Group Income Statement when the entity’s right to receive payment is established.
Loans and advances to customersLoans and advances to customers are not classified as held for trading nor designated as fair value through profit and loss. Loans and advances are initially recognised at fair value plus directly related transaction costs. Subsequent to initial recognition, these assets are carried at amortised cost using the effective interest method less any impairment losses. Income from these financial assets is calculated on an effective yield basis and is recognised in the Group Income Statement.
Impairment of loans and advances to customersAt each balance sheet date the Group reviews the carrying amounts of its loans and advances to determine whether there is any indication that those assets have suffered an impairment loss.
If there is objective evidence that an impairment loss on a financial asset or group of financial assets classified as loans and advances has been incurred, the Group measures the amount of the loss as the difference between the carrying amount of the asset or group of assets and the present value of estimated future cash flows from the asset or group of assets discounted at the effective interest rate of the instrument at initial recognition. Impairment losses are assessed individually for financial assets that are individually significant and collectively for assets that are not individually significant.
The Group as a lessorAmounts due from lessees under finance leases are recorded as receivables at the amount of the Group’s net investment in the leases. Finance lease income is allocated to accounting periods so as to reflect a constant periodic rate of return on the Group’s net investment in the lease. Rental income from operating leases is recognised on a straight-line basis over the term of the lease.
The Group as a lesseeAssets held under finance leases are recognised as assets of the Group at their fair value or, if lower, at the present value of the minimum lease payments, each determined at the inception of the lease. The corresponding liability is included in the Group Balance Sheet as a finance lease obligation. Lease payments are apportioned between finance charges and a reduction of the lease obligations so as to achieve a constant rate of interest on the remaining balance of the liability. Finance charges are charged to the Group Income Statement. Rentals payable under operating leases are charged to the Group Income Statement on a straight-line basis over the term of the lease.
Sale and leasebackA sale and leaseback transaction is one where the Group sells an asset and immediately reacquires the use of the asset by entering into a lease with the buyer.
The accounting treatment of the sale and leaseback depends upon the substance of the transaction (by applying the lease classification principles described above) whether or not the sale was made at the asset’s fair value and the relationship with the buyer which is based on levels of control and influence (the buyer may be an associate, joint venture or an unrelated party).
For sale and finance leasebacks, any profit from the sale is deferred and amortised over the lease term. For sale and operating leasebacks, generally the assets are sold at fair value, and accordingly the profit or loss from the sale is recognised immediately in the Group Income Statement.
Post-employment and similar obligationsFor defined benefit plans, obligations are measured at discounted present value (using the projected unit credit method) whilst plan assets are recorded at fair value. The operating and financing costs of such plans are recognised separately in the Group Income Statement; service costs are spread systematically over the expected service lives of employees and financing costs are recognised in the periods in which they arise. Actuarial gains and losses are recognised immediately in the Group Statement of Comprehensive Income.
Payments to defined contribution schemes are recognised as an expense as they fall due.
Share-based paymentsThe fair value of employee share option plans is calculated at the grant date using the Black-Scholes model. The resulting cost is charged to the Group Income Statement over the vesting period. The value of the charge is adjusted to reflect expected and actual levels of vesting.
TaxationThe tax expense included in the Group Income Statement consists of current and deferred tax.
Current tax is the expected tax payable on the taxable income for the year, using tax rates enacted or substantively enacted by the balance sheet date. Tax expense is recognised in the Group Income Statement except to the extent that it relates to items recognised in the Group Statement of Comprehensive Income or directly in the Group Statement of Changes in Equity, in which case it is recognised in the Group Statement of Comprehensive Income or directly in the Group Statement of Changes in Equity, respectively. Deferred tax is provided using the balance sheet liability method, providing for temporary differences between the carrying amounts of assets and liabilities for financial reporting purposes and the amounts used for taxation purposes.
Deferred tax is calculated at the tax rates that have been enacted or substantively enacted by the balance sheet date. Deferred tax is charged or credited in the Group Income Statement, except when it relates to items charged or credited directly to equity or other comprehensive income, in which case the deferred tax is also recognised in equity, or other comprehensive income, respectively.
Oth
er info
rmatio
nG
overnan
ceFin
ancial statem
ents
Strateg
ic repo
rt
Tesco PLC Annual Report and Financial Statements 2014 77

Note 1 Accounting policies continued
Fair value hedgingDerivative financial instruments are classified as fair value hedges when they hedge the Group’s exposure to changes in the fair value of a recognised asset or liability. Changes in the fair value of derivatives that are designated and qualify as fair value hedges are recorded in the Group Income Statement together with any changes in the fair value of the hedged item that is attributable to the hedged risk.
Cash flow hedgingDerivative financial instruments are classified as cash flow hedges when they hedge the Group’s exposure to variability in cash flows that are either attributable to a particular risk associated with a recognised asset or liability, or a highly probable forecasted transaction. The effective element of any gain or loss from remeasuring the derivative instrument is recognised directly in other comprehensive income.
The associated cumulative gain or loss is reclassified from other comprehensive income and recognised in the Group Income Statement in the same period or periods during which the hedged transaction affects the Group Income Statement. The classification of the effective portion when recognised in the Group Income Statement is the same as the classification of the hedged transaction. Any element of the remeasurement of the derivative instrument which does not meet the criteria for an effective hedge is recognised immediately in the Group Income Statement within finance income or costs.
Hedge accounting is discontinued when the hedging instrument expires or is sold, terminated or exercised, or no longer qualifies for hedge accounting. At that point in time, any cumulative gain or loss on the hedging instrument recognised in equity is retained in the Group Statement of Changes in Equity until the forecasted transaction occurs or the original hedged item affects the Group Income Statement. If a forecasted hedged transaction is no longer expected to occur, the net cumulative gain or loss recognised in the Group Statement of Changes in Equity is reclassified to the Group Income Statement.
Net investment hedgingDerivative financial instruments are classified as net investment hedges when they hedge the Group’s net investment in an overseas operation. The effective element of any foreign exchange gain or loss from remeasuring the derivative instrument is recognised directly in other comprehensive income. Any ineffective element is recognised immediately in the Group Income Statement. Gains and losses accumulated in other comprehensive income are included in the Group Income Statement when the foreign operation is disposed of.
Treatment of agreements to acquire non-controlling interestsThe Group has entered into a number of agreements to purchase the remaining shares of subsidiaries with non-controlling interests.
The net present value of the expected future payments are shown as a financial liability. At the end of each period, the valuation of the liability is reassessed with any changes recognised in the Group Income Statement within finance income or costs.
Offsetting financial instrumentsFinancial assets and liabilities are offset and the net amount reported in the balance sheet when there is a legally enforceable right to offset the recognised amounts and there is an intention to settle on a net basis or realise the asset and settle the liability simultaneously.
ProvisionsProvisions are measured at the present value of the expenditures expected to be required to settle the obligation using a pre-tax rate that reflects current market assessments of the time value of money and the risks specific to the obligation. The increase in the provision due to passage of time is recognised as interest expense.
Provisions for onerous leases are recognised when the Group believes that the unavoidable costs of meeting the lease obligations exceed the economic benefits expected to be received under the lease. Provisions for dilapidation costs are recognised on a lease by lease basis.
In making collective assessments of impairment, financial assets are grouped into portfolios on the basis of similar risk characteristics. Future cash flows from these portfolios are estimated on the basis of the contractual cash flows and historical loss experience for assets with similar credit risk characteristics. Historical loss experience is adjusted, on the basis of current observable data, to reflect the effects of current conditions not affecting the period of historical experience.
Impairment losses are recognised in the Group Income Statement and the carrying amount of the financial asset or group of financial assets is reduced by establishing an allowance for impairment losses. If in a subsequent period the amount of the impairment loss reduces and the reduction can be ascribed to an event after the impairment was recognised, the previously recognised loss is reversed by adjusting the allowance. Once an impairment loss has been recognised on a financial asset or group of financial assets, interest income is recognised on the carrying amount using the rate of interest at which estimated future cash flows were discounted in measuring impairment.
Loan impairment provisions are established on a portfolio basis taking into account the level of arrears, security, past loss experience, credit scores and defaults based on portfolio trends. The most significant factors in establishing these provisions are the expected loss rates. The portfolios include credit card receivables and other personal advances. The future credit quality of these portfolios is subject to uncertainties that could cause actual credit losses to differ materially from reported loan impairment provisions. These uncertainties include the economic environment, notably interest rates and their effect on customer spending, the unemployment level, payment behaviour and bankruptcy trends.
Interest-bearing borrowingsInterest-bearing bank loans and overdrafts are initially recorded at fair value, net of attributable transaction costs. Subsequent to initial recognition, interest-bearing borrowings are stated at amortised cost with any difference between proceeds and redemption value being recognised in the Group Income Statement over the period of the borrowings on an effective interest basis.
Trade payablesTrade payables are non interest-bearing and are recognised initially at fair value and subsequently measured at amortised cost using the effective interest method.
Equity instrumentsEquity instruments issued by the Group are recorded at the proceeds received, net of direct issue costs.
Derivative financial instruments and hedge accountingThe Group uses derivative financial instruments to hedge its exposure to foreign exchange, interest rate and commodity risks arising from operating, financing and investing activities. The Group does not hold or issue derivative financial instruments for trading purposes; however, if derivatives do not qualify for hedge accounting they are accounted for as such.
Derivative financial instruments are recognised and stated at fair value. Where derivatives do not qualify for hedge accounting, any gains or losses on remeasurement are immediately recognised in the Group Income Statement. Where derivatives qualify for hedge accounting, recognition of any resultant gain or loss depends on the nature of the hedge relationship and the item being hedged. In order to qualify for hedge accounting, the Group is required to document from inception the relationship between the item being hedged and the hedging instrument. The Group is also required to document and demonstrate an assessment of the relationship between the hedged item and the hedging instrument, which shows that the hedge will be highly effective on an ongoing basis. This effectiveness testing is performed at each period end to ensure that the hedge remains highly effective.
Derivative financial instruments with maturity dates of more than one year from the balance sheet date are disclosed as non-current.
78 Tesco PLC Annual Report and Financial Statements 2014
Notes to the Group financial statements continued

Note 1 Accounting policies continued
The adjustments made to reported profit before tax are:
• IAS 32 and IAS 39 ‘Financial Instruments’ – fair value remeasurements. Under IAS 32 and IAS 39, the Group applies hedge accounting to its various hedge relationships when allowed under IAS 39 and when practical to do so. Sometimes the Group is unable to apply hedge accounting to the arrangements but continues to enter into these arrangements as they provide certainty or active management of the exchange rates and interest rates applicable to the Group. The Group believes these arrangements remain effective and economically and commercially viable hedges despite the inability to apply hedge accounting. Where hedge accounting is not applied to certain hedging arrangements, the reported results reflect the movement in fair value of related derivatives due to changes in foreign exchange and interest rates. In addition, at each year end, any gain or loss accruing on open contracts is recognised in the Group Income Statement for the financial year, regardless of the expected outcome of the hedging contract on termination. This may mean that the Group Income Statement charge is highly volatile, whilst the resulting cash flows may not be as volatile. The underlying profit measure removes this volatility to help better identify the underlying performance of the Group.
• IAS 19 ‘Employee Benefits’ – non-cash Group Income Statement charge for pensions. Under IAS 19, the cost of providing pension benefits in the future is discounted to a present value at the corporate bond yield rates applicable on the last day of the previous financial year. Corporate bond yield rates vary over time which in turn creates volatility in the Group Income Statement and Group Balance Sheet. IAS 19 also increases the charge for young pension schemes, such as the Group’s, by requiring the use of rates which do not take into account the future expected returns on the assets held in the pension scheme which will fund pension liabilities as they fall due. The sum of these two effects can make the IAS 19 charge disproportionately higher and more volatile than the cash contributions the Group is required to make in order to fund all future liabilities. Therefore, within underlying profit the Group has included the ‘normal’ cash contributions for pensions but excluded the volatile element of IAS 19 to represent what the Group believes to be a fairer measure of the cost of providing post-employment benefits.
• IAS 17 ‘Leases’ – impact of annual uplifts in rent and rent-free periods. Some operating leases have been structured in a way to increase annual lease costs as the businesses expand. IAS 17 requires the total expected cost of a lease to be recognised on a straight-line basis over the term of the lease, irrespective of the actual timing of the cost. This adjustment also impacts the Group’s operating profit and rental income within the share of post-tax profits of joint ventures and associates.
• IFRS 3 (Revised) ‘Business Combinations’ – intangible asset amortisation charges and costs arising from acquisitions. Under IFRS 3 intangible assets are separately identified and fair valued. The intangible assets are required to be amortised on a straight-line basis over their useful lives and as such is a non-cash charge that does not reflect the underlying performance of the business acquired. Similarly, the standard requires all acquisition costs to be expensed in the Group Income Statement. Due to their nature, these costs have been excluded from underlying profit as they do not reflect the underlying performance of the Group.
• IFRIC 13 ‘Customer Loyalty Programmes’ – fair value of awards. The interpretation requires the fair value of customer loyalty awards to be measured as a separate component of a sales transaction. The underlying profit measure removes this fair value allocation to present underlying business performance, and to reflect the performance of the operating segments as measured by management.
• Restructuring and other one-off costs. These relate to certain costs associated with the Group’s restructuring activities and certain one-off costs including costs relating to fair valuing the assets of a disposal group. These have been excluded from underlying profit as they do not reflect the underlying performance of the Group.
• Profits/losses from property-related items. These relate to the Group’s property activities including gains and losses on disposal of property assets, development property built for resale and property joint ventures; costs resulting from changes in the Group’s store portfolio and distribution network, including pre-opening and post closure costs; and income/(charges) associated with impairment of non-trading property and related onerous contracts. These have been excluded from underlying profit as they do not reflect the underlying performance of the Group.
Standards issued but not yet effectiveAs of the date of authorisation of these financial statements, the following standards were in issue but not yet effective. The Group has not applied these standards in the preparation of the financial statements:
• IFRS 10 ‘Consolidated financial statements’ is effective from periods commencing on or after 1 January 2014. It builds on existing principles by identifying the concept of control as the determining factor in whether an entity should be included within the consolidated financial statements of the parent company. It also provides additional guidance to assist in the determination of control where this is difficult to assess.
• IFRS 11 ‘Joint arrangements’ is effective from periods commencing on or after 1 January 2014. It gives a more realistic reflection of joint arrangements by focusing on the rights and obligations of the arrangement rather than its legal form. There are now only two types of joint arrangement: joint operations and joint ventures.
• IFRS 12 ‘Disclosures of interests in other entities’ is effective from periods commencing on or after 1 January 2014. It includes the disclosure requirements for all forms of interests in other entities, including joint arrangements, associates, special purpose vehicles and other off balance sheet vehicles.
• IAS 27 (Amended) ‘Separate financial statements’ is effective from periods commencing on or after 1 January 2014. It includes the provisions on separate financial statements that are left after the control provisions of IAS 27 have been included in the new IFRS 10.
• IAS 28 (Amended) ‘Associates and joint ventures’ is effective from periods commencing on or after 1 January 2014. It includes the requirements for joint ventures, as well as associates, to be equity accounted following the issue of IFRS 11. This requirement will not affect the Group because equity accounting is currently adopted under the existing requirements of IAS 31.
• IAS 32 (Amended) ‘Financial instruments: Presentation’ is effective from 1 January 2014 respectively. The amendment clarifies some of the requirements for offsetting financial assets and financial liabilities on the balance sheet.
• IAS 36 (Amended) ‘Impairment of assets’ is effective from periods commencing on or after 1 January 2014. It addresses the disclosure of information about the recoverable amount of impaired assets if that amount is based on fair value less costs of disposal.
• IAS 39 (Amended) ‘Financial Instruments: Recognition and Measurement’ is effective from periods commencing on or after 1 January 2014. It provides relief from discontinuing hedge accounting when novation of a hedging instrument to a central counter party meets specified criteria.
• IFRS 9 ‘Financial instruments’ is effective from periods commencing on or after 1 January 2018 (tentative decision by IASB). It is a new standard for financial instruments that is ultimately intended to replace IAS 39. The replacement project consists of three phases: Phase 1 Classification and measurement of financial assets and financial liabilities; Phase 2 Impairment methodology; and Phase 3 Hedge accounting.
• IFRIC 21 ‘Levies’ is effective from periods commencing on or after 1 January 2014. It clarifies the timing of recognition of a liability to pay a levy recognised in accordance with IAS 37 ‘Provisions, Contingent Liabilities and Contingent Assets’.
• IAS 19 (Amended) ‘Employee benefits: Employee contributions’ is effective from periods commencing on or after 1 July 2014. It provides additional guidance on the accounting for contributions from employees or third parties set out in the formal terms of a defined benefit plan.
• Annual Improvements 2010-2012 and Annual Improvements 2011-2013 are effective from periods commencing on or after 1 July 2014. The Annual Improvements process covers minor amendments to IFRS that the IASB consider non-urgent but necessary.
The impact on the Group’s financial statements of the future adoption of these standards is still under review.
Use of non-GAAP measuresNet debtNet debt excludes the net debt of Tesco Bank but includes that of the discontinued operations. Net debt comprises bank and other borrowings, finance lease payables, net derivative financial instruments, joint venture loans and other receivables and net interest receivables/payables, offset by cash and cash equivalents and short-term investments.
Underlying profit before taxThe Directors believe that underlying profit before tax and underlying diluted earnings per share measures provide additional useful information for shareholders on underlying trends and performance. These measures are used for performance analysis. Underlying profit is not defined by IFRS and therefore may not be directly comparable with other companies’ adjusted profit measures. It is not intended to be a substitute for, or superior to, IFRS measurements of profit. Tax impact on non-GAAP measures is included within Note 9.
Oth
er info
rmatio
nG
overnan
ceFin
ancial statem
ents
Strateg
ic repo
rt
Tesco PLC Annual Report and Financial Statements 2014 79

Note 2 Segmental reporting
The Group’s reporting segments are determined based on the Group’s internal reporting to the Chief Operating Decision Maker (‘CODM’). The CODM has been determined to be the Executive Committee as it is primarily responsible for the allocation of resources to segments and the assessment of performance of the segments.
The Group’s Chinese (previously reported as part of the Asia segment) and US operations have been treated as discontinued as described in more detail in Notes 1 and 7. The segment results do not include any amounts for these discontinued operations.
The CODM considers the principal activities of the Group to be:
• Retailing and associated activities in: − the UK; − Asia – India, Malaysia, South Korea, Thailand; and − Europe – Czech Republic, Hungary, Poland, the Republic of Ireland, Slovakia, and Turkey.
• Retail banking and insurance services through Tesco Bank in the UK.
The CODM uses trading profit, as reviewed at monthly Executive Committee meetings, as the key measure of the segments’ results as it reflects the segments’ underlying trading performance for the financial year under evaluation. Trading profit is a consistent measure within the Group.
Segment trading profit is an adjusted measure of operating profit and measures the performance of each segment before profits/losses arising on property-related items, the impact on leases of annual uplifts in rent and rent-free periods, intangible asset amortisation charges and costs arising from acquisitions, and goodwill impairment and restructuring and other one-off costs. The IAS 19 pension charge is replaced with the ‘normal’ cash contributions for pensions. An adjustment is also made for the fair value of customer loyalty awards.
Inter-segment revenue between the operating segments is not material.
The segment results, which do not include any amounts for discontinued operations, the reconciliation of the segment measures to the respective statutory items included in the Group Income Statement, the segment assets and other segment information are as follows:
Year ended 22 February 2014At constant exchange rates*
UK£m
Asia£m
Europe£m
TescoBank
£m
Total atconstant
exchange£m
Foreignexchange
£m
Totalat actual
exchange£m
Continuing operations
Sales including VAT (excluding IFRIC 13) 48,177 10,807 10,595 1,003 70,582 312 70,894
Revenue (excluding IFRIC 13) 43,570 10,181 9,117 1,003 63,871 278 64,149
Effect of IFRIC 13 (513) (32) (45) – (590) (2) (592)
Revenue 43,057 10,149 9,072 1,003 63,281 276 63,557
Trading profit 2,191 683 221 194 3,289 26 3,315
Trading margin† 5.0% 6.7% 2.4% 19.3% 5.1% – 5.2%
Year ended 22 February 2014At actual exchange rates**
UK£m
Asia£m
Europe£m
TescoBank
£m
Totalat actual
exchange£m
Continuing operations
Sales including VAT (excluding IFRIC 13) 48,177 10,947 10,767 1,003 70,894
Revenue (excluding IFRIC 13) 43,570 10,309 9,267 1,003 64,149
Effect of IFRIC 13 (513) (33) (46) – (592)
Revenue 43,057 10,276 9,221 1,003 63,557
Trading profit 2,191 692 238 194 3,315
Trading margin† 5.0% 6.7% 2.6% 19.3% 5.2%* Constant exchange rates are the average actual periodic exchange rates for the previous financial year.** Actual exchange rates are the average actual periodic exchange rates for that financial year.† Trading margin is based on revenue excluding the accounting impact of IFRIC 13.
80 Tesco PLC Annual Report and Financial Statements 2014
Notes to the Group financial statements continued

Note 2 Segmental reporting continued
Year ended 23 February 2013At actual exchange rates*
UK£m
Asia£m
Europe£m
TescoBank
£m
Totalat actual
exchange£m
Continuing operations
Sales including VAT (excluding IFRIC 13) 48,219 10,663 10,809 1,021 70,712
Revenue (excluding IFRIC 13) 43,582 10,045 9,319 1,021 63,967
Effect of IFRIC 13 (491) (25) (45) – (561)
Revenue 43,091 10,020 9,274 1,021 63,406
Trading profit 2,272 733 329 191 3,525
Trading margin† 5.2% 7.3% 3.5% 18.7% 5.5%
Reconciliation of trading profit to profit for the year from continuing operations
2014£m
2013(restated**)
£m
Trading profit 3,315 3,525
Adjustments:
IAS 19 ‘Employee Benefits’ – non-cash Group Income Statement charge for pensions (11) 4
IAS 17 ‘Leases’ – impact of annual uplifts in rent and rent-free periods (28) (25)
IFRS 3 ‘Business Combinations’ – intangible asset amortisation charges and costs arising from acquisitions (14) (19)
IFRIC 13 ‘Customer Loyalty Programmes’ – fair value of awards (10) (28)
Restructuring and other one-off items:
Impairment of PPE and onerous lease provisions included within cost of sales*** (734) (161)
Impairment of PPE and onerous lease provisions included within profits/losses arising on property-related items 98 (709)
Impairment of goodwill – (495)
Provision for customer redress (63) (115)
Other restructuring and one-off items (102) (14)
Other profits/losses arising on property-related items 180 419
Operating profit 2,631 2,382
Share of post-tax profits of joint ventures and associates 60 72
Finance income 132 120
Finance costs (564) (517)
Profit before tax 2,259 2,057
Taxation (347) (529)
Profit for the year from continuing operations 1,912 1,528
Segment assets
At 22 February 2014UK£m
Asia£m
Europe£m
TescoBank
£m
Other/unallocated
£mTotal
£m
Total segment non-current assets 15,483 6,814 5,118 5,483 1,694 34,592
Total segment non-current assets includes:
Investments in joint ventures and associates 122 87 – 77 – 286
At 23 February 2013UK£m
Asia****
£mEurope
£m
TescoBank
£m
Other/unallocated
£m
Total continuingoperations
£m
Discontinued operations****
£mTotal
£m
Total segment non-current assets 14,532 7,399 6,471 4,709 2,008 35,119 1,914 37,033
Total segment non-current assets includes:
Investments in joint ventures and associates 104 107 1 95 – 307 187 494* Actual exchange rates are the average actual periodic exchange rates for that financial year.** Restated for amendments to IAS 19 as explained in Note 1.*** Included in £734m (2013: £161m) is £707m (2013: £67m) of PPE impairment.****China has been re-presented from Asia in this table into discontinued operations for comparison purposes.† Trading margin is based on revenue excluding the accounting impact of IFRIC 13. O
ther in
form
ation
Govern
ance
Finan
cial statemen
tsS
trategic rep
ort
Tesco PLC Annual Report and Financial Statements 2014 81

Note 2 Segmental reporting continued
Other segment information
Year ended 22 February 2014UK£m
Asia£m
Europe£m
TescoBank
£m
Total continuingoperations
£m
Discontinuedoperations*
£mTotal
£m
Capital expenditure (including acquisitions through business combinations):
Property, plant and equipment 1,370 737 253 16 2,376 86 2,462
Investment property – – – – – – –
Goodwill and other intangible assets 303 22 28 86 439 5 444
Depreciation:
Property, plant and equipment (642) (320) (307) (17) (1,286) (26) (1,312)
Investment property – (10) (9) – (19) – (19)
Amortisation of intangible assets (122) (15) (24) (66) (227) (4) (231)
Goodwill impairment losses – – – – – – –
Impairment losses (87) (39) (761) – (887) – (887)
Reversal of prior year impairment losses 135 8 11 – 154 – 154
Year ended 23 February 2013UK£m
Asia*
£mEurope
£m
TescoBank
£m
Total continuingoperations
£m
Discontinuedoperations*
£mTotal
£m
Capital expenditure (including acquisitions through business combinations):
Property, plant and equipment 1,207 688 434 13 2,342 297 2,639
Investment property – 40 3 – 43 – 43
Goodwill and other intangible assets 207 20 39 97 363 9 372
Depreciation:
Property, plant and equipment (630) (279) (288) (16) (1,213) (109) (1,322)
Investment property – (21) (15) – (36) – (36)
Amortisation of intangible assets (130) (13) (22) (61) (226) (6) (232)
Goodwill impairment losses – – (495) – (495) – (495)
Impairment losses (654) (36) (92) – (782) (68) (850)
Reversal of prior year impairment losses 1 – 2 – 3 3 6* Discontinued operations in this table represents amounts up until the point a disposal group is classified as such. The year ended 22 February 2014 represents China for the
first six months of the financial year and the previous financial year represents the US and China for the full year.
Note 3 Income and expenses
Continuing operations2014
£m2013
£m
Profit before tax is stated after charging/(crediting) the following:
Rental income, of which £34m (2013: £493m) relates to investment properties* (512) (518)
Direct operating expenses arising on rental earning investment properties 5 165
Costs of inventories recognised as an expense 46,832 47,424
Stock losses 1,316 1,157
Depreciation, amortisation and impairment charged 2,265 2,254
Operating lease expenses, of which £102m (2013: £125m) relates to hire of plant and machinery 1,414 1,287
Impairment of goodwill – 495* Refer to Note 11 for detail of £1,623m reclassification of investment property to property, plant and equipment in the year.
During the financial year the Group obtained the following services from the Group’s auditor, PricewaterhouseCoopers LLP, and network firms:
2014£m
2013£m
Audit services
Fees payable to the Company’s auditor and its associates for the audit of the Company and Group financial statements 0.8 0.8
The audit of the accounts of the Company’s subsidiaries 3.5 3.8
Audit-related assurance services 1.2 –
Total audit and audit related services 5.5 4.6
Non-audit services
Fees payable to the Company’s auditor and its associates for other services:
Taxation compliance services – 0.1
Taxation advisory services 0.6 0.4
All other non-audit services 4.1 2.4
Total auditor remuneration 10.2 7.5
In addition to the amounts shown above, the auditor received fees of £0.2m (2013: £0.1m) for the audit of the main Group pension scheme.
A description of the work of the Audit Committee is set out in the Corporate Governance Report on page 33 and includes how objectivity and independence is safeguarded when non-audit services are provided by PricewaterhouseCoopers LLP.
82 Tesco PLC Annual Report and Financial Statements 2014
Notes to the Group financial statements continued
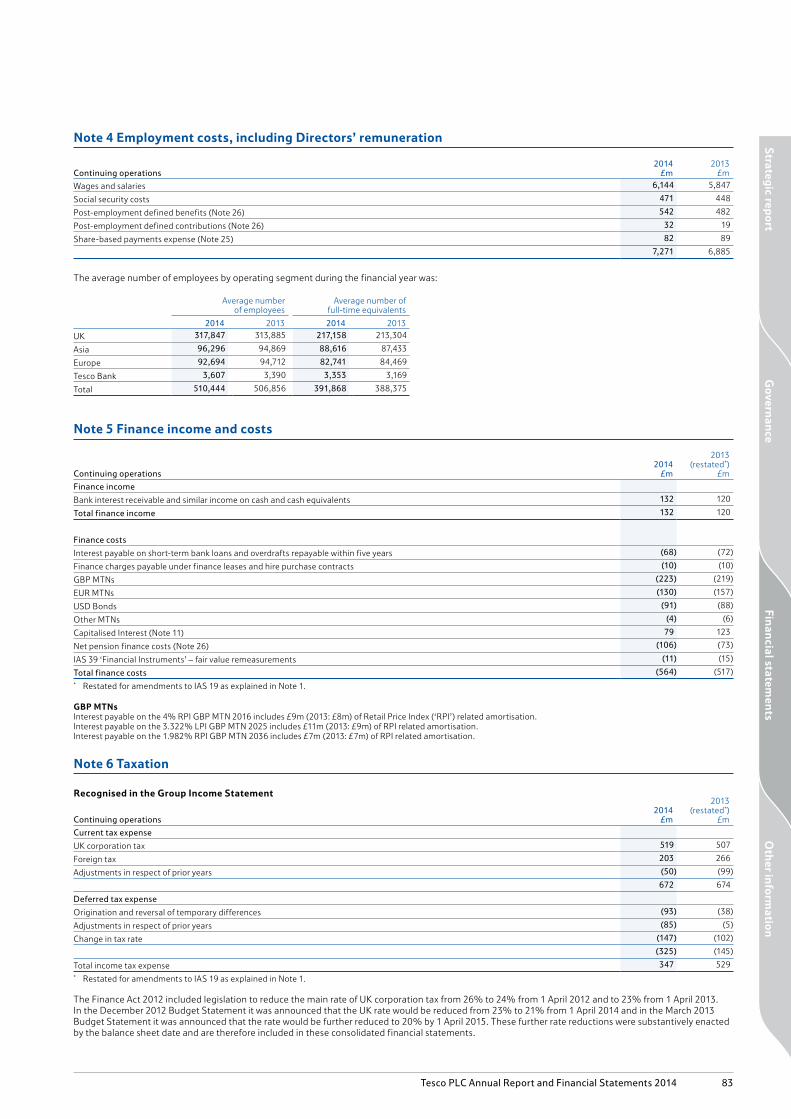
Note 4 Employment costs, including Directors’ remuneration
Continuing operations2014
£m2013
£m
Wages and salaries 6,144 5,847
Social security costs 471 448
Post-employment defined benefits (Note 26) 542 482
Post-employment defined contributions (Note 26) 32 19
Share-based payments expense (Note 25) 82 89
7,271 6,885
The average number of employees by operating segment during the financial year was:
Average numberof employees
Average number of full-time equivalents
2014 2013 2014 2013
UK 317,847 313,885 217,158 213,304
Asia 96,296 94,869 88,616 87,433
Europe 92,694 94,712 82,741 84,469
Tesco Bank 3,607 3,390 3,353 3,169
Total 510,444 506,856 391,868 388,375
Note 5 Finance income and costs
Continuing operations2014
£m
2013(restated*)
£m
Finance income
Bank interest receivable and similar income on cash and cash equivalents 132 120
Total finance income 132 120
Finance costs
Interest payable on short-term bank loans and overdrafts repayable within five years (68) (72)
Finance charges payable under finance leases and hire purchase contracts (10) (10)
GBP MTNs (223) (219)
EUR MTNs (130) (157)
USD Bonds (91) (88)
Other MTNs (4) (6)
Capitalised Interest (Note 11) 79 123
Net pension finance costs (Note 26) (106) (73)
IAS 39 ‘Financial Instruments’ – fair value remeasurements (11) (15)
Total finance costs (564) (517)* Restated for amendments to IAS 19 as explained in Note 1.
GBP MTNsInterest payable on the 4% RPI GBP MTN 2016 includes £9m (2013: £8m) of Retail Price Index (‘RPI’) related amortisation.Interest payable on the 3.322% LPI GBP MTN 2025 includes £11m (2013: £9m) of RPI related amortisation.Interest payable on the 1.982% RPI GBP MTN 2036 includes £7m (2013: £7m) of RPI related amortisation.
Note 6 Taxation
Recognised in the Group Income Statement
Continuing operations2014
£m
2013(restated*)
£m
Current tax expense
UK corporation tax 519 507
Foreign tax 203 266
Adjustments in respect of prior years (50) (99)
672 674
Deferred tax expense
Origination and reversal of temporary differences (93) (38)
Adjustments in respect of prior years (85) (5)
Change in tax rate (147) (102)
(325) (145)
Total income tax expense 347 529* Restated for amendments to IAS 19 as explained in Note 1.
The Finance Act 2012 included legislation to reduce the main rate of UK corporation tax from 26% to 24% from 1 April 2012 and to 23% from 1 April 2013. In the December 2012 Budget Statement it was announced that the UK rate would be reduced from 23% to 21% from 1 April 2014 and in the March 2013 Budget Statement it was announced that the rate would be further reduced to 20% by 1 April 2015. These further rate reductions were substantively enacted by the balance sheet date and are therefore included in these consolidated financial statements.
Oth
er info
rmatio
nG
overnan
ceFin
ancial statem
ents
Strateg
ic repo
rt
Tesco PLC Annual Report and Financial Statements 2014 83

Note 6 Taxation continued
Reconciliation of effective tax charge
2014£m
2013(restated*)
£m
Profit before tax 2,259 2,057
Tax charge at 23.1% (2013: 24.2%) (522) (498)
Effect of:
Non-deductible expenses (109) (291)
Differences in overseas taxation rates (12) 36
Adjustments in respect of prior years 135 104
Share of profits of joint ventures and associates 14 18
Change in tax rate 147 102
Total income tax charge for the year (347) (529)
Effective tax rate 15.4% 25.7%
Tax on items credited directly to the Group Statement of Changes in Equity2014
£m2013
£m
Current tax credit/(charge) on:
Share-based payments 1 (6)
Deferred tax (charge)/credit on:
Share-based payments (1) 1
Total tax on items charged to Group Statement of Changes in Equity – (5)
Tax relating to components of the Group Statement of Comprehensive Income
2014£m
2013(restated*)
£m
Current tax credit/(charge) on:
Pensions – 43
Foreign exchange movements 58 (27)
Fair value of movement on available-for-sale investments – 6
Fair value movements on cash flow hedges 4 –
Deferred tax credit/(charge) on:
Pensions 67 56
Fair value movements on cash flow hedges 35 (3)
Total tax on items credited to Group Statement of Comprehensive Income 164 75
Deferred taxThe following are the major deferred tax (liabilities)/assets recognised by the Group and movements thereon during the current and prior financial years:
Property- related items**
£m
Retirementbenefit
obligation£m
Share-basedpayments
£m
Short-termtiming
differences£m
Tax losses£m
Financial Instruments
£m
Otherpre/post
tax temporary
differences£m
Total(restated*)
£m
At 25 February 2012 (1,689) 465 11 64 24 (22) 10 (1,137)
Credit to the Group Income Statement 87 17 9 9 21 1 1 145
Charge to Group Statement of Changes in Equity – – 1 – – – – 1
Credit/(charge) to Group Statement of Comprehensive Income – 56 – – – (3) – 53
Discontinued operations – – – 5 (8) – (3) (6)
Business combinations – – – 1 1 – (2) –
Foreign exchange and other movements*** (20) 1 – 4 2 – 1 (12)
At 23 February 2013 (1,622) 539 21 83 40 (24) 7 (956)
Credit/(charge) to the Group Income Statement 282 29 19 9 (19) 2 3 325
(Charge) to Group Statement of Changes in Equity – – (1) – – – – (1)
Credit/(charge) to Group Statement of Comprehensive Income – 67 – – – 35 – 102
Discontinued operations – – 3 5 7 – – 15
Business combinations – – – – – – – –
Foreign exchange and other movements*** 32 (1) – (13) (4) – – 14
At 22 February 2014 (1,308) 634 42 84 24 13 10 (501)* Restated for amendments to IAS 19 as explained in Note 1.** Property-related items include a deferred tax liability on rolled over gains of £294m (2013: £340m) and deferred tax assets on capital losses of £58m (2013: £71m).
The remaining balance relates to accelerated tax depreciation.*** The deferred tax charge for foreign exchange and other movements is £14m credit (2013: £12m debit) relating to the retranslation of deferred tax balances at the balance
sheet date and is included within the Group Statement of Comprehensive Income under the heading currency translation differences.
84 Tesco PLC Annual Report and Financial Statements 2014
Notes to the Group financial statements continued

Note 6 Taxation continued
Certain deferred tax assets and liabilities have been offset and analysed as follows:
2014£m
2013£m
Deferred tax assets 73 58
Deferred tax liabilities (594) (1,006)
Deferred tax assets/(liabilities) relating to disposal group 20 (8)
(501) (956)
No deferred tax liability is recognised on temporary differences of £4.0bn (2013: £3.6bn) relating to the unremitted earnings of overseas subsidiaries and joint ventures as the Group is able to control the timing of the reversal of these temporary differences and it is probable that they will not reverse in the foreseeable future. The deferred tax on unremitted earnings at 22 February 2014 is estimated to be £213m (2013: £159m) which relates to taxes payable on repatriation and dividend withholding taxes levied by overseas tax jurisdictions. UK tax legislation relating to company distributions provides for exemption from tax for most repatriated profits, subject to certain exceptions.
Unrecognised deferred tax assetsDeferred tax assets in relation to continuing operations have not been recognised in respect of the following items (because it is not probable that future taxable profits will be available against which the Group can utilise the benefits):
2014£m
2013£m
Deductible temporary differences 27 3
Tax losses 66 52
93 55
As at 22 February 2014, the Group has unused trading tax losses from continuing operations of £398m (2013: £379m) available for offset against future profits. A deferred tax asset has been recognised in respect of £95m (2013: £162m) of such losses. No deferred tax asset has been recognised in respect of the remaining £303m (2013: £217m) due to the unpredictability of future profit streams. Included in unrecognised tax losses are losses of £71m that will expire in 2018 (2013: £92m in 2017) and £142m that will expire between 2019 and 2034 (2013: £37m between 2018 and 2033). Other losses will be carried forward indefinitely.
Note 7 Discontinued operations and non-current assets classified as held for sale
2014£m
2013£m
Assets of disposal groups* 2,160 307
Non-current assets classified as held for sale 327 324
Total assets of the disposal groups and non-current assets classified as held for sale 2,487 631
Total liabilities of the disposal groups* (1,193) (282)
Total net assets classified as held for sale 1,294 349* The year ending 22 February 2014 represents China and the US, while the year ending 23 February 2013 represents the US.
The non-current assets classified as held for sale consist mainly of properties in the UK and Korea due to be sold within one year.
Oth
er info
rmatio
nG
overnan
ceFin
ancial statem
ents
Strateg
ic repo
rt
Tesco PLC Annual Report and Financial Statements 2014 85
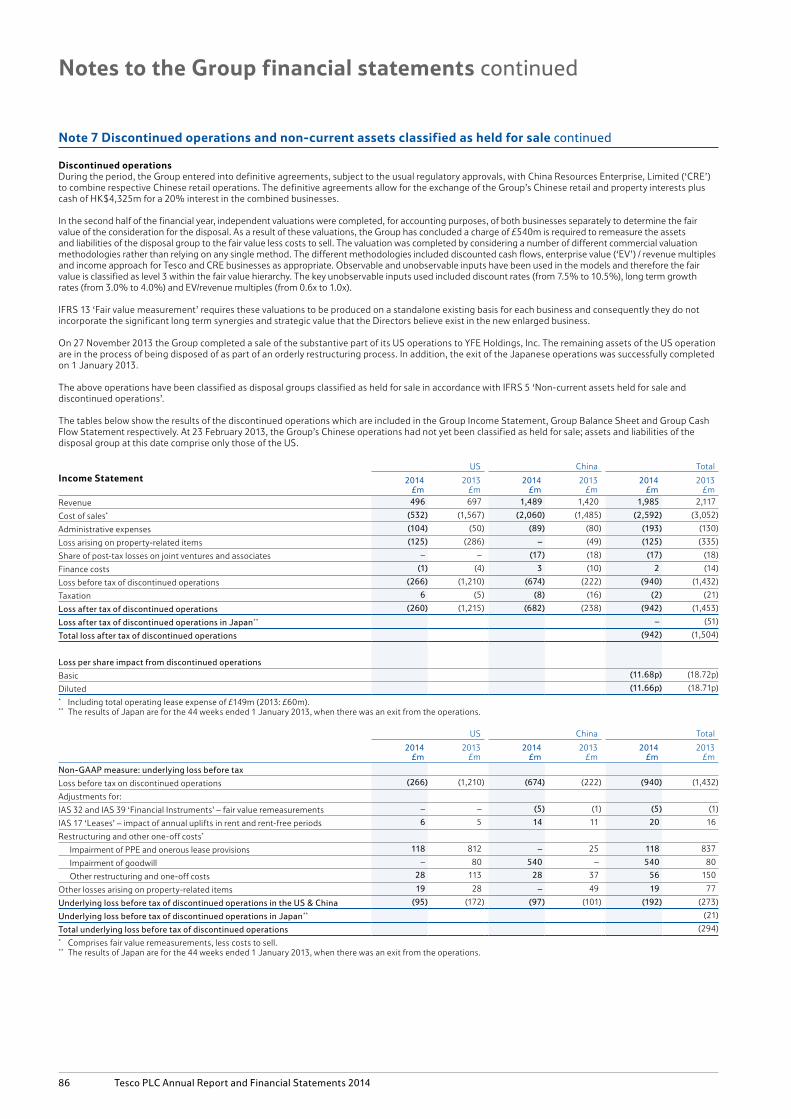
Note 7 Discontinued operations and non-current assets classified as held for sale continued
Discontinued operationsDuring the period, the Group entered into definitive agreements, subject to the usual regulatory approvals, with China Resources Enterprise, Limited (‘CRE’) to combine respective Chinese retail operations. The definitive agreements allow for the exchange of the Group’s Chinese retail and property interests plus cash of HK$4,325m for a 20% interest in the combined businesses.
In the second half of the financial year, independent valuations were completed, for accounting purposes, of both businesses separately to determine the fair value of the consideration for the disposal. As a result of these valuations, the Group has concluded a charge of £540m is required to remeasure the assets and liabilities of the disposal group to the fair value less costs to sell. The valuation was completed by considering a number of different commercial valuation methodologies rather than relying on any single method. The different methodologies included discounted cash flows, enterprise value (‘EV’) / revenue multiples and income approach for Tesco and CRE businesses as appropriate. Observable and unobservable inputs have been used in the models and therefore the fair value is classified as level 3 within the fair value hierarchy. The key unobservable inputs used included discount rates (from 7.5% to 10.5%), long term growth rates (from 3.0% to 4.0%) and EV/revenue multiples (from 0.6x to 1.0x).
IFRS 13 ‘Fair value measurement’ requires these valuations to be produced on a standalone existing basis for each business and consequently they do not incorporate the significant long term synergies and strategic value that the Directors believe exist in the new enlarged business.
On 27 November 2013 the Group completed a sale of the substantive part of its US operations to YFE Holdings, Inc. The remaining assets of the US operation are in the process of being disposed of as part of an orderly restructuring process. In addition, the exit of the Japanese operations was successfully completed on 1 January 2013.
The above operations have been classified as disposal groups classified as held for sale in accordance with IFRS 5 ‘Non-current assets held for sale and discontinued operations’.
The tables below show the results of the discontinued operations which are included in the Group Income Statement, Group Balance Sheet and Group Cash Flow Statement respectively. At 23 February 2013, the Group’s Chinese operations had not yet been classified as held for sale; assets and liabilities of the disposal group at this date comprise only those of the US.
US China TotalIncome Statement 2014
£m2013
£m2014
£m2013
£m2014
£m2013
£m
Revenue 496 697 1,489 1,420 1,985 2,117
Cost of sales* (532) (1,567) (2,060) (1,485) (2,592) (3,052)
Administrative expenses (104) (50) (89) (80) (193) (130)
Loss arising on property-related items (125) (286) – (49) (125) (335)
Share of post-tax losses on joint ventures and associates – – (17) (18) (17) (18)
Finance costs (1) (4) 3 (10) 2 (14)
Loss before tax of discontinued operations (266) (1,210) (674) (222) (940) (1,432)
Taxation 6 (5) (8) (16) (2) (21)
Loss after tax of discontinued operations (260) (1,215) (682) (238) (942) (1,453)
Loss after tax of discontinued operations in Japan** – (51)
Total loss after tax of discontinued operations (942) (1,504)
Loss per share impact from discontinued operations
Basic (11.68p) (18.72p)
Diluted (11.66p) (18.71p)* Including total operating lease expense of £149m (2013: £60m).** The results of Japan are for the 44 weeks ended 1 January 2013, when there was an exit from the operations.
US China Total
2014£m
2013£m
2014£m
2013£m
2014£m
2013£m
Non-GAAP measure: underlying loss before tax
Loss before tax on discontinued operations (266) (1,210) (674) (222) (940) (1,432)
Adjustments for:
IAS 32 and IAS 39 ‘Financial Instruments’ – fair value remeasurements – – (5) (1) (5) (1)
IAS 17 ‘Leases’ – impact of annual uplifts in rent and rent-free periods 6 5 14 11 20 16
Restructuring and other one-off costs*
Impairment of PPE and onerous lease provisions 118 812 – 25 118 837
Impairment of goodwill – 80 540 – 540 80
Other restructuring and one-off costs 28 113 28 37 56 150
Other losses arising on property-related items 19 28 – 49 19 77
Underlying loss before tax of discontinued operations in the US & China (95) (172) (97) (101) (192) (273)
Underlying loss before tax of discontinued operations in Japan** (21)
Total underlying loss before tax of discontinued operations (294)* Comprises fair value remeasurements, less costs to sell.** The results of Japan are for the 44 weeks ended 1 January 2013, when there was an exit from the operations.
86 Tesco PLC Annual Report and Financial Statements 2014
Notes to the Group financial statements continued

Note 7 Discontinued operations and non-current assets classified as held for sale continued
Balance sheet
US 2014
£m
China2014
£mTotal
£m
Assets of the disposal groups
Goodwill and other intangible assets – 100 100
Property, plant and equipment 30 1,145 1,175
Investments in joint ventures and associates – 162 162
Inventories – 138 138
Trade and other receivables – 278 278
Cash and cash equivalents 48 259 307
Total assets of the disposal groups 78 2,082 2,160
Liabilities of the disposal groups
Trade and other payables (33) (864) (897)
Borrowings – (283) (283)
Other current liabilities (13) – (13)
Total liabilities of the disposal groups (46) (1,147) (1,193)
Total net assets of the disposal groups 32 935 967
Future minimum rentals payable under non-cancellable operating leases associated with operations in China and the US at 22 February 2014 were £1,495m and £65m respectively (2013: £684m in the US).
US 2013
£m
Assets of the disposal group
Property, plant and equipment 241
Inventories 32
Trade and other receivables 15
Cash and cash equivalents 19
Total assets of the disposal group 307
Liabilities of the disposal group
Trade and other payables (192)
Borrowings (7)
Other current liabilities (83)
Total liabilities of the disposal group (282)
Total net liabilities of the disposal group 25
Cash flow statement
US China Japan Total
2014£m
2013£m
2014£m
2013£m
2013£m
2014£m
2013£m
Net cash flows from operating activities (106) (145) (66) (26) 4 (172) (167)
Net cash flows from investing activities (1) (98) (290) (276) (48) (291) (422)
Net cash flows from financing activities (7) 7 159 (124) (1) 152 (118)
Net cash flows from discontinued operations (114) (236) (197) (426) (45) (311) (707)
Intra-Group funding and intercompany transactions 146 243 217 412 40 363 695
Net cash flows from discontinued operations, net of intercompany 32 7 20 (14) (5) 52 (12)
Oth
er info
rmatio
nG
overnan
ceFin
ancial statem
ents
Strateg
ic repo
rt
Tesco PLC Annual Report and Financial Statements 2014 87

Note 8 Dividends
2014 2013
pence/share £m pence/share £m
Amounts recognised as distributions to owners in the financial year:
Prior financial year final dividend 10.13 815 10.13 813
Current financial year interim dividend 4.63 374 4.63 371
Dividends paid to equity owners in the financial year 14.76 1,189 14.76 1,184
Current financial year proposed final dividend 10.13 819 10.13 815
The proposed final dividend was approved by the Board of Directors on 15 April 2014 and is subject to the approval of shareholders at the Annual General Meeting. The proposed dividend has not been included as a liability as at 22 February 2014, in accordance with IAS 10 ‘Events after the reporting period’. It will be paid on 4 July 2014 to shareholders who are on the Register of members at close of business on 2 May 2014.
Note 9 Earnings per share and diluted earnings per share
Basic earnings per share amounts are calculated by dividing the profit attributable to owners of the parent by the weighted average number of ordinary shares in issue during the financial year.
Diluted earnings per share amounts are calculated by dividing the profit attributable to owners of the parent by the weighted average number of ordinary shares in issue during the financial year adjusted for the effects of potentially dilutive options. The dilutive effect is calculated on the full exercise of all potentially dilutive ordinary share options granted by the Group, including performance-based options which the Group considers to have been earned.
2014 2013 (restated*)
Basic
Potentially dilutive
share options Diluted Basic
Potentially dilutive
share options Diluted
Profit/(loss) (£m)
Continuing operations 1,916 – 1,916 1,532 – 1,532
Discontinued operations (942) – (942) (1,504) – (1,504)
Weighted average number of shares (millions) 8,068 10 8,078 8,033 4 8,037
Earnings per share (pence)
Continuing operations 23.75 (0.03) 23.72 19.07 (0.01) 19.06
Discontinued operations (11.68) 0.02 (11.66) (18.72) 0.01 (18.71)
Total 12.07 (0.01) 12.06 0.35 – 0.35
There have been no transactions involving ordinary shares between the reporting date and the date of approval of these financial statements which would significantly change the earnings per share calculations shown above.
Reconciliation of non-GAAP underlying diluted earnings per share2014 2013 (restated*)
£m pence/share £m pence/share
Profit from continuing operations (Diluted) 1,916 23.72 1,532 19.06
Adjustments for:
IAS 32 and IAS 39 ‘Financial Instruments’ – fair value remeasurements 11 0.14 15 0.19
IAS 19 ‘Employee Benefits’ – non-cash Group Income Statement charge for pensions 117 1.45 69 0.86
IAS 17 ‘Leases’ – impact of annual uplifts in rent and rent-free periods 22 0.27 17 0.21
IFRS 3 ‘Business Combinations’ – intangible asset amortisation charges and costs arising from acquisitions 14 0.17 19 0.24
IFRIC 13 ‘Customer Loyalty Programmes’ – fair value of awards 10 0.12 28 0.35
Restructuring and other one-off costs:
Impairment of PPE and onerous lease provisions included within costs of sales 734 9.09 161 2.00
Impairment of PPE and onerous lease provisions included within profits/losses arising on property-related items (98) (1.21) 709 8.82
Impairment of goodwill – – 495 6.16
Provision for customer redress 63 0.78 115 1.43
Other restructuring and one-off items 102 1.26 14 0.17
Other profits/losses arising on property-related items (180) (2.23) (419) (5.21)
Tax effect of adjustments at the effective rate of tax** (2014: 15.4%, 2013: 17.4%) (122) (1.51) (43) (0.54)
Underlying earnings from continuing operations 2,589 32.05 2,712 33.74* Restated for amendments to IAS 19 as explained in Note 1. ** The effective tax rate of 15.4% (2013: 17.4%) excludes certain permanent differences on which tax relief is not available.
88 Tesco PLC Annual Report and Financial Statements 2014
Notes to the Group financial statements continued

Note 10 Goodwill and other intangible assets
Internallygenerated
developmentcosts
£m
Pharmacyand
softwarelicences
£m
Otherintangible
assets£m
Goodwill£m
Total£m
Cost
At 23 February 2013 1,655 1,004 366 3,580 6,605
Foreign currency translation (6) (40) (12) (111) (169)
Additions 245 116 23 60 444
Reclassification (31) 38 2 – 9
Disposals (70) (10) (1) – (81)
Transfer to disposal group classified as held for sale – (51) – (649) (700)
At 22 February 2014 1,793 1,057 378 2,880 6,108
Accumulated amortisation and impairment losses
At 23 February 2013 916 440 261 626 2,243
Foreign currency translation (3) (24) (3) (32) (62)
Amortisation for the year 111 101 19 – 231
Reclassification (48) 48 2 – 2
Disposals (68) (10) (1) – (79)
Transfer to disposal group classified as held for sale – (22) – – (22)
At 22 February 2014 908 533 278 594 2,313
Net carrying value
At 22 February 2014 885 524 100 2,286 3,795
At 23 February 2013 739 564 105 2,954 4,362
Internallygenerated
developmentcosts
£m
Pharmacyand
softwarelicences
£m
Otherintangible
assets£m
Goodwill£m
Total£m
Cost
At 25 February 2012 1,454 726 347 3,548 6,075
Foreign currency translation 1 16 4 84 105
Additions 161 170 13 28 372
Reclassification 40 97 2 – 139
Disposals (1) (5) – – (6)
Transfer to disposal group classified as held for sale – – – (80) (80)
At 23 February 2013 1,655 1,004 366 3,580 6,605
Accumulated amortisation and impairment losses
At 25 February 2012 777 340 241 99 1,457
Foreign currency translation 2 9 – 32 43
Amortisation for the year 121 91 20 – 232
Impairment losses for the year 16 – – 495 511
At 23 February 2013 916 440 261 626 2,243
Oth
er info
rmatio
nG
overnan
ceFin
ancial statem
ents
Strateg
ic repo
rt
Tesco PLC Annual Report and Financial Statements 2014 89

Note 10 Goodwill and other intangible assets continued
Impairment of goodwillGoodwill arising on business combinations is not amortised but is reviewed for impairment on an annual basis, or more frequently if there are indications that goodwill may be impaired. Goodwill acquired in a business combination is allocated to groups of cash-generating units according to the level at which management monitor that goodwill.
Recoverable amounts for cash-generating units are based on the higher of value in use and fair value less costs of disposal. Value in use is calculated from cash flow projections for generally five years using data from the Group’s latest internal forecasts, the results of which are reviewed by the Board. The key assumptions for the value in use calculations are those regarding discount rates, growth rates and expected changes in margins. Management estimates discount rates using pre-tax rates that reflect the current market assessment of the time value of money and the risks specific to the cash-generating units. Changes in selling prices and direct costs are based on past experience and expectations of future changes in the market. Given the current economic climate, a sensitivity analysis has been performed in assessing the recoverable amounts of goodwill.
The pre-tax discount rates used to calculate value in use range from 7% to 11% (2013: 7% to 12%). On a post-tax basis, the discount rates range from 6% to 8% (2013: 5% to 10%). These discount rates are derived from the Group’s post-tax weighted average cost of capital, as adjusted for the specific risks relating to each cash-generating unit.
The forecasts are extrapolated beyond five years based on estimated long-term average growth rates of 2% to 3% (2013: 1% to 5%).
In February 2014 and 2013 impairment reviews were performed by comparing the carrying value of goodwill with the recoverable amount of the cash-generating units to which goodwill has been allocated.
In July 2013, the European Commission announced proposed changes in regulation which would cap interchange fees on consumer debit and credit cards. The regulation remains draft and it is unclear at this stage how and when the proposals will be finally implemented. Transaction fees on credit cards represent a significant part of the Tesco Bank business so any limitation on interchange fees may have an impact of the carrying value of goodwill for that business. Given the uncertainty surrounding the outcome of the proposed changes, no change to existing interchange fees has been considered as part of goodwill impairment testing for Tesco Bank at this time.
The components of goodwill are as follows:2014
£m2013
£m
China – 649
Malaysia 74 86
South Korea 475 514
Tesco Bank 802 802
Thailand 145 173
UK 761 701
Other 29 29
2,286 2,954
Goodwill related to China was reclassified to discontinued operations in the year.
An impairment charge of £495m was made in the previous year and arose from Poland (£373m), Czech Republic (£69m) and Turkey (£53m) CGUs (all included in the European operating segment). This loss was recognised in the cost of sales line in the Group Income Statement.
90 Tesco PLC Annual Report and Financial Statements 2014
Notes to the Group financial statements continued

Note 11 Property, plant and equipment
Land andbuildings
£mOther(a)
£mTotal
£m
Cost
At 23 February 2013 24,817 10,826 35,643
Foreign currency translation (1,131) (470) (1,601)
Additions(b) 1,492 955 2,447
Acquired through business combinations 9 6 15
Reclassification 1,875 27 1,902
Classified as held for sale (115) – (115)
Disposals (239) (133) (372)
Transfer to disposal group classified as held for sale (974) (360) (1,334)
At 22 February 2014 25,734 10,851 36,585
Accumulated depreciation and impairment losses
At 23 February 2013 3,961 6,812 10,773
Foreign currency translation (220) (267) (487)
Charge for the year 466 846 1,312
Impairment losses 814 52 866
Reversal of impairment losses (152) (2) (154)
Reclassification 282 1 283
Classified as held for sale 2 1 3
Disposals (139) (117) (256)
Transfer to disposal group classified as held for sale (29) (216) (245)
At 22 February 2014 4,985 7,110 12,095
Net carrying value(c)(d)
At 22 February 2014 20,749 3,741 24,490
At 23 February 2013 20,856 4,014 24,870
Construction in progress included above(e)
At 22 February 2014 612 80 692
At 23 February 2013 584 96 680(a) Other assets consist of plant, equipment, fixtures and fittings and motor vehicles.(b) Includes £79m (2013: £123m) in respect of interest capitalised, principally relating to land and building assets. The capitalisation rate used to determine the amount of finance
costs capitalised during the financial year was 5.1% (2013: 5.1%). Interest capitalised is deducted in determining taxable profit in the financial year in which it is incurred.(c) Net carrying value includes: (i) Capitalised interest of £1,208m (2013: £1,195m). (ii) Assets held under finance leases which are analysed below:
2014 2013
Land andbuildings
£mOther(a)
£m
Land andbuildings
£mOther(a)
£m
Cost 151 558 157 559
Accumulated depreciation and impairment losses (50) (529) (45) (514)
Net carrying value 101 29 112 45
These assets are pledged as security for the finance lease liabilities.
(d) The net carrying value of land and buildings comprises:
2014
£m2013
£m
Freehold 18,430 18,335
Long leasehold – 50 years or more 662 623
Short leasehold – less than 50 years 1,657 1,898
Net carrying value 20,749 20,856(e) Construction in progress does not include land.
The Group continually assesses the level of services provided to tenants of its managed investment properties in accordance with IAS 40. During the year, it was concluded that the level of services provided to tenants of some malls operated by the Group are no longer considered insignificant and as a result a number of malls with a net book value of £1,623m have been reclassified from investment property to property, plant and equipment.
Oth
er info
rmatio
nG
overnan
ceFin
ancial statem
ents
Strateg
ic repo
rt
Tesco PLC Annual Report and Financial Statements 2014 91

Note 11 Property, plant and equipment continued
Land andbuildings
£mOther(a)
£mTotal
£m
Cost
At 25 February 2012 24,761 10,011 34,772
Foreign currency translation 428 173 601
Additions(b) 1,525 1,109 2,634
Acquired through business combinations 4 1 5
Reclassification (104) (28) (132)
Classified as held for sale (125) (4) (129)
Disposals (734) (116) (850)
Transfer to disposal group classified as held for sale (938) (320) (1,258)
At 23 February 2013 24,817 10,826 35,643
Accumulated depreciation and impairment losses
At 25 February 2012 2,951 6,111 9,062
Foreign currency translation 64 98 162
Charge for the year 448 874 1,322
Impairment losses 831 2 833
Reversal of impairment losses (5) (1) (6)
Reclassification (6) 1 (5)
Classified as held for sale (25) (2) (27)
Disposals (182) (98) (280)
Transfer to disposal group classified as held for sale (115) (173) (288)
At 23 February 2013 3,961 6,812 10,773(a) (b) See page 91 for footnotes.
Impairment of property, plant and equipmentThe Group has determined that for the purposes of impairment testing, each store is a cash-generating unit. Cash-generating units are tested for impairment if there are indicators of impairment at the balance sheet date. Recoverable amounts for cash-generating units are based mainly on value in use but with some based on fair value less costs of disposal where it gives a higher value.
Value in use is generally calculated from cash flow projections for five years using data from the Group’s latest internal forecasts, the results of which are reviewed by the Board. The forecasts are extrapolated beyond five years based on estimated long-term growth rates of 2% to 5% (2013: 1% to 5%).
The key assumptions for the value in use calculations are those regarding discount rates, growth rates and expected changes in margins. Management estimates discount rates using pre-tax rates that reflect the current market assessment of the time value of money and the risks specific to the cash-generating units. Changes in selling prices and direct costs are based on past experience and expectations of future changes in the market. The pre-tax discount rates used to calculate value in use range from 6% to 14% (2013: 7% to 12%) depending on the specific conditions in which each store operates. On a post-tax basis, the discount rates range from 6% to 12% (2013: 5% to 10%). These discount rates are derived from the Group’s post-tax weighted average cost of capital, as adjusted for the specific risks relating to each geographical region.
Fair value less costs of disposal for stores was determined by reference to rental yields and residual valuation approach.
The impairment losses relate to stores, distribution centres and work-in-progress sites. In the financial year, an impairment loss of £707m was recognised relating to properties in Europe following a reduction in profits which resulted in a revision of long-term forecast cash flows. This was classified as ‘Impairment of PPE and onerous lease provisions included within cost of sale’ within non-GAAP measures in the Group Income Statement.
The reversal of previous impairment losses arose due to changes in fair value less costs of disposal or in forecasts resulting in increased value in use.
92 Tesco PLC Annual Report and Financial Statements 2014
Notes to the Group financial statements continued
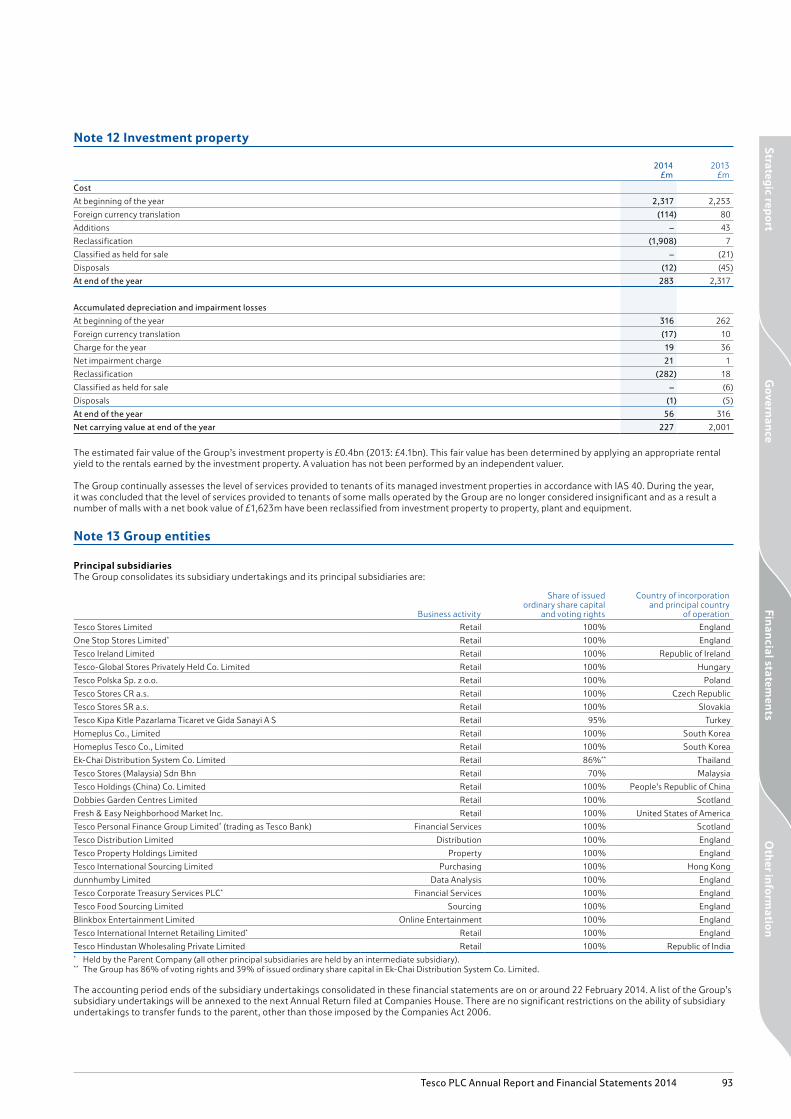
Note 12 Investment property
2014£m
2013£m
Cost
At beginning of the year 2,317 2,253
Foreign currency translation (114) 80
Additions – 43
Reclassification (1,908) 7
Classified as held for sale – (21)
Disposals (12) (45)
At end of the year 283 2,317
Accumulated depreciation and impairment losses
At beginning of the year 316 262
Foreign currency translation (17) 10
Charge for the year 19 36
Net impairment charge 21 1
Reclassification (282) 18
Classified as held for sale – (6)
Disposals (1) (5)
At end of the year 56 316
Net carrying value at end of the year 227 2,001
The estimated fair value of the Group’s investment property is £0.4bn (2013: £4.1bn). This fair value has been determined by applying an appropriate rental yield to the rentals earned by the investment property. A valuation has not been performed by an independent valuer.
The Group continually assesses the level of services provided to tenants of its managed investment properties in accordance with IAS 40. During the year, it was concluded that the level of services provided to tenants of some malls operated by the Group are no longer considered insignificant and as a result a number of malls with a net book value of £1,623m have been reclassified from investment property to property, plant and equipment.
Note 13 Group entities
Principal subsidiariesThe Group consolidates its subsidiary undertakings and its principal subsidiaries are:
Business activity
Share of issuedordinary share capital
and voting rights
Country of incorporationand principal country
of operation
Tesco Stores Limited Retail 100% England
One Stop Stores Limited* Retail 100% England
Tesco Ireland Limited Retail 100% Republic of Ireland
Tesco-Global Stores Privately Held Co. Limited Retail 100% Hungary
Tesco Polska Sp. z o.o. Retail 100% Poland
Tesco Stores CR a.s. Retail 100% Czech Republic
Tesco Stores SR a.s. Retail 100% Slovakia
Tesco Kipa Kitle Pazarlama Ticaret ve Gida Sanayi A S Retail 95% Turkey
Homeplus Co., Limited Retail 100% South Korea
Homeplus Tesco Co., Limited Retail 100% South Korea
Ek-Chai Distribution System Co. Limited Retail 86%** Thailand
Tesco Stores (Malaysia) Sdn Bhn Retail 70% Malaysia
Tesco Holdings (China) Co. Limited Retail 100% People’s Republic of China
Dobbies Garden Centres Limited Retail 100% Scotland
Fresh & Easy Neighborhood Market Inc. Retail 100% United States of America
Tesco Personal Finance Group Limited* (trading as Tesco Bank) Financial Services 100% Scotland
Tesco Distribution Limited Distribution 100% England
Tesco Property Holdings Limited Property 100% England
Tesco International Sourcing Limited Purchasing 100% Hong Kong
dunnhumby Limited Data Analysis 100% England
Tesco Corporate Treasury Services PLC* Financial Services 100% England
Tesco Food Sourcing Limited Sourcing 100% England
Blinkbox Entertainment Limited Online Entertainment 100% England
Tesco International Internet Retailing Limited* Retail 100% England
Tesco Hindustan Wholesaling Private Limited Retail 100% Republic of India* Held by the Parent Company (all other principal subsidiaries are held by an intermediate subsidiary).** The Group has 86% of voting rights and 39% of issued ordinary share capital in Ek-Chai Distribution System Co. Limited.
The accounting period ends of the subsidiary undertakings consolidated in these financial statements are on or around 22 February 2014. A list of the Group’s subsidiary undertakings will be annexed to the next Annual Return filed at Companies House. There are no significant restrictions on the ability of subsidiary undertakings to transfer funds to the parent, other than those imposed by the Companies Act 2006.
Oth
er info
rmatio
nG
overnan
ceFin
ancial statem
ents
Strateg
ic repo
rt
Tesco PLC Annual Report and Financial Statements 2014 93

Note 13 Group entities continued
Interests in joint ventures and associatesThe Group uses the equity method of accounting for its interest in joint ventures and associates. The following table shows the aggregate movement in the Group’s investment in joint ventures and associates:
Joint ventures£m
Associates£m
Total£m
At 25 February 2012 308 115 423
Additions* 11 87 98
Disposals (1) (43) (44)
Foreign currency translation 10 6 16
Share of post-tax profits of joint ventures and associates 35 19 54
Other movements in reserves – (2) (2)
Dividends received from joint ventures and associates (46) (5) (51)
At 23 February 2013 317 177 494
Additions* 3 2 5
Disposals (1) – (1)
Foreign currency translation (2) (16) (18)
Share of post-tax profits of joint ventures and associates 43 8 51
Other movements in reserves – (5) (5)
Dividends received from joint ventures and associates (39) (23) (62)
Transferred to assets of the disposal group (178) – (178)
At 22 February 2014 143 143 286* Additions are net of £5m deferred gain (2013: £60m).
Share of post-tax profits of joint ventures includes £(9)m loss attributable to joint venture operations of China for the first six months of the year ended 22 February 2014.
Significant joint ventures The Group’s principal joint ventures are:
Business activity
Share of issued share capital, loan capital and
debt securities
Country of incorporation and principal country
of operation
Shopping Centres Limited* Property Investment 50% England
BLT Properties Limited* Property Investment 50% England
The Tesco British Land Property Partnership Property Investment 50% England
The Tesco Red Limited Partnership Property Investment 50% England
The Tesco Aqua Limited Partnership Property Investment 50% England
The Tesco Coral Limited Partnership Property Investment 50% England
The Tesco Blue Limited Partnership Property Investment 50% England
The Tesco Atrato Limited Partnership Property Investment 50% England
The Tesco Property Limited Partnership Property Investment 50% England
The Tesco Passaic Limited Partnership Property Investment 50% England
The Tesco Navona Limited Partnership Property Investment 50% England
The Tesco Sarum Limited Partnership Property Investment 50% England
The Tesco Dorney Limited Partnership Property Investment 50% England
Tesco BL Properties Limited Property Investment 50% England
Fushun Splendor Real Estate Development Co. Limited Property Investment 50% People’s Republic of China
Anshan Tesco Real Estate Development Co. Limited Property Investment 50% People’s Republic of China
Tesco Qinhuangdo Property Limited Property Investment 50% People’s Republic of China
Xiamen Hete Property Co. Limited Property Investment 50% People’s Republic of China
Tesco Fujian Property Limited Property Investment 50% People’s Republic of China
Tesco Shenyang Property Co. Limited Property Investment 50% People’s Republic of China
Tesco (Fujian) Industry Limited Property Investment 50% People’s Republic of China
Tesco Nanjing Zhongshan Real Estate Development Co. Limited Property Investment 50% People’s Republic of China
Arena (Jersey) Management Limited Property Investment 50% Jersey
The Tesco Property (No. 2) Limited Partnership Property Investment 50% Jersey
Tesco Mobile Limited Telecommunications 50% England* Held by the Parent Company (all other significant joint ventures are held by an intermediate subsidiary).
The accounting period end dates of the joint ventures consolidated in these financial statements range from 31 December 2013 to 28 February 2014. The accounting period end dates differ from those of the Group for commercial reasons and depend upon the requirements of the joint venture partner as well as those of the Group.
There are no significant restrictions on the ability of joint ventures to transfer funds to the parent, other than those imposed by the Companies Act 2006.
94 Tesco PLC Annual Report and Financial Statements 2014
Notes to the Group financial statements continued

Note 13 Group entities continued
The share of the assets, liabilities, revenue and profit of the Group’s joint ventures, which are included in the Group financial statements, are as follows:
2014£m
2013£m
Non-current assets 3,158 3,391
Current assets 396 821
Current liabilities (377) (2,233)
Non-current liabilities (3,205) (1,837)
Net assets (28) 142
Cumulative unrecognised losses 171 175
Interests in joint ventures 143 317
Revenue 599 551
Profit for the year 52 35
Associates The Group’s principal associates are:
Business activity
Share of issued share capital, loan capital and debt securities
Country of incorporation and principal country
of operation
Tesco Underwriting Limited* Insurance 49.9% England
Tesco Lotus Retail Growth Freehold and Leasehold Property Fund* Property Investment 25% Thailand* Held by an intermediate subsidiary.
The share of the assets, liabilities, revenue and profit of the Group’s associates, which are included in the Group financial statements, are as follows:
2014£m
2013£m
Assets 456 574
Liabilities (313) (397)
Interests in associates 143 177
Revenue 237 2,370
Profit for the year 8 19
The accounting period end dates of the associates consolidated in these financial statements range from 31 December 2013 to 28 February 2014.
The accounting period end dates of the associates are different from those of the Group as they depend upon the requirements of the parent companies of those entities.
There are no significant restrictions on the ability of associated undertakings to transfer funds to the parent, other than those imposed by the Companies Act 2006.
Note 14 Other investments
2014£m
2013£m
Loan receivable 69 –
Available-for-sale financial assets 946 818
1,015 818
Available-for-sale financial assets mainly comprise investments in bonds with varied maturities of which £167m (2013: £57m) is current.
Note 15 Inventories
2014£m
2013£m
Goods held for resale 3,467 3,643
Development properties 109 101
3,576 3,744
Oth
er info
rmatio
nG
overnan
ceFin
ancial statem
ents
Strateg
ic repo
rt
Tesco PLC Annual Report and Financial Statements 2014 95
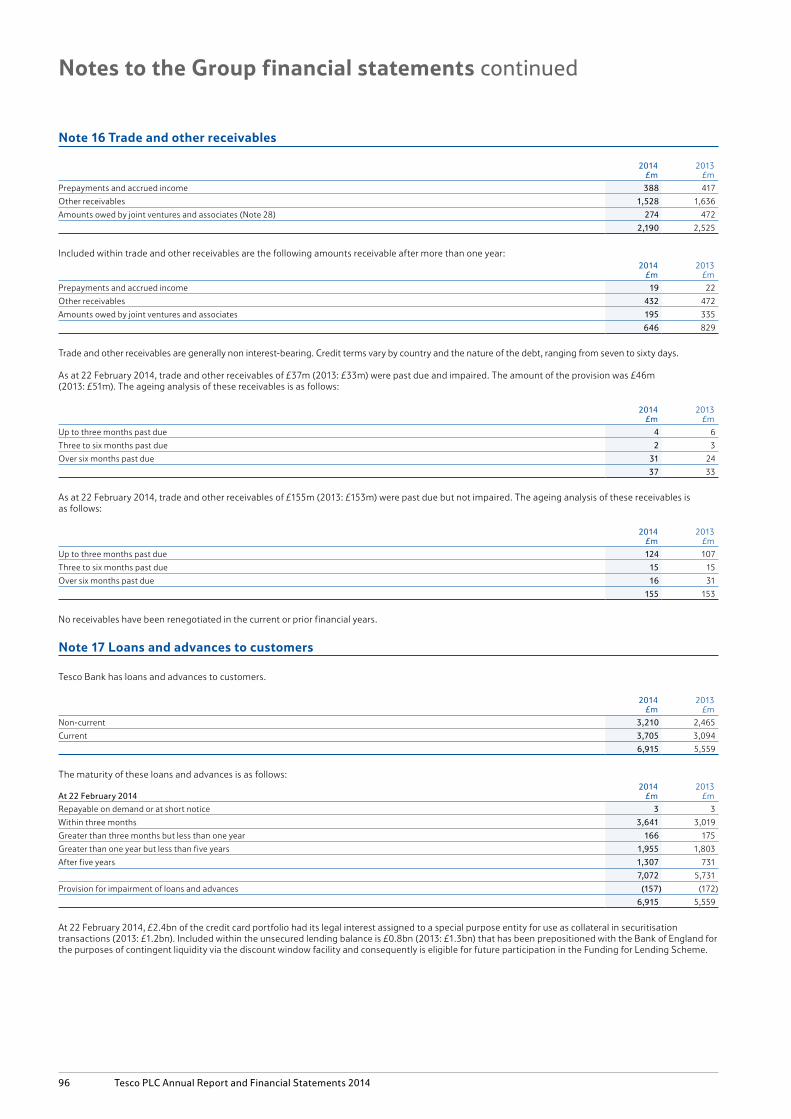
Note 16 Trade and other receivables
2014£m
2013£m
Prepayments and accrued income 388 417
Other receivables 1,528 1,636
Amounts owed by joint ventures and associates (Note 28) 274 472
2,190 2,525
Included within trade and other receivables are the following amounts receivable after more than one year:2014
£m2013
£m
Prepayments and accrued income 19 22
Other receivables 432 472
Amounts owed by joint ventures and associates 195 335
646 829
Trade and other receivables are generally non interest-bearing. Credit terms vary by country and the nature of the debt, ranging from seven to sixty days.
As at 22 February 2014, trade and other receivables of £37m (2013: £33m) were past due and impaired. The amount of the provision was £46m (2013: £51m). The ageing analysis of these receivables is as follows:
2014£m
2013£m
Up to three months past due 4 6
Three to six months past due 2 3
Over six months past due 31 24
37 33
As at 22 February 2014, trade and other receivables of £155m (2013: £153m) were past due but not impaired. The ageing analysis of these receivables is as follows:
2014£m
2013£m
Up to three months past due 124 107
Three to six months past due 15 15
Over six months past due 16 31
155 153
No receivables have been renegotiated in the current or prior financial years.
Note 17 Loans and advances to customers
Tesco Bank has loans and advances to customers.
2014£m
2013£m
Non-current 3,210 2,465
Current 3,705 3,094
6,915 5,559
The maturity of these loans and advances is as follows:
At 22 February 20142014
£m2013
£m
Repayable on demand or at short notice 3 3
Within three months 3,641 3,019
Greater than three months but less than one year 166 175
Greater than one year but less than five years 1,955 1,803
After five years 1,307 731
7,072 5,731
Provision for impairment of loans and advances (157) (172)
6,915 5,559
At 22 February 2014, £2.4bn of the credit card portfolio had its legal interest assigned to a special purpose entity for use as collateral in securitisation transactions (2013: £1.2bn). Included within the unsecured lending balance is £0.8bn (2013: £1.3bn) that has been prepositioned with the Bank of England for the purposes of contingent liquidity via the discount window facility and consequently is eligible for future participation in the Funding for Lending Scheme.
96 Tesco PLC Annual Report and Financial Statements 2014
Notes to the Group financial statements continued
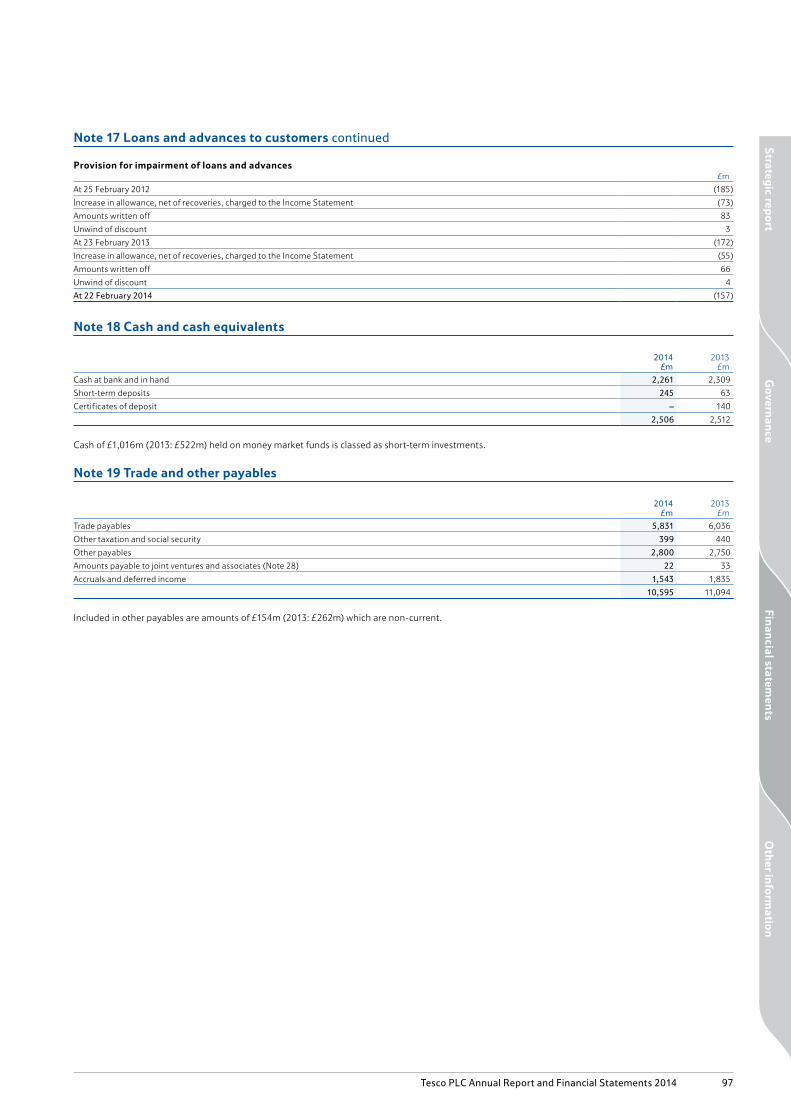
Note 17 Loans and advances to customers continued
Provision for impairment of loans and advances£m
At 25 February 2012 (185)
Increase in allowance, net of recoveries, charged to the Income Statement (73)
Amounts written off 83
Unwind of discount 3
At 23 February 2013 (172)
Increase in allowance, net of recoveries, charged to the Income Statement (55)
Amounts written off 66
Unwind of discount 4
At 22 February 2014 (157)
Note 18 Cash and cash equivalents
2014£m
2013£m
Cash at bank and in hand 2,261 2,309
Short-term deposits 245 63
Certificates of deposit – 140
2,506 2,512
Cash of £1,016m (2013: £522m) held on money market funds is classed as short-term investments.
Note 19 Trade and other payables
2014£m
2013£m
Trade payables 5,831 6,036
Other taxation and social security 399 440
Other payables 2,800 2,750
Amounts payable to joint ventures and associates (Note 28) 22 33
Accruals and deferred income 1,543 1,835
10,595 11,094
Included in other payables are amounts of £154m (2013: £262m) which are non-current.
Oth
er info
rmatio
nG
overnan
ceFin
ancial statem
ents
Strateg
ic repo
rt
Tesco PLC Annual Report and Financial Statements 2014 97

Note 20 Borrowings
Current
Par valueMaturity
year2014
£m2013
£m
Bank loans and overdrafts – – 830 730
Loans from joint ventures (Note 28) – – 16 16
5% MTN £600m 2014 628 –
2% USD Bond $500m 2014 300 –
Other MTNs – – 130 14
Finance leases (Note 34) – – 6 6
1,910 766
Non-current
Par valueMaturity
year2014
£m2013
£m
5% MTN £600m 2014 – 642
2% USD Bond $500m 2014 – 328
5.125% MTN €600m 2015 528 566
4% RPI MTN* £299m 2016 304 295
5.875% MTN €1,039m 2016 1,011 1,071
2.7% USD Bond $500m 2017 299 328
1.250% MTN €500m 2017 411 –
5.5% USD Bond $850m 2017 595 674
5.2% Tesco Bank Retail Bond £125m 2018 139 141
3.375% MTN €750m 2018 620 653
5.5% MTN £350m 2019 352 352
1% RPI Tesco Bank Retail Bond** £60m 2019 60 60
2.125% MTN €500m 2020 411 –
5% Tesco Bank Retail Bond £200m 2020 197 206
6.125% MTN £900m 2022 948 948
5% MTN £389m 2023 401 404
3.322% LPI MTN† £307m 2025 310 299
6% MTN £200m 2029 242 255
5.5% MTN £200m 2033 241 251
1.982% RPI MTN± £254m 2036 256 248
6.15% USD Bond $1,150m 2037 792 911
4.875% MTN £173m 2042 174 174
5.125% MTN €600m 2047 605 641
5.2% MTN £279m 2057 274 274
Other MTNs – – – 146
Other loans – – 18 79
Finance leases (Note 34) – – 115 122
9,303 10,068* The 4% RPI MTN is redeemable at par, including indexation for increases in the Retail Price Index (‘RPI’) over the life of the MTN.** The 1% RPI Tesco Bank Retail Bond is redeemable at par, including indexation for increases in the RPI over the life of the Bond.† The 3.322% Limited Price Inflation (‘LPI’) MTN is redeemable at par, including indexation for increases in the RPI over the life of the MTN. The maximum indexation of the
principal in any one year is 5%, with a minimum of 0%.± The 1.982% RPI MTN is redeemable at par, including indexation for increases in the RPI over the life of the MTN.
Borrowing facilitiesThe Group has the following undrawn committed facilities available at 22 February 2014, in respect of which all conditions precedent had been met as at that date:
2014£m
2013£m
Expiring between one and two years 125 1,600
Expiring in more than two years 2,600 1,225
2,725 2,825
All facilities incur commitment fees at market rates and would provide funding at floating rates.
98 Tesco PLC Annual Report and Financial Statements 2014
Notes to the Group financial statements continued

Note 21 Financial instruments
Derivatives are used to hedge exposure to market risks and those that are held as hedging instruments are formally designated as hedges as defined in IAS 39. Derivatives may qualify as hedges for accounting purposes and the Group’s hedging policies are further described below.
Net finance cost of £22m (2013: £19m) resulted from hedge ineffectiveness.
Fair value hedgesThe Group maintains interest rate and cross currency swap contracts as fair value hedges of the interest rate and currency risk on fixed rate debt issued by the Group. Changes in the fair value of derivatives that are designated and qualify as fair value hedges are recorded in the Group Income Statement, together with any changes in the fair value of the hedged asset or liability that are attributable to the hedged risk. The gain or loss on the hedging instrument and hedged item is recognised in the Group Income Statement within finance income or costs. If the hedge no longer meets the criteria for hedge accounting, the adjustment to the carrying value of the hedged item is amortised to the Group Income Statement.
A loss of £311m on hedging instruments was recognised during the year, offset by a gain of £282m on hedged items (2013: a gain of £52m on hedging instruments was offset by a loss of £65m on hedged items).
Cash flow hedgesThe Group uses forward contracts to hedge the foreign currency cost of future purchases of goods for resale, where those purchases are denominated in a currency other than the functional currency of the purchasing company. Where these contracts qualify for hedge accounting, fair value gains and losses are deferred in equity. These hedging instruments are primarily used to hedge purchases in Euros and US Dollars. The cash flows hedged will occur and will affect the Group Income Statement within one year of the balance sheet date.
The Group also uses index-linked swaps to hedge cash flows on index linked debt, interest rate swaps to hedge interest cash flows on debt and cross currency swaps to hedge cash flows on fixed rate debt denominated in foreign currencies.
Net investment hedges The Group uses currency denominated borrowings and currency swaps to hedge the exposure of a portion of its net investment in overseas operations against changes in value due to changes in foreign exchange rates. A net finance income of £7m (2013: a net finance cost of £6m) was recorded resulting from net investment hedging ineffectiveness.
Gains and losses accumulated in equity are recycled to the Group Income Statement on disposal of overseas operations.
Financial instruments not qualifying for hedge accountingThe Group’s policy does not permit use of derivatives for trading purposes. However, some derivatives do not qualify for hedge accounting, or are specifically not designated as a hedge where gains and losses on the hedging instrument and the hedged item naturally offset in the Group Income Statement.
These instruments include cross currency interest rate swaps, index linked swaps and forward foreign currency contracts. Changes in the fair value of any derivative instruments that do not qualify for hedge accounting are recognised immediately in the Group Income Statement within finance income or costs.
The fair values of derivative financial instruments have been disclosed in the Group Balance Sheet as follows:
2014 2013
Asset£m
Liability£m
Asset£m
Liability£m
Current 80 (99) 58 (121)
Non-current 1,496 (770) 1,965 (759)
1,576 (869) 2,023 (880)
Oth
er info
rmatio
nG
overnan
ceFin
ancial statem
ents
Strateg
ic repo
rt
Tesco PLC Annual Report and Financial Statements 2014 99

Note 21 Financial instruments continued
The fair value and notional amounts of derivatives analysed by hedge type are as follows:
2014 2013
Asset Liability Asset Liability
Fair value£m
Notional£m
Fair value£m
Notional£m
Fair value£m
Notional£m
Fair value£m
Notional£m
Fair value hedges
Interest rate swaps and similar instruments 71 2,057 (42) 1,492 125 1,601 (59) 1,924
Cross currency swaps 583 2,055 (25) 551 890 2,749 (34) 249
Cash flow hedges
Interest rate swaps and similar instruments 2 99 (110) 400 5 60 (126) 480
Cross currency swaps 139 287 (115) 1,605 237 642 (32) 531
Index-linked swaps 90 920 – – 80 833 – –
Forward foreign currency contracts 10 739 (62) 2,123 43 1,138 (19) 697
Cash flow hedges and net investment hedges
Cross currency swaps 10 308 – – – – (10) 325
Derivatives not in a formal hedge relationship
Interest rate swaps and similar instruments 13 2,079 – 595 – – – –
Cross currency swaps 8 128 – – 2 49 (3) 89
Index-linked swaps 614 3,619 (515) 3,589 627 3,604 (539) 3,589
Forward foreign currency contracts 36 1,035 – 181 14 397 (58) 1,121
Total 1,576 13,326 (869) 10,536 2,023 11,073 (880) 9,005
The carrying value and fair value of financial assets and liabilities are as follows:
2014 2013
Carryingvalue
£m
Fairvalue
£m
Carryingvalue
£m
Fairvalue
£m
Assets
Cash and cash equivalents 2,506 2,506 2,512 2,512
Loans and advances to customers – Tesco Bank 6,915 6,845 5,559 5,581
Short-term investments 1,016 1,016 522 522
Other investments 1,015 1,015 818 818
Joint venture and associates loan receivables (Note 28) 255 257 459 459
Other receivables 1 1 17 17
Derivative financial assets:
Interest rate swaps and similar instruments 86 86 130 130
Cross currency swaps 740 740 1,129 1,129
Index-linked swaps 704 704 707 707
Forward foreign currency contracts 46 46 57 57
Total financial assets 13,284 13,216 11,910 11,932
Liabilities
Short-term borrowings:
Amortised cost (1,276) (1,281) (535) (535)
Bonds in fair value hedge relationships (628) (660) (225) (221)
Long-term borrowings:
Amortised cost (4,901) (5,702) (4,450) (4,899)
Bonds in fair value hedge relationships (4,287) (4,227) (5,496) (5,114)
Finance leases (Note 34) (121) (121) (128) (128)
Customer deposits – Tesco Bank (6,078) (6,044) (6,000) (5,997)
Deposits by banks – Tesco Bank (780) (780) (15) (15)
Derivative and other financial liabilities:
Interest rate swaps and similar instruments (152) (152) (185) (185)
Cross currency swaps (140) (140) (79) (79)
Index-linked swaps (515) (515) (539) (539)
Forward foreign currency contracts (62) (62) (77) (77)
Total financial liabilities (18,940) (19,684) (17,729) (17,789)
Total (5,656) (6,468) (5,819) (5,857)
100 Tesco PLC Annual Report and Financial Statements 2014
Notes to the Group financial statements continued

Note 21 Financial instruments continued
The fair values of financial instruments and derivatives have been determined by reference to prices available from the markets on which the instruments are traded, where they are available. Where market prices are not available, the fair value has been calculated by discounting expected future cash flows at prevailing interest rates. The above tables exclude other receivables/payables, which have fair values equal to their carrying values.
Financial assets and liabilities by categoryThe accounting classifications of each class of financial assets and liabilities as at 22 February 2014 and 23 February 2013 are as follows:
At 22 February 2014
Available-for-sale
£m
Loans andreceivables/
other financialliabilities
£m
Fair valuethrough
profit or loss£m
Total£m
Cash and cash equivalents – 2,506 – 2,506
Loans and advances to customers – Tesco Bank – 6,915 – 6,915
Short-term investments – 1,016 – 1,016
Other investments 946 69 – 1,015
Joint venture and associates loan receivables (Note 28) – 255 – 255
Other receivables – 1 – 1
Customer deposits – Tesco Bank – (6,078) – (6,078)
Deposits by banks – Tesco Bank – (780) – (780)
Short-term borrowings – (1,904) – (1,904)
Long-term borrowings – (9,188) – (9,188)
Finance leases (Note 34) – (121) – (121)
Derivative financial instruments:
Interest rate swaps and similar instruments – – (66) (66)
Cross currency swaps – – 600 600
Index-linked swaps – – 189 189
Forward foreign currency contracts – – (16) (16)
946 (7,309) 707 (5,656)
At 23 February 2013
Available-for-sale
£m
Loans andreceivables/
other financialliabilities
£m
Fair valuethrough
profit or loss£m
Total£m
Cash and cash equivalents 140 2,372 – 2,512
Loans and advances to customers – Tesco Bank – 5,559 – 5,559
Short-term investments – 522 – 522
Other investments 818 – – 818
Joint venture and associates loan receivables (Note 28) – 459 – 459
Other receivables – 17 – 17
Customer deposits – Tesco Bank – (6,000) – (6,000)
Deposits by banks – Tesco Bank – (15) – (15)
Short-term borrowings – (760) – (760)
Long-term borrowings – (9,946) – (9,946)
Finance leases (Note 34) – (128) – (128)
Derivative financial instruments:
Interest rate swaps and similar instruments – – (55) (55)
Cross currency swaps – – 1,050 1,050
Index-linked swaps – – 168 168
Forward foreign currency contracts – – (20) (20)
958 (7,920) 1,143 (5,819)
Oth
er info
rmatio
nG
overnan
ceFin
ancial statem
ents
Strateg
ic repo
rt
Tesco PLC Annual Report and Financial Statements 2014 101

Note 21 Financial instruments continued
Fair value measurementThe following table presents the Group’s financial assets and liabilities that are measured at fair value at 22 February 2014, by level of fair value hierarchy:
• quoted prices (unadjusted) in active markets for identical assets or liabilities (Level 1);• inputs other than quoted prices included within Level 1 that are observable for the asset or liability, either directly (that is, as prices) or indirectly (that is,
derived from prices) (Level 2); and• inputs for the asset or liability that are not based on observable market data (that is, unobservable inputs) (Level 3).
At 22 February 2014Level 1
£mLevel 2
£mLevel 3
£mTotal
£m
Assets
Available-for-sale financial assets 850 – 96 946
Derivative financial instruments:
Interest rate swaps and similar instruments – 86 – 86
Cross currency swaps – 740 – 740
Index-linked swaps – 704 – 704
Forward foreign currency contracts – 46 – 46
Total assets 850 1,576 96 2,522
Liabilities
Derivative financial instruments:
Interest rate swaps and similar instruments – (152) – (152)
Cross currency swaps – (140) – (140)
Index-linked swaps – (515) – (515)
Forward foreign currency contracts – (62) – (62)
Total liabilities – (869) – (869)
Total 850 707 96 1,653
At 23 February 2013Level 1
£mLevel 2
£mLevel 3
£mTotal
£m
Assets
Available-for-sale financial assets 808 150 – 958
Derivative financial instruments:
Interest rate swaps and similar instruments – 130 – 130
Cross currency swaps – 1,129 – 1,129
Index-linked swaps – 707 – 707
Forward foreign currency contracts – 57 – 57
Total assets 808 2,173 – 2,981
Liabilities
Derivative financial instruments:
Interest rate swaps and similar instruments – (185) – (185)
Cross currency swaps – (79) – (79)
Index-linked swaps – (539) – (539)
Forward foreign currency contracts – (77) – (77)
Total liabilities – (880) – (880)
Total 808 1,293 – 2,101
The following table presents the changes in Level 3 instruments for the year ending 22 February 2014: 2014
£m2013
£m
At beginning of the year – (3)
Gains/(losses) recognised in finance costs in the Group Income Statement – –
Gains/(losses) recognised in the Group Statement of Changes in Equity – –
Purchase of non-controlling interests 96 3
At end of the year 96 –
During the financial year, £nil (2013: £431m) of Level 2 assets were transferred to Level 1 and there were no transfers into or out of Level 3 fair value measurements.
In the second half of the year, the Group acquired a non-controlling interest in Lazada, an online retailer, for £96m.
102 Tesco PLC Annual Report and Financial Statements 2014
Notes to the Group financial statements continued

Note 21 Financial instruments continued
Offsetting of financial assets and liabilitiesThe following tables show those financial assets and liabilities subject to offsetting, enforceable master netting arrangements and similar agreements.
At 22 February 2014
Financial assets offset
Gross amounts of recognised
financial assets/
(liabilities)£m
Gross amounts of
financial assets/
(liabilities) set off in the
Group Balance Sheet
£m
Net amounts presented in
the Group Balance
Sheet£m
Related amounts not set off in the Group Balance Sheet
Net amount£m
Financial instruments
£mCollateral
£m
Cash and cash equivalents 2,882 (376) 2,506 – – 2,506
Derivative financial instruments 1,576 – 1,576 (336) (6) 1,234
Trade and other receivables 2,737 (547) 2,190 – – 2,190
Total 7,195 (923) 6,272 (336) (6) 5,930
Financial liabilities offset
Bank loans and overdrafts (1,206) 376 (830) – – (830)
Repurchases, securities lending and similar agreements* (765) – (765) 765 – –
Derivative financial instruments (869) – (869) 336 16 (517)
Trade payables (11,142) 547 (10,595) – – (10,595)
Total (13,982) 923 (13,059) 1,101 16 (11,942)* Repurchases, securities lending and similar agreements are included within the Deposits by Banks balance of £780m in the Group Balance Sheet.
At 23 February 2013
Financial assets offset
Gross amounts of recognised
financial assets/
(liabilities)£m
Gross amounts of
financial assets/
(liabilities) set off in the
Group Balance Sheet
£m
Net amounts presented in
the Group Balance
Sheet£m
Related amounts not set off in the Group Balance Sheet
Net amount£m
Financial instruments
£mCollateral
£m
Cash and cash equivalents 3,243 (731) 2,512 – – 2,512
Derivative financial instruments 2,023 – 2,023 (308) (2) 1,713
Trade and other receivables 3,018 (493) 2,525 – – 2,525
Total 8,284 (1,224) 7,060 (308) (2) 6,750
Financial liabilities offset
Bank loans and overdrafts (1,461) 731 (730) – – (730)
Repurchases, securities lending and similar agreements** (5) – (5) 5 – –
Derivative financial instruments (880) – (880) 308 – (572)
Trade payables (11,587) 493 (11,094) – – (11,094)
Total (13,933) 1,224 (12,709) 313 – (12,396)** Repurchases, securities lending and similar agreements are included within the Deposits by Banks balance of £15m in the Group Balance Sheet.
For the financial assets and liabilities subject to enforceable master netting arrangements above, each agreement between the Group and the counterparty allows for net settlement of the relevant financial assets and liabilities when both elect to settle on a net basis. In the absence of such an election, financial assets and liabilities will be settled on a gross basis, however each party to the master netting agreement or similar agreements will have the option to settle all such amounts on a net basis in the event of default of the other party.
Oth
er info
rmatio
nG
overnan
ceFin
ancial statem
ents
Strateg
ic repo
rt
Tesco PLC Annual Report and Financial Statements 2014 103

Note 22 Financial risk factors
The main financial risks faced by the Group relate to fluctuations in interest and foreign exchange rates, the risk of default by counterparties to financial transactions and the availability of funds to meet business needs. The management of these risks is set out below.
Risk management is carried out by a central treasury department under policies approved by the Board of Directors. The Board provides written principles for risk management, as described in the Principal risks and uncertainties on pages 20 to 25.
Interest rate riskInterest rate risk arises from long-term borrowings. Debt issued at variable rates as well as cash deposits and short-term investments exposes the Group to cash flow interest rate risk. Debt issued at fixed rates exposes the Group to fair value risk. The Group’s interest rate management policy is explained on page 25.
The Group has Retail Price Index (‘RPI’) debt where the principal is indexed to increases in the RPI. RPI debt is treated as floating rate debt. The Group also has Limited Price lnflation (‘LPI’) debt, where the principal is indexed to RPI, with an annual maximum increase of 5% and a minimum of 0%. LPI debt is treated as fixed rate debt.
For interest rate risk relating to Tesco Bank, refer to the separate section on Tesco Bank financial risk factors on page 107.
During 2014 and 2013, net debt was managed using derivative instruments to hedge interest rate risk as follows:
2014 2013
Fixed£m
Floating£m
Total£m
Fixed£m
Floating£m
Total£m
Cash and cash equivalents – 2,506 2,506 140 2,372 2,512
Loans and advances to customers – Tesco Bank 3,440 3,475 6,915 2,739 2,820 5,559
Short-term investments – 1,016 1,016 – 522 522
Other investments 855 160 1,015 707 111 818
Joint venture and associate loan receivables (Note 28) 163 92 255 – 459 459
Other receivables 1 – 1 – 17 17
Finance leases (Note 34) (90) (31) (121) (104) (24) (128)
Bank and other borrowings (9,788) (1,304) (11,092) (9,569) (1,137) (10,706)
Customer deposits – Tesco Bank (2,707) (3,371) (6,078) (2,399) (3,601) (6,000)
Deposits by banks – Tesco Bank (780) – (780) (15) – (15)
Derivative effect:
Interest rate swaps (4,022) 4,022 – (1,156) 1,156 –
Cross currency swaps 2,418 (2,418) – 2,436 (2,436) –
Index-linked swaps (553) 553 – (537) 537 –
Total (11,063) 4,700 (6,363) (7,758) 796 (6,962)
Credit risk Credit risk arises from cash and cash equivalents, trade and other receivables, customer deposits, financial instruments and deposits with banks and financial institutions. The Group policy on credit risk is described on page 25.
The net counterparty exposure under derivative contracts is £1.2bn (2013: £1.7bn). The Group considers its maximum credit risk to be £13.3bn (2013: £11.9bn) being the Group’s total financial assets.
For credit risk relating to Tesco Bank, refer to the separate section on Tesco Bank financial risk factors on page 107.
Liquidity risk Liquidity risk is managed by short-term and long-term cash flow forecasts. In addition, the Group has committed facility agreements for £2.7bn (2013: £2.8bn), which mature between 2015 and 2018.
The Group has a European Medium Term Note programme of £15.0bn, of which £7.0bn was in issue at 22 February 2014 (2013: £6.2bn), plus a Euro Commercial Paper programme of £2.0bn, none of which was in issue at 22 February 2014 (2013: £0.1bn), and a US Commercial Paper programme of $4.0bn, £nil of which was in issue at 22 February 2014 (2013: £0.1bn).
On 5 November 2013 the Group issued €1.0bn of long-term debt and on 27 January 2014 the Group repaid ¥31.5bn of long-term debt. For liquidity risk relating to Tesco Bank, refer to the separate section on Tesco Bank financial risk factors on page 107.
104 Tesco PLC Annual Report and Financial Statements 2014
Notes to the Group financial statements continued

Note 22 Financial risk factors continued
The following is an analysis of the undiscounted contractual cash flows payable under financial liabilities and derivatives. The potential cash outflow of £18.2bn is considered acceptable as it is offset by financial assets and trade receivables of £14.8bn (2013: £17.4bn offset by financial assets and trade receivables of £14.4bn).
The undiscounted cash flows will differ from both the carrying values and fair value. Floating rate interest is estimated using the prevailing rate at the balance sheet date. Cash flows in foreign currencies are translated using spot rates at the balance sheet date. For index-linked liabilities, inflation is estimated at 3% for the life of the liability.
At 22 February 2014
Duewithin1 year
£m
Duebetween
1 and 2years
£m
Duebetween
2 and 3years
£m
Duebetween
3 and 4years
£m
Duebetween
4 and 5years
£m
Duebeyond5 years
£m
Non-derivative financial liabilities
Bank and other borrowings (1,835) (523) (1,514) (921) (743) (5,372)
Interest payments on borrowings (459) (404) (377) (306) (270) (3,152)
Customer deposits – Tesco Bank (4,725) (1,100) (141) (29) (122) –
Deposits by banks – Tesco Bank (772) (8) – – – –
Finance leases (12) (13) (12) (12) (12) (185)
Trade and other payables (10,441) (82) (19) (2) (2) (49)
Derivative and other financial liabilities
Net settled derivative contracts – receipts 76 29 68 22 44 538
Net settled derivative contracts – payments (91) (75) (59) (52) (70) (345)
Gross settled derivative contracts – receipts 4,768 713 1,323 1,758 39 1,493
Gross settled derivative contracts – payments (4,727) (648) (1,277) (1,499) (24) (1,132)
Total (18,218) (2,111) (2,008) (1,041) (1,160) (8,204)
At 23 February 2013
Duewithin1 year
£m
Duebetween
1 and 2years
£m
Duebetween
2 and 3years
£m
Duebetween
3 and 4years
£m
Duebetween
4 and 5years
£m
Duebeyond5 years
£m
Non-derivative financial liabilities
Bank and other borrowings (711) (1,081) (553) (1,550) (575) (5,805)
Interest payments on borrowings (451) (441) (402) (375) (301) (3,511)
Customer deposits – Tesco Bank (5,323) (577) (100) – – –
Deposits by banks – Tesco Bank (9) (6) – – – –
Finance leases (13) (13) (13) (13) (13) (212)
Trade and other payables (10,865) (93) (31) (19) (12) (74)
Derivative and other financial liabilities
Net settled derivative contracts – receipts 63 62 27 71 20 608
Net settled derivative contracts – payments (106) (78) (71) (50) (47) (362)
Gross settled derivative contracts – receipts 3,610 1,588 157 1,057 1,369 1,008
Gross settled derivative contracts – payments (3,564) (1,485) (57) (916) (1,000) (531)
Total (17,369) (2,124) (1,043) (1,795) (559) (8,879)
Foreign exchange riskThe Group is exposed to foreign exchange risk principally via:
• Transactional exposure that arises from the cost of future purchases of goods for resale, where those purchases are denominated in a currency other than the functional currency of the purchasing company. Transactional exposures that could significantly impact the Group Income Statement are hedged. These exposures are hedged via forward foreign currency contracts which are designated as cash flow hedges. The notional and fair value of these contracts is shown in Note 21.
• Net investment exposure that arises from changes in the value of net investments denominated in currencies other than Pounds Sterling. The Group hedges a part of its investments in its international subsidiaries via foreign currency transactions and borrowings in matching currencies which are formally designated as net investment hedges.
• Loans to non-UK subsidiaries that are hedged via foreign currency transactions and borrowings in matching currencies. These are not formally designated as hedges as gains and losses on hedges and hedged loans will naturally offset.
Oth
er info
rmatio
nG
overnan
ceFin
ancial statem
ents
Strateg
ic repo
rt
Tesco PLC Annual Report and Financial Statements 2014 105

Note 22 Financial risk factors continued
The impact on Group financial statements from foreign currency volatility is shown in the sensitivity analysis below:
Sensitivity analysisThe analysis excludes the impact of movements in market variables on the carrying value of pension and other post-employment obligations and on the retranslation of overseas net assets as required by IAS 21 ‘The Effects of Changes in Foreign Exchange Rates’. However, it does include the foreign exchange sensitivity resulting from all local entity non-functional currency financial instruments.
The sensitivity analysis has been prepared on the basis that the amount of net debt, the ratio of fixed to floating interest rates of the debt and derivatives portfolio, and the proportion of financial instruments in foreign currencies are all constant and on the basis of the hedge designations in place at 22 February 2014. It should be noted that the sensitivity analysis reflects the impact on income and equity due to all financial instruments held at the balance sheet date. It does not reflect any change in sales or costs that may result from changing interest or exchange rates.
The following assumptions were made in calculating the sensitivity analysis:
• the sensitivity of interest payable to movements in interest rates is calculated on net floating rate exposures on debt, deposits and derivative instruments with no sensitivity assumed for RPI-linked debt which has been swapped to fixed rates;
• changes in the carrying value of derivative financial instruments designated as fair value hedges from movements in interest rates or foreign exchange rates have an immaterial effect on the Group Income Statement and equity due to compensating adjustments in the carrying value of debt;
• changes in the carrying value of derivative financial instruments designated as net investment hedges from movements in foreign exchange rates are recorded directly in the Group Statement of Comprehensive Income;
• changes in the carrying value of derivative financial instruments not designated as hedging instruments only affect the Group Income Statement;• all other changes in the carrying value of derivative financial instruments designated as hedging instruments are fully effective with no impact
on the Group Income Statement; and • the floating leg of any swap or any floating rate debt is treated as not having any interest rate already set, therefore a change in interest rates affects a full
12-month period for the interest payable portion of the sensitivity calculations.
Using the above assumptions, the following table shows the illustrative effect on the Group Income Statement and equity that would result, at the balance sheet date, from changes in UK interest rates and currency exchange rates that are reasonably possible for major currencies where there have recently been significant movements:
2014 2013
Incomegain/(loss)
£m
Equitygain/(loss)
£m
Incomegain/(loss)
£m
Equitygain/(loss)
£m
1% increase in GBP interest rates (2013: 1%) 5 – 8 –
15% appreciation of the Czech Koruna (2013: 5%) – 49 (1) 21
5% appreciation of the Euro (2013: 5%) (1) (24) (12) (43)
10% appreciation of the South Korean Won (2013: 5%) – 110 – 56
10% appreciation of the US Dollar (2013: 5%) (4) 161 (13) 52
5% appreciation of the Polish Zloty (2013: Nil) – 19 – –
10% appreciation of the Hong Kong Dollar (2013: Nil) – 29 – –
35% appreciation of the Turkish Lira (2013: Nil) – 79 – –
A decrease in interest rates and a depreciation of foreign currencies would have the opposite effect to the impact in the table above.
The impact on the Group Statement of Comprehensive Income from changing exchange rates results from the revaluation of financial liabilities used as net investment hedges. The impact on the Group Statement of Comprehensive Income will largely be offset by the revaluation in equity of the hedged assets.
Capital riskThe Group’s objectives when managing capital (defined as net debt plus equity) are to safeguard the Group’s ability to continue as a going concern in order to provide returns to shareholders and benefits for other stakeholders, while maintaining a strong credit rating and headroom whilst optimising return to shareholders through an appropriate balance of debt and equity funding. The Group manages its capital structure and makes adjustments to it, in light of changes to economic conditions and the strategic objectives of the Group.
To maintain or adjust the capital structure, the Group may adjust the dividend payment to shareholders, buy back shares and cancel them, or issue new shares.
The Group finances its operations by a combination of retained profits, disposals of property assets including sale and leaseback transactions, debt capital market issues, commercial paper, bank borrowings and leases to ensure continuity of funding. The policy for debt is to ensure a smooth debt maturity profile with the objective of ensuring continuity of funding. This policy continued during the financial year with bonds redeemed of £208m (2013: £1,285m) and £844m of new bonds issued (2013: £nil). The Group borrows centrally and locally, using a variety of capital market instruments and borrowing facilities to meet the Group’s business requirements of each local business.
Refer to Note 30 for the value of the Group’s net debt (£6.6bn; 2013: £6.6bn), and the Group Statement of Changes in Equity for the value of the Group’s equity (£14.7bn; 2013: £16.7bn).
106 Tesco PLC Annual Report and Financial Statements 2014
Notes to the Group financial statements continued
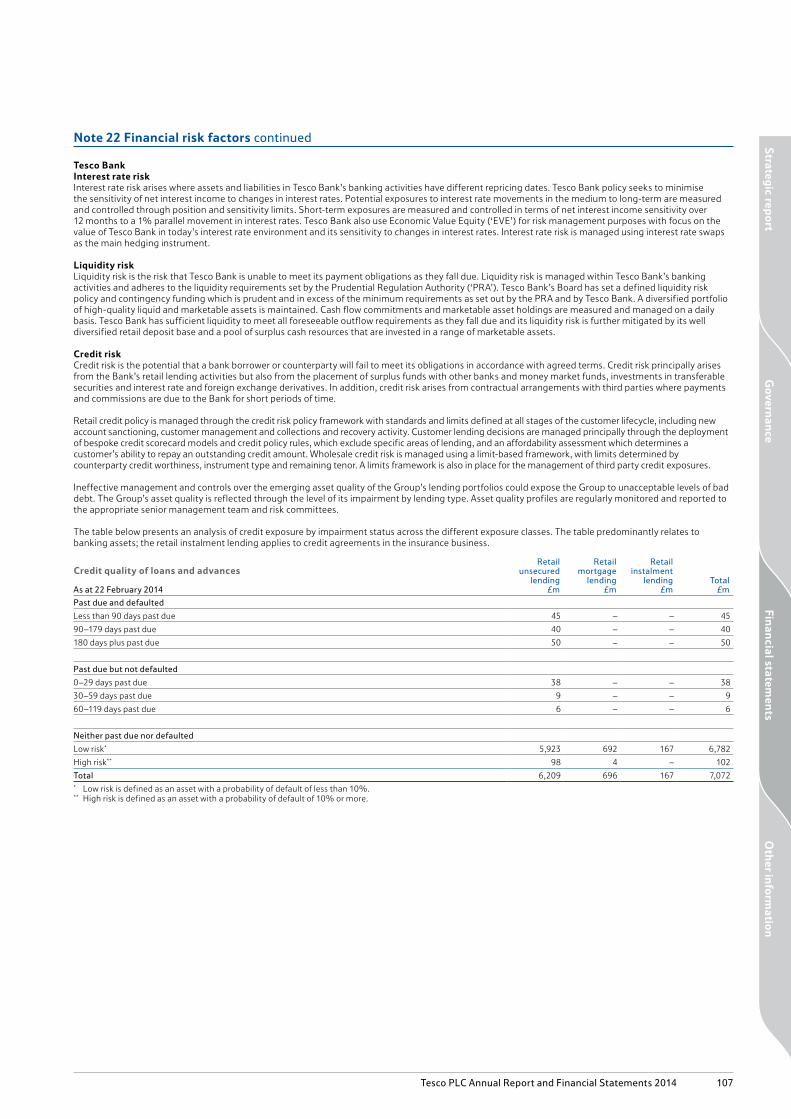
Note 22 Financial risk factors continued
Tesco BankInterest rate riskInterest rate risk arises where assets and liabilities in Tesco Bank’s banking activities have different repricing dates. Tesco Bank policy seeks to minimise the sensitivity of net interest income to changes in interest rates. Potential exposures to interest rate movements in the medium to long-term are measured and controlled through position and sensitivity limits. Short-term exposures are measured and controlled in terms of net interest income sensitivity over 12 months to a 1% parallel movement in interest rates. Tesco Bank also use Economic Value Equity (‘EVE’) for risk management purposes with focus on the value of Tesco Bank in today’s interest rate environment and its sensitivity to changes in interest rates. Interest rate risk is managed using interest rate swaps as the main hedging instrument.
Liquidity risk Liquidity risk is the risk that Tesco Bank is unable to meet its payment obligations as they fall due. Liquidity risk is managed within Tesco Bank’s banking activities and adheres to the liquidity requirements set by the Prudential Regulation Authority (‘PRA’). Tesco Bank’s Board has set a defined liquidity risk policy and contingency funding which is prudent and in excess of the minimum requirements as set out by the PRA and by Tesco Bank. A diversified portfolio of high-quality liquid and marketable assets is maintained. Cash flow commitments and marketable asset holdings are measured and managed on a daily basis. Tesco Bank has sufficient liquidity to meet all foreseeable outflow requirements as they fall due and its liquidity risk is further mitigated by its well diversified retail deposit base and a pool of surplus cash resources that are invested in a range of marketable assets.
Credit riskCredit risk is the potential that a bank borrower or counterparty will fail to meet its obligations in accordance with agreed terms. Credit risk principally arises from the Bank’s retail lending activities but also from the placement of surplus funds with other banks and money market funds, investments in transferable securities and interest rate and foreign exchange derivatives. In addition, credit risk arises from contractual arrangements with third parties where payments and commissions are due to the Bank for short periods of time.
Retail credit policy is managed through the credit risk policy framework with standards and limits defined at all stages of the customer lifecycle, including new account sanctioning, customer management and collections and recovery activity. Customer lending decisions are managed principally through the deployment of bespoke credit scorecard models and credit policy rules, which exclude specific areas of lending, and an affordability assessment which determines a customer’s ability to repay an outstanding credit amount. Wholesale credit risk is managed using a limit-based framework, with limits determined by counterparty credit worthiness, instrument type and remaining tenor. A limits framework is also in place for the management of third party credit exposures.
Ineffective management and controls over the emerging asset quality of the Group’s lending portfolios could expose the Group to unacceptable levels of bad debt. The Group’s asset quality is reflected through the level of its impairment by lending type. Asset quality profiles are regularly monitored and reported to the appropriate senior management team and risk committees.
The table below presents an analysis of credit exposure by impairment status across the different exposure classes. The table predominantly relates to banking assets; the retail instalment lending applies to credit agreements in the insurance business.
Credit quality of loans and advances
As at 22 February 2014
Retailunsecured
lending£m
Retail mortgage
lending£m
Retailinstalment
lending£m
Total£m
Past due and defaulted
Less than 90 days past due 45 – – 45
90–179 days past due 40 – – 40
180 days plus past due 50 – – 50
Past due but not defaulted
0–29 days past due 38 – – 38
30–59 days past due 9 – – 9
60–119 days past due 6 – – 6
Neither past due nor defaulted
Low risk* 5,923 692 167 6,782
High risk** 98 4 – 102
Total 6,209 696 167 7,072* Low risk is defined as an asset with a probability of default of less than 10%.** High risk is defined as an asset with a probability of default of 10% or more.
Oth
er info
rmatio
nG
overnan
ceFin
ancial statem
ents
Strateg
ic repo
rt
Tesco PLC Annual Report and Financial Statements 2014 107

Note 22 Financial risk factors continued
Credit quality of loans and advances
As at 23 February 2013
Retailunsecured
lending£m
Retail mortgage
lending£m
Retailinstalment
lending£m
Total£m
Past due and defaulted
Less than 90 days past due 30 – – 30
90–179 days past due 42 – – 42
180 days plus past due 76 – – 76
Past due but not defaulted
0–29 days past due 41 – 1 42
30–59 days past due 11 – – 11
60–119 days past due 9 – – 9
Neither past due nor defaulted
Low risk* 4,935 258 202 5,395
High risk** 126 – – 126
Total 5,270 258 203 5,731* Low risk is defined as an asset with a probability of default of less than 10%.** High risk is defined as an asset with a probability of default of 10% or more.
The credit risk exposure from off balance sheet items, mainly undrawn credit card facilities and mortgage offers, was £9.7bn (2013: £8.0bn).
Insurance riskTesco Bank is indirectly exposed to insurance risks through its ownership of 49.9% of Tesco Underwriting Limited (‘TU’), an authorised insurance company. Since late 2010 the majority of new business policies for home and motor insurance products sold by Tesco Bank have been underwritten by TU. The key insurance risks within TU relate to underwriting risk and specifically the potential for a major weather event to generate significant claims on home insurance or on motor insurance the cost of settling bodily injury claims. Exposure to this risk is actively managed within TU with close monitoring of performance metrics and the use of reinsurance to limit TU’s exposure above predetermined limits.
Note 23 Customer deposits and deposits by banks
2014£m
2013£m
Customer deposits 6,078 6,000
Deposits by banks 780 15
6,858 6,015
Included above is £1,366m (2013: £677m) non-current customer deposits and £8m (2013: £6m) non-current deposits by banks.
Deposits by banks include liabilities of £765m (2013: £5m) secured on investment securities balances which have been sold under sale and repurchase agreements.
108 Tesco PLC Annual Report and Financial Statements 2014
Notes to the Group financial statements continued

Note 24 Provisions
Propertyprovisions
£m
Otherprovisions
£mTotal
£m
At 25 February 2012 121 78 199
Foreign currency translation 6 – 6
Amount released in the year (12) – (12)
Amount provided in the year 254 116 370
Amount utilised in the year (11) (92) (103)
At 23 February 2013 358 102 460
Foreign currency translation (12) – (12)
Amount released in the year (35) – (35)
Amount provided in the year 53 63 116
Amount utilised in the year (38) (60) (98)
Transfer to disposal group classified as held for sale 2 – 2
At 22 February 2014 328 105 433
The balances are analysed as follows:2014
£m2013
£m
Current 250 188
Non-current 183 272
433 460
Property provisions comprise obligations for future rents payable net of rents receivable on onerous leases including on vacant property and unprofitable stores, terminal dilapidations and other onerous contracts relating to property. The majority of these provisions are expected to be utilised over the period to 2020.
The other provisions balances relate mainly to provisions for Tesco Bank customer redress in respect of potential complaints arising from the historic sales of Payment Protection Insurance (‘PPI’), in respect of customer redress relating to the historic sale of certain cardholder protection products (‘CPP’) and in respect of certain classes of loans and credit cards sold by the Group which are regulated under the Consumer Credit Act (‘CCA’). The Group has identified instances where the technical requirement for the provision of certain post-contractual documentation to customers with CCA-regulated products has not been fully met. While there is no evidence that these issues have caused particular detriment to customers, it is the Group’s intention to provide redress to impacted customers in order to reflect the operation of the CCA in respect of the customers’ liability. These provisions may be used over several years although the timing of utilisation is uncertain. The balance is classified as current at the year end.
Oth
er info
rmatio
nG
overnan
ceFin
ancial statem
ents
Strateg
ic repo
rt
Tesco PLC Annual Report and Financial Statements 2014 109

Note 25 Share-based payments
For continuing operations, the Group Income Statement charge for the year recognised in respect of share-based payments is £82m (2013: £89m), which is made up of share option schemes and share bonus payments. Of this amount, £63m (2013: £65m) will be settled in equity and £19m (2013: £24m) in cash.
Share option schemesThe Company had ten share option schemes in operation during the financial year, all of which are equity-settled schemes:
i) The Savings-related Share Option Scheme (1981) permits the grant to colleagues of options in respect of ordinary shares linked to a building society/bank save-as-you-earn contract for a term of three or five years with contributions from colleagues of an amount between £5 and £250 per four-weekly period. Options are capable of being exercised at the end of the three or five-year period at a subscription price of not less than 80% of the average of the middle-market quotations of an ordinary share over the three dealing days immediately preceding the offer date.
ii) The Irish Savings-related Share Option Scheme (2000) permits the grant to Irish colleagues of options in respect of ordinary shares linked to a building society/bank save-as-you-earn contract for a term of three or five years with contributions from colleagues of an amount between €12 and €500 per four-weekly period. Options are capable of being exercised at the end of the three or five-year period at a subscription price of not less than 80% of the average of the middle-market quotations of an ordinary share over the three dealing days immediately preceding the offer date.
iii) The Approved Executive Share Option Scheme (1994) was adopted on 17 October 1994. The exercise of options granted under this scheme will normally be conditional upon the achievement of a specified performance target related to the growth in earnings per share over a three-year period. No further options will be granted under this scheme and it has been replaced by the Discretionary Share Option Plan (2004). There were no discounted options granted under this scheme.
iv) The Unapproved Executive Share Option Scheme (1996) was adopted on 7 June 1996. The exercise of options granted under this scheme will normally be conditional upon the achievement of a specified performance target related to the growth in earnings per share over a three-year period. No further options will be granted under this scheme and it has been replaced by the Discretionary Share Option Plan (2004). There were no discounted options granted under this scheme.
v) The International Executive Share Option Scheme (1994) was adopted on 20 May 1994. This scheme permits the grant to selected non-UK executives of options to acquire ordinary shares on substantially the same basis as their UK counterparts. The exercise of options granted under this scheme will normally be conditional upon the achievement of a specified performance target related to the growth in earnings per share over a three-year period. No further options will be granted under this scheme and it has been replaced by the Discretionary Share Option Plan (2004). There were no discounted options granted under this scheme.
vi) The Executive Incentive Plan (2004) was adopted on 5 July 2004. This scheme permits the grant of options in respect of ordinary shares to selected senior executives. Options are normally exercisable between three and ten years from the date of grant for nil consideration. Full details of this plan can be found in the Directors’ remuneration report.
vii) The Performance Share Plan (2004) was adopted on 5 July 2004 and amended on 29 June 2007. This scheme permits the grant of options in respect of ordinary shares to selected executives. Options granted before 29 June 2007 are normally exercisable between four and ten years from the date of grant for nil consideration. Options granted after 29 June 2007 are normally exercisable between three and ten years from the date of grant for nil consideration. The exercise of options will normally be conditional upon the achievement of specified performance targets related to the return on capital employed over a three-year period. No further options will be granted under this scheme and it has been replaced by the Performance Share Plan (2011).
viii) The Performance Share Plan (2011) was adopted on 1 July 2011 and amended on 4 July 2011. This scheme permits the grant of options in respect of ordinary shares to selected executives. Options are normally exercisable between three and ten years from the date of grant for nil consideration. The exercise of options will normally be conditional upon the achievement of specified performance targets related to the return on capital employed and earnings per share over a three-year period.
110 Tesco PLC Annual Report and Financial Statements 2014
Notes to the Group financial statements continued

Note 25 Share-based payments continued
ix) The Discretionary Share Option Plan (2004) was adopted on 5 July 2004. This scheme permits the grant of approved, unapproved and international options in respect of ordinary shares to selected executives. Options are normally exercisable between three and ten years from the date of grant at a price not less than the middle-market quotation or average middle-market quotations of an ordinary share for the dealing day or three dealing days preceding the date of grant. The exercise of options will normally be conditional upon the achievement of a specified performance target related to the annual percentage growth in earnings per share over a three-year period. There were no discounted options granted under this scheme.
x) The Group New Business Incentive Plan (2007) was adopted on 29 June 2007. This scheme permits the grant of options in respect of ordinary shares to selected executives. Options will normally vest in four tranches: four, five, six and seven years after the date of grant and will be exercisable for up to two years from the vesting dates for nil consideration. The exercise of options will normally be conditional upon the achievement of specified performance targets related to the return on capital employed over the seven-year plan.
The following tables reconcile the number of share options outstanding and the weighted average exercise price (‘WAEP’):
For the year ended 22 February 2014
Savings-related Share Option Scheme
Irish Savings-relatedShare Option Scheme
Approved Share Option Scheme
UnapprovedShare Option Scheme
International ExecutiveShare Option Scheme
Nil cost share option schemes
Options WAEP Options WAEP Options WAEP Options WAEP Options WAEP Options WAEP
Outstanding at 23 February 2013 127,212,551 338.85 4,886,834 338.78 12,592,329 399.01 80,439,020 382.62 53,665,107 387.64 19,778,825 0.00
Granted 29,258,434 322.00 1,294,873 322.00 – – – – – – 7,003,764 0.00
Forfeited (24,352,865) 365.89 (1,081,476) 353.68 (3,785,217) 418.07 (21,694,176) 419.27 (17,704,212) 415.76 (2,458,290) 0.00
Exercised (9,515,992) 314.96 (200,710) 318.29 (654,147) 306.38 (5,940,411) 302.00 (3,374,535) 322.10 (3,225,216) 0.00
Outstanding at 22 February 2014 122,602,128 331.31 4,899,521 331.89 8,152,965 397.59 52,804,433 376.63 32,586,360 379.15 21,099,083 0.00
Exercisable as at 22 February 2014 15,894,484 353.09 837,652 370.38 8,145,517 397.58 52,801,878 376.63 32,546,360 379.12 4,206,723 0.00
Exercise price range (pence)
311.00to
410.00
311.00to
386.00
253.25to
473.75
253.25to
473.75
253.25to
473.75 0.00
Weighted average remaining contractual life (years) 0.44 0.44 3.63 3.78 3.88 4.18
For the year ended 23 February 2013
Savings-related Share Option Scheme
Irish Savings-relatedShare Option Scheme
Approved Share Option Scheme
Unapproved Share Option Scheme
International ExecutiveShare Option Scheme
Nil cost share option schemes
Options WAEP Options WAEP Options WAEP Options WAEP Options WAEP Options WAEP
Outstanding at 25 February 2012 131,921,033 350.28 4,975,203 352.95 13,668,564 395.47 87,418,835 377.80 59,751,420 385.37 17,801,914 0.00
Granted 32,771,389 282.00 1,407,939 282.00 – – – – – – 7,369,204 0.00
Forfeited (25,049,015) 333.25 (1,055,775) 336.01 (604,143) 410.43 (3,130,086) 401.30 (4,379,756) 397.07 (3,064,780) 0.00
Exercised (12,430,856) 321.54 (440,533) 323.97 (472,092) 281.87 (3,849,729) 257.90 (1,706,557) 284.22 (2,327,513) 0.00
Outstanding at 23 February 2013 127,212,551 338.85 4,886,834 338.78 12,592,329 399.01 80,439,020 382.62 53,665,107 387.64 19,778,825 0.00
Exercisable as at 23 February 2013 16,192,212 381.09 709,010 360.40 9,319,436 391.70 61,754,447 371.37 39,218,022 375.74 5,630,056 0.00
Exercise price range (pence)
328.00to
410.00
328.00to
410.00
197.50 to
473.75
197.50 to
473.75
197.50to
473.75 0.00
Weighted average remaining contractual life (years) 0.43 0.43 4.59 4.71 4.90 5.24
Share options were exercised on a regular basis throughout the financial year. The average share price during the financial year ended 22 February 2014 was 349.48p (2013: 328.39p).
Oth
er info
rmatio
nG
overnan
ceFin
ancial statem
ents
Strateg
ic repo
rt
Tesco PLC Annual Report and Financial Statements 2014 111

The fair value of share options is estimated at the date of grant using the Black-Scholes option pricing model. The following table gives the assumptions applied to the options granted in the respective periods shown. No assumption has been made to incorporate the effects of expected early exercise.
2014 2013
Savings-related
share option schemes
Executive share option
schemes
Nil cost option
schemes
Savings-related
share option schemes
Executive share option
schemes
Nil cost option
schemes
Expected dividend yield (%) 4.6% – 0.0% 5.0% – 0.0%
Expected volatility (%) 21 – 23% – 27% 21 – 28% – 27%
Risk-free interest rate (%) 1.2 – 1.8% – 1.7% 0.7 – 1.0% – 1.3%
Expected life of option (years) 3 or 5 – 6 3 or 5 – 6
Weighted average fair value of options granted (pence) 47.64 – 364.85 43.45 – 317.72
Probability of forfeiture (%) 14 – 16% – 0% 14 – 16% – 0%
Share price (pence) 362.00 – 364.85 312.00 – 317.72
Weighted average exercise price (pence) 322.00 – 0.00 282.00 – 0.00
Volatility is a measure of the amount by which a price is expected to fluctuate during a period. The measure of volatility used in the Group’s option pricing models is the annualised standard deviation of the continuously compounded rates of return on the share over a period of time. In estimating the future volatility of the Company’s share price, the Board considers the historical volatility of the share price over the most recent period that is generally commensurate with the expected term of the option, taking into account the remaining contractual life of the option.
Share bonus schemesEligible UK colleagues are able to participate in Shares In Success, an all-employee profit-sharing scheme. Each year, shares may be awarded to colleagues as a percentage of earnings, up to a statutory maximum of £3,000 per annum. Eligible Republic of Ireland colleagues are able to participate in a Share Bonus Scheme, an all-employee profit-sharing scheme. Each year, colleagues receive an award of either cash or shares based on a percentage of their earnings.
Selected executives participate in the Group Bonus Plan, a performance-related bonus scheme. The amount paid to colleagues is based on a percentage of salary and is paid partly in cash and partly in shares. Bonuses are awarded to selected executives who have completed a required service period and depend on the achievement of corporate targets.
Selected senior executives participate in the Management Performance Share Plan. Awards made under this plan will normally vest three years after the date of the award for nil consideration. Vesting will normally be conditional on the achievement of specified performance targets related to the return on capital employed over a three-year performance period. No further awards will be granted under this scheme and it has been replaced by the Performance Share Plan (2011).
Selected executives participate in the Performance Share Plan (2011). Awards made under this plan will normally vest three years after the date of the award for nil consideration. Vesting will normally be conditional on the achievement of specified performance targets related to the return on capital employed and earnings per share over a three-year performance period.
Selected executives also participate in the US Long-Term Incentive Plan (2007), which was adopted on 29 June 2007. The awards made under this plan will normally vest in four tranches: four, five, six and seven years after the date of award, for nil consideration.
The Executive Directors participate in short-term and long-term bonus schemes designed to align their interests with those of shareholders. Full details of these schemes can be found in the Directors’ remuneration report.
The fair value of shares awarded under these schemes is their market value on the date of award. Expected dividends are not incorporated into the fair value except for awards under the US Long-Term Incentive Plan.
The number and weighted average fair value (‘WAFV’) of share bonuses awarded during the financial year were:2014 2013
Number of shares
WAFV pence
Number of shares
WAFV pence
Shares In Success 14,776,516 383.55 – –
Irish Share Bonus Scheme 96,668 384.55 110,234 301.08
Executive Incentive Scheme 598,842 375.18 4,591,717 301.13
Performance Share Plan 30,506,080 361.13 27,025,617 317.34
US Long-Term Incentive Plan – – 178,914 314.91
Note 26 Post-employment benefits
PensionsThe Group operates a variety of post-employment benefit arrangements, covering both funded and unfunded defined benefit schemes and funded defined contribution schemes. The most significant of these are the funded defined benefit pension schemes for the Group’s employees in the UK, the Republic of Ireland, Thailand and South Korea. Of these schemes, the UK represents 95% of the defined benefit obligation (2013: 95%).
Defined contribution plansThe contributions payable for defined contribution schemes of £32m (2013: £19m) have been recognised in the Group Income Statement.
Note 25 Share-based payments continued
112 Tesco PLC Annual Report and Financial Statements 2014
Notes to the Group financial statements continued

Defined benefit plansUnited KingdomThe principal plan within the Group is the Tesco PLC Pension Scheme (the ‘Scheme’), which is a funded defined benefit pension scheme in the UK, the assets of which are held as a segregated fund and administered by the Trustee.
The Scheme is established under trust law and has a corporate trustee that is required to run the Scheme in accordance with the Scheme’s Trust Deed and Rules and to comply with the Pension Scheme Act 1993, Pensions Act 1995, Pensions Act 2004 and all the relevant legislation. Responsibility for governance of the Scheme lies with the Trustee. The Trustee is a company whose directors comprise of:
i) representatives of the Group; andii) the Scheme participants,in accordance with its articles of association and UK pension law.
All members are eligible to join the Career Average section of the Scheme (‘Pension Builder’), where benefits are based on a member’s salary and their length of service. There is a Final Salary section of the Scheme which was closed to new entrants in 2001.
Towers Watson Limited, an independent actuary, carried out the latest triennial actuarial assessment of the scheme as at 31 March 2011, using the projected unit method.
At 31 March 2011, the actuarial deficit was £934m. The market value of the schemes’ assets was £5,587m and these assets represented 86% of the benefits that had accrued to members, after allowing for expected increases in earnings and pensions in payment.
The scheme has a duration of 22 years.
Scheme Liabilities as at 31 March 2011The table below shows a breakdown of the liabilities held by the Scheme as at 31 March 2011, the date of the last triennial valuation.
%
Active 55
Deferred 19
Pensioner 26
The table below shows a breakdown of the liabilities for active members held by the Scheme as at 31 March 2011%
Pension Builder 49
Final Salary 51
OverseasThe most significant overseas schemes are the funded defined benefit schemes which operate in the Republic of Ireland, Thailand and South Korea. An independent actuary, using the projected unit method, carried out the latest actuarial assessment of the Republic of Ireland scheme as at 1 April 2010, Thailand as at 23 February 2013 and South Korea as at 22 February 2014.
The valuations used for IAS 19 have been based on the most recent actuarial valuations and updated by Towers Watson Limited to take account of the requirements of IAS 19 in order to assess the liabilities of the schemes as at 22 February 2014. The schemes’ assets are stated at their market values as at 22 February 2014. Towers Watson Limited have updated the most recent Republic of Ireland, Thailand and South Korea valuations. The liabilities relating to retirement healthcare benefits have also been determined in accordance with IAS 19.
Principal assumptions The major assumptions, on a weighted average basis, used by the actuaries were as follows:
2014 %
2013 %
Discount rate 4.7 5.1
Price inflation 3.3 3.3
Rate of increase in deferred pensions* 2.3 2.3
Rate of increase in salaries 3.4 3.4
Rate of increase in pensions in payment*
Benefits accrued before 1 June 2012 3.1 3.1
Benefits accrued after 1 June 2012 2.3 2.3
Rate of increase in career average benefits
Benefits accrued before 1 June 2012 3.3 3.3
Benefits accrued after 1 June 2012 2.3 2.3
* In excess of any Guaranteed Minimum Pension (‘GMP’) element.
UK mortality assumptions The Group conducts analysis of mortality trends under the Tesco PLC Pension Scheme in the UK as part of the triennial actuarial valuation of the Scheme. At the latest triennial actuarial valuation as at 31 March 2011 the following assumptions were adopted for funding purposes:
Base tables: 90% of the SAPS normal male pensioners for male staff and 80% of the SAPS all male pensioners light for male senior managers. 105% of the SAPS normal female pensioners for female staff and 90% for female senior managers.
These assumptions were used for the calculation of the pension liability as at 22 February 2014 for the main UK scheme.
Note 26 Post-employment benefits continued
Oth
er info
rmatio
nG
overnan
ceFin
ancial statem
ents
Strateg
ic repo
rt
Tesco PLC Annual Report and Financial Statements 2014 113

The mortality assumptions used are based on tables that have been projected to 2009 with long cohort improvements. In addition, the allowance for future mortality improvements from 2009 is in line with medium cohort projections with a minimum annual improvement of 1% per annum.
The following table illustrates the expectation of life of an average member retiring at age 65 at the reporting date and a member reaching age 65 at reporting date +25 years.
2014 Years
2013 Years
Retiring at reporting date at age 65: Male 22.9 22.8
Female 24.4 24.3
Retiring at reporting date +25 years at age 65: Male 25.2 25.2
Female 26.6 26.5
Risks The Group bears a numbers of risks in relation to the Scheme, which are described below:
Investment risk – The Scheme’s IAS 19 liabilities are calculated using a discount rate set with reference to corporate bond yields. If the return on the Scheme’s assets underperform this rate, the IAS 19 deficit will increase. The Trustee and the Group regularly monitor the funding position and operate a diversified investment strategy.
Inflation risk – The Scheme’s benefit obligations are linked to inflation therefore higher inflation will lead to higher liabilities. This will be partially offset by an increase in any Scheme assets that are linked to, or correlate with, inflation. Changes to future benefits were introduced in June 2012 to reduce the Scheme’s exposure to inflation risk by changing the basis for calculating the rate of increase in pensions to CPI (previously RPI).
Changes in bond yields – A decrease in corporate bond yields will increase the Scheme’s liabilities. However, this may be partially offset by an increase in the capital value of the Scheme’s assets that have similar characteristics.
Life expectancy risk – The Scheme’s obligations are to provide benefits for the life of the member and so increases in life expectancy will lead to higher liabilities. To reduce this risk, changes to future benefits were introduced in June 2012 to increase the age at which members can take their full pension by two years. Furthermore the Group has the ability to change this in the future if there are further unexpected changes in life expectancy.
An Audit & Risk Pensions Committee was established to further strengthen our Trustee Governance and provide greater oversight and stronger internal control over our risks. Further mitigation of the risks is provided by external advisors and the Trustee who consider the funding position, fund performance, and impacts of any regulatory changes.
A different approach is used to calculate the triennial actuarial liabilities and the IAS 19 liabilities. The key difference is that IAS 19 requires the discount rate to be set using corporate bonds whilst the actuarial liabilities discount rate is based on expected returns of Scheme assets.
Sensitivity analysis of significant actuarial assumptions2014
£m2013
£m
Change in UK defined benefit obligation from a 0.1% increase in discount rate 240 210
Increase in UK defined benefit obligation from a 1% increase in pensions in payment 1,210 1,060
Increase in UK defined benefit obligation from a 1% increase in salary growth 320 280
Increase in UK defined benefit obligation from each additional year of longevity assumed 350 310
The method and assumptions used to determine sensitivity and their limitation is the effect of varying the assumption whilst holding all other assumptions constant.
Plan AssetsThe table below shows a breakdown of the combined investments held by the Group’s schemes
2014£m
2013£m
Equities
UK 476 302
Europe 891 655
Rest of the World 3,029 3,048
4,396 4,005
Bonds
Government 280 332
Corporates – Investment grade 744 732
Corporates – Non-investment grade 170 469
1,194 1,533
Property
UK 519 513
Rest of the World 247 229
766 742
Alternative Assets
Hedge Funds 586 545
Private Equity 472 362
Other 75 –
1,133 907
Cash 635 19
Total Market Value of Assets 8,124 7,206
Note 26 Post-employment benefits continued
114 Tesco PLC Annual Report and Financial Statements 2014
Notes to the Group financial statements continued
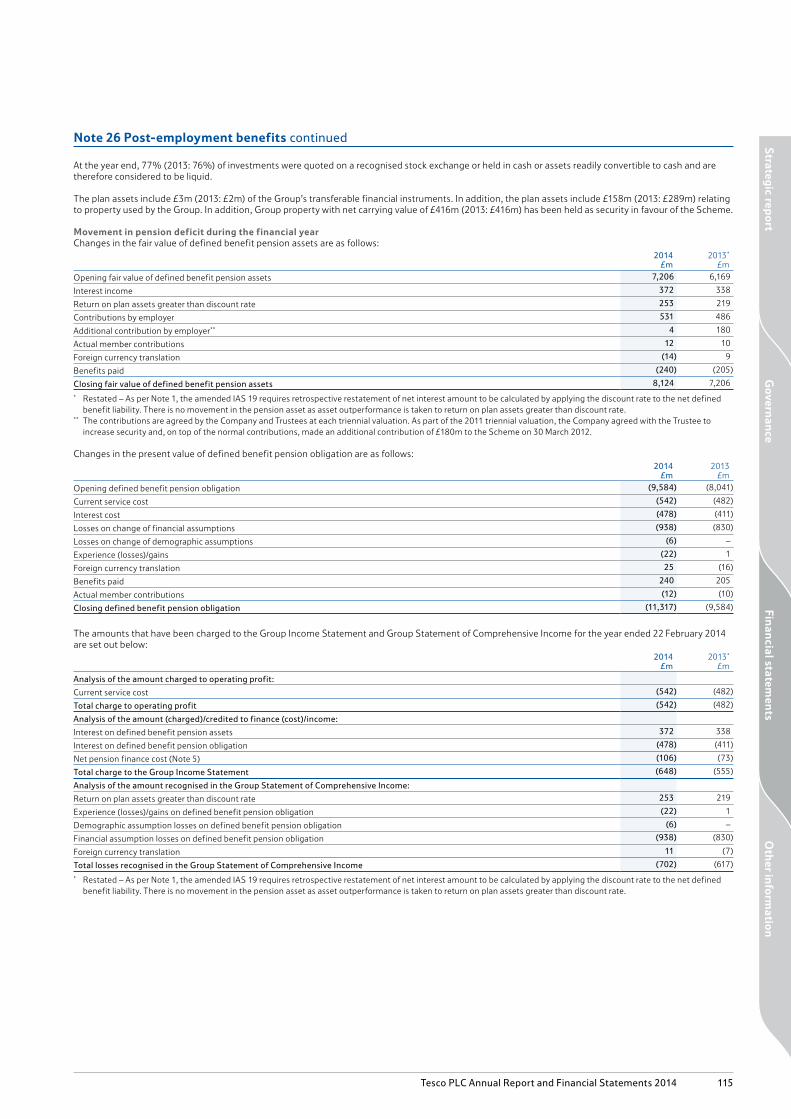
At the year end, 77% (2013: 76%) of investments were quoted on a recognised stock exchange or held in cash or assets readily convertible to cash and are therefore considered to be liquid. The plan assets include £3m (2013: £2m) of the Group’s transferable financial instruments. In addition, the plan assets include £158m (2013: £289m) relating to property used by the Group. In addition, Group property with net carrying value of £416m (2013: £416m) has been held as security in favour of the Scheme.
Movement in pension deficit during the financial year Changes in the fair value of defined benefit pension assets are as follows:
2014£m
2013*
£m
Opening fair value of defined benefit pension assets 7,206 6,169
Interest income 372 338
Return on plan assets greater than discount rate 253 219
Contributions by employer 531 486
Additional contribution by employer** 4 180
Actual member contributions 12 10
Foreign currency translation (14) 9
Benefits paid (240) (205)
Closing fair value of defined benefit pension assets 8,124 7,206
* Restated – As per Note 1, the amended IAS 19 requires retrospective restatement of net interest amount to be calculated by applying the discount rate to the net defined benefit liability. There is no movement in the pension asset as asset outperformance is taken to return on plan assets greater than discount rate.
** The contributions are agreed by the Company and Trustees at each triennial valuation. As part of the 2011 triennial valuation, the Company agreed with the Trustee to increase security and, on top of the normal contributions, made an additional contribution of £180m to the Scheme on 30 March 2012.
Changes in the present value of defined benefit pension obligation are as follows:2014
£m2013
£m
Opening defined benefit pension obligation (9,584) (8,041)
Current service cost (542) (482)
Interest cost (478) (411)
Losses on change of financial assumptions (938) (830)
Losses on change of demographic assumptions (6) –
Experience (losses)/gains (22) 1
Foreign currency translation 25 (16)
Benefits paid 240 205
Actual member contributions (12) (10)
Closing defined benefit pension obligation (11,317) (9,584)
The amounts that have been charged to the Group Income Statement and Group Statement of Comprehensive Income for the year ended 22 February 2014 are set out below:
2014£m
2013*
£m
Analysis of the amount charged to operating profit:
Current service cost (542) (482)
Total charge to operating profit (542) (482)
Analysis of the amount (charged)/credited to finance (cost)/income:
Interest on defined benefit pension assets 372 338
Interest on defined benefit pension obligation (478) (411)
Net pension finance cost (Note 5) (106) (73)
Total charge to the Group Income Statement (648) (555)
Analysis of the amount recognised in the Group Statement of Comprehensive Income:
Return on plan assets greater than discount rate 253 219
Experience (losses)/gains on defined benefit pension obligation (22) 1
Demographic assumption losses on defined benefit pension obligation (6) –
Financial assumption losses on defined benefit pension obligation (938) (830)
Foreign currency translation 11 (7)
Total losses recognised in the Group Statement of Comprehensive Income (702) (617)
* Restated – As per Note 1, the amended IAS 19 requires retrospective restatement of net interest amount to be calculated by applying the discount rate to the net defined benefit liability. There is no movement in the pension asset as asset outperformance is taken to return on plan assets greater than discount rate.
Note 26 Post-employment benefits continued
Oth
er info
rmatio
nG
overnan
ceFin
ancial statem
ents
Strateg
ic repo
rt
Tesco PLC Annual Report and Financial Statements 2014 115

Summary of movements in deficit during the financial year2014
£m2013*
£m
Deficit in schemes at beginning of the year (2,378) (1,872)
Current service cost (542) (482)
Net pension finance cost (106) (73)
Contributions by employer 531 486
Additional contribution by employer 4 180
Foreign currency translation 11 (7)
Remeasurements (713) (610)
Deficit in schemes at the end of the year (3,193) (2,378)
Deferred tax asset (Note 6) 634 539
Deficit in schemes at the end of the year net of deferred tax (2,559) (1,839)
* Restated – As per Note 1, the amended IAS 19 requires retrospective restatement of net interest amounts, to be calculated by applying the discount rate to the net defined benefit liability. There is no movement in the pension deficit as asset outperformance is taken to actuarial gains/losses.
History of movements The historical movement in defined benefit pension schemes’ assets and liabilities and history of experience gains and losses are as follows:
2014£m
2013£m
2012£m
2011£m
2010£m
Total market value of assets 8,124 7,206 6,169 5,608 4,696
Present value of liabilities relating to unfunded pension schemes (111) (91) (60) (65) (54)
Present value of liabilities relating to partially funded pension schemes (11,206) (9,493) (7,981) (6,899) (6,482)
Pension deficit (3,193) (2,378) (1,872) (1,356) (1,840)
Remeasurements on defined benefit pension assets 253 94 (168) 278 733
Experience (losses)/gains on defined benefit pension obligation (22) 1 43 (25) (1)
Post-employment benefits other than pensions The Group operates a scheme offering post-retirement healthcare benefits. The cost of providing these benefits has been accounted for on a similar basis to that used for defined benefit pension schemes.
The liability as at 22 February 2014 of £12m (2013: £12m) was determined in accordance with the advice of independent actuaries. During the year, £1m (2013: £1m) has been charged to the Group Income Statement and £1m (2013: £1m) of benefits were paid.
Expected contributions The Company expects to make normal cash contributions of approximately £579m to defined benefit schemes in the financial year ending 28 February 2015.
Note 27 Called up share capital
2014 2013
Ordinary shares of 5p each Ordinary shares of 5p each
Number £m Number £m
Allotted, called up and fully paid:
At beginning of the year 8,054,054,930 403 8,031,812,445 402
Share options exercised 19,662,145 1 18,632,251 1
Share bonus awards issued 22,104,016 1 3,610,234 –
At end of the year 8,095,821,091 405 8,054,054,930 403
During the financial year, 20 million (2013: 19 million) ordinary shares of 5p each were issued in relation to share options for an aggregate consideration of £61m (2013: £57m).
During the financial year, 22 million (2013: 4 million) ordinary shares of 5p each were issued in relation to share bonus awards for an aggregate consideration of £1.1m (2013: £0.2m).
Between 23 February 2014 and 11 April 2014 options over 942,705 ordinary shares were exercised under the terms of the Savings-related Share Option Scheme (1981) and the Irish Savings-related Share Option Scheme (2000). Between 23 February 2014 and 11 April 2014, options over 2,207,051 ordinary shares were exercised under the terms of the Executive Share Option Schemes (1994 and 1996) and the Discretionary Share Option Plan (2004).
As at 22 February 2014, the Directors were authorised to purchase up to a maximum in aggregate of 806.5 million (2013: 804.0 million) ordinary shares.
The holders of ordinary shares are entitled to receive dividends as declared from time to time and are entitled to one vote per share at general meetings of the Company.
Note 26 Post-employment benefits continued
116 Tesco PLC Annual Report and Financial Statements 2014
Notes to the Group financial statements continued

Transactions between the Company and its subsidiaries, which are related parties, have been eliminated on consolidation and are not disclosed in this note. Transactions between the Group and its joint ventures and associates are disclosed below:
Trading transactionsSales to
related partiesPurchases from
related partiesAmounts owed
by related partiesAmounts owed
to related parties
2014
£m2013
£m2014
£m2013
£m2014
£m2013
£m2014
£m2013
£m
Joint ventures 366 303 533 516 19 13 6 21
Associates 7 2 18 952 – – 17 12
Sales to related parties consists of services/management fees and loan interest.
Purchases from related parties include £412m (2013: £387m) of rentals payable to the Group’s joint ventures (including those joint ventures formed as part of the sale and leaseback programme) and £nil (2013: £952m) of fuel purchased from Greenergy International Limited. In addition, duty on the fuel purchases paid by the Group to Greenergy International Limited was £nil (2013: £1,056m).
Non-trading transactionsSale and
leaseback of assetsLoans to
related partiesLoans from
related partiesInjection of
equity funding
2014
£m2013
£m2014
£m2013
£m2014
£m2013
£m2014
£m2013
£m
Joint ventures – 493 218 459 16 16 3 24
Associates 46 503 37 21 – – 7 132
Transactions between the Group and the Group’s pension plans are disclosed in Note 26.
A number of the Group’s subsidiaries are members of one or more partnerships to whom the provisions of the Partnerships (Accounts) Regulations 2008 (‘Regulations’) apply. The accounts for those partnerships have been consolidated into these accounts pursuant to Regulation 7 of the Regulations.
During the year, the Group completed one sale and leaseback transaction involving property assets in Thailand. On 24 January 2014, one trading mall was sold to the Tesco Lotus Growth Fund, an associated entity of the Group, for a consideration of £46m.
Transactions with key management personnelMembers of the Board of Directors and Executive Committee of Tesco PLC are deemed to be key management personnel.
Key management personnel compensation and their transactions with Tesco Bank are disclosed below:2014
£m2013
£m
Salaries and short-term benefits 16 13
Pensions 3 3
Share-based payments 2 2
Loss of office costs 1 3
22 21
Of the total remuneration to key management personnel, £16m (2013: £7m) relates to Executive Committee members who are not on the PLC Board.
Transactions of key management personnel with Tesco Bank during the financial year were as follows:
Credit card and personal loan balances
Saving deposit accounts
Number of key management
personnel £m
Number of key management
personnel £m
At 22 February 2014 12 – 4 –
At 23 February 2013 12 – 5 –
Note 28 Related party transactions
Oth
er info
rmatio
nG
overnan
ceFin
ancial statem
ents
Strateg
ic repo
rt
Tesco PLC Annual Report and Financial Statements 2014 117

Note 29 Reconciliation of profit before tax to cash generated from operations
2014£m
2013 (restated*)
£m
Profit before tax 2,259 2,057
Net finance costs (Note 5) 432 397
Share of post-tax profits of joint ventures and associates (Note 13) (60) (72)
Operating profit of continuing operations 2,631 2,382
Operating loss of discontinued operations (925) (1,451)
Depreciation and amortisation 1,567 1,590
Profits/losses arising on one-off property-related items from continuing operations (98) 580
Profits/losses arising on other property-related items from continuing operations (134) (419)
Profits/losses arising on property-related items from discontinued operations 162 288
Loss arising on sale of non property-related items (1) –
Profit arising on sale of subsidiaries and other investments 1 35
Impairment of goodwill (Note 10) 540 575
Impairment of other investments 42 –
Net charge of impairment of property, plant and equipment and intangible assets not included in property-related items 715 629
Adjustment for non-cash element of pensions charges 11 (4)
Additional contribution into pension scheme (4) (180)
Share-based payments (Note 25) 47 53
Tesco Bank non-cash items included in profit before tax 76 54
Increase in inventories (115) (54)
Increase in development stock (8) (40)
Increase in trade and other receivables (33) (104)
Increase/(decrease) in trade and other payables 509 (112)
(Decrease)/increase in provisions (73) 309
Tesco Bank increase in loans and advances to customers (Note 17) (1,432) (1,220)
Tesco Bank (increase)/decrease in trade and other receivables (31) 359
Tesco Bank increase in customer and bank deposits and trade and other payables 867 579
Tesco Bank increase in provisions 2 24
Increase in working capital (314) (259)
Cash generated from operations 4,316 3,873
* Restated for amendments to IAS 19 as explained in Note 1.
The increase in working capital includes the impact of translating foreign currency working capital movements at average exchange rates rather than year end exchange rates.
Included in (decrease)/increase in provisions are movements in respect of provisions for onerous contracts relating to continuing operations of £(46)m (2013: £129m) which are included in property-related items as per the Group Income Statement, and relating to discontinued operations of £(37)m (2013: £47m) which are included in property-related items as per Note 7.
Note 30 Analysis of changes in net debt
At23 February
2013£m
Tesco Bank at23 February
2013£m
Cash flow£m
Business combinations
£m
Othernon-cash
movements£m
Net debt of disposal
group £m
Eliminationof Tesco Bank
£m
At22 February
2014£m
Cash and cash equivalents 1,457 1,055 378 9 (105) (288) (485) 2,021
Short-term investments 522 – 494 – – – – 1,016
Joint venture loans and other receivables 434 42 (96) – 10 (136) (34) 220
Bank and other borrowings (10,066) (638) (818) – 148 282 486 (10,606)
Finance lease payables (128) – 9 – 5 (7) – (121)
Net derivative financial instruments 1,172 (31) 36 – (470) – 5 712
Net debt of the disposal group 12 – – – – 149 – 161
Net debt (6,597) 428 3 9 (412) – (28) (6,597)
Net debt excludes the net debt of Tesco Bank but includes that of the discontinued operations. Movements and balances related to Tesco Bank are included within this analysis and the Reconciliation of net cash flow to movement in net debt note to allow reconciliation between the Group Balance Sheet and the Group Cash Flow Statement. These movements and balances relating to Tesco Bank are subsequently eliminated to arrive at closing net debt.
Note 31 Business combinations and other acquisitions
During the current financial year, the Group completed business combination transactions with total cash consideration of £49m (2013: £30m), which are not considered material to the Group individually or in aggregate.
118 Tesco PLC Annual Report and Financial Statements 2014
Notes to the Group financial statements continued

Capital commitmentsAt 22 February 2014, there were commitments for capital expenditure contracted for, but not provided for of £270m (2013: £1,278m), principally relating to store development.
Contingent liabilitiesTesco PLC has irrevocably guaranteed the liabilities of the following Irish subsidiary undertakings for the financial year ended 22 February 2014, which undertakings have been exempted pursuant to Section 17(1) of the Companies (Amendment) Act 1986 of Ireland from the provisions of Section 7 (other than subsection (1)(b)) of that Act:
Monread Developments Limited; Edson Properties Limited; Edson Investments Limited; Cirrus Finance (2009) Limited; Commercial Investments Limited; Chirac Limited; Clondalkin Properties Limited; Golden Island Management Services Limited; Tesco Ireland Pension Trustees Limited; Orpingford; Tesco Trustee Company of Ireland Limited; WSC Properties Limited, Thundridge; Pharaway Properties Limited; R.J.D. Holdings; Nabola Development Limited; PEJ Property Investments Limited; Cirrus Finance Limited; Tesco Ireland Limited; Wanze Properties (Dundalk) Limited; Valiant Insurance Company; Tesco Ireland Holdings Limited.
For details of assets held under finance leases, which are pledged as security for the finance lease liabilities, see Note 11. There are a number of contingent liabilities that arise in the normal course of business which if realised are not expected to result in a material liability to the Group. The Group recognises provisions for liabilities when it is more likely than not that a settlement will be required and the value of such a payment can be reliably estimated.
Tesco BankAt 22 February 2014, Tesco Bank had commitments of formal standby facilities, credit lines and other commitments to lend, totalling £9.7bn (2013: £8.0bn). The amount is intended to provide an indication of the potential volume of business and not of the underlying credit or other risks.
During the year to 22 February 2014 a change was made to a methodology by which the Group measures undrawn credit card commitments to exclude both the credit limits on cancelled cards and any overpayments made by customers. The impact of this change in the prior year is a reduction in undrawn credit card commitments of £0.5bn.
Note 33 Tesco Bank capital resources
The following tables analyse the regulatory capital resources of Tesco Personal Finance PLC (‘TPF’), being the regulated entity at the balance sheet date:
2014£m
2013*
£m
Tier 1 capital:
Shareholders’ funds and non-controlling interests, net of tier 1 regulatory adjustments 913 705
Tier 2 capital:
Qualifying subordinated debt 235 372
Other interests 33 25
Total tier 2 regulatory adjustments (21) (64)
Total regulatory capital 1,160 1,038
Following the publication of the Capital Requirements Directive (‘CRD’) IV rules in the year, the Prudential Regulation Authority (‘PRA’) issued a policy statement on 19 December 2013 detailing how the rules will be enacted within the UK with corresponding timeframes for implementation. The CRD IV rules will be phased in over the course of the next five years.
The movement of tier 1 capital during the financial year is analysed as follows:2014
£m2013*
£m
At beginning of the year 705 744
Share capital and share premium 140 45
Profit attributable to shareholders 115 93
Other reserves 1 (1)
Ordinary dividends (100) (105)
Movement in material holdings 11 (11)
Increase in intangible assets (30) (60)
At end of the year, excluding CRD IV adjustments 842 705
CRD IV adjustments
Deferred tax liabilities related to intangible assets 32 –
Movement in material holdings 39 –
At end of the year, including CRD IV adjustments 913 705
* During the year the Group has amended its Tesco Bank capital resources to reflect the industry standard approach of including annual profits in full within capital resources for the year to which they relate. The 2013 capital resources have been represented on a consistent basis with the current year presentation. Previously, annual profits were only included within capital resources at the point at which they were deemed verified by the Group’s auditors.
It is TPF’s policy to maintain a strong capital base, to expand it as appropriate and to utilise it efficiently throughout its activities to optimise the return to shareholders while maintaining a prudent relationship between the capital base and the underlying risks of the business. In carrying out this policy, TPF has regard to the supervisory requirements of the PRA.
Note 32 Commitments and contingencies
Oth
er info
rmatio
nG
overnan
ceFin
ancial statem
ents
Strateg
ic repo
rt
Tesco PLC Annual Report and Financial Statements 2014 119
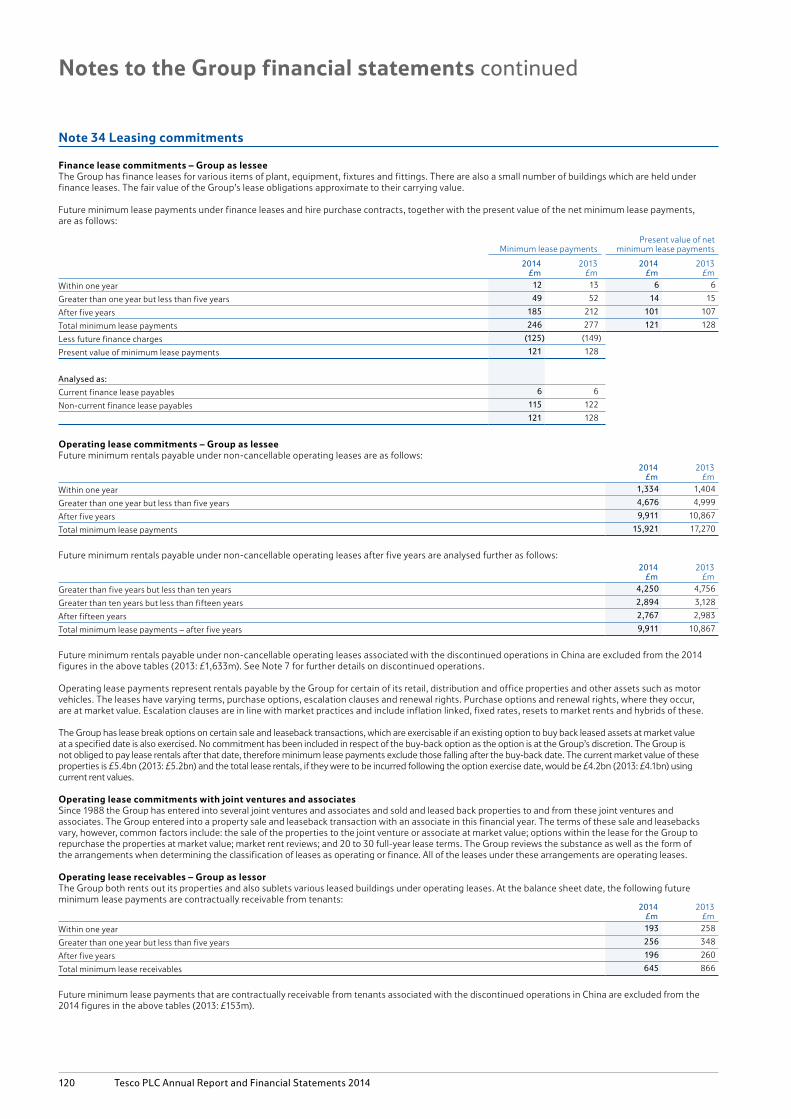
Note 34 Leasing commitments
Finance lease commitments – Group as lesseeThe Group has finance leases for various items of plant, equipment, fixtures and fittings. There are also a small number of buildings which are held under finance leases. The fair value of the Group’s lease obligations approximate to their carrying value.
Future minimum lease payments under finance leases and hire purchase contracts, together with the present value of the net minimum lease payments, are as follows:
Minimum lease paymentsPresent value of net
minimum lease payments
2014£m
2013£m
2014£m
2013£m
Within one year 12 13 6 6
Greater than one year but less than five years 49 52 14 15
After five years 185 212 101 107
Total minimum lease payments 246 277 121 128
Less future finance charges (125) (149)
Present value of minimum lease payments 121 128
Analysed as:
Current finance lease payables 6 6
Non-current finance lease payables 115 122
121 128
Operating lease commitments – Group as lesseeFuture minimum rentals payable under non-cancellable operating leases are as follows:
2014£m
2013£m
Within one year 1,334 1,404
Greater than one year but less than five years 4,676 4,999
After five years 9,911 10,867
Total minimum lease payments 15,921 17,270
Future minimum rentals payable under non-cancellable operating leases after five years are analysed further as follows:2014
£m2013
£m
Greater than five years but less than ten years 4,250 4,756
Greater than ten years but less than fifteen years 2,894 3,128
After fifteen years 2,767 2,983
Total minimum lease payments – after five years 9,911 10,867
Future minimum rentals payable under non-cancellable operating leases associated with the discontinued operations in China are excluded from the 2014 figures in the above tables (2013: £1,633m). See Note 7 for further details on discontinued operations.
Operating lease payments represent rentals payable by the Group for certain of its retail, distribution and office properties and other assets such as motor vehicles. The leases have varying terms, purchase options, escalation clauses and renewal rights. Purchase options and renewal rights, where they occur, are at market value. Escalation clauses are in line with market practices and include inflation linked, fixed rates, resets to market rents and hybrids of these.
The Group has lease break options on certain sale and leaseback transactions, which are exercisable if an existing option to buy back leased assets at market value at a specified date is also exercised. No commitment has been included in respect of the buy-back option as the option is at the Group’s discretion. The Group is not obliged to pay lease rentals after that date, therefore minimum lease payments exclude those falling after the buy-back date. The current market value of these properties is £5.4bn (2013: £5.2bn) and the total lease rentals, if they were to be incurred following the option exercise date, would be £4.2bn (2013: £4.1bn) using current rent values.
Operating lease commitments with joint ventures and associates Since 1988 the Group has entered into several joint ventures and associates and sold and leased back properties to and from these joint ventures and associates. The Group entered into a property sale and leaseback transaction with an associate in this financial year. The terms of these sale and leasebacks vary, however, common factors include: the sale of the properties to the joint venture or associate at market value; options within the lease for the Group to repurchase the properties at market value; market rent reviews; and 20 to 30 full-year lease terms. The Group reviews the substance as well as the form of the arrangements when determining the classification of leases as operating or finance. All of the leases under these arrangements are operating leases.
Operating lease receivables – Group as lessorThe Group both rents out its properties and also sublets various leased buildings under operating leases. At the balance sheet date, the following future minimum lease payments are contractually receivable from tenants:
2014£m
2013£m
Within one year 193 258
Greater than one year but less than five years 256 348
After five years 196 260
Total minimum lease receivables 645 866
Future minimum lease payments that are contractually receivable from tenants associated with the discontinued operations in China are excluded from the 2014 figures in the above tables (2013: £153m).
120 Tesco PLC Annual Report and Financial Statements 2014
Notes to the Group financial statements continued

Note 35 Events after the reporting period
On 21 March 2014, the Group entered into an agreement with Trent Limited, part of the Tata Group, to form a 50:50 Joint Venture in Trent Hypermarket Limited (‘THL’) which operates the Star Bazaar retail business in India. The Group’s investment is £85 million.
On 2 April 2014 the Group, through its subsidiary Dunnhumby Limited, acquired Sociomantic Labs (‘Sociomantic’), a Berlin-based global leader in digital advertising solutions, for £124m. Sociomantic operates in 14 countries worldwide, with clients in retail, financial services and travel services.
Tesco PLC Annual Report and Financial Statements 2014 121
Oth
er info
rmatio
nG
overnan
ceFin
ancial statem
ents
Strateg
ic repo
rt

Notes
22 February2014
£m
23 February2013
£m
Non-current assets
Investments 5 13,691 14,540
Derivative financial instruments 10 1,430 1,913
15,121 16,453
Current assets
Derivative financial instruments 10 64 198
Debtors 6 12,536 12,017
Short-term investments 7 1,016 522
Cash and cash equivalents 106 5
13,722 12,742
Creditors – amounts falling due within one year
Borrowings 9 (1,705) (292)
Derivative financial instruments 10 (130) (91)
Other creditors 8 (8,953) (8,218)
(10,788) (8,601)
Net current assets 2,934 4,141
Total assets less current liabilities 18,055 20,594
Creditors – amounts falling due after more than one year
Borrowings 9 (7,953) (9,436)
Derivative financial instruments 10 (703) (694)
(8,656) (10,130)
Net assets 9,399 10,464
Capital and reserves
Called up share capital 13 405 403
Share premium 14 5,080 5,020
Profit and loss reserve 14 3,914 5,041
Total equity 9,399 10,464
The notes on pages 123 to 130 form part of these financial statements.
Philip Clarke
Directors The Parent Company financial statements on pages 122 to 130 were authorised for issue by the Directors on 2 May 2014 and are subject to the approval of the shareholders at the Annual General Meeting on 27 June 2014.
Tesco PLC Registered number 00445790
122 Tesco PLC Annual Report and Financial Statements 2014
Tesco PLC – Parent Company balance sheet

Note 1 Accounting policies
Basis of preparationThe Parent Company financial statements have been prepared on a going concern basis using the historical cost convention modified for the revaluation of certain financial instruments and in accordance with generally accepted accounting principles (‘UK GAAP’) and the Companies Act 2006.
The financial year represents the 52 weeks to 22 February 2014 (prior financial year 52 weeks to 23 February 2013).
A summary of the Company’s significant accounting policies is set out below.
ExemptionsThe Directors have taken advantage of the exemption available under Section 408 of the Companies Act 2006 and not presented a Profit and Loss Account for the Company alone.
The Company has taken advantage of the FRS 29 ‘Financial Instruments: Disclosures’ exemption and not provided derivative financial instrument disclosures of the Company alone.
The Company has also taken advantage of the exemption from preparing a Cash Flow Statement under the terms of FRS 1 ‘Cash Flow Statement’. The cash flows of the Company are included in the Tesco Group financial statements.
The Company is also exempt under the terms of FRS 8 ‘Related Parties’ from disclosing related party transactions with entities that are part of the Tesco Group.
Short-term investmentsShort-term investments relate to money market deposits which are recognised initially at fair value, and subsequently at amortised cost. All income from these investments is included in the Profit and Loss Account as interest receivable and similar income.
Investments in subsidiaries and joint venturesInvestments in subsidiaries and joint ventures are stated at cost less, where appropriate, provisions for impairment.
Foreign currenciesAssets and liabilities that are denominated in foreign currencies are translated into Pounds Sterling at the exchange rates prevailing at the balance sheet date of the financial year.
Share-based paymentsThe fair value of employee share option plans is calculated at the grant date using the Black-Scholes model. The resulting cost is charged to the Profit and Loss Account over the vesting period. The value of the charge is adjusted to reflect expected and actual levels of vesting.
Where the Company awards shares or options to employees of subsidiary entities, this is treated as a capital contribution.
Financial instrumentsFinancial assets and financial liabilities are recognised on the Company’s Balance Sheet when the Company becomes party to the contractual provisions of the instrument.
DebtorsDebtors are recognised initially at fair value, and subsequently at amortised cost using the effective interest rate method, less provision for impairment.
Financial liabilities and equity instrumentsFinancial liabilities and equity instruments are classified according to the substance of the contractual arrangements entered into. An equity instrument is any contract that gives a residual interest in the assets of the Company after deducting all of its liabilities. Equity instruments issued by the Company are recorded as the proceeds received, net of direct issue costs.
BorrowingsInterest-bearing bank loans and overdrafts are initially recognised at the value of the amount received, net of attributable transaction costs. Subsequent to initial recognition, interest-bearing borrowings are stated at amortised cost with any differences between cost and redemption value being recognised in the Company Profit and Loss Account over the period of the borrowings on an effective interest basis.
Other creditorsOther creditors are recognised initially at fair value, and subsequently at amortised cost using the effective interest rate method.
Derivative financial instruments and hedge accountingThe Company uses derivative financial instruments to hedge its exposure to foreign exchange and interest rate risks arising from operating, financing and investing activities. The Company does not hold or issue derivative financial instruments for trading purposes.
Derivative financial instruments are recognised and stated at fair value. Where derivatives do not qualify for hedge accounting, any gains or losses on remeasurement are immediately recognised in the Company Profit and Loss Account. Where derivatives qualify for hedge accounting, recognition of any resultant gain or loss depends on the nature of the hedge relationship and the items being hedged.
In order to qualify for hedge accounting, the Company is required to document from inception, the relationship between the item being hedged and the hedging instrument. The Company is also required to document and demonstrate an assessment of the relationship between the hedged item and the hedging instrument, which shows that the hedge will be highly effective on an on-going basis. This effectiveness testing is performed at each reporting date to ensure that the hedge remains highly effective.
Derivative financial instruments with maturity dates of more than one year from the balance sheet date are disclosed as falling due after more than one year.
Oth
er info
rmatio
nG
overnan
ceFin
ancial statem
ents
Strateg
ic repo
rt
Tesco PLC Annual Report and Financial Statements 2014 123
Notes to the Parent Company financial statements

Note 1 Accounting policies continued
PensionsThe Company participates in the Tesco PLC Pension Scheme and cannot identify its share of the underlying assets and liabilities of the scheme. Accordingly, as permitted by FRS 17 ‘Retirement Benefits’, the Company has accounted for the scheme as a defined contribution scheme, and the charge for the period is based upon the cash contributions payable.
TaxationCorporation tax payable is provided on the taxable profit for the year, using the tax rates enacted or substantively enacted by the Balance Sheet date.
The company will surrender group relief to Group companies and consequently there may be no tax charge in the Profit and Loss Account.
Deferred tax is recognised in respect of all timing differences that have originated but not reversed at the Balance Sheet date and would give rise to an obligation to pay more or less tax in the future. Deferred tax assets are recognised to the extent that they are recoverable. They are regarded as recoverable to the extent that on the basis of all available evidence, it is regarded as more likely than not that there will be suitable taxable profits from which the future reversal of the underlying timing differences can be deducted. Deferred tax is measured on a non-discontinued basis at the tax rates that are expected to apply in the periods in which the timing differences reverse, based on tax rates and laws that have been substantively enacted by the Balance Sheet date.
Fair value hedgingDerivative financial instruments are classified as fair value hedges when they hedge the Company’s exposure to changes in the fair value of a recognised asset or liability. Changes in the fair value of derivatives that are designated and qualify as fair value hedges are recorded in the Company Profit and Loss Account, together with any changes in the fair value of the hedged item that is attributable to the hedged risk.
Cash flow hedgingDerivative financial instruments are classified as cash flow hedges when they hedge the Company’s exposure to variability in cash flows that are either attributable to a particular risk associated with a recognised asset or liability, or a highly probable forecasted transaction.
The effective element of any gain or loss from remeasuring the derivative instrument is recognised directly in equity.
The associated cumulative gain or loss is removed from equity and recognised in the Company Profit and Loss Account in the same period during which the hedged transaction affects the Company Profit and Loss Account. The classification of the effective portion when recognised in the Company Profit and Loss Account is the same as the classification of the hedged transaction. Any element of the re-measurement criteria of the derivative instrument which does not meet the criteria for an effective hedge is recognised immediately in the Company Profit and Loss Account.
Hedge accounting is discontinued when the hedging instrument expires or is sold, terminated or exercised, or no longer qualifies for hedge accounting or is de-designated. At that point in time, any cumulative gain or loss on the hedging instrument recognised in equity is retained in equity until the forecasted transaction occurs or the original hedged item affects the Company Profit and Loss Account. If a forecasted hedged transaction is no longer expected to occur, the net cumulative gain or loss recognised in equity is transferred to the Company Profit and Loss Account.
124 Tesco PLC Annual Report and Financial Statements 2014
Notes to the Parent Company financial statements continued

Note 2 Auditor remuneration
2014£m
2013£m
Fees payable to the Company’s auditor for the audit of the Company and Group financial statements 0.8 0.8
Note 3 Employment costs, including Directors’ remuneration
2014£m
2013£m
Wages and salaries* 21 20
Social security costs 2 2
Other pension costs 2 2
Share-based payment expense** 1 6
26 30
* The wages and salaries expense includes a recharge from Tesco Stores Limited for Board-related functions.** The share-based payment expense in 2013 includes an amount of £3m relating to liabilities of Tesco Japan that were not transferred to the acquiring company on disposal.
The average number of employees (all Directors of the Company) during the financial year was 10 (2013: 13).
The Schedule V requirements of SI 2008/410 for Directors’ remuneration are included within the Directors’ remuneration report on pages 41 to 61.
Note 4 Dividends
For details of dividends see Note 8 in the Group financial statements.
Note 5 Investments
Shares in Group
undertakings£m
Shares in joint
ventures£m
Total£m
Cost
At 23 February 2013 15,598 16 15,614
Additions 632 – 632
Disposals (1) – (1)
Transfers (489) – (489)
At 22 February 2014 15,740 16 15,756
Impairment
At 23 February 2013 1,074 – 1,074
Impairment 991 – 991
At 22 February 2014 2,065 – 2,065
Net carrying value
At 22 February 2014 13,675 16 13,691
At 23 February 2013 14,524 16 14,540
For a list of the Company’s principal operating subsidiary undertakings and joint ventures see Note 13 in the Group financial statements.
The £991m impairment relates to the Company’s investments in the Group’s Chinese retail operations. During the period, the Group entered into definitive agreements with China Resources Enterprise, Limited to combine their respective Chinese retail operations. The definitive agreements allow for the exchange of the Group’s Chinese retail and property interests plus cash of HK$4,325m for a 20% interest in the combined businesses. Consequently, the Directors have written-down the Company’s investments in China to the value consolidated in the Group financial statements, which reflects the fair value for disposal. Please refer to Note 7 in the Group financial statements for further details. O
ther in
form
ation
Govern
ance
Finan
cial statemen
tsS
trategic rep
ort
Tesco PLC Annual Report and Financial Statements 2014 125
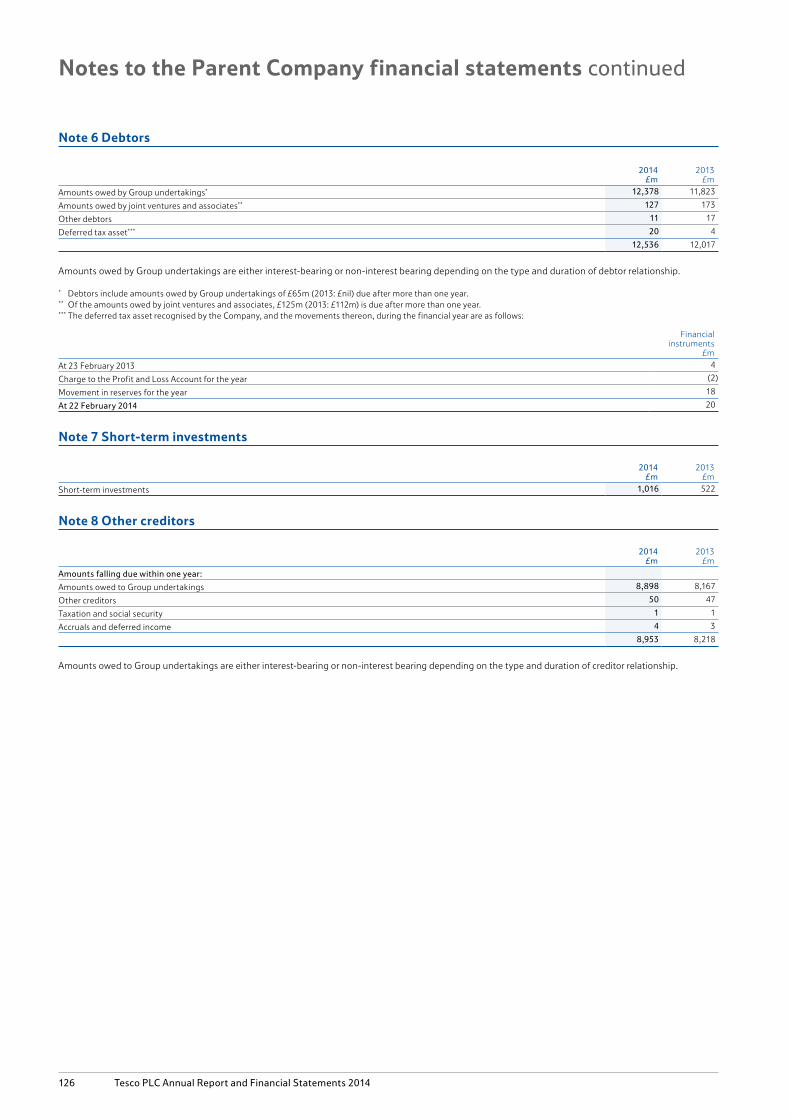
2014£m
2013£m
Amounts owed by Group undertakings* 12,378 11,823
Amounts owed by joint ventures and associates** 127 173
Other debtors 11 17
Deferred tax asset*** 20 4
12,536 12,017
Amounts owed by Group undertakings are either interest-bearing or non-interest bearing depending on the type and duration of debtor relationship.
* Debtors include amounts owed by Group undertakings of £65m (2013: £nil) due after more than one year.** Of the amounts owed by joint ventures and associates, £125m (2013: £112m) is due after more than one year. *** The deferred tax asset recognised by the Company, and the movements thereon, during the financial year are as follows:
Financial instruments
£m
At 23 February 2013 4
Charge to the Profit and Loss Account for the year (2)
Movement in reserves for the year 18
At 22 February 2014 20
Note 7 Short-term investments
2014£m
2013£m
Short-term investments 1,016 522
Note 8 Other creditors
2014£m
2013£m
Amounts falling due within one year:
Amounts owed to Group undertakings 8,898 8,167
Other creditors 50 47
Taxation and social security 1 1
Accruals and deferred income 4 3
8,953 8,218
Amounts owed to Group undertakings are either interest-bearing or non-interest bearing depending on the type and duration of creditor relationship.
Note 6 Debtors
126 Tesco PLC Annual Report and Financial Statements 2014
Notes to the Parent Company financial statements continued

Par valueMaturity
year2014
£m2013
£m
Bank loans and overdrafts – – 658 58
Loans from joint ventures – – 10 10
5% MTN £600m 2014 628 642
2% USD Bond $500m 2014 300 328
5.125% MTN €600m 2015 528 566
4% RPI MTN* £299m 2016 304 295
5.875% MTN €1,039m 2016 1,011 1,071
2.7% MTN $500m 2017 299 328
5.5% USD Bond $850m 2017 595 674
3.375% MTN €750m 2018 620 653
5.5% MTN £350m 2019 352 352
6.125% MTN £900m 2022 948 948
5% MTN £389m 2023 401 404
3.322% LPI MTN** £309m 2025 310 299
6% MTN £200m 2029 242 255
5.5% MTN £200m 2033 241 251
1.982% RPI MTN*** £252m 2036 256 248
6.15% USD Bond $1,150m 2037 792 911
4.875% MTN £173m 2042 174 174
5.125% MTN €600m 2047 605 641
5.2% MTN £279m 2057 274 274
Other MTNs – – 110 122
Other loans – – – 224
9,658 9,728
* The 4% RPI MTN is redeemable at par, including indexation for increases in the RPI over the life of the MTN.** The 3.322% LPI MTN is redeemable at par, including indexation for increases in the RPI over the life of the MTN. The maximum indexation of the principal in any one year is 5%,
with a minimum of 0%.*** The 1.982% RPI MTN is redeemable at par, including indexation for increases in the RPI over the life of the MTN.
2014£m
2013£m
Repayment analysis:
Amounts falling due within one year 1,705 292
1,705 292
Amounts falling due after more than one year:
Amounts falling due between one and two years 528 1,093
Amounts falling due between two and five years 2,829 2,934
Amounts falling due after more than five years 4,596 5,409
7,953 9,436
9,658 9,728
Note 9 Borrowings
Oth
er info
rmatio
nG
overnan
ceFin
ancial statem
ents
Strateg
ic repo
rt
Tesco PLC Annual Report and Financial Statements 2014 127

The fair value of derivative financial instruments has been disclosed in the Company’s Balance Sheet as:
2014 2013
Asset
£mLiability
£mAsset
£mLiability
£m
Amounts falling due within one year 64 (130) 198 (91)
Amounts falling due after more than one year 1,430 (703) 1,913 (694)
Total 1,494 (833) 2,111 (785)
2014 2013
Asset Liability Asset Liability
Fair value
£mNotional
£mFair value
£mNotional
£mFair value
£mNotional
£mFair value
£mNotional
£m
Fair value hedges
Interest rate swaps and similar instruments 61 1,065 – – 103 1,065 – –
Cross currency swaps 583 2,055 (25) 551 890 2,749 (34) 249
Cash flow hedges
Interest rate swaps and similar instruments – – (110) 400 – – (126) 400
Cross currency swaps 139 287 (103) 782 237 642 (31) 531
Index-linked swaps 86 860 – – 80 833 – –
Forward foreign currency contracts 2 486 (1) 196 – 93 (1) 72
Derivatives in cash flow hedge and not in a formal relationship*
Cross currency swaps 10 308 – – – – (10) 325
Derivatives not in a formal hedge relationship
Index-linked swaps 583 3,354 (499) 3,339 603 3,089 (530) 3,589
Forward foreign currency contracts 30 828 (95) 2,085 198 2,630 (53) 919
Total 1,494 9,243 (833) 7,353 2,111 11,101 (785) 6,085
* These are designated as cash flow hedges and net investment hedges at Group level but for PLC financial statements are classified as cash flow hedges and ‘not in a formal hedge relationship’.
Note 11 Share-based payments
The Company’s equity-settled share-based payment schemes comprise various share schemes designed to reward Executive Directors. For further information on these schemes, including the valuation models and assumptions used, see Note 25 in the Group financial statements.
Share option schemes The number of options and WAEP of share option schemes relating to the Company employees are:
For the year ended 22 February 2014
Savings-relatedShare Option Scheme
ApprovedShare Option Scheme
UnapprovedShare Option Scheme
Nil costshare options
Options WAEP Options WAEP Options WAEP Options WAEP
Outstanding at 24 February 2013 17,390 346.61 57,184 367.22 13,988,866 384.66 14,317,776 0.00
Granted 1,862 322.00 – – – – 1,978,324 0.00
Forfeited (6,292) 378.28 (38,176) 392.90 (3,577,576) 424.36 (2,550,724) 0.00
Exercised (3,852) 316.15 – – (935,696) 338.40 (3,030,439) 0.00
Outstanding at 22 February 2014 9,108 332.59 19,008 315.65 9,475,594 374.24 10,714,937 0.00
Exercisable as at 22 February 2014 – – 19,008 315.65 9,475,594 374.24 4,206,723 0.00
Exercise price range (pence) – – –
312.75 to 318.60 –
312.75 to 473.75 – 0.00
Weighted average remaining contractual life (years) – – – 1.68 – 3.57 – 4.18
Note 10 Derivative financial instruments
128 Tesco PLC Annual Report and Financial Statements 2014
Notes to the Parent Company financial statements continued

For the year ended 23 February 2013
Savings-relatedShare Option Scheme
ApprovedShare Option Scheme
UnapprovedShare Option Scheme
Nil costshare options
Options WAEP Options WAEP Options WAEP Options WAEP
Outstanding at 26 February 2012 25,912 355.62 64,330 373.06 14,368,570 385.59 16,030,275 0.00
Granted 3,189 282.00 – – – – 3,606,494 0.00
Forfeited (11,711) 348.94 (7,146) 419.80 (379,704) 419.80 (2,991,480) 0.00
Exercised – – – – – – (2,327,513) 0.00
Outstanding at 23 February 2013 17,390 346.61 57,184 367.22 13,988,866 384.66 14,317,776 0.00
Exercisable as at 23 February 2013 3,276 410.00 28,600 314.68 11,218,026 375.98 5,630,056 0.00
Exercise price range (pence) – 410.00 –312.75
to 318.60 –312.75
to 473.75 – 0.00
Weighted average remaining contractual life (years) – 0.20 – 2.51 – 4.74 – 5.24
Share bonus schemes The number and WAFV of share bonuses awarded during the financial year relating to the Company employees are:
2014 2013
Shares
numberWAFVpence
Sharesnumber
WAFVpence
Shares In Success 847 383.55 – –
Executive Incentive Scheme – – 37,424 308.25
Performance Share Plan – – 649,113 317.10
Note 12 Pensions
The total cost of the pension scheme to the Company was £2.3m (2013: £1.5m). Further disclosure relating to the Tesco PLC Pension Scheme can be found in Note 26 of the Group financial statements.
Note 13 Called up share capital
2014 2013
Ordinary shares of 5p each Ordinary shares of 5p each
Number £m Number £m
Allotted, called up and fully paid:
At beginning of the year 8,054,054,930 403 8,031,812,445 402
Share options 19,662,145 1 18,632,251 1
Share bonus awards 22,104,016 1 3,610,234 –
At end of the year 8,095,821,091 405 8,054,054,930 403
During the financial year, 20 million (2013: 19 million) ordinary shares of 5p each were issued in relation to share options for an aggregate consideration of £61m (2013: £57m).
During the financial year, 22 million (2013: 4 million) ordinary shares of 5p each were issued in relation to share bonus awards for an aggregate consideration of £1.1m (2013: £0.2m).
Between 23 February 2014 and 11 April 2014 options over 942,705 ordinary shares were exercised under the terms of the Savings-related Share Option Scheme (1981) and the Irish Savings-related Share Option Scheme (2000). Between 23 February 2014 and 11 April 2014, options over 2,207,051 ordinary shares were exercised under the terms of the Executive Share Option Schemes (1994 and 1996) and the Discretionary Share Option Plan (2004).
As at 22 February 2014, the Directors were authorised to purchase up to a maximum in aggregate of 806.5 million (2013: 804.0 million) ordinary shares.
The holders of ordinary shares are entitiled to receive dividends as declared from time to time and are entitled to one vote per share at general meetings of the Company.
Note 11 Share-based payments continued
Oth
er info
rmatio
nG
overnan
ceFin
ancial statem
ents
Strateg
ic repo
rt
Tesco PLC Annual Report and Financial Statements 2014 129

2014£m
2013£m
Share premium account
At beginning of the year 5,020 4,964
Premium on issue of shares less costs 60 56
At end of the year 5,080 5,020
Profit and loss reserve
At beginning of the year 5,041 2,842
Share-based payments 54 61
Dividends authorised in the year (1,189) (1,184)
Net movement on cash flow hedges (78) 2
Profit after tax for the year 86 3,320
At end of the year 3,914 5,041
Note 14 Reserves
130 Tesco PLC Annual Report and Financial Statements 2014
Notes to the Parent Company financial statements continued

Report on the Parent Company financial statementsOur opinion
In our opinion the Parent Company financial statements, defined below:
• give a true and fair view of the state of the Parent Company’s affairs as at 22 February 2014;
• have been properly prepared in accordance with United Kingdom Generally Accepted Accounting Practice; and
• have been prepared in accordance with the requirements of the Companies Act 2006.
This opinion is to be read in the context of what we say in the remainder of this report.
What we have audited
The parent Company financial statements, which are prepared by Tesco PLC, comprise:
• the Parent Company Balance Sheet as at 22 February 2014; and• the notes to the Parent Company financial statements, which
include a summary of significant accounting policies and other explanatory information.
The financial reporting framework that has been applied in their preparation comprises applicable law and United Kingdom Accounting Standards (United Kingdom Generally Accepted Accounting Practice).
In applying the financial reporting framework, the directors have made a number of subjective judgements, for example in respect of significant accounting estimates. In making such estimates, they have made assumptions and considered future events.
Certain disclosures required by the financial reporting framework have been presented elsewhere in the Annual Report and Financial Statements (the “Annual Report”) rather than in the notes to the financial statements. These are cross-referenced from the financial statements and are identified as audited.
What an audit of financial statements involves
We conducted our audit in accordance with International Standards on Auditing (UK & Ireland) (“ISAs (UK & Ireland)”). An audit involves obtaining evidence about the amounts and disclosures in the financial statements sufficient to give reasonable assurance that the financial statements are free from material misstatement, whether caused by fraud or error. This includes an assessment of:
• whether the accounting policies are appropriate to the Parent Company’s circumstances and have been consistently applied and adequately disclosed;
• the reasonableness of significant accounting estimates made by the directors; and
• the overall presentation of the financial statements.
In addition, we read all the financial and non-financial information in the Annual Report to identify material inconsistencies with the audited Parent Company financial statements and to identify any information that is apparently materially incorrect based on, or materially inconsistent with, the knowledge acquired by us in the course of performing the audit. If we become aware of any apparent material misstatements or inconsistencies we consider the implications for our report.
Opinions on other matters prescribed by the Companies Act 2006
In our opinion:
• the information given in the Strategic Report and the Directors’ Report for the financial year for which the Parent Company financial statements are prepared is consistent with the Parent Company financial statements; and
• the part of the Directors’ Remuneration Report to be audited has been properly prepared in accordance with the Companies Act 2006.
Other matters on which we are required to report by exceptionAdequacy of accounting records and information and explanations received
Under the Companies Act 2006 we are required to report to you if, in our opinion:
• we have not received all the information and explanations we require for our audit; or
• adequate accounting records have not been kept by the Parent Company, or returns adequate for our audit have not been received from branches not visited by us; or
• the Parent Company financial statements and the part of the Directors’ Remuneration Report to be audited are not in agreement with the accounting records and returns.
We have no exceptions to report arising from this responsibility.
Directors’ remuneration
Under the Companies Act 2006 we are required to report to you if, in our opinion, certain disclosures of directors’ remuneration specified by law have not been made. We have no exceptions to report arising from this responsibility.
Other information in the Annual Report
Under ISAs (UK & Ireland), we are required to report to you if, in our opinion, information in the Annual Report is:
• materially inconsistent with the information in the audited Parent Company financial statements; or
• apparently materially incorrect based on, or materially inconsistent with, our knowledge of the Parent Company acquired in the course of performing our audit; or
• is otherwise misleading.
We have no exceptions to report arising from this responsibility.
Responsibilities for the financial statements and the audit
Our responsibilities and those of the directors
As explained more fully in the Directors’ Responsibilities Statement set out on page 64, the directors are responsible for the preparation of the Parent Company financial statements and for being satisfied that they give a true and fair view.
Our responsibility is to audit and express an opinion on the Parent Company financial statements in accordance with applicable law and ISAs (UK & Ireland). Those standards require us to comply with the Auditing Practices Board’s Ethical Standards for Auditors.
This report, including the opinions, has been prepared for and only for the Company’s members as a body in accordance with Chapter 3 of Part 16 of the Companies Act 2006 and for no other purpose. We do not, in giving these opinions, accept or assume responsibility for any other purpose or to any other person to whom this report is shown or into whose hands it may come save where expressly agreed by our prior consent in writing.
Other Matter
We have reported separately on the Group financial statements of Tesco PLC for the 52 weeks ended 22 February 2014.
Mark Gill (Senior Statutory Auditor)for and on behalf of PricewaterhouseCoopers LLPChartered Accountants and Statutory AuditorsLondon2 May 2014
Oth
er info
rmatio
nG
overnan
ceFin
ancial statem
ents
Strateg
ic repo
rt
Tesco PLC Annual Report and Financial Statements 2014 131
Independent auditors’ report to the members of Tesco PLC

20141
£m20131
£m
Revenue
Interest receivable and similar income 507 480
Fees and commissions receivable 496 541
1,003 1,021
Direct costs
Interest payable (149) (172)
Fees and commissions payable (29) (26)
(178) (198)
Gross profit 825 823
Other expenses:
Staff costs (146) (134)
Premises and equipment (87) (78)
Other administrative expenses (266) (276)
Depreciation and amortisation(excluding amortisation of intangibles arising on acquisition) (71) (62)
(570) (550)
Trading profit before provisions for bad and doubtful debts 255 273
Provisions for bad and doubtful debts (61) (82)
Trading profit 194 191
Deduct: Tesco Bank intangibles2 (12) (15)
Deduct: IAS 17 Leasing charge – (1)
Movements on derivatives and hedge accounting 6 –
Net finance costs: interest (6) (9)
Share of profit of joint ventures and associates 2 10
Restructuring and other one-off items3 (63) (85)
Deduct: management charges (1) (1)
Profit before tax 120 90
Notes1 These results are for the 12 months ended 28 February 2014 and the previous year comparison is made with the 12 months ended 28 February 2013.2 The non-cash amortisation of intangibles arising on acquisition. 3 Restructuring and other one-off items includes year end provisions for PPI (2013/14: £20m; 2012/2013: £90m), CCA (2013/14: £43m; 2012/13: nil) and CCP (2013/14: nil;
2012/13: £25m). Restructuring and other one-off items in 2012/13 includes a one-off credit of £30m.
The above is not a primary statement, nor a note to the financial statements and does not form part of the Group Income Statement. It is supplementary information to aid understanding of our non retail business.
Tesco Bank income statement
132 Tesco PLC Annual Report and Financial Statements 2014
Supplementary information (unaudited)

20141
£m20131
£m
Non-current assets
Intangible assets 446 428
Property, plant and equipment 93 94
Investments in joint ventures and associates 77 95
Other investments 850 819
Loans and advances to customers 3,210 2,465
Derivative financial instruments 35 33
4,711 3,934
Current assets
Trade and other receivables 209 186
Loans and advances to customers 3,705 3,093
Derivative financial instruments 2 –
Current tax assets 1 36
Cash and cash equivalents 485 1,055
4,402 4,370
Current liabilities
Trade and other payables (260) (246)
Financial liabilities:
Derivative financial instruments (4) (7)
Customer deposits (4,713) (5,322)
Deposits by banks (772) (9)
Provisions (105) (102)
(5,854) (5,686)
Net current liabilities (1,452) (1,316)
Non-current liabilities
Financial liabilities:
Borrowings (395) (407)
Derivative financial instruments (38) (57)
Customer deposits (1,366) (677)
Deposits by banks (8) (6)
Deferred tax liabilities (25) (49)
Net assets included within Tesco Group accounts2 1,427 1,422
Notes1 As at 28 February 2014 with comparatives at 28 February 2013.2 Intra-group liabilities of £94m (2012/13: £252m) have been eliminated on consolidation in preparing the Tesco PLC consolidated financial statements. Net assets
of Tesco Bank are £1,357m (2012/13: £1,198m) including the intra-group liabilities and ATM commission.
The above is not a primary statement, nor a note to the financial statements and does not form part of the Group Balance Sheet. It is supplementary information to aid understanding of our non retail business.
Tesco Bank balance sheet
Tesco PLC Annual Report and Financial Statements 2014 133
Oth
er info
rmatio
nG
overnan
ceFin
ancial statem
ents
Strateg
ic repo
rt
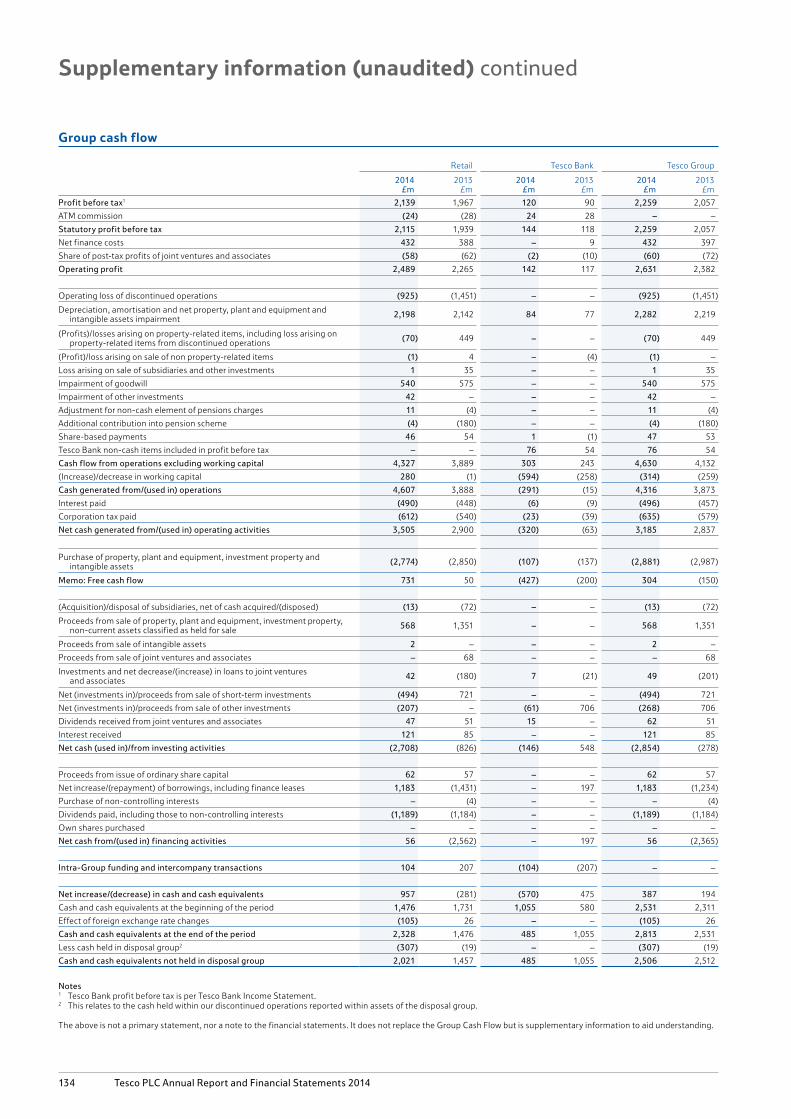
Retail Tesco Bank Tesco Group
2014£m
2013 £m
2014£m
2013 £m
2014£m
2013 £m
Profit before tax1 2,139 1,967 120 90 2,259 2,057
ATM commission (24) (28) 24 28 – –
Statutory profit before tax 2,115 1,939 144 118 2,259 2,057
Net finance costs 432 388 – 9 432 397
Share of post-tax profits of joint ventures and associates (58) (62) (2) (10) (60) (72)
Operating profit 2,489 2,265 142 117 2,631 2,382
Operating loss of discontinued operations (925) (1,451) – – (925) (1,451)
Depreciation, amortisation and net property, plant and equipment and intangible assets impairment 2,198 2,142 84 77 2,282 2,219
(Profits)/losses arising on property-related items, including loss arising on property-related items from discontinued operations (70) 449 – – (70) 449
(Profit)/loss arising on sale of non property-related items (1) 4 – (4) (1) –
Loss arising on sale of subsidiaries and other investments 1 35 – – 1 35
Impairment of goodwill 540 575 – – 540 575
Impairment of other investments 42 – – – 42 –
Adjustment for non-cash element of pensions charges 11 (4) – – 11 (4)
Additional contribution into pension scheme (4) (180) – – (4) (180)
Share-based payments 46 54 1 (1) 47 53
Tesco Bank non-cash items included in profit before tax – – 76 54 76 54
Cash flow from operations excluding working capital 4,327 3,889 303 243 4,630 4,132
(Increase)/decrease in working capital 280 (1) (594) (258) (314) (259)
Cash generated from/(used in) operations 4,607 3,888 (291) (15) 4,316 3,873
Interest paid (490) (448) (6) (9) (496) (457)
Corporation tax paid (612) (540) (23) (39) (635) (579)
Net cash generated from/(used in) operating activities 3,505 2,900 (320) (63) 3,185 2,837
Purchase of property, plant and equipment, investment property and intangible assets (2,774) (2,850) (107) (137) (2,881) (2,987)
Memo: Free cash flow 731 50 (427) (200) 304 (150)
(Acquisition)/disposal of subsidiaries, net of cash acquired/(disposed) (13) (72) – – (13) (72)
Proceeds from sale of property, plant and equipment, investment property, non-current assets classified as held for sale 568 1,351 – – 568 1,351
Proceeds from sale of intangible assets 2 – – – 2 –
Proceeds from sale of joint ventures and associates – 68 – – – 68
Investments and net decrease/(increase) in loans to joint ventures and associates 42 (180) 7 (21) 49 (201)
Net (investments in)/proceeds from sale of short-term investments (494) 721 – – (494) 721
Net (investments in)/proceeds from sale of other investments (207) – (61) 706 (268) 706
Dividends received from joint ventures and associates 47 51 15 – 62 51
Interest received 121 85 – – 121 85
Net cash (used in)/from investing activities (2,708) (826) (146) 548 (2,854) (278)
Proceeds from issue of ordinary share capital 62 57 – – 62 57
Net increase/(repayment) of borrowings, including finance leases 1,183 (1,431) – 197 1,183 (1,234)
Purchase of non-controlling interests – (4) – – – (4)
Dividends paid, including those to non-controlling interests (1,189) (1,184) – – (1,189) (1,184)
Own shares purchased – – – – – –
Net cash from/(used in) financing activities 56 (2,562) – 197 56 (2,365)
Intra-Group funding and intercompany transactions 104 207 (104) (207) – –
Net increase/(decrease) in cash and cash equivalents 957 (281) (570) 475 387 194
Cash and cash equivalents at the beginning of the period 1,476 1,731 1,055 580 2,531 2,311
Effect of foreign exchange rate changes (105) 26 – – (105) 26
Cash and cash equivalents at the end of the period 2,328 1,476 485 1,055 2,813 2,531
Less cash held in disposal group2 (307) (19) – – (307) (19)
Cash and cash equivalents not held in disposal group 2,021 1,457 485 1,055 2,506 2,512
Notes1 Tesco Bank profit before tax is per Tesco Bank Income Statement. 2 This relates to the cash held within our discontinued operations reported within assets of the disposal group.
The above is not a primary statement, nor a note to the financial statements. It does not replace the Group Cash Flow but is supplementary information to aid understanding.
Group cash flow
134 Tesco PLC Annual Report and Financial Statements 2014
Supplementary information (unaudited) continued

Continuing operations Discontinued operations Retail
2014£m
2013£m
2014£m
2013£m
2014£m
2013£m
Operating profit 2,489 2,265 (925) (1,451) 1,564 814
Depreciation and amortisation and net impairment of property, plant and equipment and intangible assets 2,156 1,465 42 677 2,198 2,142
(Profits)/losses arising on property-related items (232) 161 162 288 (70) 449
(Profit)/loss arising on sale of non property-related items (1) 4 – – (1) 4
Loss arising on sale of subsidiaries and other investments 1 – – 35 1 35
Impairment of goodwill – 495 540 80 540 575
Impairment of other investments 42 – – – 42 –
Adjustment for non-cash element of pensions charge 11 (4) – – 11 (4)
Additional contribution into pension scheme (4) (180) – – (4) (180)
Share-based payments 41 56 5 (2) 46 54
Cash flow from operations excluding working capital 4,503 4,262 (176) (373) 4,327 3,889
Decrease/(increase) in working capital 243 (253) 37 252 280 (1)
Cash generated from operations 4,746 4,009 (139) (121) 4,607 3,888
Interest paid (475) (421) (15) (27) (490) (448)
Corporation tax paid (594) (521) (18) (19) (612) (540)
Net cash generated from operating activities 3,677 3,067 (172) (167) 3,505 2,900
Purchase of property, plant and equipment, investment property and intangible assets (2,500) (2,559) (274) (291) (2,774) (2,850)
Memo: Free cash flow 1,177 508 (446) (458) 731 50
The above is not a primary statement, nor a note to the financial statements. It does not replace the Group Cash Flow but is supplementary information to aid understanding.
Retail cash flow
Tesco PLC Annual Report and Financial Statements 2014 135
Oth
er info
rmatio
nG
overnan
ceFin
ancial statem
ents
Strateg
ic repo
rt

1.0
0.5
0.0
(0.5)
(1.0)
(1.5)
(2.0)
(2.5)
(3.0)
(3.5)
% g
row
th
Q1 11/12 Q2 11/12 Q3 11/12 Q4 11/12 Q1 12/13 Q2 12/13 Q3 12/13 Q4 12/13 Q1 13/14 Q2 13/14 Q3 13/14 Q4 13/14
Inc. Petrol Exc. Petrol
First Half 2013/14
26 wks to 24/08/13
%
Second Half 2013/14
26 wks to 22/02/14
%
Full Year 2013/14
52 wks to 22/02/14
%
Full Year 2012/13
52 wks to 23/02/13
%
First Half 2013/14
26 wks to 24/08/13
%
Second Half 2013/14
26 wks to 22/02/14
%
Full Year 2013/14
52 wks to 22/02/14
%
Full Year 2012/13
52 wks to 23/02/13
%
Existing stores (0.9) (3.1) (2.0) (1.0) (0.5) (2.2) (1.3) (0.3)
Net new stores 2.0 1.9 1.9 2.8 2.2 2.1 2.1 2.9
Total 1.1 (1.2) (0.1) 1.8 1.7 (0.1) 0.8 2.6
UK quarterly like-for-like sales growth (exc. Petrol, exc. VAT, exc. IFRIC 13)
UK sales area by size of store
Tesco store size February 2014 February 2013
sq ft No. of stores Million sq ft % of total sq ft No. of stores Million sq ft % of total sq ft
0-3,000 1,648 3.9 10.2% 1,527 3.6 9.7%
3,001-20,000 319 4.0 10.5% 313 4.0 10.6%
20,001-40,000 300 8.9 23.4% 299 8.9 23.9%
40,001-60,000 170 9.0 23.5% 165 8.7 23.3%
60,001-80,000 117 7.4 19.3% 113 7.1 19.1%
80,001-100,000 45 4.1 10.6% 43 3.9 10.5%
Over 100,000 9 1.0 2.5% 10 1.1 2.9%
2,608 38.3 100.0% 2,470 37.4 100.0%
Dotcom only
Over 60,000 6 0.7 5 0.6
Other
One Stop (inc. Franchise) 730 1.2 639 1.0
Dobbies 34 1.6 32 1.5
Total (inc. Franchise) 3,378 41.8 3,146 40.5
UK sales performance (inc. VAT, exc. IFRIC 13)
136 Tesco PLC Annual Report and Financial Statements 2014
Supplementary information (unaudited) continued

Sales growth (inc. VAT) Revenue (exc. VAT)
Constant rates Actual rates
Continuing operationsLike–for–like
%
Net new stores
%Total
%Total
%
In local currency
m £m
Average exchange
rate
Closing exchange
rate
MalaysiaTYLY
––
26
26
(1)5
4,6754,591
931937
5.0214.900
5.5094.733
South KoreaTYLY
(4)(5)
45
––
3(1)
9,420,7549,421,714
5,4745,311
1,7211,774
1,7921,656
ThailandTYLY
(6)3
913
316
316
188,348183,470
3,8363,742
49.1049.03
54.3845.57
IndiaTYLY
2925
(2)–
2725
1611
6,4074,884
6857
94.2285.68
103.982.84
Czech RepublicTYLY
(4)(7)
15
(3)(2)
(4)(10)
40,31642,009
1,2981,356
31.0630.98
33.2629.38
Hungary1TYLY
1(1)
(2)1
(1)–
–(9)
563,741569,648
1,5971,606
353.0354.7
376.9337.7
PolandTYLY
(3)(4)
45
11
4(5)
11,20911,150
2,2592,176
4.9625.124
5.0474.797
SlovakiaTYLY
(5)(1)
37
(2)6
2(1)
1,3401,371
1,1341,114
1.1821.231
1.2151.154
TurkeyTYLY
(4)–
413
–13
(9)8
2,1122,123
679745
3.1102.850
3.6442.736
Republic of IrelandTYLY
(6)(1)
–3
(6)2
(2)(5)
2,6942,850
2,2792,315
1.1821.231
1.2151.154
Franchising2TYLY
n/an/a
n/an/a
n/an/a
n/an/a
259
217
1.1821.231
1.2151.154
Discontinued operations
ChinaTYLY
(4)(1)
57
16
59
14,50214,307
1,5041,431
9.64210.00
10.189.526
Notes1 Following the introduction of legislation preventing large retailers from selling tobacco in mid-July 2013, Hungary like-for-like growth is shown on an excluding
tobacco basis.2 Wholesale sales to F&F franchisees.
International sales performance (inc. Petrol, exc. IFRIC 13)
Tesco PLC Annual Report and Financial Statements 2014 137
Oth
er info
rmatio
nG
overnan
ceFin
ancial statem
ents
Strateg
ic repo
rt

Number of stores
2013year end
2014year end Net gain1
Openings
AcquisitionsClosures/ Disposals
Repurposing/ExtensionsH1 H2
UK (exc. Franchise) 3,146 3,370 224 78 125 33 (12) 2
Asia2 1,911 2,219 308 149 172 – (14) 50
Europe 1,365 1,374 9 20 28 – (39) 91
International (exc. Franchise) 3,276 3,593 317 169 200 – (53) 141
Group (exc. Franchise) 3 6,422 6,963 541 247 325 33 (65) 143
Franchise 231 342 111 43 85 – (16) 15
Group (inc. Franchise)3 6,653 7,305 652 290 410 33 (81) 158
Memo:China 131 134 3 5 2 – (4) –
Space – ‘000 sq ft
2013year end
2014year end Net gain
Openings
AcquisitionsClosures/ Disposals
Repurposing/ExtensionsH1 H2
UK (exc. Franchise) 40,495 41,813 1,318 549 884 58 (132) (41)
Asia2 31,280 33,197 1,917 721 1,172 – (31) 55
Europe 33,936 34,067 131 282 310 – (251) (210)
International (exc. Franchise) 65,216 67,264 2,048 1,003 1,482 – (282) (155)
Group (exc. Franchise)3 105,711 109,077 3,366 1,552 2,366 58 (414) (196)
Franchise 329 495 166 46 148 – (20) (8)
Group (inc. Franchise)3 106,040 109,572 3,532 1,598 2,514 58 (434) (204)
Memo:China 10,196 10,546 350 394 176 – (220) –
Notes1 Extensions/Repurposed stores are not included in the net gain for ‘number of stores’, since they are expansions/reductions in the space of existing stores.2 China is excluded from Asia’s store and space numbers.3 China is excluded from Group store and space numbers.
Group space summary
138 Tesco PLC Annual Report and Financial Statements 2014
Supplementary information (unaudited) continued

Number of stores
2013year end
2014year end Net gain1
Openings
AcquisitionsClosures/ Disposals
Repurposing/ExtensionsH1 H2
Extra 238 247 9 4 5 – – 2
Homeplus 12 12 – – – – – –
Superstore 481 482 1 3 2 – (4) –
Metro 192 195 3 1 5 – (3) –
Express 1,547 1,672 125 54 74 – (3) –
Dotcom only 5 6 1 – 1 – – –
Total Tesco (exc. Franchise) 2,475 2,614 139 62 87 – (10) 2
One Stop 639 722 83 16 36 33 (2) –
Dobbies 32 34 2 – 2 – – –
Total UK (exc. Franchise) 3,146 3,370 224 78 125 33 (12) 2
Franchise – One Stop – 8 8 – 8 – – –
Total UK (inc. Franchise) 3,146 3,378 232 78 133 33 (12) 2
Space – ‘000 sq ft
2013year end
2014year end Net gain
Openings
AcquisitionsClosures/ Disposals
Repurposing/ExtensionsH1 H2
Extra 17,051 17,610 559 295 305 – – (41)
Homeplus 523 523 – – – – – –
Superstore 14,053 14,110 57 92 60 – (95) –
Metro 2,145 2,191 46 9 61 – (24) –
Express 3,588 3,883 295 125 178 – (8) –
Dotcom only 604 716 112 – 112 – – –
Total Tesco (exc. Franchise) 37,964 39,033 1,069 521 716 – (127) (41)
One Stop 991 1,142 151 28 70 58 (5) –
Dobbies 1,540 1,638 98 – 98 – – –
Total UK (exc. Franchise) 40,495 41,813 1,318 549 884 58 (132) (41)
Franchise – One Stop – 10 10 – 10 – – –
Total UK (inc. Franchise) 40,495 41,823 1,328 549 894 58 (132) (41)
Note1 Extensions/Repurposed stores are not included in the net gain for ‘number of stores’, since they are expansions/reductions in the space of existing stores.
For a list of UK store openings, information can be found within the Analyst pack on our website at www.tescoplc.com.
UK space summary
Tesco PLC Annual Report and Financial Statements 2014 139
Oth
er info
rmatio
nG
overnan
ceFin
ancial statem
ents
Strateg
ic repo
rt

Number of stores
2013 year end
2014year end Net gain1
Openings
AcquisitionsClosures/ Disposals
Repurposing /ExtensionsH1 H2
Malaysia Hypermarket 47 49 2 – 2 – – –
Other – – – – – – – –
South Korea Hypermarket 133 139 6 3 3 – – –
Other 298 294 (4) 3 3 – (11) 1
Thailand Hypermarket 149 160 11 3 8 – – 5
Other 1,284 1,577 293 140 156 – (3) 44
Total Asia Hypermarket 329 348 19 6 13 – – 5
Other 1,582 1,871 289 143 159 – (14) 45
Total Asia (exc. Franchise) Total 1,911 2,219 308 149 172 – (14) 50
Franchise South Korea 89 198 109 42 77 – (9) (1)
Total Asia (inc. Franchise) Total 2,000 2,417 417 191 249 – (23) 49
Memo: China Hypermarket 117 119 2 3 2 – (3) –
Other 14 15 1 2 – – (1) –
Space – ‘000 sq ft
2013 year end
2014year end Net gain
Openings
AcquisitionsClosures/ Disposals
Repurposing /ExtensionsH1 H2
Malaysia Hypermarket 3,918 4,029 111 – 111 – – –
Other – – – – – – – –
South Korea Hypermarket 12,108 12,662 554 280 274 – – –
Other 934 921 (13) 7 7 – (28) 1
Thailand Hypermarket 10,709 11,324 615 142 405 – – 68
Other 3,611 4,261 650 292 375 – (3) (14)
Total Asia Hypermarket 26,735 28,015 1,280 422 790 – – 68
Other 4,545 5,182 637 299 382 – (31) (13)
Total Asia (exc. Franchise) Total 31,280 33,197 1,917 721 1,172 – (31) 55
Franchise South Korea 188 356 168 45 137 – (13) (1)
Total Asia (inc. Franchise) Total 31,468 33,553 2,085 766 1,309 – (44) 54
Memo: China Hypermarket 10,165 10,490 325 366 175 – (216) –
Other 31 56 25 28 1 – (4) –
Note1 Extensions/Repurposed stores are not included in the net gain for ‘number of stores’, since they are expansions/reductions in the space of existing stores. South Korea and
Franchise totals include one store conversion that is therefore included in the net gain for ‘number of stores’.
Asia space summary
140 Tesco PLC Annual Report and Financial Statements 2014
Supplementary information (unaudited) continued

Number of stores
2013 year end
2014year end Net gain1
Openings
AcquisitionsClosures/ Disposals
Repurposing /ExtensionsH1 H2
Czech Republic Hypermarket 86 86 – – – – – 5
Other 148 125 (23) – 1 – (24) 84
Hungary Hypermarket 118 118 – – – – – 1
Other 98 102 4 2 2 – – –
Poland Hypermarket 82 86 4 3 1 – – –
Other 364 369 5 2 6 – (3) –
Slovakia Hypermarket 62 63 1 – 1 – – –
Other 74 87 13 7 6 – – –
Turkey Hypermarket 56 56 – – 1 – (1) –
Other 135 136 1 6 3 – (8) –
Republic of Ireland Hypermarket 13 14 1 – 1 – – –
Other 129 132 3 – 6 – (3) 1
Total Europe Hypermarket 417 423 6 3 4 – (1) 6
Other 948 951 3 17 24 – (38) 85
Total Europe (exc. Franchise) Total 1,365 1,374 9 20 28 – (39) 91
Franchise Czech Republic 142 136 (6) 1 – – (7) 16
Total Europe (inc. Franchise) Total 1,507 1,510 3 21 28 – (46) 107
Space – ‘000 sq ft
2013 year end
2014year end Net gain
Openings
AcquisitionsClosures/ Disposals
Repurposing /ExtensionsH1 H2
Czech Republic Hypermarket 4,627 4,474 (153) – – – – (153)
Other 1,324 1,230 (94) – 3 – (88) (9)
Hungary Hypermarket 6,753 6,704 (49) – – – – (49)
Other 576 584 8 4 4 – – –
Poland Hypermarket 5,737 5,958 221 177 44 – – –
Other 3,689 3,756 67 27 63 – (23) –
Slovakia Hypermarket 2,960 2,980 20 – 20 – – –
Other 862 920 58 28 30 – – –
Turkey Hypermarket 3,351 3,335 (16) – 39 – (55) –
Other 602 649 47 46 20 – (19) –
Republic of Ireland Hypermarket 821 880 59 – 59 – – –
Other 2,634 2,597 (37) – 28 – (66) 1
Total Europe Hypermarket 24,249 24,331 82 177 162 – (55) (202)
Other 9,687 9,736 49 105 148 – (196) (8)
Total Europe (exc. Franchise) Total 33,936 34,067 131 282 310 – (251) (210)
Franchise Czech Republic 141 129 (12) 1 – – (6) (7)
Total Europe (inc. Franchise) Total 34,077 34,196 119 283 310 – (257) (217)
Note1 Extensions/Repurposed stores are not included in the net gain for ‘number of stores’, since they are expansions/reductions in the space of existing stores.
Europe space summary
Tesco PLC Annual Report and Financial Statements 2014 141
Oth
er info
rmatio
nG
overnan
ceFin
ancial statem
ents
Strateg
ic repo
rt

Continuing operations1
Earnings20142
£m20132
£m
Profit before tax 2,259 2,057
Underlying profit before tax 3,054 3,280
TY ERT % LY ERT %
Tax on profit3 15.36% 25.72% (347) (529)
Tax on underlying profit3 15.36% 17.44% (469) (572)
Minority interest 4 4
Basic earnings 1,916 1,532
Underlying earnings 2,589 2,712
Shares
Shares in issue at start of year Million 8,054 8,032
SAYE and Executive Share Option Schemes Million 8 7
Shares issued and own shares purchased Million 15 3
Less: weighted average shares in trust Million (9) (9)
Basic weighted average number of shares Million 8,068 8,033
Weighted average number of options A Million 121 76
Average option price B Pence 321 311
Average share price C Pence 349 328
Dilutory number of shares [A x (C-B)/C] Million 10 4
Diluted weighted average number of shares Million 8,078 8,037
Basic earnings per share – continuing operations Pence 23.75 19.07
Diluted earnings per share – continuing operations Pence 23.72 19.06
Underlying basic earnings per share – continuing operations Pence 32.09 33.76
Underlying diluted earnings per share – continuing operations Pence 32.05 33.74
Underlying diluted earnings per share – continuing operations (constant tax) Pence 31.27 33.74
Notes1 Continuing operations excludes China, the US and Japan as discontinued operations.2 For the UK and the Republic of Ireland the results are for the 52 weeks ended 22 February 2014 (prior financial year 52 weeks ended 23 February 2013). For all other
operations the results are for the financial year ended 28 February 2014 (prior financial year ended 28 February 2013).3 Effective rate of tax on profit before tax for 2012/13 has been restated on a continuing operations basis.
The above is not a note to the financial statements. It does not replace Note 9 Earnings per share and diluted earnings per share but is supplementary information to aid understanding.
Earnings per share
142 Tesco PLC Annual Report and Financial Statements 2014
Supplementary information (unaudited) continued

Financial year end 2013/14 22 February 2014
Final ex-dividend date 30 April 2014
Final dividend record date 2 May 2014
Q1 Interim Management Statement 4 June 2014
Annual General Meeting 27 June 2014
Final dividend payment date 4 July 2014
Half-year end 2014/15 23 August 2014
Interim Results 1 October 2014
Q3 Interim Management Statement 3 December 2014
Financial year end 2014/15 28 February 2015
Please note that these dates are provisional and subject to change.
The 2014/15 financial year will comprise of 53 weeks.
Adjusted net debtNet debt plus the deficit in the pension schemes plus the present value of future minimum rentals payable under non-cancellable operating leases (discounted at 7%).
Capex % of salesCapital expenditure as defined below, divided by Group sales including VAT and excluding IFRIC 13.
Capital expenditureThe additions to property, plant and equipment, investment property and intangible assets (excluding assets acquired under business combinations).
Colleagues being trained for their next roleThe proportion of colleagues who are receiving training for their next role.
Colleague retentionThe proportion of colleagues with over one year’s service who have worked for Tesco in the UK throughout the year.
Constant tax rate Using the prior year’s effective tax rate.
Donation of pre-tax profits to charities and good causesOur contribution to charities and good causes through direct donations, cause-related marketing, gifts-in-kind, staff time and management costs.
EBITDAROperating profit before depreciation, amortisation, rent and movements in impairments of property, plant and equipment, investment property and intangible assets.
Fixed charge coverThe ratio of EBITDAR (excluding Tesco Bank EBITDAR) divided by financing costs (net interest including capitalised interest and excluding IAS 32 and 39 impacts and pension finance costs) plus operating lease expenses.
GearingNet debt divided by total equity.
Net debtNet debt excludes the net debt of Tesco Bank but includes that of the discontinued operations. Net debt comprises bank and other borrowings, finance lease payables, net derivative financial instruments, joint venture loans and other receivables and net interest receivables/payables, offset by cash and cash equivalents and short-term investments.
Net indebtednessThe ratio of adjusted net debt divided by EBITDAR (excluding Tesco Bank EBITDAR) from continuing operations.
Partner viewpointThe partner viewpoint survey is our annual survey of suppliers. In this report we have stated the percentage of positive scores from respondents when we asked whether Tesco treats them with respect.
Reduction in CO2e emissions from existing stores and distribution centres
The year-on-year reduction in greenhouse gas emissions per square foot from our stores and distribution centres across the Group against a 2006/07 baseline.
Return on capital employedReturn divided by the average of opening and closing capital employed.
Return: Profit (excluding the impact of one-off property and customer redress charges) before interest after tax (applied at the effective rate of tax).
Capital employed: Net assets (excluding the impact of current year one-off property and customer redress charges) plus net debt plus dividend creditor less net assets held for resale and discontinued operations.
Return on capital employed (proforma)In the year, a proforma return on capital employed has been presented as defined below:
Return divided by the average of opening and closing capital employed.
Return: Profit (excluding the impact of one-off property and customer redress charges) before interest after tax (applied at the effective rate of tax) including Chinese operations (excluding fair value re-measurement adjustments), excluding US operations.
Capital employed: Net assets (excluding the impact of current year one-off property and customer redress charges) plus net debt plus dividend creditor less net assets held for resale, including Chinese operations (excluding fair value re-measurement adjustments), excluding US operations.
Total shareholder returnThe notional annualised return from a share, measured as the percentage change in the share price, plus the dividends paid with the gross dividends reinvested in Tesco shares. This is measured over both a one and five-year period. For example, five-year total shareholder return for 2013/14 is the annualised growth in the share price from 2008/09 and dividends paid and reinvested in Tesco shares, as a percentage of the 2008/09 share price.
Trading profitTrading profit is an adjusted measure of operating profit and measures the performance of each segment before profits/losses arising on property-related items, the impact on leases of annual uplifts in rent and rent-free periods, intangible asset amortisation charges and costs arising from acquisitions, and goodwill impairment and restructuring and other one-off costs. The IAS 19 pension charge is replaced with the ‘normal’ cash contributions for pensions. An adjustment is also made for the fair value of customer loyalty awards.
Underlying diluted earnings per shareUnderlying profit less tax at the effective tax rate and minority interest divided by the diluted weighted average number of shares in issue during the year.
Underlying profit before taxUnderlying profit before tax excludes the impact of non-cash elements of IAS 17, 19, 32 and 39 (principally the impact of annual uplifts in rents and rent-free periods, pension costs, and the marking to market of financial instruments); the amortisation charge on intangible assets arising on acquisition and acquisition costs, and the non-cash impact of IFRIC 13. It also excludes profits/losses on property-related items and restructuring and other one-off costs.
Oth
er info
rmatio
nG
overnan
ceFin
ancial statem
ents
Strateg
ic repo
rt
Tesco PLC Annual Report and Financial Statements 2014 143
Financial calendar
Glossary

2010 20113 20122 20131 20141
Financial statistics (£m)
Sales including VAT excluding IFRIC 13 62,537 67,074 71,402 70,712 70,894
Revenue excluding IFRIC 13
UK 39,104 40,766 42,803 43,582 43,570
Europe 8,724 9,192 9,866 9,319 9,267
Asia 8,465 9,802 10,828 10,045 10,309
US 349 495 – – –
Tesco Bank 860 919 1,044 1,021 1,003
Group revenue excluding IFRIC 13 57,502 61,174 64,541 63,967 64,149
Trading profit
UK 2,413 2,504 2,478 2,272 2,191
Europe 474 527 529 329 238
Asia 440 605 737 733 692
US (165) (186) – – –
Tesco Bank 250 264 225 191 194
Group trading profit 3,412 3,714 3,969 3,525 3,315
Operating profit4 3,457 3,917 4,182 2,382 2,631
Operating profit margin4 6.0% 6.4% 6.5% 3.7% 4.1%
Share of post-tax profits of joint ventures and associates 33 57 91 72 60
Net finance costs (314) (333) (235) (397) (432)
Profit before tax 3,176 3,641 4,038 2,057 2,259
Taxation (840) (864) (874) (529) (347)
Profit for the year from continuing operations 2,336 2,777 3,164 1,528 1,912
Discontinued operations – (106) (350) (1,504) (942)
Profit for the period 2,336 2,671 2,814 24 970
Attributable to:
Owners of the parent 2,327 2,655 2,806 28 974
Non-controlling interests 9 16 8 (4) (4)
Underlying profit before tax – continuing operations5 3,39518 3,85318 4,14918 3,280 3,054
Other financial statistics
Diluted earnings per share – continuing operations 29.19p 34.25p 39.23p 19.06p 23.72p
Underlying diluted earnings per share – continuing operations 31.66p 36.26p 40.31p 33.74p 32.05p
Dividend per share6 13.05p 14.46p 14.76p 14.76p 14.76p
Return on capital employed (‘ROCE’)7 12.1% 12.9%9 14.7%10 14.5%19 13.6%19
Total shareholder return8 9.5% 6.7% (3.0)% 2.1% 3.7%
Net debt (£m) 7,929 6,790 6,838 6,597 6,597
Enterprise value (£m)11 41,442 39,462 32,324 36,578 33,597
Group retail statistics
Number of stores 4,83614 5,26512 6,049 6,653 7,305
Total sales area – 000 sq ft13 95,23115 103,17212 110,563 106,040 109,572
Average employees 472,094 488,347 514,615 506,856 510,444
Average full-time equivalent employees 366,413 382,049 401,791 388,375 391,868
UK retail statistics
Number of stores 2,507 2,715 2,979 3,146 3,378
Total sales area – 000 sq ft13 34,237 36,722 39,082 40,495 41,823
Average full-time equivalent employees 196,604 200,966 205,852 213,304 217,158
Revenue per employee – £16 198,897 202,850 207,931 204,319 200,637
Weekly sales per sq ft – £17 25.22 24.95 24.86 24.15 23.331 During the financial year, the Group decided to sell its operations in China. Accordingly, these operations have been treated as discontinued in 2014.
The 2013 values have been re-presented to be consistent with 2014 and they have also been represented to account for the impact of IAS 19. Prior years have not been re-presented.
2 Excludes Japan and the US.3 Excludes Japan.4 Operating profit includes restructuring costs and profit arising on sale of fixed assets. Operating margin is based upon revenue excluding IFRIC 13.5 See glossary for definitions. 6 Dividend per share relating to the interim and proposed final dividend.7 Return on capital employed is profit before interest and tax less tax at the effective rate of tax divided by the calculated average of opening and closing net assets plus net
debt plus dividend creditor less net assets held for resale.8 See glossary for definitions. Measured over a 5 year period.9 Includes Japan and the US.10 Includes the US.11 Market capitalisation plus net debt.12 Includes franchise stores but excludes Japan.13 Store sizes exclude lobby and restaurant areas. 14 Restated to include Dobbies stores. 15 Restated to include Dobbies stores and account for a space restatement of 109,000 sq ft driven by a comprehensive remeasurement of One Stop stores.16 Based on average number of full-time equivalent employees in the UK and revenue excluding IFRIC 13.17 Based on weighted average sales area and average weekly sales, excluding Dobbies stores.18 Includes Profits/Losses on property-related items.19 Excludes China.
144 Tesco PLC Annual Report and Financial Statements 2014
Five-year record