tesla company review - october 2016
TRANSCRIPT

TESLA COMPANY REVIEW
OLMANEXTLTD|OCTOBER2016
Along with traditional financial analysis, from time to time OLMA Next Ltd commissions independent researchers to prepare challenging studies and reviews connected with potential investment ideas and projects.
This company review has been prepared by Frédéric Bonelli at the request of OLMA Next Ltd.
We are pleased to share this work about Tesla Motors Inc (TSLA) with you. We hope it will provide you with sufficient data and insight to help you gain a more thorough understanding of the big picture behind this Californian luxury electric car manufacturer which might possibly change the car industry and more.
2
ABOUT THIS WORK
OLMA Next Ltd is contemplating the launch of a fund focused on future blue chip stocks. With a combination of youth and experience, OLMA Next Ltd plans to scrutinise a number of high performing stocks on the American, European and Asian markets over the coming months.
www.olmafund.com
OLMA Next Ltd
You are welcome to share and adapt this work
Please cite this document: fredbonelli.com, Tesla Motors Inc., Company Review, Sept 2016
You may distribute a modified version of this work subject to the consent of Frédéric Bonelli
Frédéric Bonelli is an independent research consultant and VC entrepreneur who prepares content about trends and companies for funds and investors. He also helps start-ups and SMEs to produce corporate support materials to help with fundraising and other promotional activities.
Frédéric Bonelli

TESLA COMPANY REVIEW
OLMANEXTLTD|OCTOBER2016 3
TESLA MOTORS INC.
TESLA HAS ADOPTED DIGITAL TECHNOLOGIES LIKE A TRUE DIGITAL T H O R O U G H B R E D E S P E C I A L LY I N B R A N D M A R K E T I N G A N D FUNDRAISING. IT HAS DISRUPTED THE TRADITIONAL PATHS TAKEN BY CARMAKERS AND AIMS TO BECOME THE FIRST FULLY VERTICALLY INTEGRATED ENERGY COMPANY

TESLA COMPANY REVIEW
OLMANEXTLTD|OCTOBER2016 4
INTRODUCTION
Much more than just an electric car manufacturer
Tesla Motors’ share price increased from $27 to $250 between January 2012 and October 2014. Its price to sales ratio is more than 6 while those of traditional carmakers are less than 0.5. Tesla is not a simple electric vehicle designer and manufacturer, just as Apple was not simply a PC brand in 2000 and was not just an mp3 producer in 2001. Comparing Tesla to other car manufacturers is like comparing Apple to IBM.
Elon Musk, the man behind the story, really does “think differently”: Money is not the problem Nothing is impossible, until it really is Nothing is too far from the core business as long as it serves it Acceleration is the key, at almost any price or level of risk Goal delivery date is just a management/fundraising trick Late is meaningless as long as you deliver a tremendously good product If the market is not there yet, create it
Due to the infancy of the EV2 market, Tesla’s strategy is to push across all fields: Software: proprietary vehicle autopilot technologyEnergy: battery production and sales (Gigafactory) Recharging infrastructure: worldwide supercharger network Services: from vehicle after sale service to Tesla Mobility, the “PtoP taxi service”
Tesla manages a progressive focus shift from “sustainable transport” to “sustainable energy”:
SolarCity acquisition for PV cell production and installation - yet to complete, subject to shareholder approval Solar roofs for home, utilities and cars Solar farms to sustain electricity demand off the grid Battery packs for home, commercial and utilities
Software
Vehicles
Batteries
PV1 Cells
ELECTRICITY TRANSPORTATION
SOLARCITY
GIGAFACTORY
BTOB
BTOCfor the home:
Powerwall
for commercial and utilities: Powerpack
for carmakers: Batteries
vehicles: Chassis I: Roadster Chassis II: Model S, Model X Chassis III: Model 3, Model Y
services: SuperCharger Network Tesla Mobility (PtoP taxi service)
for carmakers: Electric Powertrain
TESLA MOTORS INC.
CLIENTS: Amazon AWS, Smart, Daimler, Toyota
1 PV: Photovoltaic 2 EV: Electric Vehicle

TESLA COMPANY REVIEW
OLMANEXTLTD|OCTOBER2016
GIGAFACTORYNEVADA
SOLARCITYSAN MATEO
PV CELLS
FREEMONT
VEHICLES
FACTORIES
Cars: Model S, Model X, Model 3Software: Tesla mobility
BATTERIES
HEADQUARTERS
PALO ALTO
For cars: Battery packFor homes: PowerwallFor utilities: Powerpack
For cars: EV solar roofFor homes: Solar RoofFor utilities: Solar RoofSolar Farm: direct to the grid
SUPERCHARGERS
For cars: Charger stations
5
BUSINESS GLOBAL OVERVIEW
SUPERCHARGER STATIONS
POWERPACK POWERWALL
EV BATTERY
EV SOLAR ROOF
HOME SOLAR ROOF
CHARGERS SOLAR ROOF
UTILITY SOLAR ROOF AUTOPILOT
Beyond EV manufacturing, the vision of Elon Musk for Tesla Motors is to create the first fully vertically integrated energy company, from energy generation to installation to storage to application. Tesla will generate power from the sun, store energy in batteries and use batteries to power vehicles and buildings.
Such a plan requires a sharp focus on vertical integration and a willingness to build huge production facilities.
PV CELLS
SOLAR WIND COAL NUCLEAR
TESLA MOTORS INC.TSLA (NASDAQ)
TESLA COMPANY REVIEW
OLMANEXTLTD|OCTOBER2016 6
TO DATE
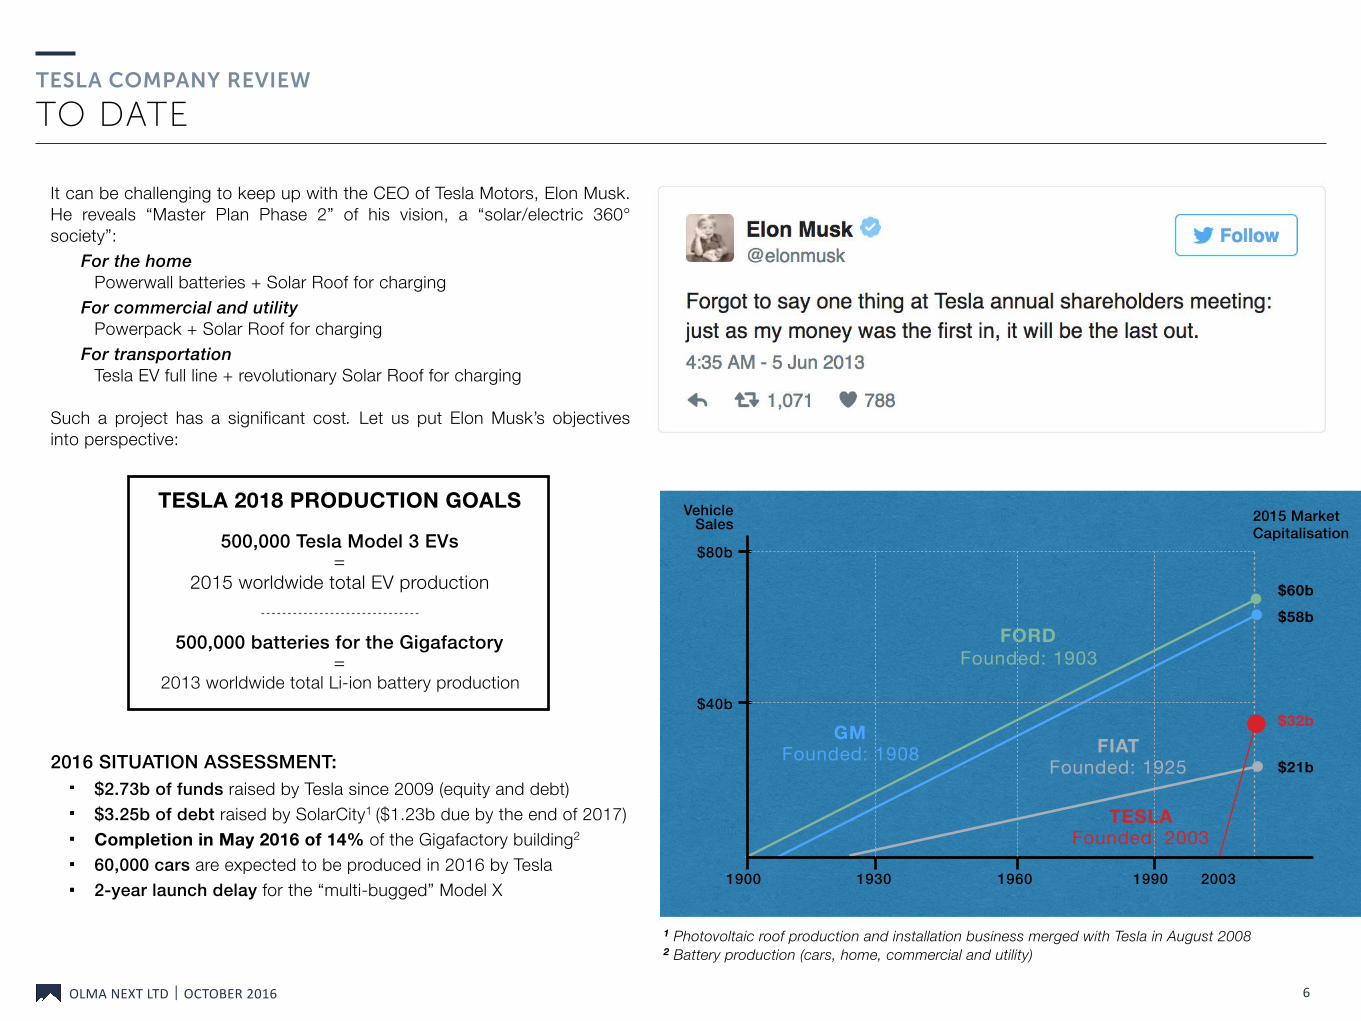
It can be challenging to keep up with the CEO of Tesla Motors, Elon Musk. He reveals “Master Plan Phase 2” of his vision, a “solar/electric 360° society”:
For the home Powerwall batteries + Solar Roof for charging
For commercial and utility Powerpack + Solar Roof for charging
For transportation Tesla EV full line + revolutionary Solar Roof for charging
Such a project has a significant cost. Let us put Elon Musk’s objectives into perspective:
TESLA 2018 PRODUCTION GOALS
500,000 Tesla Model 3 EVs =
2015 worldwide total EV production
500,000 batteries for the Gigafactory =
2013 worldwide total Li-ion battery production
2016 SITUATION ASSESSMENT: $2.73b of funds raised by Tesla since 2009 (equity and debt) $3.25b of debt raised by SolarCity1 ($1.23b due by the end of 2017) Completion in May 2016 of 14% of the Gigafactory building2 60,000 cars are expected to be produced in 2016 by Tesla 2-year launch delay for the “multi-bugged” Model X
$80b
$40b
1900 1930 1960 1990
$60b
$58b
$32b
$21b
2015 Market Capitalisation
TESLA Founded: 2003
2003
1 Photovoltaic roof production and installation business merged with Tesla in August 2008 2 Battery production (cars, home, commercial and utility)
Vehicle Sales
GM Founded: 1908
FORD Founded: 1903
FIAT Founded: 1925
TESLA COMPANY REVIEW
OLMANEXTLTD|OCTOBER2016
370,000 Model 3 reservations with
down payment only (equivalent of $14b
in future sales)
Model 3 unveiled
7
TIMELINE
’03 ’06 ’07 ’08 ’10’09 ’12’11 ’13 ’14 ’15 ’16 ’20
FOUNDED
’17
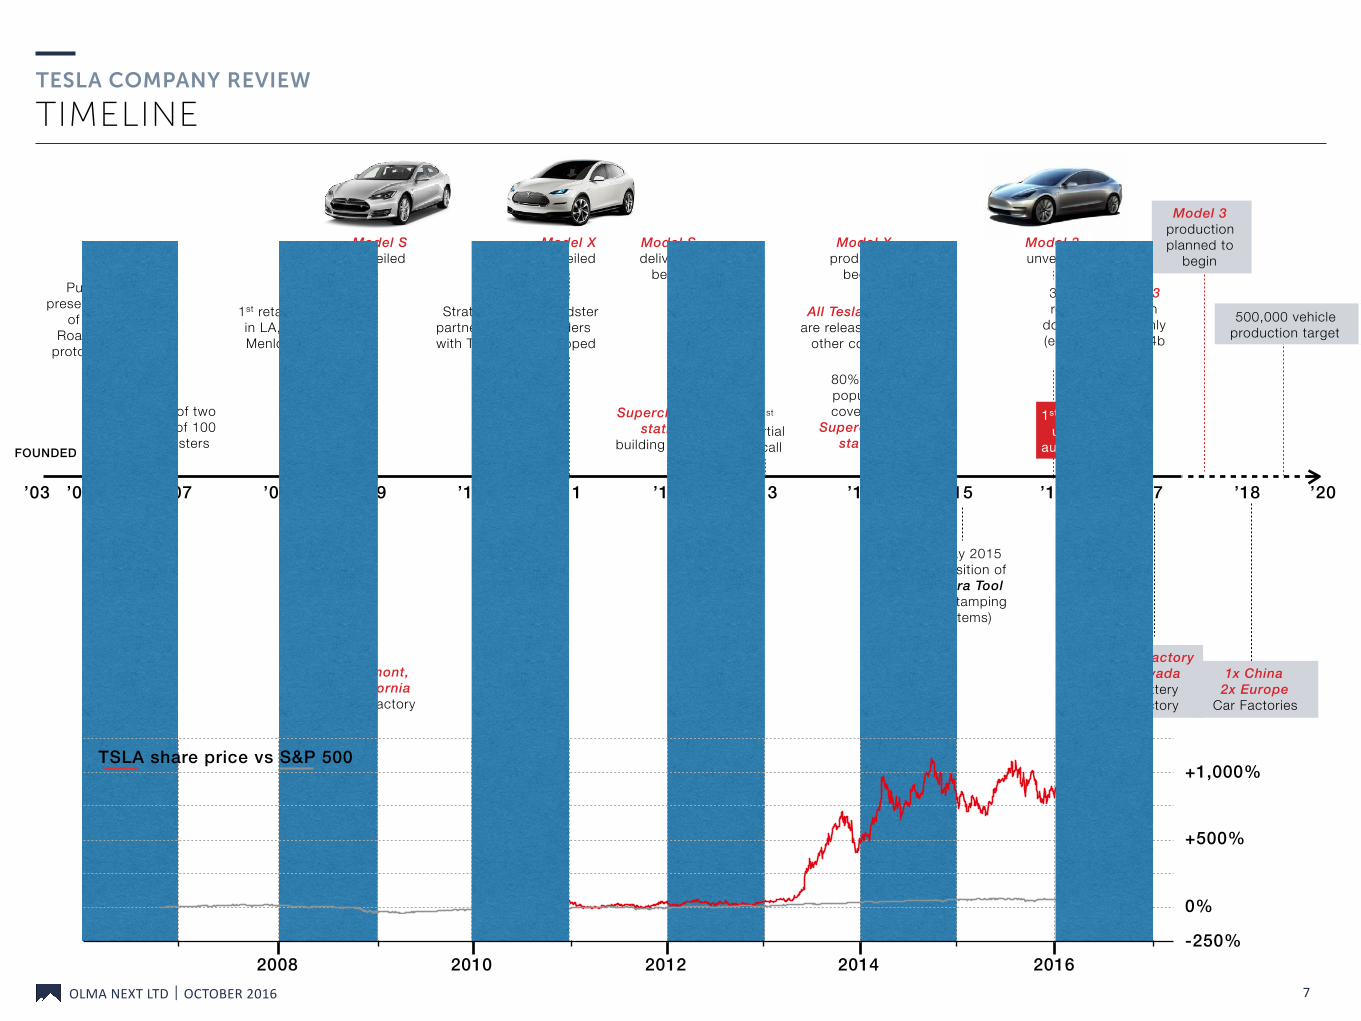
Public presentation
of the Roadster
prototypes
Sale of two sets of 100 roadsters
1st retail store in LA, 2nd in Menlo Park
Model S unveiled
Strategic partnership with Toyota
Roadster orders
stopped
Model X unveiled
Model S deliveries
begin
1st partial recall
Model X production
begins
80% of US population covered by
Supercharger stations
Supercharger station
building begins
8 May 2015 Acquisition of Riviera Tool (die stamping
systems)
’18
All Tesla Patents are released free for
other companies
Fremont, California
Car Factory
1st partial recall
1st death using
autopilot
+1,000%
+500%
0%
-250%20162014201220102008
TSLA share price vs S&P 500
1x China 2x Europe
Car Factories
Gigafactory Nevada Battery Factory
Model 3 production planned to
begin
500,000 vehicle production target
29 June 2010 IPO
on NASDAQ
22 June 2016 Acquisition of
SolarCity announced for $2.6b in Tesla
shares

TESLA COMPANY REVIEW
OLMANEXTLTD|OCTOBER2016 8
1/7 MARKET, ASSETS & PRODUCTS: PRODUCTION SITE & HR
Car factory
The Fremont factory in California is one of the largest buildings in the world with 5.3 million square feet of manufacturing and office space. Tesla has been acquiring space in other locations close to the factory to expand its operations, adding a total of over 1 million square feet of production or warehouse space in the region. In June 2016, Tesla appointed Peter Hochholdinger as Vice President of Vehicle Production. He was previously responsible for leading the production of Audi’s A4, A5 and Q5 vehicles, including 14 derivatives of those models and managed production of about 400,000 vehicles annually at Audi.
But Greg Reichow, Tesla's Vice President of Production and one of its highest-paid executives and Josh Ensign, Vice President of Manufacturing, left Tesla. This brings to five the total number of Tesla vice presidents who left the company in 2016. Expansion of factory operations will mean tooling up new production lines, which will cost significant amounts (more than the down payments received for around 370,000 Model 3 at $1,000 each). Now that Tesla has delivered the ”Proof of Concept”, and the potential for a rising EV mass market if vehicle design and performance is equal to that of ICE1 cars, all carmakers have announced EV launches for 2018-2020 with significant R&D budgets: timing is now the key.
2012 2014 2016 2018e 2020e
100k
200k
300k
400k
500k
TESLA VS FORD MODEL T PRODUCTION MILESTONES
2012 2014 2016 2020e 2022e
200k
400k
600k
800k
2018e
WORLDWIDE DEMAND FOR ELECTRIC PASSENGER CARS
2024e
Tesla Motors sales and forecast
Ford Model T 1909-1916
1 ICE: Internal Combustion Engine
Nº of Vehicles
Tesla Motors key figures: Fundraising and Debt: $2.73b Factory production: 60,000 vehicles expected for 2016 2018 vehicle battery production goal: 500,000 vehicles -
-
Nº of Vehicles

TESLA COMPANY REVIEW
OLMANEXTLTD|OCTOBER2016 9
2/7 MARKET, ASSETS & PRODUCTS: SALES, CHARGING NETWORK & BATTERIES
Tesla car sales
Now that other carmakers plan on investing significantly in EV to fill in the gap, how long will Tesla cars remain the best EVs on the market? Why could Tesla become the leading brand in the EV market from scratch in less than a decade? Is the ”Open Source Patent strategy” a major mistake or a masterstroke from the visionary Musk?
Here are some facts and figures to help build answers to these questions.
1. Supercharger network Tesla has invested heavily in its charger network. It plans to double its supercharger network in 2017, reaching 1,300 stations worldwide (North America, Europe and the Asia-Pacific regions) with a total of more than 7,000 individual chargers. Tesla also regularly updates its charger technology, which is by far the world’s fastest recharging system. This system enables recharging of a Model S giving up to 160 miles autonomy in less than 30 minutes. Charging is currently free for any Tesla owner.
2. Price/range ratio and battery technology Until 2016, Tesla had the lowest price to range ratio in the market: this is the result of all Tesla technologies combined and especially the proprietary battery design.
No other carmaker is managing its own battery technology and production and thus they depend upon availability from suppliers. This will be a problem when the EV market gathers pace.
Tesla is on the way to resolving the production delay issue of its Gigafactory. This should give Tesla a strong advantage to bring operational costs down and maintain the cheapest cell cost in the EV industry.
The cost of the battery equals 25% of the total price of an EV in 2016. This is why Chevrolet had to lower the autonomy of its Volt model to compete with Tesla’s Model 3 price.
Car Price*
THE ELECTRIC CAR MARKET WORLDWIDE 2016
150
$25k
$100k
3000Range
(in miles)
Q1:EXPENSIVE
LOW RANGE
Q2:EXPENSIVE
GOOD RANGE
Q3:AFFORDABLELOW RANGE
Q4:AFFORDABLEGOOD RANGE
Ford Focus ElectricChevy Spark
Nissan Leaf
Chevy Volt ‘17
Tesla Model 3
Tesla Model S
VW E-GolfKia Soul EV
BMW i3
Tesla Model X
*after tax credit
Tesla Supercharger Network: no other carmaker has done this yet. It is now free for life for any Tesla customer. This is a huge competitive advantage. There are 90,000 service stations in the US, while EV charging stations have now reached 40,000 (ChargingPoint + Tesla)
-

TESLA COMPANY REVIEW
OLMANEXTLTD|OCTOBER2016 10
3/7 MARKET, ASSETS & PRODUCTS: STRATEGY, MARKET & IP
3. Top down strategy Classical disruption theory suggests that most entrants start at the bottom of the performance curve and slowly work their way up until they can eventually overtake incumbent technologies. With the Supersport Luxury Liftback Model S, Tesla started at the absolute top of the performance curve. This strategy has worked incredibly well for the carmaker as it continues to execute on its vision.
4. EV focused and market momentum Tesla Motors is the only sizeable carmaker focused solely on EVs1 and the only EV company to own both battery technology and a production facility. All trends and studies confirm high market demand for lithium-ion batteries over the next 5 years. They also predict significant technological advances that will lower price and recharge time as well as increasing power and overall lifetime. Thus the Panasonic co-owned Gigafactory has a strong competitive advantage.
5. Open Source patents In June 2014, Elon Musk stated that all Tesla patents will become “Open Source”, meaning that any person may freely use one or several of them. It is most likely that he will deliver on his promise but it is interesting to read between the lines:
No patent has been canceled so far Do not confuse patent with trade secret: some parts of the Tesla factory and the Gigafactory will never be open to the public With an industrial open patent portfolio, it is a case of releasing the technology “as-is”; Tesla has probably already exceeded released patents in terms of technological progress
6. Partnerships Until the establishment of the Gigafactory with Panasonic, Tesla had partnered with Daimler and Toyota, which built electric powertrain units for some of their future EVs. These partnerships were seen as a sign of maturity and acknowledgment for Tesla as a car company. They both invested in Tesla shares and both have exited with huge cash-outs1. 1 Daimler’s investment of $50 million in May 2009 turned into over $780 million.
0 20k 40k 60k
Other
USA
Europe
Japan
China
PLUG-IN VEHICLES (xEV) SALES VOLUME AND % GROWTH
4321
118
4838
2723
33
+102%
+36%
+27%
+19%
+0%
Number of Units Sold
2016 Q1 2015 Q1
7. Sales strategy Part of Tesla's competitive advantage relates to its unique approach to sales. Instead of offering vehicles through conventional dealerships, the company has created a direct sales approach that involves the concept of sales malls where consumers can view and inquire about the vehicles. This drives a number of competitive advantages:
• better contact with customers • no inventory needed • controlled advertising • savings on dealer’s fees

TESLA COMPANY REVIEW
OLMANEXTLTD|OCTOBER2016 11
4/7 MARKET, ASSETS & PRODUCTS: MODEL 3 LAUNCH
Tesla Model 3 - The Big Leap forward
The Tesla Model 3, an all-electric four-door compact luxury sedan, was unveiled on 31 March 2016. The first 100,000 units were pre-booked before the public presentation. No one had seen, let alone driven one. All the public knew was that prices start at $35,000, the range would be 200+ miles, a cash deposit of $1,000 was required and deliveries would start in late 2017, though a 12-24 month delay is probable.
After the first public showing and over the following 3 weeks, reservations approached 400,000 units. After reductions for bogus bookings, the official number of reservations published in Tesla’s quarterly SEC filings was 373,000. The current tally is probably a lot higher.
The demand is comparable to the annual global sales of Audi A4, BMW 3-Series and Mercedes C-Class combined. This indicates the potential for EVs with competitive price, style, space, acceptable range, superior performance and efficiency.
“In roughly one year since our last visit, the progress witnessed is truly stunning.”
JAMES ALBERTINE - STIFEL ANALYST - MARCH 2016
2012 2014 2016 2018 2020
100k
200k
300k
400k
500k
TESLA HISTORICAL AND FORECAST PRODUCTION VOLUMES
Roadster Model S Model X Model 3
US ELECTRIC CAR SALES YTD AUG 2016 vs YTD AUG 2015
5,372
+21,8%
+7,4%
-2%
+71,9%
+64,1%
All EVs Total
100 Electric1 Total
Tesla Model S
Chevrolet Volt
Tesla Model X
Ford Fusion Energi
Nissan Leaf
BMW i3
7,922
9,998
10,000
14,295
15,000
37,863
83,303
-36%
-13,1%
$75,000 - 315 Miles - EV
$34,000 - 53 Miles - PHEV2
$80,000 - 250 Miles - EV
$34,000 - 22 Miles - PHEV
$30,000 - 107 Miles - EV
$43,500 - ~80Miles - EV
Tesla Model 3 expected end 2017 $35,000 - 215 Miles - EV
1 100 Electric: EV with a minimum range of 100 miles 2 PHEV: Plug-In Hybrid Electric Vehicle
Nº of Vehicles
TESLA COMPANY REVIEW
OLMANEXTLTD|OCTOBER2016 12
5/7 MARKET, ASSETS & PRODUCTS: THREATS
US sale regulations State regulations in the US related to Tesla’s direct sales, along with federal tax incentives, are going to dictate the future impact of Tesla’s product pricing. It is not clear if and how strongly the US administration will continue to support the EV market with consumer incentives. Also, it is uncertain if Tesla will continue to resist the traditional car dealer lobbying pressure, which tries to impose its multi-brand sales business model.
Cash Burn Tesla has raised over $4.5b since the IPO in 2010. As of January 2016, Musk owns about 22% of the company. Tesla announced in August 2016 that it will make a $2b secondary stock offering to finance its ambitious vehicle production objective: an estimated $1.4b worth of stock will be issued to help ramp-up production.
CEO Elon Musk will exercice his outstanding stock options (5.5m shares) and is expected to sell 2.8m of his own shares, mainly to pay taxes related to exercising vested stock options. After the SolarCity acquisition by Tesla (which has been delayed due to challenges from minority shareholders), this move seems to challenge investors and the financial world ”limits”. Some question whether this is a bold move to dominate the EV market and build the future of energy worldwide or simply a step too far.
Ability to reach economy of scale: from 60k to 500k cars Disruption and ability to “think out of the box” can revolutionise but can it also enable an EV factory that struggles to produce 80k cars in Y16 to reach 500k cars 24 months later?
http://www.investopedia.com/articles/markets/051916/tesla-
TESLA HISTORY OF DELAYS
To date, Musk has never met any past production targets. The new 2018 forecast, like the original 2020 deadline, appears unrealistic. However, something odd happened the day after Musk moved the goalposts; even as Tesla's stock declined, analysts and car enthusiasts almost universally moved their own estimates for Tesla unit sales higher.
In the same report in which J Spak from RBC Capital Market warned of “the risk to new investment” and maintained a neutral rating on the stock, he nearly doubled his forecast for Tesla's 2020 sales, to 620,000. That is higher than Musk's old target—the one most people considered impossible.
Roadster
Model S
Model X
Model 3
2006 201220102008 2014 2016 2018
9 MONTHS LATE
6+ MONTHS LATE
18+ MONTHS LATE
Unveiling of prototype
First deliveries
Initial Project launch date

TESLA COMPANY REVIEW
OLMANEXTLTD|OCTOBER2016 13
6/7 MARKET, ASSETS & PRODUCTS: BATTERIES
Batteries
Tesla´s central competitive advantage is the low cost of its battery pack. This has allowed the company to sell its models at a reasonable price but with a near-normal 300-mile range, a combination other EVs have yet to match.
This competit ive advantage comes from Tesla’s abil ity to use commoditised small cylindrical lithium cells (used in consumer electronics) via proprietary thermal/power management, versus prismatic “pouch” cells.
Taking all three battery characteristics into account (cost per kilowatt hour, specific energy and battery system efficiency), Ark Group estimates that the cost cross-over point between a 200-mile range EV using pouch cells and one using cylindrical cells will occur in the early 2020s. Consequently, all other things being equal, Tesla should enjoy a five-year competitive advantage before competing battery technology catches up. This advantage is further reinforced through Tesla’s partnership with Panasonic, one of the top historical Li-ion battery producers.
In the rising EV market, developing a battery maker next to the car producing core business is a very strong competitive advantage. This simply makes good sense for Tesla considering the huge 2018 battery volume required for the 500,000 Model 3 production goal.
In addition to the ”Gigafactory” project, several other ”super factories” have started in anticipation of a Li-ion battery market that needs to more than triple by 2020.
“The Gigafactory is designed to reduce cell costs much faster than the status quo and, by 2018, produce more lithium ion batteries
annually than were produced worldwide in 2013. By the end of the first year of volume production of our mass market vehicle, we expect the
Gigafactory will have driven down the per kWh cost of our battery pack by more than 30 percent.”
TESLA CORPORATE - FEB 2014
2014
50
100
GWh
2016 2018 2020
7 GWh 35 GWh 15 GWh 20 GWh 10 GWh
WORLDWIDE LI-ION BATTERY PRODUCTION WILL TRIPLE BY 2020
2012
CURRENT DEMAND
Gigafactory key figures: Cost: $5b Factory building completion to date: 14% 2018 vehicle batteries production goal: 500,000 batteries

TESLA COMPANY REVIEW
OLMANEXTLTD|OCTOBER2016 14
7/7 MARKET, ASSETS & PRODUCTS: PHOTOVOLTAIC CELLS
Solar Roofs
Deutsche Bank predicted in early 2015 that solar systems will be at grid parity with up to 80 per cent of the global market within 2 years. It also says that the collapse in the oil price will do little to slow down the solar juggernaut.
SolarCity, with more than 2.1 gigawatts of systems in operation, has pioneered the residential lease of solar panels, which has helped make residential roof-tops the fastest-growing segment of the US renewables industry.
However, PV roof installation companies struggle to find a workable business model: installation costs are high. Reaching the 55-cents-per-watt cost is essential to ensure that the cost structure can survive the projected withdrawal of the ITC (Federal Investment Tax Credit). Several companies are already bankrupt from trying to reach that limit.
In recent months, SolarCity has shifted its strategy to focus less on rapid growth and more on finding the most profitable customers. This is where synergies with Tesla’s customer base and 200+ unique branded stores with their ”internet only” buying process1 can be a huge competitive advantage for SolarCity.
Tesla also hopes to use SolarCity’s advanced technology2 to be the first carmaker to offer high efficiency solar roofs on its cars. The company PV panels have achieved 22% efficiency, the highest in the market to date.
“Despite the falling share prices and rising leverage, residential solar has tremendous growth potential. Total US installations are expected to reach 13.1 gigawatts by the end of 2018, more than double the
amount now” BLOOMBERG NEW ENERGY FINANCE - JUNE 2016
1 In the US, 48 of the 50 States have laws that limit or ban manufacturers from selling vehicles directly to consumers. Tesla is the only carmaker doing so. 2 In 2014, SolarCity acquired Silevo in a $200 million transaction (with an additional $150 million in performance based earn-outs) for its high-efficiency Triex technology.
1977 2000 2013
20
40
60
80
$/Watt
Price of crystalline silicon photovoltaic cells
50
100
150
250
200
GigaWatt
Global Solar
Energy Capacity
1990
PV CELL PRICE VS
PV ENERGY CAPACITY
SolarCity key figures: Cost of acquisition for Tesla Motors: $2.6b Factory debt to date: $3.25b ($1.23b due by end of 2017) Recourse debt to date: $1.6b

TESLA COMPANY REVIEW
OLMANEXTLTD|OCTOBER2016 15
PORTER’S 5 FORCES ANALYSIS (COMPETITION LEVELS)
SUPPLIERS BUYERS
THREAT: MODERATE TO LOW
The EV industry requires 3 types of suppliers, depending upon the products supplied: 1. Similar to ICE industry (interior and body): They work with a low number of customers which means dependency and bargaining disadvantage 2. Raw materials Limited differentiation and price sensitivity of the end consumer means a bargaining disadvantage even if raw material prices fluctuate 3. Specific EV industry products: Tesla is very reliant on its suppliers. Any issue with delivery will have an impact on production. But it manages a strong partnership and in-house production for every strategic component (powertrain, chassis, battery pack).
THREAT: MODERATE TO HIGH
To date: Due to the lack of quality offers in the EV segment, consumer buying power seems relatively low. However, there is an opportunity to choose a substitute (PHEV).
In 2-5 years time: There are 40+ EV models expected for 2020. Tesla and BMW's own charger networks provide a strong competitive advantage. The Tesla brand image as a “premium 100% EV manufacturer” is a strong competitive advantage. China has the biggest market potential and is expected to have the largest car market in volume in 2020. German brands are already very strong with 80% of market share for the premium car segment.
POTENTIAL ENTRANTS
THREAT: LOW
The EV industry has high entry barriers: • large amount of capital investment • specific set of skills and technologies • long product development cycle • state support for existing national manufacturers • brand building (reputation)
China is expected to become the world’s largest EV market in 20202. This will attract new entrants and therefore raise the risk that new players come into the market.
SUBSTITUTES
THREAT: MODERATE
There are 3 types of potential substitutes: 1. ICE: ICE industry is still dominant, but customers are becoming more environmentally cautious, EV cost could reach ICE cost by 2022. 2. HEV and PHEV: Have a lower level of environmental appeal than EVs. They still require investment in technology and infrastructure in order to be successful and reach a broad market. 3. Other transportation modes: Walking, cycling, public transportation: none of these offer the convenience and flexibility of a car = not a direct substitute.
INDUSTRY COMPETITORS
COMPETITION: MODERATE TO HIGH
Premium cars: Competition is very modest (very few models). The design and production cycle is long (5-6 years). Mass-market (Model 3): Chevrolet Volt is the real challenger and already on sale. Several other carmakers have announced model releases for 2020. Chinese market: Seen as of high strategic importance, China is the world’s current largest automobile market and expected largest EV market by 2020. Domestic Chinese companies are also expected to continue to evolve and therefore further increase competition.

TESLA COMPANY REVIEW
OLMANEXTLTD|OCTOBER2016 16
SWOT ANALYSIS
• China Ev carmaker are taking All the cake !
STRENGTHS
Product: With the Model S, Tesla has created and dominates the market for luxury, long-range electric vehicles.
Production: Tesla’s vertically integrated value chain allows for cost reduction and quality control. It has the ability to maintain a high rate of innovation.
Brand: IT x luxury brand recognition = highest goodwill in the market as a carmaker.
Partnership: Tesla has strong partnerships with Toyota and Daimler. It is building the Gigafactory in partnership with Panasonic (a highly effective strategic partner to stay at the top of the battery field)
Batteries: In-house production (Gigafactory), with proprietary form factor and technology make Tesla’s battery pack the most efficient.
OPPORTUNITIES
Cash: Interest rates are currently low.
EV market: It remains a blue ocean for the next 2-3 years. The competition has only just launched its ”real Tesla challenger” EV development. Chevrolet is the most advanced with the Volt.
Oil and gas: Prices will increase.
State policy: There are strong assistance programs for EV and PV and stricter emissions policies.
Trend: The public is more and more receptive to environmental issues.
WEAKNESSES
Cash: Tesla Motors still needs significant funds to complete the “Musk Master Plan”: OPEX increase, with poor return on invested capital and equity (dilution through recurrent fundraising) and high long-term liquidity risk.
Production: It lacks the scale of operation to go mass market with the Model 3 and the ability to downsize costs.
Innovation: R&D cost must stay very high to stay ahead of competition in the battery field. Traditional carmakers are raising their expectations and budget for the EV market.
Dispersion: The recent purchase of SolarCity is not closely linked to the car sector (in the short term) and will be a time/money consumer.
THREATS
Competition: All traditional carmakers have made the shift and plan to invest significantly to fill the gap.
Combustion engine: It still enjoys significant influence (performance/consumption/pollution) and the average car turnover timeframe is 11 years for owners. Oil prices are expected to remain low in the short term.
Infrastructure: Limited for EV support. There may be compatibility issues regarding charging networks.
State policy: The EV business model depends on state incentive programs that will decrease with market growth.
Battery: There are lithium supply constraints.
IN
TE
RN
AL
EX
TE
RN
AL

TESLA COMPANY REVIEW
OLMANEXTLTD|OCTOBER2016 17
PESTEL ANALYSIS
POLITICAL
+ Government incentives for EV + Expanding free trade agreements + Political stability in the majority of major markets
Due to i t s nea r ze ro ca rbon em iss i on performance, Tesla Motors has an opportunity to strengthen its financial performance through incent ives from governments. Free trade agreements open opportunities for Tesla to expand its operations internationally. Political stability of major markets makes the remote or macro-environment favourable to the company’s market penetration strategies. The exception is China, which plays by its own rules to push local EV makers like BYD.
SOCIAL
+ Increasing popularity of low-carbon lifestyles + Increasing preference for renewable energy + Improving wealth distribution in developing markets
These external factors improve market demand for the company’s electric vehicles and related products.
ECONOMIC
+ Decreasing battery costs + Decreasing renewable energy costs - Threat of economic stability issues
Battery costs are still 1/5 of the total car cost. The continued decrease of renewable energy costs makes Tesla products more attractive supplementing business improvement due to increased popularity of renewable energy solutions. However, economic stability issues threaten the company’s financial performance, especially in Europe and Asia
TECHNOLOGICAL DEVELOPMENT
+/- High rate of technological change + Increasing automation in business + Increasing popularity of online mobile systems
The high rate of technological change presents an opportunity for Tesla to enhance its product technologies. Its position as an electricity, battery and car producer give it a huge competitive advantage. However, this external factor also threatens the company due to the potential for rapid obsolescence of technologies used in its products. Thus Tesla will need to employ a significant R&D budget.
ENVIRONMENTAL
+ Climate change + Expanding environmental programs + Rising standards for waste disposal
LEGAL
+/- Dealer sales regulation in the USA + Expanding international patent protection + Energy consumption regulations
Tesla “direct sales” are allowed in many countries, but are not allowed in several US states, some of which are currently suing Tesla. Tesla’s patent release should boost other companies entering the EV market. In addition, the company has the opportunity to promote its electric vehicles, based on energy consumption regulations that customer organisations must follow.

TESLA COMPANY REVIEW
OLMANEXTLTD|OCTOBER2016
30% growth p.a. BNEF Forecast
60% growth p.a. Current rate of adoption
45% growth p.a.
18
Q&A
WHAT ABOUT THE OIL LOBBY’S STANCE REGARDING EV MARKET ?
Transportation used 70% of US oil production, 65% of which is used by cars. This means that 45.5% of US oil production is being used for cars.
As can be seen from looking at carmaker announcements, after years of denial regarding HEV and EV, they have agreed it is not sustainable to delay investments in EV, unless they deliberately wish to loose market share and money.
The “full electric” model has to be considered as the most probable for the next decade.
http://www.treehugger.com/green-jobs/hiring-spree-tesla-
By 2022, electric vehicles will cost the same as their internal-combustion counterparts.
The oil markets are going through fundamental structural changes driven by a technological revolution and geopolitical shifts and the business model that has worked for the last quarter-century is broken. […] The Chatham House Think Tank report offers two unappealing options for today’s oil majors: “managing a gentle decline by downsizing or risking a rapid collapse by trying to carry on business as usual.” Of course, there is another option: the oil and gas companies could become energy companies, focusing on new technologies, decentralized energy systems and providing clean energy. Shell is gesturing in that direction by investing $1.7 billion in clean-energy projects. Considering that is about 5 percent of the $30 billion or so the company invests in oil and gas every year, it is probably too little and too late.
2016 2018e 2020e 2024e
1
3
4
5
2022e
6
Millions of barrels of oil
per day
2
THE AMOUNT OF OIL DISPLACED BY ELECTRIC CARS DEPENDS ON WHEN VEHICLE SALES TAKE OFF.
BELOW ARE 3 SCENARIOS FOR RISING EV SALES.
Forecasted crash
“
“
www.technologyreview.com
The Bloomberg New Energy Finance (BNEF) forecast of 30% CAGR for the coming years seems less aggressive than simply taking into account current EV adoption rate (60%). Using this forecast the oil-crash benchmark of 2m barrels per day would be crossed in 2028.
With a continued EV adoption rate of 60%, electric vehicles could displace oil demand of 2m barrels a day as early as 2023. This would create an oil glut equivalent to the trigger of the 2014 oil crisis.

TESLA COMPANY REVIEW
OLMANEXTLTD|OCTOBER2016 19
Q&A
http://www.treehugger.com/green-jobs/hiring-spree-tesla-
ASPECT CURRENT ICE BATTERY-ELECTRIC FUEL-CELL
Fuel type Gasoline Electricity Hydrogen
Vehicle models available1 287 13 3
Average fuel economy1 23.3 mpg 105.2 mpge 58.5 mpge
Fuel economy range1 12-50 mpg 84-119 mpge 50-67 mpge
Effective cost per mile $0.10 $0.04 $0.09
Well-to-wheels GHG emissions (g/mi)2 356-409 214 260-364
Well-to-wheels total petroleum usage (Btu/mi)2 3791-4359 54 27-67
Driving range (average)1 418 mi 110 mi 289 mi
Driving range (min-max)1 348-680 mi 62-257 mi 265-312 mi
Time to refuel ~5 min 20-30 min (DC level 2) 3.5-12 hr (AC Level 2)
5-30 min
Security: High voltage No Yes Yes
Security: High pressure No No Yes
Availability of qualified mechanics Yes Limited Limited
Availability of qualified emergency responders Yes Yes Limited
Vehicle maintenance issues3 -
Lower than gasoline. Possible
battery replacement required during vehicle lifetime
Lower than gasoline. High-pressure tanks
may require inspection and maintenance.
1 Model year 2016 (EPA, 2015a) 2 GREET 2015 release, using default setting for model year 2015 passenger cars (ANL, 2015) 3 AFDC (2014)
RELEVANT ASPECTS OF VEHICLE PERFORMANCE FOR BATTERY-ELECTRIC VEHICLES (BEV) AND HYDROGEN FUEL-CELL VEHICLES (FCV)
best worst
WHAT ABOUT HYDROGEN FUEL CELLS COMPARED TO ELECTRIC BATTERIES ?
Hydrogen-fueled vehicles were a good alternative to electric vehicles due to their ability to refuel more quickly and overall better cell efficiency. Hydrogen can be generated using oil and gas or, even better, using wind power, solar power or any other source of electricity that happens to be available (providing ultimate flexibility). But 3 factors will probably cause the hydrogen fuel cell to loose the battle: 1. Hydrogen is not a source of energy; it is only a carrier of energy. Delivery of hydrogen, whether by truck or pipeline, requires energy costs that are several times those for established energy carriers like natural gas or gasoline. Even the most efficient fuel cells cannot recover these losses.
2. Storage: Hydrogen’s low density and extremely low boiling point increase the energy cost of compression or liquefaction, investment costs of storage and evaporation due to security wastage. Energy input outweighs the energy delivered by a factor of three to four.
3. Charging infrastructures: Most of the fuel-cell infrastructure that exists is limited to the Los Angeles and San Francisco Bay areas. Construction costs for a hydrogen refuelling station are several times a traditional gasoline station.

TESLA COMPANY REVIEW
OLMANEXTLTD|OCTOBER2016 20
Q&A
DID TESLA REALLY HAVE TO BUILD AND FINANCE ITS OWN SUPERCHARGER INFRASTRUCTURE?
Tesla is not just building and selling electric vehicles; the Tesla strategy requires to provide consumers with the means to shift from ICE vehicles to electric vehicles.
To achieve this major change in consumer behaviour, Elon Musk anticipated that a mass-market shift to battery-powered cars faced 4 great obstacles:
limited battery range; long battery charging time; lack of a network of charging stations; and battery pack lifetime and replacement cost.
Tesla was the first EV manufacturer to bring a tangible solution to the market with a 200+ mile range battery and the first to build charging clusters around major markets. Tesla then methodically extended the network to make it possible to make a cross country trip. With a charging time of 30 minutes and a range of 170 miles, Tesla had the world’s fastest charging station.
Charger infrastructure is a crucial part of the user experience and Tesla’s control over it gives a strong competitive advantage. This control means that the network can be upgraded as battery capacity evolves and Tesla can expand the network on its own terms.
Tesla cannot rely on third-party suppliers for the charger network since the industry is mired in a standards battle. It pits two other systems against Tesla’s: CHAdeMO, notably used by the Nissan Leaf, and SAE CCS, which is used by BMW and Volkswagen.
Finally, it is no secret that the Phase 3 of Elon Musk’s “Master Plan” relies upon its recent SolarCity acquisition. SolarCity will enable the use of PV cells for individual solar roofs and significantly lower supercharger dependence upon the grid.
SUPERCHARGING CORRIDORS TESLA PLANS TO ENABLE IN 2016

TESLA COMPANY REVIEW
OLMANEXTLTD|OCTOBER2016 21
Q&A
ARE ELECTRIC BATTERIES LIKE TESLA’S 100% EMISSION FREE?
Assumptions that EVs are pollution and CO2 free are myths that have to be debunked. It is a proven fact that Tesla cars generate pollution during their 3 life stages: manufacturing, operation and end-of-life.
The manufacture of an electric vehicle generates more carbon emissions than building a conventional car due to the high consumption of energy and material required for producing batteries.
EVs generate pollution, whether powered from the electrical grid, by electricity generated from natural gas or by solar panels that need rare materials and energy for manufacture. Even when electricity used for EV operation is generated from coal, all studies come to the conclusion that over an entire lifetime, an EV generates on average half of the pollution of an ICE equivalent.
In their 2015 study “Cleaner Cars from Cradle to Grave”, the Union of Concerned Scientists (UCS) carried out a rigorous assessment of the carbon footprint of Tesla cars and other electric vehicles versus internal combustion vehicles including hybrids. They found that the manufacturing of a full-sized Tesla Model S rear-wheel drive car with an 85 KWH battery was equivalent to a full-sized ICE1 car except for the battery. This adds 15% (or one metric ton) of CO2 emissions to the total manufacturing outlay. However, Tesla’s battery recycling process with Umicore is able to save at least 70% on CO2 emissions due to the recovery and refining of the battery’s valuable metals.
Midsize Gazoline
Car
100
300
400
500
600
Life Cycle of Global Warming Emissions
(grams of CO2/mile)
200
Battery manufacturing
Vehicle manufacturing
Operation
Note: UCS assume that midsize vehicles are driven 135,000 miles over their lifetimes and full-size vehicles 179,000 miles. The difference in the two mileages derives from dissimilar uses of 84-mile-range and 256-mile-range battery-electric cars. UCS further assumes that a consumer buying a BEV would drive it the same total of miles as a corresponding gasoline vehicle. UCS use the US average electricity grid emissions intensity during vehicle operation which are based on a sales-weighted average of where EVs are being sold today.
LIFE CYCLE GLOBAL WARMING EMISSIONS FROM THE MANUFACTURING AND OPERATION OF GASOLINE AND EVs
Midsize 84-mile
BEV
Full-size Gazoline
Car
Full-size 265-mile
BEV
51% DECREASE
53% DECREASE

TESLA COMPANY REVIEW
OLMANEXTLTD|OCTOBER2016 22
Q&A
DOES TESLA’S BUSINESS MODEL RELY ON GOVERNMENT SUBSIDIES?
On 30 May 2015, Jerry Hirsch wrote an article in the Los Angeles Times claiming that Elon Musk companies, “Tesla Motors Inc, SolarCity Corp and Space Exploration Technologies Corp, known as SpaceX, together have benefited from an estimated $4.9 billion in Government support.” This was the peak of the ever-growing rumours about benefiting from state and government subsidies for his businesses.
Musk immediately responded through an interview with the LA Times journalist. Several articles revealed details of each subsidy Musk's companies have received and their underlying obligations. It has been revealed that:
Most of this subsidies are not direct cash: The figure compiled by the LA Times included a variety of government incentives including grants, tax breaks, factory construction, discounted loans and environmental credits that Tesla can sell. It also includes tax credits and rebates to buyers of solar panels and electric cars. Some of the incentives do not come from tax payers: The ZEV credit (zero emission vehicle) in California was created decades ago before Tesla was launched and was paid by other car manufacturers. Most of the incentives were not Tesla creations. Thus it is considered proper management to take advantage of them just like every other competitor does. They include Department of Energy loans, federal income tax credits and rebates for eligible US buyers of electric vehicles, the California Self-Generation Incentive Program, the California job training reimbursement and Oregon tax credits and rebates.
Most of the government or state incentives come with onerous reciprocal obligations:
Job creation (>10,000) Spending milestones Potential penalties in case of payment delay or failure
The Tesla subsidy affair had an unexpected associated effect: the controversy revealed shocking figures about who was really taking significant amounts from the system.
As stated in the Guardian for example: “Fossil fuel companies worldwide are benefitting from global subsidies of $5.3tn a year, equivalent to $10m a minute every day, according to a startling new estimate by the International Monetary Fund. The IMF calls the revelation ‘shocking’ and says the figure is an ‘extremely robust’ estimate of the true cost of fossil fuels. The $5.3tn subsidy estimated for 2015 is greater than the total health spending of all the world’s governments.”
The IMF figure represents 6.5% of global GDP. Just over half the figure is the money governments are forced to spend to treat victims of air pollution and income lost because of ill health and premature deaths. This is a stark contrast to the $120bn subsidies available for renewable energy every year.
However, the problem is complex as Tim Wortsall explained in a Forbes article published on 14 November 2014: “It is largely poor and/or fossil fuel producing countries subsidising fossil fuels. It is largely the rich world subsidising renewables. Meaning that abolishing those subsidies for oil and gas isn’t really something that’s in the control of us people in that rich world.”
““This very important [International Monetary Fund] analysis shatters the myth that fossil fuels are cheap by showing just how huge their real costs are. There is no justification for these enormous subsidies for fossil fuels, which
distort markets and damage economies, particularly in poorer countries.”” NICHOLAS STERN - CLIMATE ECONOMIST AT THE LONDON SCHOOL OF ECONOMICS

TESLA COMPANY REVIEW
OLMANEXTLTD|OCTOBER2016 23
FIGURES: TESLA FINANCIAL STATEMENTS
TESLA MOTORS INC TESLA MOTORS INC (TSLA)
IPO on 29 June 2010 on NASDAQ
Founded Sector01/01/2003 Technology
Employees Fiscal Year Ends31,557 31 December
Adress3500 Deer Creek Road
Palo Alto, CA 94304-1317United States of America
Website www.teslamotors.com
2015 2014 2013
INCOME STATEMENT Revenues 4046.02 3198.35 2013.49
Gross Profit 923.5 881.67 456.26
Pretax Income (875.62) (284.63) (71.42)
Net Profit/(Loss) (888.66) (294.04) (74.01)
EPS Basic Net (6.93) (2.36) (0.62)
EPS Diluted Net (6.93) (2.36) (0.62)
Total operating expense 4762.65 3385.04 2074.76
Operating income (716.62) (186.68) (61.28)
BALANCE SHEET Total Current Assets 2791.56 3198.65 1265.93
Total Assets 8092.46 5849.25 2416.93
Total Liabilities 7003.51 4937.54 1749.81
Shareholders Equity 1088.94 911.71 667.12
CASH FLOW STATEMENT Net Income (888.66) (294.04) (74.01)
Net Cash From Operating Activities (524.49) (57.33) 257.99
Net Cash From Investment Activities (1,673.55) (990.44) (249.41)
Net Cash From Financing Activities 1,523.52 2,143.13 635.42
Net Change In Cash And Cash Equivalents (708.8) 1,059.82 643.99
-200%
-100%
0%
100%
200%
-1000
0
1000
2000
3000
4000
2015 2014 2013 2012
Net Sales Or Revenues Net Income
-200%
-100%
0%
100%
200%
-800
0
800
1600
2400
3200
4000
2015 2014 2013 2012
Net Sales Or Revenues Operating income Revenues Operating income
Revenues Net Profit/(Loss)
$
$
$m

TESLA COMPANY REVIEW
OLMANEXTLTD|OCTOBER2016 24
FIGURES: TESLA SHAREHOLDERS, FUNDING ROUNDS, M&A DEALS
Top 10 institutional shareholders
DATE AMOUNT / ROUND
LEAD INVESTOR
NUMBER OF INVESTORS
May, 2016 $1.46b / Post IPO Equity — 5
Oct, 2012 $10m / Grant California Energy Commission 1
Nov, 2010 $30m / Post IPO Equity Panasonic 1
May, 2010 $50m / Post IPO Equity Toyota 1
Sep, 2009 $82.5m / Series F Al Wahada Capital Investment 4
Jun, 2009 $465m / Debt Financing US Department of Energy 1
May, 2009 $50m / Series E Daimler 2
Nov, 2008 $40m / Debt Financing Elon Musk 5
May, 2008 $40.17m / Debt Financing Elon Musk 5
Feb, 2008 $40m / Series E Elon Musk 8
May, 2007 $45m / Series D Elon MuskTechnology Venture Partners US 10
May, 2006 $40m / Series C Elon MuskVantagePoint Capital Partners 11
Feb, 2005 $13m / Series B Elon MuskValor Equity Partners 3
Apr, 2004 $7.5m / Series A Elon Musk 2
Funding Rounds (14): $2.37b
DATE ACQUIRED CONSIDERATION
Jun 22, 2016 SolarCity (subject to completion) $2.6b in Tesla shares
May 8, 2015 Riviera Tool Unknown
Mergers & acquisitions (2)
SHAREHOLDERS Nº OF SHARES % HELD
FMR, LLC 20.74m 13.95%
Baillie Gifford & Company 13.07m 8.79%
Price T. Rowe Associates, Inc. 10.51m 7.07%
The Vanguard Group, Inc. 4.89m 3.29%
Bank of Montreal, Canada 4.87m 3.28%
Morgan Stanley Investment Management, Inc. 3.91m 2.63%
Jennison Associates LLC 3.09m 2.08%
BlackRock Institutional Trust Company 2.70m 1.81%
Capital World Investors 2.51m 1.69%
State Street Corp. 1.97m 1.32%
45,07%Per cent of shares
held by top 10 holders 540Largeur graphique : 381 pix
x : 26
Data as of 30 June 2016
45.91% Please note that Elon Musk holds approximately 22% of
Tesla’s share capital

TESLA COMPANY REVIEW
OLMANEXTLTD|OCTOBER2016 25
FIGURES: TESLA STOCK
Taille graphique :longueur : 942
hauteur : 164
Coordonnées graphique :
2016
100
150
200
300
250
50
2013 2014 2015 Apr Jul OctApr Jul OctApr Jul Oct Apr Jul
Tesla Motors Inc (TSLA) - NasdaqGS
Equity & Debt Situation
$2.52bEquity
$677mDebt
Key Statistics and Ratios
Trailing Stock Performance
TOTAL RETURN (%)
31/08/20161-MONTH 3-MONTH 6-MONTH YTD 1-YEAR 3-YEAR 5-YEAR 10-YEAR 15-YEAR
TSLA -9.70 -5.03 10.46 -11.67 -14.88 7.85 53.67
Auto Man. 5.20 8.77 16.17 -2.21 3.03 0.93 10.06 3.23 5.38
S&P 500 0.14 4.10 13.60 7.82 12.55 12.30 14.69 7.51 6.55
79%
21%
Q2 (JUN '16) 2015
Net profit margin -23.09% -21.96%Operating margin -18.74% -17.71%
EBITDA margin - -7.27%
Return on average -11.17% -12.79%
Return on average -67.38% -89.07%
— -
- 30%
0%
30%
60% TSLA Auto Manufacturers S&P 500 TR USD Car Manufacturers
$ per share

TESLA COMPANY REVIEW
OLMANEXTLTD|OCTOBER2016 26
FIGURES: SOLARCITY FINANCIAL STATEMENTS
SOLARCITY CORP INC SOLARCITY CORP INC(SCTY)
IPO on 13 Dec 2012 on NASDAQ
Founded Sector04/07/2006 Utilities
Employees Fiscal Year Ends15,2731 31 December
Adress3055 Clearview Way
San Mateo, 94402United States of America
Website http://www.solarcity.com
2015 2014 2013
INCOME STATEMENTRevenues 399.61 255.03 163.83
Gross Profit 118.82 78.59 39.36
Pretax Income (765.49) (401.96) (176.55)
Net Proft/(Loss) (58.33) (56.03) (55.79)
EPS Basic Net (0.6) (0.6) (0.7)
EPS Diluted Net (0.6) (0.6) (0.7)
Total operating expense 1047.4 590.62 313.2
Operating income (647.79) (335.59) (149.37)
BALANCE SHEET Total Current Assets 902.13 1,002.39 787.66
Total Assets 7,287.11 4,586.21 2,809.53
Total Liabilities 5,873.49 3,430.62 2,005.11
Shareholders Equity 1,413.62 1,155.58 804.41
CASH FLOW STATEMENT Net Income (768.82) (375.23) (151.75)
Net Cash From Operating Activities (789.88) (217.84) 174.51
Net Cash From Investment Activities (1,726.73) (1,344.81) (729.89)
Net Cash From Financing Activities 2,394.77 1,489.96 972.38
Net Change In Cash And Cash Equivalents (121.83) (72.69) 417
1 12/31/2015
-200%
-100%
0%
100%
200%
-400
-200
0
200
400
2015 2014 2013 2012
Net Sales Or Revenues Net Income Profit margin
-200%
-100%
0%
100%
200%
-700
-350
0
350
700
2015 2014 2013 2012
Net Sales Or Revenues Operating income Operating margin
Revenues Profit margin
Net Profit/(Loss)
Revenues Profit margin
Operating Income
$
$
$m

TESLA COMPANY REVIEW
OLMANEXTLTD|OCTOBER2016 27
FIGURES: SOLARCITY SHAREHOLDERS, FUNDING ROUNDS, M&A DEALS
540Largeur graphique : 381 pixx : 26
DATE AMOUNT/ROUND LEAD INVESTOR TOTAL
Sep, 2016 $305m / Post IPO Equity — 0
Jul, 2016 $345m / Post IPO Debt — 0
Apr, 2016 $338m / Post IPO Equity Bank of America Merrill LynchCredit Suisse 2
Nov, 2015 $113m / Post IPO Equity — 2
Jun, 2013 $201m / Post IPO Debt — 0
Jun, 2012 $250m / Private Equity U.S. Bancorp 1
Jun, 2012 $6.74m / 2nd Market Firsthand Technology Value Fund 1
Feb, 2012 $81m / Series G Silver Lake KraftwerkValor Equity Partners 5
Dec, 2011 undisclosed /2nd Market 137 Ventures 1
Jul, 2011 $20m / Series F — 5
Jun, 2011 $280m / Undisclosed Google 1
Jul, 2010 $21.4m / Series E Mayfield Fund 4
Jan, 2010 $60m / Private Equity Pacific Gas and Electric (PG&E) 1
Oct, 2009 $23.9m / Series E Generation Investment Management 2
Oct, 2008 $29.9m / Series D First Solar 3
Aug, 2007 $21m / Series C — 0
Apr, 2007 $3m / Series B — 0
Sep, 2006 $1m / Venture Elon Musk 4
Jul, 2006 $2.3m / Series A — 0
Funding Rounds (19): $2.11b
DATE ACQUIRED AMOUNT
Aug 5, 2015 ILIOSSON $10m in cashJun 17, 2014 Silevo $200m (terms undisclosed)
Oct 9, 2013 Zep Solar $158m in sharesAug 13, 2013 Paramount Solar $120m (terms undisclosed)May 12, 2010 Building Solutions UnknownSep 28, 2006 Palo Alto Solar UnknownSep 28, 2006 Declination Solar Unknown
Mergers & acquisitions (7)
30,99%!Per cent of shares
held by top 10 holders
30.20%
Data as of 30 June 2016
Top 10 institutional shareholders
SHAREHOLDERS Nº OF SHARES % HELD
FMR, LLC 11.65m 11.62%
Bank of Montreal, Canada 5.28m 5.26%
The Vanguard Group, Inc. 4.42m 4.40%
Public Sector Pension Investment Board 1.87m 1.87%
BlackRock Institutional Trust Company 1.48m 1.48%
Morgan Stanley Investment Management, Inc. 1.47m 1.47%
Deutsche Bank AG 1.41m 1.40%
Founders Fund IV Management, LLC 0.99m 0.98%
Bank of America Corp. 0.93m 0.93%
BlackRock Fund Advisors 0.78m 0.78%
Please note that Elon Musk holds approximately 22% of
SolarCity’s share capital
TESLA COMPANY REVIEW
OLMANEXTLTD|OCTOBER2016 28
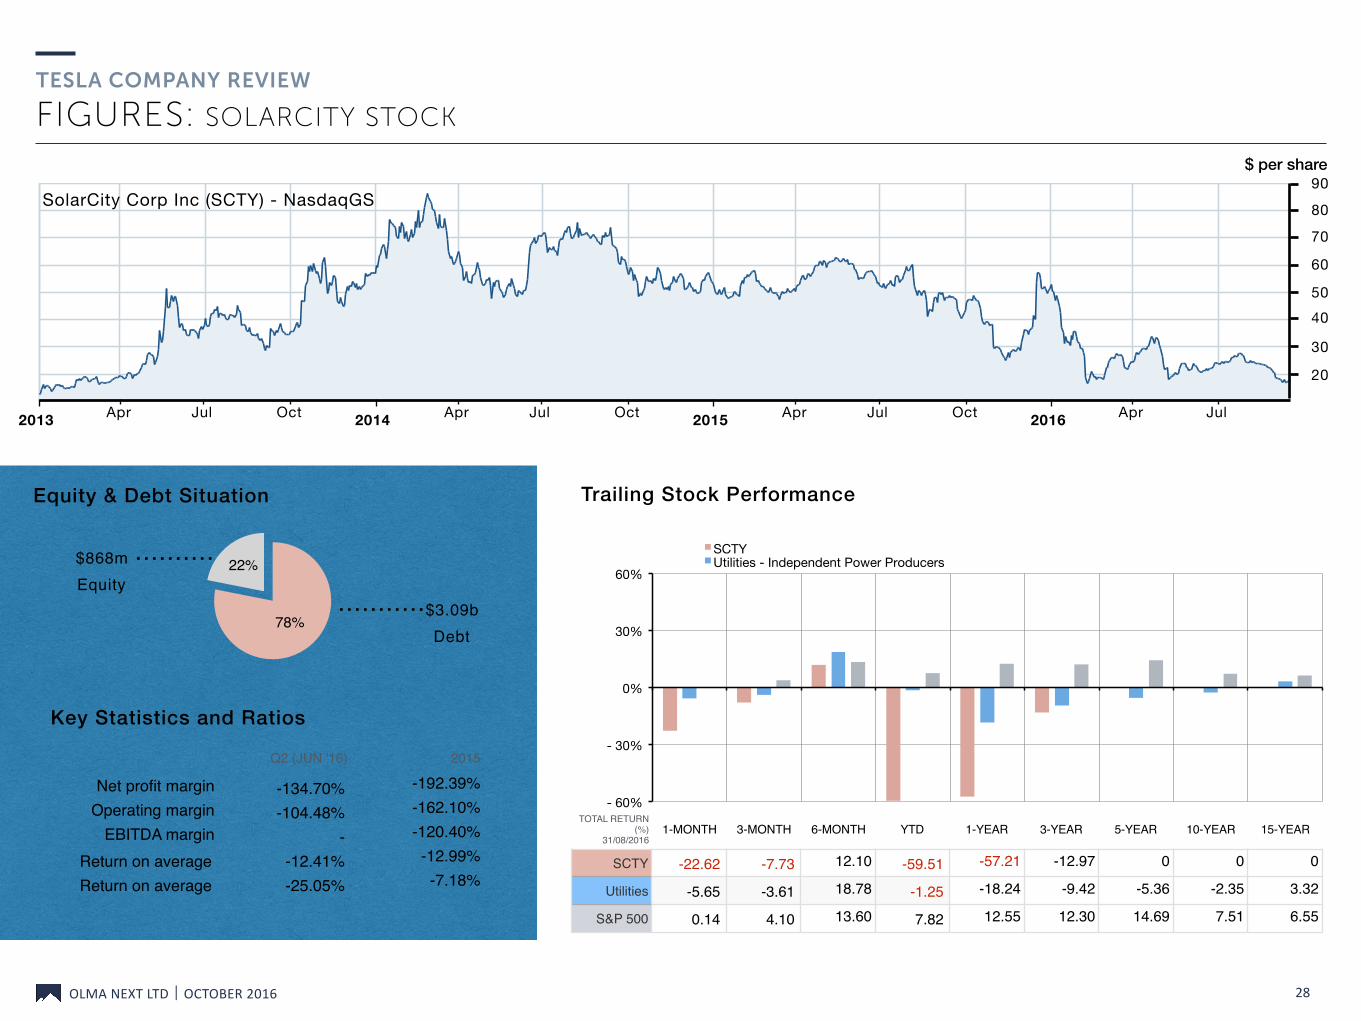
FIGURES: SOLARCITY STOCK
Taille graphique :longueur : 942
hauteur : 164
Coordonnées graphique :
2016
30
4050
90
60
20
2013 2014 2015 Apr Jul OctApr Jul OctApr Jul Oct Apr Jul
SolarCity Corp Inc (SCTY) - NasdaqGS
Equity & Debt Situation
$868mEquity
$3.09bDebt
Trailing Stock Performance
TOTAL RETURN (%)
31/08/20161-MONTH 3-MONTH 6-MONTH YTD 1-YEAR 3-YEAR 5-YEAR 10-YEAR 15-YEAR
SCTY -22.62 -7.73 12.10 -59.51 -57.21 -12.97 0 0 0
Utilities -5.65 -3.61 18.78 -1.25 -18.24 -9.42 -5.36 -2.35 3.32
S&P 500 0.14 4.10 13.60 7.82 12.55 12.30 14.69 7.51 6.55
22%
78%
Q2 (JUN '16) 2015
Net profit margin -134.70% -192.39%Operating margin -104.48% -162.10%
EBITDA margin - -120.40%
Return on average -12.41% -12.99%
Return on average -25.05% -7.18%
- -
- 60%
- 30%
0%
30%
60%
SCTY Utilities - Independent Power Producers
70
80
$ per share
Key Statistics and Ratios

TESLA COMPANY REVIEW
OLMANEXTLTD|OCTOBER2016 29
CONCLUSIONS
As Steve Jobs did with Apple, Elon Musk plans to disrupt not only one, but several industrial fields, in less than a decade. It is not an incongruous and haphazard combination but an assumed strategy: quick, deep and perfect vertical integration and synergies are essential to successfully disrupt firmly rooted industries like fossil energy, utilities and ICE transportation.
Four major factors might make Tesla’s objectives difficult to meet: the energy and utilities industries require heavy and costly local industrial implantation, especially for production and charging infrastructures electric vehicle performance depends on component-extensive synergies: therefore chassis, electric powertrain, battery cells and pack conception and production have to be fully integrated renewable energy/electric transportation still needs strong and expensive R&D to increase efficiency ratios to be able to compete with fossil energy based technology market momentum is close: Tesla must speed up production and development significantly and expect global and fierce competition
Unlike Apple, even if the anticipated products generate huge revenues, Tesla will need vast financing to reach its goals based on current strategy. This could trigger the mass dilutions which go with such financing. Tesla will also need to deliver on its numerous proclaimed commitments.

TESLA COMPANY REVIEW
OLMANEXTLTD|OCTOBER2016 30
SOURCES (1/2)
PAGE 2 http://fortune.com/2016/06/22/elon-musk-merge-tesla-solarcity/ Icons: the nounproject - A.Zumahev, J.Fernandes, J.Wilson, J. Blake, misirlou, P. Rozenberg, E. Bolet, R. Slater
PAGE 5 http://www.bloomberg.com/news/articles/2016-07-21/elon-musk-reveals-how-he-forecasts-tesla-s-future
PAGE 6 http://www.bloomberg.com/features/2016-inside-tesla-gigafactory/
PAGE 7 https://en.wikipedia.org/wiki/NUMMI http://www.bloomberg.com/news/articles/2015-08-10/here-s-how-elon-musk-takes-tesla-to-500-000-cars-in-five-years https://cleantechnica.com/2015/03/28/ev-demand-growing-global-market-hits-740000-units/
PAGE 9 http://www.statista.com/statistics/416750/number-of-electric-vehicle-charging-stations-outlets-united-states/ http://www.wsj.com/amp/articles/why-electric-cars-will-be-here-sooner-than-you-think-1472402674 http://www.hybridcars.com/tesla-claims-to-have-worlds-fastest-charger-with-145-kilowatt-supercharger-rollout/ http://www.greencarreports.com/news/1102607_how-much-does-electric-car-range-cost-per-mile https://cleantechnica.com/2016/08/17/10-solar-energy-facts-charts-everyone-know/
PAGE 10 http://www.ev-volumes.com/country/total-world-plug-in-vehicle-volumes/ http://www.wsj.com/articles/daimler-sells-tesla-stake-for-780-million-1413926628
PAGE 11 http://www.ev-volumes.com/country/total-world-plug-in-vehicle-volumes/ http://evobsession.com/us-electric-car-sales-14-highlights-august/ http://www.caranddriver.com/
PAGE 12 http://www.visualcapitalist.com/the-lithium-ion-megafactories-are-coming-chart/
PAGE 13 Bloomberg New Energy Finance https://cleantechnica.com/2014/02/04/current-cost-solar-panels/
https://cleantechnica.com/2016/08/17/10-solar-energy-facts-charts-everyone-know/
PAGE 15 http://spherepress.com/tesla-motors-external-analysis-using-pestle-porters-5-analysis/ http://jtorres2015.wixsite.com/tesla-team5/porters-5-forces https://prezi.com/odfko5i1kaqp/tesla-and-porters-five-forces/ http://studenttheses.cbs.dk/bitstream/handle/10417/4841/nicoline_eeg_praem.pdf?sequence=1 http://www.autonews.com/article/20140528/OEM05/305299995/bmw-projects-china-will-become-no.-1-ev-market-by-2019 http://www.huffingtonpost.com/steven-cohen/the-growing-level-of-envi_b_6390054.html http://www.forbes.com/sites/ywang/2016/06/08/chinas-electric-car-market-in-danger-of-backfiring-after-attracting-ragtag-crew-of-players/#3b02cf98399c http://www.sharpspixley.com/uploads/McKinseyPerspectiveonChinasautomarketin2020.pdf http://www.mckinseychina.com/wp-content/uploads/2013/04/McKinsey-China-Future-of-Chinas-Premium-Car-Market.pdf http://www.pewresearch.org/key-data-points/environment-energy-2/ https://www.theguardian.com/environment/2016/feb/25/electric-cars-will-be-cheaper-than-conventional-vehicles-by-2022
PAGE 16 http://studenttheses.cbs.dk/bitstream/handle/10417/4841/nicoline_eeg_praem.pdf?sequence=1 http://www.valueline.com/Stocks/Highlights/SWOT_Analysis__Tesla_Motors,_Inc_.aspx http://www.valueline.com/Stocks/Highlights/SWOT_Analysis__Tesla_Motors,_Inc_.aspx#.V9mBx5OLSHp http://synergyfiles.com/2016/03/tesla-batterypack-optimization/ http://knoema.fr/infographics/yxptpab/crude-oil-price-forecast-long-term-2016-to-2025-data-and-charts http://pubdocs.worldbank.org/en/677121461693540498/CMO-April-2016-Full-Report.pdf https://www.thebalance.com/oil-price-forecast-3306219 http://blog.alliance-renault-nissan.com/node/3164/ https://www.iea.org/publications/freepublications/publication/Global_EV_Outlook_2016.pdf
PAGE 17 http://panmore.com/tesla-motors-inc-pestel-pestle-analysis-recommendations
PAGE 18 http://www.bloomberg.com/features/2016-ev-oil-crisis/ https://www.technologyreview.com/s/601471/big-oil-companies-have-already-become-dinosaurs/
TESLA COMPANY REVIEW
OLMANEXTLTD|OCTOBER2016 31
SOURCES (2/2)
PAGE 19 http://www.treehugger.com/cars/are-hydrogen-fuel-cell-cars-realistic-option-compared-battery-electric-vehicles.html http://uk.businessinsider.com/in-the-battle-between-electric-cars-and-fuel-cell-vehicles-we-currently-have-a-clear-winner-2016-2?r=US&IR=T http://phys.org/news/2006-12-hydrogen-economy-doesnt.html
PAGE 20 https://electrek.co/2016/07/20/tesla-supercharger-capacity-increase-145-kw/ http://www.theverge.com/2015/1/22/7871657/bmw-volkswagen-chargepoint-fast-charging-electric-vehicles https://chargedevs.com/newswire/dc-fast-charging-maps-highlight-differences-between-tesla-and-chademoccs-rollout-strategies/ https://chargedevs.com/newswire/elon-musk-tesla-is-in-talks-with-other-automakers-about-sharing-the-supercharger-network/
PAGE 21 https://qph.is.quoracdn.net/main-qimg-3f0c0413ac0ed58f3c95352014ba35f6?convert_to_webp=true https://chargedevs.com/newswire/new-union-of-concerned-scientists-report-ev-life-cycle-emissions-are-half-that-of-an-average-gas-car/ http://www.ucsusa.org/sites/default/files/attach/2015/11/Cleaner-Cars-from-Cradle-to-Grave-full-report.pdf https://www.tesla.com/fr_FR/blog/teslas-closed-loop-battery-recycling-program?redirect=no “Cleaner Cars from Cradle to Grave” study published by the Union of Concerned Scientists (UCS)
PAGE 22 https://www.theguardian.com/environment/2015/may/18/fossil-fuel-companies-getting-10m-a-minute-in-subsidies-says-imf
https://electrek.co/2015/06/02/complete-breakdown-of-the-4-9-billion-in-government-support-the-la-times-claims-elon-musks-companies-are-receiving/ http://www.worldenergyoutlook.org/resources/energysubsidies/ http://www.forbes.com/sites/timworstall/2014/11/12/as-the-iea-says-the-550-billion-a-year-subsidy-to-fossil-fuels-restricts-renewables/#751d1b8f7ab1
PAGES 23-28 Financial Times, Morningstar, Google finance, Yahoo finance, Amigobulls, Nasdaq, Crunchbase, 4-traders.com, CNN and Reuters
Pictures used in the document: Tesla Motors Inc
The content of this document has been researched and implemented with a high degree of care. However, the possibility of errors in the processing of sources acknowledgement and copyright respect for external content use cannot be fully excluded. Please send any remarks or corrections to [email protected]
TESLA COMPANY REVIEW
OLMANEXTLTD|OCTOBER2016
Subscribe to OLMA Next’s free newsletter to get access to Case Study Nº2
32
CONTACT DETAILS
All data and information provided on this document is for informational purposes only. Frédéric Bonelli makes no representations as to accuracy, completeness, currentness, suitability, or validity of any information on this document and will not be liable for any errors, omissions, or delays in this information or any losses, injuries, or damages arising from its display or use. All information is provided on an as-is basis.
[email protected] +336 86 86 90 55
FREDERIC BONELLIResearcher
www.olmafund.com