test impacts and availability of water pursuant to...
TRANSCRIPT
Test Impacts and Availability of Water Pursuant
to Applications Pending Under Order 1169
Presentation to the Office of the Nevada State Engineer
U.S. Fish and Wildlife Service
Bureau of Land Management
National Park Service
June 28, 2013

| i P a g e
Contents Summary of Analyses and Conclusions from the Order 1169 Pumping Study/Test ..................................... 1
Summary of Analyses ............................................................................................................................... 1
Summary of Conclusions .......................................................................................................................... 3
Section 1 ‐ Impacts of Pumping under the Order 1169 Pumping Test ......................................................... 6
Impacts to Groundwater .......................................................................................................................... 6
Data Sources ......................................................................................................................................... 6
Summary of Analytical Methods .......................................................................................................... 6
Results and Discussion ......................................................................................................................... 9
Conclusions for Impacts to Groundwater .......................................................................................... 32
Impacts to Springs .................................................................................................................................. 34
Theoretical Groundwater Level/Spring Discharge Relationships ....................................................... 34
Data Sources and Data Quality........................................................................................................... 36
Methods ............................................................................................................................................. 41
Results and Discussion ....................................................................................................................... 42
Conclusions for Impacts to Springs .................................................................................................... 54
Section 2 – Modeling of Groundwater Pursuant to the Pending Applications ........................................... 57
Modeling Simulations of Pumping Impacts to Groundwater and Springs ............................................. 57
Tetra Tech Groundwater Flow Model ................................................................................................ 57
Simulations of the Potential Effects of Pumping the Pending Applications ...................................... 57
Post‐Audit of Second Year of the Order 1169 Test ............................................................................ 59
Conclusions from Modeling on the Availability of Groundwater Pursuant to the Pending Applications ........................................................................................................................................ 70
Section 3 ‐ Pumping Test Results and Groundwater Availability ................................................................ 72
Water Budget Analysis ....................................................................................................................... 72
Perennial Yield Analysis ...................................................................................................................... 73
Section 4 ‐ Public Interest Considerations and Federal Groundwater‐Dependent Resources ................... 76
USFWS Moapa Valley National Wildlife Refuge ................................................................................. 76
The Moapa Dace and its Vulnerability to Environmental Stressors ................................................... 78
NPS and BLM Groundwater‐Dependent Resources ........................................................................... 82
Conclusions from Public Interest Considerations .............................................................................. 83
Section 5 ‐ Overall Report Conclusions ....................................................................................................... 84
Section 6 – References ................................................................................................................................ 86

| ii P a g e
Appendix A
Table A.1 Specifications for Wells Utilized in Groundwater Analyses, Section 1 …………………. A.1.1
Supplemental Groundwater Hydrographs for Selected Wells in the Study Area …….…………... A.2.1
Supplemental Drawdown Hydrographs for Selected Wells in the Study Area …..…..………….... A.3.1
Results and Discussion of SeriesSEE Evaluation of Drawdown ………………………………..……........ A.4.1
Additional Appended Material Distributed Electronically
Excel Datafiles
Datafiles for Impacts to Groundwater Section
Datafiles for Impacts to Springs Section
Copies of Selected References

| 1 P a g e
SummaryofAnalysesandConclusionsfromtheOrder1169PumpingStudy/Test
SummaryofAnalyses
In 2002, the Nevada State Engineer issued Order 1169, which stated that all pending and new water
right applications in the carbonate‐rock aquifer in Coyote Spring Valley (Basin 210), Black Mountains
Area (Basin 215), Garnet Valley (Basin 216), Hidden Valley (Basin 217), the Muddy River Springs Area,
a.k.a. Upper Moapa Valley (Basin 219), and Lower Moapa Valley (Basin 220) would be held in abeyance
pending further study (NSE, 2002a). California Wash (Basin 218) was later added to the list through
Ruling 5115 (NSE, 2002b). The applications were held in abeyance because the State Engineer believed
he needed more information on the effects of groundwater pumping from the carbonate‐rock aquifer
before making a determination on pending water right applications in the listed basins. The order called
for a study covering a “5‐year minimum period of time during which at least 50% of the water rights then
currently permitted in the Coyote Spring Valley groundwater basin are pumped for at least two
consecutive years.”
The study/pumping test was delayed due to permitting issues and officially started several years later on
November 15, 2010. Carbonate pumping in Coyote Spring Valley (CSV), which began in 2006 and
averaged about 2,000 acre‐feet per year (afy) from 2006 to 2009, more than doubled to 5,400 afy during
the pumping test from November 15, 2010 to December 31, 2012. Groundwater pumping in adjacent
basins remained relatively constant during the period of the pumping test. The volume of pumping in
CSV during the test was approximately one‐third of the groundwater rights currently permitted in the
basin. The State Engineer declared in an amendment to Order 1169 (NSE, 2012e) that the test was
completed on December 31, 2012, saying he believed that sufficient information had been obtained
from the test and related monitoring to make a determination on the pending water right applications.
However, while the pumping test ended, the pumping in CSV has continued, to date, at approximately
the same rate as during the test. In the amended Order, the State Engineer invited study participants to
file a report interpreting the monitoring results and the information from the Order 1169 test.
The U.S. Fish and Wildlife Service, National Park Service, and Bureau of Land Management have
prepared this report in response to the State Engineer’s request for information related to the pumping
test. The report uses the monitoring data collected within the Study Area (Figure S‐1) to address the
three questions posed by the Nevada State Engineer in Order 1169A (NSE, 2012e):
What information was obtained from the pumping study/test?
What were the impacts of pumping under the pumping test?
What is the availability of water pursuant to the pending applications?

| 2 P a g e
Figure S‐1. The Study Area is defined as the area in which hydrologic data (groundwater level, production, and spring/stream discharge measurements/estimates) were collected as part of the 2‐year pumping test/study conducted in response to Order 1169, specifically: Coyote Spring Valley (Basin 210), the Muddy River Springs Area (Basin 219), Hidden Valley (Basin 217), Garnet Valley (Basin 216), the Black Mountains Area (Basin 215), California Wash (Basin 218), Lower Moapa Valley (Basin 220), and Lower Meadow Valley Wash (Basin 205).
| 3 P a g e
In this report, we analyze groundwater level, pumping, spring/stream discharge, and climatic data
collected before and during the Order 1169 pumping test to address these three questions. In Section 1,
we present a detailed evaluation of the impacts of pumping on groundwater levels and spring discharge.
In Section 2, we present results from a numerical groundwater model that was used to evaluate impacts
at future times and under varying pumping scenarios. We also use the model to evaluate the recovery of
the system following curtailment of pumping. In Section 3, we address the central question of
availability, given what was learned from the pumping test and previous water budget and perennial
yield information. In Section 4 of the report, we briefly discuss the potential implications of decreased
spring/stream discharge on groundwater‐dependent resources, such as Moapa dace and the Moapa
Valley National Wildlife Refuge (NWR). In the last section, we summarize our findings and conclusions.
SummaryofConclusions
What information was obtained from the pumping test?
Groundwater level, pumping, and spring/stream discharge data collected before and during the Order
1169 pumping test are sufficient to:
Document the immediate effects of the test pumping, including pumping approximately one‐
third of existing permitted groundwater rights in CSV, on groundwater levels and spring/stream
flows in the Study Area.
Delineate a portion of the carbonate‐rock aquifer, a subset of the Order 1169 Study Area, in
which pumping results in roughly equal drawdown throughout the area in a relatively short
period of time.
Develop a conceptual model of the delineated portion of the carbonate‐rock aquifer with
significant implications for the impacts of carbonate pumping anywhere within the area on
spring and stream flows and phreatophytic vegetation in the MRSA and California Wash.
Estimate the extent to which pumping was captured from groundwater storage (a lowering of
groundwater levels) as opposed to spring/stream discharge as of the end of the test, and
consequently the degree to which the full impacts of the test on spring/stream flows and
phreatophytic vegetation have been realized to date.
Determine the availability of water pursuant to applications pending under Order 1169.
What were the impacts of pumping under the pumping test?
Based on our analyses of groundwater level data from the pumping test, we have delineated a portion
of the carbonate‐rock aquifer, consisting of five hydrologic basins within the Study Area, in which
carbonate pumping results in drawdown of nearly uniform magnitude everywhere within the five basin
area within a period of months. The delineated area encompasses almost 700,000 acres, or 1,100 square
miles, and includes the following hydrographic basins: CSV, the MRSA, Hidden and Garnet valleys, and

| 4 P a g e
California Wash. Drawdown during the pumping test ranged from 1.9 to 2.5 ft throughout this portion of
the carbonate‐rock aquifer, with over half of the drawdown attributable to MX‐5 pumping in CSV. The
observed declines in groundwater levels are unprecedented in the record.
The near uniformity and large areal extent of drawdown indicates a high degree of hydrologic
connectivity throughout the five basins and suggests that carbonate pumping anywhere within these
five basins will affect groundwater levels throughout the delineated area. We hypothesize that this
portion of the carbonate‐rock aquifer acts as a high‐transmissivity (high‐diffusivity) reservoir with fixed
inflows. The potential for pumping to induce additional groundwater inflow into this portion of the
carbonate‐rock aquifer system is very limited. As a consequence, carbonate pumping would eventually
capture the only major forms of natural groundwater discharge in the area – spring/stream discharge
and ET in the MRSA and California Wash.
The drawdown observed, to date, has resulted in a small capture of spring discharge, and possibly ET, in
the MRSA and California Wash. Almost all the springs and flow monitoring sites in the MRSA showed
some level of decline during the pumping test. The degree to which spring discharges were impacted is a
function of the land surface elevation of the springs, with the higher elevation springs showing the
greater relative declines in discharge. The discharge at Pederson Spring, the highest elevation spring in
the MRSA, declined about 63% during the pumping test. If the current rate of carbonate pumping and
drawdown continues, this spring will be dry in another 1.5 years. The discharge at Pederson East Spring,
the second highest elevation spring in the MRSA, declined about 45% during the test and will be dry in
another 2.5 to 3 years, if the current rate of pumping and drawdown continues. Flows at Warm Spring
West flume declined about 9% during the test. Relative changes in flows at other lower elevation springs
and flow sites during the pumping test were ‐6% at Iverson Flume, ‐4% at both Jones Spring and Baldwin
Spring, and +19% per year at Muddy Springs. The flow increase at Muddy Springs may be partially due to
upstream effects from the July 2010 fire in the MRSA.
We estimate that 80 to 90% of groundwater withdrawn during the pumping test was captured from
groundwater storage, with only a small fraction captured from natural groundwater discharge. We
interpret this to mean that the system has not yet reached equilibrium with respect to the increased
carbonate pumping imposed during the test. The potential for drawdown to induce more inflow into the
area is very low because the increase in hydraulic gradient will be 1% or less. Therefore, all pumping
from the carbonate‐rock aquifer in this area must eventually capture the only forms of natural
groundwater discharge in the area before a new state of equilibrium can be established. Consequently,
we expect the longer‐term impacts from the current level of pumping on spring discharge and ET rates
in the MRSA and California Wash to be much greater as the system transitions from capture of
groundwater storage to capture of groundwater discharge.
Although the pumping test has been completed, SNWA has chosen so far to continue the pumping at
MX‐5 in CSV at approximately the same rate, presumably to augment water supply for Las Vegas. It is
not known how much longer this pumping will continue. Numerical pumping simulations performed by
Tetra Tech (2012b) show that pumping in the carbonate‐rock aquifer at the rates imposed during the
test (or greater) can be expected to result in substantial additional declines in groundwater levels and

| 5 P a g e
spring and stream flows beyond those observed as of the end of the test. The results of the ‘post‐audit’
simulation of the second year of the test suggest that the Tetra Tech Version 1.0 Model used to perform
these pumping simulations (Tetra Tech, 2012a) underestimates the amount of drawdown created by
pumping and the impacts to spring discharges, and overestimates the timeframes in which the projected
impacts will occur, but the areal extent of drawdown is simulated accurately.
The recovery simulation, in which MX‐5 pumping was simulated as being stopped as of the end of the
test, suggests that recovery of water levels from the effects of MX‐5 pumping would take years, and that
in the MRSA, recovery from the MX‐5 test pumping would be approximately 70% complete after 15
years. Longer periods or greater volumes of pumping will result in even slower recovery. This has some
serious implications for the effectiveness of management strategies aimed at reducing or curtailing
pumping in order to protect spring flows, biological resources, and downstream water rights.
While the pumping test yielded much information, there are some things that are still uncertain. The
level of pumping in CSV during the test was only one‐third of the annual volume allocated in CSV under
existing water right permits, although the Order required that 50% of the existing permitted rights be
pumped. Therefore, the impacts of pumping half or all of the permitted allocation in this basin were not
evaluated. The effectiveness of pumping reductions or curtailment was simulated with the modeling but
was not directly evaluated during the test. If the higher elevation springs stop flowing completely, it is
not known how fast or how effectively the system will respond to adjustments in pumping and whether
biological resources may be adversely affected in the process.
What is the availability of water pursuant to the pending applications?
Our review of earlier water budget and perennial yield information for CSV, as presented in Order 1169
(NSE, 2002a), leads to the conclusion that there is no water available for appropriation within the five‐
basin area delineated through our groundwater analyses (CSV, the MRSA, Hidden and Garnet valleys,
and California Wash). The water budget information and pumping test results suggest that all available
water in CSV is appropriated and our additional analysis of information in recent rulings suggests that
the basin may currently be over‐appropriated. Additionally, the groundwater modeling simulation
results, which examined progressively greater pumping of pending water rights in these five basins,
provide supporting evidence to the wide‐ranging effects that can be expected in these five basins with
increased pumping.
An average of 5,400 afy of groundwater was withdrawn in CSV over the period of the test. This is only
one‐third of the 16,300 afy of existing permitted rights to groundwater already appropriated in CSV. The
pumping test provides evidence that even this reduced volume of groundwater pumping cannot be
developed long‐term without adverse impacts to springs, endangered fish, Federal trust resources, and
downstream senior water rights. Consequently, we conclude that no additional groundwater is available
for appropriation to satisfy the pending water right applications that are currently being held in
abeyance for this portion of the carbonate‐rock aquifer.

| 6 P a g e
Section1‐ImpactsofPumpingundertheOrder1169PumpingTest
ImpactstoGroundwater
In this section of the report, we analyze the impact of the Order 1169 pumping test on groundwater
levels throughout the Study Area. Interpretations presented in this section focus largely on the analysis
of groundwater level observations and production from the carbonate‐rock aquifer.
DataSources
Groundwater level and production data used in these analyses, including the source, frequency, period
of record, monitoring agency or organization, and location and physical characteristics of wells utilized
in these analyses are summarized in Table A.1 (Appendix A). Figure 1.1 shows the locations of these
monitoring and production wells within the Study Area. Data interpreted in this section can be found on
a data exchange Web site maintained by the Nevada State Engineer for the Order 1169 pumping test as
of the time of this report (NDWR 2012).
Monthly precipitation data from Nevada Climate Division 4 (Extreme Southern Nevada) are used to
represent precipitation in the Study Area. Nevada Climate Division 4 includes CSV and the MRSA (see
appended data file: NV Climate Divisional 3_4 and PRISM pcp data 1985‐2012.xlsx for maps). Mayer and
Congdon (2008) found that 24‐month moving average precipitation data from this division correlated
best with carbonate water levels in the MRSA. Climate division data through 2012 are available at
http://www.wrcc.dri.edu/spi/divplot2map.html. For comparison, we also examined monthly
precipitation data from Nevada Climate Division 3 (South Central Nevada), which is north of the CSV‐
MRSA area, and monthly PRISM precipitation data, compiled for the area of the Moapa Valley NWR and
for the entire White River Flow System. PRISM data are available at http://prism.oregonstate.edu/.
SummaryofAnalyticalMethods
For the purposes of these analyses, we assume the pumping test started on September 15, 2010 and
ended on December 31, 2012. The official start date of the test was November 15, 2010. However,
significant pumping was initiated at carbonate production well MX‐5 in CSV on September 15, 2010.
While MX‐5 pumping was discharged to Pahranagat Wash from September 15 through October 29,
2010, we see no evidence that this affected carbonate water levels in the area in any major way (Figure
A.2‐1). Lastly, we informally refer to the test as a “2‐year pumping test” in this section even though the
test length actually exceeded two years by several months.

| 7 P a g e
.
Figure 1.1. Map showing the locations of monitoring and production wells utilized in analyses presented in this report (on a base map of surficial hydrogeology prepared by SNWA 2007a)

| 8 P a g e
We computed water year (Oct‐Sept) precipitation from 1987 to 2012 from the four sources of monthly
precipitation referenced in the Data Sources section above: NV Climate Division 3 and 4 and PRISM data
for two separate geographic areas. Water year was used rather than calendar year so as not to split the
winter precipitation season arbitrarily. We primarily utilize NV Climate Division 4 data in subsequent
analyses since it encompasses CSV and the MRSA, but also examine the other sources of precipitation
data to emphasize the consistency in wet and dry years throughout the region.
Our evaluation of groundwater level and production data includes several different forms of analysis to
evaluate the effects of the Order 1169 pumping test:
time series hydrographs of groundwater levels, drawdown, and pumping for carbonate
monitoring and production wells throughout the Study Area;
multiple linear regression with time and terms that account for seasonality to determine the
drawdown rate in EH‐4 during the period of the pumping test.
multiple linear regression of the average annual water level in EH‐4 from 1987 to 2012 with
water year precipitation and annual carbonate pumping in CSV and the MRSA.
distance‐drawdown hydrographs along two transects through the Study Area;
SeriesSEE analyses of groundwater level data collected during and prior to the pumping test in a
range of monitoring wells throughout the Study Area, accounting for all major pumping in the
area;
development of a conceptual model leading to identification of a portion of the carbonate‐rock
aquifer in which pumping causes water level declines of roughly equal magnitude throughout
this part of the aquifer, depletion of the Muddy River Springs, and capture of other forms of
natural discharge in the MRSA and California Wash; and
an assessment of the extent to which the test pumping was captured from groundwater
storage, as opposed to natural discharge (spring and stream discharge and evapotranspiration),
as of the end of the test.
For the time series hydrographs and distance‐drawdown hydrographs, drawdown was estimated as the
change in groundwater elevation from the beginning to the end of the pumping test (9/15/2010 to
12/13/2012, the last date of available water level data for sites with periodic measurements). Because
the SeriesSEE analyses interpret changes in groundwater levels during the test that are, in part, due to
pumping that predated the test, this analysis evaluates drawdown over a longer period, 1/1/2008 to
12/13/2012.
No corrections have been made for changes in groundwater levels due to earth tides and fluctuations in
barometric pressure in any of these analyses. We believe that these corrections, had they been made in
estimating drawdown, would be on the order of a few tenths of a foot, the magnitude of corrections

| 9 P a g e
made to carbonate water levels in California Wash during a previous study (Waddell and Roemer, 2006).
Likewise, no corrections have been made for longer‐term (regional) trends in groundwater levels given
continued uncertainties concerning the availability of a ‘reference’ well that can be used to make such
corrections1. Additional information concerning methods employed to analyze groundwater level and
production data are provided later in this section.
ResultsandDiscussion
Table 1.1 summarizes average production rates and volumes from major production wells listed in Table
A.1 over the 2‐year test period, pumping which influenced groundwater level and spring/stream
discharge data collected during the test. The appended data file (Order_1169_Monthly_Pumpage
data.xls) summarizes the historical carbonate and basin‐fill pumping data from five basins in the Study
Area (CSV, the MRSA, Garnet Valley, California Wash, and the Black Mountains Area) from 1987 to 2012.
Basin‐fill pumping in the MRSA has been ongoing for decades and has been relatively constant,
averaging about 5,000 afy since 1987. Significant carbonate pumping first began in the Study Area in
1992 in the MRSA, averaging about 1,000 afy from 1992 to 1997. Carbonate pumping in the MRSA more
than doubled in 1998, when pumping at the Arrow Canyon well began, and has averaged about 2,300
afy from 1998 to 2012. Carbonate pumping in CSV essentially began in 2006, averaging about 2,000 afy,
and increased to more than 5,000 afy in 2010 with the start of the pumping test. There was 7,500 afy of
combined carbonate pumping from CSV and the MRSA during the period of the pumping test, with
5,400 afy, or 70%, of this occurring in CSV. The 5,400 afy in CSV represents only about one‐third of the
total annual pumping rate currently appropriated through existing water right permits in CSV. Carbonate
pumping in Garnet Valley has been ongoing since at least 2000, but at a fairly small rate. It averaged
about 800 afy from 2000‐2005 and about 1,200 afy from 2006‐2012 and did not change substantially
during or just before the pumping test. Carbonate pumping in California Wash has been very small,
about 20 afy from 2009 to 2012, with no pumping prior to that. The total carbonate pumping during the
test in CSV, the MRSA, Hidden and Garnet valleys, and California Wash was about 8,540 afy or 19,900 af
in total.
The appended data file for precipitation data (NV Climate Divisional 3_4 and PRISM pcp data 1985‐
2012.xlsx) shows water year precipitation in both NV Climate Divisions as well as PRISM data for the
area of the Moapa Valley NWR and the area of the White River Flow System. Data for all areas and
sources are consistent in terms of wet and dry years (see the correlation matrix in the appended data
file). All four data sources indicate that there was above average precipitation in water year 2011, which
begins October 2010 and coincides with the start of the pumping test. Consequently, the first year of the
pumping test was conducted during fairly wet conditions. We only present NV Climate Division 4
(Extreme Southern Nevada) precipitation data for the remainder of the report.
1 The HRT identified CSVM‐3 as a potential reference well, however, our SeriesSEE analyses presented later in this section suggest that changes in groundwater levels in CSVM‐3 since 2008 include the effects of MX‐5 pumping, superimposed on the more pronounced effects of a reduction in pumping at carbonate production well CSI‐3 in CSV, rather than a long‐term (regional) trend.

| 10 P a g e
Table 1.1. Average production rates from major (utility‐ and industrial‐scale) production wells within the Order 1169 Study Area during the test (9/15/2010 to
12/31/2012).
Basin Name Wells Average Production Rate
9/15/10 ‐ 12/31/12 (afy)
Total Volume of Pumping 9/15/10 ‐ 12/31/12
(af)
CSV MX‐5 4,072 9,332
CSV MX‐5, CSI‐1, CSI‐2, CSI‐3, CSI‐4 5,383 12,325
Total MRSA (carbonate) MX‐6, Arrow Canyon‐1, Arrow Canyon‐2 2,094 4,800
Total CSV and MRSA (carbonate) 7,477 17,125
Central Garnet Valley GV‐Migrant 1, GV‐Duke‐WS1 and ‐WS2, GV‐PW‐WS1, GV‐RW1 637 1,459
Southern Garnet Valley Chem‐Lime Old, Chem‐Lime New, Republic Wells 1, 2, 5, and 6 558 1,278
Total Garnet Valley 1,194 2,737
California Wash TH‐1, ECP‐1, ECP‐2, ECP‐3 23 52
Total CSV, MRSA (carbonate), Garnet, & CA Wash 8,539 19,914
Black Mountains Area All NV Cogen Carbonate Wells 1,463 3,353
Total MRSA (basin‐fill) All Nevada Energy Basin‐Fill Wells 3,649 8,363
| 11 P a g e
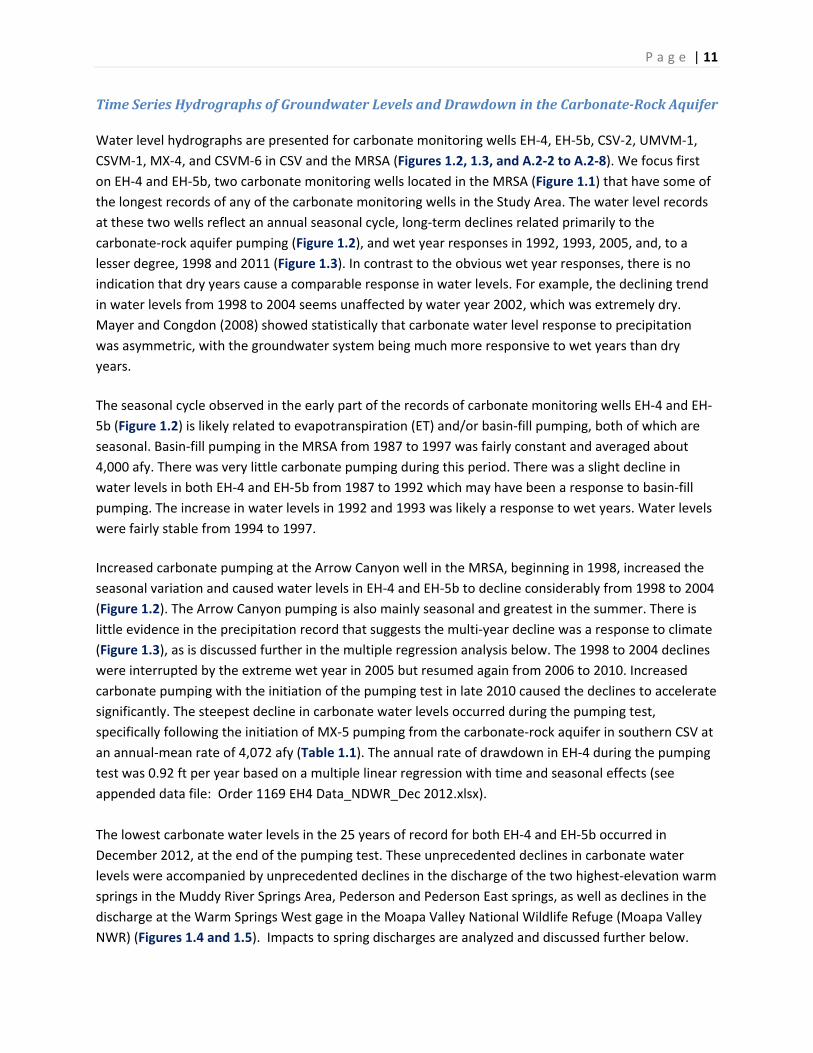
TimeSeriesHydrographsofGroundwaterLevelsandDrawdownintheCarbonate‐RockAquifer
Water level hydrographs are presented for carbonate monitoring wells EH‐4, EH‐5b, CSV‐2, UMVM‐1,
CSVM‐1, MX‐4, and CSVM‐6 in CSV and the MRSA (Figures 1.2, 1.3, and A.2‐2 to A.2‐8). We focus first
on EH‐4 and EH‐5b, two carbonate monitoring wells located in the MRSA (Figure 1.1) that have some of
the longest records of any of the carbonate monitoring wells in the Study Area. The water level records
at these two wells reflect an annual seasonal cycle, long‐term declines related primarily to the
carbonate‐rock aquifer pumping (Figure 1.2), and wet year responses in 1992, 1993, 2005, and, to a
lesser degree, 1998 and 2011 (Figure 1.3). In contrast to the obvious wet year responses, there is no
indication that dry years cause a comparable response in water levels. For example, the declining trend
in water levels from 1998 to 2004 seems unaffected by water year 2002, which was extremely dry.
Mayer and Congdon (2008) showed statistically that carbonate water level response to precipitation
was asymmetric, with the groundwater system being much more responsive to wet years than dry
years.
The seasonal cycle observed in the early part of the records of carbonate monitoring wells EH‐4 and EH‐
5b (Figure 1.2) is likely related to evapotranspiration (ET) and/or basin‐fill pumping, both of which are
seasonal. Basin‐fill pumping in the MRSA from 1987 to 1997 was fairly constant and averaged about
4,000 afy. There was very little carbonate pumping during this period. There was a slight decline in
water levels in both EH‐4 and EH‐5b from 1987 to 1992 which may have been a response to basin‐fill
pumping. The increase in water levels in 1992 and 1993 was likely a response to wet years. Water levels
were fairly stable from 1994 to 1997.
Increased carbonate pumping at the Arrow Canyon well in the MRSA, beginning in 1998, increased the
seasonal variation and caused water levels in EH‐4 and EH‐5b to decline considerably from 1998 to 2004
(Figure 1.2). The Arrow Canyon pumping is also mainly seasonal and greatest in the summer. There is
little evidence in the precipitation record that suggests the multi‐year decline was a response to climate
(Figure 1.3), as is discussed further in the multiple regression analysis below. The 1998 to 2004 declines
were interrupted by the extreme wet year in 2005 but resumed again from 2006 to 2010. Increased
carbonate pumping with the initiation of the pumping test in late 2010 caused the declines to accelerate
significantly. The steepest decline in carbonate water levels occurred during the pumping test,
specifically following the initiation of MX‐5 pumping from the carbonate‐rock aquifer in southern CSV at
an annual‐mean rate of 4,072 afy (Table 1.1). The annual rate of drawdown in EH‐4 during the pumping
test was 0.92 ft per year based on a multiple linear regression with time and seasonal effects (see
appended data file: Order 1169 EH4 Data_NDWR_Dec 2012.xlsx).
The lowest carbonate water levels in the 25 years of record for both EH‐4 and EH‐5b occurred in
December 2012, at the end of the pumping test. These unprecedented declines in carbonate water
levels were accompanied by unprecedented declines in the discharge of the two highest‐elevation warm
springs in the Muddy River Springs Area, Pederson and Pederson East springs, as well as declines in the
discharge at the Warm Springs West gage in the Moapa Valley National Wildlife Refuge (Moapa Valley
NWR) (Figures 1.4 and 1.5). Impacts to spring discharges are analyzed and discussed further below.

| 12 P a g e
0
2,000
4,000
6,000
8,000
10,000
12,000
14,000
16,000
18,000
20,000
22,000
24,000
26,000
28,000
1808
1809
1810
1811
1812
1813
1814
1815
1816
1817
1818
Monthly‐M
ean
Production (afy)
Groundwater Elevation (ft, am
sl)
Year
MX‐5 Monthly‐Mean Carbonate Pumping (afy) CSV ‐MRSA Monthly‐Mean Carbonate Pumping (afy)
EH‐4 Groundwater Elevation Measurements (ft amsl) EH‐5b Groundwater Elevation Measurements (ft amsl)
Linear t rendlines for 1998‐2004, 2006‐2010, 2010‐2012
Figure 1.2. Groundwater elevations in carbonate monitoring wells EH‐4 and EH‐5b in the MRSA and monthly‐mean production rates in the carbonate‐rock aquifer at production well MX‐5 and in the combined CSV and MRSA area from 1987 to 2012. Linear trendlines are shown for 1998‐2004, 2006‐2010, and 2010‐2012.
1987 1989 1991 1993 1995 1997 1999 2001 2003 2005 2007 2009 2011 2013
0
2
4
6
8
10
12
14
16
1811
1812
1813
1814
1815
1816
1817
1818
1819
1986 1990 1994 1998 2002 2006 2010
Precipitation (in)
Water Level Elevation (ft)
Year
Climate Div 4 WY pcp continuous dataInstantaneous measurements 2 per. Mov. Avg. (Climate Div 4 WY pcp )
Period of Order 1169
Test
Figure 1.3. Groundwater elevations in carbonate monitoring well EH‐4 in the MRSA and Nevada Climate Division 4 water year precipitation (centered on April of each water year) for the period 1987 to 2012. The black line shows the 2‐year moving average of precipitation.

| 13 P a g e
Figure 1.4. Monthly‐mean discharge of Pederson and Pederson East springs in the MRSA (Moapa Valley National Wildlife Refuge), January 2004 to January 2013 and June 2002 to January 2013, respectively, and monthly‐mean production rates in the carbonate‐rock aquifer at production well MX‐5 and in the combined CSV and MRSA area from 1992 to 2012.
Figure 1.5. Monthly‐mean discharge at the Warm Springs West gage on Pederson stream in the MRSA (Moapa Valley National Wildlife Refuge), January 2000 to January 2013, and monthly‐mean production rates in the carbonate‐rock aquifer at production well MX‐5 and in the combined CSV and MRSA area from 1992 to 2012.
0
2,000
4,000
6,000
8,000
10,000
12,000
14,000
16,000
18,000
20,000
22,000
24,000
26,000
28,000
0.00
0.05
0.10
0.15
0.20
0.25
0.30
0.35
Monthly‐M
ean
Production (afy)
Monthly‐M
ean
Discharge
(cfs)
YearMX‐5 Monthly‐Mean Carbonate Pumping (afy) CSV‐MRSA Monthly‐Mean Carbonate Pumping (afy)Pederson Spring Monthly‐Mean Discharge (cfs) Pederson East Spring Monthly‐Mean Discharge (cfs)
0
2,000
4,000
6,000
8,000
10,000
12,000
14,000
16,000
18,000
20,000
22,000
24,000
26,000
28,000
3.0
3.1
3.2
3.3
3.4
3.5
3.6
3.7
3.8
3.9
4.0
4.1
Monthly‐M
ean
Production (afy)
Monthly‐M
ean
Discharge
(cfs)
YearMX‐5 Monthly‐Mean Carbonate Pumping (afy) CSV‐MRSA Monthly‐Mean Carbonate Pumping (afy)Warm Springs West Gage Monthly‐Mean Discharge (cfs)

| 14 P a g e
Regression analysis demonstrates the influence of precipitation and carbonate pumping on carbonate
water levels in the MRSA. A multiple linear regression with three explanatory variables: the square
transform of 2‐year moving average Climate Division 4 WY precipitation; annual carbonate pumping in
the MRSA; and annual carbonate pumping in the CSV, explains 83% of the variance in average annual
carbonate water levels in EH‐4 from 1987 to 2012 (adjusted r2=0.834, Figure 1.6). The regression
coefficients are positive for precipitation (indicating increases in water levels with greater precipitation)
and negative for the two carbonate pumping terms (indicating decreases in water levels with greater
pumping). The value of the regression coefficient was slightly more negative for carbonate pumping in
the MRSA than in CSV, which may indicate a slightly higher sensitivity of EH‐4 water levels to carbonate
pumping in the MRSA. Mayer and Congdon (2008) explored the influence of precipitation and pumping
in greater detail.
1812
1813
1814
1815
1816
1817
1818
1819
1812 1813 1814 1815 1816 1817 1818 1819
Predicted EH4 Annual W
ater Level (ft)
Observed EH4 Annual Water Level (ft)
Annual EH4 level = 0.0095*WY pcp^2 ‐ 0.00078*MRSA carb pumping ‐ 0.00033*CSV carb pumping + 1817.26adj r2 = 0.83, std err = 0.47
Figure 1.6. Predicted and observed annual average carbonate water levels in EH‐4 for the period 1987 to 2012. The three explanatory variables are described in the text. Units are inches for precipitation, and acre‐feet/year for pumping. The multiple regression explains 83% of the variance in annual water levels in EH‐4.
While all three explanatory variables were statistically significant, the two carbonate pumping terms are
much more important than the precipitation term in explaining variance in annual carbonate water
levels. Without the precipitation term, the two carbonate pumping terms still explain 80% of the
variance in annual EH‐4 water levels. However, using the precipitation term only, without terms for
carbonate pumping in the regression, explains only 3% of the variance and the precipitation term is not
even statistically significant in the regression (p=0.34). This strongly suggests that the long‐term declines
in water levels observed in EH‐4 and EH‐5b, which comprise most of the variance being explained in the
regression, were caused by carbonate pumping rather than climate. Annual alluvial pumping in the
MRSA was not a significant explanatory variable in the multiple linear regression.

| 15 P a g e
Based on these observations (primarily the response to MX‐5 pumping), we conclude that saturated
carbonate rocks of southern CSV and the MRSA are part of a single carbonate‐rock aquifer system and
the warm springs of the MRSA discharge from this aquifer. That is, the warm springs, already known to
discharge from the carbonate‐rock aquifer based on their temperature and chemistry (Eakin, 1966), and
the aquifer, are one hydrologic system. Consequently, the warm springs can be impacted by drawdown
induced by pumping in the carbonate‐rock aquifer in CSV and the MRSA.
Water level hydrographs for carbonate monitoring wells M‐3, M‐2, and GV‐1 in Garnet Valley, and TH‐2
and M‐1 in California Wash, along with carbonate pumping in those same basins are presented in Figure
1.7. Groundwater records for carbonate monitoring wells in CSV, Garnet Valley and California Wash
(Figures 1.7 and A.1‐2 to A.1‐9) are generally shorter than those for EH‐4 and EH‐5b (Figure 1.2), but for
the overlapping periods all the hydrographs are similar. Groundwater levels in all of the monitoring wells
declined from 2001 to 2004 (where data are available), increased in response to the extreme wet year in
2005, resumed their decline from 2006 to 2010, and began to decline much more rapidly with the
initiation of the pumping test in late 2010. We acknowledge that none of these records have been
corrected for the effects of barometric pressure fluctuations and earth tides. However, these
corrections, had they been made, would be on the order of tenths of feet, an order of magnitude less
than the trends observed in the carbonate wells. Therefore, the overall trends cannot be due to these
other factors.
The effects of MX‐5 pumping in southern CSV appear to be present in groundwater level hydrographs
for carbonate monitoring wells in Garnet Valley and California Wash (Figure 1.7). Specifically, combined
pumping in carbonate production wells in Garnet Valley, the Black Mountains Area, and California Wash
has been relatively stable since 2006; yet groundwater levels in carbonate monitoring wells in Garnet
Valley and California Wash dropped to unprecedented levels following the introduction of MX‐5
pumping in southern CSV in 2010 (Figure 1.7). Moreover, groundwater level hydrographs for carbonate
monitoring wells in Garnet Valley and California Wash closely resemble those for wells in CSV and the
MRSA that clearly include the signature of MX‐5 pumping (Figures 1.2, 1.7, A.1‐2 to A.1‐4, A.1‐8, and
A.1‐9). This suggests, at a minimum, that carbonate pumping in CSV produces drawdown in the
carbonate‐rock aquifer in Garnet Valley and California Wash, as well as the MRSA (the source of the
Muddy River Springs and Muddy River).

| 16 P a g e
Figure 1.7. Groundwater elevations in carbonate monitoring wells M‐3, M‐2, and GV‐1 in Garnet Valley and TH‐2 and M‐1 in California Wash and monthly‐mean production rates from the carbonate‐rock aquifer in central Garnet Valley (GV‐MIGRANT 1, GV‐DUKE‐WS1, GV‐DUKE‐WS2, GV‐PW‐WS1, and GV‐RW1) and Garnet Valley and California Wash as a whole from 2001 to 2012.
There appears to be a groundwater divide in the carbonate‐rock aquifer at the southern end of CSV
based on water level elevations in carbonate monitoring well CSVM‐2 which are consistently higher than
those in nearby carbonate monitoring wells CSVM‐1, to the north, and SHV‐1, to the south in Hidden
Valley. We interpret this to be due to the development of local cones of depression in the CSV‐MRSA
area and Garnet Valley in response to long‐term pumping in the MRSA and Garnet Valley, respectively.
We note, however, that the presence of this groundwater divide does not preclude the propagation of
drawdown due to pumping in CSV and (or) the MRSA into Hidden and Garnet valleys or California Wash,
or vice versa, through the carbonate‐rock aquifer.
Hydrographs showing drawdown in carbonate monitoring wells of CSV and the MRSA during the
pumping test and monthly‐mean production in the carbonate‐rock aquifer at production well MX‐5 and
in the combined CSV and MRSA area are presented in Figures 1.8 to 1.10. Hydrographs showing
drawdown in carbonate monitoring wells of Hidden and Garnet valleys and California Wash during the
pumping test and combined monthly‐mean production in the carbonate‐rock aquifer at MX‐5, in the
combined CSV and MRSA area, central Garnet Valley (the Apex area), and Garnet Valley and California
Wash are presented in Figures A.3‐1 to A.3‐4. The timing and magnitude of increases and decreases in
drawdown in carbonate monitoring wells of CSV, the MRSA, Garnet Valley, and California Wash are
0
1,000
2,000
3,000
4,000
5,000
6,000
7,000
8,000
9,000
1804
1805
1806
1807
1808
1809
1810
1811
1812
1813
1814
1815
1816
1817
Monthly‐M
ean
Production (afy)
Groundwater Elevation (ft, amsl)
Year
Garnet V‐Calif Wash Monthly‐Mean Carbonate Pumping (afy) Central Garnet Monthly‐Mean Carbonate Pumping (afy)
M‐3 Groundwater Elevation Measurements (ft amsl) M‐2 Groundwater Elevation Measurements (ft amsl)
TH‐2 Groundwater Elevation Measurements (ft amsl) M‐1 Groundwater Elevation Measurements (ft amsl)
GV‐1 Groundwater Elevation Measurements (ft amsl)

| 17 P a g e
similar and coincide with periods of pumping and shutdowns at MX‐5 in CSV (subject to time lags on the
order of months). Additionally, total drawdown in the carbonate‐rock aquifer in the four basins as of the
end of the test was similar in magnitude, ranging from 1.9 to 2.5 feet. Again, this suggests that
carbonate pumping in CSV produces drawdown in the carbonate‐rock aquifer in Garnet Valley and
California Wash, as well as the MRSA, and that the entire area is hydrologically‐connected.
Figure 1.8. Drawdown in carbonate monitoring wells CSVM‐1 in CSV and UMVM‐1, EH‐5b, and EH‐4 in the MRSA, versus monthly‐mean production rates in the carbonate‐rock aquifer at production well MX‐5 and in the combined CSV and MRSA area, from September 15, 2010, to December 31, 2012, i.e., during the 2‐year pumping test.
0
2000
4000
6000
8000
10000
12000
14000
16000
18000
20000
22000
24000
26000
28000
‐2.0
‐1.5
‐1.0
‐0.5
0.0
0.5
1.0
1.5
2.0
2.5
3.0
Monthly‐M
ean
Production (afy)
Drawdown During 2‐Year Test Period (ft)
YearCSV‐MRSA Monthly‐Mean Carbonate Pumping (afy) MX‐5 Monthly‐Mean Carbonate Pumping (afy)
EH‐4 Test Drawdown (ft) EH‐5b Test Drawdown (ft)
UMVM‐1 Test Drawdown (ft) CSVM‐1 Test Drawdown (ft)

| 18 P a g e
Figure 1.9. Drawdown in carbonate monitoring well CSV‐2 in the MRSA versus monthly‐mean production rates in the carbonate‐rock aquifer at production well MX‐5 and in the combined CSV and MRSA area, from September 15, 2010, to December 31, 2012, i.e., during the 2‐year pumping test.
Figure 1.10. Drawdown in carbonate monitoring wells CSVM‐1, CSVM‐6, CE‐VF‐2, and CSVM‐4 in CSV, versus monthly‐mean production rates in the carbonate‐rock aquifer at production well MX‐5 and in the combined CSV and MRSA area, from September 15, 2010, to December 31, 2012, i.e., during the 2‐year pumping test.
0
2000
4000
6000
8000
10000
12000
14000
16000
18000
20000
22000
24000
26000
28000
‐2.0
‐1.5
‐1.0
‐0.5
0.0
0.5
1.0
1.5
2.0
2.5
3.0
Monthly‐M
ean
Production (afy)
Drawdown During 2‐Year Test Period (ft)
Year
CSV‐MRSA Monthly‐Mean Carbonate Pumping (afy) MX‐5 Monthly‐Mean Carbonate Pumping (afy)
CSV‐2 Test Drawdown (ft)
0
2000
4000
6000
8000
10000
12000
14000
16000
18000
20000
22000
24000
26000
28000
‐2.0
‐1.5
‐1.0
‐0.5
0.0
0.5
1.0
1.5
2.0
2.5
3.0
Monthly‐M
ean
Production (afy)
Drawdown During 2‐Year Test Period (ft)
YearCSV‐MRSA Monthly‐Mean Carbonate Pumping (afy) MX‐5 Monthly‐Mean Carbonate Pumping (afy)
CSVM‐1 Test Drawdown (ft) CSVM‐6 Test Drawdown (ft)
CE‐VF‐2 Test Drawdown (ft) CSVM‐4 Test Drawdown (ft)

| 19 P a g e
Distance‐DrawdownHydrographsintheCarbonate‐RockAquifer
Drawdown as a function of distance along two transects through the Study Area, CSV to the MRSA and
CSV to California Wash through Hidden and Garnet valleys, respectively, is presented in Figures 1.11 and
1.12 for the following times during the test:
10/29/2010, the end of the first MX‐5 pumping period (after 1.5 months of MX‐5 pumping);
5/15/2011, the end of the second MX‐5 pumping period (after a 1‐month shut‐down and an
additional 5.5 months of MX‐5 pumping);
7/10/2011, the end of a ~2 month recovery period from MX‐5 pumping;
1/14/2012, the end of the third MX‐5 pumping period (after an additional ~5 months of MX‐5
pumping);
4/22/2012, the end of a ~3.5 month recovery period from MX‐5 pumping; and
12/13/20122, the end of the fourth MX‐5 pumping period and end of the test (after an
additional ~7.5 months of continuous MX‐5 pumping).
The transect from CSV to the MRSA represents a zone of known high transmissivity within the
carbonate‐rock aquifer3, consequently a likely path for the propagation of drawdown originating in CSV.
The transect from CSV to California Wash through Hidden and Garnet valleys is likewise a physically
plausible path for the propagation of drawdown originating in CSV given the apparent presence of a MX‐
5 pumping signature in water level hydrographs for carbonate monitoring wells in Garnet Valley and the
results of SeriesSEE analyses presented later in this report.
2 12/13/2012 was the date of the last groundwater level measurement in a large number wells monitored as part of the Order 1169 test. 3 Based on the calibration of flow models to date.

| 20 P a g e
Figure 1.11. Distance‐drawdown hydrographs along a transect from northern CSV to the MRSA at a series of times during the 2‐year test period.
The shapes of the distance‐drawdown hydrographs presented in Figures 1.11 and 1.12 indicate that
drawdown in the carbonate‐rock aquifer was at a maximum at the location of production well MX‐5 in
southern CSV throughout the 2‐year test, except for periods of recovery following intermittent shut‐
downs of MX‐5. During periods of recovery from MX‐5 pumping, the greatest rebound in groundwater
levels occurred in the area of MX‐5, as expected. The introduction of MX‐5 pumping at an average rate
of 4,070 afy during the test represented a significant stress on the carbonate‐rock aquifer system. The
rate of MX‐5 pumping during the test exceeded the combined rate of pumping at all other carbonate
production wells in the CSV‐MRSA area (3,405 afy) and significantly exceeded the combined rate of
carbonate pumping in Garnet Valley and California Wash (1,220 afy). Consequently, drawdown was at a
maximum at the location of MX‐5 during all phases of the test in which MX‐5 was pumping.
‐0.2
0.0
0.2
0.4
0.6
0.8
1.0
1.2
1.4
1.6
1.8
2.0
2.2
2.4
2.6
2.8
3.0
‐20 ‐15 ‐10 ‐5 0 5 10 15 20
Drawdown in
Carbonate
Monitoring Wells During Test (ft)
Distance from Production Well MX‐5 (miles)
Development of Cone of Depression in Response to Test Pumping ‐‐ CSV to the MRSA ‐‐
10/29/10, End of 1st MX‐5 Pumping Period (1.5 Months of Pumping) 5/15/11, End of 2nd MX‐5 Pumping Period (Additional 5.5 Months of Pumping)
7/10/11, End of ~2 Month Recovery Period from MX‐5 Pumping 1/14/12, End of 3rd MX‐5 Pumping Period (Additional ~5 Months of Pumping)
4/22/12, End of ~3.5 Month Recovery Period from MX‐5 Pumping 12/13/12, Approximate End of Test (Additional ~7.5 Months of MX‐5 Pumping)
CSVM‐4[0.5' = MX‐5 DD]
EH‐4[1.2' = MX‐5 DD]
UMVM‐1
CSVM‐6[1.2' = MX‐5 DD]
CSVM‐1
CE‐VF‐2

| 21 P a g e
Figure 1.12. Distance‐drawdown hydrographs along a transect from northern CSV to California Wash through Hidden and Garnet valleys at a series of times during the 2‐year test period.
As of mid‐May 2011, following 7 months of MX‐5 pumping and a 1‐month recovery period, drawdown
due to the test pumping extended over a distance of at least 7 miles in the carbonate‐rock aquifer from
central CSV (well CSVM‐6) to western MRSA (well UMVM‐1) and at least 22 miles from central CSV
(CSVM‐6) to northern Garnet Valley (well M‐3). As of mid‐January 2012, following 13 months of MX‐5
pumping in 3 periods and 3 months of recovery in 2 rest periods, drawdown in the carbonate‐rock
aquifer extended over a distance of about 27 miles from the northern end of CSV (well CSVM‐4) to the
Muddy River Springs (well EH‐4) and 47 miles from northern CSV (CSVM‐4) to California Wash (wells TH‐
2 and M‐1) through Hidden and Garnet valleys.
The cone of depression that developed in the carbonate‐rock aquifer between CSV and the MRSA
following initiation of the test is shallow, relatively flat, and areally extensive (Figure 1.11). This is
consistent with the known high transmissivity and hydraulic diffusivity of this portion of the regional
carbonate‐rock aquifer based on documented low hydraulic gradients under pre‐test conditions, as well
as the calibration of two groundwater flow models (the CCRP Model by SNWA and Tetra Tech Model
Version 1.0 developed for the DOI agencies). Distance‐drawdown hydrographs for carbonate
‐0.2
0.0
0.2
0.4
0.6
0.8
1.0
1.2
1.4
1.6
1.8
2.0
2.2
2.4
2.6
2.8
3.0
‐20 ‐15 ‐10 ‐5 0 5 10 15 20 25 30 35
Drawdown in
Carbonate
Monitoring Wells During Test (ft)
Distance from Production Well MX‐5 (miles)
Development of Cone of Depression in Response to Test Pumping ‐‐ CSV to Hidden Valley, Garnet Valley, and California Wash ‐‐
10/29/10, End of 1st MX‐5 Pumping Period (1.5 Months of Pumping) 5/15/11, End of 2nd MX‐5 Pumping Period (Additional 5.5 Months of Pumping)
7/10/11, End of ~2 Month Recovery Period from MX‐5 Pumping 1/14/12, End of 3rd MX‐5 Pumping Period (Additional ~5 Months of Pumping)
4/22/12, End of ~3.5 Month Recovery Period from MX‐5 Pumping 12/13/12, Approximate End of Test (Additional ~7.5 Months of MX‐5 Pumping)
CSVM‐4[0.5' = MX‐5 DD]
CE‐VF‐2
CSVM‐6[1.2' = MX‐5 DD]
CSVM‐1 CSVM‐2[1.5' = MX‐5 DD]
M‐3[1.5' = MX‐5 DD]
TH‐2
M‐1[1.6' = MX‐5 DD]

| 22 P a g e
monitoring wells in CSV, Garnet Valley, and California Wash (Figure 1.12) are likewise flat, or flatter. We
interpret this to be the result of Garnet Valley pumping superimposed on the effects of carbonate
pumping in CSV and the MRSA.
The effects of earth tides and fluctuations in barometric pressure on water levels in the carbonate‐rock
aquifer should be roughly equal throughout the Study Area at any given time. Consequently, the shapes
of the distance‐drawdown hydrographs presented in Figures 1.11 and 1.12, which represent conditions
in the carbonate‐rock aquifer at particular times, should be unaffected by the absence of these
corrections. Likewise, longer‐term (regional) changes in carbonate water levels should be similar
throughout the area given the high transmissivity and diffusivity of this portion of the carbonate‐rock
aquifer, subject to minimal differences in timing. Consequently, the shapes of the distance‐drawdown
hydrographs should be minimally affected by the absence of a correction for long‐term regional trends.
IsolationofDrawdownfromMX‐5PumpingusingSeriesSEEAnalysis
Drawdown observed in the carbonate‐rock aquifer and other hydrogeologic units during the test was
the result of pumping at a large number of production wells, including the 39 utility‐ and industrial‐scale
(major) production wells listed in Table A.1. For illustrative purposes, these production wells have been
grouped into four major pumping centers in Figure 1.13: Q_CSI, Q_EAST, Q_SOUTH, and Q_MX‐5.
Average annual pumping from all major production wells in the Study Area ranged between 9,500 to
14,000 afy (Figure 1.14) over the last 10 years. Monthly pumping from major pumping centers in the
area varies seasonally and typically fluctuates between 6,400 and 19,300 afy. Q_EAST, located east‐
southeast of well MX‐5 in the MRSA (Figure 1.13), is the primary pumping center in the Study Area.
Pumping in the MRSA ranges seasonally from 4,800 to 12,900 afy. Monthly‐mean pumping at well MX‐5
in CSV was 4,070 afy during the test and ranged between 0 and 5,800 afy from September 2010 to
August 2012.
We have employed SeriesSEE analysis (the method of Halford et al. 2012) to isolate, i.e., differentiate,
drawdown induced by pumping at carbonate production well MX‐5 from drawdown induced by
pumping at other major production wells (carbonate and basin fill) that were operating in the Study
Area during the test. Specifically, we have used SeriesSEE analysis to estimate the magnitude of
drawdown induced by MX‐5 pumping as of 12/13/20124 at a range of locations within the Study Area as
a means of identifying the high‐connectivity portion of the carbonate‐rock aquifer that includes the
MRSA.
4 12/13/2012 was the date of the last groundwater level measurement in a large of number wells monitored as part of the Order 1169 test.

| 23 P a g e
Figure 1.13. Major pumping centers within the Study Area.
Q_EAST
Q_CSI
Q_SOUTH
MX-5

| 24 P a g e
0
5
10
15
20
25
2003 2004 2005 2006 2007 2008 2009 2010 2011 2012 2013
PU
MP
ING
, IN
TH
OU
SA
ND
SO
F A
CR
E-F
EE
T P
ER
YE
AR
YEAR
Q_EastQ_SouthQ_CSI-ALLMX-5
Figure 1.14. Monthly pumping from Q_East, Q_South, Q_CSI, and MX‐5 for the period 2003 to August 2012.
In particular, we have modeled groundwater level data collected in 14 monitoring wells in the MRSA,
CSV, Garnet Valley, the Black Mountains Area, California Wash, Lower Moapa Valley, and Lower
Meadow Valley Wash using SeriesSEE (Halford at al., 2012) to estimate the magnitude of drawdown
induced by MX‐5 pumping as of the end of the test (12/13/2012). Drawdown induced by pumping at all
39 major production wells listed in Table A.1 was simulated analytically using Theis transforms, where
step‐wise pumping records of discharge are transformed into water‐level changes using multiple
superimposed Theis solutions. Theis transforms can approximate drawdowns, as well as the
measurement resolution of transducers, even in complex hydrogeologic systems (Garcia et al., 2013).
Groundwater‐level fluctuations from environmental stresses such as barometric changes, earth tides,
and regional trends in groundwater levels were not modeled.
Pumping at the 39 major production wells listed in Table A.1 was simulated from 1/1/2008 to
12/13/2012, grouped into the 13 pumping centers shown in Figure 1.15 (each depicted with a ‘P’).
Groundwater level data for this same period was interpreted for the following monitoring wells5:
CSVM‐3 (carbonate monitoring well at the north end of CSV);
CSVM‐4 (carbonate monitoring well in northern CSV, immediately south of Kane Springs Valley
on the southeast side of the Kane Springs Wash Fault);
CE‐VF‐2 (carbonate monitoring well in north‐central CSV);
CSVM‐6 (carbonate monitoring well in central CSV);
5 Simulated production rates were monthly‐mean values. The frequency of modeled groundwater level measurements varied according to what is available; in some cases modeled groundwater level data were intermittent tape‐downs, in other cases they were daily‐mean values from continuous transducer records.

| 25 P a g e
CSVM‐5 (carbonate monitoring well in an elevated portion of southern CSV);
CSV‐2 (carbonate monitoring well in the MRSA, north of the Arrow Canyon wells);
EH‐4 (carbonate monitoring well in the MRSA ,close to Pederson and Pederson East springs of
the Muddy River Springs);
M‐2 (carbonate monitoring well in northern Garnet Valley);
GV‐1 (carbonate monitoring well in southern Garnet Valley close to central Garnet Valley/Apex
area pumping);
BM‐ONCO‐1 (monitoring well completed in clastic rocks in the Black Mountains Area south of
central Garnet Valley/Apex area pumping)
M‐1 (carbonate monitoring well in northern California Wash, close to the MRSA);
Byron‐1 (carbonate monitoring well in southern California Wash);
EH‐7 (monitoring well completed in younger carbonate rocks of Lower Moapa Valley); and
MW‐1A (basin‐fill monitoring well in Lower Meadow Valley Wash).
Our SeriesSEE analyses span the period 1/1/2008 to 12/13/2012 because groundwater level
measurements collected during the test (9/15/2010 to 12/13/2012) were, in part, due to pumping that
predated the test. The 14 monitoring sites listed above represent a combination of locations that were
judged a priori to be located within and outside the high‐connectivity portion of the carbonate‐rock
aquifer based on an inspection of available groundwater level hydrographs. All but two of the
monitoring wells, MW‐1A in Lower Meadow Valley Wash and EH‐7 in Lower Moapa Valley, are
completed in the carbonate‐rock aquifer. Well MW‐1A is a shallow well completed in basin fill; EH‐7 is
completed in carbonate rocks that are younger than the Paleozoic carbonate rocks comprising the
regional carbonate‐rock aquifer.
Our estimates of MX‐5 induced drawdown in the 14 monitoring wells as of 12/13/2012 are summarized
in Figure 1.15. The results of these analyses are provided in graphical form in Appendix A.4‐4 (rates of
MX‐5 pumping and total pumping within the Study Area provided as points of reference). In particular,
no drawdown due to MX‐5 pumping was identified in the records of:
carbonate monitoring well CSVM‐5 in an elevated portion of southern CSV (an area of possible
low permeability accounting for the slow rise in groundwater levels in this well over that last
several years);
clastic monitoring well BM‐ONCO‐1 in the northern Black Mountains Area (south of the central
Garnet Valley/Apex production wells);
carbonate monitoring well Byron‐1 in northwestern California Wash; or
basin‐fill monitoring well MW‐1A in Lower Meadow Valley Wash.

| 26 P a g e
Moreover, no MX‐5 induced drawdown appears to be present in the record of monitoring well EH‐7 in
Lower Moapa Valley (completed in carbonate rocks that are not part of the regional aquifer). However,
the magnitude of MX‐5 induced drawdown was substantial and nearly equal in most of the carbonate
monitoring wells analyzed in the floor of CSV, the MRSA, Garnet Valley, and California Wash as of
December 2012 (1.1. to 1.6 ft of a total 1.9 to 2.5 ft of observed water level change). Carbonate
monitoring wells CSVM‐4 and CSVM‐3 in northern CSV were an exception to this otherwise remarkably
uniform response as of the end of the test. Smaller components of MX‐5 induced drawdown were
estimated in CSVM‐4 and CSVM‐3 (about 0.5 and 0.1 ft, respectively).
We conclude that pumping at MX‐5 in the carbonate‐rock aquifer created drawdown of approximately
equal magnitude throughout CSV (at least the floor of the valley), the MRSA, Hidden and Garnet valleys,
and California Wash as of the end of the 2‐year test. Given this result and the connectivity of this
portion of the carbonate‐rock aquifer based on low hydraulic gradients under pre‐test conditions and
the calibration of two groundwater flow models, we likewise conclude that carbonate pumping at other
locations within this area has also created (and will create) drawdown of nearly equal magnitude
throughout the identified area. Using the results of these SeriesSEE analyses, we have delineated a
portion of the carbonate‐rock aquifer in which pumping causes water level declines of nearly equal
magnitude throughout this part of the aquifer (Figure 1.16), including the source of the Muddy River
Springs and majority source of the Muddy River. We note that these conclusions are consistent with the
distribution of total drawdown documented in carbonate monitoring wells as of the end of the 2‐year
test (Figure 1.17).
We note that this differentiation of pumping signals includes differentiating drawdown induced by MX‐5
pumping in CSV from drawdown induced by pumping at the Arrow Canyon and basin fill wells in the
MRSA, the CSI production wells in CSV, and production wells in Garnet Valley, the Black Mountains Area,
and California Wash (the other major production wells listed in Table A.1). See Appendix A.4 for a
discussion of the extent to which drawdown due to pumping at locations other than MX‐5 has been
isolated as part of these analyses.
Due to the limited availability of observation wells in east‐central to southern California Wash and the
portion of the Black Mountains Area that lies between southern California Wash and the Overton Arm of
Lake Mead, it was not possible to evaluate the potential for a hydraulic connection between the
delineated area (including California Wash) and Rogers and Blue Point springs.

| 27 P a g e
Figure 1.15 MX‐5 pumping‐induced drawdown (ft) in monitoring wells within the Order 1169 Study Area based on preliminary SeriesSEE analyses performed using the method of Halford et al. (2012); base map is total transmissivity calibrated using the Central Carbonate‐Rock Province (CCRP) Model developed by SNWA for the Clark, Lincoln, and White Pine Counties Groundwater Development Project.

| 28 P a g e
Figure 1.16. Map showing the approximate location of the portion of the carbonate‐rock aquifer in which pumping results in water level declines of roughly equal magnitude everywhere else in this part of the aquifer and depletion of the Muddy River Springs. (Delineated area based on SeriesSEE analyses and generalized geologic considerations. Base is SNWA (2007a) Hydrogeologic Units.)

| 29 P a g e
Figure 1.17. Total drawdown in the carbonate‐rock aquifer due to all carbonate pumping during the Order 1169 test, September 15, 2010 to December 31, 2012; base is SNWA (2007) Hydrogeologic Units.

| 30 P a g e
ConceptualModelofthePortionoftheCarbonate‐RockAquiferSystemAffectingtheMuddyRiverSprings
We hypothesize that the response to MX‐5 pumping observed during the Order 1169 pumping test was
due to two factors:
1. a high degree of connectivity within the portion of the regional carbonate‐rock aquifer
underlying CSV, the MRSA, Hidden and Garnet valleys, and California Wash (the delineated
area); and
2. relatively constant groundwater inflows to this portion of the carbonate‐rock aquifer.
Based on the results of our SeriesSEE analyses and a range of other observations discussed in previous
sections, a high degree of connectivity exists within the portion of the carbonate‐rock aquifer underlying
the delineated five‐basin area (as discussed in the previous section). We additionally propose that
groundwater inflows to this portion of the carbonate‐rock aquifer are primarily limited to CSV and that
these inflows are relatively constant.
Specifically, the magnitude of the head drop from Pahranagat Valley into CSV (or Delamar Valley to CSV)
is on the order of 1,000 ft. As a result, no amount of pumping‐induced drawdown in CSV or the other
four basins can measurably increase the hydraulic gradient and the groundwater inflow across the
northern boundaries of CSV into the delineated area. Interbasin groundwater flow into the portion of
the carbonate‐rock delineated in Figure 1.16 is for all practical purposes constant, regardless of the
magnitude of drawdown induced in CSV and the other basins by pumping.
Likewise, groundwater inflow to CSV and the other basins in the form of precipitation recharge is not
only limited, but relatively constant from year to year compared to the overall water budget of this
portion of the carbonate‐rock aquifer. Consequently, the portion of the carbonate‐rock aquifer
delineated in Figure 1.16 is effectively a high‐transmissivity carbonate‐rock reservoir with fixed inflows.
Pumping anywhere in this portion of the carbonate‐rock aquifer effectively lowers groundwater levels
everywhere within ‘the reservoir’ by almost equal amounts in relatively short periods of time (consistent
with the results of our SeriesSEE analyses and a range of other observations during the test).
Additionally, groundwater pumping must eventually be balanced by increased inflows, decreased
natural outflows, or a combination thereof (Bredehoeft, 2007). Since groundwater inflows to this
portion of the carbonate‐rock aquifer are for all practical purposes constant, all pumping from the
‘reservoir’ must eventually be captured from natural discharge at a rate approaching 100 percent of the
rate of pumping. Natural discharge within the delineated area, in turn, is limited to the Muddy River
Springs, and the Muddy River and ET associated with phreatophytic vegetation in the MRSA and
California Wash (DeMeo et al., 2008). Consequently, all pumping from this portion of the carbonate‐
rock aquifer must eventually be captured from the springs, river, and (or) ET in the MRSA and California
Wash. Any carbonate pumping in excess of the current rate of natural discharge in the MRSA and
California Wash will potentially result in capture from Rogers and Blue Point springs over longer periods
of time and/or long‐term declines in carbonate water levels throughout the five basins.

| 31 P a g e
Capture of natural discharge in the MRSA has already occurred to some extent as a result of the Order
1169 pumping. We have documented a total reduction in spring discharge of about 1200 af during the
pumping test (described in detail in the following section on impacts to springs). Unprecedented
declines in carbonate water levels during the test were also accompanied by unprecedented declines in
the discharge of the two highest‐elevation warm springs in the MRSA, Pederson and Pederson East
springs, as well as lesser reductions in discharge at the Warm Springs West gage (Figures 1.4 and 1.5)
and several lower elevation warm springs in the MRSA (Jones, Baldwin, and the Plummer Unit springs).
AssessmentofPumpingCapturedfromGroundwaterStorageduringthe2‐YearTest
We estimate that a large portion of MX‐5 pumping and some portion of the other carbonate pumping
which occurred during the Order 1169 pumping test was likely captured from groundwater storage as of
the end of the 2‐year test, with only a fraction captured to date from natural discharge. The high‐
transmissivity carbonate‐rock reservoir delineated in Figure 1.16 is approximately 690,000 acres in
area6. Based on SeriesSEE analyses, an average 1.4 ft of drawdown was induced in this portion of the
carbonate‐rock aquifer as of the end of the test in response to the withdrawal of 9,300 af from MX‐5
(9/15/2010 to 12/13/2012). If the average storage coefficient for this portion of the carbonate‐rock
aquifer is 0.01, then the majority of groundwater pumped from MX‐5 during the 2‐year test was
captured from groundwater storage. Likewise, carbonate water levels declined an average of 2.0 ft in
the delineated area over the 2‐year test period in response to the withdrawal of 19,900 ac‐ft from all
carbonate production wells. Again, if the average storage coefficient for this portion of the carbonate‐
rock aquifer is as great as 0.014, then the majority of carbonate pumping was captured from
groundwater storage, rather than natural discharge, during the test.
We note that the magnitude of the storage coefficients implied by these simple volumetric calculations,
approximately 0.01, is plausible based on estimates of storage coefficients for the carbonate‐rock
aquifer at other locations. Specifically, no storage coefficient estimates are available for this portion of
the carbonate‐rock aquifer based on the interpretation of pumping (aquifer) tests. No storage
coefficient was estimated from a multi‐well pumping test performed in carbonate well Arrow Canyon 1
in the MRSA in the 1990’s (Buqo, 1994; after Belcher et al., 2001); and no storage coefficients could be
estimated from 1986 single‐well pumping tests conducted in carbonate wells CSV‐2 in the MRSA or CE‐
VF‐2 in CSV (USGS, 2013). However, an unconfined storage coefficient of 0.020 has been estimated
from a multi‐well pumping test in carbonate well 184W101 in Spring Valley (USGS, 2013); and a confined
storage coefficient of 2.0E‐04 to 9.0E‐03 was estimated by the Southern Nevada Water Authority (SNWA
2009) from a multi‐well pumping test in well 184W105 in Spring Valley.
Based on the available storage coefficient estimates for carbonate rocks elsewhere in Nevada, we
conclude that the storage coefficient implied by our volumetric calculations for the delineated portion of
the carbonate‐rock aquifer, which data suggest is confined in some locations and unconfined in others,
6 Specifically, 693,100 acres is roughly the area delineated in Figure 1.16 less the most northerly portion of CSV where MX‐5 induced drawdown as of the end of the 2‐year test was less than the 1.1 to 1.6 ft estimated at nearly all other locations in the identified area.

| 32 P a g e
is plausible and that the bulk of carbonate pumping during the test was captured from groundwater
storage. As such, only a fraction of the pumping was captured from natural discharge as of the end of
the test. We expect the full impacts of the Order 1169 pumping test, most of which have not yet been
realized, to include capture of spring and stream discharge, followed by ET, in the MRSA and California
Wash in an amount that approaches the rate of MX‐5 pumping imposed during the test. Moreover,
about three‐quarters of drawdown observed in the carbonate‐rock aquifer within the five identified
basins was attributable to MX‐5 pumping as of the end of the test based on SeriesSEE analyses. We
interpret this to mean that the remaining quarter or more of drawdown was attributable to other
pumping. That is, the carbonate‐rock aquifer system, specifically the portion underlying the delineated
area, had not reached equilibrium with respect to pumping at one or more production wells predating
MX‐5 as of the end of the test. As a consequence, we expect the full impacts of the test to include the
capture of an additional increment of natural discharge associated with continued pumping at some
number of existing carbonate production wells (wells predating MX‐5) within the Study Area.
LimitationsoftheTestandUnresolvedQuestions
The only significant limitation of the Order 1169 pumping test was that two years was not sufficient to
observe the transition from the capture of pumping from groundwater storage to the capture of
pumping from natural discharge. As a result, the full impacts of the level of pumping during the test on
spring and stream discharges were not observed during the 2‐year test.
The time required to transition from a state where pumped water is supplied from groundwater storage
(reductions in groundwater levels) to the capture of spring/stream discharge and evapotranspiration is
unknown. The time for this transition to occur may be so long that by the time a critical reduction in
spring flow is identified (e.g., based on a reduction in flow at the Warm Springs West gage), the ensuing
recovery in groundwater levels may not occur fast enough to protect spring discharge and biological
resources in the MRSA.
Additionally, available information is not sufficient to evaluate the potential for a hydraulic connection
between the delineated high‐transmissivity portion of the carbonate‐rock aquifer (CSV, the MRSA,
Hidden and Garnet Valleys, and California Wash) and Rogers and Blue Point springs; nor is it sufficient to
determine whether MX‐5 induced drawdown in California Wash propagated through the MRSA, through
Hidden and Garnet valleys, or both.
ConclusionsforImpactstoGroundwater
Based on our SeriesSEE analyses, we have delineated a portion of the carbonate‐rock aquifer underlying
CSV, the MRSA, Hidden and Garnet valleys, and California Wash, a subset of the overall Order 1169
Study Area, in which pumping causes water level declines of nearly equal magnitude throughout this
part of the aquifer over relatively short periods of time (i.e., the 2‐year test period or less). The results of
our SeriesSEE analyses confirm that the ‘signature’ seen in groundwater level hydrographs for carbonate
monitoring wells in these five basins was indeed due to MX‐5 pumping. The area delineated using

| 33 P a g e
SeriesSEE analyses is also consistent with distance‐drawdown hydrographs for the carbonate‐rock
aquifer constructed using data collected during the test.
Based on this result and considerations related to the nature of groundwater inflows to CSV, we
hypothesize that this portion of the carbonate‐rock aquifer acts as a high‐transmissivity (high‐diffusivity)
‘reservoir’ with fixed inflows. As a consequence, pumping anywhere in this portion of the carbonate‐
rock aquifer effectively lowers groundwater levels everywhere in ‘the reservoir’ by nearly equal
amounts (consistent with the results of our SeriesSEE analyses and a range of other observations). As an
additional consequence, all pumping from the ‘reservoir’ must eventually be captured from the Muddy
River Springs, Muddy River, and (or) ET associated with phreatophytic vegetation in the MRSA and
California Wash, the only forms of natural discharge in the delineated five‐basin area, at a rate that
approaches 100 percent of the rate of pumping. Any carbonate pumping in the area that exceeds the
current rate of natural discharge in the MRSA and California Wash will potentially result in capture from
Rogers and Blue Point springs over longer periods of time and (or) long‐term declines in groundwater
levels.
We estimate that the bulk of MX‐5 pumping, as well as some portion of other carbonate pumping that
occurred during the test, was likely captured from groundwater storage (a lowering of groundwater
levels) based on volumetric calculations, which suggests that only a fraction of the water pumped was
captured from natural discharge as of the end of the test. This is confirmed by our estimate of the
decline in spring flows that occurred during the test in the MRSA (discussed in detail later in this section)
which represents a fraction of the average rate of MX‐5 pumping.
If pumping in the carbonate‐rock aquifer continues in the delineated area at the rate it occurred during
the test, we expect additional declines in spring and stream flows to occur in the MRSA and California
Wash in an amount that approaches the average rate of MX‐5 pumping, plus an additional increment of
capture associated with the continuation of other carbonate pumping in the area. Increasing the rate of
carbonate pumping in the delineated area over the level that occurred during the test will result in
further capture of spring and stream flows and (or) ET in the MRSA and California Wash in an amount
that approaches 100 percent of the increase in the rate of pumping.
Finally, we note that the impacts of the Order 1169 pumping test, both observed and anticipated, are
the result of pumping approximately one‐third of the 16,300 afy currently permitted in CSV7 and that
the applications pending under Order 1169 potentially represent a substantial increase in those rights.
This suggests that water is not available for the pending applications in CSV, in part or whole, or for
applications pending in the MRSA, Hidden or Garnet valleys, or California Wash under the Order, as
discussed in the Availability section of this report.
7 The annual‐mean rate of pumping in CSV during the test, 5,378 afy, divided by the currently permitted rights in CSV, 16,300
afy.

| 34 P a g e
ImpactstoSprings
This portion of the report presents our interpretation of the impacts of the Order 1169 pumping test on
springs and discharge in the MRSA. We begin by describing the theoretical relationship between
groundwater levels in the carbonate rock aquifer and regional spring discharge. We hypothesize that
changes in spring discharge will be proportional to the changes in hydraulic head differential at each
individual spring and that the higher elevation springs with the smallest hydraulic head will be the most
sensitive to the drawdown observed during the pumping test. To validate this hypothesis, we examine
the observed changes in discharge at several springs and flow monitoring sites in the system in relation
to spring water surface elevation, groundwater level decline, and the estimated changes in hydraulic
head differential at the springs. We also discuss other factors affecting groundwater levels and spring
discharge during the pumping test including precipitation, fire effects, and land use changes in the area.
TheoreticalGroundwaterLevel/SpringDischargeRelationships
It is well established that spring discharge in the MRSA emanates from the regional carbonate‐rock
aquifer (Eakin 1966; Prudic et al., 1993; Thomas et al., 1996). The regional carbonate‐rock aquifer is
confined and the potentiometric surface of the aquifer is greater than the land surface elevation of the
springs. This hydraulic head differential causes groundwater in the carbonate rock aquifer to rise to the
land surface, along fissures and fractures that occur in the area, and flow as spring discharge. We
assume that the flow at any spring is governed by Darcy’s Law, which states that flow through a porous
medium is proportional to the hydraulic head differential or hydraulic gradient (Fetter, 1994). The
greater the difference between the water surface elevation at the spring and the hydraulic head of the
aquifer, the greater the spring discharge, other factors being constant.
The high transmissivity of the carbonate rock aquifer in the CSV‐MSRA corridor creates a consistent and
fairly uniform potentiometric surface beneath the landscape with little variation in hydraulic head in the
aquifer. The difference in land surface elevations between MX‐4 in CSV and the springs in MRSA, some
15 miles to the east, is about 350‐450 feet, but the difference in the potentiometric surface of the
regional aquifer between carbonate monitoring wells MX‐4 in CSV and EH‐4 in MRSA is only about 5‐6
feet. The high transmissivity and associated low hydraulic gradient results in a fairly uniform
potentiometric surface elevation across the MRSA. However, the elevations of springpools in the area
vary by more than 70 feet (Beck et al., 2006). This potentially leads to a large range of hydraulic head
differential between the individual springs in the MRSA. Higher elevation springs have a much smaller
hydraulic head differential than lower elevation springs. This concept is illustrated in Figure 1.18.

| 35 P a g e
Figure 1.18. Theoretical head differential at springs of different elevation, assuming a uniform potentiometric surface in the regional carbonate‐rock aquifer.
Figure 1.19. Theoretical effects of a uniform drawdown on head differential and spring discharge at higher and lower elevation springs.

| 36 P a g e
Groundwater pumping leads to the development of a drawdown cone around the pumping center. As
the drawdown cone extends to the springs, the hydraulic head differential at the springs will be
reduced. Darcy’s Law states that a reduction in the hydraulic head differential will result in a
proportional decrease in flow rate, all other factors being constant. If, for example, a lowering of the
potentiometric surface leads to a 25% decrease in the hydraulic head differential at a spring, one would
expect a similar percentage reduction in flow at that spring. It follows that the springs in the system with
the smallest hydraulic head differential, i.e., the highest elevation springs, will be relatively more
sensitive to a uniform decline in the potentiometric surface of the carbonate rock aquifer resulting from
groundwater pumping. This concept is illustrated in Figure 1.19.
DataSourcesandDataQuality
The data we used in our analyses, including the source, type, and frequency of the data; period of record
and site history; monitoring agency or organization; quality of the data; and location and physical
characteristics of the site will be discussed in this section. Figure 1.20 shows the location of all the
monitoring sites described here. For surface water monitoring sites, we found it convenient to
distinguish between spring monitoring sites (those sites located directly at the springpool outflows) and
flow monitoring sites (those sites located some distance downstream of the springpools). All data
presented here, along with the graphical and statistical analyses, are appended as data files to this
report.
There are two carbonate monitoring wells in the MRSA near the Refuge: EH‐4 and EH‐5b (Figures 1.1
and 1.20). Both wells are monitored by Nevada Energy and have periodic measurements since 1986,
with continuous data available since 1997. The water level elevations and trends at both monitoring
wells are very similar and highly correlated (see Figure 1.2 and the appended data file: Order 1169 EH4
Data_NDWR_Dec 2012.xlsx, for a comparison of the two wells). Because the data from EH‐4 are less
erratic and more complete, and the well is physically located closer to the Refuge, we use EH‐4 data
here and assume that the water level in EH‐4 is representative of the elevation of the potentiometric
surface in the regional carbonate‐rock aquifer in the MRSA. There is some uncertainty associated with
this assumption; the hydraulic head at the springs themselves may differ from that represented by
water levels at EH‐4. The springs are physically located some distance from EH‐4 and the aquifer depth
at which the springs are sourced may not correspond with the depth of the well opening at EH‐4.
Nevertheless, the EH‐4 data were used to develop relationships between carbonate water levels and
discharge at various sites in the MRSA.
We also used periodic measurements of shallow groundwater levels from October 2009 through
December 2012 in nine monitoring wells located in the MRSA. These data are collected and reported by
the Southern Nevada Water Authority (SNWA).

| 37 P a g e
Figure 1.20. Map showing the locations of spring and flow monitoring sites; the boundary and three units of the Moapa Valley NWR; as well as the EH‐4 carbonate monitoring well, all discussed in this section of the report.

| 38 P a g e
The Moapa Valley NWR consists of three units: the Pedersen8 Unit, the Plummer Unit, and the Apcar
Unit (Figure 1.20). The springs on the Pedersen Unit are the highest elevation springs in the MRSA.
Given the expected sensitivity of the higher elevation springs and the importance of the Warm Springs
West, we mainly focus our analyses on this area. There are three continuously monitored USGS sites on
the Pedersen Unit: Pederson Spring (USGS Site No. 09415910), Pederson East Spring (USGS Site No.
09415908), and Warm Springs West (USGS Site No. 09415920). Pederson Spring and Pederson East
Spring are two spring monitoring sites that measure the outflows from the springpools. Both springs
have historically averaged about 0.2 cfs until recently. Warm Springs West is a flow monitoring site that
measures the combined discharge from diffuse groundwater seepage and five major spring groups
located about 0.1‐0.2 miles upstream on the Pedersen Unit of the Refuge.
Pederson Spring (USGS Site No. 09415910) has been monitored continuously by the USGS with a v‐notch
weir since 1986, with data gaps from 1994 to 1996 and 2003 to 2004. The v‐notch weir readings are
converted to flow using an independent rating developed by the USGS for the site. Finalized flow data
are available through February 21, 2013 at this site. The early record is variable and may have been
affected by poor check measurements, diversions from the springpool, a major fire at the site in 1994,
leakage under the weir, and other factors. In April 2004, the old v‐notch weir was replaced with a new v‐
notch weir because of leakage around the old weir. Ratings for the new weir were adapted by USGS in
October 2004 and again in April 2010. The gap in the record from February 2003 to April 2004 is due to
questions about leakage and accuracy of the old weir during this period. The relationship of spring
discharge to EH‐4 water levels is significantly different (p=0.0000) for the old weir and the new weir, in
terms of slope and intercept (see appended data file: USGS 09415910_Pederson Sprs nr Moapa_all
data_1985‐2013.xlsx). This suggests that measurements from the two periods may not be comparable.
For this reason, we only use the record from the new weir since 2004 when considering the relationship
of Pederson springflow to EH‐4 water levels.
Pedersen East Spring (USGS Site No. 09415908) has been monitored continuously since 2002 with a v‐
notch weir. The v‐notch weir readings are converted to flow using an independent rating developed by
the USGS for the site. New ratings were adapted by USGS in October 2002 and again in April 2010.
Finalized flow data are available through February 21, 2013 at this site. Pedersen East Spring is the
highest elevation spring in the Pedersen East Spring group but there are several other springs in the
spring group that are comparable in flow. The combined flow of the Pederson East Spring group, which
includes Pederson East spring, has been measured periodically with a current meter by the USGS, as
discussed below.
Warm Springs West (USGS Site No. 09415920) has been monitored continuously with a flume since
1985. Flume readings are converted to discharge using the theoretical stage‐discharge relationship of
the flume. Finalized flow data are available through February 20, 2013 at this site. Unmetered irrigation
diversions on the Refuge upstream of the site during the first half of the record resulted in
8 There are two different spellings of this name: Pedersen with an “e” at the end is the correct spelling of the landowner’s last name. Pederson with an “o” at the end is an incorrect spelling of the landowner’s name, but was adopted by the USGS for the spring and stream names. We will use both spellings here, in context.
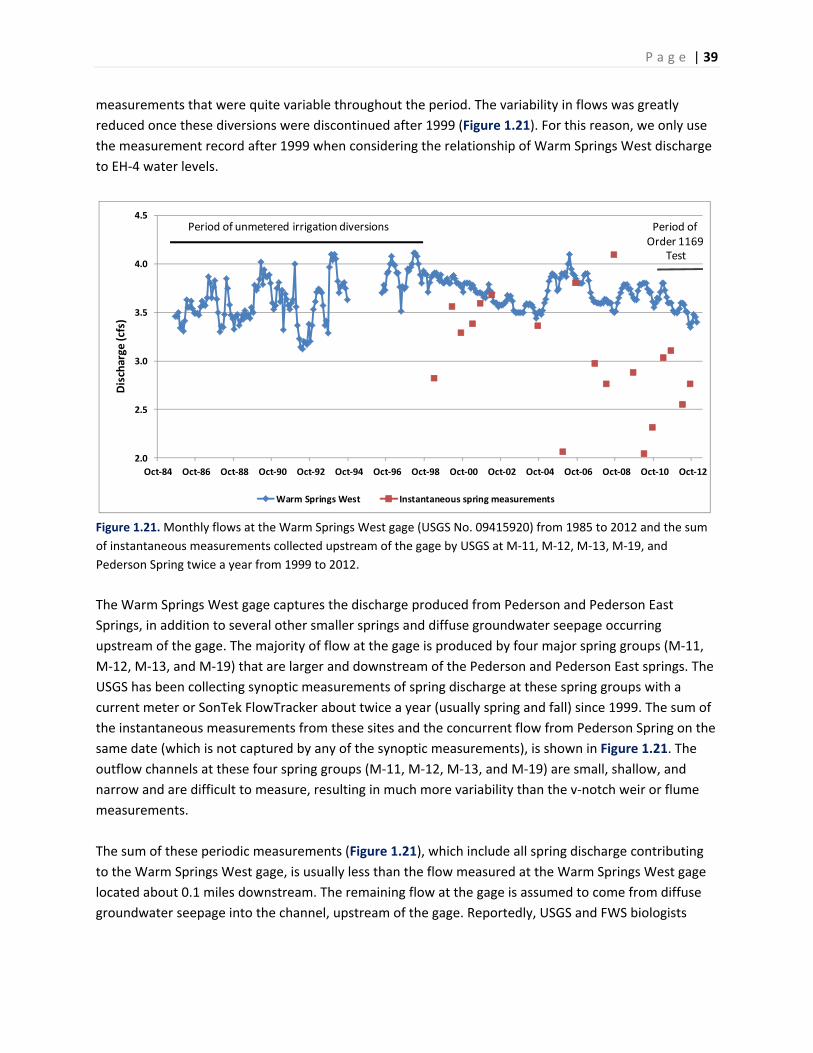
| 39 P a g e
measurements that were quite variable throughout the period. The variability in flows was greatly
reduced once these diversions were discontinued after 1999 (Figure 1.21). For this reason, we only use
the measurement record after 1999 when considering the relationship of Warm Springs West discharge
to EH‐4 water levels.
2.0
2.5
3.0
3.5
4.0
4.5
Oct‐84 Oct‐86 Oct‐88 Oct‐90 Oct‐92 Oct‐94 Oct‐96 Oct‐98 Oct‐00 Oct‐02 Oct‐04 Oct‐06 Oct‐08 Oct‐10 Oct‐12
Discharge
(cfs)
Warm Springs West Instantaneous spring measurements
Period of unmetered irrigation diversions Period of Order 1169
Test
Figure 1.21. Monthly flows at the Warm Springs West gage (USGS No. 09415920) from 1985 to 2012 and the sum
of instantaneous measurements collected upstream of the gage by USGS at M‐11, M‐12, M‐13, M‐19, and
Pederson Spring twice a year from 1999 to 2012.
The Warm Springs West gage captures the discharge produced from Pederson and Pederson East
Springs, in addition to several other smaller springs and diffuse groundwater seepage occurring
upstream of the gage. The majority of flow at the gage is produced by four major spring groups (M‐11,
M‐12, M‐13, and M‐19) that are larger and downstream of the Pederson and Pederson East springs. The
USGS has been collecting synoptic measurements of spring discharge at these spring groups with a
current meter or SonTek FlowTracker about twice a year (usually spring and fall) since 1999. The sum of
the instantaneous measurements from these sites and the concurrent flow from Pederson Spring on the
same date (which is not captured by any of the synoptic measurements), is shown in Figure 1.21. The
outflow channels at these four spring groups (M‐11, M‐12, M‐13, and M‐19) are small, shallow, and
narrow and are difficult to measure, resulting in much more variability than the v‐notch weir or flume
measurements.
The sum of these periodic measurements (Figure 1.21), which include all spring discharge contributing
to the Warm Springs West gage, is usually less than the flow measured at the Warm Springs West gage
located about 0.1 miles downstream. The remaining flow at the gage is assumed to come from diffuse
groundwater seepage into the channel, upstream of the gage. Reportedly, USGS and FWS biologists

| 40 P a g e
have observed cool‐water inputs in the lower part of the stream, just upstream of the Warm Springs
West gage, while snorkeling during fish surveys.
Other USGS sites examined and discussed in this report include three USGS flow monitoring sites: the
Warm Springs confluence at Iverson flume (USGS Site No. 09415927), the Muddy Springs at LDS Farm nr
Moapa (USGS Site No. 09415900) and the Muddy River nr Moapa (USGS Site No. 09416000). The Iverson
flume is located off the Refuge, about 0.25 miles downstream of the Plummer Unit springs, and
therefore measures a combination of carbonate springflow, rainfall runoff, and diffuse groundwater
seepage emanating upstream of the gage. From October 2001 through October 2008, the Iverson Flume
gage measured the combined outflows of the Pedersen and Plummer Units of the Refuge. However, in
October 2008, the outflow from the Pedersen Unit, downstream of Warm Springs West, was
disconnected from the Plummer outflow stream and restored to a historical stream channel. The post‐
restoration average flow at the Iverson Flume gage is about half of the pre‐restoration average since the
Pederson outflow stream is no longer captured in the measurements. We only use the measurement
record during the pumping test when considering the relationship of Iverson flume discharge to EH‐4
water levels. Finalized flow data are available through September 2012.
In addition to the springs on the Plummer Unit, there is at least one large spring downstream of the
Refuge boundary that contributes flow to the Iverson Flume gage. The USGS has collected periodic
measurements of the outflow from the Plummer Unit at the Refuge boundary (USGS Warm Spring East,
Site No. 364236114424301), upstream of this spring and the Iverson Flume gage. The nine
measurements from 2008 through 2012 range from 2.13 cfs to 2.79 cfs and average 2.53 cfs, a little over
half the post‐restoration flow measured at the Iverson Flume gage since 2008. So the contribution from
the large downstream spring and any other spring discharge and shallow groundwater seepage in the
reach between the Refuge and the gage is considerable.
The Muddy Springs at LDS Farm nr Moapa (USGS Site No. 09415900) measures the spring discharge from
the largest and lowest elevation spring in the MRSA. The spring, which had been used to maintain two
swimming pools on the LDS property, has a continuous record of flow from 1985 to the present.
According to the USGS site description, the site is located 0.1 miles downstream of the LDS pools and
measurements at the site are affected by irrigation and recreation diversions for the pools upstream.
The two large pools and the recreational facility have not been operated since they burned in the July
2010 fire, just prior to the pumping test. Finalized flow data are available through September 2012 for
this site.
The Muddy River near Moapa site (USGS Site No. 09416000) measures the discharge in the Muddy River,
just downstream of the MRSA. This site also has a continuous record of flow from 1985 to the present.
The site measures a combination of carbonate spring discharge, shallow groundwater discharge,
irrigation return flow, and rainfall runoff. We did attempt to relate discharge at the Muddy River site to
carbonate water levels in EH‐4 due to the influence of these other factors. Finalized flow data are
available through September 2012 for this site.

| 41 P a g e
We also consider data from two other spring monitoring sites in the MRSA: the daily total natural spring
discharge at Jones Spring and Baldwin Spring, collected and reported by MVWD for the period August
2010 to December 2012 and available on the NDWR Order 1169 webpage
http://water.nv.gov/mapping/order1169/. Both sites are located very close to the carbonate spring
source and therefore, will primarily measure spring discharge from the regional carbonate springs only.
The time series plot of discharge at both of these sites shows some questionable measurements during
short periods of the pumping test (see appended data file: MVWD_data_Baldwin_Jones_daily_monthly
2010‐2012.xlsx). We assumed there were problems with these values and we excluded data from these
periods in developing the relationships between discharge and carbonate water levels during the
pumping test at these sites. There was little difference in regression slopes with and without the
excluded data. The appended datafile for these sites provides comparisons of the regression results.
Methods
For this section of the report, we consider monthly data for the period of the Order 1169 pumping test,
which is considered to be from October 2010 to December 2012, the first and last complete months of
the test. We focus on the period of the pumping test primarily but look at longer periods as well,
depending on the site and the availability of data.
For the spring and flow monitoring sites, we conducted graphical and statistical analyses. We examined
the relationship between discharge and climate graphically. We examined the relationship between
discharge and pumping statistically, by correlating monthly discharge with monthly carbonate water
levels in EH‐4 for the period of the pumping test and for longer periods, where data are available. We
calculated the slope and r2 values for these relationships and estimate the maximum, minimum, and
change in discharge observed during the pumping test. Because there is variability in the actual field
discharge measurements, we used the regression equations from the discharge/EH‐4 water level
relationship to estimate discharge at a given carbonate water level.
For each site, we estimated the maximum, minimum, and change in the hydraulic head differential
during the pumping test by computing the difference between the water surface elevation at the
spring(s) contributing to the site and the carbonate water levels observed in EH‐4 during the test. We
then compared our estimates of the relative changes in hydraulic head differential during the pumping
test, expressed as a percent, with the relative changes in discharge observed at each site, also expressed
as a percent. Our assumption, as discussed above, is that relative changes in head differential and
discharge should be approximately equal. Using the drawdown rate that we determined for EH‐4 during
the pumping test and the discharge/water level relationships, we estimate when discharges at key
spring and flow monitoring sites will reach certain points of interest, assuming the level of pumping,
drawdown, and decline in flow continue at the rate observed during the test. Lastly, we finish this part
of the report with a discussion of some of the other factors that may have affected water levels and
discharges during the period of the pumping test.

| 42 P a g e
ResultsandDiscussion
PedersenUnit
Figures 1.22 and 1.23 show spring discharge at the three continuous surface water monitoring sites on
the Pedersen Unit of the Refuge, along with water year precipitation in NV Climate Division 4.
Springflow measurements are more variable than groundwater level measurements. Note that the
discharge scale for the Warm Springs West gauge only extends from 3.0 to 4.2, while that for the
Pederson gauges extend from 0.0 to 0.35. Thus the variability in the Pederson flows are proportionally
larger than those for Warm Springs West. The seasonal cycles and trends in flows since 2000 generally
mirror the carbonate water levels, decreasing from 2000 through 2004 due to increased carbonate
pumping, increasing in 2005‐2006 in response to the 2005 wet year, and declining overall during the 2‐
year pumping test. As with the groundwater levels, the lowest spring flows in the record at all of these
sites occur during 2012, near the end of the pumping test despite the wet year in 2011. However, as can
be seen on the figures, not all the spring measurement sites show the same degree of response to
groundwater level declines, mainly because of differences in spring elevations, as discussed above. Next,
we examine those individual responses in more detail, by considering relationships between discharge
and carbonate water levels in EH‐4.
2000 2001 2002 2003 2004 2005 2006 2007 2008 2009 2010 2011 2012 2013
0.0
2.0
4.0
6.0
8.0
10.0
12.0
14.0
16.0
18.0
20.0
3.0
3.2
3.4
3.6
3.8
4.0
4.2
1999 2003 2007 2011
Precipitation (in)
Spring Discharge
(cfs)
YearNV Climate Division 4 WY pcp Warm Springs West
Period of
Order 1169 Test
Figure 1.22. Monthly flows at the USGS Warm Springs West gage (USGS No. 09415920) and Nevada Climate
Division 4 water year precipitation (centered on April of each water year) for the period Jan 2000 to Dec 2012.

| 43 P a g e
2000 2001 2002 2003 2004 2005 2006 2007 2008 2009 2010 2011 2012 2013
0.0
2.0
4.0
6.0
8.0
10.0
12.0
14.0
16.0
18.0
20.0
0.00
0.05
0.10
0.15
0.20
0.25
0.30
0.35
1999 2003 2007 2011
Precipitation (in)
Spring Discharge
(cfs)
YearNV Climate Division 4 WY pcp Pederson Sprs Pederson East Sprs
Period of Order 1169 Test
Figure 1.23. Monthly flows at the USGS Pederson Spring gage (USGS No. 09415910), Pederson East Spring gage
(USGS No. 09415908), and Nevada Climate Division 4 water year precipitation (centered on April of each water
year) for the period Jan 2000 to Dec 2012.
The first spring considered is the Pederson Spring, the highest elevation spring in the area (the gage
datum or zero point of flow is 1810.99 ft). During the pumping test, the flows at Pederson Spring
declined from a maximum of 0.22 cfs to 0.08 cfs (a 0.14 cfs or 63% reduction total from the maximum
flow observed during the pumping test, Figure 1.24). The correlation between spring discharge and
water level for EH‐4 is very high (r2 = 0.98 during the pumping test and r2 = 0.93 for the entire 2004‐2012
record). The slope of the discharge‐water level relationship over the pumping test equates to ‐0.062 cfs
(‐28%) per unit foot of drawdown in the carbonate‐rock aquifer. This means that for every one foot
decline in the EH‐4 water level, Pederson Spring loses about 0.06 cfs of discharge (about 28% relative to
the maximum discharge observed during the pumping test). The next question we address is: “Is this
reasonable and close to what we expect for this site?”

| 44 P a g e
R² = 0.9297
R² = 0.9767
0.00
0.05
0.10
0.15
0.20
0.25
0.30
0.35
1812.5 1813.0 1813.5 1814.0 1814.5 1815.0 1815.5 1816.0 1816.5 1817.0Pederson Sprs Average M
onthly Flow (cfs)
EH‐4 Average Monthly Elevation (ft)
all data 2004 ‐ 2012 Oct 2010 ‐ Dec 2012 Pump Test period
Slope = ‐0.062 cfs or ‐28% per unit of drawdownduring the pump test
Figure 1.24. Monthly flows at Pederson Spring versus monthly carbonate water level elevations in EH‐4 for the
period May 2004 to Dec 2012.
The maximum and minimum monthly EH‐4 carbonate water level elevations observed from October
2010 to December 2012 were 1815 ft and 1812.8 ft, respectively. At the maximum groundwater level
elevation, Pederson Spring, with a water surface elevation of 1811 ft, had a hydraulic head differential of
4.0 ft (the “head differential” being estimated as the difference between EH‐4 water level elevation and
the spring water surface elevation). At the minimum EH‐4 water level elevation observed during the
pumping test, 1812.8 ft, the “head differential” is only 1.8 ft. Based on these two estimates, there is a
predicted 25% decrease in hydraulic head differential per unit foot of drawdown, or a total reduction in
head differential of 55% (assuming the maximum head of 4.0 ft represents 100%). Under the
assumption that flow is proportionate to head, we should expect a similar percentage decline in flow. As
shown above, there was a 28% decrease in flow per unit foot of drawdown or about 63% over the 2.2
foot range of carbonate water levels observed during the pumping test. The observed decline is very
close to the independent estimate. The spring appears to be behaving in response to the decline in
carbonate water levels and head differential as expected.
The x‐intercept of the discharge/water level regression for the period of the pumping test is 1811.5 ft
(Figure 1.24). This is the predicted carbonate water level elevation at which the spring discharge goes to
zero (the spring dries up), based on the relationship between spring discharge and EH‐4 levels. It differs
from the estimated spring water surface elevation, perhaps because of the errors associated with the
assumption that the water level in EH‐4 represents the hydraulic head at the springs. Anyway, if the
current rate of drawdown in EH‐4 (0.92 ft/year) continues, the spring will stop flowing in about 1.5
years.

| 45 P a g e
Next, we consider Pederson East Spring, which is the second highest elevation spring in the area, with a
gage datum or zero point of flow of 1807.7 ft. During the pumping test, the flows at Pederson East
Spring ranged from 0.22 cfs to 0.12 cfs (a 0.10 cfs or 45% reduction in total discharge, Figure 1.25). The
correlation between spring discharge and EH‐4 water level for Pederson East Spring is high during the
pumping test but poorer for the entire period of record (r2 = 0.92 during the pumping test and r2 = 0.59
for the entire record). The reason for the poorer correlation over the entire record is not clear but it may
indicate some changes or problems in the earlier flow record at the site. The slope of the relationship
over the pumping test equates to ‐0.043 cfs (‐21%) per unit foot of drawdown in the carbonate‐rock
aquifer. This means that for every one foot decline observed in the EH‐4 water level, Pederson East
Spring loses about 0.04 cfs (or about 21% per unit foot of drawdown). This is less than Pederson Spring,
as expected, since Pederson East Spring is slightly lower in elevation and has a greater hydraulic head
differential, and therefore, should be less sensitive to drawdown (see Figure 1.19).
R² = 0.5917
R² = 0.9192
0.00
0.05
0.10
0.15
0.20
0.25
0.30
1812.5 1813.0 1813.5 1814.0 1814.5 1815.0 1815.5 1816.0 1816.5 1817.0
Pederson East Sprs Average M
onthly Flow (cfs)
EH‐4 Average Monthly Elevation (ft)
all data 2002‐2012 Oct 2010 ‐ Dec 2012 Pump Test period
Slope = ‐0.043 cfs or ‐21% per unit of drawdownduring the pump test
Figure 1.25. Average monthly flows at Pederson East Spring versus carbonate water level elevations in EH‐4 for the
period June 2002 to Dec 2012.
At 1815 ft., the maximum EH‐4 carbonate water level elevation observed during the pumping test,
Pederson East Spring has a hydraulic head differential of 7.3 ft (based on a water surface elevation of
1807.7 ft). At 1812.8 ft., the minimum EH‐4 elevation observed, the “head differential” is 5.1 ft, which
represents a 30% reduction in head from the maximum EH‐4 water level elevation during the test. For
every unit foot of drawdown, we expect about a 14% decrease in hydraulic head differential and flow.
As shown above, the observed decline in flow was greater than this, about 21% per unit of drawdown or
about 45% over the range of carbonate water levels. Nevertheless, the estimated and observed
reductions are less than at Pederson Spring, and the Pederson East Spring discharge appears to be less
sensitive to drawdown, as expected.

| 46 P a g e
The x‐intercept of the regression for the period of the pumping test is 1810.1 ft (Figure 1.25). This is the
predicted carbonate water level elevation at which the spring discharge will go to zero. As with
Pederson Spring, the elevation of the x‐intercept of the regression differs from the water surface
elevation of the spring, perhaps because of errors associated with the assumption that EH‐4 exactly
represents the hydraulic head at the spring. If the current rate of drawdown in EH‐4 (0.92 ft/year)
continues, the spring will stop flowing in about 2.5 to 3 years.
The relationship of Warm Springs West flow to carbonate water levels in EH‐4 is shown in Figure 1.26.
The correlation between discharge and water level for Warm Springs West is fairly high during the
pumping test and for the entire period of record (r2 = 0.79 during the pumping test and r2 = 0.70 for the
entire record). We may expect a poorer correlation between discharge and carbonate water levels at
this site compared to the other two spring sites because the site is downstream of the major springs and
may be responsive to shallow basin‐fill aquifer water levels and rainfall runoff, as well as carbonate‐rock
aquifer water levels.
R² = 0.6953
R² = 0.7894
3.1
3.3
3.5
3.7
3.9
4.1
4.3
1812.0 1813.0 1814.0 1815.0 1816.0 1817.0
Warm Springs West Average M
onthly Flow (cfs)
EH‐4 Average Monthly Elevation (ft)
all data 2000 ‐ 2012 Oct 2010 ‐ Dec 2012 Pump Test period
Slope = ‐0.15 cfs or ‐4% per unit of drawdown
Figure 1.26. Average monthly flows at Warm Springs West versus carbonate water level elevations in EH‐4 for the
period Jan 2000 to Dec 2012.
During the pumping test, Warm Springs West declined from an average flow of 3.72 cfs, at a carbonate
water level elevation of 1815.0 ft, to an average flow of 3.40 cfs, at a water level elevation of 1812.8 ft.
The total decline equates to about 0.32 cfs (9%) or about a 4% decrease from the pre‐test flow rate per
unit foot of drawdown. The total decline, 0.32 cfs, is 0.09 cfs greater than the sum of the declines
(0.13+0.10=0.23 cfs) observed in the Pederson and Pederson East Springs, located upstream of the gage.
Note that there appears to be little or no decline in flow during the first year of the pumping test at the
Warm Springs West gage; most of the decline is observed in the second year (see Figure 1.22). We
believe that higher precipitation during the first year of the pumping test may have increased shallow
groundwater seepage upstream of the gage and countered some of the effects of pumping.

| 47 P a g e
Next, we compare the observed decline with the estimates of the expected decline at the Warm Springs
West gage, given the range of carbonate water levels at EH‐4 observed during the pumping test. Since
the Warm Springs West gage measures the combined discharge from a number of individual springs,
estimating the hydraulic head differential at the site is more involved. The majority of flow at the Warm
Springs West gage is accounted for with measurements at Pederson Spring and the four major spring
groups measured by the USGS twice a year: Spring 19, Spring 13, Spring 12, and Spring 11. (The
discharge at Pederson East Spring is included in the measurement at Spring 19). Beck et al. (2006)
provides information on the approximate elevation of these different spring groups. Using these
approximate elevations, we estimated the reduction in head differential at each spring group and
applied this reduction to the average flow, available from the periodic measurements from each of the
spring groups (M‐19, M‐11, M‐12, M‐13).
The approximate elevations, average flows, estimated head differentials, and estimated reductions in
head for each spring or spring group are shown in Table 1.2. Because the periodic flow measurements at
the spring groups are so variable, we used the measurements from September 2007 to September 2010
(a period when EH‐4 elevations averaged 1815.2 ft, see Figure 1.2 and 1.3) to calculate the average flow
at each of the four spring groups prior to the start of the pumping test. The total discharge at all four
measurement sites, along with flows at Pederson Spring, averaged 2.88 cfs for this period (these
measurements are plotted Figure 1.21). The average of the daily flows at the Warm Springs West gage
on concurrent dates for the same period is 3.65 cfs. Approximately 80% of the flow at the Warm Springs
West gage is accounted for with the spring measurements during the 2007 to 2010 period.
Using the maximum and minimum carbonate water levels observed at EH‐4 during the pumping test,
(1815 ft to 1812.8 ft), the proportional reductions in head differential at the five spring groups are 55%
at Pederson Spring and 9% to 17% at the other four spring groups. Multiplying the estimated
proportional reduction in head differential by the average flow from 2007‐2010 at each of the five
spring groups shows that the contribution of the springs should have been reduced in total by about 0.5
cfs during the pumping test. Applying a similar reduction in flow at the Warm Springs West gage means
the flow during the pumping test should have declined by about 0.5 cfs or 14% in total. The observed
decline during the pumping test was slightly less than this, about 0.32 cfs or about 9% in total.
Nevertheless, the relative decline at Warms Springs West is considerably less than at Pederson and
Pederson East Springs, as expected based on the lower elevations of the other springs.
PlummerUnit,ApcarUnit,andotherMRSASites
Next, we examine the observed and/or expected reductions in discharge at springs on the Plummer and
Apcar Units and elsewhere in the MRSA, given the changes in carbonate water levels observed during
the pumping test. Springs in all of these areas are lower in elevation than the springs on the Pederson
Unit, so they are expected to be less sensitive to declines in carbonate water levels.

| 48 P a g e
Table 1.2. Periodic measurements and characteristics for the major spring groups on the Pedersen Unit.
Spring or spring group Water
surface
elev (ft)
Estimated head
differential (ft)
at EH‐4 = 1815 ft
Average
flow (cfs)
2007‐
2010
Estimated
reduction during
pumping test
(%)
Estimated
flow in
Dec 2012
Pederson Spring 1811.0 4 0.23 55% 0.10
M‐19 (this site includes
the discharge from
Pederson East Spring)
1802.0 13 0.86 17% 0.71
M‐13 1799.5 15.5 0.69 14% 0.59
M‐12 1798.5 16.5 0.31 13% 0.27
M‐11 1791.5 23.5 0.79 9% 0.72
Total of all springs 2.88 2.40
Warm Springs West
(average on same
dates)
3.65 3.17*
*This is the estimated flow, applying the reduction that should have been observed at the Warm Springs
West gage during the pumping test. As shown above in Figure 1.28, the flow at Warm Springs West
during the pumping test ranged from 3.72 cfs at 1815 ft to 3.40 cfs at 1812.8 ft.
Monthly flows at the USGS Iverson gage along with water year precipitation in NV Climate Division 4 are
shown in Figure 1.27 for the period October 2008 to December 2012, the period following the
restoration of the Pederson channel. Flows were fairly stable during the first part of the pumping test
but decreased slightly during the last part of the pumping test. The timing of the decline is similar to
Warm Springs West and the flows at this site may have been influenced by the 2011 wet year as well.
The variability and increase in flows observed in 2008‐09 may be a response to the restoration itself. The
Plummer stream bank at the site of the old Pederson confluence was reconstructed and “shored up” as
part of the restoration. There was likely a temporary increase in channel losses along this section of the
channel after the restoration. As the reconstructed stream bank became saturated and sealed itself,
channel losses would have declined, resulting in an increase in flows measured downstream at the
Iverson flume. We have observed a similar response (a period of high initial channel losses followed by
recovering flows) with stream restoration work at Ash Meadows NWR. Since this increase is believed to
be an artifact of the restoration work, we didn’t attempt to correlate discharge with carbonate water
levels prior to the pumping test.
The relationship of Iverson Flume flows to carbonate water levels in EH‐4 during the pumping test is
shown in Figure 1.28. The relationship is poor (r2=0.42) but this is not surprising since the site is located
a considerable distance from the springs (about 0.25 miles downstream) and measurements may be
responsive to shallow basin‐fill aquifer water levels and rainfall runoff, as well as carbonate‐rock aquifer

| 49 P a g e
water levels. Discharge measurements at the Iverson Flume gage ranged from an average of 4.64 cfs to
4.38 cfs during the pumping test (finalized data are available only through Sept 2012). This is a decline of
0.13 cfs (2.7%) per unit foot of drawdown and 0.25 cfs (5%) over the first two years of the pumping test.
Extrapolating this rate of decline through December 2012 gives a total decrease in discharge of 0.28 cfs
or 6% during the pumping test.
2009 2010 2011 20120
2
4
6
8
10
12
14
16
18
20
3.0
3.5
4.0
4.5
5.0
5.5
6.0
2008
Precipitation (in)
Spring Discharge (cfs)
Year
NV Climate Division 4 WY pcp Plummer outflow
Period of Order 1169 Test
Figure 1.27. Monthly flows at the USGS Iverson Flume gage (USGS No. 09415927) for the period Oct 2008 to Sept
2012 and Nevada Climate Division 4 water year precipitation (centered on April of each water year) for the same
period.
R² = 0.4225
3.5
3.75
4
4.25
4.5
4.75
5
1812.5 1813.0 1813.5 1814.0 1814.5 1815.0 1815.5
Discharge (cfs)
EH‐4 Average Monthly Elevation (ft)
Slope of ‐0.13 cfs or ‐3% per unitof drawdown during the pump test
Figure 1.28. Average monthly flows at the Iverson Flume versus carbonate water level elevations in EH‐4 for the
period Oct 2010 to Sept 2012.

| 50 P a g e
The springs contributing to the Plummer stream outflow are much lower in elevation than those on the
Pederson Unit. Beck et al. (2006) give the elevations of USGS sites M‐15, M‐16, and M‐20 (all measuring
springs on the Plummer Unit) as 1749.2, 1757.2, and 1749.8 ft, respectively. This means there was 58 to
66 ft of head differential or more at these springs at the start of the pumping test. The spring(s)
downstream of the Refuge are even lower in elevation and less sensitive to drawdown, but they
contribute close to half of the discharge measured at the Iverson Flume gage. Applying the 2.2 ft decline
of carbonate water levels observed during the pumping test indicates the head differential at the
Plummer Unit springs was reduced by 3% to 4%. The observed decline of 6% for the pumping test is
slightly greater than what is estimated for the Plummer Unit, although the discharge/water level
relationship is poor and the regression slope estimate has a large uncertainty in it.
The time series plots of daily total natural discharge at Jones and Baldwin Springs for the period of the
pumping test is shown in the appended data file for these two sites. The relationship of the monthly
total natural discharge at both springs to monthly carbonate water levels in EH‐4 is shown in Figure
1.29. At Jones Spring, the correlation is very high during the pumping test (r2 = 0.90). For the period of
the pumping test, Jones Spring declined from an average flow of 1.61 cfs, at a carbonate water level
elevation of 1815.0 ft, to an average flow of 1.55 cfs, at a water level elevation of 1812.8 ft. This is a
decline of 0.027 cfs (1.7%) per unit foot of drawdown or about 0.06 cfs (4%) in total.
R² = 0.9002
R² = 0.7922
1.2
1.4
1.6
1.8
2.0
2.2
2.4
2.6
2.8
3.0
1812.5 1813.0 1813.5 1814.0 1814.5 1815.0 1815.5
Discharge (cfs)
EH‐4 Average Monthly Elevation (ft)
Jones Spring Baldwin Spring Linear (Jones Spring) Linear (Baldwin Spring)
Jones Spring: Slope of ‐0.027 cfs or ‐1.7% per unitof drawdown during the pump test
Baldwin Spring: Slope of ‐0.05 cfs or ‐1.8% per unitof drawdown during the pump test
Figure 1.29. Average monthly flows at the Jones Spring and Baldwin Spring versus carbonate water level elevations
in EH‐4 for the period Oct 2010 to Dec 2012 (excluding Oct‐Dec 2011 at Jones Spring and Oct 2010 at Baldwin
Spring as discussed in Data Sources and Data Quality).

| 51 P a g e
Beck et al. (2006) gives the elevation of a benchmark located 140 ft northwest of the Jones Spring
pumphouse as 1775.72 ft. The actual spring elevation is unknown but assuming the springhead is the
same elevation, the estimated hydraulic head differential is 39 feet at the spring at the start of the
pumping test. A 2.2 ft drawdown in carbonate water levels represents a 6% decrease in the total head
differential at the spring. Based on this, we would expect a 6% decrease in flow during the pumping test.
The observed decline in flow of 4% during the pumping test is slightly less than this.
At Baldwin Spring, the correlation between total natural discharge and carbonate water levels in EH‐4 is
fairly high for the period of the pumping test (r2 = 0.79, Figure 1.29). During the pumping test, Baldwin
Springs discharge declined from an average flow of 2.74 cfs, at a carbonate water level elevation of
1815.0 ft, to an average flow of 2.63 cfs, at a water level elevation of 1812.8 ft. This is a decline of 0.05
cfs (1.8%) per unit of drawdown or about 0.11 cfs or 4% in total.
The elevation of a benchmark 100 feet east of the pumphouse at Baldwin Spring is 1775.68 ft (Beck et
al., 2006). This is almost equal to the benchmark elevation for Jones Spring above. As with Jones Spring,
the actual spring elevation is unknown, but assuming the springhead is the same elevation, then the
elevation and head differential is the same as Jones Spring. The 2.2 ft decrease in carbonate water levels
observed at EH‐4 during the pumping test should result in a predicted decrease of 0.16 cfs (6%) in total.
The observed decline of 4% total is slightly less than this (Figure 1.29). It is interesting to note that
relative declines in flow observed at Jones Spring and Baldwin Spring are equal, although the absolute
flows are almost double at Baldwin Spring. Based on the hypothesized relationship discussed above, the
relative declines are expected to be equal, given the similarity in spring elevations.
The time series plot of discharge at the Muddy Springs at LDS Farm gage and the Muddy River nr Moapa
gage are presented in Figure 1.30 for January 2000 to September 2012, along with water year
precipitation in NV Climate Division 4. Muddy Springs is the largest and lowest elevation spring in the
MRSA, with an average flow of 7.6 cfs since 2000 and a water surface elevation of 1745.34 ft (Beck et al.
2006). With an estimated hydraulic head differential of 70 ft, this spring is expected to be the least
sensitive to drawdown of any of the springs in the MRSA. Reportedly, according to the USGS, the site is
not responsive to precipitation, unlike other flow monitoring sites in the area. This can be seen in the
time series plot in the appended data file (USGS 09415900_Muddy Sprs at LDS Farm nr Moapa NV_all
data_1985‐2012.xlsx), which shows a lack of any clear wet year response, including 2005.
Muddy Spring flows are inversely correlated with carbonate water levels in EH‐4 (r2 = 0.45) during the
pumping test, increasing with decreasing carbonate water levels, in contrast to all the other sites (see
appended data file). This means there is a slight increase in flow during the pumping test. The
correlation is very poor and the residuals with time show a major positive deviation in the second year
of the pumping test, indicating a step change in the relationship due to some other factor. The most
likely factor is the fact that the two large pools were drained and the recreational facility was essentially
abandoned sometime after the fire that occurred in July 2010.

| 52 P a g e
Flows at the Muddy River nr Moapa site show lots of variability and also a slight increasing trend in
recent years (Figure 1.30). As discussed below, this site is likely responding to several factors including
wetter than normal precipitation in 2011, fire effects, and land use changes and restoration activities in
the MRSA. We did not attempt to correlate Muddy River flows to carbonate water levels.
2000 2001 2002 2003 2004 2005 2006 2007 2008 2009 2010 2011 2012 2013
0
2
4
6
8
10
12
14
16
18
0
5
10
15
20
25
30
35
40
45
1999 2003 2007 2011
Precipitation (in)
Spring Discharge (cfs)
YearNV Climate Division 4 WY pcp Muddy Spring Muddy R nr Moapa
Period of Order 1169 Test
Figure 1.30. Monthly flows at the USGS Muddy Springs at LDS Farm nr Moapa (USGS Site No. 09415900) and the
Muddy River near Moapa (USGS Site No. 09416000) for the period Jan 2000 to Sept 2012 and Nevada Climate
Division 4 water year precipitation (centered on April of each water year) for the same period.
OtherFactorsAffectingSpringDischargeandWaterLevels
Carbonate water levels and spring discharge in the MRSA are responding to several factors
simultaneously and some of these factors cause opposing responses. The major factors that affect water
levels and spring discharge in the area are precipitation and carbonate pumping (see the multiple
regression presented earlier and Mayer and Congdon, 2008). The influence of precipitation and the wet
year in water year 2011, which started in October 2010 at the same time as the pumping test, likely
mitigated some of the response to pumping at Warm Springs West gage and the Iverson Flume gage
(Figure 1.22 and 1.27). Neither flow gage appears to show declines in response to pumping until the 2nd
year of the pumping test. The wet year may also be related to recent increases observed at Muddy
Springs and the Muddy River gages, although other factors are likely involved as well.
One other factor could be the fire on July 1, 2010 in the MRSA that burned 600 acres, adjacent to the
Refuge (Figure 1.31). The fire, which occurred just three months prior to the start of the pumping test,
destroyed vegetation and resulted in a reduction in ET and an instantaneous increase in shallow water
levels in the area of the burn (Christi Emery, SNWA, personal comm. related to a poster presented at the
Nevada Water Resources Association 2013 annual conference). Huntington et al. (2013), in Figures 11,

| 53 P a g e
13, and 14, present ET and precipitation in the MRSA from calendar years 2001 to 2012. While
precipitation in CY 2005 and CY 2010 were about equal, ET in CY 2010 was much less than in CY 2005,
likely because the fire burned much of the vegetation in the area. Figures 11 and 13 indicate that ET
stayed low in CY 2011 and CY 2012, after the fire, as well. Precipitation and groundwater discharge that
was not lost to ET probably made its way to the river, resulting in higher streamflows in the river. The
burned area also included the pool and recreational facility upstream of the Muddy Springs gage, which
may be partly responsible for the increase in flows observed at that site.
Figure 1.31. Aerial photo of burned area in the MRSA from the fire that occurred on July 1, 2010, just prior to the
pumping test. The extent of the burned area is estimated to be about 600 acres. The view is looking to the
southeast.
The ongoing removal of palm trees and tamarisk and the retirement of irrigated lands in the area over
the last several years are also important land use changes that are contributing factors. All of these
factors are expected to reduce ET and increase shallow water levels and flows in the MRSA. A recent
report by DRI (Huntington et al., 2013) estimated that ET in the MRSA has declined about 600 to 900 af
over the period 2001‐2012. Three of the four SNWA monitoring wells located near the Refuge (Lower
Pederson MW1, Stone Cabin MW2, and Francis Taylor) show increasing shallow aquifer levels during the

| 54 P a g e
period of the pumping test (see appended file: SNWA shallow monitoring wells_MRSA_periodic meas
2009‐2012.xlsx). Because the shallow basin‐fill aquifer likely contributes to flow at all the flow
monitoring sites (sites located downstream of springs, including the Warm Springs West gage, the
Iverson Flume gage, the Muddy Springs gage, and the Muddy River gage), the discharge at these gages
may have been affected as well. We propose that while carbonate water levels and spring discharge
were decreasing in response to increased carbonate pumping during the pumping test, some of these
other factors may have contributed to increases in flows.
ConclusionsforImpactstoSprings
Table 1.3 summarizes the results from the analyses. Pederson Spring, Pederson East Spring, Apcar
Spring, and Baldwin Spring are all spring monitoring sites that are located at the outflows of springs and
only measure regional spring discharge. These spring monitoring sites show the highest correlations
with carbonate water levels in EH‐4. All four sites showed declines during the pumping test and the
relative declines were proportional to the estimated reduction in hydraulic head differential at each
spring. Pederson and Pederson East Springs, the highest elevation springs, showed observed declines of
62% and 45%, respectively, during the pumping test. These springs are the most sensitive to
groundwater pumping because they have the smallest hydraulic head differential. The Apcar and
Baldwin springs, approximately equal in elevation and both lower than Pederson or Pederson East
springs, showed observed declines of 4% during the pumping test. Predicted declines in flow, based on
changes in head differential, are similar to the observed declines in flow at each spring (see Table 1.3).
The system is responding to pumping impacts and drawdown as hypothesized (see Figures 1.18 and
1.19).
Other flow monitoring sites (sites located some distance from spring sources), such as Warm Springs
West and the Iverson flume, were not as highly correlated with carbonate water levels in EH‐4.
Nevertheless, these sites still showed declines during the pumping test and the declines were
approximately proportionate to the expected reductions in head differentials at the springs contributing
to the sites. Warms Springs West and the Iverson gage declined about 9% and 6%, respectively, during
the pumping test.
Two other flow monitoring sites, the Muddy Springs at LDS Farm and the Muddy River nr Moapa,
showed increases in flow during the pumping test. The Muddy Springs is the lowest elevation spring in
the MRSA and is therefore least affected by drawdown. Increasing flows at this site during the pumping
test may be a result of upstream effects from the fire that led to changes in the operation of the pool
and recreational facility. Other factors may have contributed to flow increases at both of these sites as
well including 1) the high precipitation during the first year of the pumping test; 2) the fire and loss of
vegetation in July 2010 just prior to the pumping test; and 3) the ongoing removal of tamarisk and palm
trees and the retirement of irrigation lands in the area. These factors may have ameliorated or obscured
some of the pumping impacts at these gages.

| 55 P a g e
The total sum of the reductions in discharge during the period of the pumping test is 0.77 cfs or about
1250 af. This is about 13% of the total MX‐5 pumping in CSV during the test and only about 6% of the
total volume of carbonate pumping (19,914 af) during the test in CSV, MRSA, Garnet Valley, Hidden
Valley and California Wash. As carbonate pumping continues, carbonate water levels will decrease
further and the volume of groundwater discharge captured through reduced springflow and ET will
increase until the system reaches a new equilibrium and the pumping rate equals the captured
discharge rate (Bredehoeft, 2007; Bredehoeft and Durbin, 2009).
With respect to spring discharge impacts, if the current rate of pumping, drawdown, and decline in
discharge observed during the test continues in the near‐term, Pederson Spring, the highest elevation
and most sensitive spring in the MRSA, will reach zero discharge in about 1.5 years. Pederson East
Spring, the second most sensitive spring, will reach zero discharge in about 2.5 to 3 years. We note again
that the annual carbonate pumping rate in CSV during the test was only about one‐third of the total
appropriated volume in that basin.

| 56 P a g e
Table 1.3. Summary of Results for Impacts to Spring Discharge
Site name Type of site Site elevation
(mean sea level)
Correlation with
EH‐4 carbonate
water levels (r2)
during the
pumping test
Relative changes in
observed discharge
during the pumping
test (% per foot of
drawdown)
Total change
predicted during
the pumping test
(cfs) (based on
estimated head
changes)
Total change
observed during
the pumping test
(cfs) (based in
observed changes
in flow)
Pederson Spr Spring
Monitoring
1811 0.98 ‐28% 0.12 0.13
Pederson East Spr Spring
Monitoring
1807.7 0.92 ‐20% 0.07 0.10
Warm Springs West
(includes Ped Spr and
Ped East Springs)
Flow
Monitoring
1792 to 1811 0.79 ‐4% 0.50 0.32
Jones Spr Spring
Monitoring
1776 0.90 ‐2% 0.06 0.06
Baldwin Spr Spring
Monitoring
1776 0.79 ‐2% 0.11 0.11
Iverson Flume Flow
Monitoring
1749 to 1757 0.42 ‐3% 0.16 0.28
Muddy Springs Flow
Monitoring
1745 0.45 +7%
Total Reduction in
Discharge 0.83 0.77*
*Sum of Warm Springs West, Iverson Flume, Jones, Baldwin (the Warm Springs West gage includes Pederson and Pederson East Springs). The sum ofpredicted changes in flow at these four gages is very close to the observed sum, but that is mainly because of compensating errors at the two flow monitoring gages: Warm Springs West and Iverson Flume. We didn’t predict changes in flow at Muddy Springs due to the influence of other factors at that gage.

| 57 P a g e
Section2–ModelingofGroundwaterPursuanttothePendingApplications
ModelingSimulationsofPumpingImpactstoGroundwaterandSprings
In this section of the report, we use a numerical groundwater flow model developed by Tetra‐Tech
(2012a) to evaluate the impacts to groundwater levels and springs discharge from various pumping
scenarios. We also use the model to simulate the recovery of the system if the MX‐5 pumping had
ceased after the pumping test was completed in December 2012.
TetraTechGroundwaterFlowModel
On behalf of three Department of the Interior bureaus (the US Fish and Wildlife Service, National Park
Service, and Bureau of Land Management), Tetra Tech (2012a) prepared a three‐dimensional model of
groundwater flow of part of the Colorado River Flow System. This model is intended to provide
information on the long‐term effects of existing and future groundwater use on the groundwater
system, which includes resources that are the responsibility of these three bureaus.
The model domain includes all basins in which groundwater right applications are pending under Order
1169. The model simulates groundwater flow in the regional carbonate‐rock aquifer system that is the
source of the Muddy River Springs, Muddy River, and likely contributes to warm springs of Lake Mead
National Recreation Area. Tetra Tech Model Version 1.0 (described in detail in Tetra Tech 2012a) is a
three dimensional, 18‐layer groundwater flow model developed using MODFLOW‐2000, a widely used
finite difference groundwater flow code developed by the U.S. Geological Survey, calibrated over the
following time frames:
Transient groundwater level and spring and stream discharge measurements, 1949 to 1987,
representing a 39‐year period of basin‐fill pumping in the MRSA. Initial conditions were
established by running the model to steady state under pre‐pumping conditions.
Transient groundwater level and spring and stream discharge measurements, October 2008 to
December 2011, including the first year of the 2‐year Order 1169 pumping test. Calibration
focused on CSV and the MRSA.
SimulationsofthePotentialEffectsofPumpingthePendingApplications
A series of pumping simulations were performed using the Tetra Tech Model Version 1.0 to estimate the
effects of pumping various subsets of existing rights and pending applications within the model domain,
including pending applications held in abeyance under Order 1169 (Tetra Tech 2012b). These pumping
scenarios included:

| 58 P a g e
Scenario 1 – Current locations and rates of pumping;
Scenario 2 – All existing groundwater rights, pumped and unpumped;
Scenario 3 – All existing groundwater rights, plus all large9 pending applications filed through
1989
Scenario 4 – All existing groundwater rights, plus all large pending applications filed through
1994;
Scenario 5 – All existing groundwater rights, plus all large pending applications filed through
1999;
Scenario 6 – All existing groundwater rights, plus all large pending applications filed through
2004; and
Scenario 7 – All existing groundwater rights, plus all large pending applications filed through
2009.
Tetra Tech (2012b) includes a series of figures showing time‐series of simulated groundwater levels and
spring/stream discharges and contour maps of simulated drawdown for each of the above pumping
scenarios. Contour maps provided in Tetra Tech (2012b) depict simulated drawdown of the water table
at a series of elapsed times since the end of 2011 (end of the last calibration run). Time axes for
simulated time‐series hydrographs depict time elapsed since the end of 2011. The discussion presented
below will focus on the simulation results for Scenarios 1, 2 and 3 as they pertain to CSV and the MRSA.
Figure 2.1 (Figure 3.1‐2a of TetraTech 2012b) shows the simulated spring discharge in the MRSA for
Scenario 1, which evaluates the long‐term pumping impacts resulting from a continuation of the current
locations and rates of pumping. The model predicts that the discharge from the springs will decline as
the existing pumping captures flow from the springs. Discharge from the Pederson spring is predicted to
cease after nearly 500 years, but is nearly dry after 200 years. If all existing permitted water rights (used
and unused) were pumped (Scenario 2), the model‐predicted declines are more significant (Figure 2.2,
or Figure 3.2.2a from Tetra Tech 2012b), with the Pederson and Cardy Lamb springs predicted to cease
flowing in 30 and 60 years, respectively. Finally, Figure 2.3 (Figure 3.3‐2a of Tetra Tech 2012b) shows
the simulated spring discharge in the MRSA for Scenario 3, which evaluates the long‐term impacts
resulting from pumping all existing permitted water rights (used and unused) and all large pending
applications in the area filed through 1989, including SNWA’s pending water rights in CSV. Under this
simulation, the model predicted declines are more significant than under Scenario 2, indicating that the
discharge from all of the major springs in the MRSA will cease flowing within 10 years (Pederson Spring)
to 150 years (Muddy and Plummer springs). Declines in flow from the springs will affect the flow in the
Muddy River downstream from the springs, and impact downstream water users. The following section
compares the modeled and observed effects of the Order 1169 pumping using a longer dataset than
available for calibrating the model. This analysis found that the model under‐simulates the effects of
the pumping. Thus, springs will dry up quicker than estimated by the model.
9 ‘Large’ pending groundwater right applications refers to applications for 1,000 or more acre‐feet per year (Tetra Tech, 2012b).

| 59 P a g e
Post‐AuditofSecondYearoftheOrder1169Test
A post‐audit analysis of the Tetra Tech model (Tetra Tech 2013) was performed, using data collected
during 2012, the last year of the test. Calibration of the model was based in part on the observed
responses to pumping of the carbonate‐rock aquifer in Coyote Spring Valley (CSV) over the first part of
the Order 1169 test, during the period September 2010 through December 2011. Data are now
available on the effects of pumping in CSV through December 2012. The first part of this section is
designed to determine how well the modeling results agree with the water‐level drawdown and spring
discharge data collected in 2012. The model was not re‐calibrated to the more recent information. The
results can be used to estimate whether the model over predicts or under predicts the effects of
pumping in CSV. The conclusions of this evaluation should only be applied to the effects of pumping in
CSV, and not from other Hydrographic Areas.
The post‐audit simulation was performed with the long‐term model described in Tetra Tech (2012a),
modified to include an additional 12 months of pumping to cover the period January 1, 2012 through
December 31, 2012. Details are provided in Tetra Tech (2013). In addition, the model simulation time
was extended an additional 15 years (2013 to 2027) to evaluate the time required for the groundwater
system to recover from the effects of Order 1169 pumping. These changes and the results are discussed
later in this section. Briefly, the Multinode Well package dataset in the model was modified by
incorporating the reported monthly pumping volumes into additional monthly stress period records. If
reported values were not available for a well during 2012, the average of the monthly pumping for the
previous three‐year period was used for the applicable month in 2012, under the assumption that water
needs in 2012 were similar to those in recent years. Other data sets were extended as well, and the
changes are described in Tetra Tech (2013).
Figure 2.4 (Figure 2‐3 of Tetra Tech 2013) shows the simulated and observed water‐level changes, for
selected wells. The addition of another year of MX‐5 pumping to the simulation, and the comparison of
simulated and observed drawdown, makes it evident that the model under‐simulates the amount of
drawdown that is being caused by pumping of the carbonate‐rock aquifer. Tetra Tech (2012a, p. 45) had
noted that the model does not simulate short‐term (seasonal) variability in some areas where it is
observed, and suggested that adjustment of carbonate transmissivity and storage parameters may
improve the model fit to observed changes in water levels. Additionally, it was unclear, based on
simulating pumping through 2011, whether the model under‐simulated the amount of drawdown (i.e.,
calculated less drawdown than occurred) caused by pumping at MX‐5. The current results clearly
indicate that the model under‐simulates the amount, and probably the extent and timing, of drawdown.
For example, at CSVM‐6 (located about 3 miles north of MX‐5), the simulated drawdown is
approximately 0.6 feet, while the observed is up to 2.4 feet. At CSVM‐2 and CSV‐3, approximately eight
to ten miles south of MX‐5, the measured drawdowns were up to 2 feet, but the simulated values are
less than 0.5 feet. In California Wash, the observed drawdown was also about 2 feet (Paiute M‐1 and
Paiute M‐3) but the simulated drawdown is 0.3 feet or less.

| 60 P a g e
Figure 2.1. Simulated spring discharges in the Muddy River Springs area, Scenario 1.
Figure 2.2. Simulated spring discharges in the Muddy River Springs area, Scenario 2.

| 61 P a g e
Figure 2.3. Simulated spring discharges in the Muddy River Springs area, Scenario 3.
Figure 2.5 (Figure 2‐4 of Tetra Tech 2013) shows the observed and simulated discharge rates from the
springs. In general, the model simulates very little change in the discharges, while there are small
observed declines in the measured values during the test period. The increases in observed discharge at
Muddy Spring are believed to have been caused by anthropogenic changes near the spring and/or the
2010 fire which occurred in the immediate area. The limited simulated impact on the discharge is
caused, in part, by the under‐simulation of drawdown.
Maps of the simulated drawdown caused by pumping of MX‐5 were developed by first simulating the
effects of all existing pumping (including MX‐5), then simulating the effects of all existing pumping
except MX‐5, and subtracting the simulated water levels of the second run from those of the first run.
The result is a dataset with the simulated drawdown caused by pumping of MX‐5. This approach was
used to eliminate possible effects that might be caused by non‐linear boundary conditions, and isolates
the effects of MX‐5 pumping.

| 62 P a g e
Figure 2.4. Comparison of simulated and observed drawdown in selected wells, 2010 - 2012.

| 63 P a g e
Figure 2.6 (Figure 2‐5 of Tetra Tech 2013) shows the simulated drawdown in model layer 5 caused by
MX‐5 pumping as part of the Order 1169 test at three different times. The leftmost panel shows the
simulated effects at the end of December 2011, while the central panel shows the simulated effects of
an additional year of pumping. The rightmost panel is discussed further below under the recovery
discussion. Layer 5 is the model layer with the greatest drawdown at the location of MX‐5. Figure 2.7
(Figure 2‐6 of Tetra Tech 2013) is a similar set of maps, for model layer 11. This layer has the greatest
extent of drawdown.
In the time interval between the end of 2011 and the end of 2012, pumping continued from MX‐5, and
the extent of simulated drawdown increased in all directions. The amount of drawdown near MX‐5 also
increases, in both layer 5 and 11. The area of drawdown has begun to extend more in a north‐south
direction, reflecting the geology. To the north, the area of simulated drawdown greater than 0.1 feet
has reached Kane Spring Valley. To the south, it has reached the central part of Garnet Valley and nearly
all of Hidden Valley.
Figure 2.5. Comparison of observed and simulated spring discharge, Muddy River Springs Area, 2010 - 2012.

| 64 P a g e
Figure 2.6. Simulated drawdown from MX‐5 pumping, Model layer 5.
Figure 2.7. Simulated drawdown from MX‐5 pumping, Model layer 11.

| 65 P a g e
As noted above, the model under‐simulates the drawdown caused by the Order 1169 pumping of MX‐5
through the end of 2012. Thus, the amount of drawdown depicted on these maps is less than has been
observed. Similarly, the simulated effect of this pumping on the discharge from springs in the Muddy
River Springs area is too small. These results indicate that additional calibration of the model using the
more recent data would be beneficial. In the interim, the predictive results presented in Tetra Tech
(2012b) that pertain to pumping from the carbonate rocks in Coyote Spring Valley should be viewed as
conservative. Specifically, the carbonate water levels that drive the discharge from the springs in the
Muddy River Springs area will decline more quickly than simulated, and the flows from the springs and
in the Muddy River will decline more quickly.
The model was also used to evaluate what is likely to happen if pumping in CSV were to be reduced.
One management option for protecting the stream and spring environments in the Muddy River Springs
area would be to reduce or curtail pumping rates if water levels declined to a threshold value. However,
it is unknown whether a reduction in the pumping rate would cause an “immediate” recovery of water
levels and spring flow throughout the Muddy River Springs area, or if drawdown and water‐discharge
would continue to decline for some time, and by how much. The second part of this section evaluates
the likely effects, using cessation of pumping in MX‐5 at the end of the Order 1169 test as the imposed
change in pumping stress.
The model was run using monthly stress periods for a 15‐year period (2013 to 2027), in which no
pumping was assumed to occur from MX‐5, but other pumping was assumed to occur at the average of
the rates reported for 2010, 2011 and 2012.
Simulated drawdown at several wells is shown on Figure 2.8 (Figure 3‐1 in Tetra Tech 2013). The water
levels show the effects of MX‐5 pumping superimposed on a general downward trend. The effect of
stopping MX‐5 pumping is very evident in wells close to MX‐5 (MX‐4, CSV‐RW2, CSVM‐1, UMVW‐1, MX‐
6) and easily discernible in more distant wells (DF‐1, CSVM‐6, CSVM‐5, CSV‐3, CSVM‐2, CSV‐1). The
effect is also present (as observable changes in slope) in the simulated responses of Arrow Canyon,
Arrow Canyon 2, KMW‐1, CSVM‐4, CE‐VF‐2, CSI‐2, CSI‐1, CSV‐2, EH‐5B, EH‐4, BW‐01, Paiutes M‐1 and
Paiutes M‐3.
The time required for recovery is a function of the distance from MX‐5 and the criterion used to define
when recovery is complete. Figure 2.9a through 2.9d (Figures 3‐2a, 3‐2c, 3‐2d and 3‐2h in Tetra Tech
2013) show the simulated drawdown and recovery responses as a result of starting and stopping MX‐5
pumping. For example, at MX‐4 (Figure 2.9a), about 75% of the drawdown is recovered very quickly,
but after 15 years, the recovery is about 90% complete. At MX‐6 (Figure 2.9b), the simulated recovery is
about 75% complete after 15 years. At EH‐4 (Figure 2.9c), located near Pederson Spring in the MRSA,
the maximum drawdown is simulated as occurring several months after cessation of MX‐5 pumping, and
the recovery is about 70% complete after 15 years. In areas that are much further away, recovery is
simulated as not beginning until after 15 years since pumping ceased at MX‐5. Although the simulated
drawdown at CSVM‐3 (Figure 2.9d) is only 0.03 feet after the 28 months of MX‐5 pumping and 15 years
of recovery, the drawdown is continuing to increase.

| 66 P a g e
Figure 2.8. Simulation of water levels in selected wells, 2010 - 2012.

| 67 P a g e
Figure 2.9. Simulated drawdown and recovery caused by pumping of MX-5 at selected wells.

| 68 P a g e

| 69 P a g e
Because the model simulates that the effects from the pumping are both smaller than and less
widespread than observed, the model also would be expected to predict that changes in water levels
occur slower than observed. Thus, the recovery would also be expected to occur quicker than predicted
by the model.
Since there was no easily observable decrease in the simulated spring discharge, no easily observable
increase in simulated spring flow should occur after MX‐5 pumping is stopped. However, a plot of
simulated discharge (Figure 2.10) shows a minor decrease in flow. For example, the decline simulated
for Baldwin Spring is less than 2% of the flow in 2010.
The rightmost panel in Figures 2.6 and 2.7 shows the simulated drawdown after 15 years of recovery.
Recovery near MX‐5 is nearly complete (recovery was about 90% at MX‐4). However, the area with at
least 0.01 feet of drawdown continued to increase, and has reached the western and southern model
boundaries in layer 11. While the simulated drawdown in these areas is small, the simulation
demonstrates that although drawdown has nearly recovered near the pumping well, impacts in other
areas may be continuing to increase a decade or more after pumping has stopped. Although the model
under‐predicts the amount of drawdown, the area that was simulated as being affected by pumping of
MX‐5 is quite similar in extent to that determined from the SeriesSEE evaluation of the data. This
becomes apparent in the results from the 15‐year recovery period, whereas the SeriesSEE evaluation
found that the effects were evident at the end of the Order 1169 test.
Figure 2.10. Simulated spring discharge rates, Muddy River Springs Area, 2010 - 2027.

| 70 P a g e
There are two significant conclusions from the recovery simulation:
1. Except in the immediate vicinity of MX‐5, recovery from the effects of the 28‐month
pumping of MX‐5 will take longer than 28 months, and may take substantially longer to
occur depending on the location. Near the Muddy River Springs, approximately one‐
third of the simulated drawdown remains after 15 years of recovery.
2. The model predicts that the drawdown in Coyote Spring Valley and the Muddy River
Springs area caused by MX‐5 pumping is superimposed on a slower decline of water
levels that is likely largely caused by pumping of carbonate‐rock aquifer water from
Arrow Canyon and Arrow Canyon 2. However, in the recovery simulation, carbonate
pumping from wells in Garnet and the western part of the Black Mountains
Hydrographic Area was also included in the recovery simulation and may be responsible
for part of the slower observed decline in simulated water levels in the vicinity of MX‐5.
ConclusionsfromPost‐AuditSimulation
Results of the post‐audit simulation indicate that the model under‐simulates the amount (i.e., calculates
less effect) of drawdown and reduction of spring discharge than has actually occurred as a result of MX‐
5 pumping. The observed drawdown is more widespread, and of greater magnitude, than simulated.
The model simulates that the discharge from springs is not affected to a measureable amount, but the
real effects are measureable. Thus, predictions that have been made with the model that evaluate the
effects of pumping in Coyote Spring Valley should be considered to be conservative. The impacts from
pumping would be larger and more widespread than simulated.
This evaluation also indicates that simulated recovery of water levels and springflow from the 28‐month
Order 1169 pump test will occur over years, and in the Muddy River Springs area, that recovery will be
approximately 70% complete after 15 years. In areas that are “distant” from MX‐5, drawdown may still
be increasing 15 years after pumping of MX‐5 is stopped. If pumping at MX‐5 were to occur for longer
than 28 months, the rate of recovery can be expected to be slower.
ConclusionsfromModelingontheAvailabilityofGroundwaterPursuanttothePendingApplications
The model simulation results presented in Tetra Tech (2012b) had indicated that continuation of the
current pumping (including MX‐5) into the future would cause slow decreases in discharge from springs
in the Muddy River Springs Area, but that if all existing water rights (used and unused) and pending
water rights in CSV (including SNWA’s pending water rights applications) were fully pumped, there
would be major impacts on spring discharge (and the dependent flow in the Muddy River) within 10 to
150 years. However, the post‐audit of the model clearly indicates that the model under‐simulates the
effects of pumping from the carbonate‐rock aquifer. The timeframes predicted by the model for causing
impacts to the springs are much too long. The evaluation of the spring flow data presented in Section 1
of this report indicates that if pumping from MX‐5 were continued at the recent rates, Pederson Spring
would dry up in years, not decades. Thus, the long‐term modeling predictions presented in Tetra Tech
| 71 P a g e
(2012b) should be considered to be very conservative. Changes will occur more quickly than presented
in that report.
The modeling simulation results provide additional evidence that it is unlikely that the carbonate‐rock
aquifer can support increases in the pumping rates, without having significant impacts on spring
discharge rates. Further, the recovery simulation indicates that the pumping will impact water levels,
and thus spring discharge rates, for extended periods of time. Continued monitoring of water levels and
spring discharge rates is needed, even if groundwater production does not occur at rates greater than
the pre‐Order 1169 test rates.

| 72 P a g e
Section3‐PumpingTestResultsandGroundwaterAvailability
In this section of the report, we review the water budget and perennial yield information for the five‐
basin area identified in our groundwater analysis. We also summarize portions of recent rulings by the
State Engineer related to the concept of perennial yield, especially as it applies to hydrologically‐
connected basins.
In determining the amount of water available for appropriation, the State Engineer is required to
determine that there is unappropriated water available at the proposed source of supply, that the
proposed use not conflict with existing water rights, and that the proposed use not prove detrimental to
the public interest. The most important information from the pumping test, relevant to these three
considerations, has to do with the comparison of the volume of water that was pumped during the
pumping test with the volume of water currently appropriated in CSV. The pumping test removed an
average of 5,400 afy in CSV over the two‐year period of the test. This is only one‐third of the 16,300 afy
of groundwater that is already appropriated through existing water right permits in CSV (see Order
1169) (NSE, 2002a). The monitoring results from the pumping test clearly show that it is not possible to
pump even this reduced volume of groundwater from CSV, at least in the area of MX‐5 and the CSI wells,
without affecting spring discharge in the MRSA. Furthermore, the results indicate carbonate pumping at
any location within the five hydrologically‐connected basins in this area (southern CSV, MRSA, Hidden
Valley, Garnet Valley, and California Wash) will lower groundwater levels uniformly throughout these
basins within relatively short time periods and will eventually capture spring discharge in the MRSA.
Our analyses of spring impacts suggests that if the pumping and drawdown were to continue at the
current rate for another 1.5 to 3 years, upper elevation springs will dry up. The pumping test provides
evidence that pumping of 5,400 afy of groundwater could be challenging over the long‐term without
creating adverse impacts to springs, Federal resources dependent on them, and downstream water
rights. With respect to the question of whether groundwater is available for appropriation or not, our
analysis as presented in this report suggests the answer is no.
WaterBudgetAnalysis
The approach the State Engineer has used in determining water availability for appropriation is to
evaluate the water budget information for a basin. The evaluation of water budgets in hydrographic
basins in Nevada can be difficult because several components, including recharge from precipitation and
interbasin groundwater flow, cannot be directly observed. Usually there are ranges of estimates for
these components that are inferred from supporting hydrologic, geologic, and geochemical data. Several
competing water budgets for CSV were presented in testimony and evidence at the 2001 protest
hearings on the pending water right applications. A more recent water budget modeling effort (SNWA,
2007b) revisited the water budget for CSV but the range of estimates remains essentially unchanged.
The information from the 2001 protest hearings, as summarized in Order 1169 (NSE, 2002a, pp 5‐6),
indicates that there is a maximum of 50,000 afy of groundwater inflow into CSV and a maximum of
53,000 afy of groundwater that flows out of the basin. The extra 3,000 afy of groundwater outflow is the

| 73 P a g e
estimate of net recharge from local precipitation in CSV. Of the 53,000 afy of subsurface outflow from
CSV, 37,000 afy flows southeast and discharges at the MRSA as spring discharge and ET. This discharge
in the MRSA is already fully appropriated through the 1920 decree, as identified in Order 1169 (NSE,
2002a), and therefore not available for appropriation. According to the January 21, 1920, Order of
Determination and the March 11, 1920, Further and Supplemental Order of Determination of the
Nevada State Engineer, there is no water available for appropriation in the Muddy River, its headwaters,
sources of supply, and tributaries (Muddy Valley Irrigation Company, 1938).
That leaves a maximum of 16,000 afy of additional subsurface outflow that may bypass the MRSA and
may be available for appropriation. More recently, the State Engineer has questioned and rejected the
existence of 8,600 afy of outflow from CSV to Hidden Valley as proposed by SNWA (see Ruling 6167, pp
65‐67) (NSE, 2012d), which appears to reduce the estimates of CSV outflow and available water in the
basin further. The 16,300 afy of existing water right permits in CSV, as identified in Order 1169, equals or
exceeds even the highest estimates of the remaining subsurface outflow from CSV, as acknowledged in
Order 1169 (NSE, 2002a, p 6). From a water budget perspective, it appears there is no groundwater
available for appropriation in CSV and our interpretation of the pumping test results does not suggest
otherwise.
Order 1169 also states that “an unknown quantity of water may be available from storage but it is not
known if any of this water could be pumped without unreasonable and irreversible impacts” (NSE,
2002a, p 5). The pumping test provided some information relevant to this issue too. To date, almost all
of the water pumped has been removed from storage. Although the pumped volume during the test
represents only a small portion (one‐third) of the total existing water right permits in CSV, impacts to
springs in the MRSA have been observed already, particularly those at the highest elevations. Those
impacts are expected to increase if the current rate of pumping continues, as more of the natural spring
discharge is captured by pumping in CSV and elsewhere. These effects will only be magnified if more of
the existing water rights in CSV are put to beneficial use, which makes mitigating these impacts
challenging. Based on the results of the pumping test, it does not seem possible to remove groundwater
from storage without reducing carbonate water levels and impacting springflows. With respect to the
question of whether groundwater is available for appropriation or not, our analysis as presented in this
report suggests the answer is no.
PerennialYieldAnalysis
The State Engineer has relied on the concept of perennial yield to assess whether there is
unappropriated water available in a basin. Perennial yield is defined as the maximum amount of
groundwater that can be salvaged each year over the long term without depleting the groundwater
reservoir. Perennial yield is ultimately limited to the maximum amount of natural discharge that can be
“salvaged for beneficial use.” In a number of rulings, the State Engineer states that the perennial yield
cannot be greater than, and in some cases may be less than, the natural recharge of a basin, which is
defined as the combination of subsurface inflow and the fraction of local precipitation that contributes
to groundwater.

| 74 P a g e
The “salvaged” water referred to above has historically been viewed as the volume of groundwater that
is discharged as ET through phreatophytes. “Salvaging” that water means that this groundwater is
captured through pumping before it is discharged as ET through plants. In CSV, as in several other basins
in the area, there is no phreatophyte vegetation and no groundwater ET to “salvage” (DeMeo et al.
2008). All groundwater in CSV is predominantly discharged as interbasin subsurface outflow to the
MRSA and possibly in lesser amounts to other downstream basins as well. The perennial yield of basins
like CSV, where there is no ET, is limited to the some portion of the interbasin outflow.
In applying the perennial yield concept to hydrologically‐connected basins, the State Engineer has
acknowledged that he has to manage basins comprehensively rather than individually. If the interbasin
flow into or out of a basin is already appropriated in an upstream or downstream basin, that water is not
available for appropriation in the individual basin. The State Engineer notes this in several rulings,
including Ruling 5986 (NSE, 2009) on the Tule Desert Hydrographic Basin, which states:
“The amount of subsurface discharge that can be captured is highly variable and uncertain.
Perennial yields for these basins have historically been set at one‐half of the subsurface
discharge. However, when conditions are such that there is subsurface flow through several
basins, there is a potential for double accounting and over appropriating the resource if the
perennial yield of each basin is equal to one half of the subsurface outflow, and basin subsurface
inflows are not adjusted accordingly. Therefore, allowances and adjustments are required to the
perennial yields of basins in these flow systems so that over appropriation does not occur.”
In Ruling 6167 (NSE, 2012d) on the Delamar Valley hydrographic basin, the State Engineer states:
“It is also well known that regional groundwater flow systems hydrologically connect many of
these basins and make management on the hydrologic basin‐scale complex, and often
dependent on prior management/appropriation decisions. In these cases, the State Engineer
must determine from which basin the groundwater should be counted as available. If the
interbasin flow is appropriated in one basin, it is not available for appropriation in an adjacent
basin.”
In other words, the same water cannot be “double‐counted” or “double‐appropriated.” As
demonstrated with the water budget analysis above, there are 53,300 afy of existing water right permits
for the subsurface outflow from CSV, 16,300 afy in CSV and 37,000 afy downgradient in the MRSA. This
volume of appropriated water is equal to even the most optimistic estimates of subsurface outflow from
CSV. In addition, because the area is hydrologically‐connected, we believe that the existing water rights
in all five basins must be considered in any appropriation decision.
While considering the hydrologic connectivity of basins, the State Engineer also must consider the time
scale of any potential impacts. In Ruling 6167 (NSE, 2012d) again, he states:
“At the same time, it is important to consider the time frames and geologic uncertainties
involved. Withdrawals upgradient may or may not affect downgradient users within a
reasonable time frame. The State Engineer has found that if no measureable impacts to existing

| 75 P a g e
rights occur within hundreds of years, then the statutory requirement of not conflicting with
existing rights is satisfied. “
Our analyses of impacts to spring discharge from the pumping test show that measureable impacts from
the existing level of pumping are observed on the scale of months to years rather than hundreds of
years.
Finally, with respect to the perennial yield of CSV, it has to be noted that some portion of the interbasin
inflow to CSV from two tributary basins adjacent to CSV (Delamar, Kane Springs) has been appropriated
already, but not developed. Ruling 5712 (NSE, 2007) appropriated 1,000 afy in Kane Springs Valley and
Ruling 6167 (NSE, 2012d) appropriated 6,100 afy in Delamar Valley. Both of these appropriations will
eventually reduce the interbasin inflow to CSV if and when they are developed. The State Engineer has
recognized that prior appropriation of upgradient interbasin flow is an issue that must be considered
(see Rulings 5465, 5621, and 6144‐6167) (NSE, 2005; NSE, 2006; NSE, 2012a; NSE, 2012b; NSE, 2012c;
NSE, 2012d). With respect to Dry Lake and Delamar Valley basins, Ruling 6167 (NSE, 2012d) states:
“By discounting any subsurface inflow from up‐gradient basins that is already appropriated,
systematic double counting can be eliminated. These controls on the regional flow system allow
groundwater to be available in every basin for beneficial use.”
It seems prudent to follow the same approach here and discount the subsurface inflow already
appropriated. This means the amount of groundwater already allocated in CSV may even be greater
than the actual available water, given the constraints with existing appropriations upgradient and
downgradient of CSV. There is no information from recent studies or from our interpretation of the
pumping test results to suggest that there is additional groundwater available in the basin. The fact that
the pumping to date in CSV represents only one‐third of the existing water rights permitted in CSV and
that our analysis of spring impacts suggests that even this small level of pumping could lead to
unreasonable and possibly irreversible impacts in the next few years confirms what is indicated by the
analyses of water budgets and perennial yield – there is no additional groundwater available for
appropriation.

| 76 P a g e
Section4‐PublicInterestConsiderationsandFederalGroundwater‐DependentResources This section of the report provides an overview of public interest considerations related to the
availability of groundwater for appropriation pursuant to the applications held in abeyance by Order
1169. We focus our discussion on the potential impacts of decreased spring discharge and groundwater
levels on resources that the U.S. Fish and Wildlife Service (Service or USFWS), NPS, and BLM hold in trust
for the public. As stated earlier, the State Engineer is required to establish that a proposed groundwater
use will not prove detrimental to the public interest when determining the amount of groundwater
available for appropriation. The State Engineer has considered the protection of threatened and
endangered species as well as sensitive species and related environmental values when determining
whether water is available for appropriation.10 In Nevada, all surface water and groundwater (NRS 533.025), as well as non‐domesticated wildlife in its
natural habitat (NRS 501.100), is considered a public resource. The State is trustee of these resources,
managing them for the benefit of the citizens of Nevada and the United States. Several species that
occur in the MRSA are protected under State of Nevada statute, including but not limited to the Moapa
dace (Moapa coriacea), which is classified as endangered (NAC 503.065.2); the Moapa speckled dace
(Rhinichthys osculus moapae) and the Muddy River population of the Virgin River chub (Gila seminuda),
which are both classified as sensitive fishes (NAC 503.067); and many species of migratory birds,
including the southwestern willow flycatcher (Empidonax traillii extimus), which is classified by the State
of Nevada as endangered (NAC 503.050). Some of these species are also federally protected under the
Endangered Species Act (ESA) of 1973, as amended (16 U.S.C. 1531 et seq.).
Below, we focus our discussion on two resources in the MRSA managed by the Service, which are also of
interest to the State of Nevada and the other federal agencies: the Moapa Valley National Wildlife
Refuge (NWR; Refuge), including the fish and wildlife found there; and the Moapa dace, which is an
endangered fish that has been federally protected since March 11, 1967 (USFWS, 1967). This is followed
by a discussion of NPS and BLM water and groundwater‐dependent resources. The existence and/or
biotic integrity of these resources depend on thermal spring discharge from the carbonate‐rock aquifer
in the MRSA.
USFWSMoapaValleyNationalWildlifeRefuge
Moapa Valley NWR was established on September 10, 1979, to secure and protect habitat for the
endangered Moapa dace. The purpose or mission of Moapa Valley NWR is derived from the Endangered
Species Act of 1973, as amended: “...to conserve (A) fish or wildlife which are listed as endangered
species or threatened species...or (B) plants...” (16 USC Sec. 1534) (USFWS, 2009). The Refuge and its
resources are held in trust for the public and managed by the Service. Moapa Valley NWR comprises
10 See Ruling 3784 (February 14, 1994) (Lahontan cutthroat trout), Ruling 4683 (November 24, 1998) (Cui-ui and Lahontan cutthroat trout) and Ruling 6164 (March 22, 2012) (wildlife, wetlands and fisheries).

| 77 P a g e
multiple, adjacent but visually distinct units – the Plummer Unit, the Pedersen Unit, and the Apcar Unit
(see Figure 1.20) – purchased by the Service from various, willing sellers from 1979 to 2006.
Moapa Valley NWR is managed for two primary goals (USFWS, 2009):
Goal 1. Protect and restore, when possible, healthy populations of endemic and special status species,
such as the endangered Moapa dace, within the Muddy River headwaters.
Goal 2. Provide local communities and others with opportunities to enjoy and learn about the resources
of Moapa Valley NWR and participate in its restoration.
Most of Moapa Valley NWR was previously held by private landowners and used as several resorts with
swimming pools and other developed features. These alterations have been removed and the habitat
improved since 1979, with significant efforts and funding from the Southern Nevada Public Land
Management Act (SNPLMA) focused on restoration at the Refuge from 2004 through 2012. Public use
facilities were added in 2008 on the Plummer unit of the Refuge and opened to the public in 2009.
Opportunities for the public at the Refuge include wildlife observation, photography, hiking,
environmental education and outreach programs, and volunteer events. Visitors primarily come from
the local communities of Moapa, Overton and Logandale, as well as Mesquite and Las Vegas (including
some tourists). These efforts have occurred in support of the aforementioned goals to protect and
restore habitat for endemic and special status species, as well as provide opportunities for visitors.
In support of the purpose of Moapa Valley NWR to secure and protect habitat for the endangered
Moapa dace, the Service has two water rights that have been certificated by the Nevada State Engineer.
One of these is a non‐consumptive right for 3.5 cfs of spring flow as measured at the Warm Springs West
flume for the maintenance of habitat of the Moapa dace and other wildlife purposes (Permit No. 56668,
Certificate No. 15097 issued subject to the terms of Permit No. 56668). The other is for approximately
0.25 cfs from a well (Permit No. 27216, Certificate No. 12758 issued subject to the terms of Permit No.
22738, Certificate No. 8331). Surface water from the springs on Moapa Valley NWR also supports
adjudicated rights downstream from the Refuge. Use of these surface water rights downstream does
not generally affect the Refuge. In November 2008, the Service also applied for non‐consumptive, in‐
stream flow rights to be used for wildlife on the Apcar and Plummer spring systems. These water right
applications are being held in abeyance until the completion of the pumping test under Order 1169.
Moapa Valley NWR contains part of the unique system of thermal springs in the MRSA, including the
springs and uppermost streams of Plummer, Pederson, and Apcar/Jones. These springs and streams
provide aquatic and riparian habitats that support sensitive birds, amphibians, bats, and other fish in
addition to the Moapa dace, including the endemic Moapa White River springfish (Crenichthys baileyi
moapae) and the State protected Moapa speckled dace. The MRSA provides habitat for a unique
assemblage of aquatic species including ten native thermophiles dependent upon the warm springs and
streams for survival. Besides the dace and springfish, the system supports four endemic invertebrates

| 78 P a g e
found nowhere else in the world – the Moapa naucorid (Limnocoris moapaensis), Moapa riffle beetle
(Microcylloepus moapus), Moapa pebblesnail (Pyrgulopsis avernalis), and Moapa Warm Springs riffle
beetle (Stenelmis moapa). The upland areas on Moapa Valley NWR support a variety of birds, small
mammals and reptiles, including the threatened Mojave desert tortoise (Gopherus agassizii).
The species and resources that depend on the aquatic and riparian habitats in the MRSA do not
recognize and stay within the boundaries of the Moapa Valley NWR. Other adjacent and nearby lands
also contain springs, streams, and wetlands that provide important protection for the resources in the
MRSA that are held in trust for the public. Specifically, the Warm Springs Natural Area provides habitat
that is critical to protect the ten native aquatic species, and numerous birds, amphibians, bats and
reptiles observed in the MRSA. The aquatic and riparian habitats on these lands sustain 28 Nevada State
sensitive or federally listed species, including important tributary streams and the main‐stem river for
the endangered Moapa dace, nesting habitat for the endangered southwestern willow flycatcher, and
habitat for Nevada’s largest breeding population of vermilion flycatcher (Pyrocephalus rubinus) (SNWA,
2011). The Warm Springs Natural Area was acquired with public federal funds by the Southern Nevada
Water Authority to “develop a natural area” that “will provide controlled public access to enjoy the
abundant natural resources, will include interpretation of the resources and Threatened and
Endangered species located on the site, and will include measures to preserve and protect those
resources” (SNWA, 2011). Further downstream on the main‐stem Muddy River, additional aquatic and
riparian species depend on the water and associated habitat that occurs along public lands managed by
the Bureau of Land Management, State of Nevada (Overton Wildlife Management Area), and National
Park Service.
TheMoapaDaceanditsVulnerabilitytoEnvironmentalStressors
The endangered Moapa dace is endemic to the headwaters of the Muddy River system where it is
estimated to have occupied 25 springs and about 16 km (10 mi) of stream habitat in the early 20th
century (Ono et al., 1983). Currently, the dace population is constrained to three thermal spring
complexes and their respective springbrooks (Pederson, Plummer, and Apcar/Jones), including their
confluence upstream of the Muddy River, an area that is roughly 20% of its historic distribution. The
majority of the dace population is found on the Moapa Valley NWR and the Southern Nevada Water
Authority’s Warm Springs Natural Area. Habitat alterations, the introduction of nonnative fishes, and
water withdrawals over the last century have restricted the dace’s distribution within the Muddy River
system and resulted in severe population declines.
The status of the species has fluctuated over the last 20 years, with a couple of significant population
increases and decreases during this period. Snorkel surveys conducted each February (1994 to present)
throughout the upper Muddy River system show that Moapa dace counts have ranged from a high of
3,825 individuals in February 1994 to a low of approximately 460 individuals in February of 2008 and
2009, prior to onset of the Order 1169 pumping test. One significant decline is attributed to the invasion
of nonnative blue tilapia (Oreochromis aurea) where the dace population decreased from 3,825

| 79 P a g e
individuals in 1994 to 1,565 individuals in 1997. Between 1999 and 2007, surveys yielded between 900
and 1,300 individuals. In 2008, the dace population again experienced a drastic decline in numbers,
falling to its lowest known level of 459 individuals (a 60% decline from the previous year). The cause of
this population crash remains unknown. From 2009 through early 2012, dace numbers slowly increased.
Most recently (February 2013), surveyors counted 1,226 fish, an 88% increase over February 2012
survey results. We attribute this latest population increase to recent habitat restoration activities on the
Moapa Valley NWR and the Warm Springs Natural Area, including removal of nonnative palm trees from
stream channels, planting of native vegetation, improving stream velocities, and channel
reconfiguration. Specifically, the lower Pederson Springbrook was re‐routed closer to its historical
alignment with a new channel created in October 2008. This reach has generally supported increasing
numbers of Moapa dace since its creation and the largest number of dace of any reach in recent surveys
(August 2012 and February 2013). Most of the upper and lower reaches of the Apcar/Jones Springbrook
have also been restored and the dace population has increased in this area as well.
While the status of the Moapa dace has improved over the last couple of years presumably due to
habitat restoration, the Service continues to be concerned about long‐term persistence of the species.
The different life stages of the Moapa dace are dependent upon thermal springs, springbrooks, and the
main‐stem Muddy River for survival (Scoppettone et al., 1992), but the availability of these habitat types
continues to be limited by system alterations and the presence of nonnative fish. For example, the
largest spring in the MRSA remains unavailable to the dace for spawning and use by early life stages due
to recreational development (swimming pools, chlorination, and water diversion), and the North Fork,
South Fork, Muddy Creek, and the Muddy River main‐stem do not currently support Moapa dace. The
dace’s restricted range and small population size makes it vulnerable to extirpation from existing threats
(e.g., nonnative fishes, water withdrawals), catastrophic events, or stochastic variation in demographic
rates or in the environment. For example, wildfire in the MRSA is a continuing threat that could be
catastrophic to the Moapa dace. In 1994, a fire nearly wiped out the dace population. A more recent
(July 2010) fire, while burning about 600 acres including occupied dace habitat, did not spread to the
Moapa Valley NWR where 75% of the dace population sought refuge. Thus, maintaining or increasing
available spring and springbrook habitat on the refuge and adjacent areas– which in part can be
achieved by ensuring adequate flows– will likely reduce extinction risk and increase the dace’s ability to
recover quickly from disturbances (i.e., increase its resiliency).
For these reasons, the Moapa dace remains highly vulnerable to habitat changes such as those that
could result from reductions in spring discharge due to groundwater pumping in the MRSA or adjacent
hydrographic basins. Reductions in springflow could affect essential dace habitat features, such as
substrate composition and water depth, velocity, and temperature (Hatten et al., 2013). Life history
attributes and behavior (e.g., ability to effectively drift feed, fish size and thus fecundity) could also be
affected by reduced water volumes and velocities resulting from diminished springflow, and interactions
between native and nonnative fishes (e.g., predation and competition) could be exacerbated as habitat
diversity and complexity is reduced due to decreased flows. In particular, the dace is vulnerable to
habitat changes in spawning areas because of its reliance on thermal spring discharge to create

| 80 P a g e
conditions conducive to successful reproduction (stable water temperatures between 30 and 32 oC, such
as that found near and downstream of spring heads) and survival of early life stages (larvae are found
exclusively in the upper reaches of these spring‐fed tributaries) (Scoppettone et al., 1992).
As just described, the entire Moapa dace population is currently found within the Pederson, Plummer,
and Apcar/Jones springbrooks, and the springs that contribute flow to these streams provide important
habitat for spawning and early life stages. Therefore, maintaining adequate spring and streamflow in
these springbrooks is extremely important to survival of the Moapa dace. The hydrologic analysis
presented in this report demonstrates that the springs in the MRSA do not show the same degree of
response to groundwater level declines, mainly because of differences in spring elevation. Pederson and
Pederson East springs are at a higher elevation than the other MRSA springs and appear to be the most
sensitive to declines in carbonate water levels from groundwater pumping. If the current rate of
drawdown continues in carbonate monitoring well EH‐4, these two higher‐elevation springs will cease to
flow in 1.5 to 3 years. This does not mean that streamflow in Pederson Springbrook will cease within this
timeframe because 4 other major spring groups that are at lower elevation and are less sensitive to
groundwater level declines (referred to in this report as spring groups M‐11, M‐12, M‐13, and M‐19)
contribute a large proportion of total flow to this springbrook. During the Order 1169 pumping test,
average monthly flow at Warm Springs West gage on Pederson Springbrook (which measures the
combined discharge from Pederson Spring and the other 4 major spring groups) declined by 9 percent.
Spring and streamflow reductions during this period were less for Plummer and Apcar/Jones, as
expected due to the lower elevation of the springs contributing flow to these springbrooks. We
estimated a 6% flow reduction at the Iverson Flume on Plummer Springbrook (with a slightly lower
reduction in flow [3‐4%] for the contributing springs) and a 4% decline in flow at Jones Spring (which
feeds the Apcar stream) during the pumping test.
Based on this, we now address the question “What are the potential impacts to Moapa dace habitat and
the dace population if additional groundwater is appropriated in the MRSA and adjacent hydrographic
basins?” To answer this, we looked to a recent study conducted by Hatten et al. (2013), in which the
authors developed a set of habitat models for the dace and conducted hydraulic simulations with a two‐
dimensional hydrodynamic model to estimate the extent of dace habitat over a range of flows (plus or
minus 30% of base flow, in 10% increments). Using results from this study, we first considered potential
impacts to dace habitat based on observed or estimated impacts to spring and streamflow during the
Order 1169 pumping test. Because only one‐third of the total appropriated volume in CSV was pumped
during the Order 1169 pumping test, we anticipate greater impacts to dace habitat if appropriated rights
are fully developed and/or additional groundwater is allocated and developed.
The habitat‐flow simulations conducted by Hatten et al. (2013) consistently showed that reduced
springflows produced less Moapa dace habitat in the Pederson, Plummer, and Apcar springbrooks.
Additionally, the simulations showed that Plummer Springbrook appears to be the most sensitive to
reductions in flow (i.e., greatest potential habitat loss for any given flow reduction), followed by
Pederson and then Apcar. Based on Hatten et al. (2013), a 9% decline in flow in the Pederson

| 81 P a g e
Springbrook (such as observed during the pumping test) would result in a small (<5%) reduction in dace
habitat. Similarly, Apcar/Jones springbrook is predicted to have a <5% reduction in habitat from baseline
conditions if flows decline by amounts observed at Jones Spring during the pumping test. On the other
hand, Moapa dace habitat within Plummer Springbrook appears to be very sensitive to flow reductions.
While a 6% reduction in base flow in this stream (the estimated decrease during the pumping test) was
not specifically modeled by Hatten et al. (2013), their study predicted a rather large (20%) reduction in
dace habitat within this stream in response to a 10% decrease in base flow. We assume a somewhat
lower amount of habitat loss for a 6% decrease in flow, but a greater impact if all existing permitted
groundwater rights in CSV are developed (as this would represent three times the amount of pumping
that occurred under the pumping test). Given the species’ limited distribution, habitat losses of this
amount could prove significant. We note that the above estimates of habitat loss for all three
springbrooks do not take into account the potential offsetting of pumping impacts with recent habitat
restoration activities or other conservation measures.
We assume that a reduction in habitat, if it were to occur, would be followed by a decline in Moapa dace
numbers since population size of many endangered species is thought to be limited by the amount of
suitable habitat available to them (Williams et al., 2002). Over the last five years, the majority (up to
90%) of the dace population counted during fish surveys in the MRSA has been in the Pederson and
Plummer springbrooks. Thus, habitat loss within these streams is expected to adversely affect the
overall dace population. Additionally, dace only spawn in the Pederson, Plummer, and Apcar/Jones
spring systems, while no dace are found in the other two major spring systems (Baldwin and Muddy
Spring). Reduction and/or cessation of thermal spring discharge within the three occupied springbrooks,
particularly Pederson and Plummer, would reduce the amount of spawning habitat (i.e., waters at the
appropriate temperature for spawning), thereby affecting the dace’s ability to successfully reproduce
and reducing fecundity and overall population numbers. This could have negative implications for
survival and/or recovery of the species.
To conclude, we remain concerned about the Moapa dace’s ability to persist long‐term despite recent
population growth. Its numbers are still lower than historic estimates (Scoppettone et al., 1992; USFWS
survey data); it is restricted to a small geographic area that is but a fraction of its historic range; it has
very specific habitat requirements, particularly for spawning and early life stages, which makes it
vulnerable to changes in the environment; and it is exposed to numerous stressors with limited
opportunities to move away from the ensuing effects, such as habitat degradation. These are
characteristics that make a species highly vulnerable to extinction (Williams et al., 2005; Burkhead
2012). Moapa dace numbers increased during the pumping test period, but we attribute this to recent
habitat restoration in the MRSA, which appears likely to have offset impacts to habitat caused by
pumping‐induced flow reductions, although this has not been substantiated. However, we caution that
restoration of physical habitat (e.g., reconfiguration of stream channels, removal of nonnative plants,
and planting of native vegetation) will only go so far towards maintaining or improving the dace’s status
if the anthropogenic stressors that lead to habitat degradation are not also addressed (Hilderbrand et
al., 2005; Christian‐Smith and Merenlender, 2010). These fish depend on thermal spring discharge to

| 82 P a g e
create and maintain important habitat characteristics, and this species is thought to be more sensitive to
flow reduction than some other fish species inhabiting the Muddy River system (Hatten et al., 2013). If
additional groundwater is appropriated in CSV, the MRSA, and adjacent areas, spring discharge and
streamflow could be lowered to the point that physical habitat restoration will not be an effective or
possible mitigation option.
Aquatic species such as the Moapa dace have evolved life history strategies primarily in response to the
natural flow regime of the systems they inhabit (see Bunn and Arthington, 2002). Altering this flow
regime could affect crucial drivers of dace population dynamics, such as the resources needed for
spawning, juvenile growth, recruitment, feeding, and other behaviors. Given the dace’s sensitivity to
flow reduction, and the potential consequences of habitat loss for a species with an extremely limited
distribution, we recommend that no additional water be appropriated in CSV and adjacent hydrographic
basins.
NPSandBLMGroundwater‐DependentResources
Several important warm springs are located in the Overton Arm area of Lake Mead National Recreation
Area (Lake Mead NRA), which is administered by the NPS. These springs include Rogers, Blue Point,
Corral, and Scirpus springs, and other smaller, unnamed springs. Discharge from these springs provides
water for riparian vegetation and wildlife habitat, and sustains a recreational amenity enjoyed by many
park visitors.
The United States has federal reserved water rights for all of the springs within Lake Mead NRA. The
United States also has a state appropriative water right to Rogers Spring (Certificate No. 4476).
The relict leopard frog (Lithobates onca ; formerly classified as Rana onca), previously believed extinct,
has been found at Rogers, Corral, and Blue Point Springs. In 2002, the species was petitioned for listing
as endangered under the ESA. The Service subsequently found that listing is warranted, but
development of a proposed listing regulation is precluded by other higher priority listings. It remains on
the Service’s candidate species list. Although not an endangered or threatened species, a herd of
approximately 150 of Nevada’s official state animal – the desert bighorn sheep ‐ also use these springs
in the northern part of Lake Mead NRA.
The likely source of the water discharging from these springs is the regional carbonate‐rock aquifer
system. Therefore, the withdrawal of groundwater from this aquifer system upgradient of these springs
would most likely affect their rates of discharge. Although the Order 1169 pumping test period was too
short to be able to identify the effects of upgradient groundwater withdrawals on these springs,
geologic, hydrologic, and hydro‐geochemical evidence indicates that these springs likely are vulnerable
to depletion of discharge from longer‐term and/or cumulative carbonate pumping in the five
hydrologically connected basins discussed in earlier sections of this report.

| 83 P a g e
The BLM also has several trust resources in the area as well. Both the Moapa dace and the Moapa
speckled dace occur in parts of the Muddy River that are managed by the BLM Southern Nevada District
Office. Both species are BLM Special Status Species, a category that includes 1) species listed or
proposed for listing under the ESA and 2) BLM‐designated Sensitive Species ‐ species requiring special
management consideration to promote their conservation and reduce the likelihood and need for future
listing under the ESA. Sensitive species are designated by the BLM State Director. Many of the species
protected by the Service and the State of Nevada are on BLM’s State Sensitive Species List. This list
includes the Moapa Warm Springs riffle beetle, the Moapa pebblesnail, and the Moapa Valley pryg
(Pyrgulopsis carinifera), some of which are referred to in this report by the Service.
Further, the BLM is a member of the Biological Action Committee for the Muddy River working to
conserve and recover the rare aquatic species listed in this report. As part of these efforts, BLM used
SNPLMA funding to design and construct three fish barriers on the Muddy River to prevent the
upstream migration of nonnative species from the Virgin River. The barriers also segmented the river
into sections that can be treated in order to remove the nonnatives. The fish barrier design includes the
ability to remove the center sections and allow for connectivity after the each segment is clear of
nonnative fish. The approximate cost for the construction of the barriers was $600,000. BLM has also
contributed additional funding for the removal of nonnative fish species. In addition, the BLM has
partnered with the Service and the Walton Foundation to conduct restoration projects on the Muddy
River to benefit the southwestern willow flycatcher by increasing potential foraging habitat, which is
also groundwater dependent.
ConclusionsfromPublicInterestConsiderations
Our view continues to be that groundwater should be developed in a manner that will avoid impacts to
groundwater‐dependent public resources to the extent possible; or, if such impacts cannot be avoided,
to minimize those impacts to groundwater‐dependent resources, including the natural resources and
public facilities at the Moapa Valley NWR, Lake Mead NRA, and on other lands, as well as the
endangered Moapa dace and other federally or State‐protected and sensitive species that inhabit (some
exclusively) these areas. Appropriating additional groundwater within CSV, the MRSA, and adjacent
hydrographic basins (Hidden and Garnet valleys and California Wash) would likely prove detrimental to
the public interest given that these resources and lands rely on thermal spring discharge from the
carbonate‐rock aquifer.

| 84 P a g e
Section5‐OverallReportConclusions
In 2002, the Nevada State Engineer issued Order 1169, which stated that all pending and new water
right applications in the carbonate‐rock aquifer in Coyote Spring Valley (Basin 210), Black Mountains
Area (Basin 215), Garnet Valley (Basin 216), Hidden Valley (Basin 217), the Muddy River Springs Area,
a.k.a. Upper Moapa Valley (Basin 219), and Lower Moapa Valley (Basin 220) would be held in abeyance
pending further study (NSE, 2002a). California Wash (Basin 218) was later added to the list through
Ruling 5115 (NSE, 2002b). The applications were held in abeyance so that the State Engineer could
collect more information on the effects of groundwater pumping from the carbonate‐rock aquifer prior
to making a determination on pending water right applications in the listed basins. The order called for a
study covering a “5‐year minimum period of time during which at least 50% of the water rights then
currently permitted in the Coyote Springs Valley groundwater basin are pumped for at least two
consecutive years.”
The Order 1169 Study officially started on November 15, 2010 and was finished on December 31, 2012.
Carbonate pumping in CSV, which averaged about 2,000 afy from 2006 to 2009, more than doubled to
5,400 afy during the pumping test. Groundwater pumping in adjacent basins remained relatively
unchanged from previous years during the period of the pumping test. The volume of pumping in CSV
during the test was approximately one‐third of the groundwater rights currently permitted in that basin.
The U.S. Fish and Wildlife Service, National Park Service, and Bureau of Land Management prepared this
report in response to the State Engineer’s request for information related to the pumping test. The
report addresses the three questions posed by the Nevada State Engineer in Order 1169A (NSE, 2012e):
What information was obtained from the pumping study/test?
What were the impacts of pumping under the pumping test?
What is the availability of water pursuant to the pending applications?
The main findings of this report are:
The effects of pumping MX‐5 are readily apparent in water‐level data from the carbonate‐rock
aquifer over a 1,100 square mile area that is hydrologically‐connected and encompasses five
hydrographic basins: Coyote Spring Valley, the Muddy River Springs Area, Hidden Valley, Garnet
Valley, and California Wash. There is no scientific justification for managing groundwater
production from the carbonate‐rock aquifer separately in these five hydrographic basins.
The results indicate carbonate pumping at any location within the five hydrologically‐connected
basins in this area (southern CSV, MRSA, Hidden Valley, Garnet Valley, and California Wash) will
lower groundwater levels nearly uniformly throughout these basins within relatively short time
periods and will eventually capture from the Muddy River Springs, Muddy River, and (or) ET
associated with phreatophytic vegetation in the MRSA and California Wash, the only forms of
natural discharge in this area, at a rate that approaches 100 percent of the pumping.
| 85 P a g e
An evaluation of the discharge from springs in the Muddy River Springs area indicates that
pumping of MX‐5 has caused observable reduction in the discharge from the higher elevation
springs, and that the observed capture of the spring discharge was 10 to 20% of the rate at
which MX‐5 was pumped. Thus, during the duration of the Order 1169 test, most of the water
was being produced from storage (i.e., from the release of water caused by the reduction in
water levels). Drawdown in the carbonate‐rock aquifer was continuing to increase at the time
the test was officially ended (December 31, 2012), and therefore the capture of discharge at the
springs was also continuing to increase. If pumping of MX‐5 continues at the same rate as
during the test, discharge from the Pederson spring would likely cease in about 1.5 years and
discharge from Pederson East spring would likely cease in about 2.5 to 3 years. Continued
pumping would cause other springs to decline or dry up as well until the declines in spring
discharge and ET equal the volume of pumping.
The model developed by Tetra Tech in 2012 underestimates the magnitude of groundwater‐
level changes and the amount of time for them to be developed, but matches well the area that
will be affected by pumping from the carbonate‐rock aquifer. Thus, the predicted effects of
pumping from the carbonate‐rock aquifer are very conservative, and the springs will be
impacted considerably sooner than the model predicts, under the pumping scenarios simulated.
Our analysis of water budgets and perennial yield information suggests that there is no available
water in CSV or any of the other four hydrologic basins discussed above. The fact that the
pumping in CSV during the test was only one‐third of the existing water rights permitted in CSV
and that our analysis of spring impacts suggests that even this small level of pumping could lead
to unreasonable and possibly irreversible impacts confirms this finding.
The ecosystem around the Muddy River Springs area is dependent on the discharge from the
springs. The Moapa dace is dependent on the higher temperature discharges. Additionally, the
flow in the Muddy River is dependent on the discharge from the carbonate‐rock aquifer.
Pumping of the carbonate‐rock aquifer will reduce the streamflow and impact downstream
water rights holders. The Muddy River is fully adjudicated. Therefore, there is no water
available for water right applications pending under Order 1169 within the five basins described
above.

| 86 P a g e
Section6–References
Beck, D.A., Ryan, R., Veley, R.J., Harper, D.P., and Tanko, D.J. 2006. Water‐surface elevations, discharge, and water‐quality data for selected sites in the Warm Springs area near Moapa, Nevada: U.S. Geological Survey Open‐File Report 1311, 230 p.
Belcher, W.R., P.E. Elliott, and A.L. Geldon. 2001. Hydraulic‐property estimates for use with a transient ground‐water flow model for the Death Valley regional ground‐water flow system, Nevada and California. USGS Water‐Resources Investigations Report 01‐4210. 28 pp.
Bredehoeft, J. 2007. It is the discharge. Groundwater 45(5):523.
Bredehoeft, J. and T. Durbin. 2009. Ground water development – The time to full capture problem. Groundwater 47(4):506‐514.
Bunn, S.E. and A.H. Arthington. 2002. Basic principles and ecological consequences of altered flow regimes for aquatic biodiversity. Environmental Management 30: 492‐507.
Burkhead, N.M. 2012. Extinction rates in North American freshwater fishes, 1900‐2010. BioScience 62: 798‐808.
Christian‐Smith, J. and A.M. Merenlender. 2010. The disconnect between restoration goals and practices: a case study of watershed restoration in the Russian River Basin, California. Restoration Ecology 18: 95‐102.
DeMeo G.A., J.L. Smith, N.A. Damar, and J. Darrell. 2008. Quantifying ground‐water and surface‐water discharge from evapotranspiration processes in 12 hydrographic areas of the Colorado Regional Ground‐Water Flow System, Nevada, Utah, and Arizona. USGS Scientific Investigations Report 2008‐5116. 34 pp.
Eakin, T.E. 1966. A regional interbasin groundwater system in the White River Area, Southeastern Nevada. Water Resources Research 2:251‐271.
Fetter, C.W. 1994. Applied Hydrogeology. 3rd ed. Upper Saddle River, New Jersey: Prentice Hall.
Garcia, C.A., Halford, K.J. and Fenelon, J.M. (2013), Detecting drawdowns masked by environmental stresses with water‐level models. Ground Water, 51: 322–332. doi: 10.1111/gwat.12042
Halford, K., Garcia, C.A., Fenelon, J., and B. Mirus. 2012. Advanced methods for modeling water‐levels and estimating drawdowns with SeriesSEE, and Excel Add‐in. USGS Techniques and Methods 4‐F4. 30 pp.
Hatten, J.R., T.R. Batt, G.G. Scoppettone, and C.J. Dixon. 2013. An ecohydraulic model to identify and monitor Moapa dace habitat. PLOS ONE 8(2): 1‐12. Available at www.plosone.org.
Hilderbrand, R.H., A.C. Watts, and A.M. Randle. 2005. The myths of restoration ecology. Ecology and Society 10(1): 19. Available online at http://www.ecologyandsociety.org/vol10/iss1/art19.

| 87 P a g e
Huntington, J., C. Morton, M. Bromley, R. Liebert. 2013. Analysis of evapotranspiration for the Muddy River Springs Area. Technical Memo to Southern Nevada Water Authority. Desert Research Institute, University of Nevada at Reno, Nevada.
Johnson, C. and M. Mifflin. 2006. The AEM and regional carbonate aquifer modeling. Groundwater 44(1):24‐34.
Mayer, T.D. and R.D. Congdon. 2008. Evaluating climate variability and pumping effects in statistical analyses. Groundwater 46(2):212‐227.
Muddy Valley Irrigation Company. 1938. Protest of the Muddy Valley Irrigation Company in the Matter of Application No. 10188 by the United States Department of Agriculture, Bureau of Biological Survey, for Permission to Appropriate Water From Muddy Creek, Filed March 9, 1938: Nevada State Engineer's Office, Carson City, Nevada, 2 p.
Nevada Division of Water Resources (NDWR). 2012. NDWR Order 1169 study data‐exchange Web site: an online source of hydrologic monitoring and production data collected and provided to NDWR by Order 1169 study participants. Available on the internet at http://water.nv.gov/mapping/order1169/. Accessed most recently on February 19, 2012).
Nevada State Engineer (NSE). 2002a. Order 1169, Holding in abeyance carbonate‐rock aquifer system groundwater applications pending or to be filed in Coyote Springs Valley (Basin 210), Black Mountains Area (Basin 215), Garnet Valley (Basin 216), Hidden Valley (Casin 217), Muddy River Springs aka Upper Moapa Valley (Basin 219), Lower Moapa Valley (Basin 220), and for further study of the appropriation of water from the carbonate‐rock aquifer system, Lincoln and Clark Counties, Nevada. March 8, 2002. 11 pp.
NSE. 2002b. Ruling 5115, In the Matter of Applications 54075 and 54076 Filed to Appropriate the Underground Water from the California Wash Hydrographic Area (218), Clark County, Nevada. April 18, 2002. 40 pp.
NSE. 2005. Ruling 5465, In the Matter of Protested Application 53948 Filed to Appropriate the Underground Waters of Tikaboo Valley (Northern Part) (169A), Lincoln County Nevada, Applications 53950 and 53951 Filed to Appropriate Underground Waters of Tikaboo Valley (Southern Part) (169B), Lincoln County Nevada, Applications 54062 and 54066 Filed to Appropriate Underground Waters of Three Lakes Valley (Southern Part) (211), Clark County Nevada, and Applications 54068 and 54069 Filed to Appropriate Underground Waters of Three Lakes Valley (Northern Part) (168), Clark County Nevada. January 4, 2005. 62 pp.
NSE. 2006. Ruling 5621, In the Matter of Protested Applications 72787‐72797 Filed to Change the Point of Diversion and Place of Use of Underground Water Previously Appropriated Under Permits 53950, 53951, 54060, 54062, 54066, 54068 and 54069, within the Three Lakes Valley – Southern Part, Hydrographic Basin (211), Clark County, Nevada. June 15, 2006. 30 pp.
NSE. 2007. Ruling 5712, In the Matter of Applications 72218‐72221 Filed to Appropriate the Underground Waters of Kane Springs Valley Hydrographic Basin (206), Lincoln County, Nevada. February 2, 2007. 23 pp.

| 88 P a g e
NSE. 2009. Ruling 5986, In the Matter of Applications 64692 Filed to Appropriate the Underground Waters of Tule Desert Hydrographic Basin (221), Lincoln County, Nevada. April 29, 2009. 20 pp.
NSE. 2012a. Ruling 6164, In the Matter of Applications 54003‐54021, Inclusive, Filed to Appropriate the Underground Waters of Spring Valley Hydrographic Basin (184), Lincoln and White Pine Counties, Nevada. March 22, 2012. 218 pp.
NSE. 2012b. Ruling 6165, In the Matter of Applications 53987 and 53988 Inclusive, Filed to Appropriate the Underground Waters of Cave Valley Hydrographic Basin (180), Lincoln County, Nevada. March 22, 2012. 170 pp.
NSE. 2012c. Ruling 6166, In the Matter of Applications 53989 and 53990 Filed to Appropriate the Underground Waters Dry Lake Valley Hydrographic Basin (181), Lincoln County, Nevada. March 22, 2012. 164 pp.
NSE. 2012d. Ruling 6167, In the Matter of Applications 539991 and 53992 Filed to Appropriate the Underground Waters Delamar Valley Hydrographic Basin (182), Lincoln County, Nevada. March 22, 2012. 162 pp.
NSE. 2012e. Order 1169A. December 21, 2012. 5 pp.
Ono, R.D., J.D. Williams, and A.Wagner. 1983. Vanishing fishes of North America. Stone Wall Press, Washington, D.C. 257 pages.
Scoppettone, G.G., H.L. Burge, and P.L. Tuttle. 1992. Life history, abundance, and distribution of Moapa dace (Moapa coriacea). Great Basin Naturalist 52(3): 216‐225.
Southern Nevada Water Authority (SNWA). 2007a. Geology of White Pine and Lincoln Counties and adjacent areas, Nevada and Utah – The geologic framework of regional groundwater flow systems. Southern Nevada Water Authority, Las Vegas, Nevada, Doc. No. HAM‐ED‐0001. 157 pp.
SNWA. 2007b. Water‐Resources Assessment and Hydrogeologic Report for Cave, Dry Lake, and Delamar Valleys. Southern Nevada Water Authority Exhibit 236, Protest Hearing for Application Numbers 53987 through 53992, February 4, 2008.
SNWA. 2009. Hydrologic data analysis report for test well 184W105 in Spring Valley, Hydrographic Area 184. Southern Nevada Water Authority, Las Vegas, Nevada, Doc. No. DAR‐ED‐0002. August 2009.
SNWA. 2011. Warm Springs Natural Area Stewardship Plan. June 2011. 77 pages.
Tetra Tech, 2012a. Development of a numerical groundwater flow model of selected basins within the Colorado Regional Groundwater Flow System, Southeastern Nevada. Prepared for NPS, USFWS, and BLM. Prepared by Tetra Tech Inc., Louisville, CO.
Tetra Tech, 2012b. Predictions of the effects of groundwater pumping in the Colorado Regional Groundwater Flow System, Southeastern Nevada. Prepared for NPS, USFWS, and BLM. Prepared by Tetra Tech Inc., Louisville, CO.

| 89 P a g e
Tetra Tech, 2013. Comparison of simulated and observed effects of pumping from MX‐5 using data collected to the end of the Order 1169 Test, and prediction of the rates of recovery from the test. Prepared for NPS, USFWS, and BLM. Prepared by Tetra Tech Inc., Louisville, CO.
Thomas, J.M., A.H. Welch, and M.D. Dettinger. 1996. Geochemistry and isotope hydrology of representative aquifers in the Great Basin of Nevada, Utah, and adjacent states. USGS Professional Paper 1409‐C.
U.S. Fish and Wildlife Service (USFWS). 1967. Endangered species. Federal Register 32:4001.
USFWS. 2009. Desert National Wildlife Refuge Complex, Ash Meadows, Desert, Moapa Valley, and Pahranagat National Wildlife Refuges, Final Comprehensive Conservation Plan and Environmental Impact Statement. August 2009.
USFWS. 2013. Unpublished data for Moapa dace counts (1994 to 2013), summarized by USFWS and the Muddy River Biological Advisory Committee. USFWS Southern Nevada Field Office, Las Vegas, NV.
U.S. Geological Survey (USGS). 2013. Nevada Water Science Center, Aquifer Test Web site. Online: http://nevada.usgs.gov/water/AquiferTests/index.htm. (Accessed on May 14, 2013).
Williams, B.K., J.D. Nichols, M.J. Conroy. 2002. Analysis and management of animal populations. Academic Press, San Diego, CA. 817 pages.
Williams, J.E., C.A. Macdonald, C.D. Williams, H. Weeks, G. Lampman, and D.W. Sada. 2005. Prospects for recovering endemic fishes pursuant to the U.S. Endangered Species Act. Fisheries 30: 24‐29.