test results management pc software - aflglobal.com · test results management pc software user’s...
TRANSCRIPT

Awww.AFLglobal.com (800) 321-5298 or (603) 528-7780
TRM™ Test Results Management
PC Software
User’s Guide

II
Contents
Section 1: General InformationIntroduction............................................................................................2Contacting NOYES Customer Service ......................................................2System Requirements ..............................................................................3Installing TRM ........................................................................................3Starting TRM ..........................................................................................5
Section 2: TRM ApplicationsHome Screen Features ............................................................................6TRM Applications Summary ....................................................................7
Section 3: Results ExplorerResults Explorer Screen Features .............................................................8
Section 4: OTDR Trace Viewer ApplicationOpening Test Results with OTDR Trace Viewer ........................................11Overview of Trace Viewer Interface .........................................................12Menu Bar ...............................................................................................15
File Menu ...........................................................................................15To Restore Data ............................................................................17
Edit Menu ..........................................................................................18Edit File Info Dialog Box ................................................................18Preferences Dialog Box ..................................................................19
© 2009-12, AFL, all rights reserved. TRM0-00-1ENG Revision B, 2012-02-01 Specifications are subject to change without notice.

III
Contents
Tools Menu ........................................................................................20OTDR Trace Viewer: Events Menu .......................................................21View Menu ........................................................................................23Help Menu .........................................................................................23
About TRM screen .........................................................................24Toolbar ...................................................................................................25Trace Graph Window ..............................................................................27Event Table Window ...............................................................................29
Section 5: Working with OTDR Trace FilesConverting Test Data to the preferred Job/Route/Cable structure ............31Opening Trace Files .................................................................................35
Single-Wavelength or Multi-Wavelength ............................................35To Select a Single-Wavelength Trace Option .......................................35To Select a Multi-Wavelength Trace Option ........................................35To Open a Trace .................................................................................37Opening Previous or Next Traces ........................................................40
Comparing Traces with a Baseline Trace ..................................................40Closing Files with Changes .....................................................................41Moving Cursors and Zooming .................................................................42
Selecting the Active Cursor ................................................................42Moving the Active Cursor ...................................................................42Zoom In and Out of a Trace ................................................................43

IV
Contents
OTDR Trace Events .................................................................................44Adding Auto Events ..........................................................................44Manual Events ...................................................................................45
Selecting Loss Method ...................................................................45Positioning Cursors Correctly ........................................................46Two Point Loss Method ..................................................................46Single Event Loss Method ..............................................................47Multiple Event Loss Method ...........................................................48Fiber Attenuation Loss Method ......................................................49Start Loss Method (No Launch Cable) ............................................50End Loss Method (No Receive Cable) .............................................51
Adjusting LSA Lines............................................................................52Adding Manual Events ......................................................................53Editing Event Comments ....................................................................54Deleting Events ..................................................................................55Restoring a Deleted Event ..................................................................55Set/Adjust Pass/Fail Thresholds ..........................................................55
Thresholds Allowed Limits..............................................................56Editing Information of a Single Trace .......................................................57Printing a Single Report ..........................................................................58

V
Contents
Section 6: OTDR Trace Batch Editor ApplicationTrace Batch Editor Screen Features .........................................................59Menu Bar ...............................................................................................61
File Menu ...........................................................................................61Edit Menu ..........................................................................................62Tools Menu ........................................................................................63Help Menu .........................................................................................63
About TRM screen .........................................................................64Toolbar ...................................................................................................65Auto Events Editor ..................................................................................66Adjust Pass/Fail Editor ............................................................................68
Thresholds Allowed Limits ..................................................................70Cursor Editor ..........................................................................................71Trace Information Editor..........................................................................72Batch Editing OTDR Traces ......................................................................73
Section 7: OLTS Viewer/Editor ApplicationOpening Test Results with OLTS Viewer/Editor ........................................76OLTS Viewer/Editor Screen Features ........................................................77
Menu Bar ...........................................................................................82File Menu.......................................................................................82To Restore Data ............................................................................83

VI
Contents
Edit Menu ......................................................................................84Edit Fiber Under Test ......................................................................84Edit or Create New User Rules........................................................85Edit Preferences ............................................................................86Tools Menu ....................................................................................87
Help Menu .........................................................................................87About TRM screen .........................................................................88
Toolbar ...................................................................................................89
Section 8: Viewing OPM Results with OPM Viewer/EditorOpening Test Results with OPM Viewer/Editor ........................................90OPM Editor Screen Features ....................................................................91
Menu Bar ...........................................................................................95File Menu.......................................................................................95To Restore Data ............................................................................96Edit Preferences ............................................................................97Tools Menu ....................................................................................98
Help Menu .........................................................................................98About TRM screen .........................................................................99
Toolbar ..............................................................................................100Working with OPM Results .....................................................................101
Reorganizing OPM Results into Bi-directional Data .............................101Reorganizing Test Data into Multiple Cables .......................................106

VII
Contents
Combining Test Data from Two Sources into one Cable ......................112Viewing OPM Results in the OLTS Viewer/Editor .....................................114
To Select Standards and Applications .................................................114
Section 9: Report Wizard and Last Report ApplicationsReport Wizard ........................................................................................116Last Report Application ..........................................................................116Report Generation with DFS (fiber end-face) Images ...............................117
Section 10: Transferring Files to a PCFrom USB Flash Drive to PC ....................................................................121From Test Equipment via USB Function Port to PC ...................................121
C-Series, M-Series, OPM-Series...........................................................121OFL280 FlexTester ..............................................................................122OFL2GO: Transferring OFL250 or OFL280 (non-FlexTester) test data ...123
From Test Equipment via Serial Port to PC ...............................................125OLTS5 Test Set ...................................................................................125TurboTest 400 Test Set .......................................................................127TurboTest T500B Test Set ...................................................................129

2
Section 1: General Information
IntroductionTRM is a Windows®-based application designed to view, analyze, edit, and print test results saved with NOYES test equipment.
Note: TRM is not licensed software; you are free to copy it as needed. Please check our web site at www.AFLglobal.com > Resources > Software for software updates and additional application information.
This User’s guide contains detailed information about TRM tools and commands and assumes you have a working knowledge of your computer and standard Windows menus and commands. For help with any of these techniques, please see your Microsoft Windows documentation.
If you have any questions about your test equipment from NOYES and TRM software, or if you need technical or sales support, please contact NOYES Customer Service.
Contacting NOYES Customer ServiceYou may contact NOYES Customer Service between 8 a.m. and 5 p.m., United States Eastern Time, as follows:
Phone: 800-321-5298(NorthAmerica)•603-528-7780
Fax: 603-528-2025
Web: www.AFLglobal.com
E-mail: [email protected]

3
System RequirementsTo use TRM application, you need the following hardware and software:
• A PC with a 1GHz (or faster) processor and an 800 x 600 (or larger) display
• A CD or DVD drive if installing from CD
• At least 1 GB of RAM
• A Windows compatible pointing device (mouse, trackball, etc.)
• MS Windows XP, SP3, Vista (32-bit and 64-bit), Windows 7 (32-bit and 64-bit)
Installing TRMYou can install TRM from the supplied CD-ROM, or you can download it from our web site at www.AFLglobal.com > Resources > Software
Follow the steps below to install the TRM software.
To install from the application CD-ROM:
1. Start Windows. If Windows is running, quit all applications.
2. Insert the TRM CD into the CD-ROM drive. (Note: normally the D: drive.)
3. The Installer will display the [Welcome] screen.
If the Installer does not start automatically, from Windows do one of the following:
• Click on the [Start] button and select the [Run] command from the pop-up menu.
• The [Run] dialog box appears. On the [Open] command line, type [D:\setup.exe].
• Click on the [OK] button to start.

4
OR
• Double-click the My Computer icon on the desktop to open the My computer folder.
• Double-click the CD-ROM icon.
• Double-click [Setup] or [Setup.exe]
4. When the Installer [Welcome] screen is displayed, click on the [Next] button to continue.
5. Follow the on-screen instructions.
6. When the Installer displays the [Complete] screen, click on the [Finish] button.
To download from the web:
1. From the www.AFLglobal.com web site, select the following:
www.AFLglobal.com > Resources > Software > TRM Software > click on the download link.
2. Follow the on-screen instructions. The software will download to your computer’s hard drive.
3. Once downloaded, double-click on the [TRM] or [TRM.exe] file.
4. When the Installer [Welcome] screen is displayed, click on the [Next] button to continue.
5. Follow the on-screen instructions.
6. When the Installer displays the [Complete] screen, click on the [Finish] button.

5
Starting TRMFollow the steps below to start the TRM application:
1. In Windows, click on the [Start] button.
2. From the [Start] pop-up menu, select the [All Programs] menu.
3. Locate the NOYES Test and Inspection folder.
4. Click on the TRM shortcut
If you have installed the TRM application in a folder other than NOYES Test and Inspection, choose that folder from the Start > Programs menu.

6
Section 2: TRM Applications
Home Screen Features
Click to open Results Explorer
Click to open Report Wizard
Click to open OTDR Trace Viewer
Click to open OTDR Trace Batch Editor
Click to open OLTS Viewer/Editor
Click to open Last Report
Menu bar - Displays the available drop down menus
7
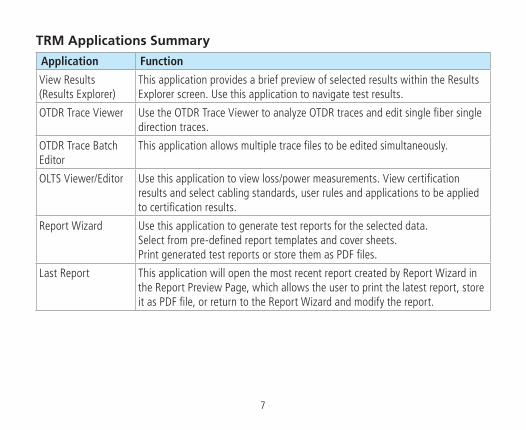
TRM Applications Summary
Application Function
View Results (Results Explorer)
This application provides a brief preview of selected results within the Results Explorer screen. Use this application to navigate test results.
OTDR Trace Viewer Use the OTDR Trace Viewer to analyze OTDR traces and edit single fiber single direction traces.
OTDR Trace Batch Editor
This application allows multiple trace files to be edited simultaneously.
OLTS Viewer/Editor Use this application to view loss/power measurements. View certification results and select cabling standards, user rules and applications to be applied to certification results.
Report Wizard Use this application to generate test reports for the selected data. Select from pre-defined report templates and cover sheets. Print generated test reports or store them as PDF files.
Last Report This application will open the most recent report created by Report Wizard in the Report Preview Page, which allows the user to print the latest report, store it as PDF file, or return to the Report Wizard and modify the report.

8
Section 3: Results Explorer
Results Explorer Screen Features
The Results Explorer is accessed from the Home screen by clicking the View Results icon -
1
2
3
6
5
7
4

9
The Results Explorer application provides a brief preview of results within Results Explorer screen. Use this application to navigate test results, switch between OTDR and OLTS test viewers (when applicable), and access the Report Wizard as needed.
The table below gives a summary of the results Explorer features.
# Feature Description
1 File navigator Displays folders and files hierarchy. Use to navigate saved test results.
2 Selected file info Displays the path of the selected folder/file/test result.
3 Results window Depending on the selected data on the “File Tree”, the Results window will display various information as follows:• Path of the currently selected folder• Summary of the selected Job/Route/Cable/Fiber• Test result preview: OTDR thumbnail, OPM result, Certification result
4 Zoom buttons Click to zoom in, zoom out, and reset pages back to their default value.
5 Soft key button:[Edit] or [Open Viewer]
The current function of this key depends on the selection in the file tree and the type of results in the cable (indicated by a label on the button as follows): Selection: Job/Route/Cable file Selection: Test Result file

10
# Feature Description
6 [Create Report] button
Click on this button to access the Report Wizard, which enables generation of test reports and selection of pre-defined report templates and cover sheets.
7 [Cancel] button Click on this button to return to the Home screen.
6
7

11
Section 4: OTDR Trace Viewer Application
Opening Test Results with OTDR Trace ViewerThis application may be accessed in several ways:
• from the Home screen by clicking on the OTDR Trace Viewer icon -
• from the Results Explorer by selecting a fiber and with a fiber selected, displaying the Open Viewer submenu and selecting a Trace Viewer for the desired test direction available
• from the Results Explorer by selecting a fiber and with a fiber selected double-clicking on a trace icon
Use the OTDR Trace Viewer to analyze OTDR traces and edit single fiber single direction results.

12
Ref Feature Description1 Menu bar Displays the available drop down menus.
2 Toolbar Contains several icons for quick access to menu commands.Click on an icon to execute the associated command.
3 Applications tabs Click on a tab to display the corresponding application window.
4 Results button “On mouse over” the [Results] button A , the Results window is displayed and “on mouse out” the Results window is auto hidden.Note: the [Results] button A looks like a heading B and the Auto Hide
icon C looks like unless “auto hide” function is enabled by clicking the Auto Hide icon C
Overview of Trace Viewer InterfacePartial views
2
A
B C
1
3
4

13
Ref Feature Description5 Results window The Results window displays folders and files hierarchy and is used to
navigate saved test results.
To disable/enable the “auto hide” function, click the Auto Hide icon /
located in the right top corner of the Results window C .6 Cables Info
windowContains informative fields: Job/Route/Cable name.
7 Zoom window Shows the current trace view relative to the entire trace.
8 Cursors data This field displays the following information: A and B cursor locations, distance from A to B, selected loss method, and (depending on the selected loss method) insertion loss, reflectance, or fiber attenuation.
Trace Viewer Screen Features (continued)Partial views
C5
8
6
7

14
Ref Feature Description9 Trace graph
windowShows a graph of the currently selected trace. Up to six traces can be displayed in the Trace graph window.
10 Event Table window
Displays saved events in a table format.
11 Trace Info/Text Info/Unit Info field
This field displays OTDR setup parameters or Text data or Test equipment data when the associated tab [Trace Info]/[Text Info]/[Unit Info] is selected.
12 [Edit Trace Info] button
Click on this button to display the Edit Trace Information window, which allows editing of the Trace and Text info for the selected trace file.
Trace Viewer Screen Features (continued)
9
10
11
12
Vertical/Horizontal split bars - allow resizing of the [Trace graph], [Event table], and [Results Info] window vertically and/or horizontally

15
Menu Bar
The Menu Bar contains several drop down menus as follows:
Each menu contains various commands. When a menu is selected, it displays a list of commands indicating functions that can be performed on selected files.
File Menu
Table below gives a summary of the available File Menu commands and their associated functions.
Command Use to perform the following Function
Open... Access the Results Explorer. Depending on the user preference setting (Edit >Preferences > Single-Wavelength or Multi-Wavelength), open a single trace file or a multiple trace file.
Open as Baseline...
Access the Results Explorer. Depending on the on the user preference setting (Single-Wavelength or Multi-Wavelength), open a single trace/multiple trace file as a baseline.Note: a baseline trace is a trace graph that is used as a point of reference for comparison.
Save Save a trace file that already exists with its original name.
Save As... Save an existing trace file under a new name and preserve the original file.

16
Command Use to perform the following Function
Convert Convert M200 v1.0.x files into v2.0.x file format
Print Trace Access the TRM Report Wizard.Preview an OTDR Trace before printing.Print the currently displayed trace in one of three layouts: With Overlay, Single, Side by Side.
Close Depending on the selected option for closing files, close selected files after automatically saving changes, or prompt the user to confirm saving.
Close All Close all open trace & baseline files.
Import Data... Download test data from an instrument.
OFL2Go... Open a utility program that copies data from an OFL250 or OFL280 (non-FlexTester) to a destination chosen by the user.
Export Job to File... Export the selected Job to a zip file.
Backup Data... To have a restoration point, create a non-visible backup copy of your data before editing: - navigate the desired Job /Route/Cable - click OK to display the [Backup Description] window - add a clear comment on backed up data to be able to identify it during restoration
Restore Data... Restore previously backed up data to a visible folder. Use comments to identify data for restoration.
Exit Close opened trace files and exit TRM.

17
To Restore Data
1. Click on individual Backups A to review comments B saved during the {Backup Data] process.
2. Using comments, identify and select data for restoration A .
3. Or select the “Restore Entire Archive” option C .
4. Click OK.
5. In the displayed File Navigator window, select the desired location.
6. Click OK to save the restored data.
A
C B

18
Edit Menu
The Edit menu allows the user to edit File information and set up Preferences.
These are the text editable fields, which allow the user to edit Cable Type, Operators ID, or Company name and add Trace Comments
These text fields allow the user to view test settings and edit some test parameters (Date, GIR, Backscatter Coefficient, and Reflectance Threshold). Changing GIR or Backscatter Coefficient will cause recalculation of the Event Table and fiber length.
Edit File Info Dialog Box

19
Preferences Dialog Box
Use the Preferences menu to select the appearance of traces and how they are opened/closed/saved.
Options to open and close files
Available distance units
Options to save changed files
Color options to display traces
Click to reset all settings to the factory default values
Advanced visual settings on/off
Number of recently open files to be displayed under [File] menu (allowed 1 to 99 files)
Options to display gridlines in Trace Window

20
Tools Menu
This menu provides access to the Home screen menus.
Command Function
View Results Opens the Results Explorer screen
Report Wizard Opens the Report Wizard screen
OTDR Trace Viewer Opens the OTDR Trace Viewer screen
OLTS Viewer/Editor Opens the OLTS Viewer/Editor screen
OTDR Trace Batch Editor Opens the OTDR Trace Batch Editor screen
Last Report Open the most recent report created by Report Wizard in the Report Preview Page.

21
OTDR Trace Viewer: Events Menu
The Events drop down menu contains all the commands you will need to select loss methods, add new events, and review or delete saved events.

22
The table below gives a summary of the available Events menu commands and associated functions.
Command Use to perform the following Function
Add Event... Add an event using the selected Loss Method at the active cursor location (not available for the Two Point or Fiber Attenuation methods).
Loss Method Select the desired Loss Measurement Method.
Current Event:
•Edit Comment
•Delete
Open a dialog box for adding and/or editing comments for the current event.
Delete the current event.
Next Event Display the next event: moves the active cursor to the next event and highlight this event in the event table.
Previous Event Display the previous event: moves the active cursor to the previous event and highlight this event in the event table.
Delete All Events Delete all saved events in the selected trace, event table.
Restore Event Restore the last event that was deleted.
Auto Events... Generate an event table.
Set/Adjust Pass/Fail Thresholds...
Edit Pass/Fail event and link Thresholds and recalculate events data.
Restore LSA Defaults Restore LSA line lengths to the default values.

23
View Menu
The View drop down menu allows the user to see selections that affect the view of the OTDR trace. Also, the View menu displays the available keyboard shortcuts.
Help Menu
This menu provides access to:
• TRM software user’s guide
• Various test equipment user’s guides
• AFL web site
• NOYES Test and Inspection web site
• Software updates section on the AFL web
• [About TRM...] screen.

24
About TRM screen
[About TRM...] screen displays TRM version number and allows to see included Modules/Versions.
Click to display the
Details screen A
A

25
ToolbarSeveral of the most commonly used commands can be accessed from the Toolbar. Click on a toolbar icon to execute the associated command.
Access the Results Explorer and navigate the desired test results
Save a trace file that already exists with its original name
Open the Report Wizard
Open the most recent report created by Report Wizard with options to save it as PDF, enlarge, or print
Open the previous file in the current folder
Open the next file in the current folder
Zoom in horizontally around the active cursor
Zoom out horizontally around the active cursor
Zoom in vertically from the trace level at the active cursor
Zoom out vertically from the trace level at the active cursor

26
Display the trace view at 100%
Zoom to the previous zoom level around the active cursor
Select the previous event
Select the next event
Switch the active cursor
27
Trace Graph Window
[B] label indicates a Baseline trace1
2
3
7
9
4
5
6
8
28
The Trace graph window displays OTDR test results in a graph format. Up to six traces can be displayed. The major features of the Trace graph window are explained below.
Ref Feature Description
1 Trace tabDisplays the name and color of the open trace. If several traces are open, click on a trace tab to display the associated trace graph.
2 Vertical axis Shows insertion loss in dB.
3Horizontal axis
Shows distance in user-selected units (km, m, mi, kf, ft).
4 Trace This is a graph of insertion loss vs. distance.
5Cursors A and B
Used to measure insertion loss, power level, reflectance, attenuation, and distance. To make a cursor active, click on the cursor line or label, or click on the Toolbar Cursor icon to toggle between A and B cursors.To move the active cursor, position the mouse pointer on a cursor, then click-and-drag along the trace graph. Also, you may use the Left and Right keyboard arrow keys.
6 Cursor labelTo move the active cursor, position the mouse pointer on a cursor or a cursor label, then click-and-drag along the trace graph.
7 Event mark Indicates the location and the number of a saved event. Events are listed in numerical order.
8 LSA linesAvailable for certain loss measurement methods. Used for calculating insertion loss, trace level, and attenuation.
9LSA line boundaries
Near and Far LSA line boundaries for each LSA line segment. Used to control length and position (relative to trace segment) of LSA line.

29
Event Table WindowThe [Event table] window allows the user to view test data associated with the trace displayed in the [Trace graph] window. If several traces are open, click the desired trace [Tab] located on top of the [Trace graph] window to display the [Event table] of the desired trace. Using the [Events] menu, the user may add or delete trace events and edit comments.
Features of the [Event table] window are explained below.
Ref Feature Description
1 Summary data row
This row contains the summary data of the displayed trace: number of saved events, link loss, link ORL, and link length.
1
2
3 7 94 5 6 8 10 11

30
Ref Feature Description
2 Event type icon Indicates the event type graphically.
3 Event number Displays the number of the saved event in numerical/position order.
4 Atten. (dB/km)
The dB/km measurement is a slope of the fiber leading to the event Note: When the length of the fiber being measured is insufficient, the dB/km measurement is displayed followed by an asterisk [*] symbol. An asterisk [*] symbol indicates, “Section is too short to ensure an accurate fiber attenuation (dB/ km) measurement.” The required minimum distance is wavelength dependent on wavelength: 1625 nm = 3 km, 1550 nm = 5 km, 1310 nm = 3 km, 1300 nm = 2 km, and 850 nm = 0.3 km.
5 Loss (dB) Shows Insertion loss in (dB) of the fiber segment before the event.
6 Source This column indicates how the event is added:•manual-addedbyoperator•auto-eventtableisgeneratedbyOTDRsoftware
7 Pass/FailIndicates Pass - or Fail - result for event (Reflectance or Loss)
8 Type This column indicates the event type.
9 Location Indicates Distance from the OTDR (or end of launch cable) to the event.
10 Refl. (dB) Displays Reflectance in (dB) for each reflective event. Green highlight indicates Passing, Pink highlight indicates Failing.
11 Loss (dB) Displays Insertion loss in (dB) for each event. Green highlight indicates Passing, Pink highlight indicates Failing.

31
Section 5: Working with OTDR Trace FilesConverting Test Data to the preferred Job/Route/Cable structureThe TRM Convert function can be used for M200 test data (User Interface v1.x.x), OFL250 and OFL280 (non-FlexTester) test data to convert from a simple folder to the preferred Job/Route/Cable structure. To convert files, perform the following:
1. Make a backup copy of the files to be worked on.
2. Use the copy and save the original data in a safe place.
A
Note that file 001 is highlighted in the Results tree, this file has been selected for viewing and conversion
Results Tree

32
3. In the Results tree select (highlight) the desired M200 v1.0.x file A for viewing and conversion.
4. From the [File] pull down menu B select [Convert] C .
B
C
33
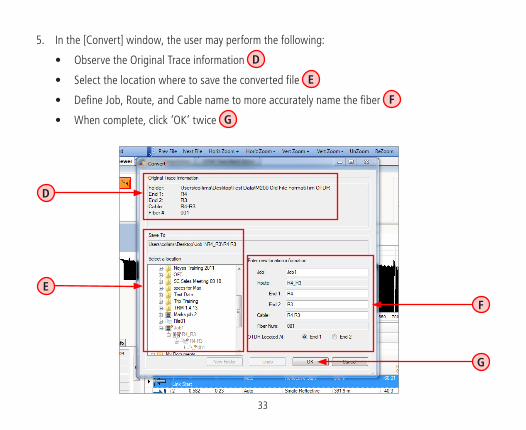
5. In the [Convert] window, the user may perform the following:
• Observe the Original Trace information D
• Select the location where to save the converted file E
• Define Job, Route, and Cable name to more accurately name the fiber F
• When complete, click ‘OK’ twice G
D
E
F
G

34
Note: Conversion will convert wavelength pairs of fibers MM 850/1300 nm SM 1310/1550 nm
6. The saved trace will appear in the new User Interface file format H .
H
35
Opening Trace Files
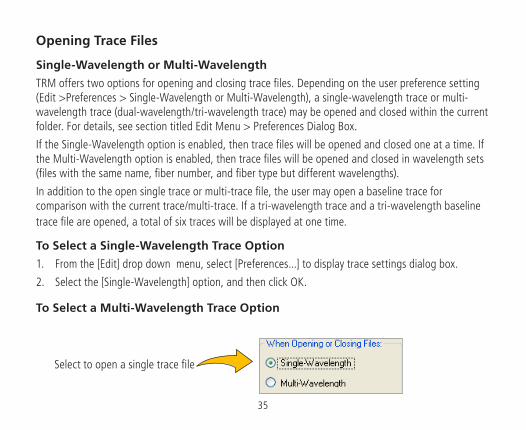
Single-Wavelength or Multi-Wavelength
TRM offers two options for opening and closing trace files. Depending on the user preference setting (Edit >Preferences > Single-Wavelength or Multi-Wavelength), a single-wavelength trace or multi-wavelength trace (dual-wavelength/tri-wavelength trace) may be opened and closed within the current folder. For details, see section titled Edit Menu > Preferences Dialog Box.
If the Single-Wavelength option is enabled, then trace files will be opened and closed one at a time. If the Multi-Wavelength option is enabled, then trace files will be opened and closed in wavelength sets (files with the same name, fiber number, and fiber type but different wavelengths).
In addition to the open single trace or multi-trace file, the user may open a baseline trace for comparison with the current trace/multi-trace. If a tri-wavelength trace and a tri-wavelength baseline trace file are opened, a total of six traces will be displayed at one time.
To Select a Single-Wavelength Trace Option
1. From the [Edit] drop down menu, select [Preferences...] to display trace settings dialog box.
2. Select the [Single-Wavelength] option, and then click OK.
To Select a Multi-Wavelength Trace Option
Select to open a single trace file

36
1. From the [View] drop down menu, select the [Options] command to display the [Preferences...] dialog box.
2. Select the [Multi-Wavelength] option, and then click OK.
Select to open trace files in wavelength sets

37
To Open a Trace
1. From the [File] drop down menu, select the [Open...] command or click the [Open] icon on the Toolbar to display the [Results Explorer ] window.
2. From the displayed list, navigate to the desired fiber.
3. To display test results, perform one of the following
Case I
The selected fiber contains two-direction test results and dB or AT results.
or
If you select on a fiber number, you will see the button labeled [Open Viewer] with three options.
Click on the [Trace Viewer A–>Z] or [Trace Viewer Z–>A] button to open the selected test result.

38
If you select on a trace icon,
you will see the button labeled [Trace Viewer A–>Z] or [Trace Viewer Z–>A]. Click on this button to open the selected test result.
Case II
The selected fiber contains test results in only one direction and dB or AT results.
or
If you select on a fiber number, you will see the button labeled [Open Viewer] with two options.
Click on the [Trace Viewer] button to open the selected test result.
If you select on a trace icon,

39
you will see the button labeled [Trace Viewer A–>Z]. Click on this button to open the selected test result.
Case III
The selected fiber contains test results in only one direction.
If you select the desired trace, you will see the button labeled [Trace Editor] or [Open Trace].
Click on this button to open the selected trace.
40
Opening Previous or Next Traces
After you open a single trace file or multiple trace file, you may use the [Prev File] and [Next File] commands to display the previous or next trace file or multiple trace file of the same fiber type (MM or SM) in the current folder:
• Click the [Next File] or [Prev File] icon on the Toolbar.
Comparing Traces with a Baseline TraceTRM allows you to open a baseline trace or trace set for comparison to another trace or trace set. If a tri-wavelength trace and a tri-wavelength baseline trace file are opened, a total of six traces will be displayed at one time.
1. From the [File] drop down menu, select the [Open as Baseline...] command to display the [Results Explorer ] window.
2. From the displayed list, navigate and open the desired trace (see Section “Opening Trace Files” for details).
3. From the [File] drop down menu, select the [Open...] command or click the [Open] icon on the Toolbar to display the [Results Explorer ] window.
4. From the displayed list, navigate and open the desired trace (see Section “Opening Trace Files” for details).

41
Closing Files with ChangesEdit > References menu offers two options for closing trace files with changes:
[Save Automatically] or [Ask “Would you like to save changes?”]
[Save Automatically] option [Ask “Would you like to save changes?”] option
If a trace file has been edited and not saved, it will be saved automatically before closing.
Note: [Save Automatically] will overwrite an existing file.
If a trace file has been edited and not saved, a dialog box will appear prompting you to save changes before closing.
To specify how trace files will be closed:
1. From the [Edit] drop down menu, select the [Preferences...] command to display the [Preferences] dialog box.
2. Select the desired option, then click OK.

42
Moving Cursors and ZoomingThe [A] and [B] cursors may be positioned to measure the insertion loss, power level (if applicable), reflectance (if applicable), attenuation (if applicable), and distance between any two points on a trace.
To make cursor positioning easier, TRM provides tools and commands for viewing different parts of a trace graph at various magnifications. [Zoom +] and [Zoom -] commands let you magnify or reduce the display of any area in the [Trace graph] window.
TRM zooms horizontally around the active cursor and vertically from the trace level at the active cursor.
Selecting the Active Cursor
To make a cursor active, do one of the following:
• In the [Trace graph] window, click on the desired cursor line or label.
• From the Toolbar, click on the [Switch Cursor] button to toggle between cursors.
Once the active cursor is selected, it can be moved along the trace graph.
Moving the Active Cursor
To move the active cursor, do one of the following:
• Position the mouse pointer on a cursor line or cursor label, then click-and-drag along the trace graph.
• Use the [Left] and [Right] keyboard arrow keys
Note: The A cursor cannot be moved beyond the B cursor location, and vice versa.
• Click on an event in the event table, the active cursor will jump to that event on the trace graph.

43
Zoom In and Out of a Trace
To magnify or reduce the trace display, use the Toolbar Zoom Buttons as follows:
or Zoom In or Zoom Out horizontally around the active cursor.
or Zoom In or Zoom Out vertically from the trace level at the active cursor.
Note: Each click magnifies the view to the next preset percentage until the limit of magnification is reached.
UnZoom and ReZoom the Trace Display
In the zoomed view, TRM always displays the active cursor area. The [UnZoom] and [ReZoom] commands allow you to display different areas of a trace graph at the same level of magnification. If you need to view a different point of the trace, move the active cursor, UnZoom and then ReZoom. TRM will display the new position of the active cursor at the previous zoom level.
Perform the following steps:
1. In the [Trace graph] window, use the [Zoom +] and [Zoom -] commands to set the desired level of magnification.
2. Click on the [UnZoom] button to display the trace view at 100%.
3. Relocate the active cursor as needed.
4. Click on the [ReZoom] button to display the new cursor location at the previous zoom level.
Note: When you toggle between [A] and [B] cursors in the magnified view, the view changes to display area around the selected cursor at the same magnification level.

44
OTDR Trace Events
Adding Auto EventsUse the [Auto Events...] command to generate an event table.
Ref Feature Description1 Trace Properties
windowContains informative fields. File name, Wavelength, Pulse Width, GIR - Group Index of Refraction and Backscatter Coefficient
2 Event Thresholds Contains informative fields: Event Loss, Event Reflectance, Event End
3 Launch Cable drop down menu
Displays the available Launch Cable options as follows: None, NOYES 150m, NOYES 500m, NOYES 1km, User
4 Receive Cable drop down menu
Displays the available Receive Cable options as follows: None, NOYES 150m, NOYES 500m, NOYES 1km, User
5 Defaults check box
Select this box to restore default settings for the Trace Editable Properties and Event Thresholds
• Review informative fields
• Edit Launch or Receive Cables as needed
• Click OK
1 1 1
2
4
5
3

45
Manual Events
Selecting Loss Method
For analyzing traces and adding events, TRM offers various Loss methods. The following table gives a summary of the available methods.
Loss Method Applications Measured parameters # of cursors
# of LSA lines*
Two Point General purpose Insertion loss between any 2 points of a trace
2 0
Single Event Used to analyze connections, splices, faults, etc.
Location, Reflectance, Insertion loss of any Reflective or Non-Reflective event
1 2
Multiple Event Used if two or more events are too close to use other methods
Location and combined Insertion loss of multiple events
2 2
Fiber Attenuation
Used to measure dB/km of fiber between events
Attenuation per km ratio of any segment of a trace with no events
1 0
Start Used to set start of fiber level
Starting location and level of a trace
1 1
End Used to set end of fiber level. Location, Reflectance, and Trace level of the fiber end
1 1

46
* LSA Line - least squared approximation segment line. Used to reduce the effects of noise and dead zone while calculating insertion loss, trace level, and attenuation.
To select the desired Loss method perform the following:
1. From the Menu bar, choose the [Events] drop down menu.
2. Choose the [Loss Method] command to display a list of the available options.
3. Select the desired Loss method.
Positioning Cursors Correctly
Depending on the selected Loss Method, you will need to position cursors and adjust LSA lines (if applicable) properly. The following graphs illustrate position of cursors and LSA lines for the available Loss methods.
Two Point Loss Method
1. Position the left cursor at the start of the event.
2. Position the right cursor beyond the event where the trace returns to a constant slope.
3. Read the insertion loss measurement displayed in the [Cursor data] window.
Right cursorLeft cursor

47
Single Event Loss Method
Position a cursor at the start of the event.
1. If required, adjust the right LSA line so the Near Right boundary is located beyond the event where the trace returns to a constant slope.
2. Read the insertion loss measurement displayed in the [Cursor data] window. or
3. From the [Events] drop down menu, choose the [Add Event...] command to add event manually.
Left LSA line Right LSA line
Cursor
Near Right boundary

48
Multiple Event Loss Method
1. Position the left cursor at the start of the first event.
2. Position the right cursor at the start of the last event.
3. If required, adjust the right LSA line so the Near Right boundary is located beyond the event where the trace returns to a constant slope.
4. Read the insertion loss measurement displayed in the [Cursor data] window. or
5. From the [Events] drop down menu, choose the [Add Event] command to add event manually.
Near Right boundary
Right cursorLeft cursor
Left LSA line Right LSA line

49
Fiber Attenuation Loss Method
This method is used just for analyzing a trace.
1. Position left and right cursors on the trace as needed.
2. Read the insertion loss (dB/km) measurement displayed in the [Cursor data] window.
Left cursor
Right cursor

50
Start Loss Method (No Launch Cable)
Position the left cursor at the beginning of the trace (0 meters).
1. If required, adjust the right LSA line so the Near Right boundary is located beyond the reflection where the trace returns to a constant slope.
2. Read the trace level measurement displayed in the [Cursor data] window. or
3. From the [Events] drop down menu, choose the [Add Event] command to add event manually.
Cursor at the origin
Near Right boundary
Right LSA line
51
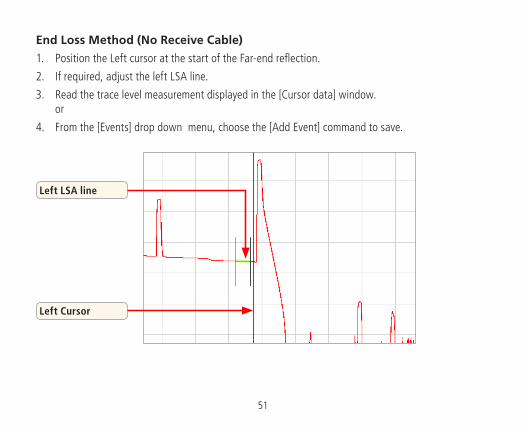
End Loss Method (No Receive Cable)
1. Position the Left cursor at the start of the Far-end reflection.
2. If required, adjust the left LSA line.
3. Read the trace level measurement displayed in the [Cursor data] window. or
4. From the [Events] drop down menu, choose the [Add Event] command to save.
Left LSA line
Left Cursor

52
Adjusting LSA Lines
If events of a trace are located very close to each other, you may have to adjust the LSA Lines. The graphs below illustrate an example of the LSA lines before and after the adjustment.
To adjust LSA lines, position the mouse pointer over an LSA line boundary, then click and drag to the desired location.
Note: if you need to restore the original lengths of the LSA lines, choose the [Restore LSA Defaults] command from the [Events] drop down menu.
LSA Line before the adjustment
LSA boundary line
LSA Line after the adjustment

53
Adding Manual Events
To manually add events, perform the following steps:
1. Select the desired Loss method.
Note: Event type displayed in the Event Table will match the currently selected loss method.
2. Move the active cursor to the event to be added.
3. From the [Events] drop down menu, select the [Add Event...] command.
4. The [Add New Event] dialog box opens displaying the event data that will be added to the [Event table] and allowing you to add a comment.
Comment text field - this is the text field where you add comments if needed.
Event data - this information will be added to the [Event table]
54
5. Type a comment in the Comment text field (maximum 94 characters) if needed.
6. Choose OK to save. TRM automatically adds an event data in the [Event table] window and places an event mark in the [Trace graph] window to indicate the added event.
Editing Event Comments
To edit a comment, do one of the following:
1. In the [Event Table], select the desired event by clicking on it.
• From the [Events] drop down menu, select the [Current Event] > [Edit Comment...] command to display the [Edit Event] dialog box.
• Edit comments as needed.
• Click on the [OK] button to save changes.
or
1. In the [Event Table], select the desired event by clicking on it.
2. Right-click the selected event, to display a submenu.
• From the displayed submenu, select the [Edit Comment...] command to display the [Edit Event] dialog box.
• Edit comments as needed.
• Click on the [OK] button to save changes.

55
Deleting Events
To delete an event, do one of the following:
1. In the [Event table], select the desired event by clicking on it.
• From the [Events] drop down menu, select the [Current Event] > [Delete] or [Delete All Events] command or
2. In the [Event table], select the desired event by clicking on it.
• Right-click the selected event, to display a submenu.
• From the displayed submenu, select the [Delete Event...] command.
Restoring a Deleted Event
From the [Events] drop down menu, select the [Restore Event] command to recover an event that was deleted last.
Note: TRM will only restore the last event deleted. All previously deleted events will not be restored.
Set/Adjust Pass/Fail Thresholds
TRM allows the user to edit Pass/Fail event and link Thresholds and recalculate the events data displayed in the event table.
1. From the [Events] drop down menu, select the [Set/Adjust Pass/Fail Thresholds...] command to open the [Re-calculate Pass/Fail Thresholds] dialog box
2. Edit Event and Link Thresholds to the allowed limits as needed. Click OK.

56
3. TRM will recalculate test results based on the new Thresholds data and display the updated results in the Event table window.
Thresholds Allowed Limits
Threshold Min Value (dB) Default Value (dB)
Max Value (dB)
Event Pass ThresholdsLoss, Reflective Event 0.05 0.75 3.00Loss, Non-reflective Event 0.05 0.30 3.00Reflectance: 1310, 1550 nm -65.0 -35.0 -20.0Reflectance: 850, 1300 nm -45.0 -22.0 -15.0Event Marginal ThresholdsLoss, Reflective Event 0.00 0.00 1.00Reflectance 0.00 -5.00 -10.0Link Pass ThresholdsLoss: 850, 1300, 1310, 1550 nm 0.00 0.00 35.0ORL: 850, 1300, 1310, 1550 nm 20.0 25.0 65.0Link Marginal ThresholdsLoss: 850, 1300, 1310, 1550 nm 0.00 0.00 5.00ORL: 850, 1300, 1310, 1550 nm 0.00 0.00 10.0

57
Editing Information of a Single TraceTRM allows you to edit trace information and certain setup parameters. This is done in the [Edit Trace Information] dialog box.
1. To display the [Edit Trace Information] dialog box, do one of the following:
• From the [Edit] drop down menu, select the [Edit File Info...] command.
• Select the [Trace Info] tab, and then click on the button.
2. In the [Edit Trace Information] dialog box, edit the desired trace parameters as needed.
3. Choose [OK] to save changes.
Note: Changes are wavelength dependent and apply to the trace indicated by the top tab in the graph window.
These are the text editable fields, which allow the user to edit Cable Type, Operators ID, or Company name and add Trace Comments
These text fields allow the user to view test settings and edit some test parameters (Date, GIR, Backscatter Coefficient, and Reflectance Threshold). Changing GIR or Backscatter Coefficient will cause recalculation of the Event Table and fiber length.

58
Printing a Single Report1. From the [File] menu, select the [Print Trace...] > [With Overlay] or [Single] or [Side by Side]
command to access the Report Preview page.
Depending on the selected printing style, TRM allows single or multiple trace view reports as follows:
• [With Overlay] style - prints all traces as a single view with overlay wavelength graph and event table for each wavelength if available.
• [Single] style - prints single trace and event table for each wavelength if available. If a trace file contains multi-wavelength test results, a report for each wavelength will be printed on individual pages.
• [Side by Side] - prints multi-view traces side by side and event tables if available.
2. From the Report Preview page, click on the [Print] button
3. Select the desired printer.
4. Click Print to print a single trace report.

59
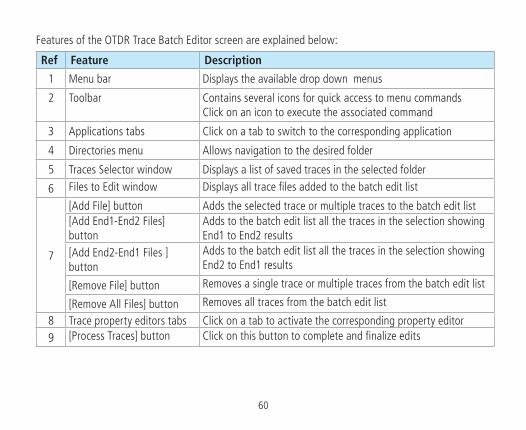
Section 6: OTDR Trace Batch Editor Application
From the Home screen, click on the OTDR Trace Batch Editor icon - to access the OTDR Trace Batch Editor application. This application allows editing all or selected test properties in multiple trace files in the open folder.
Trace Batch Editor Screen Features 1
7
9
64
5
8
32
60
Features of the OTDR Trace Batch Editor screen are explained below:
Ref Feature Description
1 Menu bar Displays the available drop down menus
2 Toolbar Contains several icons for quick access to menu commandsClick on an icon to execute the associated command
3 Applications tabs Click on a tab to switch to the corresponding application
4 Directories menu Allows navigation to the desired folder
5 Traces Selector window Displays a list of saved traces in the selected folder
6 Files to Edit window Displays all trace files added to the batch edit list
7
[Add File] button Adds the selected trace or multiple traces to the batch edit list [Add End1-End2 Files] button
Adds to the batch edit list all the traces in the selection showing End1 to End2 results
[Add End2-End1 Files ]button
Adds to the batch edit list all the traces in the selection showing End2 to End1 results
[Remove File] button Removes a single trace or multiple traces from the batch edit list
[Remove All Files] button Removes all traces from the batch edit list
8 Trace property editors tabs Click on a tab to activate the corresponding property editor9 [Process Traces] button Click on this button to complete and finalize edits

61
Command FunctionOpen... Access the Results Explorer and navigate the desired test resultsImport Data... Download test data from an instrument.OFL2Go... Open a utility program that copies data from an OFL250 or OFL280 (non-
FlexTester) to a destination chosen by the user.Export Job to File... Export the selected Job to a zip file.Backup Data... To have a restoration point, create a non-visible backup copy of your data before
editing:- navigate the desired Job /Route/Cable - click OK to display the [Backup Description] window- add a comment on backed up data to be able to identify it during restoration
Restore Data... Restore previously backed up data to a visible folder. Use comments to identify data for restoration (see page 17 for details).
Exit Close all open files and exit TRM
Menu Bar
The Menu Bar contains several drop down menus as follows:
Each menu contains various commands. When a menu is selected, it displays a list of commands indicating functions that can be performed on selected files.
File Menu
The File drop down menu contains commands for opening and closing traces, and exporting the selected Job to a zip file. The table below gives a summary of the available File Menu commands and their associated functions.
62
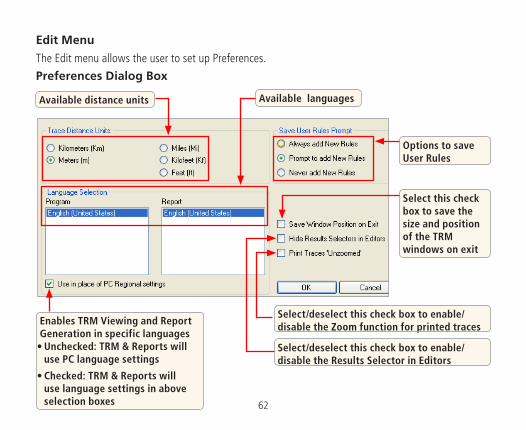
Preferences Dialog Box
Edit Menu
The Edit menu allows the user to set up Preferences.
Available distance units
Options to save User Rules
Available languages
Select this check box to save the size and position of the TRM windows on exit
Select/deselect this check box to enable/disable the Results Selector in Editors
Select/deselect this check box to enable/disable the Zoom function for printed tracesEnables TRM Viewing and Report
Generation in specific languages•Unchecked: TRM & Reports will
use PC language settings
•Checked: TRM & Reports will use language settings in above selection boxes
63
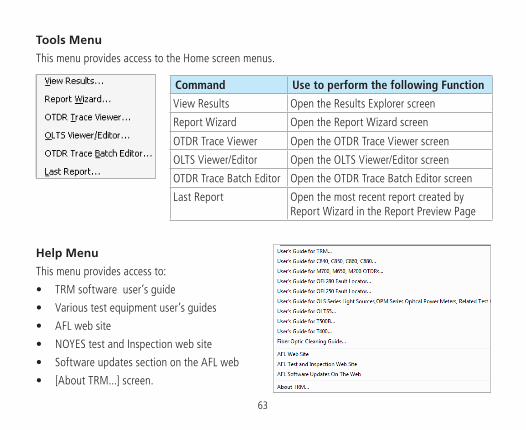
Tools Menu
This menu provides access to the Home screen menus.
Command Use to perform the following Function
View Results Open the Results Explorer screen
Report Wizard Open the Report Wizard screen
OTDR Trace Viewer Open the OTDR Trace Viewer screen
OLTS Viewer/Editor Open the OLTS Viewer/Editor screen
OTDR Trace Batch Editor Open the OTDR Trace Batch Editor screen
Last Report Open the most recent report created by Report Wizard in the Report Preview Page
Help Menu
This menu provides access to:
• TRM software user’s guide
• Various test equipment user’s guides
• AFL web site
• NOYES test and Inspection web site
• Software updates section on the AFL web
• [About TRM...] screen.

64
About TRM screen
[About TRM...] screen displays TRM version number and allows to see included Modules/Versions.
Click to display the
Details screen A
A
65
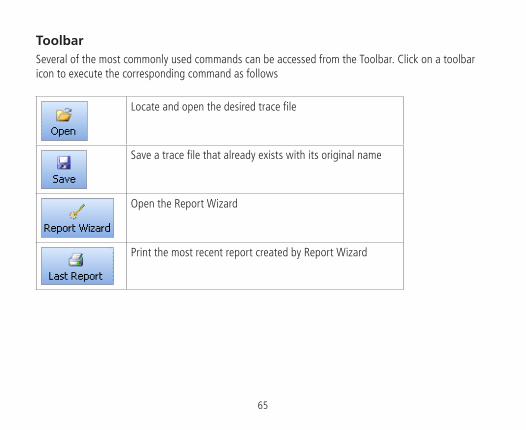
ToolbarSeveral of the most commonly used commands can be accessed from the Toolbar. Click on a toolbar icon to execute the corresponding command as follows
Locate and open the desired trace file
Save a trace file that already exists with its original name
Open the Report Wizard
Print the most recent report created by Report Wizard

66
Auto Events Editor
1
2
3
4
5
6

67
Features of the Auto Events Editor are summarized in the table below.
Ref Feature Description1 Recalculate Auto Events
check boxSelect/deselect this check box to enable/disable the recalculation process.
2 Event Thresholds properties editable fields
The Event Thresholds default values may be edited when the [Defaults] check box is deselected.
3 Informative fields These fields display Backscatter Coefficient [BC] and Group Index of Refraction [GIR].
4 Default Thresholds properties check box
Select/deselect this check box to enable/disable the default values for Event Thresholds.
5 Launch/Receive Cable user-defined fields
This section contains fields where the user may either select one of the predefined launch/receive cable option (None, NOYES 150m/500m/1km) or enter the preferred length (User option).
6 [Process Traces] button Click on this button to start the batch editing process.

68
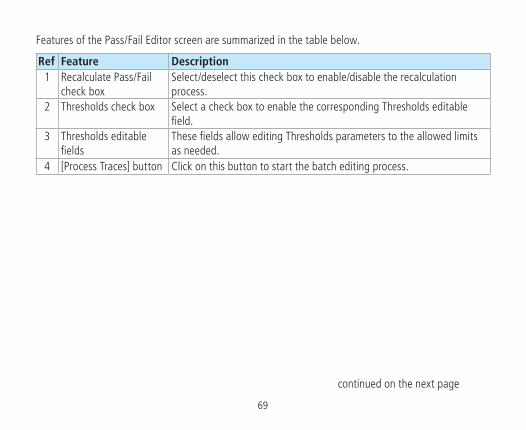
Adjust Pass/Fail EditorThis editor allows the user to edit Pass/Fail event and link Thresholds to the allowed limits as needed.
1
122
2
2
2
4
22
2
23
3
3
33
3
3
3
69
Features of the Pass/Fail Editor screen are summarized in the table below.
Ref Feature Description1 Recalculate Pass/Fail
check boxSelect/deselect this check box to enable/disable the recalculation process.
2 Thresholds check box Select a check box to enable the corresponding Thresholds editable field.
3 Thresholds editable fields
These fields allow editing Thresholds parameters to the allowed limits as needed.
4 [Process Traces] button Click on this button to start the batch editing process.
continued on the next page

70
Thresholds Allowed Limits
Event Threshold Min Value (dB) Default Value (dB) Max Value (dB)
Event Pass Thresholds
Loss, Reflective Event 0.05 0.75 3.00
Loss, Non-reflective Event 0.05 0.30 3.00
Reflectance: 1310, 1550 nm -65.0 -35.0 -20.0
Reflectance: 850, 1300 nm -45.0 -22.0 -15.0
Event Marginal Thresholds
Loss, Reflective Event 0.00 0.00 1.00
Reflectance 0.00 -5.00 -10.0
Link Threshold Min Value (dB) Default Value (dB) Max Value (dB)
Link Pass Thresholds
Loss: 850, 1300, 1310, 1550 nm 0.00 0.00 35.0
ORL: 850, 1300, 1310, 1550 nm 20.0 25.0 65.0
Link Marginal Thresholds
Loss: 850, 1300, 1310, 1550 nm 0.00 0.00 5.00
ORL: 850, 1300, 1310, 1550 nm 0.00 0.00 10.0

71
Features of the Cursor Editor are summarized in the table below.
Ref Feature Description1 Update Cursors check box Select/deselect this check box to enable/disable updates.2 Zoom adjuster Allows changing horizontal/vertical magnification around the active
cursor.3 Cursors data This field displays A and B cursor locations and distance from A to B.4 [Process Traces] button Click on this button to start the batch editing process.
Cursor Editor
Trace graph A & B cursors Click to toggle between A and B cursors
1
2
3
4

72
Trace Information Editor
Features of the Trace Information Editor are summarized in the table below.
Ref Feature Description1 Update Trace Information
check boxSelect/deselect this check box to enable/disable updates.
2 Trace properties check boxes Select a check box to activate the corresponding editable text field.3 Properties editable fields This section contains text fields where the user may enter all
information needed to identify traces4 [Process Traces] button Click on this button to start the batch editing process.
Click to clear all the text fields and check boxes
2
1
3
4

73
Batch Editing OTDR Traces1. Access the OTDR Trace Batch Editor application.
2. Navigate to the desired Job.
3. All trace files in the open folder will be displayed in the [Trace Selector] window.
4. From the displayed list, add the desired traces to the ‘Files to Edit’ list, which will be displayed in the [Files to Edit] window. Use the [Add File], [Add End1 –>End2 Files>>], or [Add End2 –>End1 Files>>] buttons for adding trace files.
To add trace files in the current folder to the batch edit list individually:
• Double-click the desired trace name listed in the [Folders/Files] window. The trace name added to the batch edit list will appear in the [Files to Edit] window.
• Or, click on the desired trace name listed in the [Folders/Files] window, then click on the [Add File] button. The trace name added to the batch edit list will appear in the [Files to Edit] window.
To add a group of traces in the current folder to the batch edit list:
• Click on the first trace to be added to highlight it.
• Hold the Shift key to scroll down to the last trace you wish to add to the batch edit list.
• Click on the [Add File] button. The trace names of the selected files will appear in the [Files to Edit] window.
5. If you need to remove trace files from the batch edit list displayed in the [Files to Edit] window, use the [Remove File] or [Remove All Files] buttons.

74
To remove trace files from the batch edit list individually:
• Double-click the desired trace name displayed in the [Files to Edit] window. The trace name listed in the [Files to Edit] window will be removed.
• Or, click on the desired trace name displayed in the [Files to Edit] window, then click on the [Remove File] button. The trace name listed in the [Files to Edit] window will be removed.
To remove a group of traces from the batch edit list:
• Click on the desired traces to be removed to highlight.
• Click on the [Remove File] button. The trace names listed in the [Files to Edit] window will be removed.
To remove all trace files from the batch list:
• Click on the [Remove All Files] button. All trace names listed in the [Files to Edit] window will be removed.
6. Use Auto Events, Adjust Pass/Fail, Cursors, and Trace Information Editors as needed.
7. Click on the [Process Traces] button to complete updates/changes.

75

76
Section 7: OLTS Viewer/Editor Application
Opening Test Results with OLTS Viewer/EditorThe OLTS Viewer/Editor application may be accessed in several ways:
• from the Home screen by clicking on the OLTS Viewer/Editor icon -
This application allows reviewing loss measurements and certification test results and selecting standards and applications to apply to certification test results.
• from the Results Explorer by selecting a fiber and with a fiber selected double-clicking on the AT icon
• from the Results Explorer by selecting a fiber and with a fiber selected, displaying the Open Viewer submenu and selecting the OLTS Viewer/Editor
77
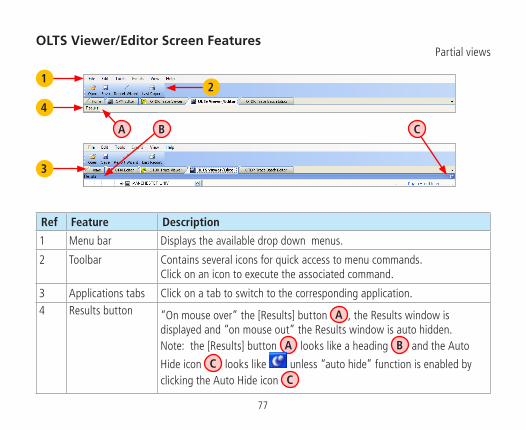
OLTS Viewer/Editor Screen Features
Ref Feature Description
1 Menu bar Displays the available drop down menus.
2 Toolbar Contains several icons for quick access to menu commands.Click on an icon to execute the associated command.
3 Applications tabs Click on a tab to switch to the corresponding application.4 Results button “On mouse over” the [Results] button A , the Results window is
displayed and “on mouse out” the Results window is auto hidden.Note: the [Results] button A looks like a heading B and the Auto
Hide icon C looks like unless “auto hide” function is enabled by clicking the Auto Hide icon C
Partial views
1
4
3
A B C
2

78
OLTS Viewer/Editor Screen Features (continued)
Ref Feature Description5 Results window The Results window displays folders and files hierarchy and is used to
navigate saved test results.
To disable/enable the “auto hide” function, click the Auto Hide icon /
located in the right top corner of the Results window C .6 Cables Info
windowContains informative fields:Job/Route/Cable name and Available Cables check box.
5
6
C

79
OLTS Viewer/Editor Screen Features (continued)
Ref Feature Description7 File Info window Contains both the editable and informative fields.
Editable fields allow editing/adding Customer, Contractor, and Operators’ ID and add comments. Informative fields display test equipment Model numbers, Software version, and tested fiber info.
7

80
OLTS Viewer/Editor Screen Features (continued)
A
B
C
10
8
9
Vertical/Horizontal split bars - allow resizing of the OLTS Viewer/Editor windows vertically and/or horizontally
D
81
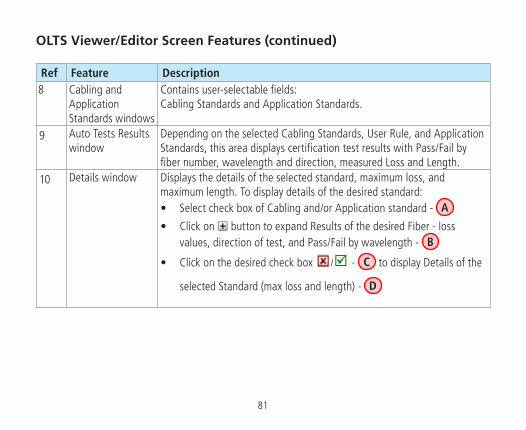
OLTS Viewer/Editor Screen Features (continued)
Ref Feature Description8 Cabling and
Application Standards windows
Contains user-selectable fields: Cabling Standards and Application Standards.
9 Auto Tests Results window
Depending on the selected Cabling Standards, User Rule, and Application Standards, this area displays certification test results with Pass/Fail by fiber number, wavelength and direction, measured Loss and Length.
10 Details window Displays the details of the selected standard, maximum loss, and maximum length. To display details of the desired standard:• Select check box of Cabling and/or Application standard - A
• Click on button to expand Results of the desired Fiber - loss values, direction of test, and Pass/Fail by wavelength - B
• Click on the desired check box / - C to display Details of the
selected Standard (max loss and length) - D

82
Menu Bar
The Menu Bar contains the available drop down menus as follows:
Each menu contains various commands. When a menu is selected, it displays a list of commands indicating functions that can be performed on selected files.
File Menu
The File drop down menu contains several commands as follows.
Command Function
Open Access the Results Explorer and navigate the desired test results file.
Save Save a file that already exists with its original name.
Save As... Save an existing file under a new name and preserve the original file.
Print OLTS Report Access the TRM Report Wizard.Preview an OLTS report before printing.Print the currently displayed OLTS report.
Close Close the open cable results and clear the OLTS Viewer.
Import Data... Download test data from an instrument.
OFL2Go... Open a utility program that copies data from an OFL250 or OFL280 (non-FlexTester) to a destination chosen by the user.

83
Command Function
Export Job to File... Export the selected Job to a zip file.
Backup Data... To have a restoration point, create a non-visible backup copy of a test data:- navigate the desired Job /Route/Cable - click OK to display the [Backup Description] window - add a comment on backed up data to be able to identify it during restoration
Restore Data... Restore previously backed up data to a visible folder.
Exit Close opened files and exit TRM.
To Restore Data
1. Click on individual Backups A to review comments B saved during the {Backup Data] process.
2. Using comments, identify and select data for restoration A .
3. Or select the “Restore Entire Archive” option C .
4. Click OK.
5. In the displayed File Navigator window, select the desired location.
6. Click OK to save the restored data.
A
BC

84
Edit Menu
The Edit menu allows the user to edit existing or create new User Rules, edit Fiber Under Test data and set up Preferences.
Edit Fiber Under TestThese fields allow the user to define fiber under test (FUT) parameters: length, number of splices, and number of connections
These fields allow the user to define connectors type, fiber type, and test method

85
Edit or Create New User Rules
Available languagesClick to create New RuleClick to delete Rules
Click to add wavelength
Select Loss Type
User-definable fields, which allow the user to select either MM or SM test port and set Pass/Fail criteria
Select Rule Type

86
Edit Preferences
Options to save User Rules
Available languages
Enables TRM Viewing and Report Generation in specific languages•Unchecked: TRM & Reports will use
PC language settings
•Checked: TRM & Reports will use language settings in above selection boxes
Select this check box to save the size and position of the TRM windows on exit
Select/deselect this check box to enable/disable the Results Selector in Editors
Select/deselect this check box to enable/disable the Zoom function for printed traces
Available distance units

87
Tools Menu
This menu provides access to the Home screen menus.
Command Function
View Results... Opens the Results Explorer screen
Report Wizard... Opens the Report Wizard screen
OTDR Trace Viewer... Opens the OTDR Trace Viewer screen
OLTS Viewer/Editor... Opens the OLTS Viewer/Editor screen
OTDR Trace Batch Editor...
Opens the OTDR Trace Batch Editor screen
Last Report... Open the most recent report created by Report Wizard.
Help Menu
This menu provides access to:
• TRM software user’s guide
• Various test equipment user’s guides
• AFL web site
• NOYES test and Inspection web site
• Software updates section on the AFL web
• [About TRM...] screen.

88
About TRM screen
[About TRM...] screen displays TRM version number and allows to see included Modules/Versions.
Click to display the
Details screen A
A

89
ToolbarSeveral of the most commonly used commands can be accessed from the Toolbar. Click on a toolbar icon to execute the corresponding command as follows
Locate and open the desired trace file
Save a trace file that already exists with its original name
Open the Report Wizard
Print the most recent report created by Report Wizard

90
Section 8: Viewing OPM Results with OPM Viewer/Editor
Opening Test Results with OPM Viewer/EditorThe OPM Viewer/Editor application may be accessed from the Results Explorer by selecting a fiber with OPM test data and with a fiber selected, displaying the Open Viewer submenu and selecting the OPM Viewer/Editor. 1. From the TRM Home screen, click the View Results icon - to access the Results Explorer
screen (see Section 3 for details).
2. In the [File Navigator] window, locate the desired fiber with OPM test data - .
3. With a fiber selected, display t h e O p e n Viewer submenu and se lec t the OPM Viewer/Editor.
This application allows users to review loss measurements and organize test data into cables by direction for accurate test reporting

91
OPM Editor Screen FeaturesPartial views
Ref Feature Description
1 Menu bar Displays the available drop down menus.
2 Toolbar Contains several icons for quick access to menu commands.Click on an icon to execute the associated command.
3 Applications tabs Click on a tab to switch to the corresponding application.4 Results button “On mouse over” the [Results] button A , the Results window is
displayed and “on mouse out” the Results window is auto hidden.Note: the [Results] button A looks like a heading B and the Auto
Hide icon C looks like unless “auto hide” function is enabled by clicking the Auto Hide icon C
Continued on next page
21
3
4
AB C

92
OPM Editor Screen Features - OPM Tests Results (continued)Partial views
Ref Feature Description5 Results window The Results window displays folders and files hierarchy and is used to
navigate saved test results.
To disable/enable the “auto hide” function, click the Auto Hide icon
/ located in the right top corner of the Results window C .6 Viewer selector Click to toggle between the OLTS and OPM Viewer/Editor7 Cables Info window Contains informative fields: Job/Route/Cable name.
Continued on next page
7
5 6
C
8

93
OPM Editor Screen Features - OPM Tests Results (continued)
Ref Feature Description8 File Info window Contains editable and informative fields. Editable fields allow editing/
adding Customer, Contractor, and Operators’ ID and add comments. Informative fields display test equipment Model numbers, Software version, and tested fiber info.
9 Test Results window Displays fiber number, wavelength, direction of test, and measured loss.10 Organize Data
buttonClicking this button allows users to select data for organization into cables by direction for accurate reporting (see next page for details).
11 Add Source button Allows users to combine data taken with more than one OPM. Data will be combined into cables by direction for more accurate reporting.
Partial views
98
10 11

94
OPM Editor Screen Features - OPM Tests Results (continued)
When the [Organize Data] button is pressed, additional block A appears at the bottom of the OPM Viewer/Editor window allowing users to perform the following:
• Edit File Info (Job Name, End 1/End 2, Cable ID, Customer, Contractor, Comments and Operators’ ID)
• Break test results data into one or more cables with data in one direction or two directions. For creating bi-directional results, be sure to select the option B .
• Combine test results from different sources into one cable.
Partial views
B A

95
Menu Bar
The Menu Bar contains the available drop down menus as follows:
Each menu contains various commands. When a menu is selected, it displays a list of commands indicating functions that can be performed on selected files.
File Menu
The File drop down menu contains several commands as follows:Command Function
Open Access the Results Explorer and navigate the desired test results file.
Save Save a file that already exists with its original name.
Close Close the open cable results and clear the OPM Viewer/Editor
Import Data... Download test data from an instrument.
Export Job to File... Export the selected Job to a zip file.
Backup Data... To have a restoration point, create a non-visible backup copy of your data before editing: - navigate the desired Job /Route/Cable - click OK to display the [Backup Description] window - add a clear comment on backed up data to be able to identify it during restoration
Continued on next page

96
Command Function
Restore Data... Restore previously backed up data to a visible folder.
Exit Close opened files and exit TRM.
To Restore Data
1. Click on individual Backups A to review comments B saved during the {Backup Data] process.
2. Using comments, identify and select data for restoration A .
3. Or select the “Restore Entire Archive” option C .
4. Click OK.
5. In the displayed File Navigator window, select the desired location.
6. Click OK to save the restored data.
A
C

97
Edit Preferences
Options to save User Rules
Available languages
Enables TRM Viewing and Report Generation in specific languages•Unchecked: TRM & Reports will use
PC language settings
•Checked: TRM & Reports will use language settings in above selection boxes
Select this check box to save the size and position of the TRM windows on exit
Select/deselect this check box to enable/disable the Results Selector in Editors
Select/deselect this check box to enable/disable the Zoom function for printed traces
Available distance units

98
Tools Menu
This menu provides access to the Home screen menus.
Command Function
View Results... Opens the Results Explorer screen
Report Wizard... Opens the Report Wizard screen
OTDR Trace Viewer... Opens the OTDR Trace Viewer screen
OLTS Viewer/Editor... Opens the OLTS Viewer/Editor screen
OTDR Trace Batch Editor...
Opens the OTDR Trace Batch Editor screen
Last Report... Open the most recent report created by Report Wizard.
Help Menu
This menu provides access to:
• TRM software user’s guide
• Various test equipment user’s guides
• AFL web site
• NOYES test and Inspection web site
• Software updates section on the AFL web
• [About TRM...] screen.

99
About TRM screen
[About TRM...] screen displays TRM version number and allows to see included Modules/Versions.
Click to display the
Details screen A
A

100
Toolbar
Several of the most commonly used commands can be accessed from the Toolbar. Click on a toolbar icon to execute the corresponding command as follows
Locate and open the desired trace file
Save a trace file that already exists with its original name
Open the Report Wizard
Print the most recent report created by Report Wizard

101
Working with OPM Results
Reorganizing OPM Results into Bi-directional Data
Figure A shows an example of OPM results displayed by the [OPM Viewer/Editor].
• 10 fibers are tested bi-directionally with NOYES OPM 5D power meter and OLS light source at 1310 nm and 1550 nm in direction A -> Z and Z -> A. Results are saved in OPM 5D as 20 fibers (results).
• When the saved results opened with TRM, they are displayed as 20 fibers tested in one direction A -> Z.
TRM allows reorganizing test results so they are displayed in A -> Z and Z -> A directions as tested.
Figure A

102
• Click the [Organize Data] button A .
• Additional block appears at the bottom of the OPM Viewer/Editor window B .
• Edit File Info editable fields C as needed (Job Name, End 1/End 2, Cable ID, Customer, Contractor, Comments and Operators’ ID). Note that edited File Info appears on the job tab D .
• For creating bi-directional data, be sure to select the option D .
To Reorganize OPM Test Results into Bi-directional Data
A
D
D
C
B

103
• Highlight the 1 to 10 fiber results at 1310 nm - 1 and 1 to 10 fiber results at 1550 nm - 2 and then drag the highlighted results to the [Bi-Directional Data] window - C as shown in Figure B.
• Results appear in the [Bi-Directional Data] window as 1 to 10 fiber results 1a and 2a in A -> Z direction columns as shown in Figure C.
Figure B Figure C
C
11
22
1a 2a

104
• Highlight the 11 to 20 fiber results at 1310 nm 3 and drag them to the [Bi-Directional Data] window as shown in Figure D. Make sure the pointer is pointing to the starting fiber cell of the desired wavelength and direction in the data destination area.
• The 11 to 20 fiber results at 1310 nm appear in the [Bi-Directional Data] window. They are
displayed as the 1 to 10 fiber results at 1310 nm 3a in Z -> A direction as shown in Figure E.
Figure D Figure E
1 1
1a 1a 3a2a 2a
3
3
2 2

105
• Highlight 11 to 20 fiber results at 1550 nm 4 and drag them to the [Bi-Directional Data] window as shown in Figure F. Make sure the pointer is pointing to the starting fiber cell of the desired wavelength and direction in the data destination area.
• The 11 to 20 fiber results at 1550 nm appear in the [Bi-Directional Data] window. They are
displayed as the 1 to 10 fiber results at 1550 nm 4a in Z -> A direction as shown in Figure G.
Reorganized OPM test results may be saved with the [Save] option and then opened in the OLTS Viewer/Editor application.
Figure F Figure G
1 1
1a 3a1a 3a 2a 4a
3 4 3 4
2 2
2a

106
Reorganizing Test Data into Multiple Cables
Figure A shows an example of OPM results displayed by the [OPM Viewer/Editor].
• 10 fibers are tested bidirectionally with NOYES OPM 5D power meter and OLS light source at 1310 nm and 1550 nm in direction A -> Z and Z -> A. Results are saved in OPM 5D as 20 fibers (results).
• When the saved results opened with TRM, they are displayed as 20 fibers tested in one direction A -> Z.
TRM allows reorganizing test results to break them into one or more cables with data in one direction or two directions.
Figure A

107
• Click the [Organize Data] button A .
• Additional block appears at the bottom of the OPM Viewer/Editor window B .
• Edit File Info editable fields as needed (Job Name, End 1/End 2, Cable ID, Customer, Contractor, Comments and Operators’ ID) C . Note that edited File Info appears on the job tab D .
• For creating bi-directional data, be sure to select the option E .
To Reorganize Test Data into Multiple Cables
A
D
D
C
B

108
Note: Fibers 1 to 2 are used in the example below. However, users may select as many fibers as needed.1. Highlight the 1 to 2 fiber results at 1310 nm 1 and 1 to 2 fiber results at 1550 nm 2 and then
drag the highlighted results to the [Bi-Directional Data] window - C as shown in Figure B.
2. Results appear in the [Bi-Directional Data] window as 1 to 2 fiber results 1a and 2a in A -> Z
Figure B Figure C
C
1 2 1 2
1a 2a

109
Figure D Figure E
direction columns as shown in Figure C.
3. Highlight the 3 to 4 fiber results at 1310 nm 3 and drag them to the [Bi-Directional Data] window as shown in Figure D. Make sure the pointer is pointing to the starting fiber cell of the desired wavelength and direction in the data destination area.
4. The 3 to 4 fiber results at 1310 nm appear in the [Bi-Directional Data] window. They are displayed
1
1a 2a
32 1
1a 3a 2a
32

110Figure G
as the 1 to 2 fiber results at 1310 nm 3a in Z -> A direction as shown in Figure E.
5. Highlight 3 to 4 fiber results at 1550 nm 4 and drag them to the [Bi-Directional Data] window as shown in Figure F. Make sure the pointer is pointing to the starting fiber cell of the desired wavelength and direction in the data destination area.
6. The 3 to 4 fiber results at 1550 nm appear in the [Bi-Directional Data] window. They are displayed
as the 1 to 2 fiber results at 1550 nm 4a in Z -> A direction as shown in Figure G.
Figure G shows the OPM test results reorganized as new Job A .
• Click on the button B to create an additional Job/Cable.
1 1
1a 3a 1a 3a 2a 4a
3 4 3 42 2
2a
A
B

111
• Additional [Bi-Directional Data] window C and tab D will appear indicating that an additional Job/Cable is added.
• Edit File Info editable fields E as needed (Job Name, End 1/End 2, Cable ID, Customer, Contractor, Comments and Operators’ ID). Note that edited File Info appears on the job tab D .
• For creating bi-directional data, be sure to select the option F .
• To add test data, copy fibers to the [Bi-Directional Data] window C as described in steps 1 to 6 selecting fiber numbers as needed.
FCE
D

112
• Click on the [Add Source] button A or the button B to add test data from the additional source to the [Test Results] window.
• Click the [Organize Data] button D .
• Additional block appears at the bottom of the OPM Viewer/Editor window E .
• Edit File Info editable fields F as needed (Job Name, End 1/End 2, Cable ID, Customer, Contractor, Comments and Operators’ ID). Note that edited File Info appears on the job tab G .
• For creating bi-directional data, be sure to select the option H .
Combining Test Data from Two Sources into one Cable
A
F
G
F
H
B
D
C
E

113
To Combine Test Data from Two Sources into one Cable
Figure A
Figure B
• To add test data from the first source A , copy fibers from the [Test Results]
window B to the [Bi-Directional Data] window C as described in steps 1 to 6 selecting fiber numbers as needed
• Click on the second source tab D to display stored test data E
• To add test data from the second source D , copy fibers from the [Test Results]
window E to the [Bi-Directional Data] window F as described in steps 1 to 6 selecting fiber numbers as needed
• Test data from first source is combined with test data from the second source as shown in Figure B
A D
B
C
E
F

114
Viewing OPM Results in the OLTS Viewer/EditorOPM test results may be opened in the OLTS Viewer/Editor application, which allows reviewing loss measurements by wavelength and direction and selecting standards and applications to apply to certification test results.
To Select Standards and Applications
1. Navigate the desired OPM test results and open them with OLTS Viewer/Editor application (see section titled “Opening Test Results with OLTS Viewer/Editor” for details).

115
2. Click the [Apply Rules] button A to display the [Edit Fiber] menu.
3. Edit fiber parameters as needed.
4. Click OK B .
5. As needed, select standards C and applications D to apply to certification test results (see section titled “OLTS Viewer/Editor Screen Features” for details).
B
C
D
These fields allow the user to define fiber under test (FUT) parameters: length, number of splices, and number of connections
These fields allow the user to define connectors type, fiber type, and test method

116
Section 9: Report Wizard and Last Report ApplicationsReport WizardThe Report Wizard application provides the user with a variety of pre-defined report templates and cover sheets and allows generating professional test reports that may be printed or stored as PDF files.
The Report Wizard application may be accessed either from the Home screen or from any Test Viewer/Editor screen as follows:
• From the Home screen, click on the Report Wizard icon -
• From the OTDR Trace Viewer, OTDR Trace Batch Editor, or OLTS Viewer/Editor, click on the Report
Wizard icon
• From the View Results application, click on the button
Follow the on-screen instructions for generating, saving, and printing test reports.
Last Report ApplicationThe Last Report application will open the most recent report created by Report Wizard in the Report Preview Page, which allows the user to print the latest report, store it as PDF file, or return to the Report Wizard and modify the created report.
The Last Report application may be accessed either from the Home screen or from any Test Viewer/Editor screen as follows:
• From the Home screen, click on the Last Report icon -
• From the OTDR Trace Viewer, OTDR Trace Batch Editor, or OLTS Viewer/Editor, click on the Last
Report icon -
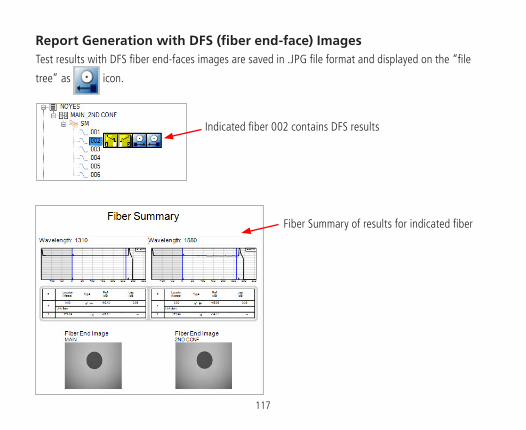
117
Report Generation with DFS (fiber end-face) ImagesTest results with DFS fiber end-faces images are saved in .JPG file format and displayed on the “file
tree” as icon.
Fiber Summary of results for indicated fiber
Indicated fiber 002 contains DFS results

118
To include images in TRM reports, select the appropriate Template to support end-face images saved in the Job. There are two options:
Cable Summary: Allows the user to include Thumbnail images of the captured end-faces.
Result Detail Pages: Allow users to include the corresponding end-face image with the OTDR trace. End-face image included with the trace is of the end where the OTDR is Located at.

119
TRM Template Selection Page
The Cable Summary Template includes the OTDR summary information and End-face image thumbnails.
The OTDR Results Template shows OTDR traces, End-face image, Event Map, and Loss results if available.

120
TRM report with OTDR traces and near end image of fiber under test

121
Section 10: Transferring Files to a PC
From USB Flash Drive to PC1. To transfer files from your test equipment to a PC using the USB drive, perform the following:
2. Copy any files stored on your test equipment Internal Drive to the USB drive.
3. Remove the USB drive from your test equipment and plug it into the USB port on your PC.
4. Copy files from the USB Flash drive to your PC.
From Test Equipment via USB Function Port to PC
C-Series, M-Series, OPM-Series
To transfer files from your test equipment to a PC using a USB cable, perform the following:
5. Connect your test equipment to a PC using the supplied mini-USB to USB cable. Note: If your PC requests new USB drivers, install the CD-ROM that comes with your test equipment, which contains the needed drivers (drivers may also be downloaded from our web at www.AFLglobal.com > Resources > Software). This step only needs to be performed the first time you connect your test equipment to your PC.
6. If your PC pops up a dialog box asking if you want to set up a new Partnership, select No (the test equipment should always be a ‘guest’).
• Open My Computer > Mobile Device > File Storage > Internal folder. or
• Open My Computer > Mobile Device > USB folder.

122
OFL280 FlexTester
To transfer files from the OFL280 FlexTester to a PC using a USB cable, perform the following:
1. Connect your OFL280 FlexTester to a PC using the supplied mini-USB to USB cable.
2. On the OFL280 FlexTester, press the [USB] key A to enable the ‘USB connection’ mode B .
3. From the Windows Explorer, locate the OFL drive C and the [Results] folder D .
4. Copy the desired traces E to your PC.
A B
D
E
C

123
OFL2GO: Transferring OFL250 or OFL280 (non-FlexTester) test data
To transfer files from the OFl250 or OFL280 OTDR (non-FlexTester) to a PC using a USB cable, perform the following:
1. Connect your OFL250/OFL280 OTDR to a PC using the supplied mini-USB to USB cable.
2. On the OFL250/OFL280 OTDR, press the [USB] key to enable the ‘USB connection’ mode.
3. From the TRM File menu, choose the [OFL2Go...] command to display the OFL2Go screen as follows:
4. To select the desired destination on your PC, click [To] A to display the “Select OFL Destination Directory” screen B (see next page).
A

124
5. From the“Select OFL Destination Directory” screen B choose the desired destination folder.
6. Click [Select] C .
7. When back in the OFL2Go screen D , click [OK] E to start transferring.
8. TRM will display notification F when transfer is complete. Click [OK] G .
9. When back in the OFL2Go screen H , click [Exit] J to exit the OFL2Go utility.
C
G
E
J
B
F
D
H

125
From Test Equipment via Serial Port to PC
OLTS5 Test Set
Using the supplied serial cable, connect your instrument to the available COM Port on your PC.
On Test Results Manager (TRM)
1. Select [File] > [Import Data...] to display the Import Data Wizard.
2. Select the destination for the downloaded files on your PC A .
3. From the pull-down menu, select your instrument for data download B .
4. Select [Next] to continue C and proceed to the next screen.
5. When the next screen is displayed, select the appropriate COM port D .
6. Click [Next] to continue E .
On OLTS5 Instrument
7. Click the Menu button to display the Main Menu.
8. Use the UP and DOWN arrow keys to highlight the [FILE] option, and then click the [SELECT] soft key to access the [FILE MENU] screen.
9. From the [FILE MENU] screen, use the Up and Down arrows to highlight the [XFER RECORDS]
B
C
D
E
A

126
option.
10. Press the [SELECT] soft key to transfer the currently
open file.
Return to Test Results Manager (TRM)
11. Click [Next] F to continue and proceed to the next screen.
12. You will see the [Download Progress] screen followed by the [Job Information] screen G .
13. The [Job Information] screen G allows users to enter and/or edit information (Name, Locations, Cable ID) for downloaded jobs.
14. Click [Next] H to continue and proceed to the next screen, which allows users to
• restart to download more data J
• view data K
• create report L
15. When done, click [Finish] M to exit the Import Data Wizard.
J
K
L
M
F
G
H

127
TurboTest 400 Test Set
Using the supplied serial cable, connect your instrument to the available COM Port on your PC.
On Test Results Manager (TRM)
1. Select [File] > [Import Data...] to display the Import Data Wizard.
2. Select the destination for the downloaded files on your PC A .
3. From the pull-down menu, select your instrument for data download B .
4. Select [Next] to continue C and proceed to the next screen.
5. When the next screen is displayed, select the appropriate COM port D .
6. Click [Next] to continue E .
On TurboTest 400 Instrument
7. Press the Menu button to display the Main Menu.
8. Use the Up and Down arrow keys to highlight the [CONNECT TO PC] option.
9. Press the [SELECT] soft key to transfer the currently open file.
A
B
C
D
E

128
Return to Test Results Manager (TRM)
10. Click [Connect to Instrument] F , then click [Next] G to continue and proceed to the next screen.
11. The next screen allows users to select files for transfer. Select the desired files H .
12. Click [Next] J to continue.
13. You will see the [Download Progress] screen followed by the [Job Information] screen K .
14. The [Job Information] screen allows users to enter and/or edit information (Name, Locations, Cable ID) for downloaded jobs.
15. Click [Next] L to continue and proceed to the next screen M , which allows users to
restart to download more data
view data
create report
16. When done, click [Finish] N to exit the Import Data Wizard.
H
J
K
L
M
N
FG
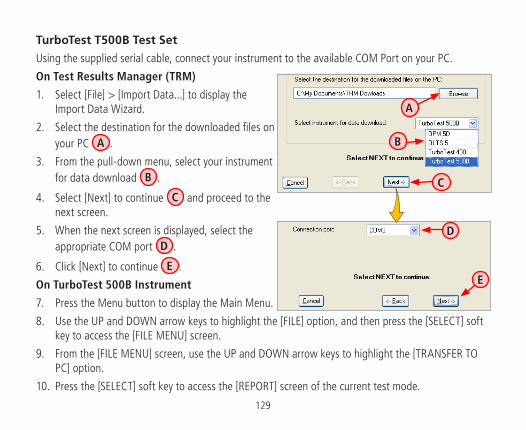
129
TurboTest T500B Test Set
Using the supplied serial cable, connect your instrument to the available COM Port on your PC.
On Test Results Manager (TRM)
1. Select [File] > [Import Data...] to display the Import Data Wizard.
2. Select the destination for the downloaded files on your PC A .
3. From the pull-down menu, select your instrument for data download B .
4. Select [Next] to continue C and proceed to the next screen.
5. When the next screen is displayed, select the appropriate COM port D .
6. Click [Next] to continue E .
On TurboTest 500B Instrument
7. Press the Menu button to display the Main Menu.
8. Use the UP and DOWN arrow keys to highlight the [FILE] option, and then press the [SELECT] soft key to access the [FILE MENU] screen.
9. From the [FILE MENU] screen, use the UP and DOWN arrow keys to highlight the [TRANSFER TO PC] option.
10. Press the [SELECT] soft key to access the [REPORT] screen of the current test mode.
A
B
C
D
E

130
11. From the [REPORT] screen, choose one of the following:
• You may press the [SELECT] soft key to transfer the current file.
• You may press the [All] soft key to transfer all files of the current test mode.
Return to Test Results Manager (TRM)
12. Click [Next] F to continue and proceed to the next screen.
13. You will see the [Download Progress] screen followed by the [Job Information] screen G .
14. The [Job Information] screen G allows users to enter and/or edit information (Name, Locations, Cable ID) for downloaded jobs.
15. Click [Next] H to continue and proceed to the next screen, which allows users to
• restart to download more data J
• view data K
• create report L
16. When done, click [Finish] M to exit the Import Data Wizard.
F
M
G
H
J
K
L

131www.AFLglobal.com (800) 321-5298 or (603) 528-7780
Thank you for choosing NOYES Test and Inspection
www.AFLglobal.com
CERTIFIED
ISO9001
NOYES