testbeds, model evaluation, statistics, and users barbara brown, director ([email protected]) joint...
TRANSCRIPT
Testbeds, Model Evaluation, Statistics, and Users
Barbara Brown, Director ([email protected])
Joint Numerical Testbed Program
Research Applications Laboratory
NCAR
11 February 2013

Topics
• Testbeds, the JNT, and the DTC• New developments in forecast verification
methods– Probabilistic– Spatial– Contingency tables– Measuring uncertainty– (Extremes)
• Users– What makes a good forecast?– How can forecast evaluation reflect users’ needs?
• User-relevant verification
• Resources

Testbeds
From Wikipedia:
“A testbed (also commonly spelled as test bed in research publications) is a platform for experimentation of large development projects. Testbeds allow for rigorous, transparent, and replicable testing of scientific theories, computational tools, and new technologies.”
For NWP / Forecasting, this means independent testing and evaluation of new NWP innovations and prediction capabilities
However, in weather prediction, we have many flavors of testbed
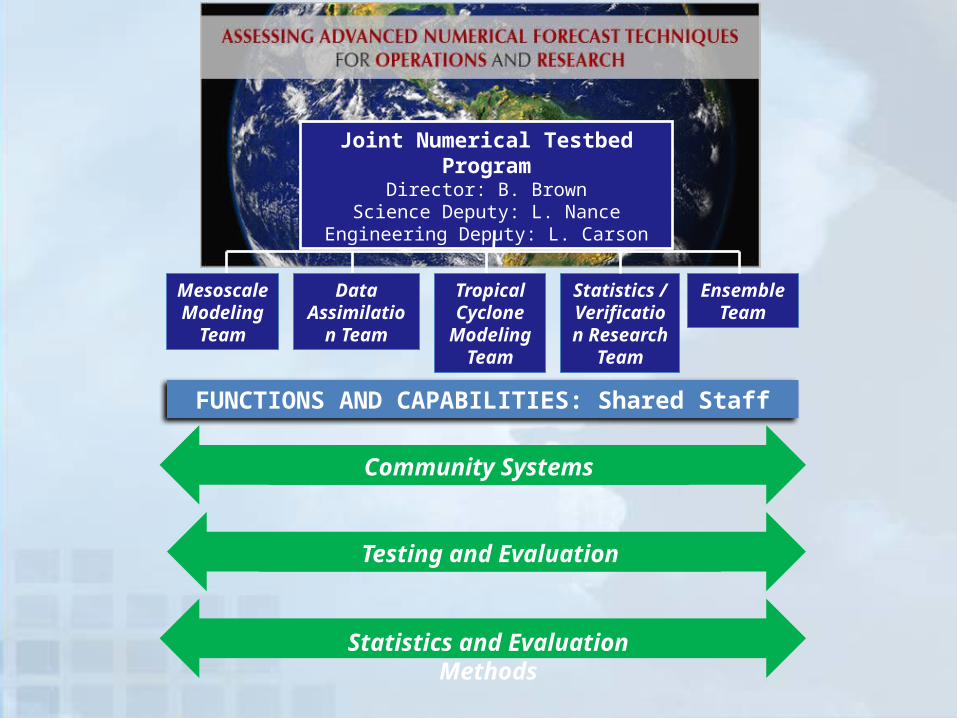
Community Systems
Mesoscale Modeling
Team
Data Assimilation
Team
Statistics / Verification
ResearchTeam
Tropical Cyclone
ModelingTeam
Ensemble Team
Joint Numerical Testbed ProgramDirector: B. Brown
Science Deputy: L. NanceEngineering Deputy: L. Carson
Testing and Evaluation
Statistics and Evaluation Methods
FUNCTIONS AND CAPABILITIES: Shared Staff

Focus and goalsFocus:
Support the sharing, testing, and evaluation of research and operational numerical weather prediction systems (O2R)
Facilitate the transfer of research capabilities to operational
prediction centers (R2O)
Goals:• Community code support
– Maintain and support community prediction and evaluation systems
• Independent testing and evaluation of prediction systems– Undertake and report on independent tests and evaluations of prediction
systems
• State-of-the-art tools for forecast evaluation– Research, develop and implement
• Support community interactions and development on model forecast improvement, forecast evaluation, and other relevant topics– Workshops, capacity development, training

Major JNT activities• Developmental Testbed Center• Hurricane Forecast
Improvement Project (HFIP)– Research model testing and
evaluation– Evaluation methods and tools
• Forecast evaluation methods– Uncertainty estimation– Spatial methods– Climate metrics– Energy forecasts– Satellite-based approaches– Verification tools
• Research on statistical extremes Use of CloudSat to evaluate vertical
cloud profiles
Hurricane track forecast verification

Major JNT activities
• Developmental Testbed Center
• Hurricane Forecast Improvement Project (HFIP)– Research model testing and
evaluation– Evaluation methods and tools
• Forecast evaluation methods– Uncertainty estimation– Spatial methods– Climate metrics– Satellite-based approaches– Verification tools
• Research on statistical extremes
Use of CloudSat to evaluate vertical cloud profiles
Hurricane track forecast verification
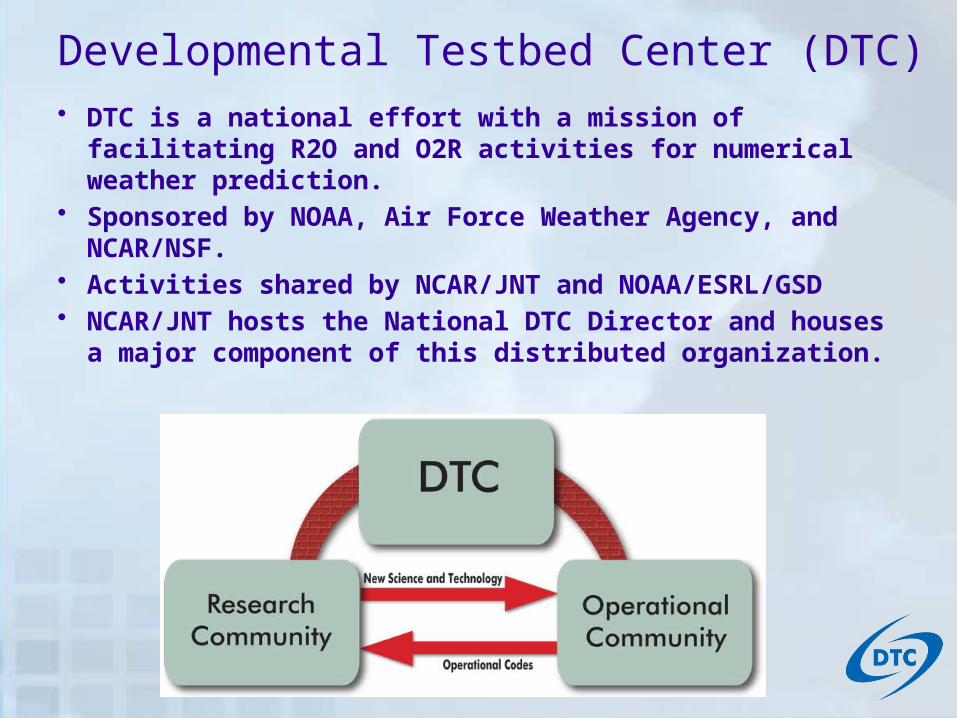
Developmental Testbed Center (DTC)• DTC is a national effort with a mission of facilitating R2O
and O2R activities for numerical weather prediction.• Sponsored by NOAA, Air Force Weather Agency, and
NCAR/NSF.• Activities shared by NCAR/JNT and NOAA/ESRL/GSD• NCAR/JNT hosts the National DTC Director and houses a
major component of this distributed organization.
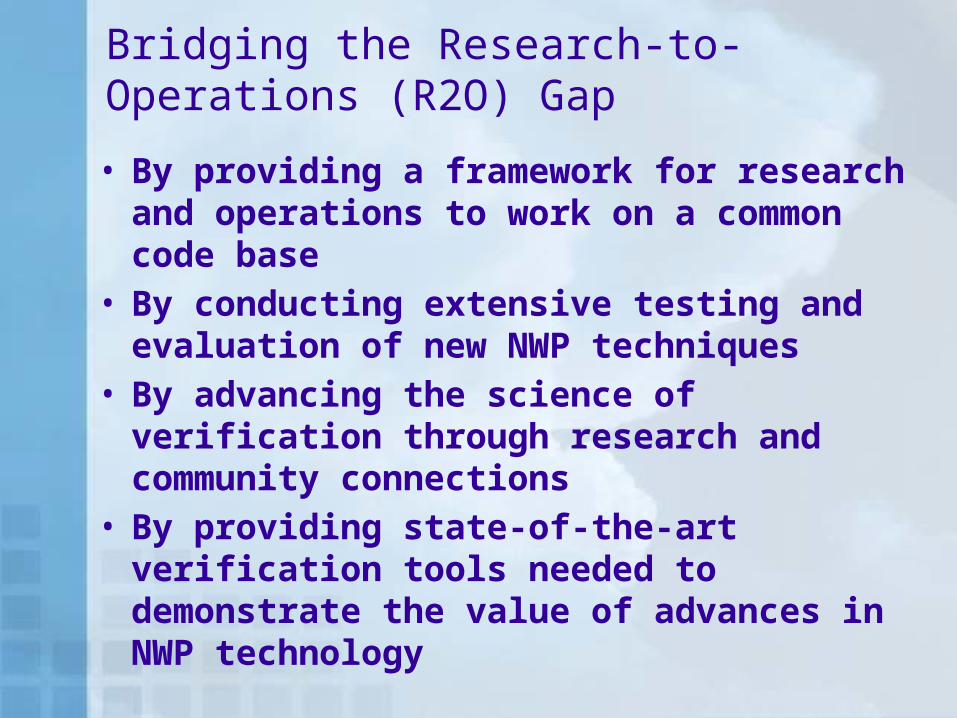
Bridging the Research-to-Operations (R2O) Gap
• By providing a framework for research and operations to work on a common code base
• By conducting extensive testing and evaluation of new NWP techniques
• By advancing the science of verification through research and community connections
• By providing state-of-the-art verification tools needed to demonstrate the value of advances in NWP technology
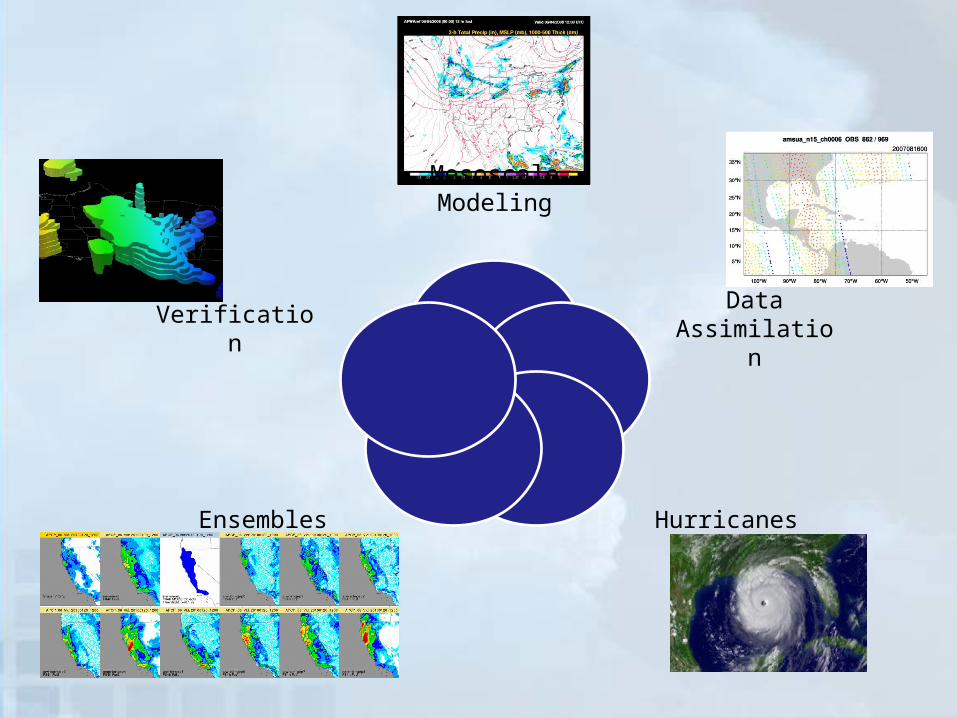
Mesoscale Modeling
Data Assimilation
HurricanesEnsembles
Verification

Community Software Projects
• Weather Research and Forecasting Model– WRF– WPS: Preprocessor– WPP/UPP: Post Processor
• Model Evaluation Tools (MET)
• Gridpoint Statistical Interpolation (GSI) data assimilation system
• WRF for Hurricanes– AHW– HWRF

Community Tools for Forecast Evaluation• Traditional and new tools
implemented into DTC Model Evaluation Tools (MET)
• Initial version released in 2008• Includes
– Traditional approaches– Spatial methods (MODE, Scale,
Neighborhood)– Confidence Intervals
• Supported to the community– Close to 2,000 users (50% university)– Regular tutorials– Email help
• MET-TC to be released in Spring 2013 (for tropical cyclones)
MET team received the 2010 UCAR Outstanding Performance Award for Scientific and Technical Advancement
http://www.dtcenter.org/met/users/

Testing and Evaluation
JNT and DTC Philosophy:• Independent of development process• Carefully designed test plan
– Specified questions to be answered– Specification and use of meaningful forecast
verification methods
• Large number of cases• Broad range of weather regimes• Extensive objective verification, including
assessment of statistical significance• Test results are publicly available

DTC tests span the DTC focus areas

Mesoscale Model Evaluation Testbed
• What: Mechanism to assist research community w/ initial stage of testing to efficiently demonstrate the merits of a new development– Provide model input & obs datasets
to utilize for testing– Establish & publicize baseline
results for select operational models– Provide a common framework for
testing; allow for direct comparisons
• Where: Hosted by the DTC; served through Repository for Archiving, Managing and Accessing Diverse DAta (RAMADDA)– Currently includes 9 cases– Variety of situations and datasets
www.dtcenter.org/eval/mmet
Verification methods: Philosophy
• One statistical measure will never be adequate to describe the performance of any forecasting system
• Before starting, we need to consider the questions to be answered before proceeding – What do we (or the users) care about? What are we trying to accomplish through a verification study?
• Different problems require different statistical treatment
• Care is needed in selecting methods for the task
Example: Finley affair• Measuring uncertainty (i.e., confidence intervals,
significance tests) is very important when comparing forecasting systems
But also need to consider practical significance

What’s new in verification?
• Contingency table performance diagrams Simultaneous display of multiple statistics
• ProbabilisticContinuing discussions of approaches, philosophy, interpretation
• Spatial methodsNew approaches to diagnostic verification
• ExtremesNew approaches and measures
• Confidence intervalsBecoming more commonly used

Computing traditional verification measures
Use contingency table counts to compute a variety of measures
POD, FAR, Freq. Bias, Critical Success Index (CSI), Gilbert Skill Score (= ETS), etc.
Use error values to estimate a variety of measures
Mean Error
MAE
MSE, RMSE
Correlation
Observed
Yes no
yes hits false alarms
No missescorrect
negativesFo
reca
st
Yes/No contingency tableContinuous statistics
Important issues:(1) Choice of scores is critical
(2) The traditional measures are not independent of each other

Relationships among contingency table scores
• CSI is a nonlinear function of POD and FAR• CSI depends on base rate (event frequency) and Bias
1CSI
1 11
POD 1 FAR
FAR
POD
CS
I
Very different combinations of FAR and POD lead to the same CSI value(User impacts?)

Pro
babi
lity
of D
etec
tion
Success Ratio
Performance diagrams
After Roebber 2009 and C. Wilson 2008
Success ratio = 1 - FAR
Equal lines of CSI
Equal lines of Bias
Take advantage of relationships among scores to show multiple scores at one time
Only need plot POD and 1-FAR
Best
NOTE: Other forms of this type of diagram exist for different combinations of measures (see Jolliffe and Stephenson 2012)

Example: Overall changes in performance resulting from changes in precip analysis
Colors = ThresholdsBlack = 0.1”Red = 0.5”Blue = 1” Green = 2”
Dots = Stage IVRectangles = CCPA
Larger impacts for higher thresholds

Measure Attribute evaluated CommentsProbability forecasts
Brier score Accuracy Based on squared error
Resolution Resolution (resolving different categories)
Compares forecast category climatologies to overall climatology
Reliability Calibration
Skill score SkillSkill involves comparison of forecasts
Sharpness measure SharpnessOnly considers distribution of forecasts
ROC Discrimination Ignores calibrationC/L Value Value Ignores calibration
Ensemble distributionRank histogram Calibration Can be misleadingSpread-skill Calibration Difficult to achieve
CRPS Accuracy
Squared difference between forecast and observed distributionsAnalogous to MAE in limit
log p score (Ignorance) Accuracy
Local score, rewards for correct category; infinite if observed category has 0 density

Ignorance score (for multi-category or ensemble forecasts)
is the category that actually was observed at time t
• Based on information theory• Only rewards forecasts with some probability
in “correct” category• Is receiving some attention as “the” score to
use
*2 , ( )1
1IS log ( )
n
t k ti
pn
*( )k t

Multivariate approaches for ensemble forecasts
• Minimum spanning tree– Analogous to Rank Histogram for
multivariate ensemble predictions– Ex: Treat precipitation and
temperature simultaneously– Bias correction and Scaling
recommended (Wilks)• Multivariate energy score
(Gneiting)– Multivariate generalization of CRPS
Multivariate approaches allow optimization on the basis of more than one variable
From Wilks (2004)
Bearing and Wind speed errors

Traditional approach for gridded forecasts
Consider gridded forecasts and
observations of precipitation
Which is better?
OBS1
2 3
45
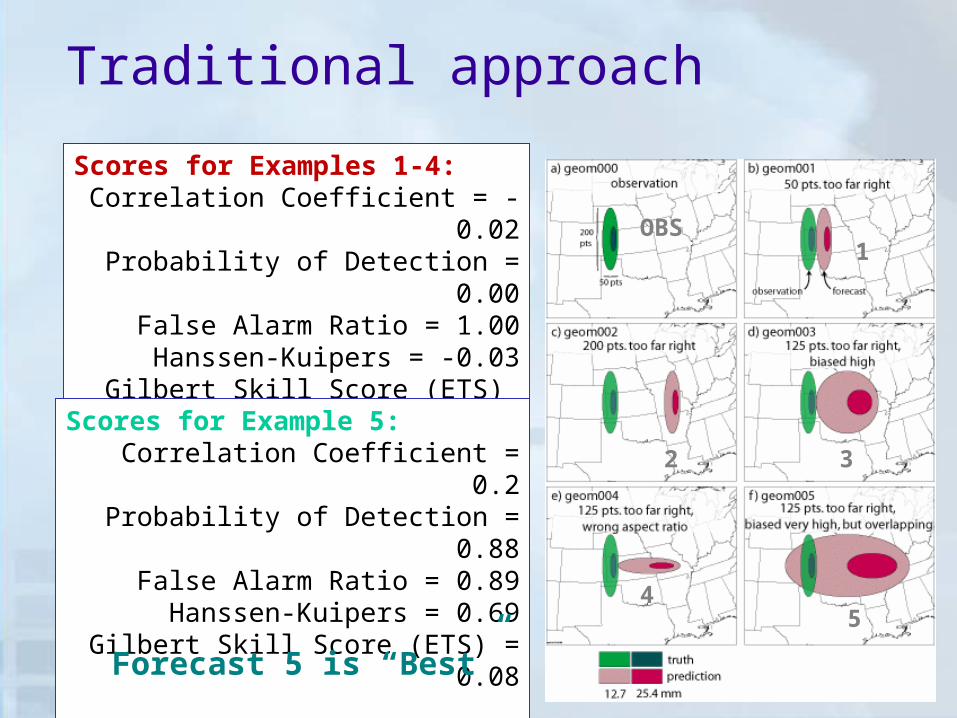
Traditional approach
OBS1
2 3
45
Scores for Examples 1-4:Correlation Coefficient = -0.02Probability of Detection = 0.00
False Alarm Ratio = 1.00Hanssen-Kuipers = -0.03
Gilbert Skill Score (ETS) = -0.01
Scores for Example 5:Correlation Coefficient = 0.2
Probability of Detection = 0.88False Alarm Ratio = 0.89Hanssen-Kuipers = 0.69
Gilbert Skill Score (ETS) = 0.08
Forecast 5 is “Best”

Impacts of spatial variability
• Traditional approaches ignore spatial structure in many (most?) forecasts– Spatial correlations
• Small errors lead to poor scores (squared errors… smooth forecasts are rewarded)
• Methods for evaluation are not diagnostic• Same issues exist for ensemble and probability forecasts
Forecast Observed
Grid-to-grid results:POD = 0.40FAR = 0.56CSI = 0.27

Method for Object-based Diagnostic Evaluation (MODE)
Traditional verification results:Forecast has very little skill
MODE quantitative results:• Most forecast areas too
large• Forecast areas slightly
displaced• Median and extreme
intensities too large• BUT – overall – forecast
is pretty good
Forecast Observed
1
2
3
Solid = Forecast
Outline = Observed
What are the issues with the traditional approaches?
• “Double penalty” problem• Scores may be insensitive to the size of the errors
or the kind of errors• Small errors can lead to very poor scores• Forecasts are generally rewarded for being smooth• Verification measures don’t provide
– Information about kinds of errors (Placement? Intensity? Pattern?)
– Diagnostic information• What went wrong? What went right?• Does the forecast look realistic?• How can I improve this forecast?• How can I use it to make a decision?

New Spatial Verification Approaches
NeighborhoodSuccessive smoothing of
forecasts/obsGives credit to "close"
forecasts
Scale separationMeasure scale-dependent error
Field deformationMeasure distortion anddisplacement (phase error)
for whole field
How should the forecast be adjusted to make the best
match with the observed field?
Object- and feature-based
Evaluate attributes of identifiable features
http://www.ral.ucar.edu/projects/icp/

Neighborhood methods
Goal: Examine forecast performance in a region; don’t require exact matches
• Also called “fuzzy” verification• Example: Upscaling
– Put observations and/or forecast on coarser grid
– Calculate traditional metrics
• Provide information about scales where the forecasts have skill
• Examples: Roberts and Lean (2008) – Fractions Skill Score; Ebert (2008); Atger (2001); Marsigli et al. (2006) From Mittermaier 2008

Scale separation methods
• Goal:
Examine performance as a function of spatial scale
• Examples: – Power spectra
• Does it look real?• Harris et al. (2001)
– Intensity-scale
Casati et al. (2004)– Multi-scale variability (Zapeda-
Arce et al. 2000; Harris et al. 2001; Mittermaier 2006)
– Variogram (Marzban and Sandgathe 2009)
From Harris et al. 2001

Field deformation
Goal: Examine how much a forecast field needs to be transformed in order to match the observed field
Examples:• Forecast Quality Index (Venugopal
et al. 2005)• Forecast Quality
Measure/Displacement Amplitude Score (Keil and Craig 2007, 2009)
• Image Warping (Gilleland et al. 2009; Lindström et al. 2009; Engel 2009)
• Optical Flow (Marzban et al. 2009)
From Keil and Craig 2008

Object/Feature-based
Goals: Measure and compare (user-) relevant features in the forecast and observed fields
Examples: • Contiguous Rain Area (CRA)• Method for Object-based
Diagnostic Evaluation (MODE)• Procrustes • Cluster analysis• Structure Amplitude and
Location (SAL) • Composite • Gaussian mixtures
MODE example 2008
CRA: Ebert and Gallus 2009

MODE application to ensembles
RETOP
Observed CAPS PM Mean Radar Echo Tops (RETOP)

Accounting for uncertainty in verification measures• Sampling
– Verification statistic is a realization of a random process.
– What if the experiment were re-run under identical conditions?
• Observational• Model
– Model parameters– Physics– Etc…
Accounting for these other areas of uncertainty is a major research need

Confidence interval example (bootstrapped)
Significant differences may show up in differences but not when looking at overlap in confidence intervals
Sometimes significant differences are too small to be practical – need to consider practical significance

Forecast value and user-relevant metrics
Forecast Goodness
Depends on the quality of the forecast
AND
The user and his/her application of the forecast information
It would be nice to more closely connect quality measures to value measures
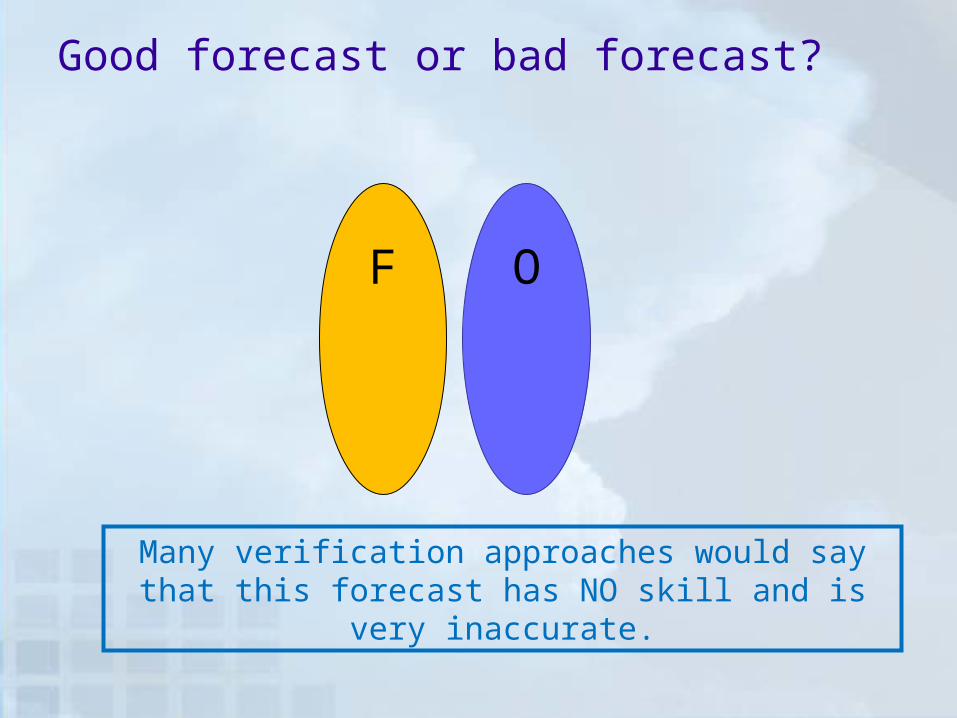
Good forecast or bad forecast?
F O
Many verification approaches would say that this forecast has NO skill and is very inaccurate.
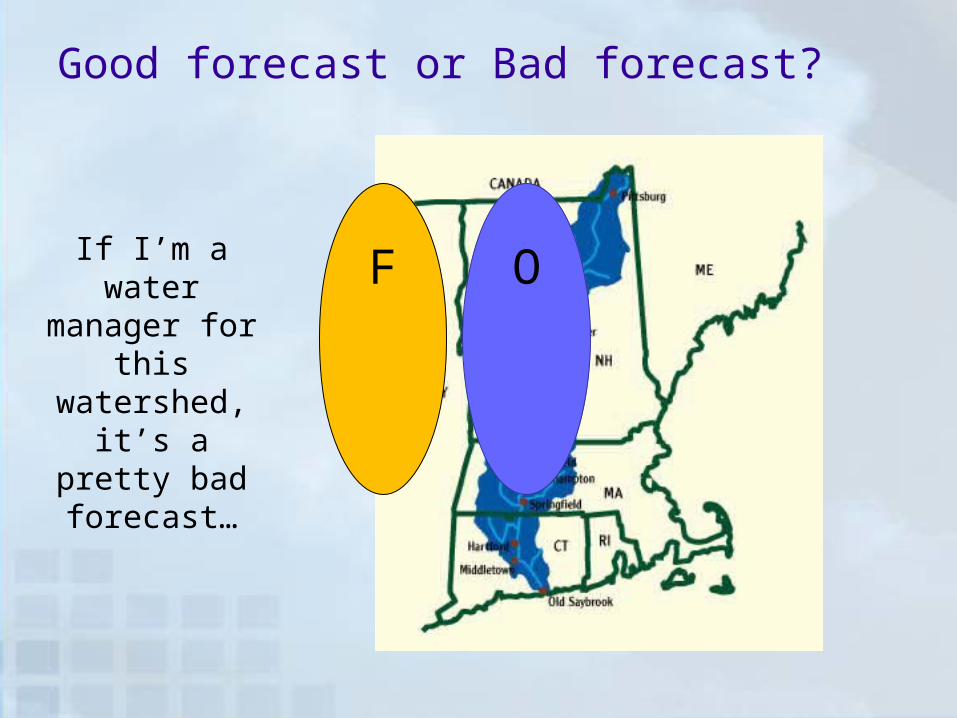
Good forecast or Bad forecast?
F OIf I’m a water manager for this watershed, it’s a
pretty bad forecast…

Good forecast or Bad forecast?
If I only care about precipitation over a larger region
It might be a pretty good forecast
O
Different users have different ideas about
what makes a forecast good
Different verification approaches can measure different types of
“goodness”
F O

User value and forecast goodness
• Different users need/want different kinds of information
• Forecasts should be evaluated using user-relevant criteria
• Goal: Build in methods that will represent needs of different usersOne measure/approach will not represent needs of all users
Examples:– Meaningful summary measures for managers– Intuitive metrics and graphics for forecasters– Relevant diagnostics for forecast developers– Connect user “values” to user-relevant metrics

Value Metrics Assessment Approach (Lazo)
• Expert Elicitation / mental modeling– Interviews with users– Elicit quantitative estimates of value for improvements
• Conjoint experiment– Tradeoffs for metrics for weather forecasting– Tradeoffs for metrics for application area (e.g.,
energy)– Tie to economic value to estimate marginal value of
forecast improvements w.r.t. each metric
• Application of approach being initiated (in energy sector)

Example of a Survey Based Choice Set Question
Courtesy, Jeff Lazo

Concluding remarks
• Testbeds provide an opportunity for facilitating the injection of new research capabilities into operational prediction systems
• Independent testing and evaluation offers credible model testing
• Forecast evaluation is an active area of research…– Spatial methods– Probabilitistic approaches– User-relevant metrics

WMO Working Group on Forecast Verification Research
• Working Group under the World Weather Research Program (WWRP) and Working Group on Numerical Experimentation (WGNE)
• International representation• Activities:
– Verification research – Training – Workshops – Publications on “best practices”:
Precipitation, Clouds, Tropical Cyclones (soon)
http://www.wmo.int/pages/prog/arep/wwrp/new/Forecast_Verification.html

Resources: Verification methods and FAQ
• Website maintained by WMO verification working group (JWGFVR)
• Includes– Issues– Methods (brief definitions)– FAQs– Links and references
• Verification discussion group:
http://mail.rap.ucar.edu/mailman/listinfo/vx-discuss http://www.cawcr.gov.au/projects/verification/

Resources
• WMO Tutorials (3rd, 4th, 5th workshops)– Presentations available
• EUMETCAL tutorial– Hands-on tutorial
http://cawcr.gov.au/events/verif2011/
http://www.space.fmi.fi/Verification2009/
3rd workshop:http://www.ecmwf.int/newsevents/meetings/workshops/2007/jwgv/general_info/index.html
http://www.eumetcal.org/-Eumetcal-modules-

Resources: Overview papers
• Casati et al. 2008: Forecast verification: current status and future directions.Meteorological Applications, 15: 3-18.
• Ebert et al. 2013: Progress and challenges in forecast verificationMeteorological Applications, submitted (available from E. Ebert or B. Brown)
Papers summarizing outcomes and discussions from 3rd and 5th International Workshop on Verification
Methods

Resources - Books
• Jolliffe and Stephenson (2012): Forecast Verification: a practitioner’s guide, Wiley & Sons, 240 pp.
• Stanski, Burrows, Wilson (1989) Survey of Common Verification Methods in Meteorology (available at http://www.cawcr.gov.au/projects/verification/)
• Wilks (2011): Statistical Methods in Atmospheric Science, Academic press. (Updated chapter on Forecast Verification)

Thank you!

Extra slides
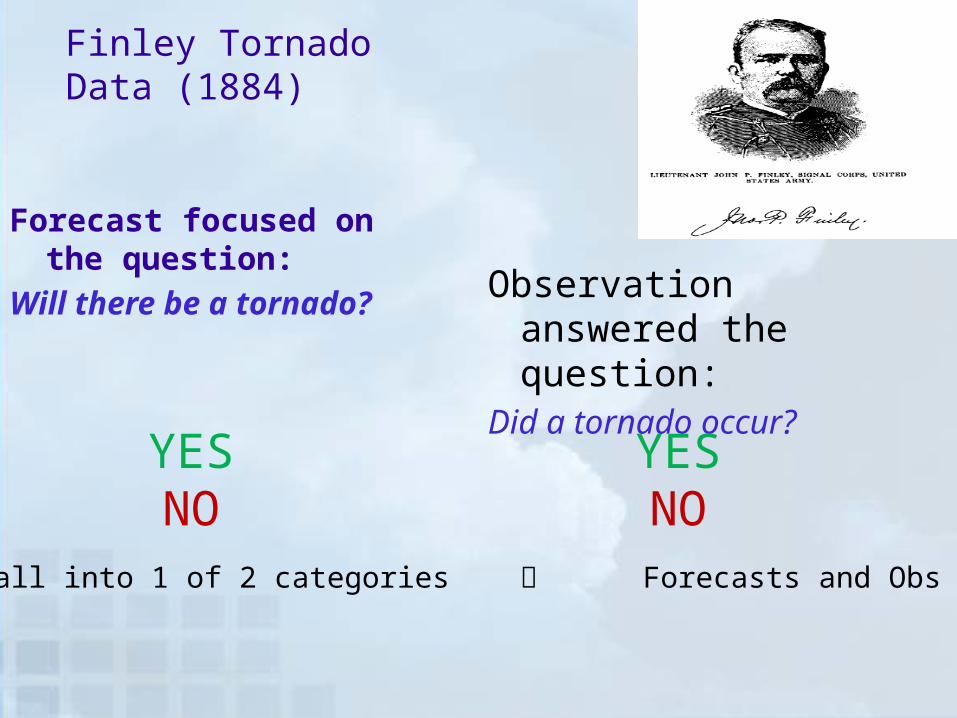
Finley Tornado Data (1884)
Forecast focused on the question:
Will there be a tornado? Observation answered the question:
Did a tornado occur?
YESNO
Answers fall into 1 of 2 categories Forecasts and Obs are Binary
YESNO
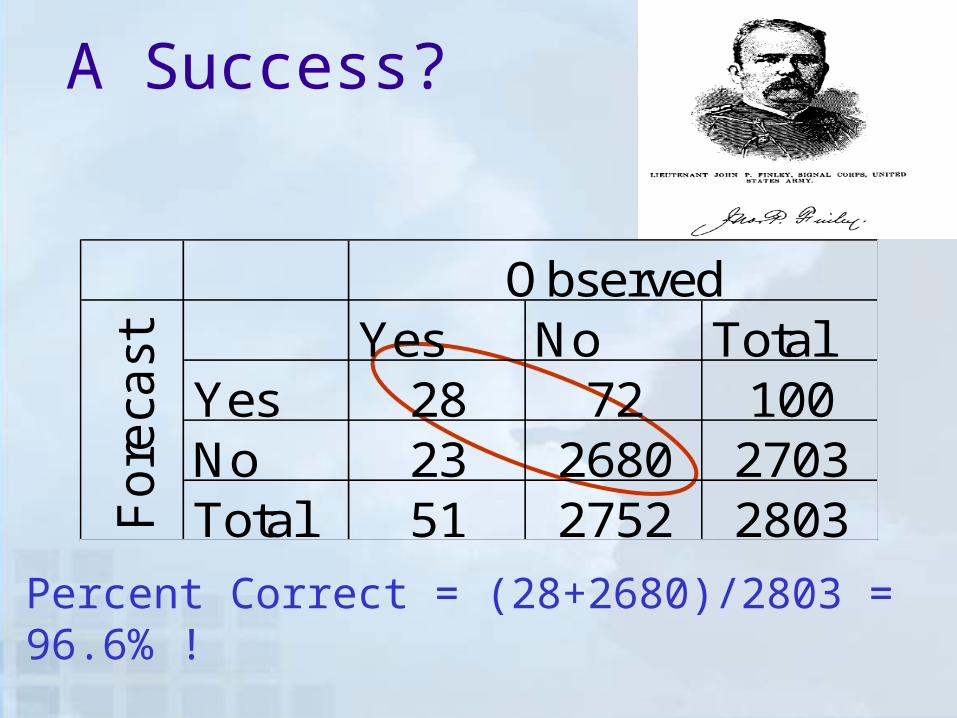
A Success?
Yes No TotalYes 28 72 100No 23 2680 2703Total 51 2752 2803
Observed
Fo
reca
st
Percent Correct = (28+2680)/2803 = 96.6% !
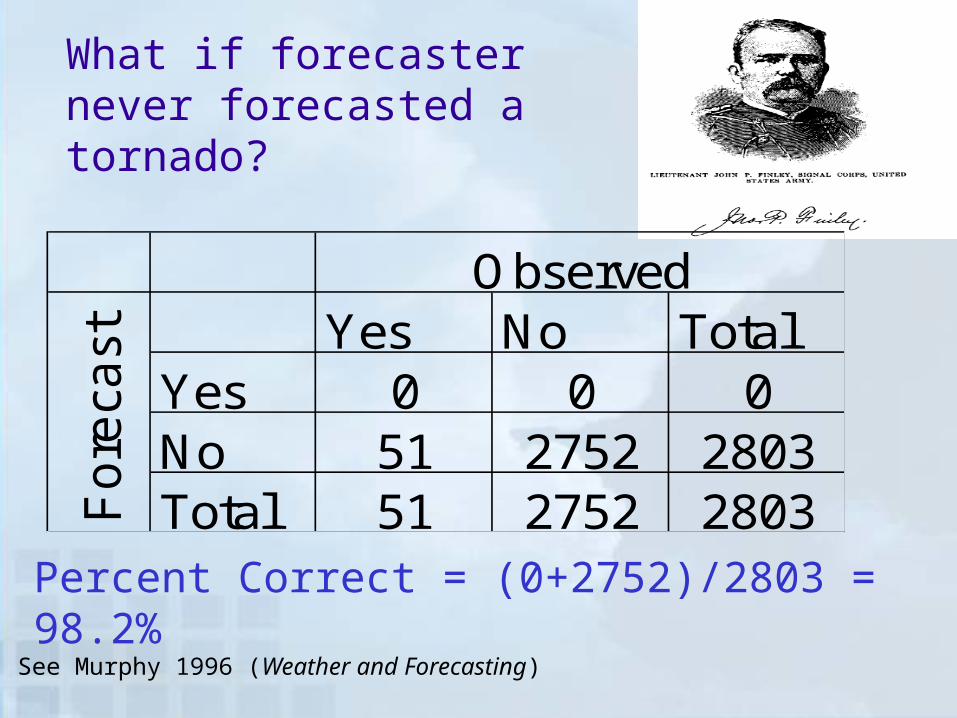
What if forecaster never forecasted a tornado?
Yes No TotalYes 0 0 0No 51 2752 2803Total 51 2752 2803
Observed
Fo
reca
st
Percent Correct = (0+2752)/2803 = 98.2%
See Murphy 1996 (Weather and Forecasting)

Extreme weather
• Typical focus on high-impact weather – heavy precip, strong wind, low visibility, high reflectivity, etc.
• “Extreme” weather often implies “Rare” or infrequent event – i.e., small samples– Infrequent events (low “base
rate”) often require special statistical treatment...
• Maybe difficult to observe
Gare Montparnasse, 1895
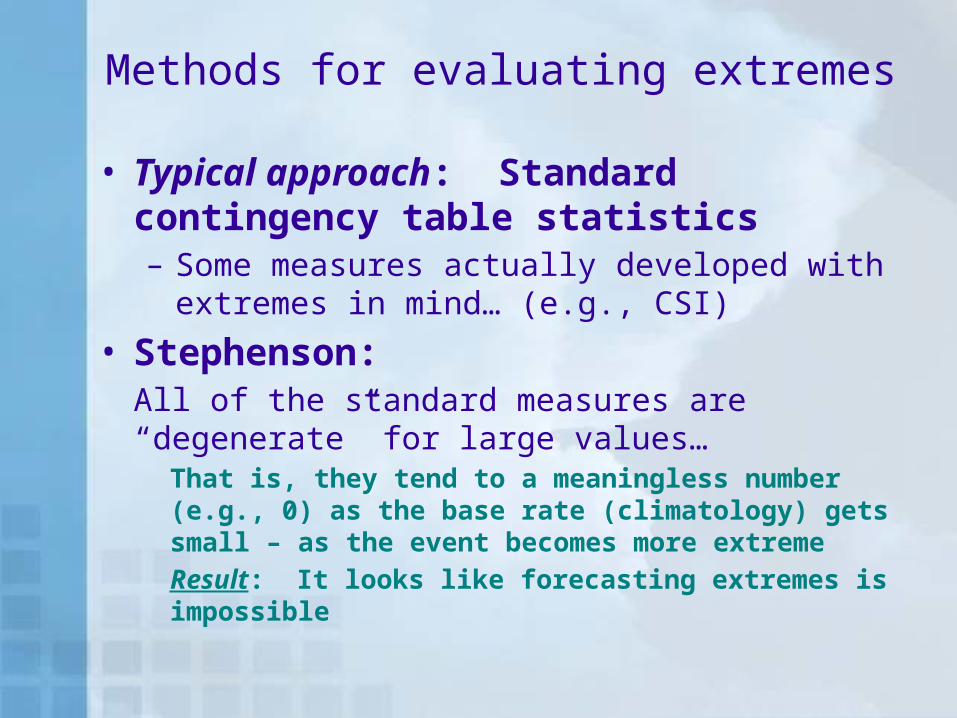
Methods for evaluating extremes
• Typical approach: Standard contingency table statistics– Some measures actually developed with extremes in
mind… (e.g., CSI)
• Stephenson:All of the standard measures are “degenerate” for large values…
That is, they tend to a meaningless number (e.g., 0) as the base rate (climatology) gets small – as the event becomes more extreme
Result: It looks like forecasting extremes is impossible

New measures for extremes
• “Extreme dependency scores” developed starting in 2008 by Stephenson, Ferro, Hogan, and others
• Based on asymptotic behavior of score with decreasing base rate
• All based on contingency table counts• Catalog of measures
– EDS – Extreme Dependency score• Found to be subject to hedging (over-forecasting)
– SEDS – Symmetric EDS • Dependent on base rate
– SEDI – Symmetric Extremal Dependency Index• Closer to a good score• Being used in practice in some places
(See Chapter 3 in Jolliffe and Stephenson 2012; Ferro and Stephenson 2011; Weather and Forecasting)

EDS Example
From Ferro and Stephenson 2011 (Wx and Forecasting)
6-h rainfall (Eskdalemuir)
EDSEDI
SEDI