testing and data reduction of the chinese small telescope...
TRANSCRIPT

Testing and data reduction of the Chinese Small Telescope Array (CSTAR) for Dome A,
Antarctica
This article has been downloaded from IOPscience. Please scroll down to see the full text article.
2010 Res. Astron. Astrophys. 10 279
(http://iopscience.iop.org/1674-4527/10/3/009)
Download details:
IP Address: 129.94.162.194
The article was downloaded on 12/09/2012 at 04:24
Please note that terms and conditions apply.
View the table of contents for this issue, or go to the journal homepage for more
Home Search Collections Journals About Contact us My IOPscience

Research in Astron. Astrophys. 2010 Vol. 10 No. 3, 279–290http://www.raa-journal.org http://www.iop.org/journals/raa
Research inAstronomy andAstrophysics
Testing and data reduction of the Chinese Small Telescope Array(CSTAR) for Dome A, Antarctica ∗
Xu Zhou1,4, Zhen-Yu Wu1, Zhao-Ji Jiang1,4, Xiang-Qun Cui2,4, Long-Long Feng3,4,
Xue-Fei Gong2,4, Jing-Yao Hu1,4, Qi-Sheng Li1, Gen-Rong Liu2, Jun Ma1,
Jia-Li Wang1,4, Li-Fan Wang3,4, Jiang-Hua Wu1, Li-Rong Xia2, Jun Yan1,4,Xiang-Yan Yuan2,4, Feng-Xiang Zhai2, Ru Zhang2 and Zhen-Xi Zhu3,4
1 National Astronomical Observatories, Chinese Academy of Sciences, Beijing 100012, China;[email protected]
2 Nanjing Institute of Astronomical Optics & Technology, National Astronomical Observatories,Chinese Academy of Sciences, Nanjing 210042, China
3 Purple Mountain Observatory, Chinese Academy of Sciences, Nanjing 210008, China;4 Chinese Center for Antarctic Astronomy, Purple Mountain Observatory, Chinese Academy of
Sciences, Nanjing 210008, China
Received 2010 January 8; accepted 2010 January 21
Abstract The Chinese Small Telescope Array (CSTAR) is the first Chinese astro-nomical instrument on the Antarctic ice cap. The low temperature and low pressuretesting of the data acquisition system was carried out in a laboratory refrigerator andon the 4500m Pamirs high plateau, respectively. The results from the final four nightsof test observations demonstrated that CSTAR was ready for operation at Dome A,Antarctica. In this paper, we present a description of CSTAR and the performancederived from the test observations.
Key words: instrumentation: detectors — techniques: photometric — stars: variables
1 INTRODUCTION
Site testing at the South Pole (90◦E, 2835m elevation) and Dome C (123◦E, 75◦S, 3260m elevation)over the past decade has shown that the Antarctic plateau offers outstanding sites for astronomicalobservations. The extremely cold temperatures lead to very low infrared backgrounds and atmo-spheric water vapor content. The very low wind speeds and stable middle and upper atmosphereresult in favorable seeing conditions for high-resolution imaging (Storey et al. 2007). The medianfree-atmosphere seeing in Dome C is 0.27 arcsec, and it is below 0.15 arcsec for 25 percent of thetime (Lawrence et al. 2004). In addition, the long dark winter on the Antarctic plateau allows con-tinuous observations of variable astronomical objects.
Dome A (77◦21′E, 80◦22′S, 4093m elevation), the highest point on the Antarctic plateau, iswidely predicted to be an even better astronomical site than Dome C, based on the topographicsimilarity and Dome A’s higher altitude. In January 2005, via overland traverse, Dome A was first
∗ Supported by the National Natural Science Foundation of China.

280 X. Zhou et al.
Table 1 Passband Parameters of Filters Used by CSTAR
Telescope CSTAR #2 CSTAR #4 CSTAR #1 CSTAR #3
Filter g r i none
Effective Wavelength (nm) 470 630 780
FWHM (nm) 140 140 160
visited by the Polar Research Institute of China (PRIC). This provides astronomers with a goodopportunity to explore this special area for astronomy. PRIC plans to establish a permanentlymannedstation at Dome A within the next decade, with astronomy as one of the scientific goals of the station.As part of this program, PRIC conducted a second expedition to Dome A, arriving via overlandtraverse in January 2008. On this expedition, the first Chinese Antarctic astronomical instrument,CSTAR, was deployed to Dome A. Besides the task of astronomical site testing, the main scientificgoals of CSTAR include variable star light curves and statistics, supernovae studies, gamma-rayburst optical afterglow detection and exoplanet detection.
CSTAR was designed and constructed during 2006–2007 at the National AstronomicalObservatories of China (NAOC) and the Nanjing Institute of Astronomical Optics Technology ofChina (NIAOT). A series of tests were performed on CSTAR before the second expedition to DomeA to ensure that it was ready for deployment. As a result of this careful preparation, CSTAR operatedsuccessfully during 2008, as part of the Plateau Observatory (PLATO) at Dome A (Yang et al. 2009).In Section 2, we describe the design and construction of CSTAR. Test observations at the Xinglongstation of NAOC and the data reduction are presented in Section 3. Finally, a summary is given inSection 4.
2 INSTRUMENTS
CSTAR is a small 2 × 2 Schmidt-Cassegrain telescope array. Each telescope of CSTAR has an en-trance pupil diameter of 145mm (effective aperture of 100mm) and a focal ratio of f/1.2, giving afield of view of ∼ 4.5◦ × 4.5◦. Figure 1 shows the optical design of the CSTAR telescope, whichconsists of a catadioptric objective with a spherical primary mirror, delivering low chromatic aberra-tion. The first plano lens serves both as a window and as a filter. In order to keep the focus unchangedthrough a ∼ 100◦C temperature range (from +20 to −80◦C ), Zerodur and fused silica are used forthe main optical components and Invar 36 is used for the telescope tube. The tube is designed tobe light weight, well sealed, and easy to assemble. The inside of the telescope tube was filled bypure nitrogen to avoid ice and frost formation on the internal optical surfaces. Each telescope tubeis hermetically sealed and an ITO (Indium-Tin-Oxide) film was coated onto the front window. Anelectric current is passed through this film, providing ∼ 10 W of power to keep the surface of thewindow warmer than the ambient temperature. CSTAR is specifically designed for Antarctic oper-ation, having no moving parts at all—including the optics and mechanical supporting system. Thefour telescopes are installed in a steel enclosure, see Figure 2, and are pointed at the South CelestialPole; i.e., each telescope is inclined 9◦38′ from the zenith. Details of the CSTAR telescope structureare described in Yuan et al. (2008).
The three telescopes, CSTAR #2, #4, and #1, have fixed filters: g, r, and i, and the fourthtelescope CSTAR #3 is filter-less. The main parameters of the three filters are listed in Table 1and the transmission curves of those filters are presented in Figure 3. The filters are designed to besimilar to the corresponding filters of the SDSS (Fukugita et al. 1996). Using these filters, CSTARcan obtain multicolor photometric data for each object simultaneously.
An Andor DV435 1k×1k frame transfer CCD with a pixel size of 13 µm is used for the detector.Frame transfer technology is ideal for fast imaging as it has the advantage of requiring no mechanicalshutter. Avoiding the need for moving parts is very desirable on the Antarctic plateau. The CCD was

CSTAR: Testing and Data Reduction 281
Fig. 1 Optical design of the CSTAR telescope.Fig. 2 Picture of the CSTAR enclosure was takenin the XingLong station of NAOC.
Fig. 3 Transmission profiles of the 3 CSTAR filters. The filter codes (see Table 1) are labeled oneach filter. Note that CSTAR #3 has no filter.
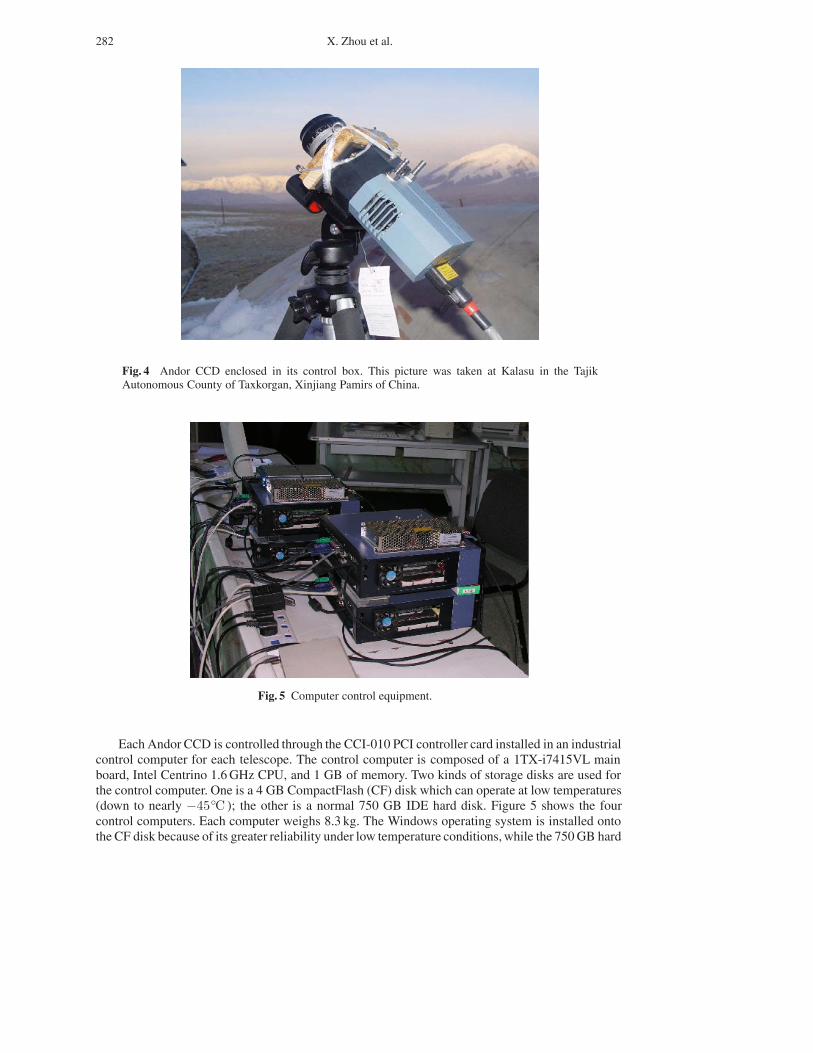
enclosed in a control box, as shown in Figure 4. The cable at the back of the box connects to thePCI controller card installed in the control computer. The typical readout noise of the CCD is ∼ 3 ewith a maximum of ∼ 12 e, and the gain is set to 2.0 e per A/D. The peak quantum efficiency ofthe Andor CCD at −90◦C is ∼ 95%. During the typical exposure time of 30 s and under the typicalambient temperatures of less than −50◦C on the Antarctic plateau, the dark current of the AndorCCD is only 0.5 e. The dark current can thus be negligible under Antarctic conditions.
282 X. Zhou et al.
Fig. 4 Andor CCD enclosed in its control box. This picture was taken at Kalasu in the TajikAutonomous County of Taxkorgan, Xinjiang Pamirs of China.
Fig. 5 Computer control equipment.
Each Andor CCD is controlled through the CCI-010 PCI controller card installed in an industrialcontrol computer for each telescope. The control computer is composed of a 1TX-i7415VL mainboard, Intel Centrino 1.6GHz CPU, and 1 GB of memory. Two kinds of storage disks are used forthe control computer. One is a 4 GB CompactFlash (CF) disk which can operate at low temperatures(down to nearly −45◦C ); the other is a normal 750 GB IDE hard disk. Figure 5 shows the fourcontrol computers. Each computer weighs 8.3 kg. The Windows operating system is installed ontothe CF disk because of its greater reliability under low temperature conditions,while the 750 GB hard

CSTAR: Testing and Data Reduction 283
disk is mainly used for data storage. The CCD control and data collection software were developedbased on the Andor-SDK-CCD software development kit for the Windows-XP operating system.The time of the control computer of CSTAR #3 is synchronized by GPS and the other computerscorrect their clock by CSTAR #3.
The real time data reduction process starts automatically after the control computer boots. Theimage is corrected for bias and flat-field frames, and the catalog of objects is produced. The brightest3000 stars of the catalog from 1/3 of the images are moved to a special directory for data transfer viairidium satellite communication.
3 TESTING AND DATA REDUCTION
3.1 Testing
In order to assure the performance of CSTAR under the extremely low temperature conditions ofDome A, the CCD system and several different industrial control computers were tested. Finally,the whole CSTAR system was tested at low temperature in the laboratory of NAOC. These testsindicated that the four telescopes and the CCD can work at low temperatures down to nearly−80 ◦C ,while the four control computers can work down to −30 ◦C . In 2007 February 6–9, the CCD andcontrol computers were tested at Kalasu. Kalasu (see Fig. 4) is located in the Tajik AutonomousCounty of Taxkorgan, on the Xinjiang Pamirs of China at an elevation of 4450 m. We chose Kalasuas the test site because of its low temperature and low atmospheric pressure conditions similar tothe Antarctic plateau. The atmospheric pressure was ∼ 58.6 kPa and the temperatures ranged from−5◦C to −18◦C during the testing process. Both the CCD and the control computers were shown towork normally during the two days of testing, and there were four 750GB normal hard disks whichwere selected for the data storage of CSTAR.
On 2007 September 3–7, test observations of CSTAR were performed at the Xinglong stationof NAOC. The four CCDs were cooled down to −40◦C ∼ −50◦C by the electronic cooling system
Fig. 6 Bias frame images for each telescope.

284 X. Zhou et al.
Fig. 7 Flat-field images for each telescope.
of the camera. The weather was good most of the time during the four observation nights, and morethan 20 000 images were obtained. The typical exposure time was 20 s. Figure 6 shows the ‘super’bias images for each telescope, which are the median of 100 bias frame images for each telescope.There is no obvious variation or structure in the ‘super’ bias images. These ‘super’ bias images areunique bias frames to be used for reduction of data both from observations at Xinglong and alsofrom Dome A.
Variations of night-sky background are obvious even in the zenith direction. If one takes the timeduring a photometric, moonless night to obtain a long series of sky-dominated images pointing di-rectly at the zenith, the effects of the nonuniformity of the night sky can be minimized. However, ourtelescope observes the polar sky area at an airmass of 1.54 at the Xinglong station. The median skybackground can only be used as an initial flat-field for image correction. Thus, we typically obtained‘supersky’ flat-fields by combining images of the sky (Zhou et al. 2004). During this combination,the bright stars in the images were masked and rejected, and only the areas free from stars wereused. By comparing the images, the median level of each pixel could be selected to derive the final‘supersky’ flat-field. One hundred images of ‘supersky’ for each telescope of CSTAR were used toobtain the ‘supersky’ flat-field. These flat-fields mostly reflect the small, pixel to pixel variations inthe images. Figure 7 shows the final ‘supersky’ flat-field images for each telescope. Some obviousstructures can still be seen.
3.2 Data Reduction
First, for each filter a ‘super’ bias frame was subtracted from each image, then the ‘super-sky’ flat-field was divided by the bias-corrected images. The bias and flat-field corrected dataof ∼ 20 000 images obtained by CSTAR during the four test-observation nights were processedwith the automatic data reduction software developed by Z. J. Jiang and X. Zhou based on theDAOPHOT photometric package (Stetson 1987), which was used in the data reduction of BATC

CSTAR: Testing and Data Reduction 285
(Fan et al. 1996; Wu et al. 2007). Because CSTAR has a large field and is undersampled, obtainingan accurate point-spread function (PSF) for the sources detected across the whole view of field isvery difficult. The DAOFIND program was used to find stars in each image and DAOPHOT wasused to perform synthetic aperture photometry on the objects detected by DAOFIND. All instru-mental magnitudes of the four telescopes were then normalized to the V band magnitudes of stars inthe image 39530013.fit, which was observed by the #3 telescope on 2007 September 5.
3.3 Error Analysis and Correction
There are obvious systematic errors in the derived aperture-photometry magnitudes. The errorsmainly come from the following sources:
1. The bias stability of each CCD.Due to the continuous observation during exposures and the frame transfer mode of the CCD,there is no opportunity to obtain real-time bias frames. The bias frames obtained at one timemust be used for observations from another day at Dome A. Because of variations in the envi-ronmental parameters, such as temperature and instrumental status, the bias of each CCD cameramay change. This variable bias will introduce linear errors in the observed magnitudes.
2. Non-uniformity of the ‘supersky’ flat-field.The flat-field images were not obtained during ideal photometric nights, and not from the zenithsky. A brightness gradient and asymmetry may exist in the flat-field frames. The variation intemperature from −40 to −80◦C may also change the characteristics of the flat field. Duringthe polar observations by the fixed CSTAR telescopes, every star will trace out a circle on theCCD, and the residual flat-field error will give a false variation in the observed magnitude ofeach star.
3. Variable PSF for stars in different positions in the images of CSTAR.The telescopes of CSTAR have a large field of view. The optical design cannot keep the PSFexactly uniform over all parts of the image. When we use a fixed aperture to measure the mag-nitudes of the stars, the PSF depends on the location on the image and this will cause a variationin the instrumental magnitudes of each star relative to the other stars.
Because we are observing a single area of the sky, and the sky’s image is rotating on the CCD, wehave the opportunity to correct the main residual system errors mentioned above. Using thousandsof stars with very different magnitudes, we can easily determine the variable component of thebias residuals based on the different magnitudes of those stars in two different images. Using all ofthe circular traces of the stars, the large-scale residual flat-field correction can be obtained. Usingthe instrumental magnitudes from several different apertures for each star, the aperture photometrycurve-of-growth can be obtained in all parts of the image, but is mainly corrected with residual flat-field correction mentioned above. The instrumental magnitudes obtained from different apertureswere calibrated to the standard system. After all these corrections, the systematic errors in the derivedphotometric magnitudes can be reduced to the level of 0.01 mag for the brightest stars in mostof the images. Some sudden abnormal variations, where they exist, mostly come from the cirrusclouds in the sky. Figure 8 presents the magnitude-corrected flat-field images for each telescopeusing thousands of stars, and shows the obvious circular structures that match the traces of stars onthe CCD.
Two kinds of error estimates have been performed. One is theoretic statistical estimation basedon a star’s magnitude and its sky background. The other is obtained by real repeated observations ofall the objects in the images. By comparing the errors resulting from different images of the samefield with the same filter, we find that the measurement errors are normally ±0.01 mag for brightstars. The statistical errors can be regarded as the lower limits of the measurement errors. In theerror estimates, we ignore points with abnormally large deviations to calculate the root mean square
286 X. Zhou et al.
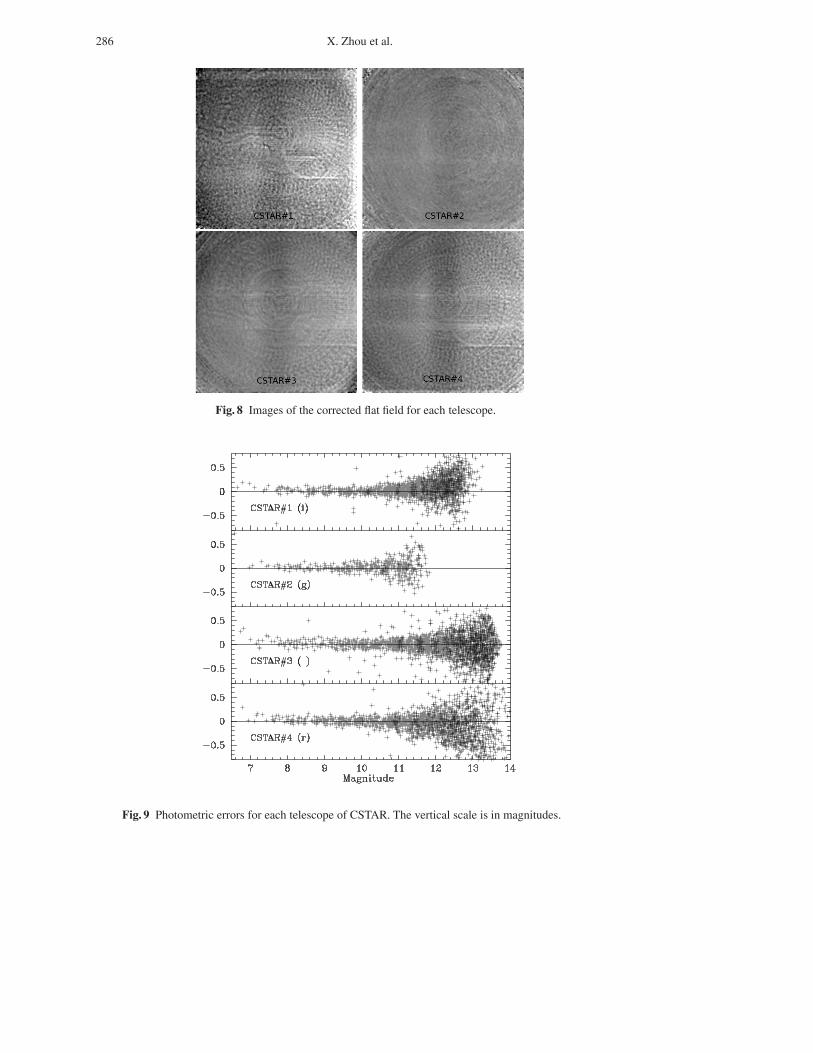
Fig. 8 Images of the corrected flat field for each telescope.
Fig. 9 Photometric errors for each telescope of CSTAR. The vertical scale is in magnitudes.
CSTAR: Testing and Data Reduction 287
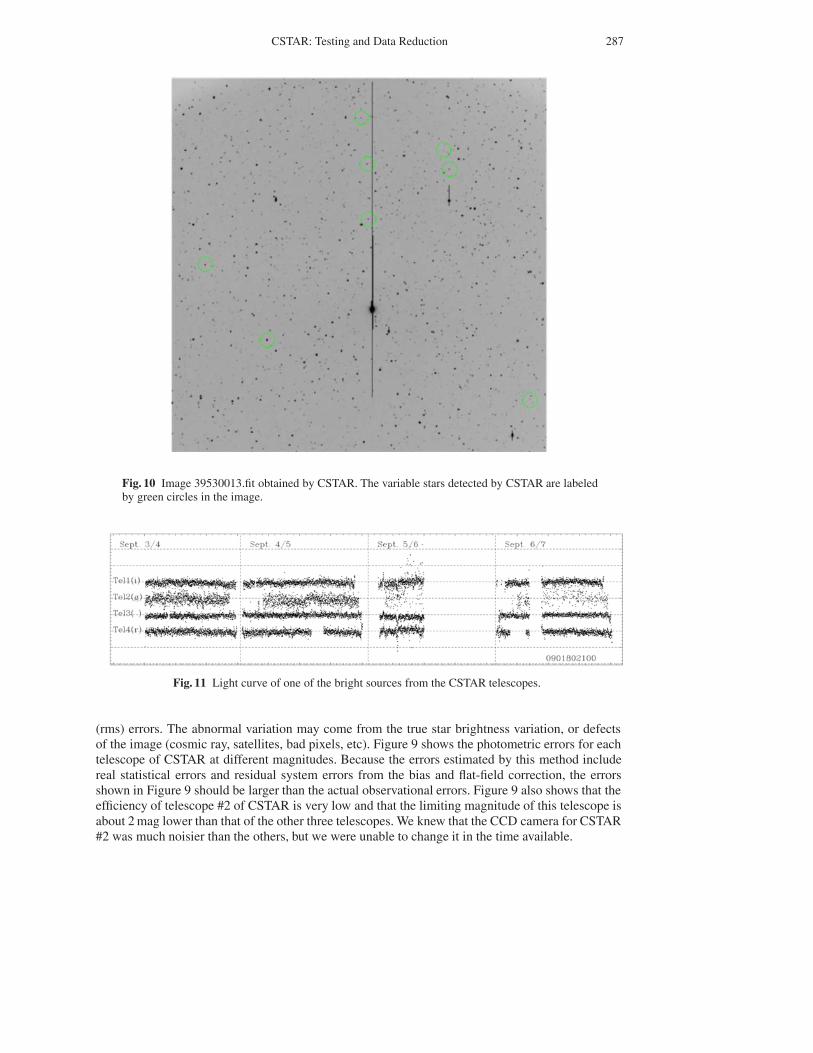
Fig. 10 Image 39530013.fit obtained by CSTAR. The variable stars detected by CSTAR are labeledby green circles in the image.
Fig. 11 Light curve of one of the bright sources from the CSTAR telescopes.
(rms) errors. The abnormal variation may come from the true star brightness variation, or defectsof the image (cosmic ray, satellites, bad pixels, etc). Figure 9 shows the photometric errors for eachtelescope of CSTAR at different magnitudes. Because the errors estimated by this method includereal statistical errors and residual system errors from the bias and flat-field correction, the errorsshown in Figure 9 should be larger than the actual observational errors. Figure 9 also shows that theefficiency of telescope #2 of CSTAR is very low and that the limiting magnitude of this telescope isabout 2 mag lower than that of the other three telescopes. We knew that the CCD camera for CSTAR#2 was much noisier than the others, but we were unable to change it in the time available.
288 X. Zhou et al.
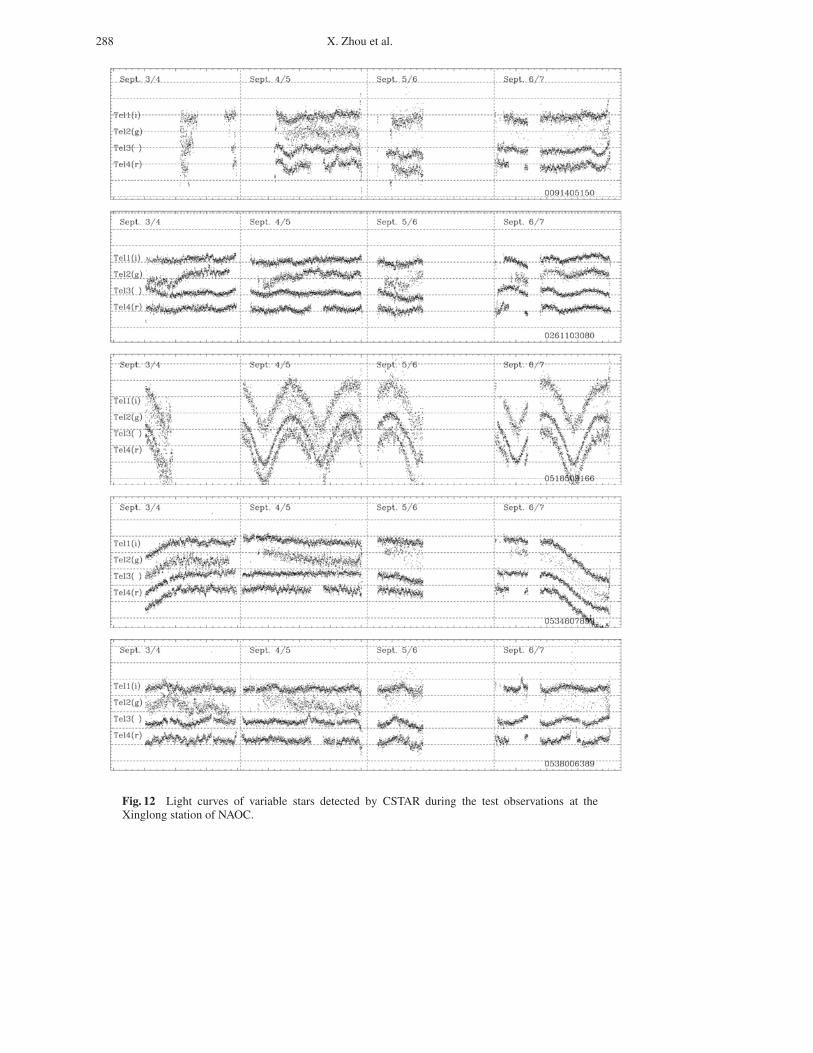
Fig. 12 Light curves of variable stars detected by CSTAR during the test observations at theXinglong station of NAOC.

CSTAR: Testing and Data Reduction 289
Fig. 12 — Continued.
Figure 10 shows the image 39530013.fit obtained by CSTAR during the test observations atthe Xinglong station of NAOC. As an example of the data obtained, the light curve of one of thebright stars from the four CSTAR telescopes is shown in Figure 11. The main scientific objectivesof CSTAR are to assess the site quality of Dome A and to study the variable objects in the region ofthe South Pole. The variable stars detected by CSTAR are labeled by green circles. The light curvesof those variable stars are presented in Figure 12.
4 CONCLUSIONS
CSTAR, China’s first Antarctic astronomical instrument is described. CSTAR is composed of foursmall Schmidt-Cassegrain telescopes. Each telescope has an effective aperture of 100 mm and afield of view of ∼ 4.5◦ × 4.5◦. Three of the four telescopes are equipped with g, r, i filters, and thefourth one is filter-less. A frame-transfer Andor DV435 1k×1k CCD is used as the detector on eachtelescope. A specially designed control computer for each telescope is used for data acquisition anddata reduction.
Low-temperature laboratory testing demonstrates that the telescopes and the CCD can workunder extremely low temperatures (down to nearly −80 ◦C ), while the control computer can work attemperatures as low as −30◦C . Actual test observations at Kalasu in the Xinjiang Pamirs indicatedthat the CCD and control computer can work at these low temperatures and under low atmosphericpressure conditions.
290 X. Zhou et al.
‘Super’ bias and ‘supersky’ flat-field images were obtained during the test observations at theXinglong station of NAOC. These test observations and the subsequent data reduction indicate thatCSTAR can work stably and obtain a large volume of scientific data. A special data reduction methodwas used to derive the observational errors for each of the objects detected by CSTAR. The datareduction process is done automatically in real time, and a catalog of the brightest star from 1/3of the images obtained are prepared for further data transfer via iridium satellite communication.Finally, eight variable stars were detected by CSTAR during the test observations.
Acknowledgements This work was supported by the National Natural Science Foundation ofChina (Grant Nos. 10873016, 10633020, 10603006 and 10803007), and by National Basic ResearchProgram of China (973 Program, No. 2007CB815403). We thank our colleagues at the University ofNew South Wales, Australia, for assistance in editing this paper.
References
Fan, X. H., et al. 1996, AJ, 112, 628Fukugita, M., et al. 1996, AJ, 111, 1748Lawrence, J. S. Ashley, M. C., Tokovinin, A., & Travouillon, T. 2004, Nature, 431, 278Stetson, P. B. 1987, PASP, 99, 191Storey, J. W. V., Lawrence, J. S., & Ashley, C. B. 2007, Revista Mexicana de Astronomia y Astrofisica
Conference Series, 31, 25Wu, Z. Y., et al. 2007, AJ, 133, 2061Yang, H. G., et al. 2009, PASP, 121, 174Yuan, X. Y., et al. 2008, SPIE, 7012, 152Zhou, X., et al. 2004, AJ, 127, 3642