testing of freeze thaw and deicing salt resistance …sept.org/techpapers/492.pdf · testing of...
TRANSCRIPT

Testing of Freeze Thaw and Deicing Salt Resistance Prot. Dr. Max J. Setzer, University Essen, Building Physics and Materials Science, Germany Dipl.-Ing. Rainer Auberg, University Essen, Building Physics and Materials Science, Germany
SUMMARY
For a sufficiently reliable acceptance criterion the results of any test procedures must be reproducible, independent from the testing institute and precise (low scattering). Therefore, RILEM TC 117 FDC (Freeze thaw deicing resistance of concrete) decided that any test procedure should prove its precision following ISO 5725. In this contribution, the essentials of basic research on freezing of pore water in concrete are outlined and the consequences for a test procedure are given. A procedure meeting the prerequisites has been developed, the CDF test (Capillary suction of Deicing chemicals and Freeze thaw test). It also fulfils the special needs of testing dry concrete block testing. It is designed to be simple in handling, fast and acceptable in price. On the basis of a large test program, a CDF resistance limit can be defined. By several international round robin projects with plastic mixes precision has been substantiated. An acceptance criterion can be proposed, For concrete blocks precision and correlation of the CDF test and Swedish Standard procedure can be estimated by an international round robin test and by a comparison test program.
1. INTRODUCTION
In most standards and technical recommendations, freeze thaw and deicing salt resistance of concrete is achieved by defining the mix design parameters such as water cement ratio and entrained air (description concept) (e.g. in [4,5]). In concrete block production, where dry concrete mixes are used, these rules are not fully applicable and more importantly cannot be replaced by other adequate general limitations of design parameters. Instead there exists a local long term experience of the different manufacturers which, however, is not a reliable quality assessment for the user. Therefore, the freeze thaw and deiCing salt resistance has to be tested directly (performance concept). There are some test procedures proposed for this aim. However, any test procedure must meet some prerequisites to prove its reliability: I. The test must be precise enough.
The risk for both the supplier and the client with respect to an unjustified test result must be minimised by a sufficiently precise procedure. To avoid the costs not justified by production, the scattering of test results has to be caused mainly by the changes and variations of the product and not by the scattering of the test procedure itself. Otherwise the costs of production are increased merely to guarantee an acceptable result of an inaccurate test. The safety margin and therefore as a rule the cement content must be increased due to the test and not due to uncertainties of production. Precision can be proved following ISO 5725 "Accuracy (trueness and precision) of measurement methods and results" [1]. Therefore, this standard is recommended by RILEM TC 117 FDC "Freeze Thaw and Deicing Salt Resistance of Concrete" for assessment of precision [7].
II. The test has to be correlated to durability under practical conditions. III. The test must be adequately applicable for the special needs of concrete blocks.
There is one essential difference between plastic mixes and dry concrete production: whereas plastic concretes that are freeze thaw resistant are sufficiently water tight, since for both a low water cement ratio is required, this cannot be expected for dry mixes. To assure the requirements of shape and dimension in concrete block production, the content of mixing water is adjusted as a rule where the maximum green strength is reached. However, if the content of mixing water is even slighlly below this maximum concrete is no longer watertight, although these blocks are in most cases freeze thaw and deicing salt resistant by practical experience. In testing the durability of blocks the water permeability has to be taken into account. If the deicing solution is on top it will be drained into the block or through the block. Frost damage is no longer restricted to the surface This leads to unpredictable - and unwanted - test results.
In the authors' opinion the prerequisites I and II have to be proved for any procedure and III for a block testing procedure before application. However, for freeze thaw and deicing salt testing in most cases, even in standardised procedures, they are not reliably substantiated. It is the aim of this article to present some data here. In addition to precision and to correlation to practice a test procedure should be simple in handling. The cost of personnel should be low and the procedure as fast and as cheap in equipment as possible.
- 76 -

For 3 test procedures we have data to evaluate precision for concrete blocks: ONORM, the Swedish Standard (slab test) and the CDF test. Following a RILEM TC 117 FDC recommendation, Swedish Standard, the CDF test and the cube test should be studied in the future [7). Out of these only the Swedish Standard and the CDF test use one concrete surface as the tested area, whereas in the cube test the specimens are completely immersed and thus all outer surfaces tested. In addition, in the cube test the shape is restricted to a cube of 10 x 10 x 10 cm. Therefore, this test is not discussed further here for concrete blocks. Adequate and precise testing of freeze thaw as well as of freeze thaw and deiCing resistance of concrete is embarrassed by the complicated freezing of pore water as found in [19). Therefore, for a better understanding some major points are oullined first. In the next section the differences of the three procedures ONORM Swedish Standard and CDF test are oullined. A short description of the methodology of ISO 5725 is given and the results for concrete blocks reported.
2. FINDINGS OF BASIC RESEARCH RELEVANT FOR FREEZE THAW TESTING
2.1. Material properties of concrete and pore water
2.1.1. Pore size distribution and pore water Concrete and especially the matrix out of hardened cement paste are characterised by a special pore structure that is completely different from other building materials.
As found in Table 1 we [18) distinguish between empty coarse pores, capillaries containing more or less macroscopic bulk water depending on environmental conditions and gel pores containing water unfreezable above -20°C. At -20°C usually more than 60% of pore water remains unfrozen. This leads to a remarkable transport in the submicroscopic structure of hardened cement paste. The characteristics of pore water are caused by the physical interaction between the solid matrix with pore water via the intemal surfaces. Therefore, these phenomena increase with decreasing pore size, which finally generates a type of pore water in the gel pores which behaves completely differently from usual bulk water. As seen in Figure 1 the freezing point is depressed below -20°C even without deicing chemicals. For more details see [8).
2.1.2. Deicing chemicals
The influence of deicing chemicals is superimposed to the disturbance by the solid matrix. Therefore, the freezing point is additionally decreased. Since ice contains almost no extraneous elements, the concentration of the unfrozen liquid increases with the amount of ice formed. The gap between formed ice and unfrozen pore water is increased by deicing salt (Figure 1). Since the freezing paint of capillary water is also lowered, there exists a pOint of maximum damage approximately at 3% sodium chloride solution. Beyond this point the amount of freezable water at -20°C again decreases. In addition, the hygroscopic point, i.e. the relative humidity below which water condenses or does not evaporate, is also decreased by dissolved salts [8).
Table 1. Classification of pores and pore water [18) Type Minimum char. Type of pore water
dimension (hydraulic radius)
Coarse pores > 1 mm Empty Macro capillaries > 30 ~lm Bulk water, freezable, fast removed and
refilled. Nearl"l'no suction heipht. Meso capillaries > 1 ~lm Bulk water, freezable, remarkable suction
height. Filling within days. Micro capillaries >30 nm Bulk water, freezable, extreme capillary
(>0,03 ~lm) pressure, but highly increased intemal friction. Meso gel pores > 1 nm Prestructured water, evaporating until -50% r,h.,
not freezable above -23°C.j181
Micro gel pores > 0,03 nm Structured water, highly disturbed, not freezing under normal conditions. [181

n:l E ..... Q) .r: -o "'0 C
0,2
q> 0,1 en
~ S
structured -1--- prestructured --I bulk
0,00
-60 -40 -20 o Temperature 0 C
Figure 1. Low temperature gifferential ~canning falorimetry (DSC) plots of hardened cement paste immersed in NaCI-solutions of 0%, 1 %, 3% and 20% concentration. Each peak is caused by a phase transition of pore water. The regions of freezing of capillary bulk water and of prestructured and structured gel water are indicated for 0% solution. The minimum temperature of -20 ± O.SoC of CDF test is marked as well as the admitted region of slab test -16 C to -20°C, which is
typical in many test procedures. It is easily seen that the amount of frozen water of a 3% deicing solution is drastically affected by such uncertainties [8).
2.2. Influence of production and material on pore size distribution
The pore size distribution is generated by various influences. Gel pore distribution is only affected by the chemistry during hydration of cement and of chemically reacting hydraulic additives such as slag, fly ash or silica fume. Capillary pores are generated by the surplus water not needed for hydration. Their amount decreases with water cement ratio and the degree of hydration. Since both are controlled by production process and by mix design and since capillary pores contain most of the freezable water, design rules are in many cases applicable for making frost and deicing salt resistant concretes. However, since the parameters increase, e.g. with hydraulic additives, the rules do no longer fit in many cases; a test is needed. There are in addition air-filled pores by compaction and by artificially entrained air. The special compaction of dry concretes can lead to very small compaction pores similar to air pores generated by an air entraining agent.
2.3. Consequences for testing
Essential conclusions for freeze thaw and deicing salt testing can be drawn from basic research. I. The amount of freezable water must be controlled as precisely as possible. A content similar
to practical conditions must be reached. In the CDF test this is done by capillary suction of the water or deicing salt solution for 7 days. The specimens have been softly dried before at the outer surface so that no more freezable water is contained (21 days at 20°C and 65% relative humidity). After the capillary suction process a water content comparable to practical conditions as shown in [17) is reached.
II. The amount and concentration of deicing salt solution in the pore system must be controlled. In the CDF test this is reached by capillary suction, not of water but of deicing solution and herewith resaturation not with pure water but with a solution of a defined concentration. If the
- 78-
resaturation is done with water - as e.g. in the Swedish test - the deicing chemicals are taken up by both diffusion and by later suction in an uncontrolled way. This leads to additional damage as shown by Miura [10] and to an increase of scattering as can be analysed from the round robin tests of Plahn and Golz [11]. Therefore, capillary suction of the deicing salt solution improves the precision of the test.
III. The temperature regime of the freeze thaw cycles must be controlled as precisely as possible.
Deviations can drastically change the amount of frozen water even in specimens with the same degree of saturation. If reproducibility and repeatability are required - they define the precision - then strict rules are mandatory for testing. In the CDF test the precision of temperature the regime is reached by a test chest where heat is transferred not by air but by liquid.
3. CHARACTERISTICS OF TEST PROCEDURES
Three test procedures are discussed here: two national standardised ONORM 8 3303 [3,2], Swedish Standard (Slab test) [6] and a test recently developed from basic research results, the CDF (Capillary suction of Deicing chemicals and Freeze thaw test) method [15]. All methods have in common that one surface of the specimen is tested. Precuring of the specimens has been the same at all procedures and test runs, i.e. 21 days at 20°C and 65% r.h.
3.1. Tested surface and test liquid
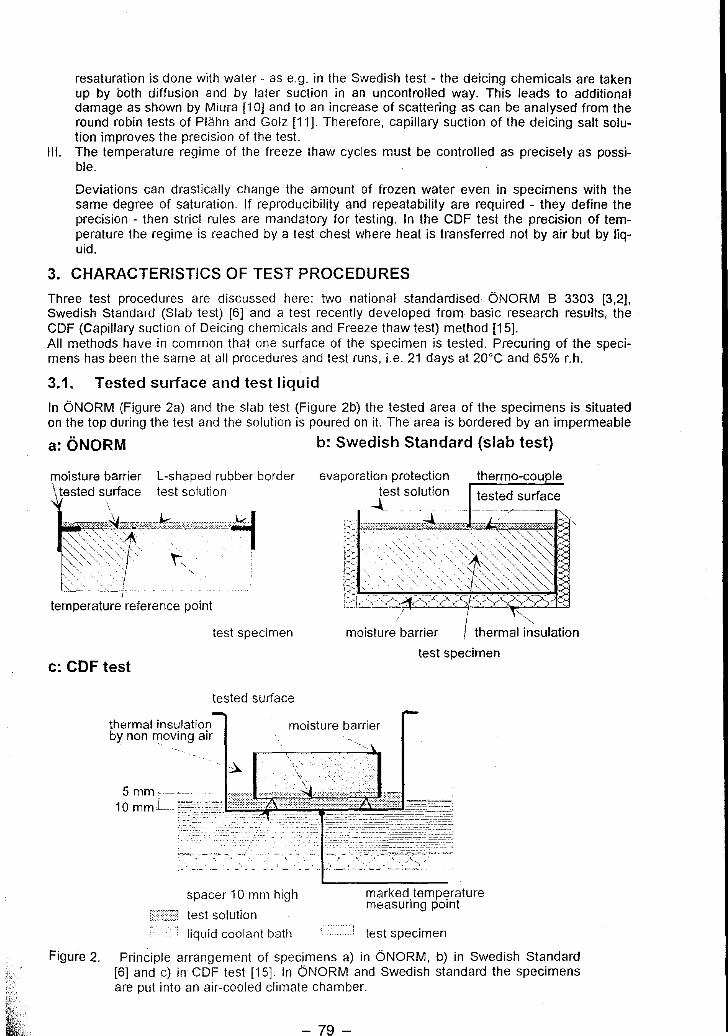
In ONORM (Figure 2a) and the slab test (Figure 2b) the tested area of the specimens is situated on the top during the test and the solution is poured on it. The area is bordered by an impermeable
a: ONORM b: Swedish Standard (slab test)
moisture barrier L-shaped rubber border ~ tested surface test solution
\
~:r,~;g,,-" I " '-
temperature reference point
test specimen
c: CDF test
tested surface
moisture barrier
thermo-cou Ie
tested surface
test specimen
moisture barrier
spacer 10 mm high
test solution liquid coolant bath
marked temperature measuring point
C.' ...., test specimen
Figure 2. Principle arrangement of specimens a) in ONORM, b) in Swedish Standard [6] and c) in CDF test [15]. In ONORM and Swedish standard the specimens are put into an air-cooled climate chamber.
- 79 -

rim. As mentioned above, even freeze thaw and deicing salt resistant concrete blocks are not necessarily water tight in contrast to plastic mixes. In this case, the solution is rapidly drained and not kept on the surface. Since drainage during the test is rather uncontrolled the scaling of the surface layer gives unpredictable results and an unpredi'ctable internal damage of the block can also occur. Following ONORM the bottom layer of the bfocks is sealed additionally. However, the results change drastically with respect to unsealed bloc'ks (20). In slab test this sealing is done in each case. The CDF method (Figure 2c) was originally developed [20,17) to exclude this unwanted drainage phenomenon, During capillary suction and freeze-thaw cycles the specimens are stored with the test surface inverted in stainless steel containers. They are placed on 10 mm high spacers. The level of the liquid is kept at 15 mm so that the specimens dip in 5 mm. Especially for concrete blocks it has been shown (20) that after 7 days of suction the specimens reach a degree of saturation as in practice.
3.2. Uniaxial thermal attack
During the freeze-thaw cycles in ONORM, heat transfer is possible over all surfaces of the specimens leading to a non-uniform and, due to the different heat capacities of liquid and concrete, uncontrolled thermal distribution in the specimens. In Swedish Standard the lateral surfaces are thermally insulated in addition. In the CDF method thermal insulation is reached by the geometry. The non-moving air in the containers acts as an insulator, whereas the heat flux is regulated by the liquid bath where the containers are dipping in.
3.3. Temperature regime and cooling equipment
a:ONORM b: Swedish Standard (slab test)
20
~ 10 (j)
C5 ro Q; 0 0.
E ~ -10
-20
h \
I----! \
o
C:CDF test
o
;)\
6
6
12 Time (h)
12
Time (h)
(i
,/
" 18
18
::}
,)
24
24
- 80 -
20
~ 10 (j)
" ro ill 0 0.
E ~ -10
o
Figure 3:
6 12 Time (h)
24-hour temperature regime of a) 6NORM, b) Swedish standard and c) CDF test.
18 24
The permitted temperature range is plotted as shaded area. (In CDF test it is +- 0.5 K)

The cooling and heating in ONORM and the slab test is done by an air-cooled chamber. The temperature regimes are plotted in Figure 3. It should be noted, however, that even the rather moderate demands can scarcely be reached by the recommended test chamber even by skilled operators. In the CDF test the ONORM freeze thaw cycle has been adopted and reduced to 12 hours. The deviation from the regime shall not exceed.:!: 0.5 K at a marked measuring point. This is reached by cooling with a liquid and its 4000 times higher heat capacity related to volume than air. The containers dip into the cooling bath.
3.4. Evaporation during the test
In Swedish Standard evaporation of the deicing solution is prohibited by a plastic sheet on top. (However, the air between liquid surface and cover also acts as thermal insulator). In the CDF test evaporation is prohibited by geometry due to the inverted position of test area.
3.5. Measuring scaled material
In all procedures the deicing solution with scaled-off material is poured off and the scaled material is filtered and dried at 105°C. The total weight of dried material related to the tested area is the test criterion. Loosely adhering particles are removed by brushing in ONORM and Swedish Standard - which is not easily done in a defined way. Due to inverted position of the tested area in the CDF method, the containers can be put into an ultrasonic bath to unbind the adhering material.
4. STATISTICAL BASIS (ISO 5725)
Test procedures with presumably identical materials and under presumably identical circumstances do not yield identical results. Precision refers to the closeness of agreement between test results and can be assessed following ISO 5725 [1] by evaluating round robin tests. It is characterised herein by the terms repeatability and reproducibility. It is measured by the repeatability or reproducibility variances s2, the standard deviations s and the coefficients of variation v. Repeatability refers to measurements made under repeated but as constant as possible boundary conditions, i.e. "where independent test results are obtained with the same method on identical test material in the same laboratory by the same operator using the same equipment within short intervals of time" ([1] part 1, page 6). With repeatability one achieves generally speaking the minimum of variability. Repeatability is derived from the variability of materials and variability of test procedure. They cannot be separated by experiment. However, if material variability can be kept small enough, variability of the test procedure dominates. Reproducibility refers to measurements made under widely varying conditions, i.e. "where test results are obtained with the same method on identical test material in different laboratories with different operators using different equipment" ([1]part 1, page 6). By reproducibility the maximum scatter is found. Reproducibility consists out of repeatability and the variation between laboratories. Therefore out of repeatability and reproducibility the between laboratory variability can be calculated. Variance is the mean square deviation of results from mean value. The variances si2 of the different factors contributing to total variance St2 can be added if independence assumed. Especially reproducibility variance sR2 includes repeatability variance sr2 and between laboratory variance sL2
, , , s;, = s,: + s,- (1 )
Repeatability - and therefore reproducibility - variance contains both material and test procedure variance. In a production control a test procedure should have a definitely smaller variance than the variance of a production. Otherwise the safety margin and herewith the cost of a production control would be determined by the test procedure and not by the real production process. However, for the assessment of the precision of a test procedure, the materials variance must be smaller than the variance of the test procedure itself. Therefore, in a round robin test the uniformity of tested concrete material is a serious challenge. The standard deviation is the square root of variance S2, the coefficient of variation is the standard deviation divided by the mean value m.

In contrast to variance they cannot be simply added or subtracted. If several scattering parameters contribute, the largest is dominant. If the scattering of one parameter is below 50% of the largest it can hardly be detected quantitatively any longer. This aspect is important if either material scattering or test scattering should be assessed as the relevant parameter. In addition the repeatability value r (and the reproducibility value R) is defined by the level below which the absolute difference between two single test results is found with a confidence level of 95% certainty and obtained under repeatability (and reproducibility) conditions
/.='). "i. f7 - ') 8." - V1. v"\- ...... -~ '>r (2)
As a rule, a correlation between the coefficient of variation v and the mean scaling m is found:
S ( /J1 )" \'--- V -. - 117 - (I 117,.,
(3)
In this equation mo is the mean value at an acceptance criterion and Vo is the coefficient of variation at this value. The exponent e shows how fast the coefficient of variation decreases (e<O) or even increases (e>O), if the mean scaling or equivalently the number of cycles increases. e=O means that there is no change.
5. TEST PROJECTS
5.1. Plastic concrete mixes and the CDF test
For the CDF test both a resistance limit and the precision following ISO 5725 are evaluated for plastic concrete mixes [13).
5.1.1. COF Resistance Limit
The resistance limit has been found by evaluating 140 different kinds of concrete mixes. Six different types of cement, different aggregates and additives were used in various designs. Therefore a broad and systematically selected spectrum of constructive concretes as used in practice has been tested. In the Ph.D. thesis of Hartmann [9). the results of the first 90 series are described in detail. The other data are given in [12). By evaluating the parameters air-void content, L300 content and spacing factor characteristic for freeze thaw and deicing resistance and by comparin~ them with the scaling in the CDF test, a reliable CDF resistance limit can be given at 1500 g/m as mean value after 28 freeze thaw cycles.
5.1.2. Precision of the COF Test
Additionally precision was assessed by analysing more than 400 internal tests, 1 internal round robin test, 26 comparison tests between Universities of Essen and Weimar and 3 international round robin tests [13). At the CDF resistance limit the repeatability coefficient of variation was found to be 11 %, the between laboratories coefficient of variation 14 % and a reproducibility coefficient of variation 18 %. This is an excellent result for freeze thaw testing and comparable to concrete strength testing. The data following eq. 3 are given in Table 2. Herewith the coefficients of variation can be calculated at other scaling levels.
5.1.3. Acceptance criterion of the COF test
With the CDF resistance limit and the repeatability coefficient of variation an acceptance criterion for the CDF test with 5 specimens after 28 cycles can be proposed to 1800 g/m2 as an upper 5 % fractile.
Repeatability Between Reproducibility laboratory
e -0.329 -0.26 -0.288
vo 10.39% 14.03% 17.51%
Table 2. Parameters of correlation between coefficient of variation and relative mean scaling for plastic concrete mixes corresponding to equation 3.
- 82-

10000 ,---------------------------,-------------,--------------,
N < E 1000· .~--.-.---. . c, c .2 ~ .s: 100 Q)
o "E '" -g 10 2 I/)
10
..... --.~- ... -.~.-------.. ~--__::P_;;_----------__l
/~D
;~ot /lCF--~-
/- . ..; .... __ . __ .- -~- .. ----~
: I : I
100 1000 10000
Mean Scaling g/ml\2
Figure 4. Standard deviation as function of mean scaling of ONORM test [20]
5.2. Results for concrete blocks with the CDF test, ONORM and the Swedish test
5.2.1. ONORM
The data for the precision of ONORM are taken from a test program in 1988 [20,17]. Two different types of concrete blocks (denoted C, I) have been produced and tested both with sealed and unsealed bottom (see Table 2). In Figure 4 the standard deviation s is plaited versus the mean scaling m in a double logarithmic scale. A linear relation is clearly seen in this plot proving a correlation as in eq. 3. For ONORM the acceptance criterion 111() is 100 g/m2 after 50 cycles. With this value we find for vo = 58 % and for e = 0.11. Since e is greater than zero the even insufficient result for the coefficient of variation at the acceptance level becomes worse with increasing scaling and therefore with increased number of cycles. I.e. a longer duration does not increase but decrease the precision. The values can be used as data for repeatability coefficient of variation. Due to this result ONORM was not studied further.
5.2.2. International round robin test with Swedish standard and the CDF Test
In Figure 5 the increase of scaling of all single concrete blocks of one manufacturer tested in the international round robin project is plotted for both slab test and CDF test. Since the amount of scaling of the same material is different in the two tests, the scaling is plotted relative to the resistance criteria which is given by Swedish standard [6] for the slab test at 500 g/m2 (calculated for 28 cycles) or by the above mentioned procedure for the CDF test at 1500 g/m2 . A uniform linear increase with the number of freeze thaw cycles is observed in both procedures. No extraordinary deviation for one single specimen (straggler) is observed. The relative increase is rather similar, showing a not too bad correlation between the two resistance limits. However, the scattering in the slab test is apparently much larger. Therefore, the danger of failing the slab test even for these - in the mean value - very good blocks cannot be neglected. A separation of different qualities is not easy with the slab test. The risk for both producer and client is not small. Two types of blocks were manufactured for the international round robin test by two industrial manufacturers. 8 international institutes joined the project for the CDF test and 6 for the slab test.
Type 25 cycles 50 cycles Mean Std. dev. Mean Std. dey.
I - sealed 90 91 I - unsealed 122 100 196 178 C - sealed 920 520 C - unsealed 692 497 1263 801
Table 3. Mean scaling of the I and C concrete block types tested by the ONORM
_ A"l _

a: Slab test
100%
a 80% .1 .. a
Ii)
E OJ
60% c rn u (f)
40% (]) t .::: 10 iii 20% c::
0% "I.
0
b: CDF test
100%
a a 80% Ii) ~
E OJ 60% .!:: rn u (f) 40% (])
> ~
20% (])
c::
0% 0
• 5
5
··---------------r-------------r---;
I -I -- ------- --L- -------+----+-----1
I + ------L:-----+---·--I I I :
-i-j- Hc-.----l--------I Ir . = • J: ____ +---__ : ~
•
10 15 20 25 30 Number of Freeze Thaw Cycles
10
--'------------1---I
c---------f -- ----+-------1 !
------j-----1
I 1------------j-----~-i • I _____
I J-~:::t:r~i-J
15 20 25 30 Number of Freeze Thaw Cycles
Figure 5. Relative scaling of all concrete blocks tested in the round robin project either by Swedish Standard - slab test - (a) or by the CDF test (b) at various international institutes. The significantly higher scattering of the slab test results with respect to CDF is already seen.
Since blocks were used out of a regular production the materials scattering was the most serious problem, although the single blocks were selected with great care with respect to uniformity. Therefore, it is not surprising that both repeatability and reproducibility are increased with respect to the laboratory manufactured plastic mixes reported above. Nevertheless, the results can be evaluated sufficiently well following ISO 5725. The coefficients of variation of reproducibility, between laboratory variations and repeatability, respectively, are shown in figure 6 for both slab test an CDF test. For a better comparability of the results the relative mean scaling is also used here. The precision data of both procedures are found in Table 4.

a: Slab test
60% c 0 50% .. IG '':
40% IG > .... 0 30% .... c I
C!I 20%
r-'j)
if: C!I 10% 0 r----u I
0% L-0%
b: CDF Test
60% r----c i
I 0 50% t··· .. ! IG '':
40% i-~ 1 .... I • 0 30% t----- .. ....
C .!!! 20% u i-'
if: C!I
10% 0 r" U
0% i -+~-.--- .. - -
0%
.. -
I
10%
- .. . - - ..... !-
10%
20%
::--::::-::::====b=-=---!IReproducibility _--+---1 Between lab.
Repeatability
I --- ----------~------r----I
I --- -- ---r---------- --1-----1------1
30% 40% 50% 60%
Relative Mean Scaling m/500
20% 30%
··-T-- .------1-----1
I + --------1----; I I I I
Reproducibility Between lab.
'---::;:,...-f==--I Repeatability
40% 50% 60%
Relative Mean Scaling m/1500
Figure 6. Coefficients of variation at a) slab test and b) CDF test as function of the relative mean scaling, Le. the mean scaling divided by the acceptance criterion 500 g/m2 in the slab test and 1500 g/m2 in the CDF test.
For the CDF test the coefficients of variation of plastic mixes can be calculated at the relative scaling of (30 %) out of the precision data given above. It is 25 % for reproducibility, 19 % for between laboratory variation and 15 % for repeatability. It is seen in Figure 6b that the repeatability and reproducibility values are somewhat surpassed by the block values denoting that the materials scattering is becoming dominant. However, the between laboratory coefficient of variation is even somewhat smaller than that found in the plastic concrete round robin project. Since the between laboratory scattering does not include materials scattering this shows that the precision of the test itself is still high and equivalent to plastic concrete testing. In the slab test all the equivalent values are substantially higher (nearly doubled). Here the scattering of the test procedure itself is high. It is unacceptable since changes in materials and production scattering are undetectable and masked by the test scattering even under conditions which are similar to an excellent production, but nevertheless inferior to normal laboratory conditions claimed for round robin tests .. The difference between the two procedures can be calculated. However, it must be kept in mind that only variances s2 and therefore the v2 at one mean level can be added or subtracted linearly. The increase of the coefficient of variation between the two procedures 6V at one scaling level can then be calculated by
~ 2 2 L'\ v = VSlahk',' - v CDF

Specification
Series A
Series B
Mean values A,B
Plastic concrete
Table 4.
Procedure
CDF test
Slab test
!1v
CDF test
Slab test
!1v
CDF test
CDF test
Relative scaling level
mrelative= 450/1500 = 30%
mrelative= 150/500 = 30%
mrelative= 450/1500 = 30%
mrelative= 150/500 = 30%
mrelative= 450/1500 = 30%
vr vR vL
22% 25% 14%
31% 46% 33%
22% 39% 30%
47% 54% 27%
65% 72% 40%
45% 48% 30%
15% 25%
Statistical evaluation of the two international round robin tests with concrete blocks of producer A (Series A) and of producer 8 (Series 8) following ISO 5725 where vr denominates the repeatability coefficient of variation, vR the reproducibility coefficient of variation and vL the between laboratory coefficient of variation. The coefficients of variation have been used instead of standard deviations for better comparability of the two procedures. In addition, the statistical difference between the coefficients of variation !1v as defined in the text are given. The data for plastiC concrete mixes at the same scaling level are given for comparability. The mean value for the coefficients of variation is only useful for the between laboratory coefficient of variation, which does not contain materials scattering.
In the beginning it was intended to test bad and good concrete block quality. However, due to the great efforts in controlling the production process even the 'bad' blocks reached a high resistance in both the Swedish test and the CDF test. The difference is now more in the materials scattering. The precision can only be given for this level.
5.2.3. Correlation Testing Swedish Standard - CDF Test
In a project sets of concrete blocks from 26 different producers out of the normal production process are tested following Swedish Standard and the CDF test strictly in parallel. Now 11 tests have been finished. Out of these data a correlation factor fe,s can be found
~ 1800 -N
E --~ 1500 "_. U; Q.l
1200 ";' u.. 0 () 900 Ol
~ 600 ro () • (f)
c 300 ro <ll ~
0 0
f ~ menr/ c.s /mss
•
100 200 300
Mean Scaling - Slab Test [g/m2]
I i L-
400 500
Figure 7. Comparison of mean scaling in g/m2 of Slab test and of CDF test for concrete blocks of different producers.
- fiR

Out of the evaluated data a guess can be given for (., = 3.7. However, it must be kept in mind
that this factor is only applicable for the special testing conditions used. For the slab test it is feared that under slightly different conditions the results are no longer comparable. For the CDF test the independence is proved by the assessment of the reproducibility. That means that the CDF resistance limit of 1500 g/m2 is equivalent to 405 g/m2 in the Swedish Standard. Taking into account the scattering of the slab test, the correlation is excellent also under practical aspects.
6. CONCLUSIONS
In a round robin test of concrete blocks the most serious problem is the high scattering of materials compared with the scattering of materials of laboratory manufactured concrete. Nevertheless, the precision and suitability of test procedures can be assessed following ISO 5725. ONORM B 3303 had a too high scattering to meet the needs of appropriate quality control or standardisation. It is not further studied. Problems arise when the concrete blocks are not watertight. Even sealing the bottom side too is not a straight-forward solution. Swedish Standard is cheap in equipment, but time consuming and not sufficiently precise. For constructive concretes an assessment of precision following ISO 5725 is not yet given. In a CEN round robin test for plastic concrete mixes, the comparability proved to be not yet sufficient [19]. Research work is still being carried out to improve it. For concrete blocks serious and often problems arose in our testing with the slab test since for a reliable test a watertight concrete is prerequisite. While plastic concretes are watertight in any case, if they are freeze thaw resistant, this demand cannot be fulfilled for concrete blocks made out of dry mixes although the blocks will prove to be resistant to freeze thaw and deiCing chemicals in practice. The CDF test at the moment requires a special test equipment. However, it can be run by even untrained personnel with the smallest amount of time and with reliable and comparable results. It is doubled in speed with at least doubled precision and less than half the labour costs. The precision for constructive concretes is proved. An acceptance criterion can be proposed even as 5 % fractile to 1800 g/m2 after 28 cycles, i.e. after 14 days. The CDF test procedure has originally been designed for concrete blocks, slabs and curbs out of dry mixes. It is suitable for this purpose even for not watertight or even water draining concrete products. For no other test procedure comparable good data are published for precision. A correlation to the wide spread slab test can be given.
7. ACKNOWLEDGEMENT
The authors want to thank BDB (Bundesverband der Beton- und Fertigteilindustrie). FTB (Forschungsgesellschaft der Transportbetonindustrie), Mr Fritz - Fa. Zapf, and the manufacturers for supporting the projects. Basic research has been supported by DFG (Deutsche Forschungsgemeinschaft). The stay at the conference is sponsored by Firma. Katzenberger, Munich.
8. LITERATURE
1. ISO 5725: Accuracy (trueness and precision) of measurement methods and results. 1990. 2. ONORM B 3306: Prufung der Frost-Tausalz-BesUindigkeit von vorgefertigten Betoner-
zeugnissen. Osterreichisches Normeninstitut, Wien (1982) 3. ONORM B 3303: Betonprufung. Abs. 6.10. Osterreichisches Normeninstitut, Wien (1983) 4. DIN 1045: Beton und Stahlbeton; Bemessung und AusfOhrung, Beuth, Berlin (1988) 5. CEN 206, DIN ENV 206 Beton; Eigenschaften, Herstellung Verarbeitung und GOtenachweis.
(1990) 6. Swedish Standard SS 13 72 44: Concrete testing - Hardened concrete - Frost resistance. 7. RILEM TC-117 FDC - Freeze thaw and deiCing resistance of concrete, report of the 6th
meeting in Quebec, August 1993. 8. BEDDOE, R.; SETZER, M.J.: A low temperature investigation of hardened cement paste
subjected to chloride action. In: Cem. Concr. Res. 18, (1988),249 9. Hartmann, V. Optimierung und Kalibrierung der Frost-Tausalz-PrOfung von Beton CDF
Test. Ph.D. thesis, University of Essen, 1992. 10. Miura, T.: Influence of the curing conditions and wlc on the surface scaling of the concrete.
5th meeting of RILEM TC 117 FDC, Zurich 1992 11. Plahn, J; Golz, W.: Vergleichsuntersuchungen an vier Prufverfahren fOr den Frost-Tau
salzwiderstand. Stra~e und Autobahn 1 (1984) 14 12. Setzer, M.J, Auberg, R.: The characteristics of scaling. Experiences with the CDF test

13. Setzer, M.J.; Auberg, R.: Freeze Thaw and Deicing Salt Resistance of Concrete Testing by CDF Method. to be published in Materials and Structure
14. Setzer, M.J.; Auberg, R.: CDF lest specifications - Revision in parts, to be published. 15. Setzer, M.J.; Hartmann, V.: CDF test specifications. Concrete precasting plant and technol
ogy, Vol 57(6) (1991) pp. 83-86. 16. Setzer, M.J.; Hartmann, V: Improved frost/de-icing salt resistance testing of concrete ele
ments., Concrete precasting plant and technology, Vol 57(9) (1991) pp. 73-82. 17. Setzer, M.J., Schrage, I.: Testing for frost de-icing salt resistance of concrete blocks. Con
crete precasting plant and technology, Vol 57(6) (1991) pp. 58-69. 18. Setzer, M.J.: Interaction of water with hardened cement paste. in: S. Mindess, ed.: Ad
vances in cementitious materials. Ceramic Transactions, American Ceramic Soc .• Westerville, Vol. 16 (1991) p. 415
19. Setzer, M.J.: On the abnormal freezing of pore water and testing of freeze-thaw and deicing salt resistance. In Proceedings of International workshop on the resistance of concrete to scaling due to freezing in the presence of deicing salts. Sainte-Fay (Quebec). August 1993, pp 3-20.
20. Setzer, M.J.: PrUfung des Frost-Tausalz-Widerstandes von Betonwaren. Forschungsberichte aus dem Fachbereich Bauwesen. Universilat GH Essen; Heft 49 (1990)
ADDRESS:
Prof. Dr. Max J. Setzer, Rainer Auberg Universitat GH Essen Lehrstuhl 8auphysik und Materialwissenschaft Postfach 0-45117 Essen Germany Phone: +49 201 183 2690 Fax: +49201 1833968