testing of underwater concrete with anti …...appendices underwater concrete, anti-washout...
TRANSCRIPT
TESTING OF UNDERWATER CONCRETE WITH ANTI-WASHOUT ADMIXTURE RESCON T (FINAL REPORT)
Jan-Åke Grändås
2004-05-04
Vattenfall Utveckling AB U 04:37
Testing of underwater concrete with anti-washout admixture Rescon T (Final Report)
From Report date Report no. Vattenfall Utveckling AB, Concrete Testing 2004-05-04 U 04:37
Author Access Assignment no. Jan-Åke Grändås Open 14000
Client Technical scrutiny Rescon Mapei AS Dag Vollset Vallsetvegen 6 Tomas Sandström
2120 Sagstua Approved by Norway Mats Tegelberg
Search words Number of pages Number of appendices
Underwater concrete, Anti-washout admixture 7 5 Summary
Testing of Rescon Mapei AS’s anti-washout admixture Rescon T (AUV) for underwater castings has been performed at Vattenfall Utveckling AB in accordance with Vägverket’s (the Swedish Road Administration’s) publication number 2002:50. The project was divided up so that Rescon Mapei was responsible for ordering and manufacture of the concrete, and also provided a concretepump. Vattenfall Utveckling AB was responsible for the necessary equipment in the laboratory and for performing the required testing. The testing worked well and all requirements placed on the fresh concrete and hardened concrete were fulfilled .

Table of contents Page
1 INTRODUCTION 1
2 EQUIPMENT 1
3 CONCRETE 1
4 MIXING 2
5 CASTING 2
6 TESTING OF THE FRESH CONCRETE 3
7 INSPECTION AND SPLITTING OF TEST SPECIMENS AFTER 21 DAYS 4
8 TEST LOADING OF CUBES 4
9 DRILLING AND TEST LOADING OF CYLINDERS 5
10 BALLAST CONTENT IN SLUDGE 6
11 SUMMARY 7
12 REFERENCES 7
List of appendices Pages
APPENDIX 1:
APPENDIX 2:
APPENDIX 3:
APPENDIX 4:
APPENDIX 5:
Formwork types
Composite grading curve
Result of level measurements
Photos from the inspection
Test positions for drilling out cores
2
1
3
3
1
Vattenfall Utveckling AB U 04:37
Page 1 (7)
1 Introduction Testing of Rescon Mapei AS’s anti-washout admixture Rescon T (AUV) for underwater castings has been performed at Vattenfall Utveckling AB in accordance with Vägverket’s (the Swedish Road Administration’s) publication number 2002:50. The testing was performed at Vattenfall Utveckling AB, Concrete Testing, in Älvkarleby on 3 February 2004 and was conducted in the laboratory at +20° C. The project was divided up so that Rescon Mapei was responsible for ordering and manufacture of the concrete, and also provided a concretepump. Vattenfall Utveckling AB was responsible for the necessary equipment in the laboratory and for performing the required testing.
2 Equipment Two different types of formwork filled with water were used, type 1 and type 2, the designs of which are presented in Appendix 1. The formworks were manufactured in accordance with the requirements specified in the Swedish Road Administration’s publication number 2002:50. The concrete pump’s pump unit was made by Putzmeister. The diameter of the pipes and orifice valve was 100 mm.
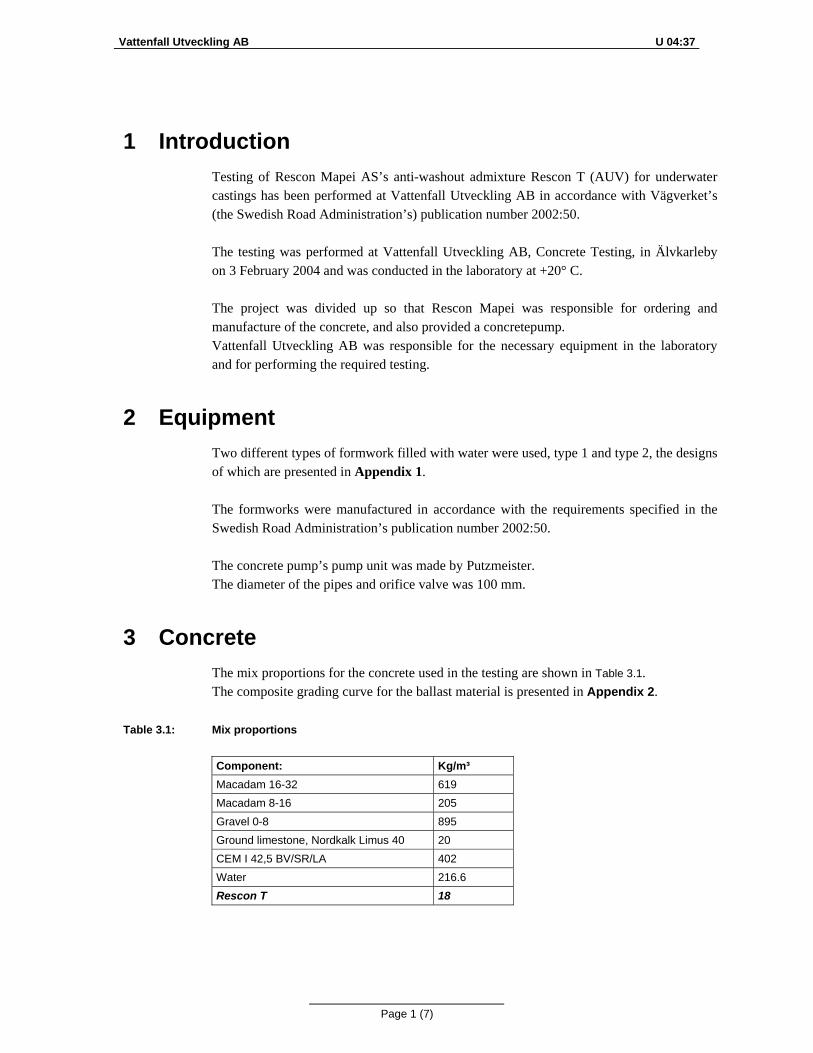
3 Concrete The mix proportions for the concrete used in the testing are shown in Table 3.1. The composite grading curve for the ballast material is presented in Appendix 2.
Table 3.1: Mix proportions
Component: Kg/m³ Macadam 16-32 619 Macadam 8-16 205 Gravel 0-8 895 Ground limestone, Nordkalk Limus 40 20 CEM I 42,5 BV/SR/LA 402 Water 216.6 Rescon T 18

Vattenfall Utveckling AB U 04:37
Page 2 (7)
4 Mixing The concrete was delivered by Grus & Betong in Forsbacka and mixing on the testing date of 3 February 2004 was conducted as follows: • Mixing started at 07:40 hours with the mixing of 1m3 concrete. Ballast, cement and
water were added to the mixer in the normal way. 18 kg of Rescon T were added on the ballast weighing machine.
• After 7 litres of extra water were added, the mixing ended at 07:46 hours and the consistency was measured at 600 mm through measuring the spread on a concrete cake obtained from a slump cone in accordance with SS-EN 12350-2.
• At 07:57 hours, 72 kg of Rescon T (4 x 18 kg) were added direct into the rotator of the concrete-mixer lorry.
• Thereafter, two batches of concrete were mixed each of 2 m3, ready at 08:00 hours and 08:04 hours respectively.
• The concrete was subsequently mixed for 15 minutes in the concrete-mixer lorry. The speed of the rotor was 12.5 rpm.
• The concrete temperature was measured at 18°C. • At 08:35 hours, the consistency was measured as above at 580 mm. The time from when mixing started to when the lorry left the concrete factory was 60 minutes (including testing of the concrete). The transport distance to the laboratory was approx. 50 km. Transport took place in a truck mixer.
5 Casting The test began with the casting of formwork type 1 (with reinforcement). Casting took place in one stage up to approx. 1 metre above the bottom at the short side nearest the tremie pipe. When measuring level 10 minutes after completion of casting, a maximum level difference of 33 mm was measured. The highest permitted value is 50 mm, and the requirement is therefore fulfilled. Time: Event: 09:50 hours Casting starts. 10:05 hours Casting completed, tremie pipe lifted cautiously. 10:15 hours Measurement of level begins from the short side furthest from the casting place. Formwork type 2 (without reinforcement) was cast after formwork type 1. Casting was performed in two stages. The first stage consisted of approx. 600 litres and the second stage of approx. 400 litres.
Vattenfall Utveckling AB U 04:37
Page 3 (7)
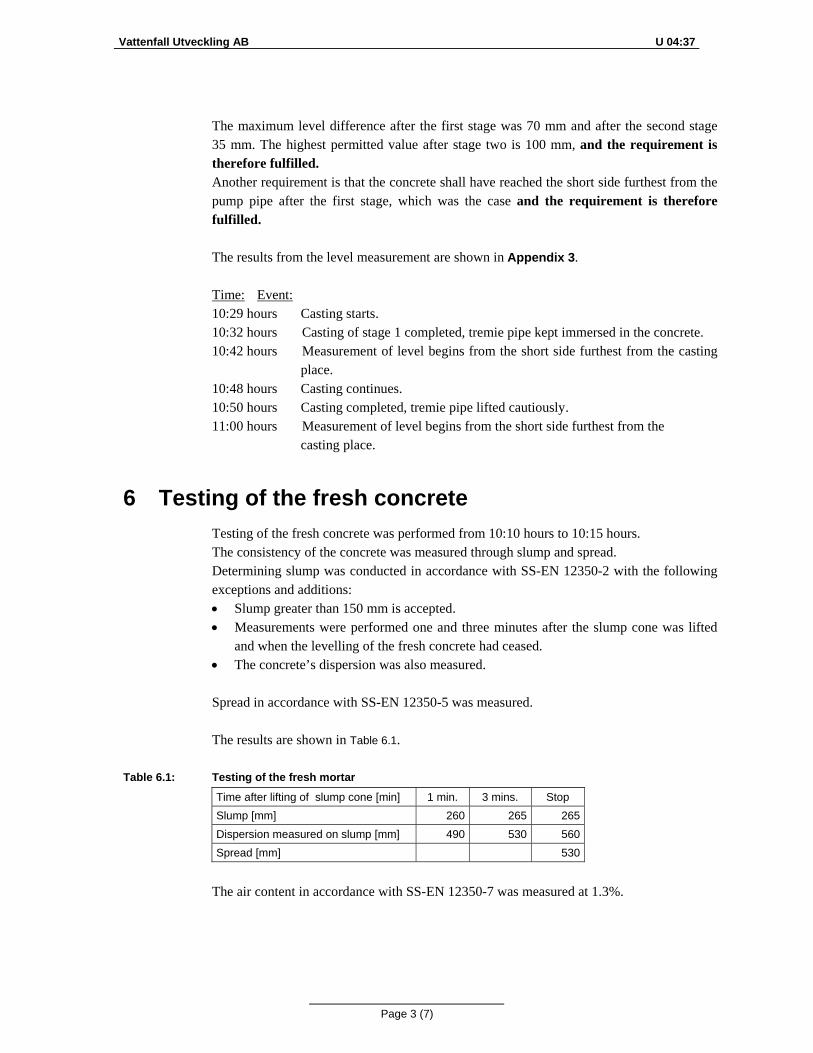
The maximum level difference after the first stage was 70 mm and after the second stage 35 mm. The highest permitted value after stage two is 100 mm, and the requirement is therefore fulfilled. Another requirement is that the concrete shall have reached the short side furthest from the pump pipe after the first stage, which was the case and the requirement is therefore fulfilled. The results from the level measurement are shown in Appendix 3. Time: Event: 10:29 hours Casting starts. 10:32 hours Casting of stage 1 completed, tremie pipe kept immersed in the concrete. 10:42 hours Measurement of level begins from the short side furthest from the casting
place. 10:48 hours Casting continues. 10:50 hours Casting completed, tremie pipe lifted cautiously. 11:00 hours Measurement of level begins from the short side furthest from the casting place.
6 Testing of the fresh concrete Testing of the fresh concrete was performed from 10:10 hours to 10:15 hours. The consistency of the concrete was measured through slump and spread. Determining slump was conducted in accordance with SS-EN 12350-2 with the following exceptions and additions: • Slump greater than 150 mm is accepted. • Measurements were performed one and three minutes after the slump cone was lifted
and when the levelling of the fresh concrete had ceased. • The concrete’s dispersion was also measured. Spread in accordance with SS-EN 12350-5 was measured. The results are shown in Table 6.1.
Table 6.1: Testing of the fresh mortar
Time after lifting of slump cone [min] 1 min. 3 mins. Stop Slump [mm] 260 265 265 Dispersion measured on slump [mm] 490 530 560 Spread [mm] 530
The air content in accordance with SS-EN 12350-7 was measured at 1.3%.

Vattenfall Utveckling AB U 04:37
Page 4 (7)
7 Inspection and splitting of test specimens after 21 days
During inspection of the test specimens (prior to splitting) there was no blistering or crack formation. On the surface of the test specimens, only a very thin layer of sludge could be scraped away. Splitting of test specimen type 1 was performed by staff from the Concrete Laboratory at Vattenfall Utveckling AB using Finja Bemix Betonamit Snigeldynamit. On inspection, there was no sludge formation or blistering at the reinforcement bar. Connection between reinforcement and concrete looked fine. The set requirement is therefore fulfilled. Some ballast separation has occurred, but this does not affect the properties of the concrete in general, see “Test loading of core samples” Section 9. See also photos in Appendix 4. On inspection of the test specimens 91 days after casting, no crack formation could be observed.
8 Test loading of cubes 21 cubes (150 mm) were pressure tested at the Concrete Laboratory at Vattenfall Utveckling AB. The results of the test loading are shown in Table 8.1.
Table 8.1: Development of strength
Age [days]
Density [Kg/m³]
Compressive strength Individual values [MPa]
Compressive strength
Mean [MPa] 1 2330 4.8 5.8 5.9 6 2 2340 16.3 15.6 15.6 16 3 2340 21.4 21.3 21.1 21 7 2340 33.3 33.2 35.0 34 14 2320 40.3 41.5 39.9 41 28 2300 46.7 47.1 46.0 47 91 2300 51.1 50.1 50.9 51
The results at 28 days shall meet the requirements for strength class C28/35 in accordance with SS-EN 206-1 (SS 13 70 03). Since the cubes have been stored in accordance with SS 13 72 10 (stored dry) recalculation of the result at 28 days gives 0.92 x 47 = 43 MPa. The mean value shall be 35+4 MPa =39 MPa and individual value > 35-4=31 MPa. The requirement regarding compressive strength is fulfilled.

Vattenfall Utveckling AB U 04:37
Page 5 (7)
9 Drilling and test loading of cylinders Drilling out and test loading of cylinders from test specimen type 1 were performed by staff at the Concrete Laboratory at Vattenfall Utveckling AB. This testing shall fulfil two requirements; firstly requirements on maximum spread in accordance with publication 2002:50, secondly requirements for strength class C 28/35 in accordance with BBK, section 7.3.3.3. conditions B. The results are presented in Table 9.1. A figure showing where the test positions are situated on the test specimens is shown in Appendix 5.
Table 9.1: Result from test loading of drilled out cylinders
Core number (direction of flow)
Position Compressive strength [MPa]
Mean value [MPa]
Standard deviation [MPa]
Coefficient of Variation [%]
1 ÖA 42.1 1 MB 42.7 1 UC 42.5 42.4 0.35 0.8
2 Ö 42.2 2 M 42.5 2 U 43.8 42.8 0.85 2.0
3 Ö 40.8 3 M 40.5 3 U 42.1 41.1 0.85 2.1
4 Ö 42.7 4 M 41.6 4 U 39.3 41.2 1.73 4.2
Mean value [MPa] 41.9
Standard deviation [MPa] 1.20
Coefficient of variation [%]
2.9
A Ö = Upper edge B M = Middle C U = Lower edge

Vattenfall Utveckling AB U 04:37
Page 6 (7)
Evaluation
Evaluation in accordance with BBK 94 section 7.3.3.3 conditions B. The concrete’s strength class is C 28/35 ⇒ f KK = 28 MPa Mean value (m) = 41.9 MPa Standard deviation (s) = 1.20 MPa Lowest individual value = 39.3 MPa The mean value shall be ≥ fKK exp (1.4 s/m) = 28.8 MPa Individual test shall be ≥ fKK –5 MPa = 23 MPa The concrete fulfils the requirements for concrete quality C28/35. In accordance with publication 2002:50, the coefficient of variation for the entire series shall be below 7 % and the coefficients of variation within each core be below 10 %. The coefficient of variation is 2.9 % for the entire series and 0.8 %, 2.0 %, 2.1 % and 4.2 % for the respective series. The concrete fulfils the requirements regarding the coefficients of variation.
10 Ballast content in sludge Samples have been taken out by scraping the upper edge down to a depth of roughly 1.5 mm. The samples (of approx. 10 grams each) have then been dried, weighed, prepared with phosphoric acid, rinsed with water, and dried and weighed again. This has resulted in a ballast content in a percentage by weight. Three test samples have been taken from test specimen type 1: one at each end and one in the middle of the test specimen. The results are shown in Table 10.1.
Table 10.1: Ballast content in sludge
Sample position Ballast content in percentage by weight
At tremie pipe 75 %Middle of test specimen type 1
76 %
Beyond 2nd bar 67 %
The requirement is that the ballast content in the sludge shall be at least 50 %. The requirement regarding sludge content is fulfilled.
Vattenfall Utveckling AB U 04:37
Page 7 (7)
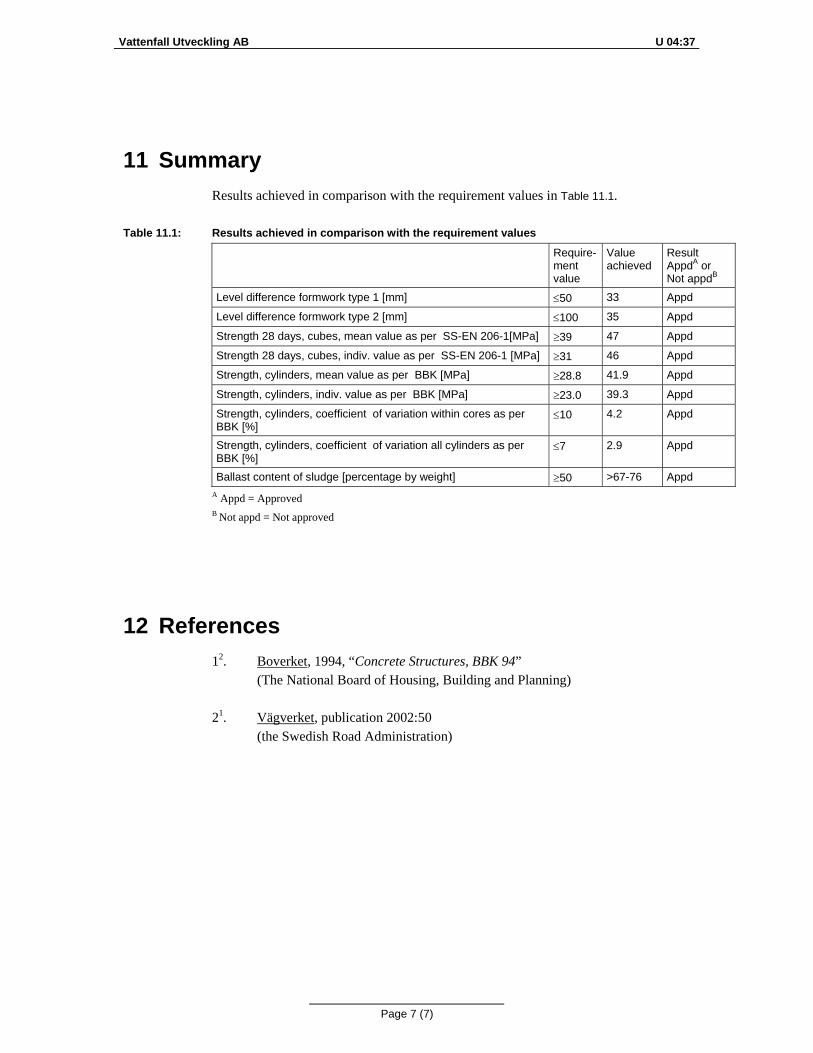
11 Summary Results achieved in comparison with the requirement values in Table 11.1.
Table 11.1: Results achieved in comparison with the requirement values
Require- ment value
Value achieved
Result AppdA or Not appdB
Level difference formwork type 1 [mm] ≤50 33 Appd
Level difference formwork type 2 [mm] ≤100 35 Appd
Strength 28 days, cubes, mean value as per SS-EN 206-1[MPa] ≥39 47 Appd
Strength 28 days, cubes, indiv. value as per SS-EN 206-1 [MPa] ≥31 46 Appd
Strength, cylinders, mean value as per BBK [MPa] ≥28.8 41.9 Appd
Strength, cylinders, indiv. value as per BBK [MPa] ≥23.0 39.3 Appd
Strength, cylinders, coefficient of variation within cores as per BBK [%]
≤10 4.2 Appd
Strength, cylinders, coefficient of variation all cylinders as per BBK [%]
≤7 2.9 Appd
Ballast content of sludge [percentage by weight] ≥50 >67-76 Appd A Appd = Approved B Not appd = Not approved
12 References 12. Boverket, 1994, “Concrete Structures, BBK 94” (The National Board of Housing, Building and Planning) 21. Vägverket, publication 2002:50 (the Swedish Road Administration)
Vattenfall Utveckling AB U 04:37Appendix 1
Page 1 (2)
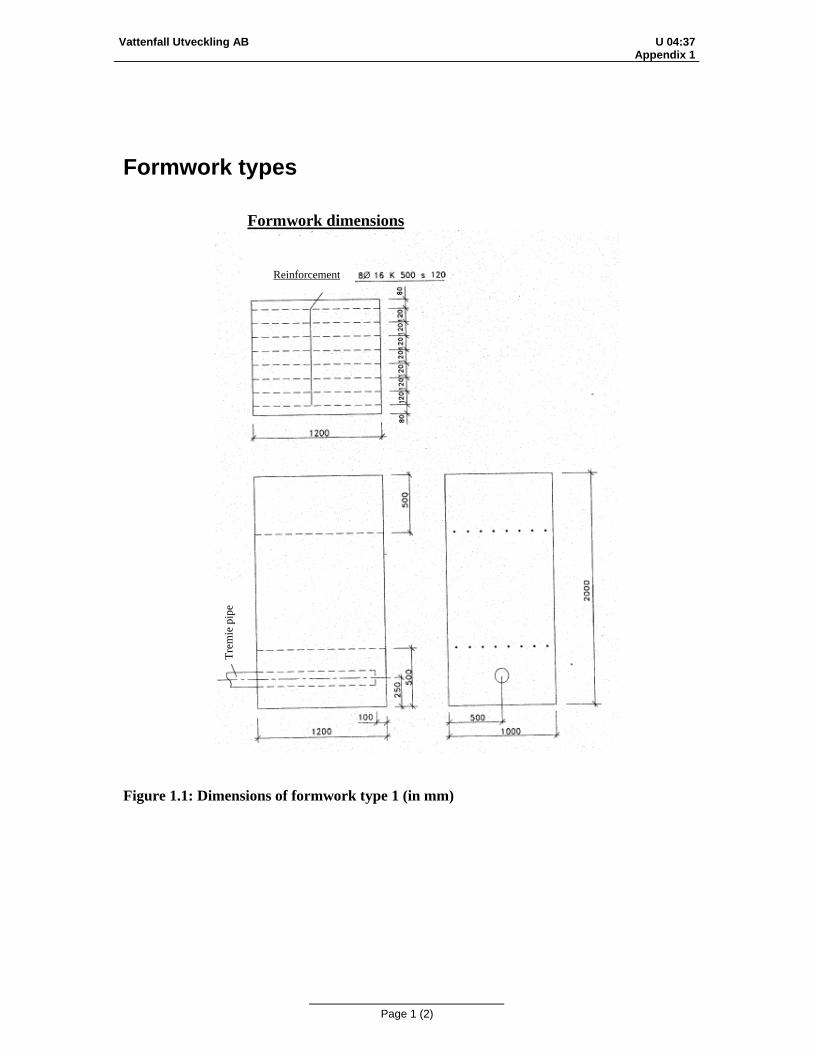
Formwork types Formwork dimensions
Figure 1.1: Dimensions of formwork type 1 (in mm)
Reinforcement
Trem
ie p
ipe

Vattenfall Utveckling AB U 04:37Appendix 1
Page 2 (2)
Figure 1.2: Dimensions of formwork type 2 (in mm)
Trem
ie p
ipe

Vattenfall Utveckling AB U 04:37Appendix 2
Page 1 (1)
Composite grading curve
Figur 2.1: Composite grading curve of ballast material
Grading width [mm]
Passing quantity [%]
Data Guide line Min Max Current
0,075 1,7 1,2 1,7 1,3
0,125 3,4 2,9 3,4 3,0
0,25 7 6 7 7,8
0,5 19,2 17,2 21,2 14,6
1 28,9 23,9 33,9 27,9
2 37,4 32,4 42,2 40,4
4 45,7 40,7 50,7 47,4
8 53,7 48,7 58,7 53,7
16 62,6 57,6 67,6 67,4
25 76 71 81 89,4
32 98,6 97,6 99,1 99,6
Table 2.1: Composite grading curve of ballast material
0
10
20
30
40
50
60
70
80
90
100
0,075 0,125 0,25 0,5 1 2 4 8 16 25 32Grading width (mm)
Pass
ing
quan
tity
(%)
Guide lineMinMaxCurrent

Vattenfall Utveckling AB U 04:37Appendix 3
Page 1 (3)
Result of level measurements The distance between a horizontal plane cutting the highest level of the formwork bottom is shown in table and diagram form. The measurements have been performed with an accuracy of 2 mm. The level difference for formwork type 1 was 33 mm and for formwork type 2 was 35 mm. The tables show the level of the concrete surface in cm. The horizontal row refers to distance from the short side in metres, whilst the vertical column refers to the distance from the left long side, viewed in direction of flow, stated in metres. Formwork type 1
Table 3:1 Concrete surface level after casting in formwork type 1.
5 45 55 100 145 155 195 5 99,0 99,0 99,0 100,0 101,0 101,4 102,0
50 99,0 100,3 100,5 100,8 101,4 101,5 102,3
95 99,2 100,0 100,3 101,5 101,8 101,8 102,3
Figure 3:1 Concrete surface level after casting in formwork type 1, measured in cm.
5 45 55 100 145 155 1955
950
20
40
60
80
100
120

Vattenfall Utveckling AB U 04:37Appendix 3
Page 2 (3)
Formwork type 2
Table 3:2 Concrete surface level after casting in formwork type 2, stage 1. 5 50 100 150 200 50 300 350 395 5 26,5 27,0 25,6 24,2 23,0 21,9 21,0 20,4 20,2
25 26,5 27,0 25,7 24,5 23,2 22,0 21,0 20,5 20,0
45 26,4 26,6 25,7 23,7 22,5 21,4 20,7 20,0 20,2
Figure 3:2 Concrete surface level after casting in formwork type 2, stage 1,
measured in cm.
5 50 100 150 200 250 300 350 3955
2545
010
20
30
40
50
60
70
80
90
100
Vattenfall Utveckling AB U 04:37Appendix 3
Page 3 (3)
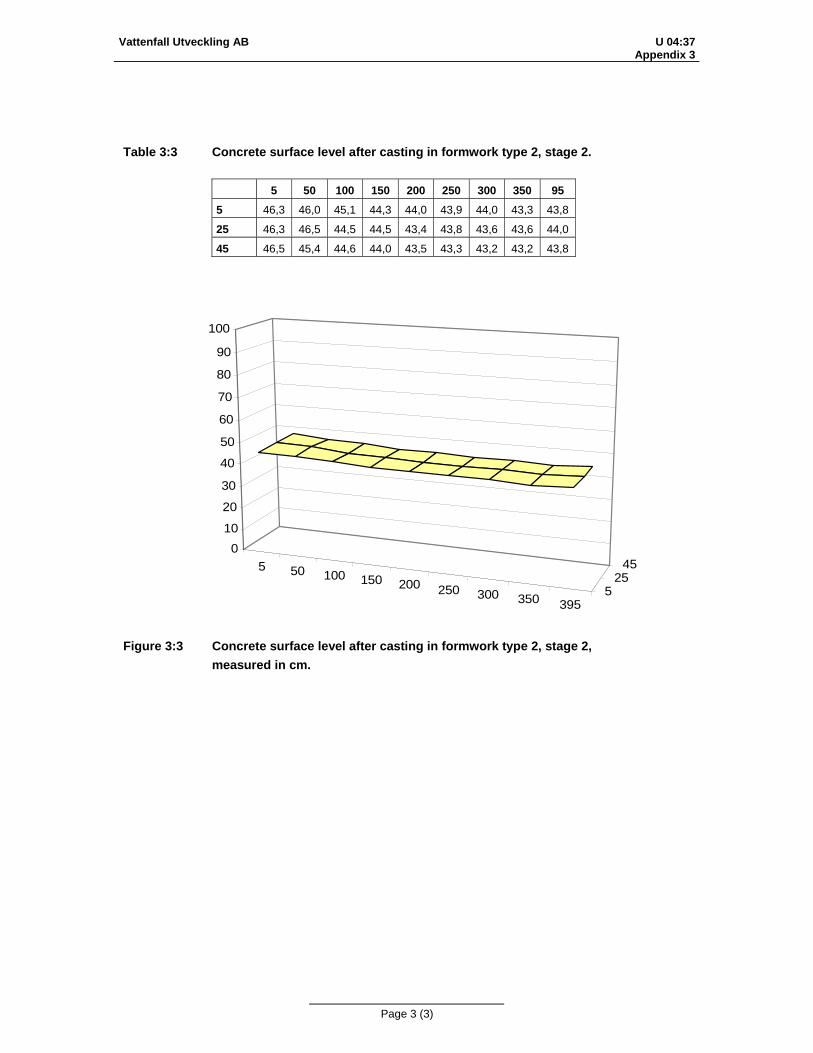
Table 3:3 Concrete surface level after casting in formwork type 2, stage 2.
5 50 100 150 200 250 300 350 95 5 46,3 46,0 45,1 44,3 44,0 43,9 44,0 43,3 43,8
25 46,3 46,5 44,5 44,5 43,4 43,8 43,6 43,6 44,0
45 46,5 45,4 44,6 44,0 43,5 43,3 43,2 43,2 43,8
Figure 3:3 Concrete surface level after casting in formwork type 2, stage 2,
measured in cm.
5 50 100 150 200 250 300 350 3955
2545
010
20
30
40
50
60
70
80
90
100

Vattenfall Utveckling AB U 04:37Appendix 4
Page 1 (3)
Photos from the inspection
Figure 4:1 Drill cores from test positions up to and including 4 (4 at top)
Figure 4:2 Bottom edge of drill cores from test positions up to and including 4
(from left to right)
Vattenfall Utveckling AB U 04:37Appendix 4
Page 2 (3)
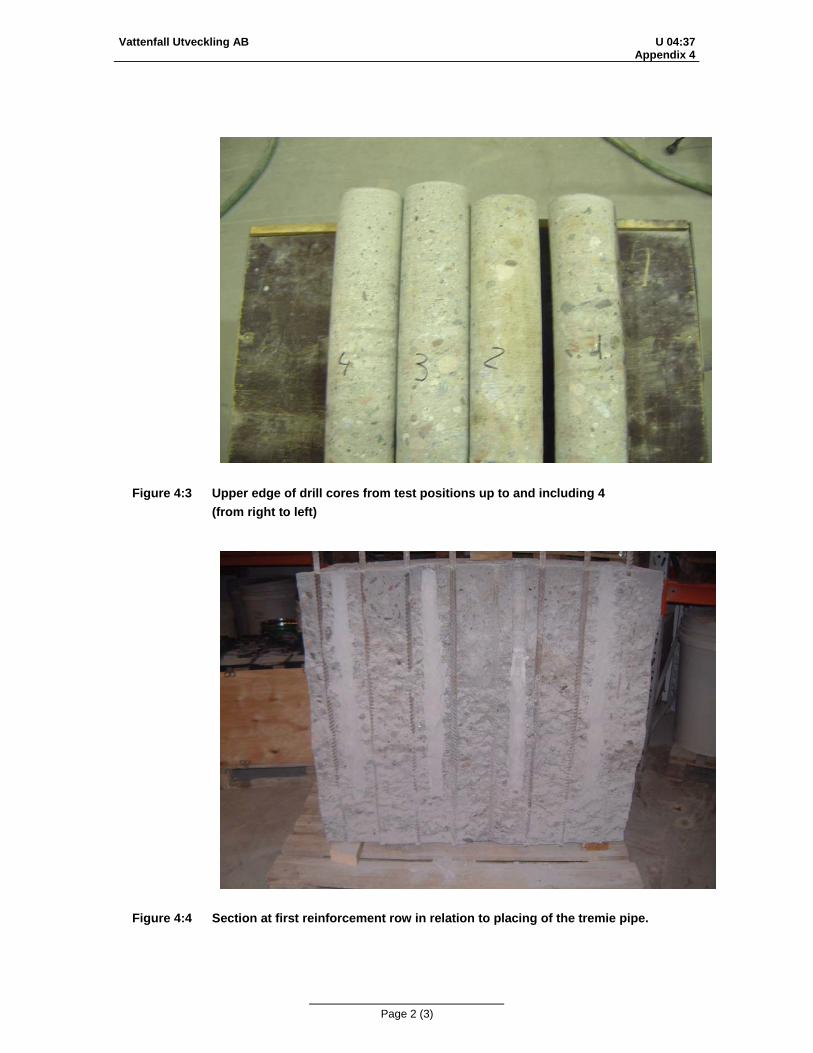
Figure 4:3 Upper edge of drill cores from test positions up to and including 4
(from right to left)
Figure 4:4 Section at first reinforcement row in relation to placing of the tremie pipe.

Vattenfall Utveckling AB U 04:37Appendix 4
Page 3 (3)
Figure 4:5 Section at second reinforcement row in relation to placing of the tremie pipe.

Vattenfall Utveckling AB U 04:37Appendix 5
Page 1 (1)
Test positions for drilling out cores
Figure 5:1 Splitting lines and orientation of drilled out cores from casting in formwork type 1
Splitting lines and orientation of drill cores
Tremie pipe
Position of the reinforcement and splitting lines for the concrete
The drill holes shall be placed right before one of the reinforcement bars nearestthe centre line in the test specimen´s long side.
Drill core no