testing portal, more than just numbers - school … · testing portal, more than just numbers: ......
TRANSCRIPT

Testing Portal, More Than Just Numbers:
Using K12 Educator and Student Data from
the SAT® Suite of Assessments to Inform
Instruction
AP Symposium January, 2017

Confidence
▶ https://www.youtube.com/watch?v=enLRwKjIOAM
2

100
For every 100 9th graders…
70
graduate from high
school
44
enroll in and enter college
30
return to college for
their sophomore
year
21
earn a bachelor ’s
degree within six years
Source: The National Center for Higher Education Management Systems Progress and Completion Data
The Case for Rigor

Agenda
▶ Using data to inform instruction
▶ SAT Suite of Assessments
▶ Access the data
▶ Understand the reports and data provided by the SAT® Suite of Assessments
▶ Use data and reports to support:
▶ Student support and intervention
▶ Monitoring of curriculum and instruction

5
Data to Inform Instruction
▶ Use of data to inform instruction is the critical reason we collect the data.
▶ Testing data should help you understand where your students are in relationship to the content teachers are responsible for teaching
▶ Data should help you make informed decisions about what you need to do next

▶ Reveals students in each performance group.
▶ Help inform how you choose
▶ student groups
▶ seating charts
▶ differentiate for individuals
▶ Identify areas for concentration between different classes
6
Aggregate Data

7
Data for Each Student
Any standardized test is one moment in time Use what you know about students to make decisions How do they perform on your classroom tests Positive or poor performance can be influenced by
Motivation Test Anxiety Outside Factors

The SAT® Suite of Assessments
Connect to College
Check-in and Focus
Readiness Baseline

New Mexico Universities SAT average scores
9

Understanding the SAT® College and Career Readiness Benchmarks▶ 75% likelihood of earning at least a C in a first-semester, credit-bearing college course in a
related subject.
▶ Set at section level.
▶ Grade-level benchmarks are based on expected student growth towardthe SAT Benchmarks:
Grade 8 Grade 9 Grade 10 Grade 11 SAT
Section Level390 410 430 460 480 ERW
430 450 480 510 530 MATH

The redesigned SAT will be the anchor of a vertically aligned SAT Suite of Assessments.
Section Score Ranges
11
Scores Across the SAT Suite of Assessments

Making the Most of the SAT® Suite
Access ► View and print online score reports.
► Download Data Files.
Understand ► Unpack scores, benchmarks, percentiles, and concordance.
► Access key resources.
Use ► Score reports help you advise students and plan ahead.
► Link students to Official SAT Practice and AP Potential™.
► Quickly get the information you need.

Score Reports

SAT® Scores and Subscores

Benchmark Reporting: Color-CodedScore Ranges
Section scores
▶ Green = Meets grade-level benchmark.
▶ Yellow = Lies between the red and green ranges.
▶ Red = Does not meet benchmark for previous grade level.
11th-Grade Math Section Benchmark Example
Grade 11 BMGrade 10 BM

Accessing

End-to-End Process to Gain Access
Create a
College Board
Professional
Account
Request
Access from
the Access
Manager
Log in to the
SAT® Suite of
Assessments
Reporting Tool

Login PageLogin Page

Access HelpAccess Help

DashboardDashboard

Understanding and Using Scores

Student Search

Paper Score Reports for PSAT/NMSQT®

► Reports individual student scores
► Lists student performance on all
assessments taken over time
► Shows projection of next year’s
scores
► Identifies whether the student is
likely to succeed in AP® and links
to the AP PotentialTM tool
► Links to detailed score reporting,
including test, cross-test, and
subscores
NOTE: All reports are subject to change and should not be considered final.
Student Score Report
(Educator Version)

25
Making Information Work for Youand Your Students
1. Determine students’ current status.
2. Set attainable goals toward meeting/exceeding benchmarks.
3. Guide students to targeted practice.
4. Measure progress.
5. Meet the benchmark!
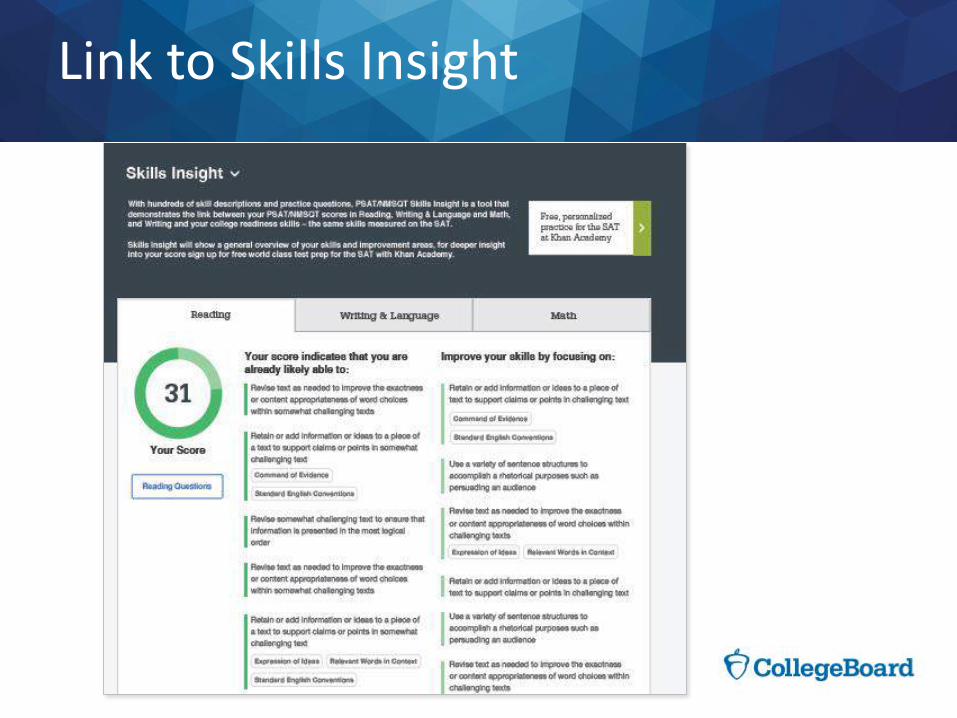
Link to Skills Insight
2626

NOTE: Reports shown are illustrations, and all data is fictitious.
View AP Potential

Using the Student Score Report
▶ For those who need to strengthen skills to meet college and career benchmarks, develop an acceleration plan.
▶ For students who are close to meeting the benchmark, click through to the PDF version of the Student Report to identify particular areas to practice.
▶ For students who have met or exceeded the benchmark, ensure students are taking challenging courses, including Advanced Placement
®, and
provide challenging assignments to expand on their knowledge and skills.
28

Reports Center

Reports Center Navigation

► Use the Summary Report to:
Step 1: Choose an Assessment

► Use the Summary Report to:
Step 2: Choose a Report

Score Reports

Scores By Institution
▶ Comparison to District, State, and National for School Improvement Planning
▶ Useful data for grant writing
▶ Superintendent to see an overview of all schools in the district
▶ Districtwide drill down to view sub-score mean performance
► Use the Scores by Institution to:

► Use the Summary Report to:
Scores by Institution Report

Scores by Institution Report
Scores by Institution

► Use the Summary Report to:
Scores by Institution
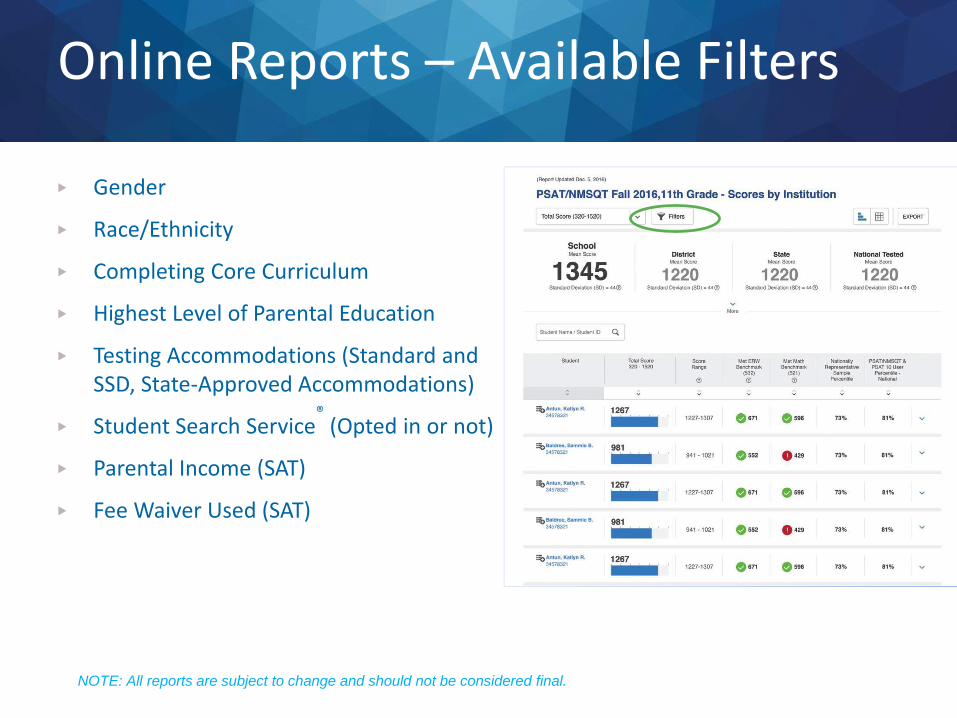
Online Reports – Available Filters
▶ Gender
▶ Race/Ethnicity
▶ Completing Core Curriculum
▶ Highest Level of Parental Education
▶ Testing Accommodations (Standard and SSD, State-Approved Accommodations)
▶ Student Search Service®
(Opted in or not)
▶ Parental Income (SAT)
▶ Fee Waiver Used (SAT)
NOTE: All reports are subject to change and should not be considered final.

► Use the Summary Report to:
Scores by Institution

Scores By Demographics
▶ Comparison to District, State, and National for EPPS Plan
▶ Quick overall glance to see how scores are distributed for the purpose of
targeting monies to meet areas of improvement
▶ Ensure that all students have similar participation rates and equal access to
assessments
► Use the Scores by Demographics to:

► Use the Summary Report to:
Scores by Demographics

Benchmarks by Institution
▶ Side by side comparison of District, State, and National % of who met both
benchmarks
▶ Side by Side Comparison of Schools in the District Benchmark Data
▶ Quick view of % in each section score for all schools performance group data
in the district
► Use the Benchmarks by Institution to:

► Use the Summary Report to:
Benchmarks by Institution

► Use the Summary Report to:
Benchmarks by Institution

Benchmarks by Demographics
▶ Performance Data about students in demographic groups for the purpose of assessing performance to target intervention
▶ Comparison of mean scores in each demographic group for the purpose:
▶ School Improvement Plan (this report is a baseline)
▶ Intervention
▶ Equity and Access (equal access to assessments)
▶ Data Driven Instruction
► Use the Benchmarks by Demographics to:

Benchmark by Demographics Report
► Provides
benchmark
performance
demographic
groups
► Allows comparison
of up to two
demographic traits.
NOTE: All reports are subject to change and should not be considered final.

NOTE: Reports shown are illustrations, and all data is fictitious.

Using the Scores by Demographics and Benchmarks by Demographics Reports
Determine whether any subgroups are underperforming:
▶ Compare average scores and benchmark performance for all students and each demographic group.
▶ Use the average score/benchmark performance as a baseline for developing school improvement goals.
Ensure that all students have similar participation rates and equal access to assessments.
▶ Develop school improvement goals focused on participation rates.
54

Instructional Planning Report
▶ Use for creating a pacing guide to ensure completion of needed content.
▶ Am I spending enough time where there are weak points in this data and where do I need to make adjustments?
▶ Determine areas in which students are meeting and exceeding college and career benchmarks.
▶ How can I collaborate with my colleagues (cross curriculum) to ensure success for all?
▶ Comparing my instructional planning using evidence in the report.
▶ Does my lesson plan reflect student need in the report?
► Use the Instructional Planning Report to:

► Use the Summary Report to:
Instructional Planning Report

► Use the Summary Report to:
Instructional Planning Report

► Use the Summary Report to:
Instructional Planning Report

► Use the Summary Report to:
Instructional Planning Report

Create Your Classes
62

See Your Classes
63

Question Analysis Planning Report
▶ Use for creating a pacing guide to ensure completion of needed content.
▶ Am I spending enough time where there are weak points in this data and where do I need to make adjustments?
▶ Adjusting instructional strategies according to needs
▶ Do my classroom exams reflect the question structure and format that provide practice for the summative assessment? (PSAT, SAT, state assessment, etc.)
▶ Shows strengths and weakness on each question and college and readiness benchmark / state standard.
▶ How can I collaborate with my colleagues (cross curriculum) to ensure success for all?
▶ Use correct answer percentages to inform daily instruction for remediation and acceleration.
► Suggested use of the Question Analysis Report :

► Use the Summary Report to:
Question Analysis Reports

► Use the Summary Report to:
Question Analysis Report

► Use the Summary Report to:
Question Analysis Report

► Use the Summary Report to:
Question Analysis Report

► Use the Summary Report to:
Question Analysis Report

Using the Question Analysis Report
Understand what each question reveals about student learning.
▶ Consider whether students struggle with particular types of questions.
▶ Diagnose errors in student choices by understanding the distractors.
Use difficulty indicators to determine the level of question with which students are struggling.
▶ All types: Are students exposed to this content in class?
▶ Hard questions: How can you raise the level of challenge in class?
Look for opportunities for skill reinforcement in science andsocial studies courses.
▶ Identify questions linked to the cross-test scores.
▶ Ensure students have the opportunity to practice analysis skills in content-area courses.
74

Official SAT® Practice on Khan Academy®

Official SAT® Practice on Khan Academy®
▶ https://www.youtube.com/watch?v=KOntbZIna1E

New Mexico Students Called to Action
2.1 million unique users in the
US last year…
NM – 2% linkage 2015-16
•As a call to action, NM has set a metric for
2016-17 at 60% linkage
•NM Students who took the 10th grade
PSAT/NMSQT exam in October should be
linked by February 1, 2017

Khan Academy® Resources
Go to satpractice.org/k12 for resources about Official
SAT® Practice on Khan Academy.
View sample study plans and study-group ideas at
sat.org/studygroup.
Student resources for the SAT and PSAT-related
assessments are at sat.org/k12.
Instructional videos on Khan Academy are at
youtube.com/collegeboard.

Daily Practice for the New SAT®
» Daily SAT practice questions
» Instant practice test scoring

81
Module 1 Key Changes
Module 2 Words in Context and Command of Evidence
Module 3 Expressions of Ideas and Standard English Conventions
Module 4 Math that Matters Most – Heart of Algebra and Problem Solving and Data Analysis
Module 5 Math that Matters Most – Passport to Advanced Math and Additional Topics in Math
Module 6 Using Scores and Reporting to Inform Instruction
https://collegereadiness.collegeboard.org/educators/k-12/professional-development-modules
Professional Development Module Titles

82
Big Future

► Use the Summary Report to:

Questions?
Edwina HensleeDirector, NM PartnershipThe College Board
575-369-9702
Pam RichardsRegional Coach NM/College Board State Partnership
817-368-2932
Kimberly BostwickRegional Coach NM/College Board State Partnership
575-749-4969