testing system set-up to evaluate acoustic induced vibration · the piping and data acquisition...
TRANSCRIPT
TESTING SYSTEM SET-UP TO EVALUATE ACOUSTIC INDUCED VIBRATION
J. Adin Mann III, Daniel Eilers, Trent Jackson
Fisher Controls International LLC Emerson Process Management
Marshalltown, Iowa, USA
Rob Swindell and Christopher Middleton Wood Group Kenny Southampton, UK
David Arnett Chevron Energy Technology Co.
Houston Texas, USA
Nicolas Horder Xodus Group Aberdeen, UK
Hisao Izuchi Chiyoda Corporation
Yokohama, Japan
Geoff Evans BP Exploration & Prod. Co. Ltd
Sunbury on Thames, UK
ABSTRACT
A consortium of companies is collaborating in a Joint Industry Project (JIP) for Acoustic Induced Vibration (AIV). Laboratory testing is one of the work areas of the JIP. The goals of the tests are to evaluate typical pipe fittings for AIV induced fatigue, to rank order their AIV risk and to obtain data for validation of computational models. An NPS6x8 (6R8) pressure safety valve was the flow and noise input to a 10S piping system, which consisted of an NPS12 tailpipe input into an NPS12x20 tee. Small bore connectors (SBCs) were included in both the NPS12 tailpipe and the NPS20 header. The type of fitting used as the connection between the SBC and the pipe was varied. The system was operating in a Carucci-Mueller acoustic power of around 175 dB. Vibration acceleration response of the system was measured, and dynamic strain data was also gathered to evaluate fatigue life. The piping and data acquisition system setup will be discussed along with the type of results that are being obtained.
INTRODUCTION
During the 2012 INTERNOISE Conference, a session on Acoustic Induced Vibration (AIV) concluded with several attendees being interested in a Joint Industry Project to address ongoing concerns about AIV since current AIV evaluation methods seemed to be overly conservative. The scope of a project to establish new technology on AIV was considered large enough that the collaboration among various organizations was required. A three phase JIP was proposed which started in February 2015. The project is being managed by the Energy Institute. The JIP members are BP, ConocoPhillips, Chevron, Nexen, KBR, Chiyoda, Petrofac, Xodus, Bechtel, Wood Group Kenny, and Emerson (Fisher Valves). Much of the focus of the work is addressing existing facilities. The goals of the multiple phases planned for the JIP are to:
• Collate and evaluate all additional available data on AIV failures
• Evaluate potential remedial solutions to piping systems that have been identified as being at risk of AIV, particularly those control methods that can be retrofitted to existing systems
• Quantify the improvements that can be achieved by using more robust piping fittings
• Update current AIV design tools to improve source predictions and to take account of larger diameter flare piping
One focus of the first phase is performing laboratory tests to evaluate different typical fittings in a flare system and evaluate remedial solutions. This paper presents the design of the test setup. Future papers on the test results will follow.
TESTING FLOW SYSTEM The testing has been performed at the Emerson Innovation
Center, Fisher Technology Flow Lab. Four joints were tested: stub-on, stub-on with reinforcement pad, Buttweld Pipet®, and Sweepolet®.
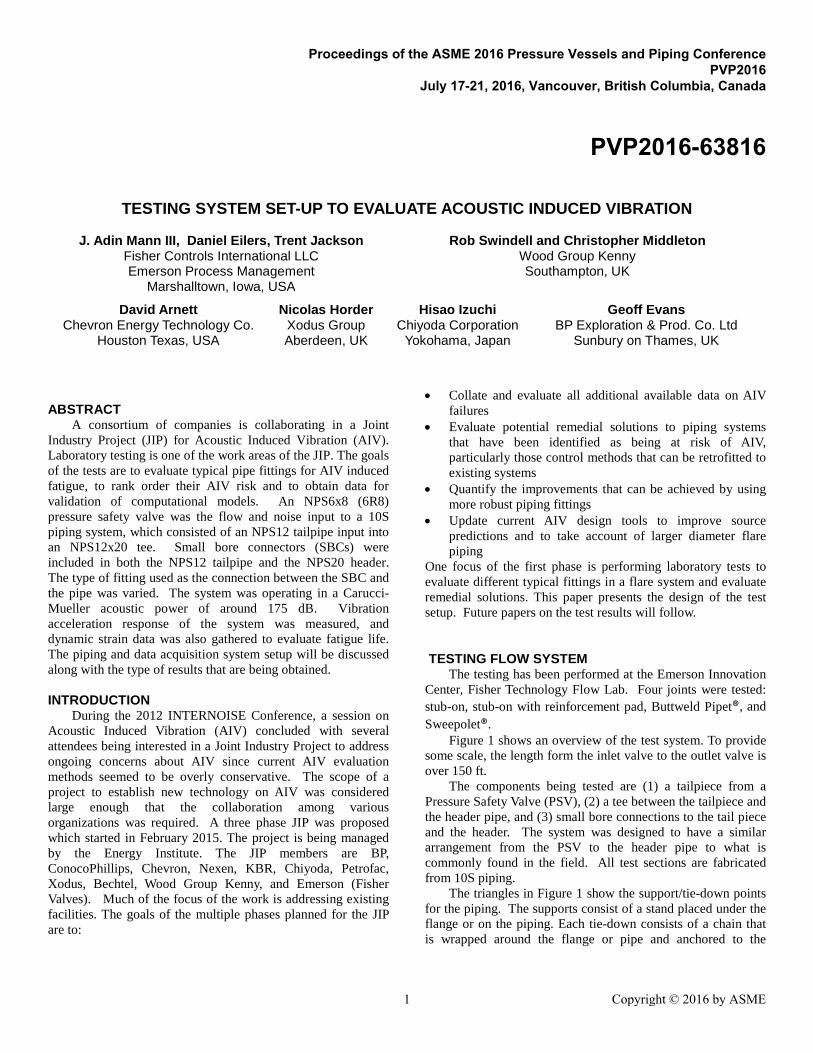
Figure 1 shows an overview of the test system. To provide some scale, the length form the inlet valve to the outlet valve is over 150 ft.
The components being tested are (1) a tailpiece from a Pressure Safety Valve (PSV), (2) a tee between the tailpiece and the header pipe, and (3) small bore connections to the tail piece and the header. The system was designed to have a similar arrangement from the PSV to the header pipe to what is commonly found in the field. All test sections are fabricated from 10S piping.
The triangles in Figure 1 show the support/tie-down points for the piping. The supports consist of a stand placed under the flange or on the piping. Each tie-down consists of a chain that is wrapped around the flange or pipe and anchored to the
Proceedings of the ASME 2016 Pressure Vessels and Piping Conference PVP2016
July 17-21, 2016, Vancouver, British Columbia, Canada
PVP2016-63816
1 Copyright © 2016 by ASME
concrete floor. No support/tie-down is used on the test section except at the flanges and the blanked off tailpiece not under test.
The tailpipe was 10S NPS12 which has a diameter to thickness ration D/t = 71 and the header pipe was 10S NPS20 which has a D/t = 92. These D/t ratios are considered by many as indicative of a piping system susceptible to AIV damage.
The PSV was a Farris NPS6x8 (68R) valve provided by Puffer-Swiven. The spring was removed and the travel fixed at full open. An NPS 8x12 expansion was used at the valve outlet to connect to the NPS 12 tailpiece. The NPS 12 pipe was chosen so that sonic flow downstream of the test PSV was not likely. All test joints were welded, and the test sections connected with bolted flanges. There are three test sections, two to test different tee fabrication methods and one that will be used to test support designs.
Figure 1: Complete test system.
The following tee joints were fabricated:
Tailpiece to Header Tee Joints 1. Stub-on (Figure 3) 2. Stub-on with full encirclement wrap (Figure 4) 3. Sweepolet® (Figure 5) 4. Buttweld Pipet® (Figure 6)
Small Bore Connector Tee Joints
1. Buttweld Pipet® with a partial wrap (or repad)(Figure 8) 2. Sockolet® (Figure 7) 3. Sweepolet® (Figure 8) 4. Buttweld Pipet® (Figure 7)
The SBC consisted of a tee between the pipe and a NPS2 standard wall pipe. The Sweepolet®, Buttweld Pipet®, and Sockolet® were provided by WFI International.
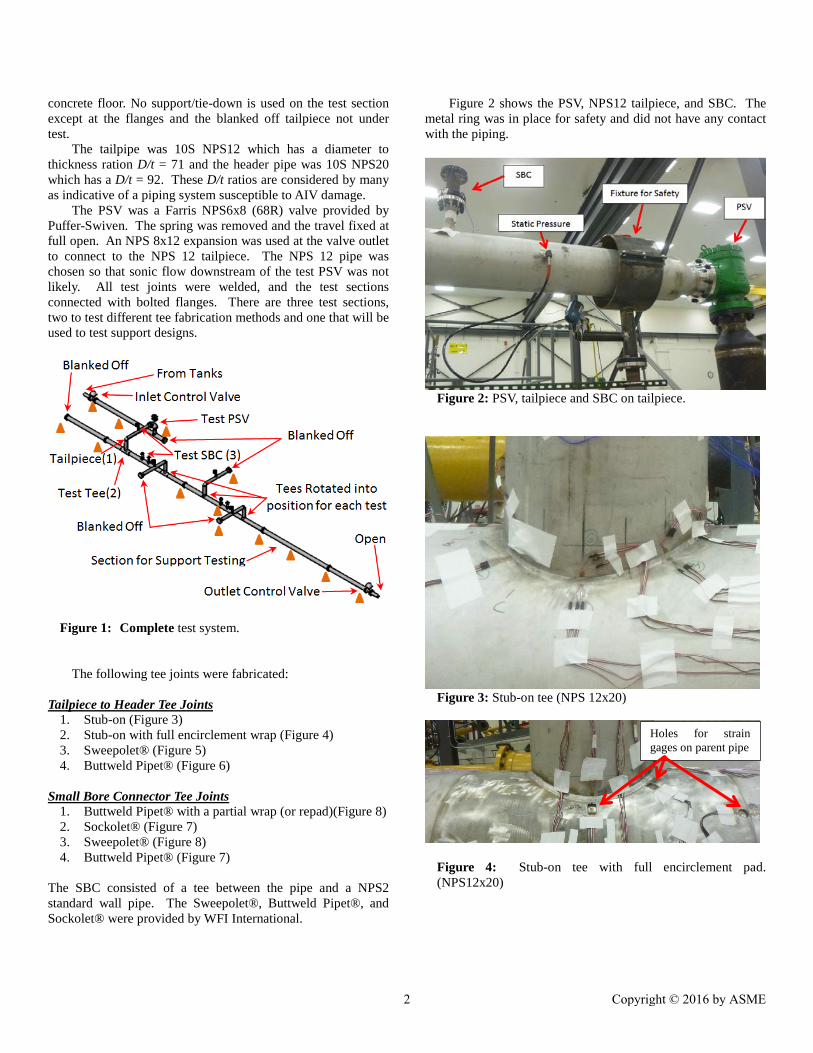
Figure 2 shows the PSV, NPS12 tailpiece, and SBC. The metal ring was in place for safety and did not have any contact with the piping.
Figure 2: PSV, tailpiece and SBC on tailpiece.
Figure 3: Stub-on tee (NPS 12x20)
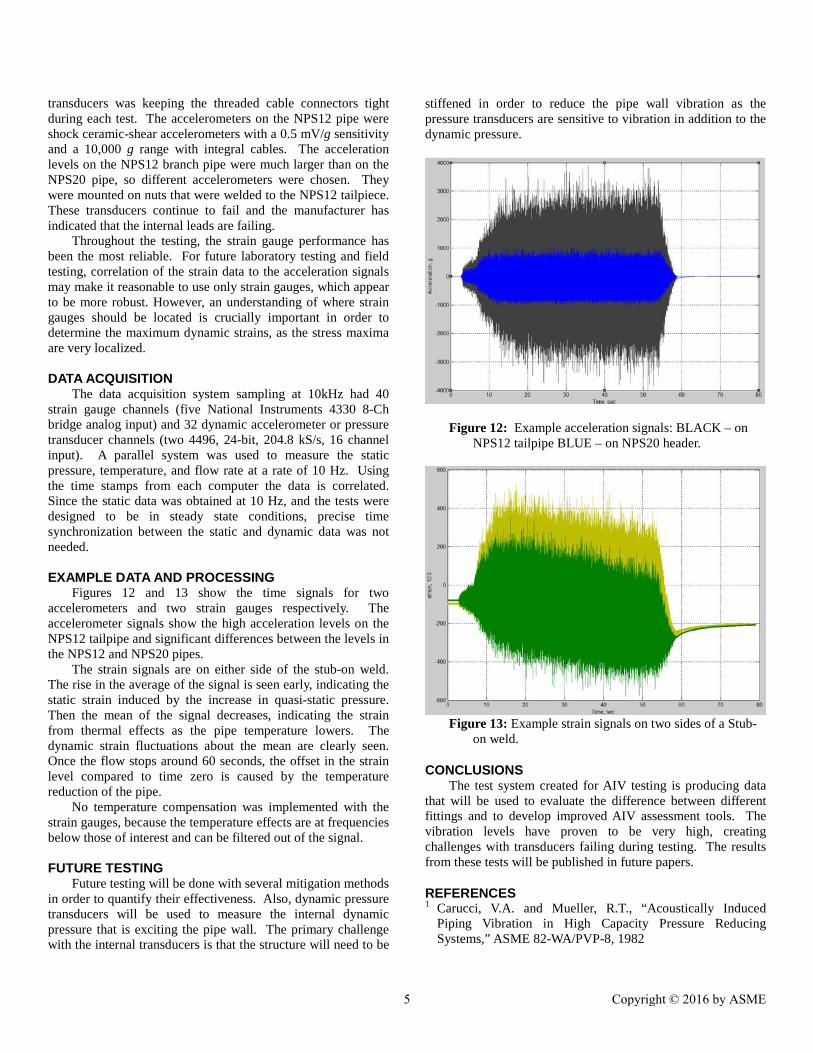
Figure 4: Stub-on tee with full encirclement pad. (NPS12x20)
Holes for strain gages on parent pipe
2 Copyright © 2016 by ASME
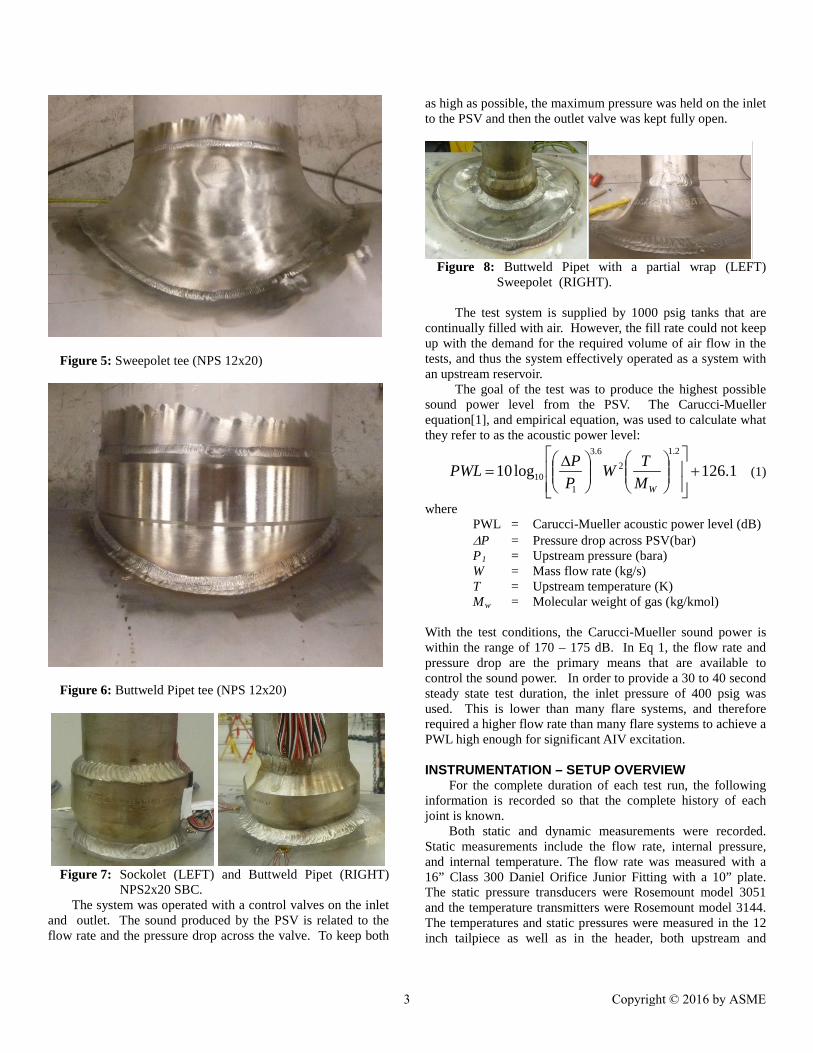
Figure 5: Sweepolet tee (NPS 12x20)
Figure 6: Buttweld Pipet tee (NPS 12x20)
Figure 7: Sockolet (LEFT) and Buttweld Pipet (RIGHT)
NPS2x20 SBC. The system was operated with a control valves on the inlet
and outlet. The sound produced by the PSV is related to the flow rate and the pressure drop across the valve. To keep both
as high as possible, the maximum pressure was held on the inlet to the PSV and then the outlet valve was kept fully open.
Figure 8: Buttweld Pipet with a partial wrap (LEFT) Sweepolet (RIGHT).
The test system is supplied by 1000 psig tanks that are
continually filled with air. However, the fill rate could not keep up with the demand for the required volume of air flow in the tests, and thus the system effectively operated as a system with an upstream reservoir.
The goal of the test was to produce the highest possible sound power level from the PSV. The Carucci-Mueller equation[1], and empirical equation, was used to calculate what they refer to as the acoustic power level:
1.126log102.1
26.3
110 +
∆=
WMTW
PPPWL (1)
where PWL = Carucci-Mueller acoustic power level (dB) ∆P = Pressure drop across PSV(bar) P1 = Upstream pressure (bara) W = Mass flow rate (kg/s) T = Upstream temperature (K) Mw = Molecular weight of gas (kg/kmol) With the test conditions, the Carucci-Mueller sound power is within the range of 170 – 175 dB. In Eq 1, the flow rate and pressure drop are the primary means that are available to control the sound power. In order to provide a 30 to 40 second steady state test duration, the inlet pressure of 400 psig was used. This is lower than many flare systems, and therefore required a higher flow rate than many flare systems to achieve a PWL high enough for significant AIV excitation.
INSTRUMENTATION – SETUP OVERVIEW
For the complete duration of each test run, the following information is recorded so that the complete history of each joint is known.
Both static and dynamic measurements were recorded. Static measurements include the flow rate, internal pressure, and internal temperature. The flow rate was measured with a 16” Class 300 Daniel Orifice Junior Fitting with a 10” plate. The static pressure transducers were Rosemount model 3051 and the temperature transmitters were Rosemount model 3144. The temperatures and static pressures were measured in the 12 inch tailpiece as well as in the header, both upstream and
3 Copyright © 2016 by ASME

downstream of the test tee. The static pressure transducer arrangement was such that the pressure drop across the PSV was measured.
The 20x12 test tee was instrumented with 5 pairs of strain gauges. The strain gauges were Vishay C2A-06-062WW-350 stacked rosettes. For each pair one was on the tailpiece and one on the header side of the test tee. Figure 9 shows a picture of the Stub-on tee showing all the gauges, and Figure 10 shows a close up on one of the gauge pairs.
In the case of the stub-on tee with full encirclement pad, holes were made in the pad to allow for strain measurements on the parent pipe; this can be seen in Figure 3. Strain was also measured on the pad.
Figure 9: Overview of transducer for Tailpiece to Header joint.
Figure 10: Close-up of one strain gauge pair.
The SBC’s were instrumented with uniaxial strain gauges,
measuring the strain normal to the weld. One gauge pair was mounted along the pipe axis and one perpendicular to the pipe axis as shown in Figure 11.
Accelerometers were used to: (1) identify circumferential modes in the tailpiece and header and (2) evaluate how the
vibration decays away from the test joint. The circumferential modes were measured with an array of 8 accelerometers; each located 2 diameters from the joint. Accelerometers were also placed in 1D intervals on the header pipe downstream of the joint and one was located 3D upstream of the joint. Thus, the vibration downstream and upstream of the test joint was measured.
For the two SBCs, a tri-axial accelerometer was placed on the top of each SBC as well as a uni-axial accelerometer on the pipe adjacent to the SBC.
Figure 11: Close-up of a SBC with transducers notes.
INSTRUMENTATION - CHALLENGES
The primary challenge in the testing was keeping the instrumentation intact and working. The vibration levels are very high, some as high as ±3000 g, Figure 12. The pressure and temperature transducers downstream of the PVS experienced several failures. On the static pressure, the National Pipe Thread (NPT) fitting failed at the threads. A low weight fitting was eventually used that has survived multiple tests. The temperature transducer is an insertion type transducer, and typically fails after several tests.
Accelerometers on the NPS20 header were quartz shear accelerometers with a 10 mV/g sensitivity and 1 to 10 kHz range. They were mounted using threaded pads which were glued with JB Weld 8265S. The challenge with these
4 Copyright © 2016 by ASME
transducers was keeping the threaded cable connectors tight during each test. The accelerometers on the NPS12 pipe were shock ceramic-shear accelerometers with a 0.5 mV/g sensitivity and a 10,000 g range with integral cables. The acceleration levels on the NPS12 branch pipe were much larger than on the NPS20 pipe, so different accelerometers were chosen. They were mounted on nuts that were welded to the NPS12 tailpiece. These transducers continue to fail and the manufacturer has indicated that the internal leads are failing.
Throughout the testing, the strain gauge performance has been the most reliable. For future laboratory testing and field testing, correlation of the strain data to the acceleration signals may make it reasonable to use only strain gauges, which appear to be more robust. However, an understanding of where strain gauges should be located is crucially important in order to determine the maximum dynamic strains, as the stress maxima are very localized.
DATA ACQUISITION
The data acquisition system sampling at 10kHz had 40 strain gauge channels (five National Instruments 4330 8-Ch bridge analog input) and 32 dynamic accelerometer or pressure transducer channels (two 4496, 24-bit, 204.8 kS/s, 16 channel input). A parallel system was used to measure the static pressure, temperature, and flow rate at a rate of 10 Hz. Using the time stamps from each computer the data is correlated. Since the static data was obtained at 10 Hz, and the tests were designed to be in steady state conditions, precise time synchronization between the static and dynamic data was not needed. EXAMPLE DATA AND PROCESSING
Figures 12 and 13 show the time signals for two accelerometers and two strain gauges respectively. The accelerometer signals show the high acceleration levels on the NPS12 tailpipe and significant differences between the levels in the NPS12 and NPS20 pipes.
The strain signals are on either side of the stub-on weld. The rise in the average of the signal is seen early, indicating the static strain induced by the increase in quasi-static pressure. Then the mean of the signal decreases, indicating the strain from thermal effects as the pipe temperature lowers. The dynamic strain fluctuations about the mean are clearly seen. Once the flow stops around 60 seconds, the offset in the strain level compared to time zero is caused by the temperature reduction of the pipe.
No temperature compensation was implemented with the strain gauges, because the temperature effects are at frequencies below those of interest and can be filtered out of the signal.
FUTURE TESTING
Future testing will be done with several mitigation methods in order to quantify their effectiveness. Also, dynamic pressure transducers will be used to measure the internal dynamic pressure that is exciting the pipe wall. The primary challenge with the internal transducers is that the structure will need to be
stiffened in order to reduce the pipe wall vibration as the pressure transducers are sensitive to vibration in addition to the dynamic pressure.
Figure 12: Example acceleration signals: BLACK – on NPS12 tailpipe BLUE – on NPS20 header.
Figure 13: Example strain signals on two sides of a Stub-
on weld.
CONCLUSIONS The test system created for AIV testing is producing data
that will be used to evaluate the difference between different fittings and to develop improved AIV assessment tools. The vibration levels have proven to be very high, creating challenges with transducers failing during testing. The results from these tests will be published in future papers.
REFERENCES 1 Carucci, V.A. and Mueller, R.T., “Acoustically Induced
Piping Vibration in High Capacity Pressure Reducing Systems,” ASME 82-WA/PVP-8, 1982
5 Copyright © 2016 by ASME