testing the validity of phillips curve in the newly
TRANSCRIPT

TESTING THE VALIDITY OF PHILLIPS CURVE IN THE NEWLY INDUSTRIALIZED COUNTRIES (NICs)
LAI CHIN SIAN
This project is submitted in partial fulfillment of the requirements for the degree of Bachelor of Economics
with Honours (International Economics)
Faculty of Economics and Business UNIVERSITI MALAYSIA SARAWAK
2010

ABSTRACT
Testing the Validity of Phillips Curve in Newly Industrialized Countries (NICs)
By
Lai Clain Sian
The existence of Phillips curve has been debated over a century. However, it
cannot be denied that the Phillips curve does play an important role in the decision-
making process on macroeconomic policy. This study examines the validity of
Phillips curve in Newly Industrialized Countries (NICs) using quarterly data.
Various econometric methodologies like unit root tests, cointegrating test in the
ARDL framework, and Oranger causality test are employed in this study. This study
found that the Phillips curve does exist in NICs. Besides, Phillips curve exists in
Brazil, Mexico and Turkey for both short run and long run. Furthermore, the Phillip
curve is found to be valid and stable in Mexico and Turkey, whereas it is not stable
in Brazil, South Africa and Thailand. In addition, this study suggests that Brazil,
Mexico, South Africa, Thailand and Turkey should consider the Phillips curve
theory in making monetary policy and shift their economy to supply side economy.

ABSTRAK
Mengkaji Kewujudan Keluk Phillips di Newly Industrialized Countries (NICs)
Ok6
Lai Chin Sian
Kewujudan keluk Phillips telah dipertikaikan sejak abad yang lalu.
Walaubagaimanapun, keluk Phillips masih dikatakan penting dalam proses
pembuatan keputusan yang berkaitan dengan polisi makroekonomi. Kajian ini
bertujuan mengkaji kewujudan keluk Phillips di NICs dengan menggunakan suku
tahun data. Pelbagai jenis kaedah ekonometrik seperti ujian kepegunan, ujian
kepengamiran dalam bentuk ARDL, dan ujian penyebab Granger telah diggunakan
dalam kajian ini. Kajian ini mendapati kewujudan keluk Phillips di NICs. Selain
daripada itu, keluk Phillips didapati wujud pada jangka masa pendek dan panjang
bagi Brazil, Mexico dan Turki. Tambahan pula, keluk Phillips didapati wujud dan
stabil di Mexico dan Turki, tetapi tidak stabil di Brazil, Afrika Selatan dan Thailand.
Kajian ini juga mengcadangkan Brazil, Mexico, Afrika Selatan, Thailand dan Turki
harus mengpertimbangkan theori keluk Phillips semasa membuat keputusan yang
berkaitan dengan polisi kewangan dan mereka juga harus mengalihkan arah ekonomi
mereka ke ekonomi sebelah penawaran.

ACKNOWLEDGEMENT
First of all, I would like to express my thankfulness to my final year project
supervisor of the Faculty Economics and Business, Universiti Malaysia Sarawak
(UNIMAS). His guidance, patience, and helpfulness help me a lot in order to
complete this study. He is willing to teach and share his knowledge with me. Besides,
he supervises me by providing important information and numerous materials related
to my study. He is also willing to give advices to me in order to solve the problems
in my study and shows me the way to analyze and to run the data.
Besides, I would like to express my gratefulness to the Faculty of Economics
and Business, UNIMAS, which makes available the final year project guidelines
which help me a lot in accomplishing my final year project.
Last but not least, the understanding and helpfulness of my friends allow me
to obtain and collect useful information and data for my study. They taught me a lot
and explained the correct ways to me while I faced problems in running the data. So,
I would like to thank them for helping me to accomplish my final year project.
TABLE OF CONTENT
LIST OF TABLES
LIST OF FIGURES
CHAPTER ONE: INTRODUCTION
1.0 Background of Study
1.1 Phillips Curve
1.2 Background of Country
1.3 Inflation and Unemployment Rate in NICs
1.3.1 Brazil
1.3.2 India
1.3.3 Malaysia
1.3.4 Mexico
1.3.5 the Philippines
1.3.6 South Africa
1.3.7 Thailand
1.3.8 Turkey
1.4 Motivation
1.5 Problem Statement
1.6 Objectives of Study
1.6.1 General Objective
1.6.2 Specific Objectives
1.7 Significance of Study
XI
xii
1-20
1
3
5
7
7
8
9
11
12
13
14
15
16
17
18
18
19
19
vll

1.8 Organization of Study
CHAPTER TWO: LITERATURE REVIEW
2.0 Introduction
2.1 Theoretical Framework
2.1.1 Theory of Phillips Curve
2.1.2 Models of Phillips Curve
2.2 Empirical Testing Procedures
2.3 Empirical Evidences
2.4 Concluding Remarks
CHAPTER THREE: METHODOLOGY
3.0 Introduction
3.1 Model
3.2 Data Sample and Data Collection
3.3 Research Design
3.4 Data Analyzing Method
3.5 Unit Root Test
3.5.1 Augmented Dickey-Fuller (ADF) Test
3.5.2 Phillips Perron (PP) Test
3.5.3 Kwiatkowski-Phillips-Schmidz-Shin (KPSS) test
3.5.4 Ng and Perron Test
3.6 Autoregressive distributed lag (ARDL) model
3.6.1 CUSUM of Squares Test
20
21-47
21
21
21
24
30
38
41
4&61
48
48
49
50
51
51
51
53
53
55
56
57
Vlll

3.7 Granger Causality Test
3.8 Expected Results
3.9 Concluding Remarks
58
60
61
CHAPTER FOUR: EMPIRICAL RESULTS AND DISCUSSIONS 62-97
4.0 Introduction 62
4.1 Unit Root Test 64
4.1.1 Unit Root Test Results (ADF, PP and KPSS) for Inflation Rate 65
4.1.2 Ng and Perron Unit Root Test Results for Inflation Rate 69
4.1.3 Unit Root Test Results (ADF, PP, and KPSS) for 72
Unemployment Rate
4.1.4 Ng and Perron Unit Root Test Result for Unemployment 75
Rate
4.1.5 Summary of Unit Root Test Result for Inflation Rate and 77 Unemployment Rate
4.2 Autoregressive distributed lag (ARDL) model 78
4.2.1 Bound Testing Approach
4.2.2 ARDL Estimations
4.2.3 CUSUM of Square Test
80
85
91
4.3 Granger Causality Test 94
4.4 Concluding Remarks 97
CHAPTER FIVE: CONCLUSION AND POLICY 98-104
RECOMMENDATION
5.0 Introduction 98
5.1 Summary and Findings 98
ix

5.1.1 Summary 98
5.1.2 Findings 99
5.2 Policy Recommendation 101
5.3 Limitation of Study and Further Research Recommendation 103
5.5 Concluding Remarks 103
REFERENCES
X

LIST OF TABLES
Table 1: The Summary of the Literature Review 43-47
Table 2: Critical Bounds Values for F-test 57
Table 3: Results of ADF, PP and KPSS unit root test for Inflation Rate 68
Table 4: Result of Ng and Perron unit root test for Inflation Rate 70
Table 5: Summary of Unit Root Tests Result for Inflation Rate 71
Table 6: Results of ADF, PP and KPSS unit root test for Unemployment Rate 74
Table 7: Result of Ng and Perron unit root test for Unemployment Rate 76
Table 8: Summary of Unit Root Tests Result for Unemployment Rate 77
Table 9: Summary of Unit Root Test Results for Inflation Rate and 78
Unemployment Rate
Table 10: The Order of Lag based on Unrestricted Vector Autoregression 82
(VAR)
Table 11: Bounds Tests for the Existence of Cointegration
Table 12a: ARDL Estimations for Brazil
Table 12b: ARDL Estimations for Mexico
Table 12c: ARDL Estimations for South Africa
Table 12d: ARDL Estimations for Thailand
Table 12e: ARDL Estimations for Turkey
Table 13: Granger Causality Test Results
Table 14: Summary of Phillips curve Results
83
86
87
88
89
90
96
104
X1

LIST OF FIGURES
Figure 1: UK's Evidence on Phillips Curve 4
Figure 2: Inflation and Unemployment Rate in Brazil from 2001Q4-2009Q3 7
Figure 3: Inflation and Unemployment Rate in India from 1992Q 1-2003Q2 8
Figure 4: Inflation and Unemployment Rate in Malaysia from 9
1998Q1-2009Q1
Figure 5: Inflation and Unemployment Rate in Mexico from 2000Q2-2009Q2 11
Figure 6: Inflation and Unemployment Rate in Philippines from 12
1998Q 1-2009Q2
Figure 7: Inflation and Unemployment Rate in South Africa from 13
2000Q 1-2009Q2
Figure 8: Inflation and Unemployment Rate in Thailand from 2001Q 1-2009Q2 14
Figure 9: Inflation and Unemployment Rate in Turkey from 2000Q 1-2009Q3 15
Figure 10: The Trade-Off Relationship between Wage Inflation and 22
Unemployment Rate
Figure 11: CUSUM of Square Test for Brazil, Mexico, South Africa, 93 Thailand, and Turkey
X11

CHAPTER ONE
INTRODUCTION
1.0 Background of Study
Fifty years ago, Phillips (1958) introduced a statistically significant trade-off
relationship between wage of inflation and unemployment rate in United Kingdom.
The trade-off relationship between wage of inflation and unemployment rate in this
theory indicates that the variables are negatively correlated. Or it can be said that,
lower rate of unemployment will has a higher wages for the labor. Adversely, when
unemployment rate of the country is high, the labor wages is lower in that country.
The inverse relationship between wage of inflation and unemployment rate is being
known as Phillips curve. Phillips (1958) indicated that the trade-off relationship
between wage of inflation and unemployment in Phillips curve is due to the demand
for labor. When the demand for labor is high and there are few unemployed, the
firms will increase the wages a little above the prevailing rate to attract the most
suitable labor from other industries. Meanwhile, when the demand for labor is low
and unemployment rate is high, the wage rates will automatically fall slowly. Thus,
create a trade-off relationship between wage of inflation and unemployment rate.
Samuelson and Solow (1960) assumed that firm will automatically
increase the overall goods price level in market due to a rise in nominal wage. Since
the inflation in nominal wages is move together with inflation in prices, the wage of
inflation in Phillips curve is substituted by inflation in prices. The Phillips curve
illustrates that the level of inflation is positively related to economic activity where
I

proven by the lower rate of unemployment during inflation. The Phillips curve
hypothesis has been criticized by some researchers. However, it is become integral
to macroeconomic policy when many countries like United State and OECD
countries yield the similar trade-off relationship among inflation and unemployment
rate as portrayed by Phillips (1958) in United Kingdom.
Phillips curve is important for policymaker due to its inverse relationship
between inflation and unemployment rate since inflation and unemployment are the
macroeconomic key variables that concerned most by the policymakers around the
world. Sjauelson and Solow (1960) stated that Phillips curve is the menu for
policymaker to monitoring the inflation and unemployment rate. In Phillips curve, it
is suggested that if the government want to reduce unemployment rate, it has to
accept higher inflation rate as a trade-off. The situation is same when the government
wanted to reduce inflation rate in the country. Generally, during the inflation, the
main policy for the government is price stabilization or monetary policy.
Government will control the price level through monetary policy in order to reduce
the inflation in a country. Meanwhile, if the Phillips curve is valid for the country,
the dilemma that faced by the government is they have to accept higher
unemployment rate in order to reduce the high inflation rate in the country. This
condition makes the Philips Curve as an important consideration for government and
central bank in making an appropriate policy during inflation period. Hence, it is
important to investigate the existence of Phillips curve in a country.
This study is going to tests and investigates the existence of Phillips curve in
Newly Industrialized Countries (NICs) before them moving toward to industrialized
economies since Phillips curve is playing an important role in disinflation decision
2

making. NICs is chosen in this study because the characteristics of NICs like export
oriented, large inflow of foreign investment, and rapid economic growth seem that
the unemployment rate in NICs should be lower. Hence, a study on Phillips curve
should be done in NICs so that the policymaker in NICs would not face the dilemma
where they should accept high unemployment rate in order to disinflation in their
countries during the inflation period. Besides, there is seldom Phillips curve studies
have been done in developing countries. Most of the studies are done in developed
countries like Australia, Japan, United State and United Kingdom. Hence, NICs is
selected in this study to investigate the existence of Phillips curve.
1.1 Phillips Curve
Since Phillips curve is illustrating the relationship between inflation and
unemployment rate, thus the Phillips curve equation will only consists of two
variables, notably inflation rate and unemployment rate. The dependent variable in
Phillips curve equation is inflation rate which is normally measured by consumer
price index (CPI), while independent variable is unemployment rate. The
conventional Phillips curve equation that proposed by Phillips (1958) is takes the
following form:
ºA'c - wt-i =a+ Ql(uc - uc-, ) + Ec (1)
3

where, wt - wt-1 = changes in nominal wages
Ut = unemployment rate in year t
ut-1 = natural rage of unemployment or NAIRU (non-socelerating
rate of unemployment)
a= constant
ri = slope coefficient Et = error term
The slope coefficient ßl is in negative sign. According to Samuelson and Solow
(1960), the negative sign of ßl is due to an increase in bargaining power of workers
in periods which reflects lower levels of unemployment. The United Kingdom's
evidence on trade-off relationship between inflation and unemployment rate
(Phillips, 1958) is shown as below:
Figure 1: UK's Evidence ou PhRUps Curve
4

Figure 1 shows the scatter diagram of trade-off relationship between inflation
and unemployment rate in UK from 1861-1913. From the figure above, when
Phillips curve exists in a country, the government decreases the unemployment rate
from 6% to 4.5% will results the inflation rate to raise from -0.1% to 0.5%. Hence,
the existence of Phillips curve is important to be investigated so that the policymaker
can make an appropriate decision regarding to reduce the unemployment rate or
inflation rate.
1.2 Background of Country
Newly Industrialized Countries (NICs) is a category that is applies for several
countries around the world by political scientists and economists. Initially, the NICs
is refers to Four Asian Tigers, namely Hong Kong, Singapore, South Korea, and
Taiwan in the 1970s and 1980s. With the exceptionally fast industrial growth since
1960s, all these four countries have move their status from industrialized countries to
developed countries. Nevertheless, with the combination of an open political process,
high GDP growth, and export oriented economy policy, these countries are even
surpassed the ranks of many developed countries. All these four countries are
classified as high income economies by World Bank and advanced economics by
IMF. Now, the new NICs is represented by nine countries from different regions,
notably Brazil, China, India, Malaysia, Mexico, the Philippines, South Africa,
Thailand and Turkey.
The NICs is formed together with several similar characteristics which the
country members are listed by Bozyk (2006), Guillen (2003), Waugh (2000), and
5

Mankiw (2007). Among the characteristics are rapid economic growth, export
oriented, and large inflow of foreign investment. These characteristics indicate the
unemployment rate should be lower in NICs. Therefore, the Phillips curve study
should be done in NICs so that it can provide appropriate information to policymaker
when they are adopting the disinflation policy.
Generally, there are some researchers have examined the existence of Phillips
curve in selected NICs country members, notably Brazil, China, India, Malaysia, the
Philippines, Thailand and Turkey. All of them are yield the different results. Some
results show the existence of Phillips curve and some show the nonexistence of
Phillips curve. In ASEAN, both Wongwachara and Minphimai (2008) and Puzon
(2009) tested the Phillips curve in Malaysia, Indonesia, the Philippines and Thailand.
Both of them found that there is no Phillips relation hold in ASEAN. However,
Bhanthumnavin (2001) studied the Phillips curve in Thailand by using quarterly data
from 1993 to 2000 and proved that the Phillips curve in Thailand is only valid after
the onset Asian crisis 1997. Besides, both Furuoka (2007) and Tang and Lean (2007)
found a stable Phillips curve exists in Malaysia. Moreover, Scheibe and Vines (2005)
found that China is experienced a vertical long run Phillips curve. Paul (2009)
examined the existence of Phillips curve in India and found that the Phillips curve is
valid in India. Conversely, the Phillips curve is not valid in Brazil and Turkey. Tajra
(1999) examined the Phillips curve in Brazil and found that the Phillips curve does
not exists in Brazil. For the case of Turkey, the nonexistence of Phillips curve
between inflation and output is shown by Catik et al. (2008).
When the Phillips curve is exists and alive in NICs, the policymaker should
consider both the inflation and unemployment rate due to their trade-off relationship
6

in Phillips curve. Adversely, when Phillips curve does not hold in NICs, the
policymaker can choose any suitable monetary policy to reduce the inflation rate
without facing the dilemma among inflation and unemployment rate. So, it is
important to study the Phillips curve in NICs in order to provide guidelines for
government in implementing the monetary policy during inflation. In order to study
the Phillips curve, first of all, the trend of inflation and unemployment in NICs
should be studied. Hence, the following section discusses the trend of inflation and
unemployment rate in Brazil, India, Malaysia, Mexico, the Philippines, South Africa,
Thailand, and Turkey. Since China does not have complete data, hence it is not
included in the following section.
1.3 Inflation and Unemployment Rate in NICs
1.3.1 Brazil
Infatioa Rate in Brazil from 2061Q4-2IS Q3
2002 2003 2004 2005 2006 2007 2008 2009 ''ears
lWimploymeat Rite I. Brazil from 2001Q4-2009Q3
13
12
ilo
2002 2003 2004 2005 2006 2007 2008 2009
Vein
Figure 2: Inflation and Unemployment Rate in Brazil from 2001Q4-2009Q3
Figure 2 above shows the trend of inflation and unemployment rate in Brazil
from year 2001Q4 to 2009Q3. Brazil faced a relatively high accumulated inflation in
2003Q1, which is 6.22% compared to average 2%. However, in August 2003, Brazil
7

inflation rate dropped to 0.79% due to the Brazilian President changed the Brazil
market sentiment through fiscal discipline, floating exchange rate and inflation
targeting. After a sharp declined in 2003 inflation rate, Brazil inflation rate is
fluctuated around 2% and experienced a small decline in 2006Q2 before increased to
1.82% in 2008Q 1 due to the global financial crisis.
Compared to Brazil inflation trend, the unemployment rate is in downward
trend. The Brazil unemployment rate in 2003Q3 hit the highest value along the
sample period, which is 12.9%. This is because the inflation targeting that
implemented by Brazilian President in order to control high inflation rate in 2003 has
led to booming recession. While in 2009Q1, the unemployment rate increased from
7.3% in 2008Q4 to 8.57% due to the global financial crisis. However, the
unemployment rate decreased again to 7.93% in 2009Q3.
13.2 India
Inflation Rate in I. äa from I992QI-2eSJQ2
92 93 94 95 98 97 98 99 00 01 02
ti'eatn
Unemployment Rate In India from 1992Q1-2003Q2
4
J\} 96 -
Li!
92 93 94 95 '96''97' 6 97 98''99 00 01 02
Venn
Figure 3: Inflation and Unemployment Rate in India from 1992Q1-2003Q2
8

From the Figure 3 above, it can be seen that India has a stable inflation rate
along the sample size. However, there is a sharp slump of inflation rate in 1998Q4.
The inflation rate is decreased from 4.50% in 1998Q3 to -3.92% in 1998Q4.
However, the sharp slump of inflation in 1998Q4 is not due to the Asian financial
crisis. The inflation rate of India increased again to around 2.11% in 1999Q3. After
that, the inflation rate of India is stable and not much fluctuates from 1999Q4 to
2003Q2.
Besides, India also has a more stable unemployment rate compared to other
NICs. It can be seen that, the highest unemployment rate is 3.08% in 1997Q2.
Meanwhile, the lowest unemployment rate along the sample size is -2.17% in
2002Q1. In overall, it can be said that the unemployment rate is stable and fluctuated
in around 1% in Brazil.
1.3.3 Malaysia
laflatioa Rate I. Nblaysla from 19*QI-2009QI
98 99 00 01 02 03 04 05 06 07 08 Venn
I1aeaploymeot Rate In Malaysia from 199$QI-2009Q1 f8
44
' 40
3.6
32
28 98 99 00 01 02 03 04 05 06 07 08
Venn
Figure 4: Inflation and Unemployment Rate in Malaysia from 1998Q1-2009Q1
9

Figure above shows that Malaysia experienced a stable inflation rate before a
sharp rise in 2008Q2 and a sharp drop in 2008Q4. Both the sharp rise and sharp drop
of inflation rate in Malaysia is caused by the current subprime mortgage crisis.
Malaysia is greatly affected by the global crisis that is started in US due to its
international trade relationship with US. In the beginning of crisis, Malaysia's
inflation rate rose to 4.11% in 2008Q2 from a lower rate of 2.3% in 2008Q1. After
gone through a high inflation rate, Malaysia experienced a recession in 2008Q3,
which the inflation rate dropped to -1.57%. Even though the inflation rate increased
to -1.06% in 2008Q4, however, Malaysia is still in a recession and recovery situation.
Malaysia has an inconsistent trend of unemployment rate. Actually, the
unemployment rate in Malaysia is considered low compared to other NICs members
except Brazil and Thailand. The highest rate of unemployment in Malaysia is 4.5%
in 1999Q I and the lowest is 2.9% in 1998Q 1. The unemployment rate in 2008Q4
and 2009Q1 begins to creep upward after the economy shows signs of weaknesses
toward the end of 2008. It can be shown in above figure where the unemployment
rate is rise up sharply in 2009Q 1.
10

1.3.4 Mezico
2.5
2.0J
g! 0.5 x
o. oa
-0. b
I. Rate is melke iM 200SQ2-20"Q2 Umop- 3 eat Rase b melke M 2100Q2-I0lQ2 6.
00 01 02 03 04 05 06 07 00
Venn
6.
ý A
I1 E3ý x
2ý
I 00 01 02 03 04 05 06 07 08
Ycws
Figure 5: I. Aatio, and Unemployment Rate im Mexico from 2000Q2-2009Q2
Mexico has a more fluctuating inflation rate compared to other members.
Even though Mexico has a more fluctuating inflation rate, but the inflation rate is
still remains in lower rate. After the 1994 crisis, Mexico improved the country's
macroeconomics fundamentals. Hence, it is not influenced much by the 2002 South
American crisis. Figure above shows the inconsistent of Mexico inflation rate, which
is dropped and then rose back again. There is a sharp drop in 2007Q2, which is from
1.34% in 2007Q 1 dropped to -0.11 %. In 2008Q4 and 2009Q 1, the inflation rate rose
to 2.33% before dropped to 1.41% in 2009QI. This is because of the current global
crisis.
Unemployment rate in Mexico is in upward trend which indicates that the
unemployment rate is in increasing rate. The Mexico unemployment rate increased
from initially 1.8% in 2001 Q4 to 5.06% in 2009Q 1. The keep increasing
unemployment rate which started from 2008Q3 until 2009Q I is caused by the
subprime mortgage crisis. The unemployment rate increased from 4.19% in 2008Q3
to 4.3% in Q4 and then reached 5.17% in 2009Q2.
11
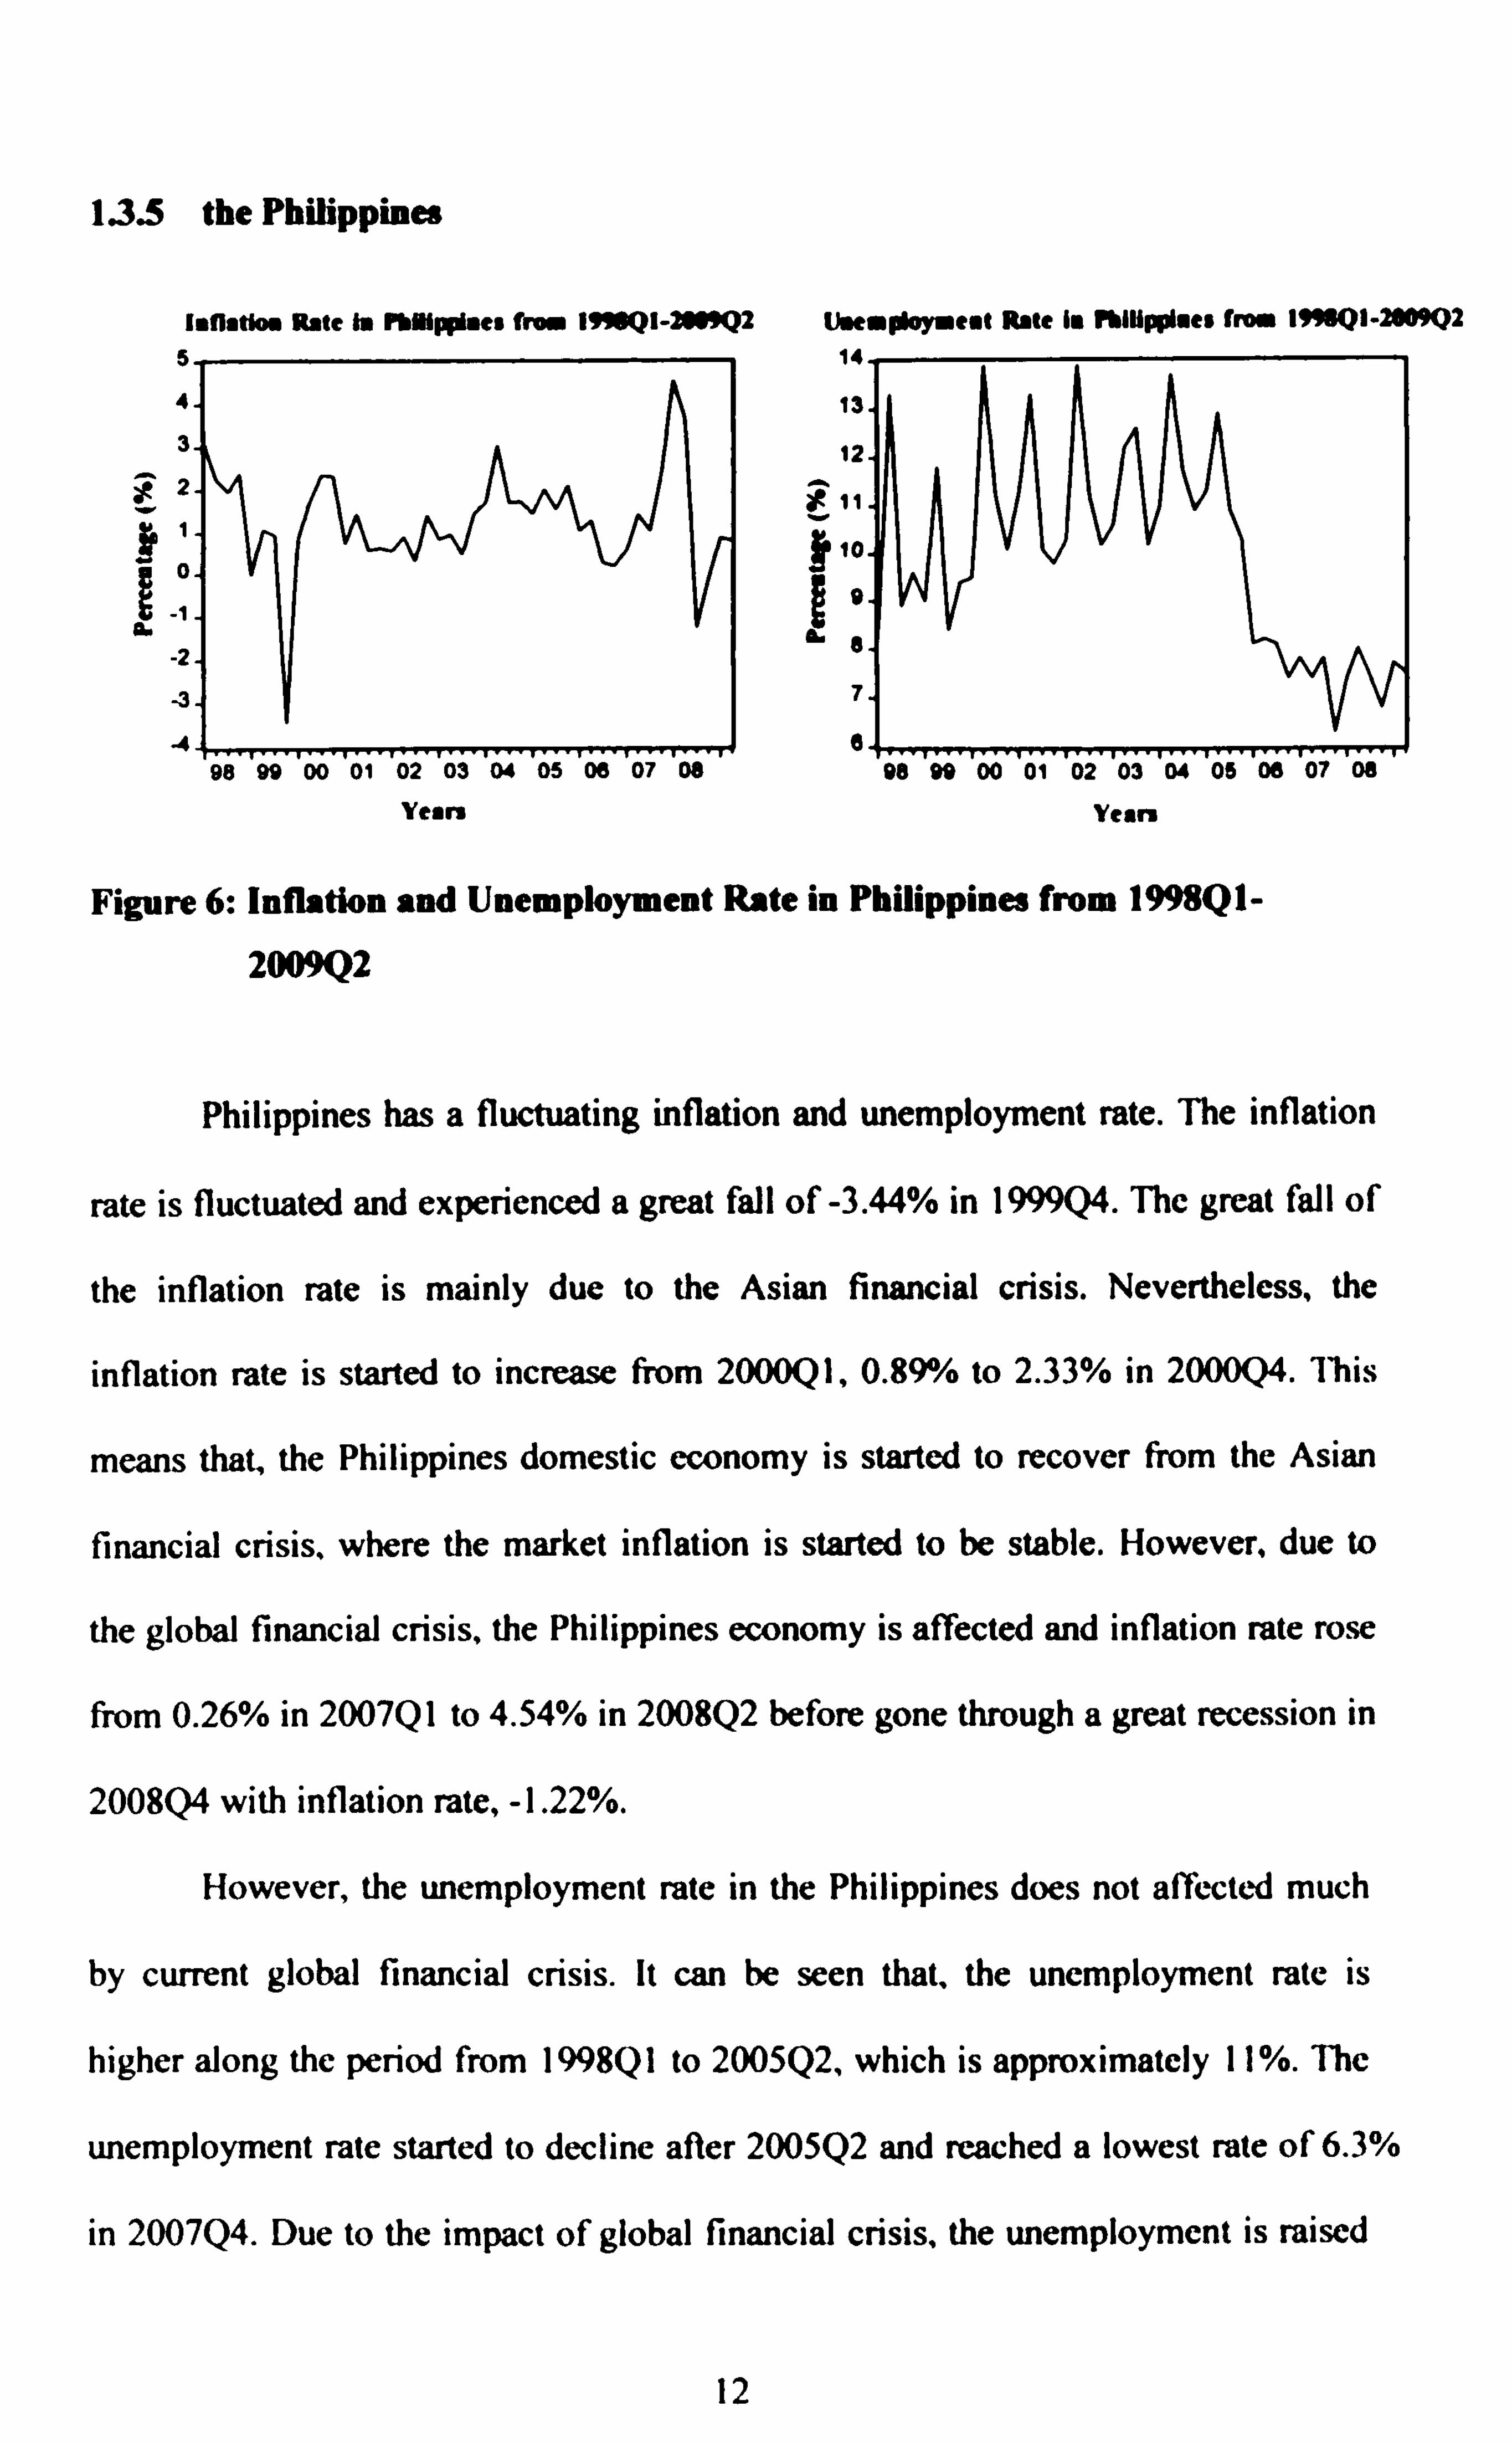
1.3.5 the Philippines
IaOatioa Rate In pYYipphee from I99SQI-2999Q2 UaemptoMeat Rate I. I7lüppluee frm 199ZIQ1-2009Q2
S 14
13J
98 99 00 01 02 03 04 05 06 07 08
Venn
X >>a .. 12. '
0 9
e
W
96 99 00 01 02 03 04 05 06 07 08
Vein
Figure 6: Inflation and Unemployment Rate in Philippines from 1998Q1-
2009Q2
Philippines has a fluctuating inflation and unemployment rate. The inflation
rate is fluctuated and experienced a great fall of -3.44% in 1999Q4. The great fall of
the inflation rate is mainly due to the Asian financial crisis. Nevertheless, the
inflation rate is started to increase from 2000Q1,0.89% to 2.33% in 2000Q4. This
means that, the Philippines domestic economy is started to recover from the Asian
financial crisis, where the market inflation is started to be stable. However, due to
the global financial crisis, the Philippines economy is affected and inflation rate rose
from 0.26% in 2007Q1 to 4.54% in 2008Q2 before gone through a great recession in
2008Q4 with inflation rate, -1.22%.
However, the unemployment rate in the Philippines does not affected much
by current global financial crisis. It can be seen that, the unemployment rate is
higher along the period from 1998Q 1 to 2005Q2, which is approximately 11%. The
unemployment rate started to decline after 2005Q2 and reached a lowest rate of 6.3%
in 2007Q4. Due to the impact of global financial crisis, the unemployment is raised
12

a little bit from 6.3% in 2007Q4 to 8% in 2008Q2. After that, the unemployment has
dropped to 6.8% in 2008Q4 before rose back to 7.7% in 2009Q1.
1.3.6 South Africa
3, '
ý Y 1- ý
I k:
it -1ä
-3
ieftatlar Rabe I. South Africa in= 2NIQ1-2009Q2 Uaemploymeat Rate I. Sorg Africa kr. 2NHQ1-2I Q2 4 32
X29, z
1726 yY ` 24 Y
96
-2 J
00 .ri.. T/.
ý. .i
03 .i0.4
/ý( W
/ý W
ryý / \Iý VL V/ V
20 00 01 02 03 04 05 06 07 06
Years Years
Figure 7: Inflation and Unemployment Rate in South Africa from 2000Q1-
2009Q2
South Africa has a great deflation in 2003Q3 before its inflation rate
continued to rise and create an increasing trend. In 2003Q3, South Africa has gone
through a disinflation with the inflation rate of -0.80%, which is a sharp drop from
3.31% in 2002Q2. After that, the South Africa inflation rate continued to rise and
create an upward trend. After reached 3.1% in 2008Q3, the inflation rate started to
drop to 0.78% in 2008Q4 during the global financial crisis.
Despite of upward trend in South Africa inflation rate, the unemployment
rate for South Africa is in downward trend. From the highest rate of 30.4% in
2002Q3, the South Africa unemployment rate decreased to 21% in 2007Q4.
13

However, the unemployment rate rose back to 23.3% in 2009Q 1 due to the subprime
mortgage crisis. Nevertheless, it is still in low value compared to 30.4% in 2002Q3.
13.7 Thailand
5
Inflation Rate I. 7ti. Ya. d fr. a 2W101-20M2 Uaewployaeat Rate I. 7lailaad from 2N1QI-2019Q2
4
3
X2
'1 äo
-1
-3
-4 2001 2002 2003 2004 2005 2006 2007 2006 2001 2002 2003 2004 2005 2006 2007 2008
5
4
I V
ý
2
I
Veen Veen
Figure 8: Inflation and Unemployment Rate in Thailand from 2001Q1-2009Q2
Overall, Thailand has a quite stable inflation rate which is fluctuating
approximately at 1% from 2001Q1 to 2004Q4. The inflation rate increased to 2.7%
in 2005Q3 from 2% in 2005Q2. Then, the inflation rate is in inconsistent trend from
2005Q4 to 2008Q2 before experienced a sharp drop in 2008Q4 which is from
highest value of 4.23% in 2008Q2 dropped to -3.44% in Q4. The sharp drop is
caused by the subprime mortgage crisis. After the sharp drop, the inflation rate
increased to -0.71% in 2009Q I and be estimated recovery soon from the global
financial crisis.
Similar with South Africa, the Thailand unemployment rate is also in
downward trend. It is an inconsistent downward trend. From a high rate of 4.63% in
2001Q1, the unemployment rate decreased to 1. l 9% in 2008Q3. However, during
14