testing two subsidized employment approaches …
TRANSCRIPT

THE SUBSIDIZED AND TRANSITIONAL EMPLOYMENT DEMONSTRATION
Implementation and Early Impacts of the Los Angeles
County Transitional Subsidized Employment Program
OPRE Report 2016-77
November 2016
TESTING TWO SUBSIDIZED EMPLOYMENT APPROACHES
FOR RECIPIENTS OF TEMPORARY ASSISTANCE
FOR NEEDY FAMILIES

Testing Two Subsidized Employment Approaches for Recipients of Temporary Assistance for Needy Families:
Implementation and Early Impacts of the Los Angeles County Transitional Subsidized Employment Program
OPRE Report 2016-77 November 2016
Authors: Asaph Glosser (MEF Associates), Bret Barden (MDRC), and Sonya Williams (MDRC), with Chloe Anderson (MDRC)
Submitted to:
Girley Wright and Erica Zielewski, Project Officers Office of Planning, Research and Evaluation
Administration for Children and Families U.S. Department of Health and Human Services
Project Director: Dan Bloom MDRC
16 East 34th Street New York, NY 10016
Contract Number: HHSP 233-2010-0029YC
This report is in the public domain. Permission to reproduce is not necessary.
Suggested citation: Glosser, Asaph, Bret Barden, and Sonya Williams, with Chloe Anderson. (2016). Testing Two Subsidized Employment Approaches for Recipients of Temporary
Assistance for Needy Families: Implementation and Early Impacts of the Los Angeles County Transitional Subsidized Employment Program. OPRE Report 2016-77. Washington, DC: Office
of Planning, Research and Evaluation, Administration for Children and Families, U.S. Department of Health and Human Services.
Disclaimer: The views expressed in this publication do not necessarily reflect the views or policies of the Office of Planning, Research and Evaluation, the Administration for Children and
Families, or the U.S. Department of Health and Human Services.
This report and other reports sponsored by the Office of Planning, Research and Evaluation are available at http://www.acf.hhs.gov/programs/opre.

MDRC and subcontractors MEF Associates, Branch Associates, and Decision Information Resources (DIR), Inc., are conducting the Subsidized and Transitional Employment Demonstra-tion under a contract with the Administration for Children and Families in the U.S. Department of Health and Human Services (HHS), funded by HHS under a competitive award, Contract No. HHSP 233-2010-0029YC. The project officers are Girley Wright and Erica Zielewski. The Rockefeller Foundation also provided funding to support the demonstration. Dissemination of MDRC publications is supported by the following funders that help finance MDRC’s public policy outreach and expanding efforts to communicate the results and implica-tions of our work to policymakers, practitioners, and others: The Annie E. Casey Foundation, Charles and Lynn Schusterman Family Foundation, The Edna McConnell Clark Foundation, Ford Foundation, The George Gund Foundation, Daniel and Corinne Goldman, The Harry and Jeanette Weinberg Foundation, Inc., The JBP Foundation, The Joyce Foundation, The Kresge Foundation, Laura and John Arnold Foundation, Sandler Foundation, and The Starr Foundation. In addition, earnings from the MDRC Endowment help sustain our dissemination efforts. Con-tributors to the MDRC Endowment include Alcoa Foundation, The Ambrose Monell Foundation, Anheuser-Busch Foundation, Bristol-Myers Squibb Foundation, Charles Stewart Mott Founda-tion, Ford Foundation, The George Gund Foundation, The Grable Foundation, The Lizabeth and Frank Newman Charitable Foundation, The New York Times Company Foundation, Jan Nichol-son, Paul H. O’Neill Charitable Foundation, John S. Reed, Sandler Foundation, and The Stupski Family Fund, as well as other individual contributors. The findings and conclusions in this report do not necessarily represent the official positions or policies of the funders, nor does mention of trade names, commercial practices, or organizations imply endorsement by the U.S. government. For information about MDRC and copies of our publications, see our website: www.mdrc.org.

iii
Overview
Introduction Securing unsubsidized employment in a competitive labor market can be difficult for job seekers with limited education or work experience, especially if they are caring for young children, doubly so if they are single parents. Some public assistance programs — state Temporary Assistance for Needy Families (TANF) programs, for example — attempt to make recipients more employable by temporarily providing subsidized employment to people who cannot find them in the regular labor market, using public funds to pay all or some of their wages.
Subsidized jobs can be designed to teach participants basic work skills, give them work experience that can be used on future résumés, or help them get a foot in the door with employers. Past research has found mixed results regarding these programs’ ability to affect participants’ employment rates or earnings in the long term, or the rates at which they receive TANF benefits. The mixed track record of subsidized employment programs has pushed the field to identify new models for subsidized employment. This study evaluates two approaches to subsidized employment for TANF recipients in Los Angeles County.
Primary Research Questions The study seeks to answer the following research questions:
• How was the program designed and operated?
• What are the impacts of the program’s two approaches on employment, TANF receipt, income, and overall well-being, relative to what would have happened in the absence of the program?
• Which of the two approaches appears to be more effective for which population subgroups?
• To what extent do the two approaches’ costs differ from the amounts expended on behalf of individuals randomly assigned to a control group that could not receive program services? How does this cost differential relate to the benefits associated with program impacts, if any?
Purpose This report presents implementation findings and interim impact results (after one year) from a random assignment evaluation of subsidized employment for TANF recipients in Los Angeles County. The study examines the impact of two distinct approaches to subsidized employment. The first, Paid Work Experience (PWE), subsidizes the wages of individuals placed at nonprofit or public-sector employers. The second, On-the-Job Training (OJT), offers wage subsidies to for-profit, private-sector employers who agree to place employees onto their payrolls after an initial two-month tryout period; if they do, the wage subsidies can continue up to an additional four months. The study

iv
examines the implementation and impacts of both approaches to subsidized employment, and draws some initial comparisons between them.
Key Findings Findings from the report include the following:
• The two approaches had substantially different subsidized employment placement rates. Forty-two percent of OJT participants were placed in subsidized employment, compared with 80 percent of PWE participants.
• PWE placements lasted an average of more than 64 days longer than OJT placements. Compared with OJT placements, PWE placements were far more likely to continue beyond the second month, the time when OJT participants were to move onto employers’ payrolls. Both types of placements were designed to last up to six months.
• Members of the control group received other types of welfare-to-work services. Members of the control group were almost as likely as members of the program groups to receive welfare-to-work services other than subsidized employment. The control group was more likely than either of the program groups to be involved in education.
• Both PWE and OJT group members had higher rates of work and earnings than control group members. In the first year after random assignment, both PWE and OJT group members were more likely to work, worked more quarters on average, and had higher average earnings than control group members. These differences were largest among sample members who had not been employed in the year before random assignment. The differences also declined as people left subsidized jobs. There were only a few modest differences between the program participants and control group members in other outcomes such as TANF receipt or overall well-being.
Methods The evaluation includes an implementation study, an impact study, and a benefit-cost analysis. This report presents implementation findings and interim impact findings (after one year). Benefit-cost findings and longer-term impact findings (after 30 months) will be presented in a future report.
The implementation study describes the PWE and OJT approaches as they were designed and as they ultimately operated. Data sources for the implementation study include staff interviews, observations, and participation data. The implementation sections of this report integrate qualitative and quantitative data from these various sources to create a coherent picture of the implementation of the programs.
The impact study uses a randomized controlled trial design in which individuals eligible for and interested in the subsidized jobs program were randomly assigned to PWE, to OJT, or to a control group who does not have access to either of these subsidized employment approaches. This design makes it possible to compare each subsidized employment approach with the control group, and to compare them with one another. The study will evaluate impacts on employment and earnings,

v
TANF receipt, and overall well-being, among other areas. Data sources for the impact study include administrative wage records, subsidized employment payroll records, TANF benefit payment records, and surveys conducted approximately 4, 12, and 30 months after participants entered the study.

vi
Contents
Overview iii List of Exhibits viii Acknowledgments x Executive Summary ES-1 Chapter 1 Introduction 1
Background and Policy Context 1 The STED Project 4 The Evaluation Design 6 The Implementation Study 7 The Impact Study 8 The Structure of This Report 10
2 Area Background 12 Los Angeles County: A Unique Setting for a Subsidized Employment Program 12 Subsidized Employment for TANF Recipients in Los Angeles County 14 The Growth of the Transitional Subsidized Employment Program 16
3 Program Models, Recruitment, and Sample Characteristics 19 The Approaches’ Intended Models 19 Recruitment and Study Enrollment 23 Baseline Characteristics 26
4 Implementation of the Two Types of Subsidized Employment 31 Placement Rates and Participation in Welfare-to-Work Activities 31 OJT and PWE in Practice 39 Summary of Implementation Findings 49
5 Impacts 51 Impacts on Participation and Service Receipt 52 Impacts on Employment and Earnings 56 Impacts on TANF Benefits and Child Care 62 Impacts on Economic and Personal Well-Being 64 Summary of Impact Findings 68
6 Summary, Conclusion, and Next Steps 73 Next Steps 74

vii
Appendix A Impacts on Child Care Arrangements After One Year 76 B Survey Response Analysis 79
References 89

viii
List of Exhibits
Table
ES.1 Impacts on Employment and Earnings After One Year ES-8
2.1 Total Number of Los Angeles GAIN Participants at the Start and End of the Study Period 15
3.1 Subsidy Structures 20
3.2 Sample Characteristics at Random Assignment 28
5.1 Impacts on Participation and Service Receipt After One Year 53
5.2 Impacts on Employment and Earnings After One Year 57
5.3 Impacts on Employment and Earnings After One Year, by Employment Status at Random Assignment 65
5.4 Impacts on TANF Receipt After One Year 67
5.5 Impacts on Well-Being and Social Support After Four Months 69
5.6 Impacts on Economic and Personal Well-Being After One Year 71
A.1 Impacts on Child Care Arrangements After One Year 77
B.1 Selected Baseline Characteristics of Survey Respondents and Nonrespondents, by Survey 82
B.2 Joint Test of Differences Between Survey Respondents and Nonrespondents, by Survey 83
B.3 Selected Baseline Characteristics of Survey Respondents, by Research Group and Survey 84
B.4 Joint Test of Differences Between Research Groups Among Survey Respondents, by Survey 85
B.5 Joint Test of Impact Differences Between Survey Respondents and Nonrespondents, by Survey 87
B.6 Estimated Regression Coefficients for Program Impacts for Survey and Full (Imputed) Sample 88

ix
Figure
2.1 Low-Income Job Density, GAIN Offices, and Worksource Centers in Los Angeles County 13
2.2 GAIN Regions, Regional Offices, and Worksource Centers 17
3.1 How a Participant Entered Transitional Subsidized Employment 25
3.2 Study Participant Enrollment Over Time 27
4.1 OJT Placement Rate, Average Placement Duration, and Number of Placements, by Worksource Center 34
4.2 PWE Placement Rate, Average Placement Duration, and Number of Placements, by Worksource Center 35
4.3 Percentage of OJT Placements Lasting Two Months or Longer, by Worksource Center 37
4.4 Numbers of OJT and PWE Employers and Placements 43
4.5 Placements Among OJT and PWE Employers 44
5.1 PWE Employment and Earnings Over Time 61
5.2 OJT Employment and Earnings Over Time 63
Box
1.1 Other Programs in the STED Evaluation 3
1.2 Short-Term Findings from the Department of Labor Evaluation in Fort Worth 4
4.1 Worksource Center Staffing 46

x
Acknowledgments
This report would not have been possible without the support of many individuals and organiza-tions. The Subsidized and Transitional Employment Demonstration and Evaluation Project (STED) is conceived and sponsored by the Administration for Children and Families in the U.S. Department of Health and Human Services (HHS). Dedicated staff members in that agency have been instrumental to the success of the project, in particular Girley Wright and Erica Zielewski.
At the Los Angeles Department of Public Social Services (DPSS), we would like to thank Luther Evans, Lorraine Sinelkoff, Silvia Dueñas, Patricia Buenrostro, and Michael Bono. At South Bay Workforce Investment Board, we would like to thank David Nelms, Tracey Atkins, and Francisco Carrillo. We would also like to acknowledge and thank the many DPSS and Worksource Center staff members across Los Angeles County who implemented the intervention. We also thank Chris Warland at the National Transitional Jobs Network for assistance with the implementation of this study.
At MEF, Mike Fishman co-led the site work and implementation research and provided a thoughtful review of the report; Emmi Obara was also instrumental in site work and imple-mentation research. At MDRC, Dan Bloom, Cindy Redcross, Vanessa Martin, Charles Micha-lopoulos, Gayle Hamilton, Richard Hendra, Johanna Walter, John Hutchins, and Gordon Berlin provided thoughtful comments on several drafts of this report. Michelle Manno capably managed the report’s production. In addition to the authors, Melanie Skemer, Chloe Anderson, Sally Dai, Danielle Cummings, Gary Reynolds, and Adrienne Yao were part of the stellar quantitative analysis team who processed the surveys and federal and local data sets used in the report, and offered insightful recommendations. Danielle Craig coordinated the production of the report. Joshua Malbin edited the report and Carolyn Thomas prepared it for publication.
Finally, we extend our deep appreciation to the thousands of women and men who par-ticipated in the study and gave generously of their time to respond to surveys and participate in interviews and focus groups.
The Authors

ES-1
Executive Summary
Securing unsubsidized employment in a competitive labor market can be difficult for job seekers with limited education or work experience, especially if they are caring for young children, doubly so if they are single parents. Some public assistance programs — state Tempo-rary Assistance for Needy Families (TANF) programs, for example — attempt to make recipi-ents more employable by offering them subsidized employment. Subsidized employment programs provide jobs to people who cannot find them in the regular labor market, using public funds to pay all or some of their wages. Subsidized jobs can be designed to teach participants basic work skills, provide them with work experience that can be used on future résumés, or help them get a foot in the door with employers. Past research has found mixed results regard-ing these programs’ ability to affect participants’ employment rates or earnings in the long term, or the rates at which they receive TANF benefits.
This report presents implementation findings and interim impact results (after one year) from a random assignment evaluation of subsidized employment for TANF recipients in Los Angeles County. The study is part of a broader evaluation being funded by the Administration for Children and Families in the U.S. Department of Health and Human Services, called the Subsidized and Transitional Employment Demonstration (STED). The Los Angeles STED study examines how two distinct approaches to subsidized employment affect TANF recipients’ employment, earnings, TANF receipt, and overall well-being. The first approach subsidizes the wages of individuals placed at nonprofit or public-sector employers. The second approach offers wage subsidies to private-sector employers. Both of these subsidized employment approaches target TANF recipients who have not been able to secure employment in the competitive labor market following a supervised job-search period.
Background and Context Previous efforts to use subsidized employment to improve the long-term employment outcomes of hard-to-employ populations have had mixed results. Bloom outlines the history of subsidized and transitional employment tests, finding a long legacy of such programs.1 Some programs have resulted in long-term gains in employment and earnings. However, most recent studies suggest that while subsidized employment can generate impacts on employment and earnings during the subsidy period, those impacts recede quickly after the subsidy ends.2
1Dan Bloom, Transitional Jobs: Background, Program Models, and Evaluation Evidence (New York:
MDRC, 2010). 2A recent study of one program targeting TANF recipients in Philadelphia, which did not find long-term
positive impacts on employment, did find sustained positive impacts on measures of TANF receipt. Program (continued)

ES-2
Subsidized employment received renewed attention as a result of the recent recession. In 2009, when the national unemployment rate reached 10 percent, states used funds from the American Recovery and Reinvestment Act’s TANF Emergency Fund to subsidize jobs for about 280,000 people. Forty states put at least some people to work under its auspices before the funding expired in late 2010, and 14 states (including California) and the District of Columbia each placed at least 5,000 people in subsidized jobs.
Most of the TANF Emergency Fund programs (particularly the larger ones) broadly targeted unemployed workers. Eligibility was not limited to TANF recipients, people with criminal records, or other disadvantaged groups who had been the focus of most earlier studies of subsidized employment programs. Notably, about half the TANF Emergency Fund place-ments nationwide were summer jobs for young people. Also, many of the programs did not emphasize helping participants make a transition to unsubsidized jobs; instead, they emphasized “rapid job placement to alleviate unemployment.”3 Like previous efforts in economic down-turns designed to give unemployed people the chance to earn income, the TANF Emergency Fund programs served many people who had steady work histories, and the models assumed that those people would return to regular jobs once the labor market improved. The TANF Emergency Fund programs were popular in many states, with governors from both parties expressing strong support for them. The experience, while relatively short-lived, rekindled interest in subsidized employment more broadly.
In 2010, the U.S. Departments of Health and Human Services and Labor made substan-tial investments to further advance the field’s understanding of subsidized employment. Through STED, the Department of Health and Human Services is funding studies of seven subsidized employment interventions. These studies explore how subsidized employment strategies can meet the needs of TANF recipients and other low-income young people and adults. Two of these studies, including the Los Angeles study that is the subject of this report, focus specifically on subsidized employment for TANF recipients.4
group members were less likely than control group members to be receiving cash assistance 18 months after they enrolled in the program. See Dan Bloom, Sarah Rich, Cindy Redcross, Erin Jacobs, Jennifer Yahner, and Nancy Pindus, Alternative Welfare-to-Work Strategies for the Hard-to-Employ: Testing Transitional Jobs and Pre-Employment Services in Philadelphia (New York: MDRC, 2009).
3Mary Farrell, Sam Elkin, Joseph Broadus, and Dan Bloom, Subsidized Employment Opportunities for Low-Income Families: A Review of State Employment Programs Created Through the TANF Emergency Fund (Washington, DC: Office of Planning, Research and Evaluation, Administration for Children and Families, U.S. Department of Health and Human Services, 2011).
4For a summary of other subsidized employment tests being funded by the Departments of Health and Human Services and Labor see Dan Bloom, Testing the Next Generation of Subsidized Employment Pro-grams: An Introduction to the Subsidized and Transitional Employment Demonstration and the Enhanced
(continued)

ES-3
The STED Evaluation in Los Angeles County The mixed track record of subsidized employment programs described above has pushed the field to identify new models for subsidized employment. This study of Los Angeles’s Transi-tional Subsidized Employment program is one such attempt. Targeting TANF recipients in Los Angeles County who failed to find unsubsidized jobs during a four-week “job club,” the study is an opportunity to understand the extent to which two different approaches to subsidized employment can improve participants’ employment and earnings.
• Paid Work Experience, or PWE, involves a six-month, fully subsidized placement in a public-sector or nonprofit position. Participants do not go onto employers’ payrolls, and instead are paid (at the minimum wage) by a Work-force Investment Board acting as an intermediary. PWE seeks to increase the employability of participants by giving them work experience.
• On-the-Job Training, or OJT, is a private-sector wage subsidy approach. Participants are placed in jobs with for-profit, private employers; they spend the first two months on the payroll of a Workforce Investment Board and the final four months on employers’ payrolls, with employers receiving a partial subsidy of up to $550 per month. This approach seeks to replicate more closely a “real-world” work environment, with the goal of permanent, unsub-sidized placement at the same employer.5
The evaluation set out to answer the following questions:
• How was the program encompassing these two approaches designed and operated?
• What are the impacts of these two approaches on employment, TANF re-ceipt, income, and overall well-being, relative to what would have happened in the absence of the program?
• Which of the two approaches appears to be more effective for which popula-tion subgroups?
Transitional Jobs Demonstration, OPRE Report 2015-58 (Washington, DC: Office of Planning, Research and Evaluation, Administration for Children and Families, U.S. Department of Health and Human Services, 2015).
5Many articles and research studies have defined “on-the-job training” models, particularly in the work-force system. The OJT approach implemented in Los Angeles County differs from other on-the-job training models in several ways, including the structure of the subsidy, the point at which a participant transitions onto an employer’s payroll, and the availability of training that complements the placement. This report nevertheless refers to the approach as “On-the-Job Training” both for the sake of consistency and because that is what it is called by the Los Angeles Department of Public Social Services, which runs the program.

ES-4
• To what extent do the two approaches’ costs differ from the amounts ex-pended on behalf of individuals randomly assigned to a control group? How does this cost differential relate to the benefits associated with program im-pacts, if any?
To answer these questions, the evaluation includes an implementation study, an impact study, and a benefit-cost analysis. The impact study uses a randomized controlled trial design, in which individuals eligible for and interested in the subsidized jobs program were randomly assigned to one of the two subsidized employment approaches (the two program groups) or to a control group who did not have access to these subsidized job opportunities but who could receive other welfare-to-work services. The MDRC team is following the program and control group members for 30 months using surveys and government records to measure outcomes in three areas: employment and earnings, TANF benefit receipt, and overall well-being. If differ-ences emerge between the program groups and the control group over time, and these differ-ences are statistically significant, then the differences can be attributed with some confidence to the subsidized employment approaches. Such differences are referred to as “impact estimates.” In addition to examining how the outcomes of the program groups compare with those of the control group, the evaluation will also examine how the outcomes of the PWE and OJT pro-gram groups compare with one another.6
This report focuses mostly on the implementation study, but it also describes the two approaches’ impacts in the first year after people were randomly assigned to one of the three groups. One year of follow-up is not long enough to fully assess the two approaches’ impacts on many important outcomes. In particular, program group members spent a substantial part of the first year in subsidized jobs, so the programs’ long-term impacts on unsubsidized employment are not yet clear.7 Impact results at 30 months after random assignment will be presented in a later report, as will the findings from the benefit-cost analysis.
6It is too early to assess the two approaches’ long-term impacts on unsubsidized employment. Because this
report only follows participants’ outcomes through one year, the analyses presented here may be considered “exploratory,” and therefore do not use formal statistical methods to account for the fact that several program-control differences are examined. When many such comparisons are made, there is a greater probability that some of the differences will be found to be statistically significant even though they did occur by chance. The report’s analysis addresses this issue by minimizing the number of comparisons and highlighting those that are most important. The 30-month report will present “confirmatory” impacts on earnings in Year 2 through the first half of Year 3, a time when the longer-run effects should be evident.
7Although most impact analyses presented in this report are within one year after random assignment, employment and earnings in the first quarter of Year 2 are also included because they show a time when the vast majority of program group participants had completed work in their subsidized jobs, and thus provide a preview of what their outcomes might be after the subsidy ends. However, even in the first quarter of Year 2, around 2 percent of PWE and OJT program group members were still in subsidized employment.

ES-5
The Transitional Subsidized Employment Program Los Angeles County’s TANF agency has traditionally viewed subsidized employment as a viable option for all TANF recipients who are required to meet work-participation requirements and who are unable to secure unsubsidized employment. The sample members can be thought of as representing the middle of the TANF caseload in terms of job readiness. They were not the most job-ready TANF recipients: They had all been unable to find unsubsidized employment after a four-week job search with the help of TANF staff members, and they had barriers to employment such as limited work experience, low levels of education, criminal convictions, or prolonged spells on TANF. However, neither were they the most disadvantaged TANF recipi-ents, as many of those highly disadvantaged people (those with disabilities, those caring for disabled family members, or those with very young children) would have had exemptions from work-participation requirements.
Los Angeles County represented a unique opportunity to test large-scale subsidized employment approaches in a geographically and economically varied setting. The county has a large TANF program, contains diverse municipalities, and offers a complex operational context in which to implement the program. All of these factors result in a study that demonstrates both the difficulty of implementing a large-scale subsidized employment program and the lessons that stem from its implementation.
Main Results in This Report Los Angeles County partnered with 21 Worksource Centers that were responsible for recruiting employers, placing participants into PWE or OJT subsidized jobs, and providing case manage-ment during placements. The centers handled these tasks differently and had varying degrees of success in implementing the program.
• The two approaches had substantially different placement rates: 42 per-cent of OJT group members were placed in subsidized employment, compared with 79 percent of PWE group members.
Most Worksource Centers indicated that it was not difficult to place PWE participants. A wide array of employers was available to them, many of which were willing to take almost any participant referred by the centers, sometimes without even interviewing that individual. Examples of PWE employment included maintenance work at a county courthouse, administra-tive duties at a nonprofit arts organization, and sorting donations at a food bank’s warehouse.
In comparison, Worksource Center staff members had more divergent assessments about how feasible it was to place participants in OJT positions. Examples of OJT employment included customer service at a medical products company, housekeeping at a hotel, and produc-tion work at a wholesale food services company.

ES-6
It was clear from staff interviews that several Worksource Centers decided that placing participants in OJT positions was not worth the effort required. These Worksource Centers either did not have enough people on staff or were unwilling to devote enough of their time to develop enough job openings for the participants referred to them. Many Worksource Centers found it difficult to recruit private-sector employers that were willing to hire TANF recipients, even when the position was subsidized. In part the difficulty arose because private-sector employers had to take on greater risk to participate in the program — specifically, they were required to agree to move participants onto their own payrolls at the beginning of the third month. However, the fact that a subset of Worksource Centers did succeed in placing more than half of their OJT participants suggests that there are viable models for placement in private-sector subsidized employment.
The PWE placement rate is clear evidence that a welfare-to-work program can create subsidized work experiences for TANF recipients on a large scale, with diverse public-sector and nonprofit employers. The OJT placement rate, while lower than PWE’s, compares favor-ably with other attempts to place welfare participants in private-sector subsidized positions.8 The experience of implementing OJT in Los Angeles County reinforces previous findings that it is difficult to place hard-to-employ people in private-sector subsidized employment.
• Participants in the two approaches stayed in their placements for differ-ent average lengths of time. PWE placements lasted an average of more than 64 days longer than OJT placements. Compared with OJT place-ments, PWE placements were far more likely to continue beyond the second month.
Retention beyond the second month was a critical measure of success for the OJT pro-gram, because after the second month OJT participants moved onto employers’ payrolls. The lower retention rate and shorter overall duration of placements among OJT participants reflects the fact that private-sector employers applied added scrutiny and higher standards as partici-pants approached this transition point.
• As expected, members of the control group were almost as likely as those in the program groups to receive welfare-to-work services other
8Stephen Freedman, Jan Bryant, George Cave, and Michael R. Bangser, New Jersey: Final Report on the
Grant Diversion Project (New York: MDRC, 1988); Patricia Auspos, George Cave, and David Long, Maine: Final Report on the Training Opportunities in the Private Sector Program (New York: MDRC, 1988); Larry Orr, Howard S. Bloom, Stephen H. Bell, Fred Doolittle, Winston Lin, and George Cave, Does Job Training for the Disadvantaged Work? Evidence from the National JTPA Study (Washington, DC: Urban Institute Press, 1996).

ES-7
than subsidized employment. The control group was more likely than either of the program groups to be involved in education.
All individuals in the study (including control group members) were expected to partic-ipate in some type of welfare-to-work activities as a condition of receiving TANF. Thus, it is not surprising that the three groups had similar overall participation rates in welfare-to-work activities and supportive services offered as part of TANF. However, the OJT and PWE approaches had a negative impact on participation in education: Members of both program groups were less likely than the control group to report participation in education, in particular postsecondary education leading to a degree. This decrease could have occurred because program group members who were busy in subsidized employment had less time available to pursue education, or because control group members who did not have access to subsidized employment pursued education in order to improve their employability and to partly fulfill TANF work requirements.9 Regardless, these results suggest that participation in subsidized employment may have an opportunity cost that could affect longer-term employment and earnings, if control group members secure degrees or credentials that make them more competi-tive in the labor market. Future reports with longer follow-up periods will analyze the extent to which control and program group members successfully completed postsecondary education programs and earned degrees.
• In the first year after random assignment, both PWE and OJT group members were more likely to work than control group members, worked more quarters on average, and had higher average earnings. These differences were larger among sample members who had not been employed in the year before random assignment and declined as people left subsidized jobs.
As shown in Table ES.1, 58 percent of the control group worked in jobs covered by un-employment insurance in the first year after random assignment. However, the employment rates for the PWE group (92 percent) and the OJT group (76 percent) were both substantially higher, as were the annual average earnings for both research groups.10 These differences in employment and earnings reflect participation in subsidized employment; as noted earlier, 79 percent of PWE and 42 percent of OJT group members worked in subsidized jobs in the year following random assignment. The differences in employment and earnings between the
9Under federal regulations, TANF programs can count a maximum of 12 months of postsecondary educa-
tion or vocational educational training toward a participant’s core work requirement in his or her lifetime. 10These percentages also include employment from subsidized jobs provided to the program groups, em-
ployment which is not covered by unemployment insurance wage records.

ES-8
program groups and the control group were concentrated in the first two quarters after random assignment, when most participation in subsidized employment occurred. The employment rates and earnings of the three groups converged over time as program group members left their subsidized jobs. By the beginning of the second year following random assignment, the PWE and OJT groups were still significantly more likely than the control group to be employed, but the differences between groups were much smaller.
In general, impacts were larger for less employable participants. For both PWE and OJT, the differences in employment rates and earnings between the program group and the control group were much larger among the subgroup of sample members who had not worked in the year before random assignment. Notably, almost all of the difference in employment rates
OutcomePWE
GroupOJT
GroupControl Group
PWE vs.Control
OJT vs.Control
PWE vs.OJT
Employment (%) 91.8 76.2 57.8 34.1 *** 18.4 *** 15.8 ***PWE or OJT subsidized employment (%) 79.4 41.6 --
Total earnings ($) 7,188 5,764 4,459 2,729 *** 1,305 *** 1,424 ***Amount of earnings subsidized ($) 3,895 1,083 --
Total earnings (%)$6,000 or more 57.8 36.7 26.2 312 *** 10.2 *** 21.1 ***$10,000 or more 23.2 22.5 15.9 7.3 *** 6.6 *** 0.7$14,000 or more 9.0 11.6 10.7 -1.7 0.9 -2.6 *
Employment in the first quarter of Year 2 51.5 53.6 47.2 4.4 * 6.5 *** -2.1PWE or OJT subsidized employment 2.1 1.9 --
in the first quarter of Year 2
Sample size 874 877 871
Table ES.1
Impacts on Employment and Earnings After One Year
Difference (Impact)
SOURCES: MDRC calculations based on quarterly wage data from the National Directory of New Hires and program payroll records.
NOTES: Results in this table are regression-adjusted, controlling for pre-random assignment characteristics. Statistical significance levels are indicated as: *** = 1 percent; ** = 5 percent; * = 10 percent.Employment rates and earnings include both subsidized jobs and all other jobs covered by unemployment
insurance.

ES-9
for the first quarter of Year 2 appears to be among sample members who were not employed in the year before random assignment. In addition, the difference between the PWE and OJT groups was larger for the subgroup who did not work in the year before random assignment than it was for the subgroup who did.
• There were only a few modest differences between the program partici-pants and control group members in outcomes not directly related to employment, including TANF receipt and measures of well-being.
Almost all of the research participants received TANF benefits in the quarter of random assignment. Receipt rates declined in a similar fashion for all three groups, reaching about 70 percent for PWE, OJT, and control group members in the first quarter of Year 2. PWE and OJT group members did receive smaller amounts from TANF on average than control group members in the year following random assignment, though the differences between the program group members and the control group members are fairly modest ($469 less on average for PWE group members and $170 less on average for OJT group members). The PWE group members experienced a greater reduction in total TANF payments than the OJT group, reflect-ing the PWE group’s higher overall earnings during this time.
At around five months after random assignment PWE members were 22 percentage points more likely than control group members and 15 percentage points more likely than OJT group members to report being financially better off than they had been a year before. There may have been a larger impact for the PWE group than the OJT group because PWE group members were placed in subsidized jobs at a higher rate. PWE group members were also somewhat less likely to report experiencing psychological distress than their control group counterparts at around five months after random assignment. However, when surveyed one year after random assignment, there were few differences in reported well-being between the program and control group members.
Next Steps The STED evaluation in Los Angeles County is part of an effort to investigate the effects of subsidized employment programs for TANF recipients. As has been the case in many recent, similar tests, short-term employment and earnings impacts were observed during the study period for both PWE and OJT group members. More follow-up is required to determine whether in fact the employment impacts of the Los Angeles program are restricted to the subsidy period. The work experience PWE and OJT group members gained from their place-ments may have effects on employment that become apparent later on. However, control group members reported higher rates of participation in education than PWE and OJT group members, which may also affect their employment and earnings in the long term.

ES-10
A second goal of the evaluation is to compare two approaches to subsidized employ-ment. The PWE approach achieved higher placement rates in subsidized jobs than the OJT approach, resulting in larger initial employment and earnings gains for the PWE group than the OJT group. While the employment and earnings of both PWE and OJT participants followed similar trends by the end of the observation period, it is possible that their longer-term outcomes may diverge. The OJT model provided participants with an employment experience that better reflects the unsubsidized labor market; this experience could translate to more successful employment searches in the future. In addition, because the OJT placements could turn into permanent jobs, longer-term employment and earnings gains may emerge over time for OJT group members compared with PWE group members.
Finally, it is always relevant to examine the targeting of services in any employment program — “what works for whom.” While this question cannot be addressed in any definitive fashion in the analysis period used for this report, so far the majority of the employment impacts produced by both PWE and OJT were among sample members without recent work experience. While both approaches also produced employment gains for sample members who did have recent work experience, these results suggest that subsidized employment programs may be more effective for people who are more detached from the labor market. Additional follow-up will reveal whether these effects persist and shed light on the relative effectiveness of the PWE and OJT approaches for different population subgroups. The final report, expected in 2018, will present the effects of these two subsidized employment approaches 30 months after random assignment.

1
Chapter 1
Introduction
This report presents interim results from a random assignment evaluation of subsidized em-ployment for recipients of Temporary Assistance for Needy Families (TANF) in Los Angeles County. The study investigates the impacts of two distinct approaches to subsidized employ-ment on TANF recipients’ employment, earnings, TANF receipt, and overall well-being. The first approach, Paid Work Experience, subsidizes the wages of individuals placed at nonprofit or public-sector employers. The second approach, On-the-Job Training, uses wage subsidies at private-sector employers. Both of these approaches use publicly funded wage subsidies to provide employment opportunities to TANF recipients who have not been able to secure employment in the competitive labor market.
The findings in this report demonstrate that these models can place a large number of TANF recipients in diverse employment opportunities. The report also describes the short-term impacts on earnings and employment that result from these placements. The longer-term impacts of the two approaches will be described in a future report.
Background and Policy Context Previous efforts to use subsidized employment to improve the long-term employment outcomes of hard-to-employ populations have had mixed results. Bloom outlines the history of subsidized and transitional employment tests, finding a long legacy of programs seeking to use subsidized employment to ease people’s transition into the unsubsidized labor market.1 While some programs have resulted in long-term gains in employment and earnings, most recent studies suggest that subsidized employment can generate impacts on employment and earnings while the subsidy is in place, but that the effects recede quickly after the subsidy ends.2
Subsidized employment received renewed attention as a result of the recent recession. In 2009, when the national unemployment rate reached 10 percent, states used funds from the American Recovery and Reinvestment Act’s TANF Emergency Fund to create jobs for about 280,000 people. Forty states put at least some people to work under its auspices before the
1Bloom (2010). 2A recent study of one program targeting TANF recipients in Philadelphia, which did not find positive
impacts on employment in the long term, did find sustained positive impacts on measures of TANF receipt. Program group members were less likely than control group members to be receiving cash assistance 18 months after they enrolled in the program. See Bloom et al. (2009).
2
funding expired in late 2010, and 14 states and the District of Columbia each placed at least 5,000 people in subsidized jobs.
Most of the TANF Emergency Fund programs (particularly the larger ones) broadly targeted unemployed workers. Eligibility was not limited to TANF recipients, people with criminal records, or other disadvantaged groups who had been the focus of most earlier studies of subsidized employment programs. Notably, about half the placements nationwide under the TANF Emergency Fund were summer jobs for young people. Also, many of the programs did not emphasize helping participants make the transition to unsubsidized jobs. Instead, they mainly emphasized “rapid job placement to alleviate unemployment.”3 Like previous efforts in economic downturns designed to give unemployed populations the opportunity to earn income, the TANF Emergency Fund programs served many people who had steady work histories, and the models assumed that those people would return to regular jobs once the labor market improved. The TANF Emergency Fund programs were popular in many states, with governors from both parties expressing strong support for them. The experience, while relatively short-lived, rekindled interest in subsidized employment more broadly.
In 2010, the U.S. Departments of Health and Human Services and Labor made substan-tial investments to further advance the field’s understanding of subsidized employment. Through the Subsidized and Transitional Employment Demonstration (STED), the Department of Health and Human Services is funding studies of seven subsidized employment interven-tions. These studies explore how subsidized and transitional employment strategies can meet the needs of TANF recipients and other low-income young people and adults. Box 1.1 outlines the seven STED studies. Two of these studies, including the Los Angeles study that is the subject of this report, focus specifically on subsidized employment for TANF recipients.4
Concurrently, the Department of Labor funded studies of seven programs using a range of approaches to explore the effects of subsidized and transitional employment on the outcomes of formerly incarcerated individuals and noncustodial parents. Three of the programs targeted recently released prisoners, and four targeted noncustodial parents (parents who do not have custody of at least one of their children). Two of these studies — both targeting noncustodial parents — are also a part of the STED project. Box 1.2 discusses one of the Department of Labor programs that is similar in some respects to the Los Angeles program discussed in this report.
3Farrell, Elkin, Broadus, and Bloom (2011). 4For a summary of other subsidized employment tests being funded by the Department of Health and Hu-
man Services and the Department of Labor, see Bloom (2015).

3
Box 1.1
Other Programs in the STED Evaluation
Bridges to Pathways (Chicago, IL). The Chicago Department of Family and Support Ser-vices worked with the University of Chicago Crime Lab and Chapin Hall to design this program, which tries to curb youth violence. It targets 16- to 24-year-olds who are leaving incarceration (some from the juvenile justice system, some from the adult system), and in-cludes three components: (1) a temporary, subsidized job, (2) online high school classes, and (3) a cognitive behavioral therapy-like intervention. The program seeks to engage participants full time for three to four months.
GoodTransitions (Atlanta, GA). Operated by Goodwill of North Georgia, Inc., this program targeting noncustodial parents uses a staged model that starts with subsidized, temporary jobs in Goodwill stores and progresses to subsidized placements in the community, as participants demonstrate that they can function with reduced supervision. Participants are also provided with opportunities for short-term vocational training. Good Transitions is also in a concurrent evaluation funded by the Department of Labor.
Jobs Now STEP Forward (San Francisco, CA). Administered by the county’s Human Services Agency, the program focuses on six target populations: adults who have used up their TANF eligibility, adults who have used up their unemployment insurance benefits, adults receiving food stamp benefits, California General Assistance recipients, adults with dependent children who have family incomes at or below 200 percent of the federal poverty line, and former participants of JobsNOW (the Human Service Agency’s original subsidized employ-ment program).
Minnesota STED. The Minnesota Department of Human Services selected Ramsey, Dakota, Scott, and Hennepin Counties to implement a new subsidized employment program model for its TANF recipients. The counties are partnering with Goodwill-Easter Seals and HIRED to provide two types of subsidized employment: Paid Work Experience, which places less job-ready participants in the nonprofit or public sector, and Subsidized Employment, which places more job-ready participants in the for-profit sector.
Young Adult Internship Program (New York, NY). The Young Adult Internship Program, a program operated by the city Department of Youth and Community Development, provides 12-week paid internships to young people ages 18 to 24 who are disconnected from school and work. It serves about 1,300 people a year.
TransitionsSF (City and County of San Francisco, CA): The San Francisco Office of Economic and Workforce Development operates this program in partnership with three other agencies: the Department of Child Support Services, the San Francisco Human Services Agency, and Goodwill Industries. The program targets noncustodial parents and uses a three-tiered model that places participants into temporary, subsidized jobs based on their level of job readiness. Those with the least job experience and education are placed with private nonprofit employers, those with moderate levels of experience work as trainees with city agencies, and those with the most experience are placed with private-sector, for-profit employers. The model includes modest financial incentives for reaching participation milestones as well as child support-related incentives such as reinstatement of driver’s licenses, fast-track assistance and modifications of child support orders, and debt forgiveness. TransitionsSF is also in the concurrent evaluation funded by the Department of Labor.

4
The STED Project The mixed track record of subsidized employment programs described above has pushed the field to identify new models for subsidized employment. This study of Los Angeles’s Transi-tional Subsidized Employment program is one such attempt. Targeting TANF recipients in Los Angeles County who failed to find unsubsidized jobs in a four-week “job club,” the study is an opportunity to understand the extent to which the two approaches to subsidized employment available through this program can improve participants’ employment, earnings, and overall well-being.
● Paid Work Experience (PWE) involves a six-month, fully subsidized placement in a public-sector or nonprofit position. Participants do not go onto employers’ payrolls, and instead are paid (at minimum wage) by a Work-
Box 1.2
Short-Term Findings from the Department of Labor Evaluation in Fort Worth
One of the programs in the Department of Labor study — the one in Fort Worth, TX — used a private-sector wage subsidy model that had some similarities to the On-the-Job Training approach being tested in Los Angeles County. The Fort Worth study targets recently released prisoners, not TANF recipients, but the results from that study provide some relevant infor-mation about the viability of these types of models.
The Fort Worth findings were mixed. A relatively low proportion of individuals randomly assigned to the program group were successfully placed in subsidized jobs (36 percent). According to unemployment insurance data, during the first year after random assignment the Fort Worth program did not significantly increase employment, neither during the period of the subsidy nor after the subsidy ended. However, data from the client survey suggest that the program did increase employment, possibly in areas not covered by the unemployment insur-ance system (such as temporary or informal jobs, day labor, or self-employment).* In addition, the program generated statistically significant reductions in the rate at which participants were rearrested or reincarcerated. __________________________
*Redcross et al. (forthcoming).

5
force Investment Board acting as an intermediary.5 PWE seeks to increase the employability of participants by giving them work experience.
● On-the-Job Training (OJT) is a private-sector wage subsidy approach.6 Participants are placed in jobs with private employers; they spend the first two months on the payroll of a Workforce Investment Board and the final four months on employers’ payrolls, with employers receiving a partial subsidy of up to $550 per month. While this approach does not have a spe-cific training component, aside from job-specific skills acquired during the course of employment, it seeks to replicate more closely a “real-world” work environment, with the goal of permanent, unsubsidized placement at the same employer.
While both PWE and OJT heavily emphasize developing work experience and job skills through subsidized employment, there are several important differences between the two approaches. The PWE approach focuses exclusively on placing participants with public-sector or nonprofit employers, whereas OJT participants are placed with private-sector employers. Additionally, OJT employers are required to place participants on the company payroll in Month 3, a provision designed to make it more likely for those employers to keep participants in unsubsidized employment after the subsidy ends. No similar requirement exists for PWE.
The theory guiding the Transitional Subsidized Employment program (in both the PWE and OJT approaches) is that the work experience participants accumulate through subsidized placements can make them more viable in the unsubsidized labor market, resulting in longer-term stability in earnings. Unlike education and training programs that aim to help participants acquire technical skills and knowledge, often in specific sectors, both PWE and OJT emphasize rapid job placement, and not in any specific sectors. Though the program is expected to have larger and more immediate effects on employment rates than other training models, participants may primarily end up in low-wage jobs.
This interim report describes initial findings from the STED test in Los Angeles County, describing the design, implementation, and interim impacts of Los Angeles’s subsi-
5The minimum wage in Los Angeles was $8 an hour when the project began, and increased to $9 an hour
on July 1, 2014. 6Many articles and research studies have defined “on-the-job training” models, particularly in the work-
force programs funded by the Department of Labor. The OJT approach implemented in Los Angeles County differs from other on-the-job training models in several ways, including the structure of the subsidy, the point at which a participant transitions onto an employer’s payroll, and the availability of training that complements the placement. This report nevertheless refers to the approach as “On-the-Job Training” both for the sake of consistency and because that is what it is called by the Los Angeles Department of Public Social Services, which runs the program.
6
dized job programs (that is, the impacts after 12 months). A final report will describe impacts after 30 months.
The Evaluation Design The evaluation of the Transitional Subsidized Employment program set out to answer the following questions:
● How was the program designed and operated?
● What are the impacts of the program’s two approaches on employment, TANF receipt, income, and overall well-being, relative to what would have happened in the absence of the program?
● Which of the two approaches appears to be more effective for which popula-tion subgroups?
● To what extent do the two approaches’ costs differ from the amounts ex-pended on behalf of individuals randomly assigned to a control group that could not receive program services? How does this cost differential relate to the benefits associated with program impacts, if any?
To answer these questions, the evaluation includes an implementation study, an impact study, and a benefit-cost analysis.7 The impact study uses a randomized controlled trial design. In this design, individuals eligible for and interested in the subsidized jobs program were randomly assigned to one of two program groups who have access to the Transitional Subsi-dized Employment program, or to a control group who does not. Participants in the control group can receive other services in the community, including those available through the county’s welfare-to-work program. This process is designed to create three groups that are comparable at the start of the study in both their measurable and unmeasurable characteristics. One can therefore be confident that any statistically significant differences in the groups’ outcomes that emerge over time — for example, differences in employment rates — can probably be attributed to the program rather than to preexisting differences between the groups.
Three points about the evaluation approach are worth noting. First, there are critical dis-tinctions between program models as they are written on paper and the program services that are actually offered, and in turn between the services offered and the services that clients receive. Of course, models are not always implemented with fidelity, and potential participants
7This report does not include results from the benefit-cost analysis, which will be made available in the
final report.

7
do not necessarily use the services that are offered. The evaluation’s implementation study (described below) examines all the links in this chain, including the “implementation process” — the steps that Los Angeles County used to put its PWE and OJT approaches into practice.
Second, the evaluation assumes that program impacts — that is, differences in out-comes between the program groups and the control group — are the product of the service contrast: the differences in the services received by members of the three groups. The evaluation design assumes that although they are excluded from the Transitional Subsidized Employment program, the control group will make use of some other welfare-to-work services, as TANF recipients are typically required to work or participate in work-related activities like job search-es or education and training. As discussed further below, the evaluation is using surveys and county records to measure the services received by all three groups.
Third, the characteristics of the service shape the implementation process. Similarly, the characteristics of the clients and the local context (including factors like the labor market, the service environment, and the operation of the local TANF system) shape a program’s imple-mentation, the services received by the program and control groups, and their outcomes. The implementation study therefore also describes these contextual factors.
The Implementation Study The implementation study set out to describe the Transitional Subsidized Employment program in Los Angeles. As discussed earlier, to do so the study aimed to describe the PWE and OJT approaches as they were designed, the steps that local managers took to put them in place, the nature of the services that were ultimately offered to clients, the frequency and duration of the services that they actually received, the context in which the programs operated, and the degree to which the services received by program group members differed from those received by control group members. The study used several data sources:
● Staff interviews and observations. The research team made formal visits to interview staff members and observe program activities and operations. It made multiple visits to each region and to 19 of the 21 Worksource Centers that placed participants in subsidized employment as part of this evaluation. In addition, the team gathered important information through regular contact with staff members.
● Participation data. The research team collected data on participation in sub-sidized employment and TANF program activities from Los Angeles County and its partners’ data systems and payroll records. In addition, the county and its partners provided supplemental aggregate data.

8
The implementation chapter of this report integrates qualitative and quantitative data from these various sources to create a coherent picture of the implementation of the Transitional Subsidized Employment program.
The Impact Study This report mainly focuses on implementation and service receipt, but it also provides prelimi-nary evidence on the Transitional Subsidized Employment program’s impacts on employment, TANF receipt, and overall well-being after one year. These results lay the groundwork for the final report, which will address the impact questions more definitively, as more follow-up time is needed to provide reliable evidence on the program’s long-term impacts.
Because this report only follows participants’ outcomes through one year, the analyses presented here may be considered “exploratory,” and therefore do not use formal statistical methods to account for the fact that several program-control differences are examined. Hypoth-esis testing is conducted independently for each outcome, and the findings are interpreted as suggestive evidence of program effectiveness.8 When many such comparisons are made, there is a greater probability that some of the differences will be found to be statistically significant even though they did occur by chance. The report’s analysis addresses this issue by minimizing the number of comparisons and highlighting those that are most important. The 30-month report will present “confirmatory” impacts on earnings in Year 2 through the first half of Year 3, a time when the longer-run effects should be evident.
The evaluation team is collecting the following data for sample members in all three re-search groups. In general, a year and a quarter of follow-up data are currently available for the sample.
Baseline data. The research team extracted baseline data on sample members’ demo-graphic characteristics, work histories, and other characteristics from Los Angeles County’s TANF data systems.
Employment and earnings records. Data from the National Directory of New Hires were used to measure quarterly earnings. Maintained by the federal Office of Child Support Enforcement, the National Directory of New Hires contains quarterly earnings data collected by state workforce agencies on jobs covered by unemployment insurance — that is, the vast majority of formal employment.
8These analyses will be as meaningful and reliable as findings from previous studies that did not stipulate
ahead of time the hypothesized effects of the programs involved (the great majority of rigorous job-training evaluations).

9
None of the subsidized wages paid to participants in the PWE group are covered by the National Directory of New Hires, nor are the first two months of subsidized wages paid to participants in the OJT group. (After two months OJT participants moved onto employers’ payrolls, and subsidized wages for the following four months are covered.) The research team therefore combined the data from the National Directory of New Hires with program payroll records of subsidized employment for these uncovered wages to create fully accurate measures of employment.
TANF benefit payment records. TANF payment records were used to measure how many people received TANF benefits and how much they received.9
Surveys. The evaluation team attempted to interview each sample member at approxi-mately 4, 12, and 30 months after his or her random assignment date. The 12- and 30-month surveys include questions about participation in employment-related and education- or training-related activities, and other topics that are not covered in the records described above. The survey conducted at 4 months was intended to measure some of the financial and nonfinancial benefits associated with employment during the time when program group members were most likely to be in subsidized employment. Due to resource constraints, the 4-month survey was only administered to a subsample of study participants, and due to logistical constraints it was not administered to those randomly assigned at the beginning of the study. (See Appendix B for more information about the survey and analysis of the extent to which results may be biased by survey nonresponse.)
Outcomes
The measures of effectiveness used in this evaluation fall into three domains: labor-market outcomes (that is, employment and earnings), TANF receipt, and overall well-being.
In the labor-market domain, the primary measures are quarterly employment rates and quarterly earnings; these measures are quarterly because that is how the National Directory of New Hires maintains the data. Since each of the programs offers participants a period of paid employment, program group members are expected to have higher employment and earnings during the program period as long as program participation rates are sufficiently high and the programs target people who would not otherwise be working.
The goal of Los Angeles County’s subsidized employment program is to permanently alter an individual’s trajectory of employment, earnings, and income through work experience and other forms of support. However, this report’s one-year follow-up period primarily covers a
9The final report will also include impacts on participants’ receipt of Supplemental Nutrition Assistance Program benefits (food stamps).

10
period in which sample members were working in subsidized jobs. Although participants typically remained in subsidized jobs for only a few months, some of them left the jobs and returned, or entered the subsidized jobs later than initially expected. Some program group members were still working in subsidized jobs in the last quarter of the follow-up period, and it is thus too early to answer questions about long-term impacts after participants leave the program.10
Analytic Methods
To estimate impacts, the analysis compares the average outcomes of program and con-trol group members. The study’s random assignment design ensures that there are no systematic differences between the two program groups and the control group at the time of randomization. As a result, any statistically significant differences in the three groups’ outcomes are likely to be due to the intervention. While the simple comparison of the program and control groups’ mean outcomes would provide an unbiased estimate of the true impact, the impacts are estimated using multivariate regression models that predict outcomes as a function of assignment to the program groups and participant baseline characteristics. This method, which is conventional, is used to improve the statistical precision of the estimates.
Because of the random assignment design, the crucial difference between the program and control groups will be access to subsidized employment services. That is, individuals in the program groups will have access to program services, other TANF services, and possibly other similar services available in the community; while control group members will have access to only other TANF services and those other services in the community, but not PWE or OJT. The estimate of the average impact of access is referred to as the “intent-to-treat” impact estimate. It measures the impact of having the opportunity to participate in the intervention, not the average impact on program group members who actually participate in the intervention. As noted earlier, because this report includes one year of follow-up data and is exploratory in nature, it does not draw any firm conclusions about the impacts of PWE and OJT.
The Structure of This Report The chapters that follow present findings from the implementation study and interim findings from the impact study. Chapter 2 provides background on the program and the context in
10Although most impact analyses presented in this report cover the year after random assignment, the re-
port also includes employment and earnings in the first quarter of Year 2. In the first quarter of Year 2, the vast majority of program group participants had completed work in their subsidized jobs, so impacts from that quarter provide a preview of the program’s effects after the subsidy ends. However, even in the first quarter of Year 2, around 2 percent of PWE and OJT program group members were still in subsidized employment.

11
which it occurred. Chapter 3 describes the research design, the program model, and the characteristics of the sample. Chapter 4 describes the implementation of the program and provides data on program participation. Chapter 5 presents the impact findings. Chapter 6 offers some conclusions.

12
Chapter 2
Area Background
Los Angeles County represented a unique opportunity to test large-scale subsidized employ-ment approaches in a geographically and economically varied setting. The county has a large Temporary Assistance for Needy Families (TANF) program, contains diverse municipalities, and offers a complex operational context in which to implement the program. All of these factors resulted in a test that demonstrates both the difficulty of implementing a large-scale subsidized employment program and the lessons that stem from its implementation.
Los Angeles County: A Unique Setting for a Subsidized Employment Program Los Angeles County is the most populous county in the country, with almost 10 million residents. It covers over 4,000 square miles and contains more than 80 cities, 16 of which have populations greater than 100,000.1
Unsurprisingly, given its size, Los Angeles County has substantial variation from place to place in economic indicators that influence the low-wage labor market and the prospects for unsubsidized employment among TANF recipients. As Figure 2.1 shows, Los Angeles County has a diverse labor market; multiple areas have large numbers of low-wage jobs, including the downtown area and areas of dense population in other large cities. However, the figure also shows that the county is quite geographically dispersed, meaning program participants might have to travel considerable distances for job opportunities.
The county’s economy as a whole changed dramatically over the course of the study. When random assignment began in November 2012, the unemployment rate in the county was 10.0 percent. By November 2014 (one year after the last study member enrolled), the unem-ployment rate had decreased to 7.9 percent.2 This reduction is similar to the roughly 2 percent-age point decrease in the national unemployment rate during this same time period.3
Compared with other states, California has a relatively generous TANF program and a disproportionate share of the national population of TANF recipients. In 2013, 66 percent of families with children in poverty in California received cash assistance, compared with the
1Los Angeles County (2016). 2Bureau of Labor Statistics (2016b). 3Bureau of Labor Statistics (2016a).

13

14
national average of 26 percent, and the benefit level for a single-parent family of three in California was $638 per month, compared with the national average of $437.4 Additionally, California’s TANF caseload represented roughly 36 percent of the total national caseload, though California had approximately 12 percent of the total national population.5
The TANF program in California is called California Work Opportunities and Respon-sibilities to Kids (CalWORKs). It is supervised by the state and administered by counties. All TANF recipients must participate in their counties’ welfare-to-work programs to receive benefits, unless they meet one of the criteria for an exemption (which include disability, caring for an ill household member, caring for young children, and pregnancy). The welfare-to-work program in Los Angeles County is called Greater Avenues for Independence (GAIN). Each GAIN participant is assigned to a GAIN Service Worker, with whom he or she is expected to have at least monthly contact.
GAIN participants are eligible to receive the types of employment services and activi-ties often offered by TANF programs, including job-search and job-readiness assistance, community service opportunities, and education and training directly related to employment. Participants are also eligible for subsidized child care and mental health services.
Table 2.1 shows the GAIN caseload at the start of random assignment (November 2012) and in the final month of random assignment (November 2013). During this time, the caseload increased by roughly 7,000 families, from 46,022 to 53,044.
Subsidized Employment for TANF Recipients in Los Angeles County The Los Angeles Department of Public Social Services, which administers both the local TANF program and GAIN, oversees the county’s subsidized employment program for TANF recipi-ents. This program — called Transitional Subsidized Employment — has been operating in Los Angeles County since 2003. While the eligibility requirements for the program have changed over time, the county has consistently viewed Transitional Subsidized Employment as a way to reengage hard-to-employ TANF recipients in work. The two subsidized employment approach-es studied in this project — Paid Work Experience and On-the-Job Training — were run under the Transitional Subsidized Employment program.
4Floyd and Schott (2013); Center on Budget and Policy Priorities (2014). 5U.S. Department of Health and Human Services (2014).

15
The program groups in the study received subsidized employment experiences that
depended on an array of service providers across a large area. The implementation of the Transitional Subsidized Employment program involves a complicated set of organizational relationships and staff structures. The primary entities involved are:
● GAIN. Staff members at each of the seven GAIN regional offices (and two substations) are responsible for enrolling individuals into Temporary Subsi-dized Employment and monitoring their participation. These staff members, called Transitional Subsidized Employment Liaisons, are responsible for screening potential participants for eligibility, enrolling them into the pro-gram, and referring the participants to the local Worksource Centers that conduct job development and placement.6 GAIN’s Service Workers were responsible for referring participants to Transitional Subsidized Employment after random assignment and are responsible for monitoring their general welfare-to-work participation. These case-carrying GAIN Service Workers are also responsible for ensuring that participants have added forms of sup-port such as child care, transportation subsidies, and funds to purchase cloth-ing or tools for their jobs.
● South Bay Workforce Investment Board. The Department of Public So-cial Services engaged the South Bay Board to oversee the administration and payment of the program subsidy.7 The South Bay Board was charged with
6“Job development” consists of active outreach to employers to understand their staffing needs and to
market program participants to those employers. 7The South Bay Board is one of several Workforce Investment Boards in Los Angeles County, each of
which typically operates multiple Worksource Centers.
Families Enrollees Exemptions Enrollees Exemptions
Two-parent families 12,547 5,032 12,813 3,142All other families 33,475 32,031 40,231 23,408
Total 46,022 37,063 53,044 26,550
Table 2.1
November 2012 November 2013
Total Number of Los Angeles GAIN Participants at the Start and End of the Study Period
SOURCES: California Department of Social Services (2016a, 2016b).

16
developing and monitoring contracts with employers and with overseeing the Worksource Centers that delivered the intervention. The South Bay Board was also responsible for allocating Transitional Subsidized Employment slots to the Worksource Centers. Each Worksource Center essentially served pro-gram participants who lived near it; if there were multiple Worksource Cen-ters in a region they split the participants evenly. The South Bay Board also reallocated some slots based on performance, for example if a Worksource Center was not placing enough participants.
● Worksource Centers. Worksource Centers in Los Angeles County work with both employers and job seekers to provide business and employment services. For the Transitional Subsidized Employment program, Work-source Centers were responsible for recruiting employers, placing partici-pants in subsidized jobs, and providing case management while participants were in those jobs. Worksource Centers were also expected to assist partic-ipants with their search for unsubsidized employment. The South Bay Board directly operated 5 of the Worksource Centers serving study partici-pants and had contracts with another 16 that served study participants.8 Worksource Centers were compensated based on their ability to place par-ticipants: The South Bay Board paid Worksource Centers $1,200 for every participant placed in a subsidized position and $400 for each participant who moved into an unsubsidized job. This pay structure was the same for both approaches tested in the study.
Figure 2.2 shows the locations of each of the seven GAIN regional offices and two sub-stations, as well as the locations of each of the 21 WorkSource centers that received Transitional Subsidized Employment referrals from GAIN over the course of the study.
The Growth of the Transitional Subsidized Employment Program The Transitional Subsidized Employment program expanded dramatically following the 2008 recession. Like many states, California took advantage of designated federal funding in the American Recovery and Reinvestment Act of 2009 to expand its subsidized employment program.9 The TANF Emergency Fund, created by that act, provided substantial additional money in 2009 and 2010 to states that had experienced increases in their TANF caseloads or in
8These 16 Worksource Centers include one that was only added as a provider in October 2013, nearly at the end of the study enrollment period.
9Farrell, Elkin, Broadus, and Bloom (2011).

17

18
certain kinds of TANF-related expenses. The fund provided generous reimbursement for state expenditures on subsidized employment. The subsidized employment programs that states developed or expanded during the recession with Emergency Fund dollars were primarily intended to be countercyclical programs that quickly transferred public money to low-income populations in order to foster positive economic activity.10
Using this funding, Los Angeles County was able to expand the Transitional Subsidized Employment program to serve more individuals, serving over 10,000 low-income county residents from April 2009 through September 2010. The expanded program mainly focused on TANF recipients but also served dislocated workers.11 The TANF Emergency Fund also allowed Los Angeles County to expand the program to include more types of employers. Specifically, the program began to include private-sector employers using the same subsidy structure it offered to public-sector and nonprofit employers. The county was able to offer more generous wage subsidies than it had before, and according to county administrators, participants arrived more prepared for employment than traditional GAIN clients, coming to the program with a wide variety of skills and employment experiences. Largely because of the weak econo-my, the TANF population itself was more heterogeneous than in more typical economic times.
After the TANF Emergency Fund ended in 2010, California continued to make the Transitional Subsidized Employment program a priority. During the current evaluation, state funds supported approximately 50 percent of the total wage costs of a subsidized employee. Since this level of funding is relatively generous, the county, too, made subsidized employment a priority, seeking to make the greatest possible use of this state funding mechanism.
Nevertheless, Los Angeles County made several shifts in the Transitional Subsidized Employment program starting in 2011. As the economy started to improve, it shifted its focus from short-term economic stimulus to helping hard-to-employ individuals improve their long-term success in the labor market. The county sought to build on its success in engaging private sector employers under the TANF Emergency Fund while serving a harder-to-employ popula-tion. The current study gives Los Angeles County an opportunity to test the traditional Tempo-rary Subsidized Employment model that primarily placed participants in nonprofit and public-sector positions against one focused on private-sector employment.
10Pavetti, Schott, and Lower-Basch (2011). 11Roder and Elliott (2013).

19
Chapter 3
Program Models, Recruitment, and Sample Characteristics
This chapter provides details on Los Angeles County’s subsidized employment program and the two specific approaches being tested. It also describes eligibility requirements and enrollment, and describes the characteristics of the sample.
The Approaches’ Intended Models Individuals in Los Angeles County’s welfare-to-work program (called Greater Avenues for Independence, or GAIN) can engage in many activities to meet their work-participation re-quirements, including job-search and job-readiness preparation, education, community service, and subsidized employment.
● Los Angeles County views subsidized employment as a way to provide participants with work experience that can increase their viability in the competitive labor market, giving them greater economic stability in the long term.
It also sees subsidized employment as a way to increase participants’ incomes in the near term, and to improve the county’s Temporary Assistance for Needy Families (TANF) work-participation rate, a federally defined measure of the percentage of eligible families engaged in a prespecified list of work activities.
The version of Transitional Subsidized Employment that was tested in this study sought to compare two distinct subsidized employment approaches. The county’s traditional approach — Paid Work Experience (PWE) — placed participants in nonprofit or public-sector positions. However, as described in the last chapter, the county began to engage private-sector employers using money from the TANF Emergency Fund, and for this study it decided to test a second approach that focused on placements in the private sector — an approach the county calls On-the-Job Training (OJT). Table 3.1 summarizes the PWE and OJT subsidy structures.
Paid Work Experience: Subsidized Employment in the Nonprofit or Public Sector
In Los Angeles County’s PWE approach, Worksource Centers place participants in nonprofit or public-sector positions. Participants might do maintenance work at a county

20
Program Target Population Placement Type Length Wage Reimbursed Employer of RecordPaid Work Experience (PWE)
People who complete a four-week job search without finding an unsubsidized job
Nonprofit or public sector
6 months $8/hour South Bay Workforce Investment Board
On-the-Job Training (OJT)
People who complete a four-week job search without finding an unsubsidized job
For-profit sector 6 months 100% (up to $8/hour) for the first 2 months, then $350 or $550/month depending on hours worked in the latter 4 months
South Bay Workforce Investment Board for the first 2 months, then employer
Subsidy Structures
Table 3.1
SOURCE: Los Angeles Department of Public Social Services.

21
courthouse, for example, perform administrative duties at a nonprofit arts organization, or sort donations at a food bank’s warehouse. The placements last for up to six months and participants earn $8 per hour. The South Bay Workforce Investment Board serves as the employer of record for all PWE participants, for the entirety of the placement.1
Los Angeles County sees PWE as a way for hard-to-employ GAIN participants — in-dividuals who could not find jobs after four weeks of searching with GAIN’s help — to develop work experience that can translate into a line on a résumé and a reference for future employ-ment opportunities.
Staff members said that PWE placements afford participants the opportunity to become accustomed to workplace norms, explore potential fields of interest, and build employment experience in a more supportive environment than they may find in the competitive labor market. Moreover, the subsidized placements allow participants to retain access to the support services available through GAIN (for example, child care, transportation subsidies, and job-search and job-readiness preparation) while increasing their earnings.2
Los Angeles County does not expect that PWE participants will secure unsubsidized employment at their job sites when their placements end. Rather, administrators and staff members see the placements as a way to help GAIN participants become more employable in the longer term.
On-the-Job Training: Subsidized Employment in the Private Sector
Los Angeles County developed the OJT approach to try to replicate a “real-world” work environment for GAIN participants. In the OJT approach, Worksource Centers place participants — again, those who could not find jobs after four weeks of searching — with for-profit employers. Leaders noted that when the county tried placing people in private-sector positions using the TANF Emergency Fund, participants did not often end up in unsubsidized employment with that employer after the subsidy ended. The county was interested in providing more active support to help participants make the transition to unsubsidized jobs with the employers hosting subsidized jobs.
OJT participants have been placed providing customer service at a medical products company, for example, doing housekeeping at a hotel, and doing production work at a whole-
1As the employer of record, the South Bay Board is responsible for paying participants and for paying all
payroll taxes. 2California’s TANF program treats income from subsidized employment the same way it treats other
earned income: In most cases, 50 percent of earned income is disregarded in TANF benefit calculations. Earnings from work should therefore combine with TANF benefits to increase participants’ overall earnings.

22
sale food-services company. As is the case in PWE, the placements can last up to six months. For the first two months, the participant is on the payroll of the South Bay Workforce Invest-ment Board, earning $8 per hour. Beginning in the third month and lasting through the sixth month, the participant goes directly onto the employer’s payroll. An employer must add a participant to its payroll in the third month in order to continue the placement. Once a partici-pant is on the employer’s payroll, his or her wages are set by the employer, who is reimbursed by the South Bay Board either $350 or $550 per month, depending on the number of hours the participant works.
Unlike PWE, the OJT approach explicitly aims to have participants make the transition into unsubsidized positions with the same employer when the subsidy ends. In a typical subsi-dized jobs model, the default presumption is that participants’ employment ends when the subsidy does. However, by requiring employers to put participants on their payrolls, Los Angeles County switched the default, forcing employers to act if they wanted to terminate or lay off employees.
After the TANF Emergency Fund ended, Los Angeles County pilot tested a version of the OJT approach where employers were required to put participants on their payrolls from the start, but Worksource Centers struggled to recruit employers and place participants. In response, the county altered the OJT approach to include a two-month trial during which employers did not have to assume the added risk of putting participants directly on their payrolls.
Changes from Previous Versions of the Transitional Subsidized Employment Program
The version of Transitional Subsidized Employment studied in this evaluation differs from previous versions of the program in two important ways:
1. Worksource Centers did not get to choose which participants they served. Pre-viously, the Worksource Centers did have wide latitude to choose the GAIN partic-ipants they served. While all of these individuals would have met the same basic criterion of being unable to find a job after four weeks of searching, they had a wide range of skills and experiences.
Different Worksource Centers and GAIN regional offices handled things different-ly. In previous versions of the program it was not uncommon for a GAIN office to select a group of potential participants and bring them together for an orientation, then have staff members from a Worksource Center interview them and decide whom to enroll. Other GAIN offices referred all potential participants to Work-source Centers, but the Worksource Centers could decide whether or not to enroll each of them in the program. Either way, the Worksource Centers had the oppor-

23
tunity to screen out the more difficult-to-place participants, and could focus their ef-forts on the most job-ready participants.
For the duration of the study, Los Angeles County and the South Bay Workforce Investment Board required Worksource Centers to serve all GAIN participants re-ferred to them. GAIN staff members were the only ones who could decide whether potential participants were suitable for Transitional Subsidized Employment. Worksource Centers could still refer participants back to GAIN if the participants were unable to secure a subsidized position (or if they failed to show up for meet-ings with Worksource Center staff members).
2. Participants were randomly assigned to either PWE or OJT. Before the study, Worksource Centers could attempt to place participants in any available subsidized job opening. They had substantial flexibility to match participants to the widest possible array of positions with nonprofit, public-sector, and for-profit employers. This flexibility probably made it easier to place harder-to-employ participants, and also made it easier to place participants in jobs aligned with their interests.
For the duration of the study, however, participants were randomly assigned to either PWE or OJT, and the study required an equal number be assigned to each of these two groups. Conversations with providers before the study began did not yield a clear consensus regarding whether OJT or PWE positions were better suit-ed for more or less job-ready participants. However, it is certainly the case that during the study Worksource Centers had reduced flexibility, which could have made it harder to place participants. Moreover, it created an added imperative for the Worksource Centers to recruit diverse placement opportunities in the private sector, so that they could accommodate participants with different interests and levels of employability.
The goal of the current evaluation was to measure the impacts of PWE and OJT on the GAIN population, and to shed light on the subgroups for whom these approaches worked best and least. The added restrictions were imposed so that the study could assess the differences between the two approaches’ impacts.
Recruitment and Study Enrollment Transitional Subsidized Employment is available to GAIN participants who are seeking employment and who need to meet the work-participation requirements of the welfare-to-work program. Los Angeles County has traditionally viewed it as a viable option for all TANF recipients subject to those requirements who are unable to secure unsubsidized employment.

24
Target Population
The flow chart in Figure 3.1 shows where the Transitional Subsidized Employment program fits in the experience of a TANF recipient in Los Angeles County. Participants entering TANF are screened to determine whether they are exempt from work requirements because they are below a certain age, because they have medical issues, because they have children below a certain age, because they are pregnant, because they have been the victims of domestic violence, because they are caring for an ill household member or a child who is a dependent of the court, or because they are full-time volunteers in the Volunteers in Service to America Program. Those who are not exempted from work requirements are sent to GAIN.
GAIN Service Workers are then responsible for identifying participants’ barriers to em-ployment and discussing their options with them. Participants are referred to a job club to begin a four-week job search. Participants who do not find jobs are assessed at the Los Angeles County Office of Education during the fourth week to identify potential activities that may assist them. At that time, a case worker may recommend Transitional Subsidized Employment. Many GAIN participants do enter Transitional Subsidized Employment right after the four-week job search, while others complete one or more other GAIN activities first (for example, education or community service).
Los Angeles County and GAIN see Transitional Subsidized Employment as a viable option for many GAIN participants. One administrator noted that Transitional Subsidized Employment is “designed for the middle group that has the skills but can’t find a job on their own.” The county does not see the program as an appropriate fit for the most job-ready GAIN participants or those who are the hardest to serve, many of whom end up receiving exemptions from work requirements.
Eligibility Criteria
All seven of the GAIN regions in Los Angeles County enrolled participants into the study. In each region, designated Transitional Subsidized Employment Liaisons (TSE Liaisons) were responsible for participant enrollment. They received referrals from case-carrying GAIN Service Workers. These GAIN Service Workers were responsible for identifying individuals on their caseloads who met the following basic eligibility criteria:
● Completed a four-week job search without finding an unsubsidized job
● Able to work the required hours
● On TANF with five or more months left of TANF eligibility

25
Figure 3.1
How a Participant Entered Transitional Subsidized Employment
Enters TANF
Exempt from work
requirements?
Specialized supportive services
GAIN
Joins job club(4-week job
search)
Finds a job?
No action — client takes job
Assessment
Referral to Transitional Subsidized
Employment
Other activity
No
Yes
Yes
No
SOURCE: Los Angeles Department of Public Social Services.

26
● No participation in Transitional Subsidized Employment in the preceding 12 months
● No major barriers identified that would prevent the participant from working
Along with the above eligibility criteria, the county asked TSE Liaisons to screen par-ticipants for “demonstrated willingness and desire to work.” TSE Liaisons acknowledged that this criterion was subjective. Regions varied in the extent to which they conducted additional screening beyond the formal eligibility requirements. Some regions enrolled all participants who met the formal eligibility criteria and who wanted to participate, while others conducted additional screening.
In some regions, staff members indicated that they attempted to identify participants who voiced an interest in the program and employment more generally. Others emphasized that participants had to be “work-ready,” an informal assessment largely based on participants’ work experience, skills, abilities, and interests. One staff member asked all potential participants, “If you were offered a job tomorrow, would you take it?”
Random assignment occurred in person at GAIN offices. TSE Liaisons were responsi-ble for explaining the study to potential participants, confirming their eligibility for the study and willingness to participate in it, obtaining their informed consent, collecting baseline infor-mation, and randomly assigning eligible participants. Participants were randomly assigned to PWE, OJT, or a control group.
TSE Liaisons immediately referred PWE and OJT program group participants to a Worksource Center after random assignment. This referral was typically made based on available slots at the Worksource Centers assigned to the region. TSE Liaisons referred control group participants back to their GAIN Service Workers to be assigned to a different activity.
Baseline Characteristics The study sample includes 2,622 individuals who were randomly assigned between November 2012 and November 2013. Figure 3.2 shows how the sample built up over this time: There was steady enrollment for the first few months, followed by a decline in enrollment during the spring of 2013. This decline was due to some short-term uncertainty regarding the level of funding for Transitional Subsidized Employment during this period. Beginning in May 2013, Los Angeles County made a concerted effort to increase enrollments, and more than 250 people were randomly assigned each month from June through October of that year.

27
This section presents the characteristics of program and control group members based on data gathered from the program’s database. The data collected — presented in Table 3.2 — include information on participants’ demographic characteristics, employment histories, histories of receiving public assistance and benefits, education levels, and histories of mental health and substance abuse.
During the study, Transitional Subsidized Employment primarily served racial and eth-nic minorities: 55 percent of the sample identified as Latino and 32 percent identified as black. The majority (67 percent) of the sample were not married. All of the individuals in the sample had children; most had either one or two children. There was a roughly even distribution in the amount of time they had been on TANF. While almost a third had been on TANF for less than 12 months during their adult lifetimes, 24 percent had been on TANF cumulatively for at least three years as adults.
Figure 3.2
Study Participant Enrollment Over Time
0
50
100
150
200
250
300
350
400
450
500
Nov.2012
Dec.2012
Jan.2013
Feb.2013
Mar.2013
Apr.2013
May2013
Jun.2013
Jul.2013
Aug.2013
Sep.2013
Oct.2013
Nov.2013
Num
ber
of st
udy
part
icip
ants
enr
olle
d
Month
SOURCE: MDRC calculations using baseline data collected by the Los Angeles Department of Public Social Services' GAIN Employment Activity and Reporting System.

28
Characteristic Total
Average age (years) 31.7
Age (%)18-24 years old 24.925-34 years old 42.535-44 years old 21.545 years old or older 11.1
Male (%) 14.5
Marital status (%)Never married 66.8Currently married 13.9Separated, divorced, or widowed 19.3
Race/ethnicity(%)Hispanic, Latino, or Spanish 54.7White/non-Hispanic 6.5Black/non-Hispanic 31.6Asian/non-Hispanic 3.1Other 4.1
No high school diploma or equivalent (%) 39.0
Has a disability (%) 1.6
Cares for someone with a disability (%) 4.9
Number of minor children (%)One 53.0Two 27.6Three 13.3Four or more 6.1
Average number of minor children 1.7
Total time on TANF in the past (%)Less than 12 months 31.712 to 23 months 23.424 to 35 months 21.436 months or more 23.5
Speaks a language other than English in the home (%) 53.3(continued)
Table 3.2
Sample Characteristics at Random Assignment

29
Characteristic Total
Housing (%)Emergency or temporary housing 3.9Homeless 5.5
Ever employed (%) 93.9
Months employed in the last 3 years (%)1 or less 22.02 to 5 13.26 to 11 17.712 to 23 24.324 or more 22.8
Ever worked for the same employer more than 6 months (%) 51.7
Hourly wage at the end of last job (%)Less than $8.00 3.3$8.00 - $9.99 48.6$10.00 - $11.99 21.6$12.00 - $15.99 16.5$16.00 - $19.99 5.5$20.00 + 4.6
Monthly income (%)None ($0) 1.2$1 to $500 33.1$501 to $1,000 48.0$1,001 to $2,500 15.8More than $2,500 1.9
Has a formal child support order in place (%) 28.4
Receives child support (%) 10.8
Receives Medi-Cal (California Medicaid) 98.8
Has ever received substance abuse treatment (%) 2.1
Has ever received mental health treatment (%) 8.6
Was ever convicted of a crime (%) 14.9
Was ever incarcerated (%) 5.7
Sample size 2,622
Table 3.2 (continued)
SOURCE: MDRC calculations using baseline data collected by the Los Angeles Department of Public Social Services' GAIN Employment Activity and Reporting System.

30
Although most people in the sample — over 90 percent — had worked at some point in the past, on the whole they had very low incomes and probably had substantial barriers to employment. More than 50 percent had worked a year or less in the previous three years, and roughly 70 percent had been making less than $12 an hour in their last jobs.
In addition to scattered employment experiences, participants reported limited educa-tional attainment: 39 percent did not have a high school diploma or high school equivalency credential. Additionally, a subset of participants reported having been convicted of a crime — 15 percent — though only 6 percent reported having been incarcerated.
Overall, the sample members can be thought of as representing the middle of the TANF caseload in terms of job readiness. They were not able to find unsubsidized employment after a four-week job search with the help of GAIN staff members, and they had some barriers to employment such as limited work experience, low levels of education, criminal convictions, or prolonged spells on TANF. However, neither were they the most disadvantaged individuals on the TANF caseload, as many of those highly disadvantaged TANF recipients (those with disabilities, those caring for disabled family members, or those with very young children) would have had exemptions from work-participation requirements.

31
Chapter 4
Implementation of the Two Types of Subsidized Employment
Los Angeles County sees both approaches in the Transitional Subsidized Employment program — Paid Work Experience (PWE) and On-the-Job Training (OJT) — as an opportunity to expand work opportunities for recipients of Temporary Assistance for Needy Families (TANF) and improve their employability in the unsubsidized labor market. Although the two approaches shared a goal, however, they had different implementation experiences. The PWE approach was easier to implement than OJT: It had higher placement rates, its participants waited less time before being placed, and they stayed in their placements longer on average.
Neither of the approaches was implemented uniformly. Different Worksource Centers handled service delivery differently: They recruited employers, placed participants, and provid-ed case management services in different ways. Also, even though both PWE and OJT aimed to help participants find unsubsidized employment in the long term, the implementation research suggests that they provided little systematic support to help participants search for unsubsidized jobs. More generally, an analysis of participation in Greater Avenues for Independence (GAIN) shows that many sample members in the program and control groups received other welfare-to-work services in addition to or in lieu of a subsidized job.
Placement Rates and Participation in Welfare-to-Work Activities Since Los Angeles County has a large subsidized employment program delivered by many providers, the research team anticipated variation in implementation. Different GAIN regions handled recruitment differently; local economic conditions and labor markets varied from location to location; and different Worksource Centers used different job development and placement strategies.1
This section discusses overall implementation lessons, addressing variation in initial placement rates, retention in subsidized positions, and support for unsubsidized job-search activities. It highlights the different methods used by different providers and the experiences of the participants in the two program groups.
1As mentioned in Chapter 2, “job development” consists of active outreach to employers to understand
their staffing needs and to market program participants to those employers.

32
Initial Placement
After a participant was randomly assigned to one of the two program groups, the Work-source Center staff was under considerable pressure to place that participant in a subsidized job and help him or her remain there. Nevertheless, the research team and Los Angeles County anticipated that participants in the OJT and PWE program groups would be placed at different rates. Specifically, the county anticipated that PWE would have higher placement rates, based on its previous experiences with both approaches. PWE represents a lower risk to employers, as they are not required to put participants on their payrolls and are not expected to retain them after the subsidy ends. Additionally, the Worksource Centers had access to a shared list of employers, many of whom accept multiple concurrent placements for PWE, which created economies of scale in job development.
Conversely, the OJT approach involves more risk for employers, especially in the third month, when an employer is required to add a participant to the payroll in order to continue receiving the subsidy. And individual Worksource Centers were required to identify OJT employers independently; they did not work from a shared pool of employers, the way they could in making PWE placements.
● The two approaches had substantially different placement rates: 42 per-cent of OJT group members were placed in subsidized employment, compared with 79 percent of PWE group members.
These placement rates varied across the 21 Worksource Centers, as did the raw num-bers of placements the centers made. Centers placed an average of 33 participants in PWE positions (with a range from 2 to 80 placements), resulting in placement rates ranging from 49 percent to 100 percent. They placed an average of 18 participants in OJT positions (with a range from 0 to 38 placements), resulting in placement rates ranging from 0 percent (at two centers) to 76 percent. Seven Worksource Centers placed at least 50 percent of OJT participants, while all but one Worksource Center achieved at least a 50 percent placement rate for PWE participants.2
Most Worksource Centers indicated that it was not difficult to place PWE participants. A wide array of employers was available to them, many of which were willing to take almost any participant referred by the centers, sometimes without even interviewing that individual.
In comparison, Worksource Center staff members had more divergent assessments about how feasible it was to place participants in OJT positions. In interviews, staff members made it clear that several Worksource Centers decided placing participants in OJT positions was not worth the effort required. Since they received equal reimbursement for placing OJT and
2The Worksource Center with a PWE placement rate under 50 percent had a placement rate of 49 percent.

33
PWE participants, some Worksource Centers decided to focus exclusively on PWE placements. These Worksource Centers either did not have enough people on staff or were unwilling to devote enough of their time to identify enough job openings for the participants referred to them. However, the fact that a subset of Worksource Centers did succeed in placing more than half of their OJT participants suggests that there are viable models for on-the-job training placement.
● It also took different lengths of time to place participants in the PWE and OJT groups. It took 33 days on average to place OJT group mem-bers, compared with 24 days for PWE group members.
These lengths of time are measured from the date of random assignment to participants’ first day on the job. Los Angeles County had set a benchmark of 21 business days for this span, and the averages above show that it was difficult for Workforce Centers to meet that goal. It probably took longer on average to place OJT participants because fewer private-sector em-ployers participated in the program than nonprofit and public-sector employers, and those private-sector employers typically had more rigorous and time-intensive hiring processes. These processes often included interviewing multiple participants for a single position. The time between referral to a Worksource Center and placement varied widely from center to center.
Duration of Placements
Worksource Center staff members suggested that after participants began subsidized employment, if they were going to drop out at all they most commonly did so during the first few weeks. Employers indicated that this initial period is often when problems that lead to firing manifest themselves — problems like consistent tardiness, failure to show up for work, or interpersonal conflicts with other employees. Additionally, Worksource Center staff members indicated that participants who drop out during these first weeks are often those who realize that it is too difficult to balance employment with their other responsibilities (for example, their roles as parents), or who realize that their employment interests are not well aligned with their placements.
● Participants in the two approaches stayed in their placements for differ-ent average lengths of time. PWE placements lasted an average of more than 64 days longer than OJT placements.
Figures 4.1 and 4.2 illustrate the variation in placement rates and average placement du-rations among PWE and OJT participants referred to different Worksource Centers. Figure 4.1 shows substantial variation in both OJT placement rates and the average duration of OJT placements across the Worksource Centers. It also shows that Worksource Centers with higher

34
placement rates did not necessarily have longer average placements. Figure 4.2 shows that PWE placement rates and durations varied less across the Worksource Centers. Almost all had placement rates of at least 60 percent and all but one had average placement durations longer than 120 days.
● Compared with OJT placements, PWE placements were far more likely to continue beyond the second month.
On average, over 86 percent of PWE placements continued beyond the second month. In comparison, far fewer OJT placements continued beyond the second month, when an OJT participant was to “roll over” from the South Bay Workforce Investment Board payroll onto the payroll of the employer.
Figure 4.1
OJT Placement Rate, Average Placement Duration, andNumber of Placements, by Worksource Center
2 placements
38 placements
0
20
40
60
80
100
0 20 40 60 80 100 120 140 160 180 200
Perc
enta
ge o
f par
ticip
ants
pla
ced
Average placement length (days)
Each dot represents a Worksource Center. The size of each dot represents the number of placements.
SOURCE: MDRC calculations based on South Bay Workforce Investment Board payroll data and employer invoices.

35
The data suggest that among OJT participants who worked in subsidized jobs, between 37 percent and 69 percent were moved onto their employers’ payrolls. Employer invoice data — the requests participating employers made for wage subsidies — show that 37 percent of OJT participants made it to the third month and onto their payrolls. Yet the placement data maintained by the South Bay Board show that 69 percent of placements continued beyond the second month.3 The percentage of OJT participants working in subsidized jobs who rolled over onto their employers’ payrolls is therefore somewhere between 37 percent and 69 percent.
3There are several potential explanations for this discrepancy. First, the database maintained by the South
Bay Board contained placement end dates that were set to six months after the start date when placements were made. The end dates were supposed to be updated when placements ended before six months, but it is possible that in some cases such updates were not made. Second, Worksource Center staff members indicated that some
(continued)
Figure 4.2
PWE Placement Rate, Average Placement Duration, andNumber of Placements, by Worksource Center
2 placements
80 placements
0
20
40
60
80
100
0 20 40 60 80 100 120 140 160 180 200
Perc
enta
ge o
f par
ticip
ants
pla
ced
Average placement length (days)
Each dot represents a Worksource Center. The size of each dot represents the number of placements.
SOURCE: MDRC calculations based on South Bay Workforce Investment Board payroll data.

36
There was substantial variation among Worksource Centers in the percentages of their OJT placements that lasted beyond two months. Figure 4.3 shows the percentages of OJT participants whose placements lasted beyond two months for each Worksource Center. Accord-ing to the payroll and employer invoice records presented in the figure, only two Worksource Centers had more than 50 percent of placements extend into the third month, and six had fewer than 30 percent of their placements last that long.
In comparison, there was less variation among Worksource Centers for PWE place-ments. All but four Worksource Centers had at least 80 percent of their placements last beyond the second month, and three Centers had 100 percent of their placements last beyond the second month (not shown).
The differences in placement duration between PWE and OJT were at least partially a function of the differences in subsidy structure. In OJT, the economics of the placement changed dramatically for employers at the conclusion of the second month. The subsidy they received was reduced, and they were also required to put participants on their payrolls begin-ning in Month 3. As a result, employers had to decide whether to retain each individual partici-pant. The research team’s conversations with employers suggested that they did not automati-cally add all participants to their payrolls who completed the first two months of the subsidy; they only retained the higher-performing individuals.
Participants also had different employment experiences in large part because Work-source Centers handled case management and job placement differently. Some Worksource Centers put more effort than others into job development, preparing participants for inter-views and matching them to jobs, and providing case management for participants after they were placed.
Participation in Other GAIN Activities
Transitional Subsidized Employment does not stand alone. Los Angeles County has embedded it in the broader welfare-to-work program (GAIN), which offers TANF recipients multiple options for meeting work-participation requirements. Moreover, TANF recipients’ circumstances change fairly often, which can shift their eligibility for benefits and the degree to which they are exempt from those work-participation requirements. Program group members
employers chose not to pursue the wage subsidy for participants, instead electing to move them onto their payrolls as traditional employees. Often, employers were less interested in the wage subsidy and more interested in the assistance that the program provided with employee recruitment and screening, and the continuing social support that GAIN recipients received while employed.

37
Figure 4.3
Percentage of OJT Placements Lasting Two Months or Longer,by Worksource Center
0%0%00
1722
2426
313334
3638
40404141
4445
5055
0 20 40 60 80 100
WC21WC20WC19WC18WC17WC16WC15WC14WC13WC12WC11WC10
WC9WC8WC7WC6WC5WC4WC3WC2WC1
Percentage of OJT placements lasting two months or longer
Wor
ksou
rce
Cen
ter
(WC
)
NA
NA
SOURCE: MDRC calculations based on South Bay Workforce Investment Board payroll data and employer invoices.
NOTE: The two Worksource Centers marked "NA" did not place any OJT participants referred to them.
38
participated in GAIN activities other than subsidized employment both during and after their subsidized placements, and control members were also active participants in GAIN.
● Program and control group members participated in GAIN activities other than subsidized employment at high levels.
During the six months following random assignment — when program group members were meant to be participating in OJT or PWE — roughly 80 percent of control group members participated in a GAIN activity.4 Examples of common activities include job searching and job-readiness preparation, vocational training and education, community service, and remedial education.
Program group members also participated in GAIN activities other than their subsidized jobs in the six months following random assignment. Among those randomly assigned to PWE, roughly 62 percent participated in such activities, as did about 70 percent of OJT participants.
● Some program group members had unsubsidized employment during the subsidy period.
Los Angeles County tracks unsubsidized employment among current TANF recipients, and unexpectedly, its database records relatively high rates of unsubsidized employment among PWE and OJT program group members during the time when they were eligible for the wage subsidy. Among PWE and OJT program group members, 18 percent and 22 percent were recorded as being engaged in unsubsidized employment at some point during the six months following random assignment, with 13 percent of PWE group members and 4 percent of OJT group members holding subsidized and unsubsidized jobs at the same time. Among control group members, who did not have access to subsidized employment, 28 percent held unsubsi-dized jobs at some point during those six months.5
● Program group members participated in GAIN activities at high rates after the subsidy ended.
Many program group members remained engaged in GAIN activities following the subsidy period. Thirty-six percent of PWE group members and 35 percent of OJT group members left TANF within the 12 months after random assignment. Most of those who re-
4This percentage excludes those who had unsubsidized employment. 5These employment numbers reported to Los Angeles County may not be the same as the employment
numbers reflected in unemployment insurance wage records.

39
mained participated in many GAIN activities, the most common being job-search and job-readiness activities.6
OJT and PWE in Practice The implementation of the PWE and OJT approaches depends heavily on the actions of individual Worksource Centers. Staff members at the centers have to work with employers to develop appropriate placement opportunities, and they must match participants with these opportunities.
Much of the variation in placement rates and job retention observed in the study stems from differences in the way Worksource Centers handled these tasks and provided case man-agement. The variation was also influenced somewhat by the various employers they worked with. Those that were most successful in implementing the model were forceful and energetic in their interactions with both participants and employers, seeking to create matches that aligned employers’ needs with participants’ skills and interests.
Job Development for Subsidized Placements
● The success of the program depended on Worksource Centers’ ability to develop enough potential placements for participants.
Worksource Centers emphasized that it was important to have appropriate positions available for the many types of people GAIN referred to them, especially since the random assignment process determined whether participants could be placed in OJT or PWE.
Some Worksource Centers were much more active than others in their job-development activities, and some were much more willing than others to customize those efforts for each participant. The centers that had higher placement rates were typically those that had the broadest employer pools and that put time into identifying jobs for participants who did not fit into the slots already available. It is likely that having many employment options on hand allowed them to respond better to unexpected participant interests and skill sets.
Employers participating in Transitional Subsidized Employment entered into an agree-ment with the South Bay Workforce Investment Board. Worksource Center staff members were responsible for developing relationships with employers and then South Bay Board staff members worked with the employers directly to finalize all of the necessary paperwork.
6This analysis of GAIN activities does not include participation in unsubsidized employment.

40
Employers had to adhere to certain requirements regarding the work experience they provided. For one thing, they had to provide participants with an employment experience that had all the normal requirements of a job at that company or organization. In essence, employers had to ensure that the participant was treated the same as any other employee. Employers were also required to carry liability and workers’ compensation insurance policies that met certain standards,7 and to prepare an evaluation of each participant’s performance every other week and submit it to the South Bay Board along with the participant’s time sheet.
The contracts between the South Bay Board and OJT employers included additional provisions that clearly outlined the expectations regarding participant retention following the subsidy. The contract language reads:
[The] goal of the program is to retain the participant as a regular employee upon successful completion of training, at the post-training wage rate, at a full-time scheduled number of work hours unless otherwise agreed to in writing.... Failure to retain a [Transitional Subsidized Employment] participant who has success-fully completed training may be grounds for disqualification for subsequent ad-ditional [Transitional Subsidized Employment] agreements.
● Worksource Center staff members approached job development for PWE and OJT participants in distinctly different ways.
The shared pool of PWE employers maintained centrally by the South Bay Workforce Investment Board reduced the burden on individual Worksource Centers to find subsidized jobs openings for PWE group members. Worksource Center staff members reported that the availa-bility of a small number of PWE employers who were willing to accept almost any placement eased the pressure on them to develop new PWE placement opportunities. Many of the Work-source Centers used this pool of PWE employers or relied on a few places that could take many participants, while a few continued to identify additional jobs for PWE participants.
Several centers provided subsidized employment for PWE participants at their own or-ganizations and some centers hired them permanently in unsubsidized positions. Three said that they take on many PWE participants who want customer-service jobs and who are otherwise hard to place, and added that it was easier to provide unsubsidized job leads to participants who were already at the center. Two others reported taking on their higher-skilled PWE participants.
In comparison, the structure of the study required Worksource Centers to make an ac-tive attempt to increase the pool of OJT employers. Most centers worked to improve OJT job
7They had to carry $2 million in aggregate liability coverage and $1 million in liability coverage for prod-
ucts/completed operations and personal and advertising injury, for each occurrence. They were also required to have a workers’ compensation policy of at least $1 million.

41
development during the study, with varying degrees of success. Some centers had available job openings at no more than about 5 OJT employers, while a few others reported 10, and one even had 20 to 30. While the Worksource Centers that placed more participants typically had larger pools of employers, some of the higher-volume Worksource Centers had success working with a relatively limited number of employers. Most often, these employers had multiple types of jobs available. For example, some of the larger employers offered both clerical and warehouse positions.
To find employers, some Worksource Centers said they made contact with employers who posted positions on Craigslist and offered them the chance to hire OJT participants instead. Others attended job fairs and networking events, e-mailed employers who had participated in the past, and cold-called or canvassed neighborhood employers.
● Worksource Centers focused primarily on independently owned, small and medium-sized businesses for OJT placement.
Worksource Center staff members pointed out that they could have had difficulties placing participants with large corporations whose human resources departments had many rules regarding hiring. Conversely, they also noted that very small employers had difficulties meeting the insurance and liability requirements mentioned above, and lacked the time to deal with the paperwork involved in participating. Employers that had experienced the Transitional Subsidized Employment contracting process as it was conducted under the TANF Emergency Fund had fewer concerns, as the paperwork was already largely in place.
Employers were also supposed to submit a training plan describing the skills that partic-ipants would learn during the subsidy period, though often employers would just use a general job description. Worksource Centers reported that some employers were hesitant to participate because they did not want to train participants whom they perceived as having barriers to employment. Staff members said that this hesitancy was largely related to the stigma of working with TANF recipients.
The Employer Pool for Subsidized Placements
● Many different types of employers participated in the Transitional Sub-sidized Employment Program. Some hired many more employees than others.
The five PWE employers with the most placements were a food bank, the County Of-fice of Education, two Worksource Centers, and a nonprofit agency that provides services to low-income populations such as food assistance, medical care, and job-training programs. Of

42
these five, the employer that took on the most PWE participants had 76 placements, while the employer that took on the fewest had 30.
The five OJT employers with the most placements were a commercial photography studio, a wholesale food services company, a printing and copy shop, a fast food restaurant, and a medical-product sales company. Of these five, the employer that took on the most OJT participants had 16 placements, while the employer that took on the fewest had 13.
More generally, the job sectors represented among PWE and OJT employers included retail, construction, health care, automotive service and repair, manufacturing, food service, cleaning and janitorial, child care, education, other social services, recreation, legal work, and finance and insurance.
● PWE placements were concentrated among a comparatively small group of employers, while OJT placements were more spread out.
Figures 4.4 and 4.5 illustrate this fact. Figure 4.4 shows that while there were only slightly more PWE employers than OJT employers, there were almost twice as many PWE placements. The average PWE employer had 5.6 participants over the course of the study, compared with an average of 3.2 placements per OJT employer. Figure 4.5 shows that 35 percent of PWE employers only had a single placement, compared with 42 percent of OJT employers. Moreover, the five PWE employers with the most placements accounted for 36 percent of all PWE placements, whereas the top five OJT employers only accounted for 20 percent of all OJT placements. These differences reflect the fact that individual Worksource Centers were required to recruit their own employers for OJT participants, but were able to place PWE participants using the shared pool of employers.
● Interviews with employers revealed a mix of motivations to participate in the Transitional Subsidized Employment program.
Many employers said that, when recruiting employees for low-wage positions, they found it was easier to find good candidates through the Transitional Subsidized Employment program than it was to find them using traditional means such as advertisements on Craigslist. Working with the program simplified the hiring process, as they only had to review a few vetted candidates instead of having to look through hundreds of résumés. A subset of employers — most of them PWE employers — said that they primarily participated in the program to help the participants. They often described their involvement in the program as a way to give back to the community and to help those in need.
Some OJT employers saw the Transitional Subsidized Employment program as free or cheap labor and did not intend to keep participants past the subsidy period, while others

43
provided on-the-job training with the intention of hiring the participant after the subsidy ended. Some Worksource Centers deliberately advertised the program to employers as a way to obtain free labor, while one Worksource Center said it told employers that Transitional Subsidized Employment is not a free labor program, and that they needed to seriously consider hiring the participants permanently. Since OJT employers’ contracts with the South Bay Workforce Investment Board explicitly stated that they were expected to retain participants after the subsidy ended, the South Bay Board monitored retention among employers. In collaboration with Worksource Center staff members, it would terminate agreements with employers that demonstrated a pattern of not retaining participants who successfully completed the subsidy period.
Figure 4.4
Numbers of OJT and PWE Employers and Placements
111122
0
20
40
60
80
100
120
140
160
Num
ber
of e
mpl
oyer
s
OJT PWE
SOURCE: MDRC calculations using data from the South Bay Workforce Investment Board.
NOTE: The figures above exclude 16 OJT placements and 13 PWE placements for which no employer was listed.
353
682
0
100
200
300
400
500
600
700
Num
ber
of p
lace
men
ts
OJT PWE

44
The Subsidized Placement Process
● The Worksource Centers that placed participants at higher rates were typically more flexible than others and were able to tailor the subsi-dized-job-search process to the needs of individual participants.
For example, those Worksource Centers that performed better tended to schedule ap-pointments individually instead of having set orientation times, or at least provided their schedules to the GAIN regional office so that participants could find the time that worked best for them.
Typically, Worksource Centers interviewed newly referred participants to learn about their relevant work experience, skills, and interests. However, staff members’ ability to use this information to match participants with jobs was often constrained by the number of
Figure 4.5
Placements Among OJT and PWE Employers
42.338.7
12.66.3
35.3 36.9
15.6 12.3
0
10
20
30
40
50
60
70
80
90
100
1 2-4 5-9 10 or more
Perc
enta
ge o
f em
ploy
ers
Number of placements per employer
OJT PWE
SOURCE: MDRC calculations using data from the South Bay Workforce Investment Board.
NOTE: The figures above exclude 16 OJT placements and 13 PWE placements for which no employer was listed.

45
employers they had access to, participants’ proximity to job sites, or participants’ criminal backgrounds.
In addition to initial interviews with participants, Worksource Center staff members of-ten helped participants to practice their interview skills and refine the résumés they had devel-oped during job club (the four-week job-search activity they had all completed). Staff members said that improving participants’ résumés and interview skills was especially important for successful OJT placements. They noted that the résumés developed during job club were often relatively generic and did not always highlight the specific skills and experiences individual participants had that would make them marketable to employers.
Almost all PWE and OJT employers interviewed participants before accepting them for placements. The only exceptions were a small number of PWE employers that had long-standing relationships with the Transitional Subsidized Employment program and that consist-ently accepted many people the program referred to them. (For example, the most common PWE employer was a food bank that had many warehouse and clerical positions available for PWE participants.) Similarly, almost all employers asked to see a résumé before they would consider a participant for a subsidized job.
Worksource Center staff members reported that they made contact with employers on behalf of participants and set up interviews for them. Typically, they said, among those partici-pants they were eventually able to place, it took up to three interviews before a participant was hired.
Worksource Center staff members said that, whenever possible, they took transporta-tion into account when placing participants. Because an inability to get to work easily is a major reason people fail to retain jobs, they tried to ensure that they placed participants at work sites that they could get to easily, using the modes of transportation available to them.
If the Worksource Centers were unable to place a participant within 21 business days, they usually referred the client back to GAIN.8 However, if a Worksource Center felt that there was a high probability of placing a participant — for example, if that participant had one or more interviews scheduled shortly after the 21-day window — then it would refrain from referring the participant back to GAIN.
If they were referred back to GAIN, participants were either assigned to a different Worksource Center to reattempt placement or they were assigned to a different activity, such as community service or job searching. The decision as to how to proceed was made by individual case workers and participants, based on participants’ specific circumstances.
8GAIN typically referred participants to Worksource Centers on the day of random assignment.

46
Many Worksource Center staff members indicated that they would attempt to place a participant in a second position if the participant’s first position ended before the full six-month subsidy period was up. This combination of circumstances most commonly occurred when OJT employers declined to move participants onto their payrolls in the third month of the subsidy. Worksource Center staff members said that if the job loss was the participant’s fault (if, for example, they lost the job for not showing up to work without prior notice, theft or other employee misconduct, or multiple instances of tardiness), then they would not typically attempt to make a second placement.
Case Management During Placements
Los Angeles County’s design of the PWE and OJT approaches intended for Work-source Center staff members to provide ongoing case management to participants. However, there was variation in the degree to which Worksource Centers consistently communicated with participants following placement. Similarly, the Centers handled staffing for the Transitional Subsidized Employment program in different ways, as described in Box 4.1.
Box 4.1
Worksource Center Staffing
Worksource Centers handled staffing for the Transitional Subsidized Employment program in different ways. Most did one of two things: Either they had one or two staff members dedicated to the program or they had a larger group of staff members working on the pro-gram who also had multiple other responsibilities. Which they chose was generally a func-tion of how the program fit into their existing structures and capabilities. Some funded program staff members only with the payments they received for placing participants with employers, while others supplemented this funding with the time of existing managers, case workers, and job developers.
Worksource Centers with dedicated program staff members typically had one or two. Some centers ran the program with just one staff person responsible for all aspects of the program: providing case management, recruiting employers, and identifying job openings, among other responsibilities. Another group of centers had a single program worker responsible for case management, along with a job developer who found job openings for OJT participants, and in some cases, for PWE participants as well. Some of the larger Worksource Centers had staff members who were full-time job developers. Depending on the center, these job developers worked in specific sectors of the labor market or were assigned to specific programs, and lent assistance to the Transitional Subsidized Employment program. Most often Worksource Center staff members who worked on the Transitional Subsidized Employment program worked on other programs as well, even in some cases where they were the only person working on Transitional Subsidized Employment.

47
● In most cases Worksource Center staff members and participants inter-acted little after participants were placed in subsidized jobs.
Employers were required to submit time sheets to the Worksource Centers that included a performance review section; some Centers reported using these notes to organize their case management, although not all employers included much detail on these reviews.
For OJT participants in the first two months of their placements and for all PWE partic-ipants, the most frequent point of contact with Worksource Centers came when they received their paychecks every other week. While participants had the option of setting up direct deposit, Worksource Centers reported that the vast majority chose to receive paper checks.
Some Worksource Center staff members said they drove to job sites with the checks, but most required participants to come to the Worksource Centers to pick them up. Staff members consistently said they used this biweekly interaction to check in with participants, often addressing workplace issues or confirming that participants were receiving the transporta-tion or child care support from GAIN that they needed. Worksource Centers said that they communicated with OJT participants far less frequently after they moved onto employers’ payrolls.
One center used text messages to communicate with participants placed in subsidized jobs once or more per week. Several Worksource Centers reported visiting work sites to speak to participants. As was the case with the biweekly check-ins, these interactions largely focused on the status of the placement and any workplace issues that had emerged. More frequently, though, the Worksource Centers left it up to participants to initiate contact regard-ing workplace issues.
GAIN staff members also said they had limited interaction with participants after they were placed, apart from processing requests for assistance with child care, transportation, and work materials. The TSE Liaisons said that participants were most likely to reach out to them as they neared the end of the subsidy period for help searching for unsubsidized jobs.
● Employers indicated that they would make contact with Worksource Centers if they had issues with participants.
The most common issue employers raised was poor attendance — both lateness and unplanned absences. Employers commonly terminated participants for reasons including poor performance, unexcused absences, and failure to follow guidance or direction from supervisors.

48
Support for Unsubsidized Job Searches
● Participants did not consistently receive help from the program when it came time to search for an unsubsidized job.
While individual Worksource Center and GAIN staff members reported providing such assistance to participants, their methods and intensity varied. Moreover, conversations with GAIN and Worksource Centers revealed that neither was sure which of them had primary responsibility for providing this support.
There was variation among Worksource Centers in how much unsubsidized-job-search support they gave participants during the subsidy period. About half of the Worksource Centers reported providing job leads by e-mail or phone to participants throughout the subsidy period and even beforehand; others waited until the last few weeks or until after the end of the subsidy period. One Worksource Center said that because it was paid primarily based on placements in subsidized jobs (Worksource Centers were paid $1,200 per subsidized job placement and $400 per unsubsidized job placement), and because it had limited resources to run the program, it did not focus on unsubsidized job development or helping participants search for unsubsidized jobs.
● PWE participants did not consistently have dedicated time to search for unsubsidized jobs.
Los Angeles County intended for PWE participants to have eight hours of paid job-search time in the final month of their subsidized placements, but conversations with Work-source Centers revealed that they did not regularly receive it.
● Some Worksource Centers were more systematic than others in helping participants pursue unsubsidized employment.
Staff members at one Worksource Center reported that they would send a list of all par-ticipants coming to the end of the subsidy to the center’s job development team — a group who identified job leads for all of the center’s multiple employment programs. The file included basic information about the participants and their work experience, and the job development team would attempt to match these participants with unsubsidized listings. Another center required all PWE participants to come to the center for help searching for unsubsidized jobs as they neared the end of their placements.
● For OJT participants, support for post-subsidy job searching was even less structured.
The assumption among staff members was that OJT participants would make a transi-tion to unsubsidized jobs with their OJT employers when the subsidy ended. Worksource

49
Center staff members did not report working with OJT participants to identify unsubsidized jobs in the event that they were not retained by their OJT employers.
Summary of Implementation Findings The implementation of PWE and OJT for this study relied on the coordinated actions of a large number of entities across a geographically dispersed area. The fact that the research design aimed to compare the effects of two distinct subsidized employment models made implementa-tion even more complex.
Despite these challenges, the test in Los Angeles County demonstrates that it is feasible to implement a large-scale subsidized employment intervention for a TANF population.
● The PWE placement rate is clear evidence that a welfare-to-work pro-gram can create subsidized work experiences for TANF recipients on a large scale, with diverse public-sector and nonprofit employers.
The Worksource Centers were successful in placing participants with both public-sector and nonprofit employers, and a relatively high proportion of participants completed the full six-month placement.
● The OJT placement rate, while lower than PWE’s, compares favorably with other attempts to place welfare participants in on-the-job training positions.
A study of a welfare grant diversion in New Jersey found a very similar rate of on-the-job training placements — 43 percent. That study’s authors noted that this rate was higher than those in five other states running similar interventions.9 In a study in Maine, only 30 percent of the program group was successfully placed in on-the-job training positions.10 While the popula-tion involved is not directly equivalent, an evaluation of Job Training Partnership Act programs found a similar placement rate to the Maine study. That intervention, which included an on-the-job training component, had a placement rate of 30 percent.11 The experience of implementing OJT in this study reinforces these previous findings that it is difficult to place hard-to-employ people in private-sector subsidized employment.
9Freedman, Bryant, Cave, and Bangser (1988). 10Auspos, Cave, and Long (1988). 11Orr et al. (1996).
50
● The variation in placement rates among Worksource Centers suggests that if future interventions direct more referrals to higher-performing centers, they could achieve even higher average placement rates.
While the overall PWE placement rates were high and some Worksource Centers were successful in placing OJT participants, there was substantial variation in placement rates among Worksource Centers. If GAIN channeled a greater proportion of referrals to those Worksource Centers that had more robust job development and case management, it might be able to increase overall placement rates.
It is important to acknowledge two additional challenges to implementation, one caused by the study itself and one caused by the financial structure of the subsidy.
● The requirement that Worksource Centers place participants only in the type of position to which they had been randomly assigned — OJT or PWE — probably limited placement rates somewhat.
This requirement was especially burdensome when it came to OJT participants. Work-source Centers had less difficulty placing PWE participants, since they could use the shared pool of PWE employers. If participants had uncommon career goals, however, or more pro-nounced barriers to employment (for example, criminal backgrounds, child care responsibilities that constrained their schedules, or limited language skills), centers often did not have OJT employers available that could hire them.
● The Worksource Center reimbursement structure itself may have also contributed to implementation challenges, especially when it came to helping participants retain their subsidized positions.
The structure of the contract between the South Bay Workforce Investment Board and the Worksource Centers — specifically that the bulk of payment was for the placement rather than for retention — led Worksource Centers to focus on initial placements. They may have put less time into assisting participants with job retention or finding unsubsidized work, which was the ultimate goal of the program. Further, as Worksource Centers found OJT more difficult, the reimbursement structure gave them an incentive to focus on easier placements, typically those for participants assigned to PWE.

51
Chapter 5
Impacts
The primary goal of the Transitional Subsidized Employment program was to increase the employment and earnings of participants. This report examines early impacts: the program’s effects on employment and earnings and its effects in other areas in the first year after random assignment and shortly thereafter. Since the analysis period includes the time when Paid Work Experience (PWE) and On-the-Job Training (OJT) program group members were participating in subsidized employment, the early impacts shown here are a direct result of these placements. The programs’ impacts on employment and earnings in the unsubsidized labor market require further follow-up to assess; they will be presented in a later report.
As discussed in previous chapters, the Transitional Subsidized Employment program, which includes both the PWE and OJT approaches, heavily emphasizes building work experi-ence by placing participants in mainly low-wage jobs where they can develop their basic employability skills. Both the PWE and OJT approaches are therefore hypothesized to affect employment rates first, with longer-term earnings gains emerging for participants over time due to the work experience they gain from subsidized employment. Short-term differences in the two approaches’ impacts will be largely the result of the differences in their placement rates. That is, OJT was expected to and did have a lower placement rate than PWE because OJT required Worksource Centers to find jobs in the private sector, which proved comparatively difficult for them, as discussed in earlier chapters. Thus, the short-term effects are expected to be lower for OJT than PWE. More follow-up is needed before it will be possible to assess whether OJT and PWE have different long-term impacts (because of the nature of their place-ments or because of other differences between them), or whether PWE is more effective than OJT for some types of participants or vice versa (that is, which works better for whom).
To assess the approaches’ impacts on employment and their effects in other areas, this study compares the outcomes of program participants with the outcomes of similar individuals who did not participate in the program. While assignment to the control group means that those sample members did not participate in subsidized employment, control group members did continue to receive other services from Los Angeles County and were free to seek out other services available in the community. Examining the differences in participation and service receipt between PWE and OJT program group members and control group members makes it possible to assess the extent to which program group members received different types or amounts of assistance. These differences in participation and service receipt, in turn, provide context needed to understand the differences between the outcomes of program group members and control group members. This chapter therefore describes the two approaches’ impacts on

52
participation and service receipt, followed by their impacts on employment and their effects in other areas in the first year after random assignment.1
Impacts on Participation and Service Receipt To receive benefits from Temporary Assistance for Needy Families (TANF), control group members who were not exempt from work requirements had to participate in some other activity such as unsubsidized employment, vocational training, community service, or job-search and job-readiness activities.2 Since TANF mandates work activity for recipients unless they have an exemption (as discussed in Chapters 2 and 3) and since the county’s database showed that 80 percent of control group members participated in some welfare-to-work activity in the six months following random assignment (as noted in Chapter 4), control group participa-tion levels were expected to be fairly high. Therefore, program-control differences in participa-tion (or “impacts” on participation) in activities other than subsidized employment were expected to be small. Table 5.1 shows impacts on participation and service receipt for all three research groups in three categories (employment support, education and training, and other services), as recorded by a survey administered around 12 months after random assignment.
● Apart from the subsidized job, the program had modest impacts on par-ticipation and service receipt, reflecting the fact that the control group continued to receive services from the county and other providers in the community.
The PWE and OJT subsidized employment approaches differed from other recently studied subsidized employment programs (such as those serving noncustodial fathers and former prisoners in the recent Department of Labor-funded studies mentioned in the introduc-tion to this report) in two important ways that affect their impacts on participation and service receipt. First, as mentioned, control group members in this study still had access to other services provided by Los Angeles County as part of TANF. Second, the subsidized employment intervention in Los Angeles primarily focused on the subsidized job itself, and did not include the additional services provided in some of these other recent studies, in part because the county already provided some of these services. It is not surprising, therefore, that the Transitional Subsidized Employment program had modest overall impacts on participation and service receipt apart from the subsidized job itself, as the control group received services at a high rate, especially compared with control groups in the Department of Labor-funded studies.
1Unless otherwise indicated, all impact results discussed in this report are statistically significant, with
p < 0.10. 2PWE and OJT members also had access to these services provided by the county during or after their
participation in their assigned approaches.
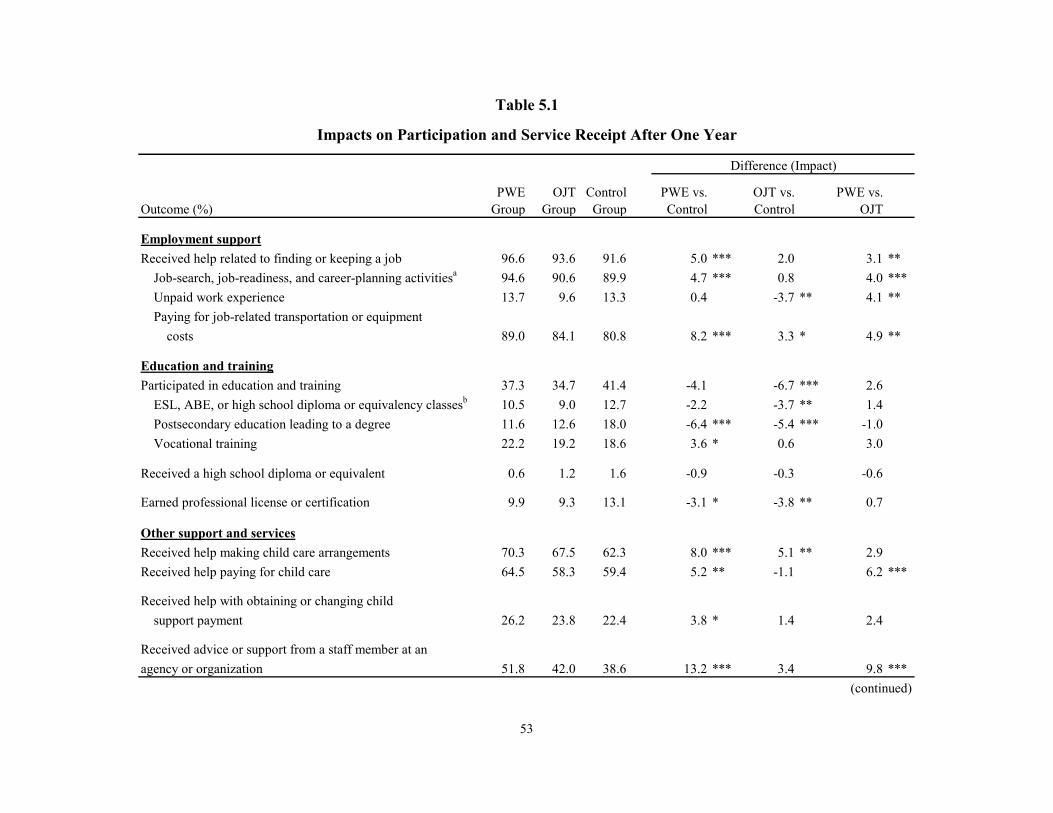
53
Outcome (%)PWE
GroupOJT
GroupControlGroup
PWE vs. Control
OJT vs. Control
PWE vs. OJT
Employment supportReceived help related to finding or keeping a job 96.6 93.6 91.6 5.0 *** 2.0 3.1 **
Job-search, job-readiness, and career-planning activitiesa 94.6 90.6 89.9 4.7 *** 0.8 4.0 ***Unpaid work experience 13.7 9.6 13.3 0.4 -3.7 ** 4.1 **Paying for job-related transportation or equipment
costs 89.0 84.1 80.8 8.2 *** 3.3 * 4.9 **
Education and trainingParticipated in education and training 37.3 34.7 41.4 -4.1 -6.7 *** 2.6
ESL, ABE, or high school diploma or equivalency classesb 10.5 9.0 12.7 -2.2 -3.7 ** 1.4Postsecondary education leading to a degree 11.6 12.6 18.0 -6.4 *** -5.4 *** -1.0Vocational training 22.2 19.2 18.6 3.6 * 0.6 3.0
Received a high school diploma or equivalent 0.6 1.2 1.6 -0.9 -0.3 -0.6
Earned professional license or certification 9.9 9.3 13.1 -3.1 * -3.8 ** 0.7
Other support and servicesReceived help making child care arrangements 70.3 67.5 62.3 8.0 *** 5.1 ** 2.9Received help paying for child care 64.5 58.3 59.4 5.2 ** -1.1 6.2 ***
Received help with obtaining or changing childsupport payment 26.2 23.8 22.4 3.8 * 1.4 2.4
Received advice or support from a staff member at an agency or organization 51.8 42.0 38.6 13.2 *** 3.4 9.8 ***
Difference (Impact)
Table 5.1
Impacts on Participation and Service Receipt After One Year
(continued)

54
Outcome (%)PWE
GroupOJT
GroupControlGroup
PWE vs. Control
OJT vs. Control
PWE vs. OJT
Received mentoring from a staff member at an agency or organization 50.1 34.5 32.7 17.4 *** 1.9 15.5 ***
Received mental health assistance 9.7 9.8 12.2 -2.5 -2.4 -0.2
Sample size 700 694 698
Difference (Impact)Table 5.1 (continued)
SOURCE: MDRC calculations based on responses to the 12-month survey.
NOTES: Results in this table are regression-adjusted, controlling for pre-random assignment characteristics. Statistical significance levels are indicated as: *** = 1 percent; ** = 5 percent; * = 10 percent.aIncludes help with job searches, job referrals, developing a résumé, filling out job applications, preparing for job interviews, job-readiness
training, and planning for future career or educational goals.bESL = English as a second language, ABE = adult basic education.

55
Almost all of the PWE and OJT program group members reported receiving assistance related to employment. PWE and OJT group members were more likely to receive help related to finding or keeping a job than control group members, but this impact was small, since large proportions of both the control group and the program groups made use of these services. PWE and OJT group members were also more likely than control group members to have received services related to finding employment specifically. The PWE group was more likely than both the control group and the OJT group to receive assistance with employment-related expenses such as transportation or equipment. The contrast presented in this table does not specifically include subsidized employment — the main service provided to the PWE and OJT groups but not to the control group — as subsidized employment is analyzed alongside other employment outcomes in the next section of this chapter. Lastly, while PWE group members participated in unpaid work experience at similar rates as the control group, OJT group members were less likely to have participated in this activity.
● Both PWE and OJT group members were less likely to participate in postsecondary education than control group members, and OJT group members were less likely to participate in any education and training activities measured by the survey.
PWE and OJT group members were less likely to participate in postsecondary educa-tion leading to a degree than control group members. There could be a number of reasons for this difference: PWE and OJT group members were more likely to be employed (discussed more in the next section of this chapter) and therefore may have had less time available to pursue postsecondary education. In the absence of subsidized employment (which counts toward TANF work requirements), more control group members may have elected to pursue postsecondary education (which also counts toward TANF work requirements) to increase their future employment prospects in the long term while meeting the requirements in the short term.3 Regardless, these results suggest that participation in subsidized employment may have an opportunity cost that could affect longer-term employment and earnings, if control group members secure degrees or credentials that make them more competitive in the labor market. Future reports with longer follow-up periods will analyze the extent to which control and program group members successfully completed postsecondary education programs and earned degrees.
OJT group members also reported lower rates of participation in other education activi-ties, such as high school equivalency courses, and were less likely than control group members to participate in any education and training activities. Both PWE and OJT group members were
3Under federal regulations, TANF programs can count a maximum of 12 months of postsecondary educa-
tion or vocational training toward a participant’s core work requirement in his or her lifetime.

56
somewhat less likely than control group members to report receiving a professional license or certification in the year following random assignment.
● Both PWE and OJT group members reported receiving child care ser-vices at higher rates than control group members.
While both PWE and OJT group members reported receiving assistance with child care at higher rates than control group members, only PWE group members were more likely to report having received help paying for child care. These differences reflect PWE and OJT group members’ participation in subsidized employment. PWE and OJT group members were more likely to receive child care services because of their participation in subsidized jobs. Likewise, more PWE group members were employed — due to their high rates of participation in subsi-dized employment (as discussed earlier in this report) — and therefore more of them were eligible for child care assistance.
● PWE group members were more likely to report receiving advice, sup-port, or mentoring from staff members than control group members or OJT group members.
This difference may reflect the overall high rate of subsidized employment among PWE group members, who were placed at nonprofit organizations or public agencies where they may have found these mentors. It may also reflect the work environments into which PWE group members were placed, which tended to be more supportive than unsubsidized work environ-ments or the environments at OJT positions (which were meant to be similar to the world of “real-life” unsubsidized work).
● Program impacts, if any, are likely to be the result of subsidized employment.
On the whole, these impacts on service receipt and participation apart from subsidized employment are relatively modest. Therefore any other program impacts — impacts on em-ployment and earnings, TANF receipt, and overall well-being — are likely to represent effects resulting primarily from PWE or OJT subsidized employment, rather than these additional supportive services.
Impacts on Employment and Earnings Table 5.2 shows the employment and earning outcomes for PWE, OJT, and control group members in the first year after random assignment. The top panel (“administrative outcomes”) shows measures derived from unemployment insurance wage records, supplemented with data

57
OutcomePWE
GroupOJT
GroupControlGroup
PWE vs.Control
OJT vs.Control
PWE vs.OJT
Administrative outcomesa
Employment (%) 91.9 76.2 57.8 34.1 *** 18.4 *** 15.8 ***PWE or OJT subsidized employment 79.4 41.6 --
Number of quarters employed 2.8 2.1 1.5 1.3 *** 0.6 *** 0.8 ***Employed in all quarters (%) 28.1 20.7 14.9 13.3 *** 5.9 *** 7.4 ***
Total earnings ($) 7,188 5,764 4,459 2,729 *** 1,305 *** 1,424 ***Amount of earnings subsidized ($) 3,895 1,083 --
Total earnings (%)$6,000 or more 57.8 36.7 26.2 31.2 *** 10.2 *** 21.1 ***$10,000 or more 23.2 22.5 15.9 7.3 *** 6.6 *** 0.7$14,000 or more 9.0 11.6 10.7 -1.7 0.9 -2.6 *
Employment in the first quarter of Year 2 51.5 53.6 47.2 4.4 * 6.5 *** -2.1PWE or OJT subsidized employment 2.1 1.9 -- in the first quarter of Year 2
Sample size 874 877 871
Self-reported outcomesEver employed in Year 1 (%) 78.6 70.0 55.5 23.0 *** 14.5 *** 8.6 ***
Currently employed (%) 43.2 44.3 38.9 4.3 5.4 ** -1.1(continued)
Table 5.2
Impacts on Employment and Earnings After One Year
Difference (Impact)

58
OutcomePWE
GroupOJT
GroupControlGroup
PWE vs.Control
OJT vs.Control
PWE vs.OJT
Hours worked per week in current job (%)More than 20 hours 33.3 33.1 28.4 4.9 * 4.7 * 0.2More than 34 hours 22.1 22.7 18.0 4.1 * 4.8 ** -0.7
Hourly wage in current job (%)More than $10.00 16.5 14.5 13.7 2.8 0.8 2.0More than $12.00 9.0 8.2 7.2 1.8 1.1 0.8More than $15.00 2.8 3.7 3.5 -0.8 0.1 -0.9
Type of employment (%)Not currently employed 57.2 56.2 61.5 -4.3 -5.3 ** 1.0Permanent 31.9 35.8 27.4 4.5 * 8.3 *** -3.9Temporary, including day labor and odd jobs 10.4 7.6 10.3 0.1 -2.7 * 2.8 *Other 0.4 0.4 0.7 -0.3 -0.3 0.0
Currently in subsidized employment (%) 1.3 2.0 1.2 0.1 0.7 -0.7
Among those currently employedb
Hours worked per week 31.9 31.3 30.8 1.1 0.5 0.6Hourly wage ($) 10.5 10.8 10.5 0.0 0.3 -0.3
Sample size 700 692 698(continued)
Difference (Impact)
Table 5.2 (continued)

59
from the South Bay Workforce Investment Board concerning subsidized employment and earnings.4 The bottom panel (“self-reported outcomes”) shows measures derived from a survey administered roughly 12 months after random assignment.
● In the first year after random assignment, both PWE and OJT group members were more likely than control group members to have ever been employed. They also worked more quarters on average and had higher average earnings.
According to the administrative data, 58 percent of the control group worked in the first year after random assignment. However, the employment rate in the first year after random assignment for the PWE group was 34 percentage points higher than the employment rate for the control group; the difference in employment rates between the OJT group and the control group was 18 percentage points.5 PWE and OJT group members also worked, on average, in more quarters than control group members, and were more likely to have worked in all four quarters of the year following random assignment. The annual average earnings for PWE group members were more than $2,000 higher than the average for the control group; the difference between OJT and control group members’ annual average earnings was over $1,000.6 However, similar proportions of PWE, OJT, and control group members earned $14,000 or more in the
4“Administrative records” are data collected in the course of administering a program. “Administrative outcomes” are measures derived from such data.
5Note that for both the PWE and OJT groups, the employment rates based on self-reports are lower than those derived from administrative data. This discrepancy could indicate that some members of the two program groups did not perceive their subsidized placements as employment.
6Obvious outliers — earnings records of more than $100,000 per quarter — were removed from the analy-sis as records that were likely to be invalid. To guard against additional possible outliers, the table also presents the percentages of each group who earned more than certain amounts.
Table 5.2 (continued)
SOURCES: MDRC calculations based on quarterly wage data from the National Directory of New Hires, program payroll records, and responses to the 12-month survey.
NOTES: Results in this table are regression-adjusted, controlling for pre-random assignment characteristics.
Statistical significance levels are indicated as: *** = 1 percent; ** = 5 percent; * = 10 percent.One sample member is missing a Social Security number and therefore could not be matched to
employment data. aEmployment rates and earnings include both subsidized jobs and all other jobs covered by
unemployment insurance.bThese measures are calculated among those employed at the time of the survey; they are therefore
considered nonexperimental and are not tested for statistical significance.

60
year following random assignment, indicating that the increase in annual average earnings is mostly due to the difference in employment rates between the groups, rather than reflecting employment in better-paying jobs.7
These differences in employment and earnings reflect participation in the PWE and OJT programs: 80 percent of PWE group members and 42 percent of OJT group members had subsidized employment in the year following random assignment.8 As shown in Figures 5.1 and 5.2, the differences in employment and earnings between the program groups and the control group were concentrated in the first two quarters after random assignment, the same time period when participation in subsidized employment was the greatest.9
Figures 5.1 and 5.2 also show that the employment rates and earnings of both the PWE and OJT group members converged over time with the employment rates and earnings of control group members. By the beginning of the second year following random assignment, the differences between the PWE and OJT members’ employment rates and those of the control group were modest, and were partially due to program group members’ continued participation in subsidized employment. Among those employed at the time of the survey, there appears to be few differences between the three groups in hours worked or wage rates.10
● For both PWE and OJT, the employment impacts were concentrated among those who had little recent work experience.
Table 5.3 shows a limited set of employment outcomes for two subgroups: people who did not work in the year before random assignment and those who did. Recent work experience can be a sign of “employability” — an individual’s ability to gain employment in the competi-tive labor market, or that person’s “job readiness” (which PWE and OJT are designed to enhance). Recent work experience also predicts future employment fairly well, as can be seen in the differences between the control group subgroups: Only 45 percent of the people in the control group who did not work in the year before random assignment were employed in the year following random assignment, while 76 percent of those who did work in the year before random assignment were employed in the following year.
7The total earnings thresholds shown in the table ($6,000, $10,000, and $14,000) were determined using
the distribution of control group earnings. Specifically, the thresholds were set at the 25th, 50th, and 75th percentiles of the control group’s earnings distribution.
8Note that the subsidized employment rates presented in this analysis are measured on a calendar quarterly basis, and therefore may differ slightly from the 12-month rates shown in earlier chapters and exhibits.
9In Figures 5.1 and 5.2, total employment and earnings for the program groups include both subsidized and unsubsidized jobs.
10Overall, including individuals in all groups who were not employed, PWE and OJT group members worked more hours and had higher hourly wages than control group members. Thus, these overall average differences in hours and wages were due to the difference in employment rates.

61
(continued)
Figure 5.1
PWE Employment and Earnings Over Time
Employment
Earnings
0102030405060708090
100
0***
1***
2***
3***
4*
Perc
enta
ge e
mpl
oyed
Quarter after random assignment
PWE group total employment
Control group employment
668
2,289 2,385
1,846 1,960
411
1,038
1,3841,625
1,874
0
500
1,000
1,500
2,000
2,500
3,000
0***
1***
2***
3*
4
Ave
rage
ear
ning
s ($)
Quarter after random assignmentPWE group Control group
PWE group subsidized employment

62
For both PWE and OJT, the differences in employment rates and earnings between the program group and the control group were larger in the subgroup of sample members who had not worked in the year before random assignment. PWE had a 45 percentage point impact among those who had not worked in the previous year, and an 18 percentage point impact among those who had worked; for OJT these impacts were 24 percentage points and 10 per-centage points, respectively. Notably, almost all of the impacts on employment rates in the first quarter of Year 2 appear to be concentrated among sample members who were not employed in the year before random assignment. In addition, the difference between the PWE and OJT groups was larger for the subgroup who did not work in the year before random assignment than it was for the subgroup who did.
Impacts on TANF Benefits and Child Care Table 5.4 shows outcomes related to TANF receipt during the year following random assign-ment. These measures were derived from Los Angeles County data on TANF payments. Appendix Table A.1 shows outcomes related to child care, derived from the survey of research participants administered roughly one year after random assignment.
● In the year following random assignment, there were few differences in the rates at which PWE, OJT, and control group members received TANF benefits, but PWE and OJT group members received slightly lower total TANF payments.
Almost all of the research participants received TANF benefits in the quarter of random assignment. Receipt rates declined in a similar fashion for all three groups, reaching around 70 percent for PWE, OJT, and control group members in the first quarter of the second year following random assignment. PWE and OJT group members did receive lower amounts from TANF on average than control group members in the year following random assignment, though the differences between the program groups and the control group were fairly small. The PWE group also experienced a somewhat greater reduction in total TANF payments than the
Figure 5.1 (continued)
SOURCES: MDRC calculations based on quarterly wage data from the National Directory of New Hires, program payroll records, and responses to the 12-month survey.
NOTES: Results in this table are regression-adjusted, controlling for pre-random assignment characteristics.Statistical significance levels are indicated as: *** = 1 percent; ** = 5 percent; * = 10 percent.Employment rates and earnings include both subsidized jobs and all other jobs covered by
unemployment insurance.

63
(continued)
Figure 5.2
OJT Employment and Earnings Over Time
Employment
Earnings
0102030405060708090
100
0***
1***
2***
3***
4***
Perc
enta
ge e
mpl
oyed
Quarter after random assignment
OJT group total employment
Control group employment
453
1,6101,826 1,875 1,935
411
1,038
1,3851,625
1,874
0
500
1,000
1,500
2,000
2,500
3,000
0 1***
2***
3**
4
Ave
rage
ear
ning
s ($)
Quarter after random assignmentOJT group Control group
OJT group subsidized employment

64
OJT group (reflecting the PWE group’s overall higher earnings during this time). The reason there were not more substantial differences in TANF receipt and payments, even though there were substantial impacts on employment, is that California disregards a relatively high percent-age of earned income in calculating TANF benefits (50 percent). PWE and OJT wages would have counted as income, but half of this income would have been disregarded in the calculation of a sample member’s TANF benefits.
As discussed above, both PWE and OJT group members were more likely than control group members to report receiving assistance with child care in the year following random assignment (see Appendix Table 1). However, there were few differences between the three groups in child care outcomes. Only around 30 percent of sample members had some kind of child care arrangement in the month before the survey, and around 14 percent had received subsidized child care in that month.
Impacts on Economic and Personal Well-Being It is well established that losing a job can harm one’s well-being, but it is less clear whether finding a job has the inverse effect. Further, while there have been studies focusing on the effect of increased income on well-being, there have not been many that address whether income from work has a different effect on well-being than income from other sources. In the interest of exploring the relationship of employment and well-being further, this evaluation included survey questions that focused on financial and personal well-being. There was particular interest in understanding whether well-being increased during the time when program group members were working in subsidized jobs. Therefore, an earlier survey was administered to study participants around four months after random assignment, on average, at which time PWE and OJT group members were likely to be working in subsidized jobs or to have just completed their subsidized jobs.11 The one-year follow-up survey also asked
11Due to resource constraints, the four-month survey was only administered to a subsample of study par-
ticipants, and due to logistical constraints it was not administered to those randomly assigned at the beginning of the study. See Appendix B for more information about the survey samples and an analysis of the extent to which results may be biased by survey nonresponse.
Figure 5.2 (continued)
SOURCES: MDRC calculations based on quarterly wage data from the National Directory of New Hires, program payroll records, and responses to the 12-month survey.
NOTES: Results in this table are regression-adjusted, controlling for pre-random assignment characteristics.Statistical significance levels are indicated as: *** = 1 percent; ** = 5 percent; * = 10 percent.Employment rates and earnings include both subsidized jobs and all other jobs covered by
unemployment insurance.

65
OutcomePWE
GroupOJT
GroupControlGroup
PWE vs.Control
OJT vs.Control
PWE vs.OJT
PWE vs.Control
OJT vs. Control
PWE vs.OJT
Did not work in the previous yearb
Employment (%) 90.2 68.6 44.9 45.3 *** 23.8 *** 21.6 *** ††† ††† †††PWE or OJT subsidized employment 80.9 41.0 --
Number of quarters employed 2.7 1.7 1.1 1.6 *** 0.6 *** 1.0 *** ††† †††
Total earnings ($) 6,686 4,370 2,977 3,709 *** 1,393 *** 2,316 *** ††† †††
Employment in the first quarter of Year 2 45.3 45.0 37.7 7.6 ** 7.3 ** 0.3PWE or OJT subsidized employment in the first 2.5 2.0 --
quarter of Year 2
Sample size 874 877 871
Worked in the previous yearb
Employment (%) 94.4 86.4 76.0 18.4 *** 10.4 *** 8.0 *** ††† ††† †††PWE or OJT subsidized employment 77.4 42.7 --
Number of quarters employed 3.0 2.5 2.0 1.0 *** 0.5 *** 0.5 *** ††† †††
Total earnings ($) 7,830 7,621 6,594 1,236 ** 1,027 * 209 ††† †††
Employment in the first quarter of Year 2 59.8 65.2 60.3 -0.5 4.9 -5.4PWE or OJT subsidized employment in the first 1.6 1.6 --
quarter of Year 2
Sample size 874 877 871(continued)
Subgroup Impactsa
Table 5.3
Difference Between
at Random Assignment
Difference (Impact)
Impacts on Employment and Earnings After One Year, by Employment Status

66
Table 5.3 (continued)
SOURCES: MDRC calculations based on quarterly wage data from the National Directory of New Hires, program payroll records, and responses to the 12-month survey.
NOTES: Results in this table are regression-adjusted, controlling for pre-random assignment characteristics. Statistical significance levels are indicated as: *** = 1 percent; ** = 5 percent; * = 10 percent.Employment rates and earnings include both subsidized jobs and all other jobs covered by unemployment insurance.aWhen comparing impacts between two subgroups, an H-statistic is generated. The H-statistic is used to assess whether the difference in impacts between the subgroups
is statistically significant. Statistically significant differences across subgroups are indicated as: ††† = 1 percent; †† = 5 percent; † = 10 percent.bAs shown in quarterly wage records from the National Directory of New Hires.

67
OutcomePWE
GroupOJT
GroupControlGroup
PWE vs.Control
OJT vs.Control
PWE vs.OJT
Ever received a TANF payment (%) 99.1 99.9 99.1 0.0 0.8 ** -0.8 **
Number of months receiving TANF payments 9.9 9.9 10.1 -0.2 -0.2 0.0
Received TANF payments in quarter (%)Quarter of random assignment 99.1 99.7 98.8 0.3 0.8 * -0.6First quarter after random assignment 95.9 96.1 95.6 0.3 0.5 -0.2Second quarter after random assignment 85.4 84.9 86.7 -1.3 -1.8 0.5Third quarter after random assignment 76.8 76.0 78.0 -1.2 -2.0 0.8Fourth quarter after random assignment 69.5 71.3 72.1 -2.6 -0.8 -1.8
(first quarter of Year 2)
Amount of TANF paymentsa ($) 4,571 4,870 5,040 -469 *** -170 ** -299 ***
Left TANF during Year 1b (%) 38.1 37.9 32.6 5.6 ** 5.3 ** 0.3
Sample size 874 877 871
Table 5.4
Impacts on TANF Receipt After One Year
Difference (Impact)
SOURCE: MDRC calculations based on Los Angeles Department of Public Social Services TANF data.
NOTES: Results in this table are regression-adjusted, controlling for pre-random assignment characteristics.aIncludes TANF payments in the quarter of random assignment and the first three quarters after random assignment.bDefined as leaving TANF for at least two months.

68
questions regarding well-being, although the evaluation team did not expect the program to generate considerable longer-term effects on well-being: The primary intervention involved temporary, minimum-wage positions for program group members, with little additional support beyond the existing services available to both program group and control group members. This section presents the impacts on well-being at four months (Table 5.5), fol-lowed by the impacts on well-being after a year (Table 5.6).
● Around four months after random assignment, when many people were still in subsidized jobs, both PWE and OJT group members were more likely than control group members to report being financially better off than they had been a year before. There were few other statistically sig-nificant differences in well-being between PWE, OJT, and control group members during this early follow-up period.
As shown in Table 5.5, around four months after random assignment PWE members were 22 percentage points more likely than control group members and 15 percentage points more likely than OJT members to report being financially better off than they had been a year before. There may have been a larger impact on the PWE group than the OJT group because PWE group members were placed in subsidized jobs at a higher rate. PWE group members were somewhat less likely to experience psychological distress than their control group counterparts. There were few other statistically significant differences between the program groups and the control group in measures of well-being related to food security, happiness, and social support.
● Around one year after random assignment, there were few statistically significant differences in measures of well-being between program group members and control group members.
As Table 5.6 shows, there were almost no statistically significant impacts on well-being for either program group around one year after random assignment. One exception is that OJT group members were more likely to have employer-based health insurance. It is worth noting that over half of all groups experienced some form of financial shortfall during the year, with around 40 percent being unable to pay for housing and around a third having a utility or phone line disconnected. Around a fifth of all group members had had insufficient food in the month before the survey, and a fifth had not had health care coverage in the previous month.
Summary of Impact Findings There were few notable differences in service receipt between the program groups and
the control group except for participation in subsidized employment. Both PWE and OJT

69
Outcome (%)PWE
GroupOJT
GroupControlGroup
PWE vs. Control
OJT vs. Control
PWE vs. OJT
Financial well-beingState of family finances at the end of a typical month (%)
Some money left over 7.2 7.1 4.4 2.9 * 2.8 0.1Just enough to make ends meet 46.7 43.8 43.0 3.7 0.7 3.0Not enough to make ends meet 46.0 49.1 52.6 -6.6 * -3.5 -3.1
Financial situation is better than it was this time last year (%) 66.7 51.8 44.4 22.3 *** 7.5 ** 14.8 ***
Frequency of worry about ability to meet monthly living expenses(range of 0 to 10 where 0 = never and 10 = all the time) 6.9 7.2 6.9 -0.1 0.3 -0.3
Did not have enough food in the past week (%) 22.5 19.8 24.0 -1.5 -4.2 2.7
Personal well-being (%)Experienced serious psychological distress in the past montha 10.8 13.1 15.2 -4.4 * -2.1 -2.3
Overall happinessVery happy 24.4 21.7 20.9 3.5 0.8 2.7Pretty happy 56.4 56.0 57.2 -0.8 -1.2 0.4Not too happy 19.1 22.2 21.9 -2.7 0.4 -3.1
Social supportScore on social support scaleb 3.9 3.8 3.8 0.1 0.0 0.1
Has someone who could complete a small favor 85.5 84.4 83.4 2.1 1.0 1.1
Has someone who could lend $250 61.8 55.9 56.2 5.6 -0.3 5.9 *
Sample size 410 403 400(continued)
Difference (Impact)
Table 5.5
Impacts on Well-Being and Social Support After Four Months

70
Table 5.5 (continued)
SOURCE: MDRC calculations based on responses to the four-month survey.
NOTES: Results in this table are regression-adjusted, controlling for pre-random assignment characteristics. aA score of 13 or higher on the Kessler-6 (K-6) scale is used here to define serious psychological distress. The K-6 assesses how often during the past
month a respondent felt so sad that nothing could cheer him or her up; nervous; restless or fidgety; hopeless; that everything was an effort; or worthless. As a result of minor differences between the scale used to administer the K-6 in this survey and the standard K-6 scale, the percentages presented in this table may slightly underestimate the incidence of serious psychological distress in the sample.
bThe social support scale ranges from 1 to 5. The scale assesses how often the following types of support are available to respondents: someone to listen when they need to talk, to give information to help them understand a situation, to give good advice about a crisis, to confide in or talk to about themselves or their problems, to give valued advice, to share private worries and fears, to turn to for suggestions about how to deal with a personal problem, and to understand their problems.

71
OutcomePWE
GroupOJT
GroupControlGroup
PWE vs.Control
OJT vs.Control
PWE vs.OJT
Experienced a financial shortfall in the past 12 months 56.9 52.7 56.4 0.5 -3.7 4.3Could not pay rent or mortgage 42.3 39.3 42.7 -0.4 -3.4 2.9Evicted from home or apartment 5.7 6.0 6.0 -0.3 0.0 -0.3Utility or phone service disconnected 36.1 36.7 35.4 0.7 1.3 -0.6Could not afford prescription medicine 14.2 12.7 12.0 2.2 0.8 1.5
Received subsidized child care in the past month 13.6 13.8 14.0 -0.3 -0.2 -0.1
Received food stamps in the past month 85.0 84.5 84.2 0.8 0.3 0.5
Did not have enough food in the past month 23.5 20.2 20.9 2.6 -0.7 3.4
Lived in emergency or temporary housing in the 4.0 3.5 3.6 0.5 0.0 0.5past month
Is currently in good, very good, or excellent health 80.3 77.7 78.9 1.4 -1.2 2.7
Had health insurance coverage in the past month 81.1 81.9 83.2 -2.1 -1.4 -0.8Health insurance coverage was employer-based 6.4 7.1 4.3 2.1 * 2.8 ** -0.7
Is currently happyVery happy 32.0 30.4 30.4 1.6 0.0 1.6Pretty happy 50.3 50.1 51.8 -1.5 -1.7 0.2Not too happy 17.7 19.5 17.8 0.0 1.7 -1.8
Experienced serious psychological distress in the past 8.5 8.7 9.2 -0.7 -0.5 -0.2montha
Sample size 700 694 698
Table 5.6
Impacts on Economic and Personal Well-Being After One Year
Difference (Impact)
(continued)

72
increased employment and earnings in the year following random assignment; most of the increase appears to be due to the program-subsidized jobs. PWE group members worked more and earned more than OJT group members, reflecting the PWE approach’s higher placement and participation rates. However, there were few differences between the PWE, OJT, and control groups in secondary outcome measures such as those related to TANF receipt or well-being.
As has been seen in other studies of subsidized employment programs, the employment rates and earnings of the program groups converged with those of the control group over time. While both PWE and OJT group members had higher employment rates than the control group at the beginning of the second year following random assignment, both differences are small and, among employed sample members, the weekly hours worked and hourly wages are similar. It may be the case that this difference in employment rates at the end of the follow-up period can be attributed to the fact that some members of the program groups were still partici-pating in subsidized employment.
Table 5.6 (continued)
SOURCE: MDRC calculations based on responses to the 12-month survey.
NOTES: Results in this table are regression-adjusted, controlling for pre-random assignment characteristics.
aA score of 13 or higher on the Kessler-6 (K-6) scale is used here to define serious psychological distress. The K-6 assesses how often during the past month a respondent felt so sad that nothing could cheer him or her up; nervous; restless or fidgety; hopeless; that everything was an effort; or worthless. As a result of minor differences between the scale used to administer the K-6 in the 12-month survey and the standard K-6 scale, the percentages presented in this table may slightly underestimate the incidence of serious psychological distress in this sample.

73
Chapter 6
Summary, Conclusion, and Next Steps
This report provides preliminary findings from the Subsidized and Transitional Employment Demonstration (STED) evaluation in Los Angeles County. While the subsequent reports will discuss the impacts of the intervention after 30 months, these early findings provide important insights into the viability of subsidized employment as a welfare-to-work strategy for people receiving Temporary Assistance for Needy Families (TANF).
● The study demonstrates that subsidized employment can be implement-ed on a large scale with a TANF population.
The size and scope of the program demonstrate that it is feasible to implement a subsi-dized employment program for TANF populations in an extremely large county welfare program. Even though the program used a dispersed set of providers across a wide geographic region, a large number of participants in both groups had sustained work experiences the way the model intended. While variation existed in implementation, the overall placement rates were in line with those found in similar studies.
● There was substantial variation in the quality of implementation of sub-sidized employment placement.
While overall both approaches in the program were implemented well, there was sub-stantial variation among service providers in their subsidized employment placement rates and placement durations, which suggests that not all study participants received the same treatment. Some higher-performing Worksource Centers developed diverse subsidized job opportunities for participants and were successful in placing a high proportion of the participants with whom they worked. In comparison, the data suggest that some Worksource Centers did not make a priority of this program and devoted limited resources to it, resulting in much lower overall performance.1
1It is not possible to analyze experimentally which Worksource Centers were associated with which im-
pacts. Random assignment occurred at county welfare-to-work offices, whose staff members could then make subjective decisions in referring program group members to any Worksource Center with available Paid Work Experience (PWE) or On-the-Job Training (OJT) slots. Therefore, while it is possible to define control subgroups at the level of the welfare-to-work offices, it is not possible to create them at the level of the Worksource Centers for experimental analysis. A quasi-experimental analysis may be possible, and may be included in the final report.

74
● Wage-subsidy models with private-sector employers are difficult to im-plement for hard-to-employ populations.
The OJT model represents a viable approach to helping participants make the transition to unsubsidized employment. However, it is labor-intensive. It requires case managers to put in a lot of work to cultivate employers and identify potential job openings, and requires them to make creative efforts to match participants’ skills and experiences with employers’ needs. Not only is it difficult to place participants, even among those placed the program experienced high levels of attrition. The most successful Worksource Centers were the ones that were able to devote consistent staff time to the program.
Next Steps The STED evaluation in Los Angeles County is part of an effort to investigate the effects of subsidized-employment programs for TANF populations. As has been the case in many recent, similar tests, short-term employment and earnings impacts were observed during the study period. Those employment and earnings impacts diminished over time and PWE, OJT, and control group members had fairly similar employment situations at the end of the period covered in this report. More follow-up is required to determine whether in fact the employment impacts are restricted primarily to the subsidy period. The work experience PWE and OJT group members gained from their placements may have effects on employment that become apparent later on. However, control group members reported higher rates of participation in education and training, which may also affect their employment and earnings in the long term.
A second goal of the evaluation was to compare two approaches to subsidized employ-ment. The PWE approach achieved higher placement rates in subsidized jobs than the OJT approach, resulting in larger employment and earnings gains for the PWE group than the OJT group. While the employment and earnings of PWE and OJT participants followed similar trends by the end of the observation period, it is possible that their longer-term outcomes may diverge. The OJT model provided participants with an employment experience that more closely reflects the unsubsidized labor market; this experience could translate to more success-ful employment searches in the future. In addition, because the OJT placements could turn into permanent jobs, longer-term employment and earnings gains may emerge for OJT group members compared with PWE group members.
Finally, it is always relevant to examine the targeting of services in any employment program — what works for whom. While this question cannot be addressed in any definitive fashion in the analysis period used for this report, so far the majority of the employment impacts produced by both PWE and OJT were among sample members without recent work experience. While both approaches also produced employment gains for sample members who did have

75
recent work experience, these results suggest that subsidized employment programs are more effective for people who are more detached from the labor market. Additional follow-up will reveal whether these effects persist and shed light on the relative effectiveness of the PWE and OJT approaches for different population subgroups. In addition, the implementation analysis highlighted variation in implementation and in different service providers’ operational contexts that could affect long-term outcomes. The final report, expected in 2018, will present outcomes for all sample members 30 months after random assignment.

Appendix A
Impacts on Child Care Arrangements After One Year

77
OutcomePWE
GroupOJT
GroupControlGroup
PWE vs.Control
OJT vs.Control
PWE vs.OJT
Among the full sample
Lives with a child under the age of 13 (%) 83.0 84.1 83.9 -1.0 0.2 -1.1
Had a child in child care in the past montha (%) 28.9 28.2 28.2 0.7 -0.1 0.7
Paid for child care in the past month (%) 5.9 6.1 5.1 0.9 1.1 -0.2
Amount paid for child care in the past month ($) 15.2 13.4 11.3 3.9 2.1 1.8
Received subsidized child care in the past month (%) 13.6 13.8 14.0 -0.3 -0.2 -0.1
Had a child care arrangement with income-based feesin the past month (%) 5.3 6.3 4.5 0.8 1.8 -1.0
Quit or did not participate in a job, schooling, or trainingactivity because of problems arranging child care (%) 11.0 13.3 15.1 -4.1 ** -1.8 -2.4
Sample size 874 877 871
Among those living with a child under age 13b
Had a child in child care in the past montha (%) 34.9 33.5 33.7 1.1 -0.2 1.3
Among those with a child in child care, number of children in child care 1.4 1.4 1.5 -0.1 -0.1 0.1
Paid for child care in the past month (%) 7.2 7.3 6.1 1.0 1.1 -0.1
Amount paid for child care in the past month ($) 18.5 15.6 13.7 4.8 1.9 2.9
Received subsidized child care in the past month (%) 16.4 16.4 16.7 -0.3 -0.2 -0.1(continued)
Difference (Impact)
Appendix Table A.1
Impacts on Child Care Arrangements After One Year

78
OutcomePWE
GroupOJT
GroupControlGroup
PWE vs.Control
OJT vs.Control
PWE vs.OJT
Had a child care arrangement with income-based feesin the past month (%) 6.4 7.5 5.4 1.0 2.1 -1.1
Quit or did not participate in a job, schooling, or trainingactivity because of problems arranging child care (%) 13.2 15.8 18.0 -4.9 -2.3 -2.6
Sample size 700 694 698
Difference (Impact)Appendix Table A.1 (continued)
SOURCE: MDRC calculations based on responses to the 12-month survey.
NOTES: Results in this table are regression-adjusted, controlling for pre-random assignment characteristics. aIncludes children under age 13 only.bOutcomes in this panel are calculated among those living with a child under the age of 13 at the time of the survey; they are therefore considered
nonexperimental and are not tested for statistical significance.

Appendix B
Survey Response Analysis
80
As discussed in Chapter 1, three surveys were fielded to collect data for the Subsidized and Transitional Employment Demonstration (STED) evaluation in Los Angeles. This analysis examines the survey response for the first two surveys, one administered roughly four months after random assignment (the in-program survey) and the second administered roughly one year after random assignment (the 12-month survey).1 Each survey collected data from a sample of the research participants, so it is possible that the participants who responded to the survey are not representative of the impact sample of study participants, which could introduce bias into the estimates produced from the survey data.2 It is not unexpected that the survey sample may have different social or demographic characteristics than the impact sample of study partici-pants, as certain characteristics such as age, gender, and stability are associated with survey response rates generally (women are more likely to respond to surveys than men, for example). A problem arises, however, if there are differences between the types of program group mem-bers who responded to the survey and the types of control group members who responded to the survey. In that case, impact estimates based on the survey data may be biased.
Overall, the administration of both surveys went well. Both surveys achieved response rates of 80 percent and almost all interviews were completed on time.3 However, due to budget constraints the in-program survey was only administered to a subsample of all study partici-pants, and due to logistical constraints it was not administered to those randomly assigned at the beginning of the study. As a result, the number of respondents for the in-program survey (1,214) is smaller than the number of respondents for the 12-month survey (2,093). Despite this differ-ence, the response analysis for the two surveys indicates no evidence of response issues that might introduce bias into impact estimates. There are a few, small differences in the social and demographic characteristics of the survey respondents compared with nonrespondents for both surveys, which is to be expected, as mentioned above. However, the characteristics of the surveyed members of the three research groups — the control group, the Paid Work Experience (PWE) program group, and the On-the-Job Training (OJT) program group — are similar for both surveys. In addition, tests comparing the program’s impacts on survey sample members with the impacts estimated for the impact sample indicate no differences between those who participated in the survey and those who did not.
1The third survey, administered roughly 30 months after random assignment, is still being fielded. The
response analysis for this survey will be presented in a later report. 2The “impact sample” consists of all study participants who were randomly assigned, not including a
small number who later asked to be removed from the study. 3The response rate for the in-program survey was 81 percent and the response rate for the 12-month sur-
vey was 80 percent. The program groups and the control group all had similar response rates. “On time” for both surveys was defined as within one month, plus or minus, of the designated reference point for the survey, which was Month 4 after random assignment for the in-program survey and Month 12 after random assign-ment for the 12-month survey.

81
Response Differences Appendix Table B.1 compares the social and demographic characteristics of survey respondents and nonrespondents. There were statistically significant differences between respondents and nonrespondents to both the in-program and 12-month surveys for a few characteristics. For both surveys, respondents were more likely to be female, were more likely to have a disability, and had received Temporary Assistance for Needy Families (TANF) payments for more months in their lifetimes at the time of random assignment. Additionally, respondents to the in-program survey were older and had higher monthly incomes at random assignment than nonrespondents, while respondents to the 12-month survey were more likely to be black and less likely to be Hispanic than nonrespondents. Since comparing a series of characteristics makes it more likely that one will find a statistically significant difference by chance, the evaluation team conducted a global test of the relationship between these characteristics and survey response status (that is “respondent” or “nonrespondent”). This test is conducted by estimating a regression model predicting survey response status. The test statistic reported for each characteristic indicates whether the indicated characteristic has a statistically significant association with survey response status, controlling for the other characteristics, and the joint test indicates whether the characteristics collectively have a statistically significant association with survey response status. The results of these tests are shown in Appendix Table B.2; they provide further verifica-tion that survey respondents are different from nonrespondents for both surveys.
It is not uncommon to find some baseline characteristics that are associated with survey response status. These associations may indicate some level of nonresponse bias, but this bias would primarily affect outcome level estimates. Generally, survey respondents tend to be more stable than nonrespondents, so their outcome levels may be higher than those of nonrespondents to some degree. (For example, respondents may have higher employment rates than non-respondents.) The primary concern when it comes to estimating program impacts, however, is whether there are baseline differences between respondents in the program groups and respond-ents in the control group. The evaluation team therefore compared the social and demographic characteristics of survey respondents in the PWE program group, the OJT program group, and the control group. As shown in Appendix Table B.3, survey respondents in the three research groups were fairly similar. Appendix Table B.4 shows that the joint test did not find a statistical-ly significant association between the social and demographic characteristics of survey respond-ents and research group status. However the table does show a significant baseline difference for one characteristic: Survey respondents who were members of the PWE group were more likely to have received TANF payments for less than 12 months in their lifetimes at the time of random assignment than survey respondents who were OJT or control group members, control-ling for the other characteristics.

82
ImpactCharacteristic Respondents Nonrespondents Respondents Nonrespondents Sample
Age *18-24 years 26.7 23.3 25.2 23.6 24.925-34 years 42.1 42.8 42.2 43.6 42.535-44 years 19.6 23.2 21.1 23.2 21.545 or more years 11.6 10.6 11.5 9.6 11.1
Female (%) 86.9 84.3 * 87.1 79.1 *** 85.5
Race/ethnicity (%) ***Hispanic, Latino, or Spanish 53.8 55.5 53.7 58.7 54.7White, non-Hispanic 6.4 6.5 6.0 8.2 6.4Black, non-Hispanic 32.9 30.5 33.1 25.7 31.6Other, non-Hispanic 7.0 7.4 7.2 7.4 7.2
Ever employed (%) 94.1 93.8 93.6 95.3 93.9
Ever worked for the same employer more than 6 months (%) 52.9 50.6 52.2 49.8 51.7
Number of minor children (%)One 52.1 53.7 52.7 54.0 53.0Two 27.3 27.8 27.3 28.9 27.6Three 13.9 12.8 13.5 12.6 13.3Four or more 6.6 5.7 6.5 4.5 6.1
Educational attainment (%)No degree 40.4 37.9 39.8 36.0 39.0High school diploma or equivalent 34.3 33.9 33.2 37.5 34.1Some college 20.5 23.4 22.1 21.7 22.1Bachelor's degree 4.8 4.8 4.8 4.7 4.8
Has a disability (%) 2.2 1.1 ** 1.9 0.6 ** 1.6
Total time on TANF in the past (%) *** *Less than 12 months 28.4 34.6 30.8 35.5 31.712 to 23 months 24.1 22.7 23.1 24.3 23.424 to 35 months 23.7 19.5 22.0 19.4 21.536 months or more 23.7 23.2 24.1 20.8 23.4
Monthly income (%) ***None ($0) 0.7 1.6 1.2 0.9 1.2$1 to $500 33.5 32.7 33.4 31.8 33.1$501 to $1,000 52.3 44.3 48.1 47.6 48.0$1,001 to $2,500 12.6 18.6 15.3 17.8 15.8More than $2,500 0.8 2.8 1.9 1.9 1.9
Sample size 1,214 1,409 2,093 530 2,623(continued)
In-Program Survey 12-Month Survey
Appendix Table B.1
Selected Baseline Characteristics of Survey Respondents and Nonrespondents, by Survey

83
Appendix Table B.1 (continued)SOURCE: MDRC calculations using baseline data collected on the Los Angeles Department of Public Social Services' Greater Avenues for Independence Employment Activity and Reporting System.
NOTE: Statistical significance levels are indicated as: ***=1 percent; ** = 5 percent; * = 10 percent.
CharacteristicAge 6.477 * 4.867
Race/ethnicity 0.801 11.976 **
Female 2.579 21.310 ***
Ever employed 0.489 1.869
Ever worked for the same employer more than 6 months 0.123 0.844
Number of minor children 5.152 4.010
Educational attainment 2.122 3.185
Has a disability 4.887 * 4.809 *
Total time on TANF in the past (%) 8.308 ** 1.760
Monthly income 33.553 *** 0.874
Overall test 68.356 *** 56.624 ***Sample size 2,623 2,623
Appendix Table B.2
Joint Test of Differences Between Survey Respondents and Nonrespondents,by Survey
In-Program Survey 12-Month Survey
SOURCES: MDRC calculations using baseline data collected on the Los Angeles Department of Public Social Services' Greater Avenues for Independence Employment Activity and Reporting System.
NOTES: Statistical significance levels are indicated as: ***=1 percent; ** = 5 percent; * = 10 percent. The joint test of differences between survey respondents and nonrespondents was conducted by estimating a regression model of survey response status probability for each survey. For each characteristic, the joint test indicates whether there is an association between the characteristic and survey response status, controlling for the other characteristics. The overall test indicates whether there is an association between survey response status and the other characteristics collectively.

84
CharacteristicPWE
Group OJT GroupControl Group
PWE Group OJT Group
Control Group
Age18-24 years 26.6 28.2 25.3 24.0 26.2 25.525-34 years 41.7 39.1 45.5 41.1 40.3 45.135-44 years 18.0 22.5 18.3 22.3 22.0 19.145 or more years 13.7 10.1 11.0 12.6 11.5 10.3
Female (%) 86.1 86.1 88.5 85.7 87.9 87.8
Race/ethnicity (%)Hispanic, Latino, or Spanish 52.8 53.6 54.9 53.9 53.7 53.5White, non-Hispanic 7.1 6.0 6.0 5.8 6.1 6.2Black, non-Hispanic 32.2 34.5 32.0 32.9 33.3 33.2Other, non-Hispanic 7.9 6.0 7.1 7.5 6.9 7.1
Ever employed (%) 94.1 92.8 95.3 93.8 92.5 94.4
Ever worked for the same employer more than 6 months (%) 53.1 57.3 48.4 ** 53.4 53.8 49.3
Number of minor children (%)One 54.4 53.0 49.0 53.1 54.1 51.0Two 25.6 28.2 28.3 25.9 28.1 27.9Three 13.9 11.6 16.3 14.0 12.4 14.0Four or more 6.1 7.2 6.5 7.0 5.5 7.0
Educational attainment (%)No degree 40.1 43.8 37.3 38.2 42.3 38.9High school diploma or equivalent 33.7 33.7 35.5 32.5 32.5 34.7Some college 19.8 19.6 22.3 23.9 21.0 21.5Bachelor's degree 6.4 3.0 5.0 5.4 4.2 4.9
Has a disability (%) 2.2 1.7 2.8 1.7 1.9 2.2
Total time on TANF in the past (%)Less than 12 months 32.2 27.7 25.3 32.6 31.4 28.412 to 23 months 21.0 26.2 25.3 22.0 23.3 24.124 to 35 months 24.1 24.3 22.8 23.0 21.6 21.336 months or more 22.7 21.8 26.8 22.4 23.7 26.2
Monthly income (%)None ($0) 0.7 1.0 0.5 1.0 1.9 0.9$1 to $500 35.9 33.5 31.2 35.4 33.7 31.1$501 to $1,000 50.0 53.3 53.5 46.9 48.2 49.2$1,001 to $2,500 12.4 11.2 14.3 14.6 14.3 17.1More than $2,500 1.0 1.0 0.5 2.1 1.9 1.7
Sample size 410 404 400 700 695 698(continued)
Appendix Table B.3
Selected Baseline Characteristics of Survey Respondents, by Research Group and Survey
In-Program Survey 12-Month Survey

85
Appendix Table B.3 (continued)
SOURCE: MDRC calculations using baseline data collected on the Los Angeles Department of Public Social Services' Greater Avenues for Independence Employment Activity and Reporting System.
NOTE: Statistical significance levels are indicated as: ***=1 percent; ** = 5 percent; * = 10 percent.
CharacteristicAge 1.472 3.255
Race/ethnicity 5.991 2.577
Female 0.392 0.426
Ever employed 0.760 0.951
Ever worked for the same employer more than 6 months 2.244 2.901
Number of minor children 1.715 0.727
Educational attainment 2.225 1.529
Has a disability 0.253 0.395
Total time on TANF in the past (%) 6.252 * 4.521
Monthly income 4.475 4.604
Overall test 26.476 22.291Sample size 1,214 2,093
Appendix Table B.4
Joint Test of Differences Between Research Groups Among Survey Respondents, by Survey
In-Program Survey 12-Month Survey
SOURCE: MDRC calculations using baseline data collected on the Los Angeles Department of Public Social Services' Greater Avenues for Independence Employment Activity and Reporting System.
NOTES: Statistical significance levels are indicated as: ***=1 percent; ** = 5 percent; * = 10 percent. The joint test of differences between research group members among survey respondents was conducted by estimating a regression model of research group membership for each survey. For each characteristic, the joint test indicates whether there is an association between the characteristic and research group membership, controlling for the other characteristics. The overall test indicates whether there is an association between research group membership and the other characteristics collectively.

86
Outcome Differences Another way to assess possible bias arising from survey response rates is to examine differences between the impact sample and the survey respondents in impacts estimated using administra-tive data. If the differences between the program and control groups in the survey respondent sample are not similar to those observed for the full impact sample, it would indicate that the respondent sample is not representative and so impact estimates based on the survey may be biased. As was the case with the comparisons of social and demographic characteristics, testing multiple outcomes makes it more likely that one will find a statistically significant difference by chance, so a joint test is required. This test is conducted using multivariate analysis of variance (MANOVA), which tests for differences in multiple dependent variables (outcomes) simultane-ously. Appendix Table B.5 shows the results of a joint test of differences between respondents to both surveys and the impact sample for impacts estimated based on earnings and employ-ment data from the unemployment insurance system and on TANF administrative data. All of the test statistics are fairly small and only one is statistically significant, which indicates that the impacts on the impact sample are not different from the impacts on the survey respondents.4
A second method to assess whether impact estimates are biased due to survey nonre-sponse is multiple imputation. This method uses statistical modeling to predict the responses for sample members who did not participate in the survey. Multiple predictions are generated to simulate the distribution of responses from which impact sample estimates are generated. In other words, this analysis provides an estimate of the impacts derived from survey data if all members of the impact sample had participated in the survey. Appendix Table B.6 shows the estimated regression coefficients for the program effects for the survey respondents and for the impact sample estimated using multiple imputation.5 The estimates are virtually the same for both outcomes for both program groups, in both size and statistical significance, providing further evidence that there is no significant difference in program impacts between survey respondents and nonrespondents.
4The one test that appears to be statistically significant is the Roy’s Greatest Root test on employment and
earnings outcomes. However, Roy’s Greatest Root is considered an upper-bound test, and when viewed in conjunction with the other three, more conservative tests performed on the employment and earnings outcomes which show no statistical significance, common practice is to ignore the Roy’s Greatest Root test and view the overall finding as statistically insignificant.
5Estimated coefficients are analogous to program impacts as reported in the text.

87
Summary The survey response analyses for the in-program and 12-month surveys indicate that the respondent samples are fairly representative of the impact sample, particularly when it comes to comparisons between research groups. While overall the respondent sample does not precisely represent the impact sample — meaning that outcome estimates may overstate the impact sample’s true outcome levels — few differences were found between program group respond-ents and control group respondents, meaning that any program impact estimates are unlikely to be affected by survey nonresponse.
Name of Test Test Statistic Prob(F) Test Statistic Prob(F)
Employment and earnings
Wilks' Lambda 0.991 0.543 0.988 0.156
Pillai's Trace 0.009 0.543 0.012 0.155
Hotelling-Lawley Trace 0.009 0.543 0.012 0.156
Roy's Greatest Root 0.006 0.270 0.008 0.067
TANF receipt
Wilks' Lambda 0.994 0.677 0.995 0.835
Pillai's Trace 0.006 0.677 0.005 0.835
Hotelling-Lawley Trace 0.007 0.678 0.005 0.836
Roy's Greatest Root 0.004 0.507 0.003 0.623
Sample size 1,214 2,093
12-Month SurveyIn-Program Survey
Joint Test of Impact Differences Between Survey Respondents and Nonrespondents, by Survey
Appendix Table B.5
SOURCES: MDRC calculations using quarterly wage data from the National Directory of New Hires, Los Angeles Department of Public Services TANF administrative data, and baseline data collected on its Greater Avenues for Independence Employment Activity and Reporting System.
NOTE: The joint test of impact differences between survey respondents and nonrespondents was conducted using multivariate analysis of variance (MANOVA) on the impacts on (1) employment and earnings outcomes and (2) TANF outcomes for all three study groups simultaneously. Each test statistic uses the F distribution; the probability result refers to the null hypothesis of the MANOVA, which is that the impacts differ between survey respondents and nonrespondents.

88
Ever employed in Year 1 (%)Survey sample 23.1 *** 14.7 ***Full sample (imputed) 23.4 *** 14.8 ***
Currently employed(%)Survey sample 4.0 5.1 **Full sample (imputed) 3.7 4.8 *
Sample size 1,214 2,093
Appendix Table B.6
Estimated Regression Coefficients for Program Impactsfor Survey and Full (Imputed) Sample
PWE Group OJT Group
SOURCES: MDRC calculations using Los Angeles Department of Public Services TANF administrative data and baseline data collected on its Greater Avenues for Independence Employment Activity and Reporting System.
NOTES: Statistical significance levels are indicated as: ***=1 percent; ** = 5 percent; * = 10 percent. The program impacts here are estimated as the differences in the mean program and control group member computed from the full set of regression coefficients included in the impact model. Survey-sample-estimated program impacts vary slightly from those reported in the main text due to minor differences in model specification.

89
References
Auspos, Patricia, George Cave, and David Long. 1988. Maine: The Demonstration of State Work/Welfare Initiatives, Final Report on the Training Opportunities in the Private Sector Program. New York: MDRC.
Bloom, Dan. 2010. Transitional Jobs: Background, Program Models, and Evaluation Evidence. Washington, DC: Office of Planning, Research and Evaluation, Administration for Children and Families, U.S. Department of Health and Human Services.
Bloom, Dan. 2015. Testing the Next Generation of Subsidized Employment Programs: An Introduction to the Subsidized and Transitional Employment Demonstration and the Enhanced Transitional Jobs Demonstration. OPRE Report 2015-58. Washington, DC: Office of Planning, Research and Evaluation, Administration for Children and Families, U.S. Department of Health and Human Services.
Bloom, Dan, Sarah Rich, Cindy Redcross, Erin Jacobs, Jennifer Yahner, and Nancy Pindus. 2009. Alternative Welfare-to-Work Strategies for the Hard-to-Employ: Testing Transitional Jobs and Pre-Employment Services in Philadelphia. New York: MDRC.
Bureau of Labor Statistics. 2016a. “Databases, Tables & Calculators by Subject.” Website: http://data.bls.gov/timeseries/LNS14000000.
Bureau of Labor Statistics. 2016b. “Local Area Unemployment Statistics Map.” Website: http://data.bls.gov/map/MapToolServlet?survey=la&map=county&seasonal=u.
California Department of Social Services. “WTW 25 - CalWORKs Welfare-To-Work Monthly Activity Report - All (Other) Families.” Website: www.cdss.ca.gov/research/PG291.htm. Accessed on May 17, 2016a.
California Department of Social Services. “WTW 25 - CalWORKs Welfare-To-Work Monthly Activity Report - Two-Parent Families.” Website: www.cdss.ca.gov/research/PG292.htm. Accessed on May 17, 2016b.
Center on Budget and Policy Priorities. 2014. “California: TANF Caseload and TANF-to-Poverty Ratio Fact Sheet.” Washington, DC: Center on Budget and Policy Priorities.
Farrell, Mary, Sam Elkin, Joseph Broadus, and Dan Bloom. 2011. Subsidizing Employment Opportunities for Low-Income Families: A Review of State Employment Programs Created Through the TANF Emergency Fund. Washington, DC: Office of Planning, Research and Evaluation, Administration for Children and Families, U.S. Department of Health and Human Services.
Floyd, Ife, and Liz Schott. 2013. TANF Cash Benefits Continued to Lose Value in 2013. Washington, DC: Center on Budget and Policy Priorities.
Freedman, Stephen, Jan Bryant, George Cave, and Michael R. Bangser. 1988. New Jersey: Final Report on the Grant Diversion Project. New York: MDRC.

90
Los Angeles County. “County of Los Angeles.” Website: www.lacounty.gov/government/ about-la-county. Accessed on May 24, 2016.
Orr, Larry L., Howard S. Bloom, Stephen H. Bell, Fred Doolittle, Winston Lin, and George Cave. 1996. Does Training for the Disadvantaged Work? Evidence from the National JTPA Study. Washington, DC: The Urban Insitute.
Pavetti, LaDonna, Liz Schott, and Elizabeth Lower-Basch. 2011. Creating Subsidized Employment Opportunities for Low-Income Parents: The Legacy of the TANF Emergency Fund. Washington, DC: Center on Budget and Policy Priorities and the Center for Law and Social Policy.
Redcross, Cindy, Bret Barden, Dan Bloom, Joseph Broadus, Jennifer Thompson, Sonya Williams, Sam Elkin, Randall Juras, Janaé Bonsu, Ada Tso, Barbara Fink, Whitney Engstrom, Johanna Walter, Gary Reynolds, Mary Farrell, Karen Gardiner, Arielle Sherman, Melanie Skemer, Yana Kusayeva, and Sara Muller-Ravett. Forthcoming. The Enhanced Transitional Jobs Demonstration: Implementation and Early Impacts of the Next Generation of Subsidized Employment Programs. Washington, DC: U.S. Department of Labor, Employment and Training Administration.
Roder, Anne, and Mark Elliott. 2013. Stimulating Opportunity: An Evaluation of ARRA-Funded Subsidized Employment Programs. New York: Economic Mobility Corporation.
U.S. Department of Health and Human Services. 2014. “TANF: Total Number of Recipients.” Washington, DC: U.S. Department of Health and Human Services. Website: www.acf.hhs.gov/sites/default/files/ofa/2013_recipient_tan.pdf.