tests of the hepd device at the sparc-lab facility
TRANSCRIPT

Laboratori Nazionali di Frascati
ISTITUTO NAZIONALE DI FISICA NUCLEARE
INFN-15-03/LNF 3rd April 2015
Tests of the HEPD device at the SPARC-LAB facility
Riccardo Pompili1, Enrica Chiadroni1, Cinzia De Donato2, Massimo Ferrario1, Giuseppe
Masciantonio2, Bruno Spataro1
1)INFN-Laboratori Nazionali di Frascati Via E. Fermi 40, Frascati, Italy
2)University of Rome Tor Vergata, Physics Departme
Abstract
We reported here simulation studies performed with the GPT code on the beam dynamics of the SPARCLAB photoinjector. These studies are finalized to test an High Energy Particle Detector (HEPD) having the aim to identify the type of particle (proton, electron, ion) and the direction in order to be able to establish the angle between the trajectory of the particle and the Earth's magnetic field (pitch angle). The measurement of the incident particle direction is essential to understand the spatial correlation between the earthquake and detection sites. Good angular resolution is expected to play a key role for the understanding of the physics responsible for the phenomena. The data reported in this note foresees the use of the high brightness electron beam produced at SPARCLAB with energies in the range between 5 and 100 MeV.
Pubblicato da SIDS–Pubblicazioni Laboratori Nazionali di Frascati PACS.: 29.20.Ej, 29.27.Bd, 29.40.-n

Tests of the HEPD device at the SPARC-LAB facility
1 Instrument OverviewThe High Energy Particle Detector (HEPD) is designed to provide good energy and angular resolutions
for electrons in the energy range 3 to 100 MeV and for protons in the energy range 30 to 200 MeV. The
required energy and angular resolutions for 5 MeV electrons are less than 10% and less than 8°,
respectively. The detector consists of two layers of plastic scintillators for trigger (one thin segmented
counter S1 and one deep counter S2) and a calorimeter; the calorimeter volume is surrounded by 5 mm
thick plastic scintillator veto planes. The direction of the incident particle is provided by two planes of
double-side silicon microstrip detectors, placed at the top of the detector.
The basic detector design is shown in Fig. 1.
The Silicon Detector consists of 2 silicon tracker planes (~21x21 cm2) at distance Z=1 cm; each plane
consists of 3 ladder, each one composed by 2 Si modules and read out by 6 + 6 VA (Viking Access)
integrated in one hybrid circuit. Modules have 192 micron read-out (p and n) for a resultant resolution
of 40-50 micron and are AC coupled. The VA is a CMOS ASIC with 64 channels, including charge
sensitive preamplifier-shaper circuits, with simultaneous sample and hold, multiplexed analog readout,
1/23
Fig. 1: HEPD design.

calibration facilities and internally generated biases. The calorimeter (Energy detector) consists of a
tower of 15 layers of plastic scintillator planes (15 × 15 × 1 cm3) followed by a 3 × 3 matrix of an
inorganic scintillator LYSO (for a resulting plane of dimension 15 × 15 × 4 cm3 ) on the bottom of the
tower. Each plastic scintillator plane is read out by 2 Photo Multiplier Tubes (PMTs) located on
opposite corners while each LYSO crystal is read out by 1 PMT located on the bottom face. The
Trigger detector comprises 2 plastic scintillator planes located at the top of calorimeter tower and read
out by PMTs, one thin counter S1 of dimensions 20x18x0.5 cm3 segmented along the y direction in 6
counters (each one read out by 2 PMTs) and one deep counter S2 located on the top of the scintillator
tower (same dimension, characteristic and read out of the calorimeter planes). The Veto Detector
consists of 5 plastic scintillator planes (four lateral and one at the bottom of the instrument), each one
read out by 2 PMTs located on opposite corners. The volume defined by the Veto detector is around
20x17x33 cm3. Each plastic scintillator counter and LYSO crystal is covered with diffusing coating to
optimize the light collection. PMT signals are read out by chip EASIROC which provides multiplexed
outputs for charge measurements (through two analog outputs with different gains) and 32 trigger
outputs through integrated comparators with a settable threshold.
1.1 Electrical Architecture
The HEPD electronics can be divided basically into 4 blocks (see Fig. 8): the power supply subsystem,
the Silicon detector block, the Scintillator detectors (Trigger, Energy and Veto detectors) block and the
Global HEPD Control & Data Managing.
The power supply subsystem includes the low voltage power supply, which delivers (from satellite
29.5V) all the low voltage levels to the detector electronics, and the high voltage power supply that
provides the necessary bias voltages for PMTs (up to 1000 V) and Silicon modules (up to 300 V).
Both power subsystems include a proper redundancy and protection against the possible failures both
into the power modules and into the load.
Each detector block includes a power chain for bias distribution and a data acquisition (DAQ)
processing chain; the power chain distributes the voltages provided by the power supply subsystem to
the detector electronics, PMTs and Silicon modules; the detector DAQ processing chain includes
preamplifiers (VA or EASIROC), Analog-Digital Converter (ADC), Control & Config FPGA (Field
2/23

Programmable Gate Array), Digital Signal Processing (DSP) and Dual Port RAM (DP-RAM). The
preamplified signals coming from the EASIROC (PMT) or VA(Silicon sensors) are digitalized by ADC
and sent to the Control & Config FPGA. This FPGA is responsible of configuring the detector and of
managing data acquisition. During the startup phase (or any system reset), the main task of the Control
& Config FPGA is to configure the instrument; in this phase it will set the parameters and the bias of
the Front-end of the detector. Moreover, during operative phase, when a trigger signal occurs, the
Control & Config FPGA sends the start of acquisition to each ADC. The ADC data output are stored in
DP-RAM. Afterwards, these data will be read and processed by a dedicated low power DSP with
functions of calibration, calculation and subtraction of the pedestal and data reduction (for the Silicon
Detector). The results will be written on the second DP-RAM waiting to be picked up by the Global
HEPD Control & Data Management. Depending on the decision of the trigger subsystem, these data
will be sent to the main DAQ and formatted in “event data” or deleted. The data acquisition processing
scheme is shown in Fig. 2. The Global HEPD Control & Data Managing is divided in 3 subsystems, the
Housekeeping & Microcontroller, the Trigger subsystem and the Main DAQ. The House-keeping &
Microcontroller is responsible of the reconfiguration of the detector and of temperature, timing and
acquisition system control. The main functions of the Trigger subsystem are to reject or select data by
means of different trigger levels, to enable acquisition and data processing, to estimate dead/live time
and to provide the detector and events counters. The trigger subsystem consists of different levels that
can be implemented at EASIROC level and on a FPGA. Differently from the Silicon detector, the
Trigger, Veto and Energy detectors communicate directly with the trigger box before data processing.
The comparators integrated into the EASIROC chips enable easy solution for a complex fast level
trigger and help the upper level triggers. The fast trigger signals are provided by the the EASIROC
digital trigger outputs of the Trigger Detector and sent to the FPGA where upper level triggers are
generated. The 1st level trigger is generated combining the fast trigger with the digital trigger output of
the EASIROC chips of the Energy detector by means of masks. The 1st level trigger is sent to the
Control & Config FPGA of each detector DAQ processing chain to start the signal ADC acquisition
and processing.
3/23
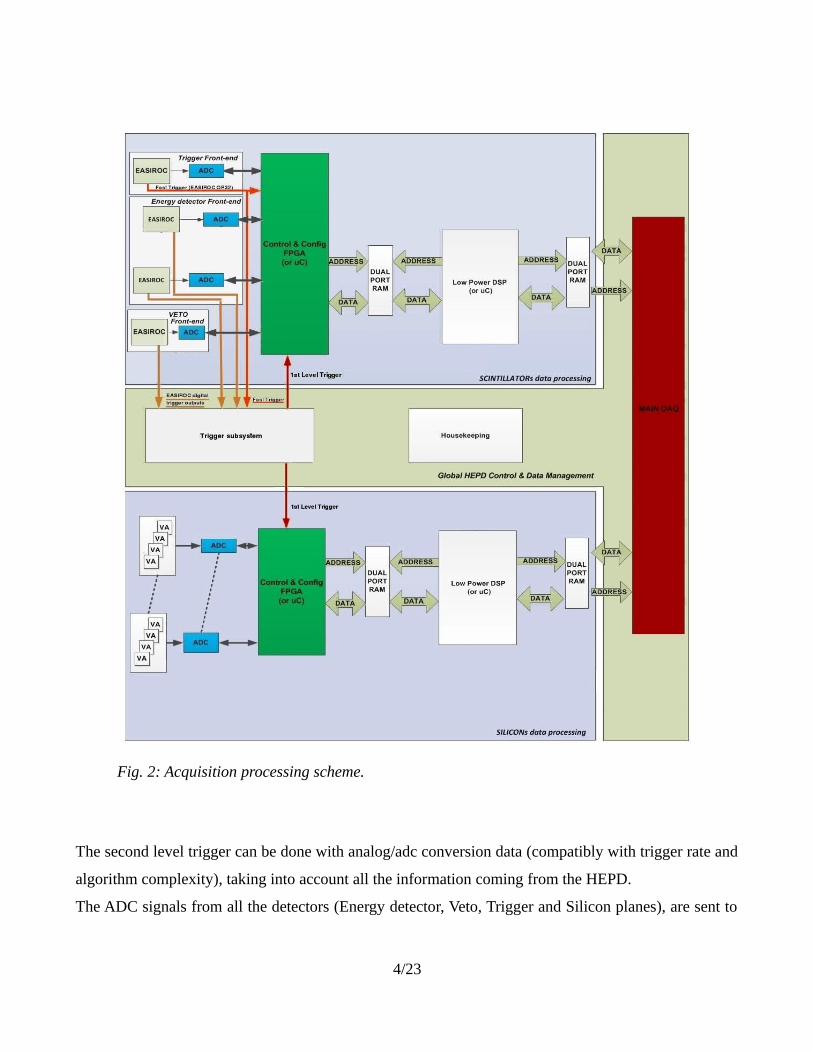
The second level trigger can be done with analog/adc conversion data (compatibly with trigger rate and
algorithm complexity), taking into account all the information coming from the HEPD.
The ADC signals from all the detectors (Energy detector, Veto, Trigger and Silicon planes), are sent to
4/23
Fig. 2: Acquisition processing scheme.

the trigger box where charge/energy informations are combined and selected by means of trigger
masks. Depending of the decision of the trigger box (2nd level), these data will be deleted or sent to the
main DAQ. Here data coming from all the detectors has to be formatted in “event data” before being
sent to satellite CPU. Local timing information from detectors and satellite absolute time, as well as
satellite position and attitude, have to be included in the event data.
1.2 Tests
In first instance, the proposed tests will allow to check the functionality of the whole detector,
including characterization of the electronic noise, dynamic range, maximum data throughput of the
detector and stability of the power supply at maximum load condition. Moreover the proposed tests
have the aim to fully characterize and verify the detection performances of the HEPD for electrons and
to study and optimize different trigger strategies. The HEPD must be tested with electrons beams of
different energies (at least in the energy range 3 to 100 MeV) and incoming directions to measure the
energy and angular resolution and verify the minimum requirements (Energy resolution < 10% and
angular resolution<8° for 5 MeV electrons). The measurements to perform at different energies and
incident directions are:
the total energy loss recorded in the silicon detectors, in the scintillator planes S1 and S2 and in
the calorimeter and the reconstructed energy and resolution;
the reconstructed direction and angular resolution.
From the energy and angular measurements, we will be able to compute, for electrons, the effective
detection efficiency and the acceptance as a function of energy. These measurements will be compared
with the detector performances evaluated with Geant3 and Geant4 simulations, together with similar
tests that will be performed on proton beams in another facility. The measurement of the incident
particle direction is essential to understand the spatial correlation between the earthquake and detection
sites. Good angular resolution is expected to play a key role for the understanding of the physics
responsible for the phenomena. Given the impossibility to control the direction of the field-of-view of
the detector on the satellite, a wide angular acceptance is expected to increase the probability to
observe the desired phenomena during an orbit of the satellite. Nevertheless the expected flux rate
varies along the orbit and during an Earthquake “particle burst” by more than 1 order of magnitude,
requiring in some cases data decimation due to the HEPD limit for data transmission link to ground.
5/23

Consequently different trigger event selections and their relative acceptance have to be investigated.
To this aim, the energy and angular measurements on electron beams will be based on a not restrictive
event selection, requiring:
track information in the two planes of the silicon tracker;
a signal in the scintillators S1 and S2.
The information from the Veto and Energy detector will by analyzed offline in order to evaluate the
impact of more restrictive trigger requirements (VETO rejection, energy cut in the energy released in
the calorimeter, etc) on the detector performances. In the same way, it will be evaluated the effects of
an event selection imposing a triggering signal from the central region of both trigger and silicon
detector in order to limit the detector acceptance in high flux cases.
This analysis will allow to define and optimize different trigger strategies/masks that will be applied
on-orbit according to the flux rate expected in different orbital zones or in case of particle bursts due to
earthquakes.
2 The proposed activity
One of the goal of the Memorandum of understanding between China Earthquake Administration
(CEA) and Agenzia Spaziale Italiana (ASI) foresees the realization and test of the High Energy Particle
Detector (HEPD) device. The particle detector has the aim to identify the type of particle (proton,
electron, ion) and its direction in order to be able to establish the angle between the trajectory of the
particle and the Earth's magnetic field (pitch angle). The purpose is to correlate the particles measured
with the Van Allen belts and determine the magneto-spheric region of origin, with the goal of obtaining
the energy spectrum and the composition of the particle bands of stability that fall suddenly into the
atmosphere ("particle burst"). In order to achieve the best results it is necessary to obtain the maximum
geometrical acceptance at the same weight and power. In particular, the device specifications regarding
electrons as the hitting particles foresee an energy range between 3 MeV and 100 MeV, with a
maximum operating frequency of 1 kHz. In the following paragraphs, it is proposed to realize the
HEPD tests at the SPARC-LAB facility, in the framework of Laboratori Nazionali di Frascati (LNF).
6/23
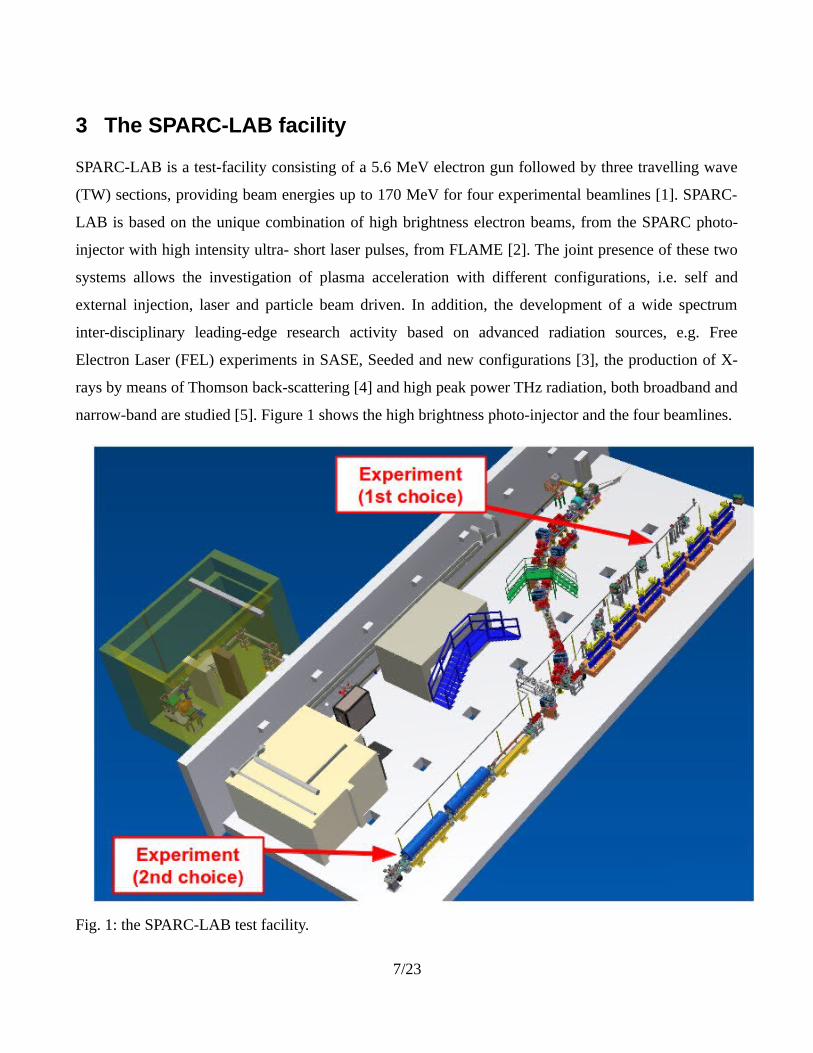
3 The SPARC-LAB facility
SPARC-LAB is a test-facility consisting of a 5.6 MeV electron gun followed by three travelling wave
(TW) sections, providing beam energies up to 170 MeV for four experimental beamlines [1]. SPARC-
LAB is based on the unique combination of high brightness electron beams, from the SPARC photo-
injector with high intensity ultra- short laser pulses, from FLAME [2]. The joint presence of these two
systems allows the investigation of plasma acceleration with different configurations, i.e. self and
external injection, laser and particle beam driven. In addition, the development of a wide spectrum
inter-disciplinary leading-edge research activity based on advanced radiation sources, e.g. Free
Electron Laser (FEL) experiments in SASE, Seeded and new configurations [3], the production of X-
rays by means of Thomson back-scattering [4] and high peak power THz radiation, both broadband and
narrow-band are studied [5]. Figure 1 shows the high brightness photo-injector and the four beamlines.
Fig. 1: the SPARC-LAB test facility.
7/23
3.1 SPARC-LAB photo-injector
The SPARC-LAB photo-injector is composed by a 1.6 cell BNL/UCLA/SLAC type gun operating at S-
band (2.856 GHz) with high peak field (120 MV/m) on the incorporated metallic photo-cathode (Cu),
generating electron beams with energies up to 5.6 MeV. The repetition rate of the generated electron
beams is 10 Hz. Actually the gun is then followed by three S-band travelling wave (TW) sections (3 m
long) whose accelerating gradients (20 MV/m for the first two sections and 15 MV/m for the third one)
boost the beam energy up to 170 MeV. The first section is also used as RF compressor (velocity
bunching regime) by varying the beam injection phase [6]. Solenoid coils embedding the first two
sections can be powered to provide additional magnetic focusing to better control the beam envelope
and the emittance oscillations under RF compression. A diagnostics transfer line allows to fully
characterize the accelerated beam by measuring transverse emittance, longitudinal profile, and slice
emittance [7] through a Radio-Frequency Deflector (RFD) [8]. At the beginning of 2015, the third S-
band accelerating section will be replaced by a 1.4 m long C-band one, operating at a doubled
frequency (5.712 GHz) with 35 MV/m accelerating gradient.
4 Realization of the experiment and goals of the proposal
In this section several possible configurations of the experiment are proposed. The goal is to provide a
fully characterized electron beam (charge, energy, energy spread, emittance, bunch length) exiting from
the SPARC-LAB linac with the following parameters:
• Charge: from 25 pC up to 100 pC.
• Energy: from 3 MeV up to 170 MeV.
As reported in fig. 1 we identify two possible configurations, corresponding to two physical locations
where the experiment can be performed. The first one is located on the second beamline where, after a
dogleg section, there are about 5 m of free space usable for the experimental vacuum chamber
providing the samples to be tested and all the related instrumentation needed to perform the
experiment. This solution is the most affordable because it allows to vary the energy from 5 MeV up to
170 MeV, it does not interfere with the other SPARC-LAB activities and does not require mechanical
installation along the main linac. In this case the beam energy can span a range between about 5 MeV
8/23

(energy at the exit of the gun while taking off the three accelerating sections) and 170 MeV (energy
with accelerating sections turned on). On the other hand, it requires the delivering of the beam up to the
second beamline, that can be prohibitive at low energies (of the order of 5 MeV). A second solution
foresees the installation of the experiment at the exit of the photo-injector gun, where the energy of the
beam can be gradually scaled starting from 2-3 MeV up to about 6 MeV (maximum energy at the exit
of the gun). Nevertheless the space available for installations is limited to about 20 cm, corresponding
to a free drift between the electron gun and the first accelerating section. Moreover, it requires a
physical installation of the experimental chamber on the main linac. In order to provide well defined
electron beam specifications (charge, energy, energy spread, emittance, pulse duration), in the next
paragraphs several numerical simulations are presented for both the configuration described before.
5 Simulations with the General Particle Tracer (GPT) code
The simulations of the electron beam from its production and transport along the SPARC-LAB
accelerator is obtained by using the General Particle Tracer (GPT) code [9], which includes space-
charge calculations. The General Particle Tracer (GPT) code is a completely 3D code and includes
various space-charge models, ranging from 1D interaction to fully 3D point-to-point calculations and
allowing to investigate the non-linear effects of charged particles dynamics in electromagnetic fields by
using an embedded fifth order Runge-Kutta driver with adaptive step-size control that ensures accuracy
while keeping the computation time to a minimum. Almost all standard accelerator components are
represented in GPT by specific sub-routines. The next paragraphs will propose several possible beam
configurations at different energies for both experimental solutions described above. Each simulation is
then summarized by evaluating the following key parameters:
• charge
• energy
• energy spread
• transverse emittance
• pulse duration
Paragraphs 4.1 and 4.2 describe simulations taking into account a possible experimental installation
9/23
along the second beamline. In this case both the 5 MeV and 100 MeV solutions are exploited. Instead,
in par. 4.3, a possible installation at the exit of the photo-injector gun is studied. In this case the
maximum energy is limited to about 5 MeV.
5.1 Production of a 5 MeV beam and transport up to the 2nd beamline
(experimental solution nr. 1)
This section describes the generation and transport of a 5 MeV beam from the photo-cathode up to the
second beamline, where the experiment could be arranged. The simulation starts with 2000 macro-
particles simulating a total charge of 25 pC. The laser hitting the photo-cathode has a duration of 60 fs
(rms). In order to be able to transport the beam, the solenoids embedding the gun and the first two TW
sections are properly set to achieve the lowest possible emittance and a low divergence at the end of the
linac. More details are given in next paragraph.
5.1.1 Evolution along the Linac
Figure 2 shows the Longitudinal Phase Space (LPS) of the 25 pC beam at the end of the linac. The x-
axis reports the temporal information while the y-axis shows the kinetic energy of all the macro-
particles. This beam has been obtained by turning off the 2 S-band and the last C-band TW sections, i.e.
only the gun contributes to accelerating the beam. By considering a peak accelerating electric field of
120 MV/m, the mean energy at the gun exit is 5.07 MeV with an energy spread of 0.07 MeV.
10/23
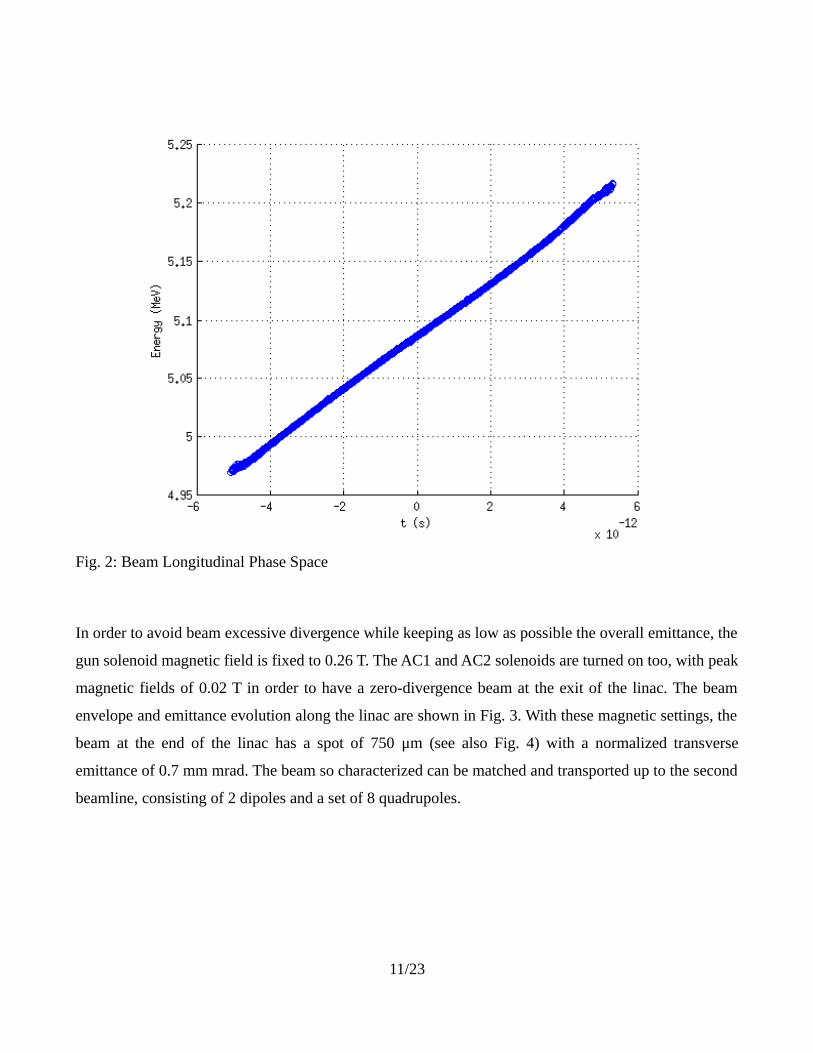
Fig. 2: Beam Longitudinal Phase Space
In order to avoid beam excessive divergence while keeping as low as possible the overall emittance, the
gun solenoid magnetic field is fixed to 0.26 T. The AC1 and AC2 solenoids are turned on too, with peak
magnetic fields of 0.02 T in order to have a zero-divergence beam at the exit of the linac. The beam
envelope and emittance evolution along the linac are shown in Fig. 3. With these magnetic settings, the
beam at the end of the linac has a spot of 750 μm (see also Fig. 4) with a normalized transverse
emittance of 0.7 mm mrad. The beam so characterized can be matched and transported up to the second
beamline, consisting of 2 dipoles and a set of 8 quadrupoles.
11/23

Fig. 3: Emittance and envelope evolution along the linac.
Fig. 4: Transverse view of the beam at the end of the linac.
12/23

The final beam parameters are summarized in the table below.
Parameter Value
Energy (MeV) 5.09
Energy spread (MeV) 0.07
Spot X (mm) 7.53e-01
Spot Y (mm) 7.55e-01
Duration (ps, rms) 2.83
Emittance (mm mrad) 7.23e-01
5.1.2 Evolution along the 2nd beamline
The simulation ends with the transport in the second beamline. The beam transpost in this beamline has
been simulated by using the CERN MAD-X code [10]. The quadrupoles are set in order to close the
dispersion (null Dx at the end of the line, see figure below) between the two dipoles while maintaining
the beam focused on the beam-pipe. The figure below shows the Twiss parameters βx,y evolution in the
line. By considering a possible installation of the experimental test apparatus 15 m after the end of the
linac, the transverse beam dimensions can be easily managed by using the quadrupole triplet after the
second dipole. Specifically, in the figure the final dimensions are about 7 mm. The minimum spot size
achievable with the current quadrupole setup is about 400 μm.
13/23

Fig. 4: Evolution of the beam in the dogleg line.
5.1.3 Use of targets in order to decrease the energy below 5 MeV
High-energy electrons predominantly lose energy in matter by bremsstrahlung, and high-energy
photons by e+e− pair production. A typical behavior of the energy loss of electrons in matter is shown
in fig. 5, reporting the rate of energy loss for electrons in lead. Targets of different thicknesses and
material could be used in order to decrease the energy of the accelerated electrons in the range of 3-5
14/23

MeV, thus making them fully compatible with the HEPD test requirements. The use of targets is studied
in the following pages.
Fig. 5: Energy loss in lead.
By starting with a 5.1 MeV electron beam, the energy can be decreased, for instance, by using a Pb or
Al screen. With these screen, by considering energy minimum ionization energies of 12.74 MeV/cm
and 4.36 MeV/cm, respectively for Pb and Al, it is possible to reach the final energies showed in the
plot of Fig. 6. In particular, energies of 3 MeV can be reached by using a 1.7 mm-thick Pb screen
inserted in the beam-pipe before the interaction with the HEPD device.
15/23
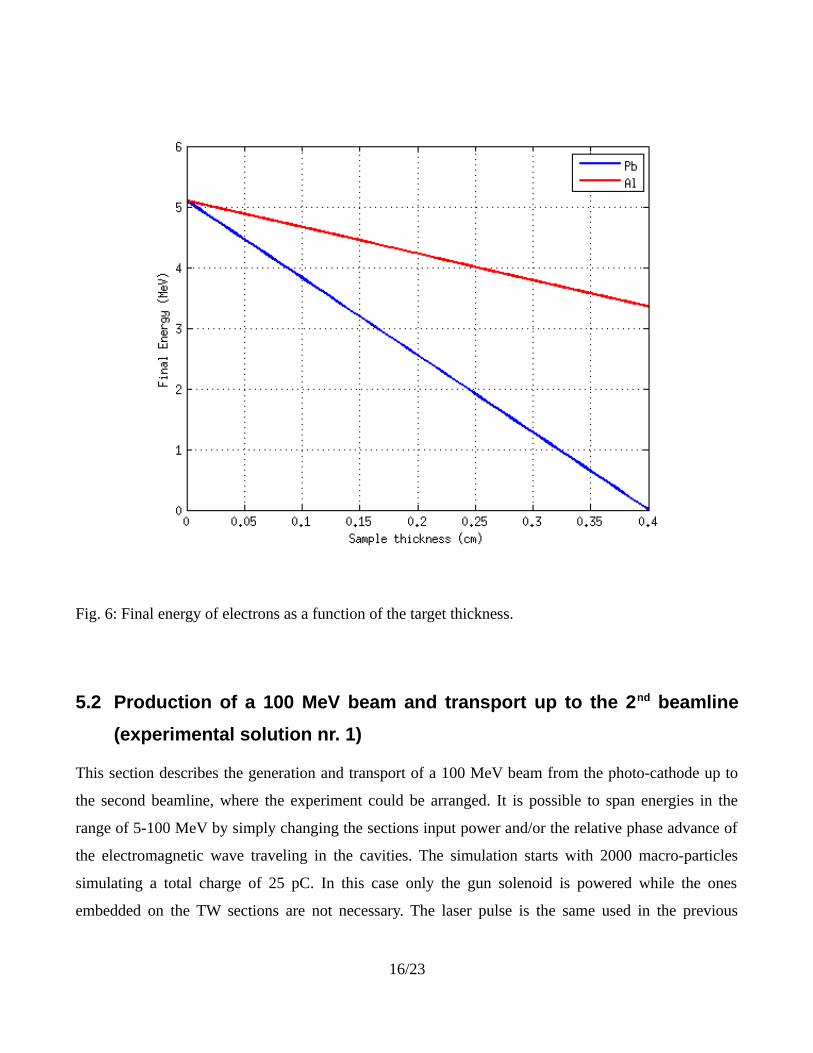
Fig. 6: Final energy of electrons as a function of the target thickness.
5.2 Production of a 100 MeV beam and transport up to the 2nd beamline
(experimental solution nr. 1)
This section describes the generation and transport of a 100 MeV beam from the photo-cathode up to
the second beamline, where the experiment could be arranged. It is possible to span energies in the
range of 5-100 MeV by simply changing the sections input power and/or the relative phase advance of
the electromagnetic wave traveling in the cavities. The simulation starts with 2000 macro-particles
simulating a total charge of 25 pC. In this case only the gun solenoid is powered while the ones
embedded on the TW sections are not necessary. The laser pulse is the same used in the previous
16/23

configuration. More details are given in next paragraph.
5.2.1 Evolution along the Linac
The beam described in this section has been obtained by considering an accelerating gradient of 20
MV/m for the S1 and S2 sections, while it is 120 MV/m for the Gun, as in the previous section. The
last C-band section is turned off. The gun solenoid is set to have a peak magnetic field of 0.28 T. The
LPS of the simulated beam is showed in the plot below.
Fig. 7: Beam Longitudinal Phase Space
The mean energy is 100.4 MeV with an energy spread of 0.4 MeV. The evolution along the linac of the
beam envelope and its relative emittance is showed in Fig. 8. The final spot size is showed in Fig. 9.
17/23
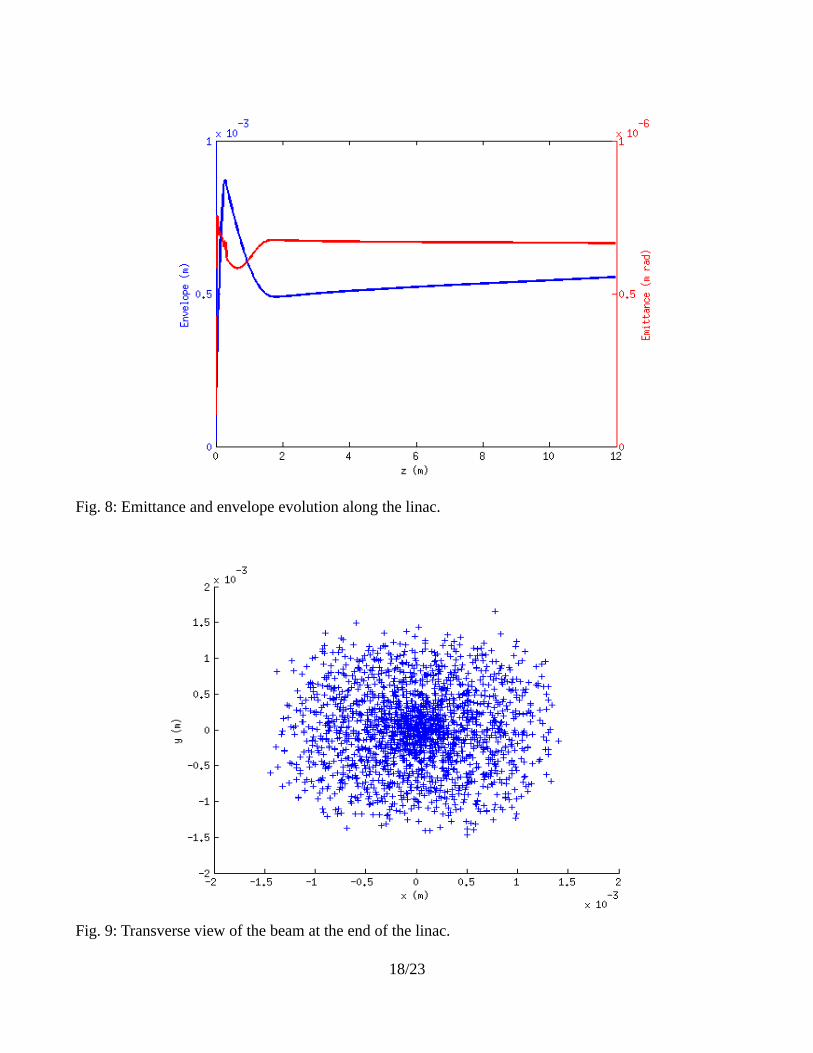
Fig. 8: Emittance and envelope evolution along the linac.
Fig. 9: Transverse view of the beam at the end of the linac.
18/23

The final beam parameters are summarized in the table below.
Parameter Value
Energy (MeV) 100.4
Energy spread (MeV) 0.4
Spot X (mm) 5.60e-01
Spot Y (mm) 5.63e-01
Duration (ps) 0.53
Emittance (mm mrad) 6.9e-01
5.2.2 Evolution along the 2nd beamline
The simulation ends with the transport in the second beamline. The quadrupoles are set again in order
to close the dispersion (null Dx at the end of the line, see figure below) between the two dipoles. The
figure below shows the Twiss parameters βx,y evolution in the line. By considering a possible
installation of the experimental test apparatus 15 m after the end of the linac, the transverse beam
dimensions can be easily managed by using the quadrupole triplet after the second dipole. Specifically,
in the figure the final dimensions are about 2 mm. The minimum spot size achievable with the current
quadrupole setup is about 400 μm.
19/23

Fig. 10: Evolution of the beam in the dogleg line.
5.3 Production of a 5 MeV beam (experimental solution nr. 2)
This section describes the generation and transport of a 5 MeV beam from the photo-cathode. In this
case the experimental apparatus is installed at the exit of the gun. The simulation starts with 2000
macro-particles simulating a total charge of 25 pC. The laser hitting the photo-cathode has a duration of
60 fs (rms). The first plot shows the final energy as a function of the chosen injection phase. In this way
the energy can be varied by only tuning this phase. By implementing this solution the only way to
focus the beam is by using the solenoid gun, that can produce round spots with the dimensions showed
in the second plot, varying from 170 μm up to 1.8 mm.
20/23

Fig. 11: Energy at the exit of the gun as a function of the injection phase.
21/23

Fig. 12: Spot at the exit of the gun as a function of the solenoid current.
6 Conclusions
This proposal showed a possible realization of an experiment able to test the HEPD at SPARC-LAB.
Two possible configurations have been described. In the first one the experimental apparatus is
installed along the second beamline, allowing to test the apparatus with electron beams with energies
ranging from few MeV up to 100 MeV, as required for the tests. In the second one the experiment is
directly installed at the gun exit, allowing to deliver beams with low energies in a easier way. In this
case, however, the maximum energy would be 6 MeV.
The simulation showed that the first solution is the more practicable. The final parameters summarized
in the reported tables, showed that a high quality beam can be produced and delivered up to the
experimental station. Parameters as charge, charge density (i.e. charge per surface unit) and transverse
dimensions can be managed by using the quadrupoles installed in the second beamline. In this way,
different tests with different beam configurations can be performed for the experiment.
7 Acknowledgments
We acknowledge support from the Italian Space Agency (ASI INFN 2012-14-R.0 contract), National
Institute for Nuclear Physics (INFN) and Ministero degli Affari Esteri (MAE).
References
1. M Ferrario, D Alesini, et al. Sparc_lab present and future. Nuclear Instruments and Methods in
Physics Research Section B: Beam Interactions with Materials and Atoms, 2013.
2. P. Valente, F. Anelli, et al. Development of a multi-gev spectrometer for laser–plasma
experiment at flame. Nuclear Instruments and Methods in Physics Research Section A:
Accelerators, Spectrometers, Detectors and Associated Equipment, 653(1):42 – 46, 2011.
22/23

3. L. Giannessi, D. Alesini, et al. Self-amplified spontaneous emission for a single pass free-
electron laser. Phys. Rev. ST Accel. Beams, 14:060712, Jun 2011.
4. A Bacci, D Alesini, et al. Electron linac design to drive bright compton back-scattering gamma-
ray sources. Journal of Applied Physics, 113(19):194508–194508, 2013.
5. E Chiadroni, M Bellaveglia, et al. Characterization of the thz radiation source at the frascati
linear accelerator. Review of Scientific Instruments, 84(2):022703–022703, 2013.
6. M Ferrario, D Alesini, et al. Experimental demonstration of emittance compensation with
velocity bunching. Physical review letters, 104(5):054801, 2010.
7. D Filippetto, M Bellaveglia, et al. Phase space analysis of velocity bunched beams. Physical
Review Special Topics-Accelerators and Beams, 14(9):092804, 2011.
8. D Alesini, E Chiadroni, et al. Sliced beam parameter measurements. In Proceedings of EPAC,
2009.
9. MJ de Loos and SB van der Geer. General particle tracer: A new 3d code for accelerator and
beamline design. In Proceedings of the fifth European Particle Accelerators Conference Sitges,
page 1241, 1996.
10. Hans Grote and F Christoph Iselin. The mad program (methodical accelerator design).
Technical report, CM-P00049316, 1990.
23/23