tetra technologies, inc. on the cover · all of csi compressco s ... (0.34) (1.85) (1.59) (2.16)...
TRANSCRIPT
TETRA Technologies, Inc. 2017 A
NN
UA
L REPORT
TETRA Technologies, Inc.GLOBAL HEADQUARTERS24955 Interstate 45 NorthThe Woodlands, TX 77380
+1.281.367.1983tetratec.com
ANNUAL REPORT2017
02
01
03 04 05 06
2017 saw the successful completion of a multi-year project in the Gulf of Mexico for a major operator, during which our TETRA CS Neptune® completion fluids system was utilized. This transformational technology is an example of the environmentally friendly, value-added solutions that TETRA is developing for our customers.
TETRA’s Production Testing business delivered a fast-tracked EPF installation for a customer in the Middle East in 2017 by dismantling and reworking a former facility, mobilizing to a new location and engineering and delivering the changes required to achieve the aims of this new customer. This facility was delivered to the mechanical completion stage within three months and handed over to the customer.
Four of our flagship G3516 3-stage 1,380HP compressors are providing gas lift service on a well in Conroe, Texas. All of CSI Compressco’s horsepower categories achieved utilization increases in 2017 as compared to the prior year.
TETRA Advanced Displacement System (TADS™), another innovative completion fluids system, was introduced to the market in 2017 through our TETRA Innovation Group (TIG). The TADS™ fluids system performed well for a Gulf of Mexico customer, successfully demonstrating effective wellbore cleaning performance and water-wetting of tubular surfaces.
TETRA introduced a new water management technology in the Permian Basin in 2017. Our Automated Distribution Manifold is shown efficiently managing two distinct produced water tank batteries at a customer’s reuse facility.
Production of our TETRA CS Neptune® heavy-brine completion fluid was accomplished at our offshore fluids production facility located in Galveston, Texas. TETRA’s new zinc- and formate-free completion fluid is the cost-effective alternative to traditional zinc bromides and cesium formate high-density completion fluids.
01
02
03
04
05
06
ON THE COVER
336476_Tetra_AR_CVR_R1.indd 1-3 3/12/18 9:04 PM
BOARD OF DIRECTORS
MARK E. BALDWIN (1*)
Retired Executive Vice President and Chief Financial Officer of Dresser-Rand Group, Inc. Director of KBR, Inc. Director of Nine Energy Service Inc. Director of TETRA Technologies, Inc. since 2014.
THOMAS R. BATES, JR. (2*)
Chairman of the Board of Directors of Independence Contract Drilling Inc. Chairman of the Board of Directors of Tidewater Inc. Chairman of the Board of Directors of Vantage Drilling International. Director of Alcer Gold Corporation. Adjunct Professor at the Neely School of Business, Texas Christian University. Director of TETRA Technologies, Inc. since 2011.
STUART M. BRIGHTMANChief Executive Officer of TETRA Technologies, Inc. Chairman of the Board of Directors of CSI Compressco GP Inc. Director of C&J Energy Services, Inc. Director of TETRA Technologies, Inc. since 2009.
PAUL D. COOMBS (1, 3)
Director of Balchem Corporation. Director of CSI Compressco GP Inc. Director of TETRA Technologies, Inc. since 1994.
JOHN F. GLICK (2, 3*)
Retired President, Chief Executive Officer, and a Director of Lufkin Industries, Inc. Chairman of the Board of Directors of Hunting PLC. Vice Chairman of the Board of Directors of CHI St. Luke’s Health. Director of CHI St. Luke’s Memorial Health. Director of TETRA Technologies, Inc. since 2014.
STEPHEN A. SNIDER (2, 3)
Retired President, Chief Executive Officer, and a Director of the general partner of Exterran Partners, L.P. Director of Thermon Group Holdings, Inc. Director of TETRA Technologies, Inc. since 2015.
WILLIAM D. SULLIVAN (Ex-Officio member of each board committee)Chairman of the Board of Directors of TETRA Technologies, Inc. Retired Executive Vice President, E&P, Anadarko Petroleum Corporation. Chairman of the Board of Directors of SM Energy Company. Director of Legacy Reserves GP, LLC. Director of CSI Compressco GP Inc. Director of TETRA Technologies, Inc. since 2007.
KENNETH E. WHITE, JR. (1,2)
Retired President and Chief Operating Officer of Torch Energy Advisors. Director of TETRA Technologies, Inc. since 2002.
JOSEPH C. WINKLER III (1)
Retired Chief Executive Officer and Chairman of the Board of Directors of Complete Production Services, Inc. Director of Hi-Crush Partners LP. Director of Commercial Metals Company. Director of Eclipse Resources Corporation. Director of TETRA Technologies, Inc. since 2015.
EXECUTIVE OFFICERS
STUART M. BRIGHTMANChief Executive Officer
BRADY M. MURPHYPresident and Chief Operating Officer
ELIJIO V. SERRANOSenior Vice President and Chief Financial Officer
BASS C. WALLACE, JR.Senior Vice President and General Counsel
MATTHEW J. SANDERSONSenior Vice President
OWEN A. SERJEANTPresident — CSI Compressco GP Inc.
JAMES H. FUNKEVice President
BEN C. CHAMBERSVice President — Accounting and Controller
ELISABETH K. EVANSVice President — Human Resources
JOSEPH J. MEYERVice President — Finance and Treasurer
STOCKHOLDER INFORMATION
CORPORATE HEADQUARTERSTETRA Technologies, Inc.24955 Interstate 45 NorthThe Woodlands, TX 77380+1 281.367.1983www.tetratec.com
STOCKHOLDER RELATIONS
TETRA Technologies, Inc.24955 Interstate 45 NorthThe Woodlands, TX 77380
TRANSFER AGENT AND REGISTRAR
Computershare Investor Services350 Indiana Street, Suite 800Golden, CO 80401+1 303.262.0600
STOCK LISTING
Shares of common stock of TETRA Technologies, Inc., trade on the New York Stock Exchange under the ticker symbol TTI.
INDEPENDENT AUDITORS
Ernst & Young LLP5 Houston Center1401 McKinney Street, Suite 1200Houston, TX 77010
FORM 10-K
The Company’s Form 10-K for the year ended December 31, 2017, is included in this Annual Report. Additional copies may be obtained free of charge by visiting the Company’s website (www.tetratec.com) or by writing to:Stockholder RelationsTETRA Technologies, Inc.24955 Interstate 45 NorthThe Woodlands, TX 77380
ANNUAL MEETING
The annual meeting of stockholders will be held at 11:00 a.m. local time on Friday, May 4, 2018, at our Corporate Headquarters in The Woodlands, Texas.
DISCLOSURE CERTIFICATION
As required by the NYSE listing standards, Stuart M. Brightman, our Chief Executive Officer, certified on May 22, 2017, that he was not aware of any violation by the Company of NYSE corporate governance listing standards. The certification required by Section 302 of the Sarbanes-Oxley Act was filed with the SEC on March 2, 2018, as an exhibit to our Annual Report on Form 10-K
(1) Member, Audit Committee(2) Member, Compensation Committee(3) Member, Nominating and Corporate Governance Committee(*) Indicates Committee Chairmanship
Copyright ©2018 TETRA Technologies, Inc. All Right Reserved.
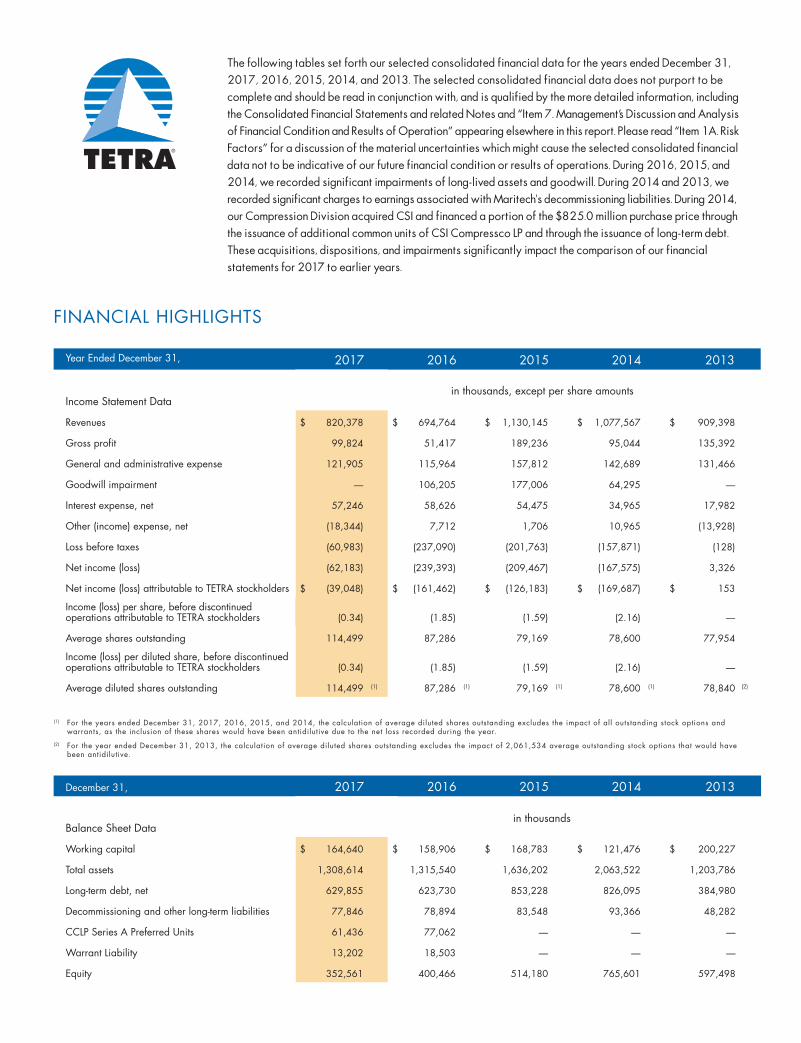
The following tables set forth our selected consolidated financial data for the years ended December 31, 2017, 2016, 2015, 2014, and 2013. The selected consolidated financial data does not purport to be complete and should be read in conjunction with, and is qualified by the more detailed information, including the Consolidated Financial Statements and related Notes and “Item 7. Management’s Discussion and Analysis of Financial Condition and Results of Operation” appearing elsewhere in this report. Please read “Item 1A. Risk Factors” for a discussion of the material uncertainties which might cause the selected consolidated financial data not to be indicative of our future financial condition or results of operations. During 2016, 2015, and 2014, we recorded significant impairments of long-lived assets and goodwill. During 2014 and 2013, we recorded significant charges to earnings associated with Maritech's decommissioning liabilities. During 2014, our Compression Division acquired CSI and financed a portion of the $825.0 million purchase price through the issuance of additional common units of CSI Compressco LP and through the issuance of long-term debt. These acquisitions, dispositions, and impairments significantly impact the comparison of our financial statements for 2017 to earlier years.
(1) For the years ended December 31, 2017, 2016, 2015, and 2014, the calculation of average diluted shares outstanding excludes the impact of all outstanding stock options and warrants, as the inclusion of these shares would have been antidilutive due to the net loss recorded during the year.
(2) For the year ended December 31, 2013, the calculation of average diluted shares outstanding excludes the impact of 2,061,534 average outstanding stock options that would have been antidilutive.
FINANCIAL HIGHLIGHTS
Year Ended December 31, 2017 2016 2015 2014 2013
Income Statement Data
Revenues $ 820,378 $ 694,764 $ 1,130,145 $ 1,077,567 $ 909,398
Gross profit 99,824 51,417 189,236 95,044 135,392
General and administrative expense 121,905 115,964 157,812 142,689 131,466
Goodwill impairment — 106,205 177,006 64,295 —
Interest expense, net 57,246 58,626 54,475 34,965 17,982
Other (income) expense, net (18,344) 7,712 1,706 10,965 (13,928)
Loss before taxes (60,983) (237,090) (201,763) (157,871) (128)
Net income (loss)
$
(62,183)
$
(239,393)
$
(209,467)
$
(167,575)
$
3,326
Net income (loss) attributable to TETRA stockholders (39,048) (161,462) (126,183) (169,687) 153
Income (loss) per share, before discontinuedoperations attributable to TETRA stockholders (0.34) (1.85) (1.59) (2.16) —
Average shares outstanding 114,499 87,286 79,169 78,600 77,954
Income (loss) per diluted share, before discontinuedoperations attributable to TETRA stockholders (0.34) (1.85) (1.59) (2.16) —
Average diluted shares outstanding 114,499 (1) 87,286 (1) 79,169 (1) 78,600 (1) 78,840 (2)
December 31, 2017 2016 2015 2014 2013
Balance Sheet Data
Working capital $ 164,640 $ 158,906 $ 168,783 $ 121,476 $ 200,227
Total assets 1,308,614 1,315,540 1,636,202 2,063,522 1,203,786
Long-term debt, net 629,855 623,730 853,228 826,095 384,980
Decommissioning and other long-term liabilities 77,846 78,894 83,548 93,366 48,282
CCLP Series A Preferred Units 61,436 77,062 — — —
Warrant Liability 13,202 18,503 — — —
Equity 352,561 400,466 514,180 765,601 597,498
in thousands, except per share amounts
in thousands
BOARD OF DIRECTORS
MARK E. BALDWIN (1*)
Retired Executive Vice President and Chief Financial Officer of Dresser-Rand Group, Inc. Director of KBR, Inc. Director of Nine Energy Service Inc. Director of TETRA Technologies, Inc. since 2014.
THOMAS R. BATES, JR. (2*)
Chairman of the Board of Directors of Independence Contract Drilling Inc. Chairman of the Board of Directors of Tidewater Inc. Chairman of the Board of Directors of Vantage Drilling International. Director of Alcer Gold Corporation. Adjunct Professor at the Neely School of Business, Texas Christian University. Director of TETRA Technologies, Inc. since 2011.
STUART M. BRIGHTMANChief Executive Officer of TETRA Technologies, Inc. Chairman of the Board of Directors of CSI Compressco GP Inc. Director of C&J Energy Services, Inc. Director of TETRA Technologies, Inc. since 2009.
PAUL D. COOMBS (1, 3)
Director of Balchem Corporation. Director of CSI Compressco GP Inc. Director of TETRA Technologies, Inc. since 1994.
JOHN F. GLICK (2, 3*)
Retired President, Chief Executive Officer, and a Director of Lufkin Industries, Inc. Chairman of the Board of Directors of Hunting PLC. Vice Chairman of the Board of Directors of CHI St. Luke’s Health. Director of CHI St. Luke’s Memorial Health. Director of TETRA Technologies, Inc. since 2014.
STEPHEN A. SNIDER (2, 3)
Retired President, Chief Executive Officer, and a Director of the general partner of Exterran Partners, L.P. Director of Thermon Group Holdings, Inc. Director of TETRA Technologies, Inc. since 2015.
WILLIAM D. SULLIVAN (Ex-Officio member of each board committee)Chairman of the Board of Directors of TETRA Technologies, Inc. Retired Executive Vice President, E&P, Anadarko Petroleum Corporation. Chairman of the Board of Directors of SM Energy Company. Director of Legacy Reserves GP, LLC. Director of CSI Compressco GP Inc. Director of TETRA Technologies, Inc. since 2007.
KENNETH E. WHITE, JR. (1,2)
Retired President and Chief Operating Officer of Torch Energy Advisors. Director of TETRA Technologies, Inc. since 2002.
JOSEPH C. WINKLER III (1)
Retired Chief Executive Officer and Chairman of the Board of Directors of Complete Production Services, Inc. Director of Hi-Crush Partners LP. Director of Commercial Metals Company. Director of Eclipse Resources Corporation. Director of TETRA Technologies, Inc. since 2015.
EXECUTIVE OFFICERS
STUART M. BRIGHTMANChief Executive Officer
BRADY M. MURPHYPresident and Chief Operating Officer
ELIJIO V. SERRANOSenior Vice President and Chief Financial Officer
BASS C. WALLACE, JR.Senior Vice President and General Counsel
MATTHEW J. SANDERSONSenior Vice President
OWEN A. SERJEANTPresident — CSI Compressco GP Inc.
JAMES H. FUNKEVice President
BEN C. CHAMBERSVice President — Accounting and Controller
ELISABETH K. EVANSVice President — Human Resources
JOSEPH J. MEYERVice President — Finance and Treasurer
STOCKHOLDER INFORMATION
CORPORATE HEADQUARTERSTETRA Technologies, Inc.24955 Interstate 45 NorthThe Woodlands, TX 77380+1 281.367.1983www.tetratec.com
STOCKHOLDER RELATIONS
TETRA Technologies, Inc.24955 Interstate 45 NorthThe Woodlands, TX 77380
TRANSFER AGENT AND REGISTRAR
Computershare Investor Services350 Indiana Street, Suite 800Golden, CO 80401+1 303.262.0600
STOCK LISTING
Shares of common stock of TETRA Technologies, Inc., trade on the New York Stock Exchange under the ticker symbol TTI.
INDEPENDENT AUDITORS
Ernst & Young LLP5 Houston Center1401 McKinney Street, Suite 1200Houston, TX 77010
FORM 10-K
The Company’s Form 10-K for the year ended December 31, 2017, is included in this Annual Report. Additional copies may be obtained free of charge by visiting the Company’s website (www.tetratec.com) or by writing to:Stockholder RelationsTETRA Technologies, Inc.24955 Interstate 45 NorthThe Woodlands, TX 77380
ANNUAL MEETING
The annual meeting of stockholders will be held at 11:00 a.m. local time on Friday, May 4, 2018, at our Corporate Headquarters in The Woodlands, Texas.
DISCLOSURE CERTIFICATION
As required by the NYSE listing standards, Stuart M. Brightman, our Chief Executive Officer, certified on May 22, 2017, that he was not aware of any violation by the Company of NYSE corporate governance listing standards. The certification required by Section 302 of the Sarbanes-Oxley Act was filed with the SEC on March 2, 2018, as an exhibit to our Annual Report on Form 10-K
(1) Member, Audit Committee(2) Member, Compensation Committee(3) Member, Nominating and Corporate Governance Committee(*) Indicates Committee Chairmanship
Copyright ©2018 TETRA Technologies, Inc. All Right Reserved.
The following tables set forth our selected consolidated financial data for the years ended December 31, 2017, 2016, 2015, 2014, and 2013. The selected consolidated financial data does not purport to be complete and should be read in conjunction with, and is qualified by the more detailed information, including the Consolidated Financial Statements and related Notes and “Item 7. Management’s Discussion and Analysis of Financial Condition and Results of Operation” appearing elsewhere in this report. Please read “Item 1A. Risk Factors” for a discussion of the material uncertainties which might cause the selected consolidated financial data not to be indicative of our future financial condition or results of operations. During 2016, 2015, and 2014, we recorded significant impairments of long-lived assets and goodwill. During 2014 and 2013, we recorded significant charges to earnings associated with Maritech's decommissioning liabilities. During 2014, our Compression Division acquired CSI and financed a portion of the $825.0 million purchase price through the issuance of additional common units of CSI Compressco LP and through the issuance of long-term debt. These acquisitions, dispositions, and impairments significantly impact the comparison of our financial statements for 2017 to earlier years.
(1) For the years ended December 31, 2017, 2016, 2015, and 2014, the calculation of average diluted shares outstanding excludes the impact of all outstanding stock options and warrants, as the inclusion of these shares would have been antidilutive due to the net loss recorded during the year.
(2) For the year ended December 31, 2013, the calculation of average diluted shares outstanding excludes the impact of 2,061,534 average outstanding stock options that would have been antidilutive.
FINANCIAL HIGHLIGHTS
Year Ended December 31, 2017 2016 2015 2014 2013
Income Statement Data
Revenues $ 820,378 $ 694,764 $ 1,130,145 $ 1,077,567 $ 909,398
Gross profit 99,824 51,417 189,236 95,044 135,392
General and administrative expense 121,905 115,964 157,812 142,689 131,466
Goodwill impairment — 106,205 177,006 64,295 —
Interest expense, net 57,246 58,626 54,475 34,965 17,982
Other (income) expense, net (18,344) 7,712 1,706 10,965 (13,928)
Loss before taxes (60,983) (237,090) (201,763) (157,871) (128)
Net income (loss)
$
(62,183)
$
(239,393)
$
(209,467)
$
(167,575)
$
3,326
Net income (loss) attributable to TETRA stockholders (39,048) (161,462) (126,183) (169,687) 153
Income (loss) per share, before discontinuedoperations attributable to TETRA stockholders (0.34) (1.85) (1.59) (2.16) —
Average shares outstanding 114,499 87,286 79,169 78,600 77,954
Income (loss) per diluted share, before discontinuedoperations attributable to TETRA stockholders (0.34) (1.85) (1.59) (2.16) —
Average diluted shares outstanding 114,499 (1) 87,286 (1) 79,169 (1) 78,600 (1) 78,840 (2)
December 31, 2017 2016 2015 2014 2013
Balance Sheet Data
Working capital $ 164,640 $ 158,906 $ 168,783 $ 121,476 $ 200,227
Total assets 1,308,614 1,315,540 1,636,202 2,063,522 1,203,786
Long-term debt, net 629,855 623,730 853,228 826,095 384,980
Decommissioning and other long-term liabilities 77,846 78,894 83,548 93,366 48,282
CCLP Series A Preferred Units 61,436 77,062 — — —
Warrant Liability 13,202 18,503 — — —
Equity 352,561 400,466 514,180 765,601 597,498
in thousands, except per share amounts
in thousands
336476_Tetra_AR_CVR_R1.indd 4-6 3/12/18 9:04 PM
management business, we have broadened our service offerings, captured existing synergies including complementary products and customer bases, and laid the foundation for continued growth across all North American shale plays. The reception from our customers following the acquisition has been tremendous, and we believe that moving forward we will clearly emerge as one of the largest and strongest water management and flowback testing service companies in the Permian Basin. Since closing, we have branded the two businesses under SwiftWater, A TETRA Company, and integration is underway. We are encouraged by the significant revenue expansion opportunities this integration represents for our fluids, water management, and frac flowback business in the Permian Basin.
In 2017, our Chemicals group expanded its geographic footprint in the oil and gas clear brine fluids market by leveraging our manufacturing position with new supply agreements in the Middle East and North Sea. Additionally, in our North American market, they leveraged byproducts from our El Dorado, Arkansas, production plant through distribution agreements that created new product and market opportunities.
Our Production Testing product line increased earnings in the second half of the year based on the strength of continued North American land activity and an increase in international opportunities. We continue to deploy Early Production Facilities in key markets around the world, and our Flowback and Testing equipment utilization showed strong improvement throughout the year. We feel we are well positioned to continue strong growth and improved earnings through 2018.
Throughout 2017, our Compression Division delivered impressive returns within what is widely viewed as a strongly recovering compression market. Overall operating fleet horsepower in service increased by 5.7% year-over-year, with higher utilization across all categories of horsepower. The year included a new equipment sales backlog that rose from $22 million at the end of 2016 to $48 million at the end of 2017, increasing to a $117- million backlog by the end of January 2018. New equipment sales were led by electric-driven packages for Permian Basin midstream customers. Furthermore, encouraging developments in new large-horsepower compression service segments in Mexico and Argentina contributed to a 92% utilization rate for our high-horsepower units. Aftermarket service revenues increased in 2017, up 21% year-over-year. The division started to receive the benefit of lower costs and increased efficiencies from the new Enterprise Resource Planning (ERP) system, which was fully integrated and launched in August 2017. With a $4-million annualized cost savings anticipated by mid-2018, our sales team and field technicians are now connected in real time to provide fully optimized scheduling and logistics support within a rapidly changing environment. Across the organization, we worked last year to improve our internal systems of HSEQ and Supply Chain and Procurement Management. We upgraded our Quality Management System (QMS) in 2017 to support ISO upgrades and upcoming API requirements, and we implemented an improved vendor HSEQ
Audit Process to ensure alignment of continuous improvement efforts with our key suppliers.
Every day, we remain Dedicated to the CØRE of our values-driven culture that focuses on customers, on our “Drive to ZERO” safety mindset, on maximizing our returns, and on engaging and motivating our outstanding employees. In 2017, these commitments resulted in new technological advancements and recognition within our industry for our leading role in driving innovation.
In continued fulfillment of our long-term growth strategy, we executed a divestiture of our offshore decommissioning services businesses and Maritech operations, along with all of Maritech’s related asset retirement obligations, in early 2018. This transaction reduces the volatility associated with the offshore decommissioning businesses and its seasonality. It also allows TETRA to direct capital and resources to the areas where its competitive advantage is stronger and barriers to entry are higher. Additionally, it provides more predictability and eliminates the uncertainty and costs associated with decommissioning liabilities in the Gulf of Mexico. As a result, TETRA is now a more focused and well-defined organization, exploiting its competitive advantage in U.S. shale plays, the international and offshore fluids markets, and in meeting the compression needs of the industry. By simplifying our value proposition and focusing on areas where we have a clear, competitive advantage, we have further strengthened our business composition and positioned ourselves for more growth moving forward.
As we enter 2018, we are solidly positioned to accelerate our strategic plan. Our fluids business is transforming with our acquisition of SwiftWater. Our objective of being a water solutions leader in North America and, in particular, in the Permian Basin, is advanced with this acquisition. The divestiture of our decommissioning services business and our decommissioning liabilities results in a more predictable company. We will further invest in our growth businesses of fluids, testing, and compression to leverage our existing platform.
Finally, I want to thank all of our employees for their dedication and service, welcome our SwiftWater employees to the TETRA family, and thank our stockholders for their support of our strategic vision.
Thank you for your continued support and confidence,
Stuart M. BrightmanChief Executive Officer
I am very proud of what our team accomplished in 2017. During the downturn over the past two years, we made difficult decisions to ensure financial stability and be robustly positioned for the recovery. We aggressively managed costs and proactively addressed our balance sheet. During the entire time, we articulated our near-term strategic plan and our long-term strategic vision, and invested in technology and people to align with these future aspirations.
As recovery in the energy markets was taking place during the second half of 2017, we maintained our capital allocation strategy of investing in our businesses with the highest return on technological differentiation. Throughout the year, we expanded and enhanced customer engagement and relationships across active oil and gas basins worldwide by focusing on understanding our customers’ needs and providing industry-leading solutions. We optimized our geographic market presence, streamlined our operations, and matched our personnel and equipment to emerging market trends. With an eye to the future, we invested in the development of differentiated, innovative, value-added products, and we created cost savings and improved efficiency through recent systems implementation initiatives. As we begin 2018, we feel that our balance sheet can support our growth and success within what appears to be a steadily improving market. Importantly, we have started the new year with bold initiatives designed to sharpen our focus on core businesses, while fully exploiting competitive advantages within our primary market segments.
Chief among our investments in the future success of our organization was the recent hiring of two key members of our leadership team. We have added two senior executives with significant industry experience and proven track records to provide bandwidth and leadership as we fully engage with the robust recovery taking place within the markets we serve.
Brady Murphy recently joined us as President and Chief Operating Officer. Brady has more than 35 years of global operations, engineering, manufacturing, and business development experience in the energy industry. In the past, he has served as a member of the executive management team at Halliburton and brings a wealth of experience that I believe will help elevate us to the next level of growth and performance.
Owen Serjeant joined us in November as President of CSI Compressco GP Inc. Owen has more than 35 years of global management and operational experience in a variety of areas within the energy industry, including the compression sector. Most recently, he was with Cameron, a Schlumberger Limited company, where he held numerous leadership positions. Prior to
his time at Cameron, Owen spent 18 years at Cooper Energy Services. He will be a valuable asset as we endeavor to take full advantage of the remarkable recovery within the compression business.
In addition to these two executives, we have recruited and added many other high-impact and high-potential individuals to the organization. We have promoted others into bigger roles, all to help us drive shareholder value.
Across our entire organization, we are committed to training and developing key employees for future opportunities within the company. We recognize excellence wherever we find it, and we continue to look for ways to reward high performers with additional responsibilities.
In 2017, our Fluids Division drove the development of new onshore and offshore technologies through integrated fluids research and global manufacturing capabilities. We oversaw the completion of the TETRA CS Neptune® completion fluids system project for a deepwater GOM operator and an expansion of our onshore water management operations that resulted in generating business across a diverse customer base.
The success of the TETRA CS Neptune® technology project simply cannot be overstated. In 2017, TETRA completed a multi-year project in the Gulf of Mexico that, by all measures, was an unqualified success. We view the TETRA CS Neptune® completion fluids system as a transformational, disruptive technology that is generating additional interest from customers around the world. We are excited about the future and about the role TETRA CS Neptune® technology will play in the growth of our Fluids Division.
Continuing a trend that began in mid-2016, TETRA’s North American water management services were buoyed by significant growth capital investment in the energy industry, rising oil and natural gas prices, and an increasing industry awareness of the benefits to be gained through the use of our signature products. Our Automated Distribution Manifold, along with other innovations such as our Automated Blending Controller, reflect the hard work of our TETRA Innovation Group and our engineering team, and has facilitated our positioning as the obvious integrated water solutions provider across North American basins.
As a demonstration of TETRA’s ongoing commitment to the development of the strategically important water management business, we were excited to announce the recent acquisition of SwiftWater Energy Services. By combining the resources of SwiftWater in the Permian Basin with our existing water
Letter to Stockholders"As we enter 2018, we are solidly positioned to accelerate our strategic plan. We will further invest in our growth businesses of fluids, testing, and compression to leverage our existing platform."
"As we begin 2018, we feel that our balance sheet can support our growth and success within what appears to be a steadily improving market. Importantly, we have started the new year with bold initiatives designed to sharpen our focus on core businesses, while fully exploiting competitive advantages within our primary market segments."
”
-
336476_Tetra_AR_NAR_R1.indd 1 3/12/18 9:06 PM

management business, we have broadened our service offerings, captured existing synergies including complementary products and customer bases, and laid the foundation for continued growth across all North American shale plays. The reception from our customers following the acquisition has been tremendous, and we believe that moving forward we will clearly emerge as one of the largest and strongest water management and flowback testing service companies in the Permian Basin. Since closing, we have branded the two businesses under SwiftWater, A TETRA Company, and integration is underway. We are encouraged by the significant revenue expansion opportunities this integration represents for our fluids, water management, and frac flowback business in the Permian Basin.
In 2017, our Chemicals group expanded its geographic footprint in the oil and gas clear brine fluids market by leveraging our manufacturing position with new supply agreements in the Middle East and North Sea. Additionally, in our North American market, they leveraged byproducts from our El Dorado, Arkansas, production plant through distribution agreements that created new product and market opportunities.
Our Production Testing product line increased earnings in the second half of the year based on the strength of continued North American land activity and an increase in international opportunities. We continue to deploy Early Production Facilities in key markets around the world, and our Flowback and Testing equipment utilization showed strong improvement throughout the year. We feel we are well positioned to continue strong growth and improved earnings through 2018.
Throughout 2017, our Compression Division delivered impressive returns within what is widely viewed as a strongly recovering compression market. Overall operating fleet horsepower in service increased by 5.7% year-over-year, with higher utilization across all categories of horsepower. The year included a new equipment sales backlog that rose from $22 million at the end of 2016 to $48 million at the end of 2017, increasing to a $117- million backlog by the end of January 2018. New equipment sales were led by electric-driven packages for Permian Basin midstream customers. Furthermore, encouraging developments in new large-horsepower compression service segments in Mexico and Argentina contributed to a 92% utilization rate for our high-horsepower units. Aftermarket service revenues increased in 2017, up 21% year-over-year. The division started to receive the benefit of lower costs and increased efficiencies from the new Enterprise Resource Planning (ERP) system, which was fully integrated and launched in August 2017. With a $4-million annualized cost savings anticipated by mid-2018, our sales team and field technicians are now connected in real time to provide fully optimized scheduling and logistics support within a rapidly changing environment. Across the organization, we worked last year to improve our internal systems of HSEQ and Supply Chain and Procurement Management. We upgraded our Quality Management System (QMS) in 2017 to support ISO upgrades and upcoming API requirements, and we implemented an improved vendor HSEQ
Audit Process to ensure alignment of continuous improvement efforts with our key suppliers.
Every day, we remain Dedicated to the CØRE of our values-driven culture that focuses on customers, on our “Drive to ZERO” safety mindset, on maximizing our returns, and on engaging and motivating our outstanding employees. In 2017, these commitments resulted in new technological advancements and recognition within our industry for our leading role in driving innovation.
In continued fulfillment of our long-term growth strategy, we executed a divestiture of our offshore decommissioning services businesses and Maritech operations, along with all of Maritech’s related asset retirement obligations, in early 2018. This transaction reduces the volatility associated with the offshore decommissioning businesses and its seasonality. It also allows TETRA to direct capital and resources to the areas where its competitive advantage is stronger and barriers to entry are higher. Additionally, it provides more predictability and eliminates the uncertainty and costs associated with decommissioning liabilities in the Gulf of Mexico. As a result, TETRA is now a more focused and well-defined organization, exploiting its competitive advantage in U.S. shale plays, the international and offshore fluids markets, and in meeting the compression needs of the industry. By simplifying our value proposition and focusing on areas where we have a clear, competitive advantage, we have further strengthened our business composition and positioned ourselves for more growth moving forward.
As we enter 2018, we are solidly positioned to accelerate our strategic plan. Our fluids business is transforming with our acquisition of SwiftWater. Our objective of being a water solutions leader in North America and, in particular, in the Permian Basin, is advanced with this acquisition. The divestiture of our decommissioning services business and our decommissioning liabilities results in a more predictable company. We will further invest in our growth businesses of fluids, testing, and compression to leverage our existing platform.
Finally, I want to thank all of our employees for their dedication and service, welcome our SwiftWater employees to the TETRA family, and thank our stockholders for their support of our strategic vision.
Thank you for your continued support and confidence,
Stuart M. BrightmanChief Executive Officer
I am very proud of what our team accomplished in 2017. During the downturn over the past two years, we made difficult decisions to ensure financial stability and be robustly positioned for the recovery. We aggressively managed costs and proactively addressed our balance sheet. During the entire time, we articulated our near-term strategic plan and our long-term strategic vision, and invested in technology and people to align with these future aspirations.
As recovery in the energy markets was taking place during the second half of 2017, we maintained our capital allocation strategy of investing in our businesses with the highest return on technological differentiation. Throughout the year, we expanded and enhanced customer engagement and relationships across active oil and gas basins worldwide by focusing on understanding our customers’ needs and providing industry-leading solutions. We optimized our geographic market presence, streamlined our operations, and matched our personnel and equipment to emerging market trends. With an eye to the future, we invested in the development of differentiated, innovative, value-added products, and we created cost savings and improved efficiency through recent systems implementation initiatives. As we begin 2018, we feel that our balance sheet can support our growth and success within what appears to be a steadily improving market. Importantly, we have started the new year with bold initiatives designed to sharpen our focus on core businesses, while fully exploiting competitive advantages within our primary market segments.
Chief among our investments in the future success of our organization was the recent hiring of two key members of our leadership team. We have added two senior executives with significant industry experience and proven track records to provide bandwidth and leadership as we fully engage with the robust recovery taking place within the markets we serve.
Brady Murphy recently joined us as President and Chief Operating Officer. Brady has more than 35 years of global operations, engineering, manufacturing, and business development experience in the energy industry. In the past, he has served as a member of the executive management team at Halliburton and brings a wealth of experience that I believe will help elevate us to the next level of growth and performance.
Owen Serjeant joined us in November as President of CSI Compressco GP Inc. Owen has more than 35 years of global management and operational experience in a variety of areas within the energy industry, including the compression sector. Most recently, he was with Cameron, a Schlumberger Limited company, where he held numerous leadership positions. Prior to
his time at Cameron, Owen spent 18 years at Cooper Energy Services. He will be a valuable asset as we endeavor to take full advantage of the remarkable recovery within the compression business.
In addition to these two executives, we have recruited and added many other high-impact and high-potential individuals to the organization. We have promoted others into bigger roles, all to help us drive shareholder value.
Across our entire organization, we are committed to training and developing key employees for future opportunities within the company. We recognize excellence wherever we find it, and we continue to look for ways to reward high performers with additional responsibilities.
In 2017, our Fluids Division drove the development of new onshore and offshore technologies through integrated fluids research and global manufacturing capabilities. We oversaw the completion of the TETRA CS Neptune® completion fluids system project for a deepwater GOM operator and an expansion of our onshore water management operations that resulted in generating business across a diverse customer base.
The success of the TETRA CS Neptune® technology project simply cannot be overstated. In 2017, TETRA completed a multi-year project in the Gulf of Mexico that, by all measures, was an unqualified success. We view the TETRA CS Neptune® completion fluids system as a transformational, disruptive technology that is generating additional interest from customers around the world. We are excited about the future and about the role TETRA CS Neptune® technology will play in the growth of our Fluids Division.
Continuing a trend that began in mid-2016, TETRA’s North American water management services were buoyed by significant growth capital investment in the energy industry, rising oil and natural gas prices, and an increasing industry awareness of the benefits to be gained through the use of our signature products. Our Automated Distribution Manifold, along with other innovations such as our Automated Blending Controller, reflect the hard work of our TETRA Innovation Group and our engineering team, and has facilitated our positioning as the obvious integrated water solutions provider across North American basins.
As a demonstration of TETRA’s ongoing commitment to the development of the strategically important water management business, we were excited to announce the recent acquisition of SwiftWater Energy Services. By combining the resources of SwiftWater in the Permian Basin with our existing water
Letter to Stockholders"As we enter 2018, we are solidly positioned to accelerate our strategic plan. We will further invest in our growth businesses of fluids, testing, and compression to leverage our existing platform."
"As we begin 2018, we feel that our balance sheet can support our growth and success within what appears to be a steadily improving market. Importantly, we have started the new year with bold initiatives designed to sharpen our focus on core businesses, while fully exploiting competitive advantages within our primary market segments."
”
-
336476_Tetra_AR_NAR_R1.indd 2 3/12/18 9:06 PM

UNITED STATESSECURITIES AND EXCHANGE COMMISSION
WASHINGTON D.C. 20549
FORM 10-K(MARK ONE)
[ X ] ANNUAL REPORT PURSUANT TO SECTION 13 OR 15(d) OF THE SECURITIES EXCHANGE ACT OF 1934FOR THE FISCAL YEAR ENDED DECEMBER 31, 2017
OR
[ ] TRANSITION REPORT PURSUANT TO SECTION 13 OR 15(d) OF THE SECURITIES EXCHANGE ACT OF 1934 FOR THE TRANSITION PERIOD FROM TO .
COMMISSION FILE NUMBER 1-13455
TETRA Technologies, Inc.(EXACT NAME OF THE REGISTRANT AS SPECIFIED IN ITS CHARTER)
DELAWARE 74-2148293(STATE OR OTHER JURISDICTION OF (I.R.S. EMPLOYERINCORPORATION OR ORGANIZATION) IDENTIFICATION NO.)
24955 INTERSTATE 45 NORTH
THE WOODLANDS, TEXAS 77380(ADDRESS OF PRINCIPAL EXECUTIVE OFFICES) (ZIP CODE)
REGISTRANT’S TELEPHONE NUMBER, INCLUDING AREA CODE: (281) 367-1983
SECURITIES REGISTERED PURSUANT TO SECTION 12(b) OF THE ACT:
COMMON STOCK, PAR VALUE $.01 PER SHARE NEW YORK STOCK EXCHANGE(TITLE OF CLASS) (NAME OF EXCHANGE ON WHICH REGISTERED)
SECURITIES REGISTERED PURSUANT TO SECTION 12(g) OF THE ACT: NONE
INDICATE BY CHECK MARK IF THE REGISTRANT IS A WELL-KNOWN SEASONED ISSUER (AS DEFINED IN RULE 405 OF THE SECURITIES ACT).YES [ X ] NO [ ]
INDICATE BY CHECK MARK IF THE REGISTRANT IS NOT REQUIRED TO FILE REPORTS PURSUANT TO SECTION 13 OR SECTION 15(d) OF THE ACT. YES [ ] NO [ X ]
INDICATE BY CHECK MARK WHETHER THE REGISTRANT (1) HAS FILED ALL REPORTS REQUIRED TO BE FILED BY SECTION 13 OR 15(d) OF THE SECURITIES EXCHANGE ACT OF 1934 DURING THE PRECEDING 12 MONTHS (OR FOR SUCH SHORTER PERIOD THAT THE REGISTRANT WAS REQUIRED TO FILE SUCH REPORTS) AND (2) HAS BEEN SUBJECT TO SUCH FILING REQUIREMENTS FOR THE PAST 90 DAYS. YES [ X ] NO [ ]
INDICATE BY CHECK MARK WHETHER THE REGISTRANT HAS SUBMITTED ELECTRONICALLY AND POSTED ON ITS CORPORATE WEB SITE, IF ANY, EVERY INTERACTIVE DATA FILE REQUIRED TO BE SUBMITTED AND POSTED PURSUANT TO RULE 405 OF REGULATION S-T DURING THE PRECEDING 12 MONTHS (OR FOR SUCH SHORTER PERIOD THAT THE REGISTRANT WAS REQUIRED TO SUBMIT AND POST SUCH FILES).YES [ X ] NO [ ]
INDICATE BY CHECK MARK IF DISCLOSURE OF DELINQUENT FILERS PURSUANT TO ITEM 405 OF REGULATION S-K IS NOT CONTAINED HEREIN, AND WILL NOT BE CONTAINED, TO THE BEST OF REGISTRANT’S KNOWLEDGE, IN DEFINITIVE PROXY OR INFORMATION STATEMENTS INCORPORATED BY
REFERENCE IN PART III OF THIS FORM 10-K OR ANY AMENDMENT TO THIS FORM 10-K. [ ]INDICATE BY CHECK MARK WHETHER THE REGISTRANT IS A LARGE ACCELERATED FILER, AN ACCELERATED FILER, A NON-ACCELERATED FILER, A SMALLER REPORTING COMPANY, OR AN EMERGING GROWTH COMPANY. SEE THE DEFINITIONS OF “LARGE ACCELERATED FILER,” “ACCELERATED FILER,” “SMALLER REPORTING COMPANY,” AND "EMERGING GROWTH COMPANY" IN RULE 12b-2 OF THE EXCHANGE ACT. (CHECK ONE):
LARGE ACCELERATED FILER [ ] ACCELERATED FILER [ X ] NON-ACCELERATED FILER [ ] SMALLER REPORTING COMPANY [ ]
EMERGING GROWTH COMPANY [ ]
IF AN EMERGING GROWTH COMPANY, INDICATE BY CHECK MARK IF THE REGISTRANT HAS ELECTED NOT TO USE THE EXTENDED TRANSITION PERIOD FOR COMPLYING WITH ANY NEW OR REVISED FINANCIAL ACCOUNTING STANDARDS PROVIDED PURSUANT TO SECTION 13(A) OF THE EXCHANGE ACT [ ]
INDICATE BY CHECK MARK WHETHER THE REGISTRANT IS A SHELL COMPANY (AS DEFINED IN RULE 12b-2 OF THE EXCHANGE ACT).YES [ ] NO [ X ]
THE AGGREGATE MARKET VALUE OF COMMON STOCK HELD BY NON-AFFILIATES OF THE REGISTRANT WAS $311,416,405 AS OF JUNE 30, 2017, THE LAST BUSINESS DAY OF THE REGISTRANT’S MOST RECENTLY COMPLETED SECOND FISCAL QUARTER.
NUMBER OF SHARES OUTSTANDING OF THE ISSUER’S COMMON STOCK AS OF MARCH 1, 2018, WAS 125,528,953 SHARES.
DOCUMENTS INCORPORATED BY REFERENCE
PART III INFORMATION IS INCORPORATED BY REFERENCE TO THE REGISTRANT’S PROXY STATEMENT FOR ITS ANNUAL MEETING OF STOCKHOLDERS TO BE HELD MAY 4, 2018, TO BE FILED WITH THE SECURITIES AND EXCHANGE COMMISSION WITHIN 120 DAYS OF THE END OF THE REGISTRANT’S FISCAL YEAR.
TABLE OF CONTENTS
Part I Item 1. BusinessItem 1A. Risk FactorsItem 1B. Unresolved Staff CommentsItem 2. PropertiesItem 3. Legal ProceedingsItem 4. Mine Safety Disclosures Part II
Item 5.Market for Registrant’s Common Equity, Related Stockholder Matters, and Issuer Purchases of Equity Securities
Item 6. Selected Financial DataItem 7. Management’s Discussion and Analysis of Financial Condition and Results of Operation
Item 7A. Quantitative and Qualitative Disclosures about Market RiskItem 8. Financial Statements and Supplementary DataItem 9. Changes in and Disagreements with Accountants on Accounting and Financial DisclosureItem 9A. Controls and ProceduresItem 9B. Other Information Part III
Item 10. Directors, Executive Officers, and Corporate GovernanceItem 11. Executive CompensationItem 12. Security Ownership of Certain Beneficial Owners and Management and Related Stockholder MattersItem 13. Certain Relationships and Related Transactions, and Director IndependenceItem 14. Principal Accounting Fees and Services Part IV
Item 15. Exhibits, Financial Statement SchedulesItem 16. Form 10-K Summary
11124242626
26
2830
6162626363
6464646464
6571
i
Forward-Looking Statements
This Annual Report on Form 10-K contains “forward-looking statements” within the meaning of Section 27A of the Securities Act of 1933, as amended, and Section 21E of the Securities Exchange Act of 1934, as amended. Forward-looking statements in this Annual Report are identifiable by the use of the following words, the negative of such words, and other similar words: “anticipates”, “assumes”, “believes”, “budgets”, “could”, “estimates”, “expects”, “forecasts”, “goal”, “intends”, “may”, “might”, “plans”, “predicts”, “projects”, “schedules”, “seeks”, “should, “targets”, “will”, and “would”.
Such forward-looking statements reflect our current views with respect to future events and financial performance and are based on assumptions that we believe to be reasonable, but such forward-looking statements are subject to numerous risks, and uncertainties, including, but not limited to:
• economic and operating conditions that are outside of our control, including the supply, demand, and prices of crude oil and natural gas;
• the levels of competition we encounter;
• the activity levels of our customers;
• our operational performance;
• the availability of raw materials and labor at reasonable prices;
• risks related to acquisitions and our growth strategy;
• our ability to comply with the financial covenants in our debt agreements and the consequences of any failure to comply with such financial covenants;
• the availability of adequate sources of capital to us;
• the effect and results of litigation, regulatory matters, settlements, audits, assessments, and contingencies;
• risks related to our foreign operations;
• information technology risks including the risk from cyberattack, and
• other risks and uncertainties under “Item 1A. Risk Factors” in this Annual Report and as included in our other filings with the U.S. Securities and Exchange Commission (“SEC”), which are available free of charge on the SEC website at www.sec.gov.
The risks and uncertainties referred to above are generally beyond our ability to control, and we cannot predict all the risks and uncertainties that could cause our actual results to differ from those indicated by the forward-looking statements. If any of these risks or uncertainties materialize, or if any of the underlying assumptions prove incorrect, actual results may vary from those indicated by the forward-looking statements, and such variances may be material.
All subsequent written and oral forward-looking statements made by or attributable to us or to persons acting on our behalf are expressly qualified in their entirety by reference to these risks and uncertainties. You should not place undue reliance on forward-looking statements. Each forward-looking statement speaks only as of the date of the particular statement, and we undertake no obligation to update or revise any forward-looking statements we may make, except as may be required by law.
1
PART I
Item 1. Business.
The financial statements presented in this Annual Report are the consolidated financial statements of TETRA Technologies, Inc., a Delaware corporation and its subsidiaries. When the terms “TETRA,” “the Company,” “we,” “us,” or “our” are used in this document, those terms refer to TETRA Technologies, Inc. and its consolidated subsidiaries.
TETRA is a Delaware corporation, incorporated in 1981. Our corporate headquarters are located at 24955 Interstate 45 North, The Woodlands, Texas, 77380. Our phone number is 281-367-1983, and our website is accessed at www.tetratec.com. Our common stock is traded on the New York Stock Exchange under the symbol “TTI.”
Our Corporate Governance Guidelines, Code of Business Conduct, Code of Ethics for Senior Financial Officers, Audit Committee Charter, Compensation Committee Charter, and Nominating and Corporate Governance Committee Charter, as well as our Annual Reports on Form 10-K, Quarterly Reports on Form 10-Q, and Current Reports on Form 8-K, and all amendments to those reports are all available, free of charge, on our website at www.tetratec.com as soon as practicable after we file the reports with the SEC. Information contained on or connected to our website is not, and shall not be deemed to be, a part of this Annual Report on Form 10-K or incorporated into any other filings with the SEC. The documents referenced above are available in print at no cost to any stockholder who requests them from our Corporate Secretary.
About TETRA
TETRA Technologies, Inc., together with its consolidated subsidiaries, is a leading, geographically diversified oil and gas services company, focused on completion fluids and associated products and services, water management, frac flowback, production well testing, offshore rig cooling, and compression services and equipment. Prior to March 2018, our operations also included selected offshore services including well plugging and abandonment, decommissioning, and diving, as well as a limited domestic oil and gas production business. As of December 31, 2017 we were composed of five reporting segments organized into four divisions - Fluids, Production Testing, Compression, and Offshore.
Our Fluids Division manufactures and markets clear brine fluids, additives, and associated products and
services to the oil and gas industry for use in well drilling, completion and workover operations in the United States and in certain countries in Latin America, Europe, Asia, the Middle East and Africa. The division also markets liquid and dry calcium chloride products manufactured at its production facilities or purchased from third-party suppliers to a variety of markets outside the energy industry. The Fluids Division also provides domestic onshore oil and gas operators with a wide variety of water management services.
Our Production Testing Division provides frac flowback, production well testing, offshore rig cooling, and other associated services and early production facilities (EPFs) in many of the major oil and gas producing regions in the United States, Mexico, and Canada, as well as in oil and gas basins in certain regions in South America, Africa, Europe, the Middle East and Australia.
Our Compression Division is a provider of compression services and equipment for natural gas and oil production, gathering, transportation, processing, and storage. The Compression Division's equipment sales business includes the fabrication and sale of standard compressor packages, custom-designed compressor packages and oilfield pump systems designed and fabricated at the division's facilities. The Compression Division's aftermarket business provides compressor package reconfiguration and maintenance services and compressor package parts and components manufactured by third-party suppliers. The Compression Division provides its services and equipment to a broad base of natural gas and oil exploration and production, midstream, transmission, and storage companies operating throughout many of the onshore producing regions of the United States, as well as in a number of foreign countries, including Mexico, Canada and Argentina.
Our Offshore Division consists of two operating segments, both of which were disposed on March 1, 2018: Offshore Services and Maritech. The Offshore Services segment provided services primarily to the offshore oil and gas industry, consisting of: (1) downhole and subsea services, such as well plugging and abandonment and
2
inspection, repair and maintenance services; (2) decommissioning and certain construction services utilizing heavy lift barges and various cutting technologies with regard to offshore oil and gas production platforms and pipelines; and (3) conventional and saturation diving services. For additional information regarding the sale of the Offshore Division, see "Note C - Acquisitions and Dispositions" of the Notes to Consolidated Financial Statements.
The Maritech segment was a limited oil and gas production operation. During 2011 and the first quarter of 2012, Maritech sold substantially all of its oil- and gas-producing property interests. Maritech’s operations consisted primarily of the ongoing abandonment and decommissioning associated with its remaining offshore wells and production platforms.
We continue to pursue a long-term growth strategy that includes expanding our continuing core businesses, which excludes our recently disposed Offshore Services and Maritech segments, through internal growth and acquisitions, domestically and internationally. For financial information for each of our segments, including information regarding revenues and total assets, see “Note Q - Industry Segments and Geographic Information” contained in the Notes to Consolidated Financial Statements.
Products and Services Fluids Division
Liquid calcium chloride, calcium bromide, zinc bromide, zinc calcium bromide, sodium bromide, and blends of such products manufactured by our Fluids Division are referred to as clear brine fluids ("CBFs") in the oil and gas industry. CBFs are salt solutions that have variable densities and are used to control bottom-hole pressures during oil and gas completion and workover operations. The Fluids Division sells CBFs and various CBF additives to U.S. and foreign oil and gas exploration and production companies and to other companies that service customers in the oil and gas industry. The Fluids Division provides both stock and custom-blended CBFs based on each customer's specific needs and the proposed application. The Fluids Division provides a broad range of associated CBF services, including: on-site fluids filtration, handling and recycling; wellbore cleanup; fluid engineering consultation; and fluid management services. The Fluids Division's newest CBF technology, TETRA CS Neptune® completion fluids, are high-density, solids-, zinc- and formate-free completion fluids. They were developed by TETRA to be environmentally friendly and cost-effective alternatives to traditional zinc bromide and cesium formate high-density completion fluids for use in well completion and workover operations, as well as a low-solids reservoir drilling fluid.
We offer to repurchase (buyback) certain used CBFs from customers, which we are able to recondition and recycle. Selling used CBFs back to us reduces the net cost of the CBFs to our customers and minimizes our customers’ need to dispose of used fluids. We recondition used CBFs through filtration, blending and the use of proprietary chemical processes, and then market the reconditioned CBFs.
By blending different stock CBFs and using various additives, we are able to modify the specific density,
crystallization temperature, and chemical composition of the CBFs as necessary. The division’s fluid engineering personnel determine the optimal CBF blend for a customer’s particular application to maximize its effectiveness and lifespan. Our filtration services use a variety of techniques and equipment to remove particulates from CBFs at the customer’s site so that the CBFs can be reused. Filtration also enables recovery of a greater percentage of used CBFs for reconditioning.
The Fluids Division also provides a wide variety of water management services that support hydraulic
fracturing in unconventional well completions for domestic onshore oil and gas operators. These services include fresh and produced water analysis, treatment, storage, transfer, engineering, recycling, and environmental risk mitigation. The Fluids Division's patented equipment and processes include BioRid® treatment services, certain blending technologies, and TETRA STEELTM 1200 rapid deployment water transfer system. The Fluids Division seeks to design environmentally friendly solutions for the unique needs of each customer’s wellsite in order to maximize operational performance, and efficiency and minimize the use of fresh water. These include tailored “Last Mile” infrastructure - which consists of water storage ponds, movable storage tanks, a network of water transfer lines including TETRA STEEL™ lay-flat hose, TETRA Blend™ automated transfer and blending of produced water, and oil recovery from produced water via the TETRA Orapt™ mobile oil separator system - to transfer water around the well pads in a safe, efficient and environmentally responsible manner.
3
On February 28, 2018, pursuant to a purchase agreement dated February 13, 2018 (the 'SwiftWater Purchase Agreement"), we purchased all of the equity interests in SwiftWater Energy Services, LLC ("SwiftWater"), which is engaged in the business of providing water management and water solutions to oil and gas operators in the Permian Basin market of Texas. SwiftWater provides a diverse range of water management equipment and services for operators in the Permian Basin, offering an integrated line of services ranging from lay-flat hose water transfer, water treatment, above-ground water storage for fresh and produced water applications, secondary frac tank containment, poly pipe, pit lining rentals, and supporting ancillary equipment. For additional information regarding the acquisition of SwiftWater, see "Note C - Acquisitions and Dispositions" of the Notes to Consolidated Financial Statements.
The Fluids Division manufactures liquid and dry calcium chloride and liquid calcium bromide, zinc bromide, zinc calcium bromide, and sodium bromide for distribution, primarily into energy markets. Liquid and dry calcium chloride are also sold into water treatment, industrial, cement, food processing, road maintenance, ice melt, agricultural, and consumer products markets. Sodium bromide is also sold into industrial water treatment markets, where it is used as a biocide in recirculated cooling tower waters and in other applications.
Our calcium chloride manufacturing facilities are located in the United States and Finland. We also acquire calcium chloride inventory from other producers. In the United States, we manufacture calcium chloride at five manufacturing plant facilities, the largest of which is our plant near El Dorado, Arkansas, which produces liquid and flake calcium chloride products and sodium chloride. Liquid and flake calcium chloride are also produced at our Kokkola, Finland, plant. We operate our European calcium chloride operations under the name TETRA Chemicals Europe. We also manufacture liquid calcium chloride at our facilities in Parkersburg, West Virginia and Lake Charles, Louisiana, and we have two solar evaporation facility locations located in San Bernardino County, California, that produce liquid calcium chloride and sodium chloride from underground brine reserves, which are naturally replenished. All of our calcium chloride production facilities have a combined production capacity of more than 1.5 million equivalent liquid tons per year.
Our Fluids Division manufactures liquid calcium bromide, zinc bromide, zinc calcium bromide and sodium bromide at our West Memphis, Arkansas facility. A patented and proprietary process utilized at this facility uses bromine and zinc to manufacture zinc bromide. This facility also uses proprietary processes to manufacture calcium bromide and sodium bromide and to recondition and upgrade used CBFs that we have repurchased from our customers.
See “Note Q - Industry Segments and Geographic Information” in the Notes to Consolidated Financial
Statements for financial information about the Fluids Division.
Production Testing Division
Our Production Testing Division provides frac flowback services, early production facilities and services, production well testing services, offshore rig cooling services, and other associated services, including well flow management and evaluation services that enable operators to quantify oil and gas reserves, optimize oil and gas production and minimize oil and gas reservoir damage. In certain gas-producing basins, water, sand and other abrasive materials commonly accompany the initial production of natural gas, often under high-pressure and high-temperature conditions and, in some cases, from reservoirs containing high levels of hydrogen sulfide gas. The Production Testing Division provides the specialized equipment and qualified personnel to address these impediments to production. Early production services typically include sophisticated evaluation techniques for reservoir management, including unconventional shale reservoir exploitation and optimization of well workover programs. Frac flowback and production well testing services may include well control, well cleanup and laboratory analysis. These services are utilized in the completion process after hydraulic fracturing and in the production phase of oil and gas wells.
Our Production Testing Division maintains one of the largest fleets of high-pressure production testing
equipment in the United States, including equipment designed to work in environments where high levels of hydrogen sulfide gas are present. The division has domestic operating locations in Colorado, Louisiana, North Dakota, Oklahoma, Pennsylvania, Texas, West Virginia, and Wyoming. The division also has locations in Canada, and in certain countries in South America, Europe, Africa, and the Middle East. Production Testing operations in Canada are provided through our subsidiary, Greywolf Energy Services ("Greywolf").
4
Through our Optima Solutions Holdings Limited subsidiary ("OPTIMA"), the Production Testing Division is a provider of offshore oil and gas rig cooling services and associated products that suppress heat generated by high rate flaring of hydrocarbons during offshore oil and gas well test operations.
See “Note Q - Industry Segments and Geographic Information” in the Notes to Consolidated Financial Statements for financial information about the Production Testing Division.
Compression Division
Our Compression Division is a provider of compression services and equipment for natural gas and oil production, gathering, transportation, processing, and storage. The Compression Division fabricates and sells standard and custom-designed compressor packages, as well as oilfield fluid pump systems, and provides aftermarket services and compressor package parts and components manufactured by third-party suppliers. The majority of the Compression Division’s service compression fleet is monitored 24/7 via satellite telemetry from Fleet Reliability Centers (FRC) located at The Woodlands, Texas-based corporate office and the Midland, Texas-based packaging facility. The Compression Division provides its compression services and equipment to a broad base of natural gas and oil exploration and production, midstream, transmission and storage companies operating throughout many of the onshore producing regions of the United States, Canada and Mexico, as well as certain countries in South America.
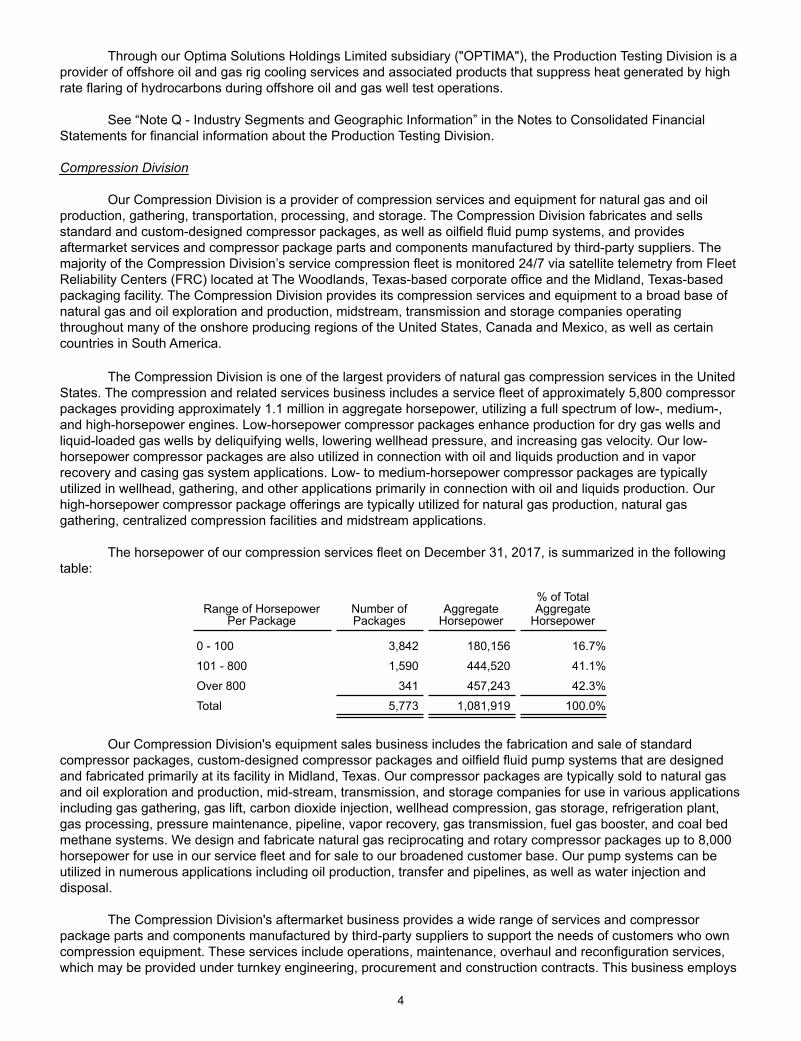
The Compression Division is one of the largest providers of natural gas compression services in the United States. The compression and related services business includes a service fleet of approximately 5,800 compressor packages providing approximately 1.1 million in aggregate horsepower, utilizing a full spectrum of low-, medium-, and high-horsepower engines. Low-horsepower compressor packages enhance production for dry gas wells and liquid-loaded gas wells by deliquifying wells, lowering wellhead pressure, and increasing gas velocity. Our low-horsepower compressor packages are also utilized in connection with oil and liquids production and in vapor recovery and casing gas system applications. Low- to medium-horsepower compressor packages are typically utilized in wellhead, gathering, and other applications primarily in connection with oil and liquids production. Our high-horsepower compressor package offerings are typically utilized for natural gas production, natural gas gathering, centralized compression facilities and midstream applications.
The horsepower of our compression services fleet on December 31, 2017, is summarized in the following table:
Range of HorsepowerPer Package
Number ofPackages
AggregateHorsepower
% of Total Aggregate
Horsepower
0 - 100 3,842 180,156 16.7%
101 - 800 1,590 444,520 41.1%
Over 800 341 457,243 42.3%
Total 5,773 1,081,919 100.0%
Our Compression Division's equipment sales business includes the fabrication and sale of standard compressor packages, custom-designed compressor packages and oilfield fluid pump systems that are designed and fabricated primarily at its facility in Midland, Texas. Our compressor packages are typically sold to natural gas and oil exploration and production, mid-stream, transmission, and storage companies for use in various applications including gas gathering, gas lift, carbon dioxide injection, wellhead compression, gas storage, refrigeration plant, gas processing, pressure maintenance, pipeline, vapor recovery, gas transmission, fuel gas booster, and coal bed methane systems. We design and fabricate natural gas reciprocating and rotary compressor packages up to 8,000 horsepower for use in our service fleet and for sale to our broadened customer base. Our pump systems can be utilized in numerous applications including oil production, transfer and pipelines, as well as water injection and disposal.
The Compression Division's aftermarket business provides a wide range of services and compressor package parts and components manufactured by third-party suppliers to support the needs of customers who own compression equipment. These services include operations, maintenance, overhaul and reconfiguration services, which may be provided under turnkey engineering, procurement and construction contracts. This business employs

5
factory trained sales and support personnel in most of the major oil- and natural gas-producing basins in the United States to perform these services.
Virtually all of our Compression Division's operations are conducted through our partially owned subsidiary, CSI Compressco LP ("CCLP"). Through our wholly owned subsidiary, CSI Compressco GP Inc., we manage and control CCLP, and accordingly, we consolidate CCLP results of operation in our consolidated results of operation. As of December 31, 2017, common units held by the public represented approximately a 60% common unit ownership interest in CCLP.
See “Note Q - Industry Segments and Geographic Information” in the Notes to Consolidated Financial Statements for financial information about the Compression Division.
Offshore Division
Our Offshore Division consists of two operating segments: Offshore Services and Maritech. On March 1, 2018, we closed a series of related transactions that resulted in the disposition of these two businesses. Pursuant to an Asset Purchase and Sale Agreement (the "Maritech Asset Purchase Agreement") with Orinoco Natural Resources, LLC ("Orinoco") Orinoco purchased certain offshore oil, gas and mineral leases and related assets of Maritech (the "Maritech Properties"). Immediately thereafter, we closed a Membership Interest Purchase and Sale Agreement (the "Maritech Equity Purchase Agreement") with Orinoco, whereby Orinoco purchased all of the equity interests of Maritech (the "Maritech Equity Interests"). Immediately thereafter, we closed an Equity Interest Purchase Agreement (the "Offshore Services Purchase Agreement") with Epic Offshore Specialty, LLC, an affiliate of Orinoco ("Epic Offshore"), whereby Epic Offshore purchased (the "Offshore Services Sale") all of the equity in TSB Offshore, Inc. and TETRA Applied Technologies, LLC, which owns all of the equity interests in Epic Diving & Marine Services, LLC, which are the wholly owned subsidiaries that comprise our Offshore Services segment operations (the "Offshore Services Equity Interests").
Under the terms of the Maritech Asset Purchase Agreement, the Maritech Equity Purchase Agreement, and the Offshore Services Purchase Agreement, the consideration delivered by Orinoco and Epic Offshore for the Maritech Properties, the Maritech Equity Interests and the Offshore Services Equity Interests consisted of (i) the assumption by Orinoco of all of the liabilities and obligations relating to the ownership, operation and condition of the Maritech Properties and the provision of certain indemnities by Orinoco to us under the Maritech Asset Purchase Agreement, (ii) the assumption by Orinoco of all of the liabilities of Maritech and the provision of certain indemnities by Orinoco under the Maritech Equity Purchase Agreement, (iii) the assumption by Epic Offshore of substantially all of the liabilities of the Offshore Services Equity Interests relating to the periods following the closing of the Offshore Services Sale and the provision of certain indemnities by Epic Offshore under the Offshore Services Purchase Agreement, (iv) cash in the amount $3.1 million which is equal to the value of the fuel in the vessels owned by Offshore Services as of the closing plus the value (determined to be sixty percent of the amount paid by Offshore Services therefore) of all usable spare parts and supply inventory of Offshore Services, (v) a promissory note in the original principal amount of $7.5 million payable by Epic Offshore to us in full, together with interest at a rate of 1.52% per annum, on December 31, 2019, (vi) performance by Orinoco under a Bonding Agreement executed in connection with the Maritech Asset Purchase Agreement and the Maritech Equity Purchase Agreement whereby Orinoco provided at closing non-revocable performance bonds in an amount equal to $46.8 million to cover the performance by Orinoco and Maritech of the asset retirement obligations of Maritech, to be replaced within 90 days of the closing with non-revocable performance bonds, meeting certain requirements, in the sum of $47.0 million, and (vii) the delivery of a personal guaranty agreement from Thomas M. Clarke and Ana M. Clarke guaranteeing the payment obligations of Orinoco under the Bonding Agreement (collectively, the "Transaction Consideration"). See "Note C - Acquisitions and Dispositions" in the Notes to Consolidated Financial Statements for financial information about the February 2018 sale of the Offshore Division.
As a result of these transactions, we have effectively exited the businesses of our Offshore Services and Maritech segments.
Offshore Services Segment. The Offshore Services segment provided: (1) downhole and subsea services, such as well plugging and abandonment and inspection, repair and maintenance services; (2) decommissioning and certain construction services utilizing heavy lift barges and various cutting technologies with regard to offshore oil and gas production platforms and pipelines; and (3) conventional and saturation diving services. We provided these services to offshore oil and gas operators, primarily in the U.S. Gulf of Mexico. We offered comprehensive integrated services, including individualized engineering consultation and project management services.

6
Maritech Segment. The Maritech segment was a limited oil and gas production operation in the offshore U.S. Gulf of Mexico. During 2011 and the first quarter of 2012, Maritech sold substantially all of its proved reserves. Subsequent to these sales of proved reserves, Maritech’s remaining operations consisted primarily of the ongoing abandonment and decommissioning of its remaining offshore wells, facilities and production platforms. As part of the sale of our Offshore Division in March 2018, Orinoco purchased Maritech and its remaining oil and gas leases and assumed all of Maritech's abandonment and decommissioning obligations.
The sales of substantially all of Maritech’s oil and gas producing properties during 2011 and 2012
essentially removed us from the oil and gas exploration and production business, and significantly all of Maritech’s oil and gas acquisition, development and exploitation activities ceased. Since the sales of its proved reserves, Maritech’s remaining oil and gas reserves and production were negligible. Prior to March 1, 2018, Maritech’s operations consisted primarily of the well abandonment and decommissioning of its remaining offshore oil and gas platforms and facilities. During the three year period ended December 31, 2017, Maritech spent approximately $14.9 million on such efforts. Approximately $46.7 million of Maritech decommissioning liabilities remained as of December 31, 2017, and such liabilities were assumed by Orinoco as part of the sale of the Offshore Division.
Maritech’s decommissioning liabilities are established based on what it estimates a third party would charge to plug and abandon the wells, decommission the pipelines and platforms, and clear the sites associated with its properties. For a further discussion of Maritech’s historical adjustments to its decommissioning liabilities, see “Note I - Decommissioning and Other Asset Retirement Obligations” in the Notes to Consolidated Financial Statements.
See “Note Q - Industry Segments and Geographic Information” in the Notes to Consolidated Financial
Statements for financial information about the Offshore Division.
Sources of Raw Materials Our Fluids Division manufactures calcium chloride, calcium bromide, zinc bromide, zinc calcium bromide,
and sodium bromide for sale to its customers. The Fluids Division also recycles used calcium bromide and zinc bromide CBFs repurchased from its oil and gas customers.
The Fluids Division manufactures liquid calcium chloride, either from underground brine or by reacting
hydrochloric acid with limestone. The Fluids Division also purchases liquid and dry calcium chloride from a number of U.S. and foreign chemical manufacturers. Our El Dorado, Arkansas, plant produces liquid and flake calcium chloride and sodium chloride, utilizing underground brine (tail brine) obtained from Lanxess AG ("Lanxess," which acquired Chemtura Corporation during 2017) that contains calcium chloride and sodium chloride. We also produce calcium chloride and sodium chloride at our two facility locations in San Bernardino County, California, by solar evaporation of pumped underground brine reserves that contain calcium chloride. The underground reserves of this brine are deemed adequate to supply our foreseeable need for calcium chloride at those plants.
The Fluids Division's primary sources of hydrochloric acid are co-product streams obtained from chemical
manufacturers. Substantial quantities of limestone are also consumed when converting hydrochloric acid into calcium chloride. Currently, hydrochloric acid and limestone are generally available from multiple sources.
To produce calcium bromide, zinc bromide, zinc calcium bromide, and sodium bromide at our West
Memphis, Arkansas, facility, we use bromine, hydrobromic acid, zinc and lime as raw materials. There are multiple sources of zinc that we can use in the production of zinc bromide and zinc calcium bromide. We have a long-term supply agreement with Lanxess, under which the Fluids Division purchases its requirements of raw material bromine from Lanxess’s Arkansas bromine facilities. In addition, we have a long-term agreement with Lanxess under which Lanxess supplies the Fluids’ El Dorado, Arkansas, calcium chloride plant with raw material tail brine from its Arkansas bromine production facilities.
We also own a calcium bromide manufacturing plant near Magnolia, Arkansas, which was constructed in
1985. This plant was acquired in 1988 and is not operable. We currently lease approximately 30,000 gross acres of bromine-containing brine reserves in the vicinity of this plant. While this plant is designed to produce calcium bromide, it could be modified to produce elemental bromine or select bromine compounds. Development of the brine field, construction of necessary pipelines and reconfiguration of the plant would require a substantial capital investment. The long-term Lanxess bromine supply agreement discussed above provides us with a secure supply
7
of bromine to support the division’s current operations. We do, however, continue to evaluate our strategy related to the Magnolia, Arkansas, assets and their future development. Lanxess has certain rights to participate in future development of the Magnolia, Arkansas assets.
The Fluids and Production Testing Divisions purchase their water management, production testing, and rig
cooling equipment and components from third-party manufacturers. CCLP designs and fabricates its reciprocating and rotary screw compressor packages and pumps with components obtained from third party suppliers. These components represent a significant portion of the cost of the compressor packages and pump systems. Some of the components used in the assembly of compressor packages, well monitoring, sand separation, production testing, and rig cooling equipment are obtained from a single supplier or a limited group of suppliers. We do not have long-term contracts with these suppliers or manufacturers. Should we experience unavailability of the components we use to assemble our equipment, we believe there are adequate alternative suppliers and any impact to us would not be severe. CCLP occasionally experiences long-lead times for components from suppliers and, therefore, may at times make purchases in anticipation of future orders.
Market Overview and Competition
Our operations are significantly dependent upon the demand for, and production of, natural gas and oil in the various domestic and international locations in which we operate. Beginning in 2014, and continuing throughout most of 2016, reduced prices of natural gas and oil led to declines in our customers' drilling activities and capital expenditure levels in the domestic and international markets in which we operate. The decline in activity in the natural gas and oil exploration and production industry resulted in reduced demand for certain of our products and services compared to early 2014 levels. With the increase in oil and gas pricing that continued throughout most of 2017 and early 2018, we are seeing indicators of improving demand in the North America and international markets, while offshore activity remains flat year-over-year.
Fluids Division Our Fluids Division provides its products and services to oil and gas exploration and production
companies in the United States and certain foreign markets, and to other customers that service such companies. Current areas of market presence include the onshore U.S., the U.S. Gulf of Mexico, the North Sea, Mexico, and certain countries in South America, Europe, Asia, the Middle East and Africa. Customers with deepwater operations frequently utilize high volumes of CBFs, which can be subject to harsh downhole conditions, such as high pressure and high temperatures. Demand for CBF products offshore is generally driven by completion activity.
Since 2014, there has been increased industry demand for onshore water management services in
unconventional shale gas and oil reservoirs in connection with hydraulic fracturing operations. However, beginning in 2015, demand for certain Fluids Division products and services, particularly water management services, was adversely affected by declining oil and natural gas pricing and customer budgetary constraints. Throughout 2017, demand for our North American onshore water management services increased as oil and natural gas prices rose. The Fluids Division provides water management services to a wide-range of onshore oil and gas operators located in all active North America unconventional oil and gas basins. The acquisition of SwiftWater expands our market share in the Permian Basin, which is one of the fastest growing basins for oilfield services globally, by adding significant capacity as well as incremental products and services, with nominal customer overlap.
Our Fluids Division’s principal competitors in the sale of CBFs to the oil and gas industry are Baker Hughes,
Baroid, a subsidiary of Halliburton, and M-I Swaco, a subsidiary of Schlumberger. This market is highly competitive, and competition is based primarily on service, availability, and price. Major customers of the Fluids Division include Anadarko, Chesapeake, Chevron, ConocoPhillips, Devon Energy, Encana, EOG Resources, ExxonMobil, Halliburton, LLOG Exploration, Oklahoma Energy Corp., Petrobras, Pioneer Natural Resources, Saudi Aramco, Schlumberger, Shell, Southwestern Energy, Total, Tullow, W & T Offshore, and YPF. The Fluids Division also sells its CBF products through various distributors. Competitors for the division’s water management services include large, multinational providers as well as small, privately owned operators.
Our liquid and dry calcium chloride products have a wide range of uses outside the energy industry. Non-
energy market segments where these products are used include water treatment, industrial, food processing, road maintenance, ice melt, agricultural, and consumer products. We also sell sodium bromide into industrial water treatment markets as a biocide under the BioRid® tradename. Most of these markets are highly competitive. The Fluids Division’s European calcium chloride operations market our calcium chloride products to certain European

8
markets. Our principal competitors in the non-energy related calcium chloride markets include Occidental Chemical Corporation and Vitro in North America and NedMag in Europe. Production Testing Division
Our Production Testing Division provides frac flowback services, early production facilities and services, production well testing services, offshore rig cooling services, and other associated services in various onshore domestic and international locations. The Production Testing Division serves all active North America unconventional oil and gas basins. Through Greywolf, the division serves the western Canada market. In addition, through our OPTIMA subsidiary, the Production Testing Division offers offshore oil and gas rig cooling services and associated products that suppress heat generated by high-rate flaring of hydrocarbons during offshore well testing operations. OPTIMA primarily serves markets in the North Sea, Asia-Pacific, the Middle East and South America.
The U.S. and Canadian production testing markets are highly competitive, and competition is based on availability of appropriate equipment and qualified personnel, as well as price, quality of service, and safety record. We believe that our skilled personnel, operating procedures and safety record give us a competitive advantage. Competition in onshore U.S. and Canadian production testing markets is primarily dominated by numerous small, privately owned operators. Expro International, Halliburton, and Schlumberger, are major competitors in the foreign markets we serve although, we provide these services to their customers on a subcontract basis from time to time. The major customers for this division include Chevron, ConocoPhillips, Eclipse Resources, Encana, EP Energy, EQT, Expro, Peyto, Pioneer Natural Resources, Range Resources, Rice Energy, Saudi Aramco, Schlumberger, Shell, and Vantage Energy.
Compression Division
The Compression Division provides its products and services to a broad base of natural gas and oil exploration and production, midstream, pipeline transmission, and storage companies, operating throughout many of the onshore producing regions of the United States. The Compression Division also has operations in Latin America and other foreign regions. While most of the Compression Division's services are performed throughout Texas, the San Juan Basin, the Rocky Mountain region and the Midcontinent region of the United States, we also have a presence in other U.S. producing regions. The Compression Division continues to seek opportunities to further expand its operations into other regions in the U.S. and elsewhere in the world.
This division’s strategy is to compete on the basis of superior services at a competitive price. The Compression Division believes that it is competitive because of the significant increases in the value that results from the use of its services, its superior customer service, its highly trained field personnel and the quality of the compressor packages it uses to provide services. The Compression Division’s major customers include Anadarko, Cimarex Energy, ConocoPhillips, Denbury Onshore, and Targa Resources.
The compression services and compressor package fabrication business is highly competitive. Certain of the Compression Division's competitors may be able to more quickly adapt to changes within the compression industry and changes in economic conditions as a whole, more readily take advantage of available opportunities and adopt more aggressive pricing policies. Primary competition for our low-horsepower compression services business comes from various local and regional companies that utilize packages consisting of a screw compressor with a separate engine driver or a reciprocating compressor with a separate engine driver. These local and regional competitors tend to compete with us on the basis of price as opposed to our focus on providing production enhancement value to the customer. Competition for the mid- and high-horsepower compression services business comes primarily from large national and multinational companies that may have greater financial resources than ours. Such competitors include ArchRock, AXIP Energy Services, CDM Resource Management, Exterran, J-W Power, and USA Compression. Our competition in the standard compressor package fabrication and sales market includes several large companies and a large number of small, regional fabricators, including some of those who we compete with for compression services, as well as AG Equipment Company, Enerflex, SEC Energy Products & Services, and others. The Compression Division's competition in the custom-designed compressor package market usually consists of larger companies that have the ability to address integrated projects and provide product support after the sale. The ability to fabricate these large custom-designed packages at the Compression Division's facilities, which is near the point of end-use of many customers, is often a competitive advantage.
9
Offshore Division
Offshore Services Segment. Demand for the Offshore Services segment’s offshore well abandonment and decommissioning services in the Gulf of Mexico is primarily driven by the maturity and decline of producing fields, aging offshore platform infrastructure, damage to platforms and pipelines from hurricanes and other windstorms, and government regulations, among other factors. Demand for the Offshore Services segment’s construction and other services is driven by the general level of offshore activity of its customers, which is affected by oil and natural gas prices and government regulation. Offshore activities in the Gulf of Mexico are seasonal, with the majority of work occurring during the months of April through October when weather conditions are most favorable. Critical factors required to compete in this market include, among other factors: (i) the proper equipment, including vessels and heavy lift barges; (ii) qualified, experienced personnel; (iii) technical expertise to address varying downhole, surface and subsea conditions, particularly those related to damaged wells and platforms; and (iv) a comprehensive health, safety and environmental program. Our Offshore Services segment's fleet of owned equipment includes two heavy lift derrick barges, the TETRA Hedron, which has a 1,600-metric-ton lift capacity, fully revolving crane and the TETRA Arapaho, which has a 725-metric-ton lift capacity. We believe that the integrated services that we offer and our vessel and equipment fleets satisfy current market requirements in the Gulf of Mexico and allow us to successfully compete in that market.
The Offshore Services segment markets its services primarily to major oil and gas companies and
independent operators. One of the Offshore Services segment’s most significant customers historically has been Maritech; however, the amount of work performed for Maritech has been reduced in recent years and the amount of work to be performed in the future for Maritech is expected to continue to decline. Major customers include, Fieldwood Energy, Shell, Stone Energy, Talos Energy, and W&T Offshore. The Offshore Services segment’s services are performed primarily in the U.S. Gulf of Mexico, however, the segment has provided services in the Mexican Gulf of Mexico and in the Asia-Pacific region and is seeking to expand its operations to international markets. Our principal competitors in the U.S. Gulf of Mexico market are Chet Morrison Contractors, Manson Gulf, Montco Oilfield Contractors, Oceaneering, Ranger Offshore, and Superior Energy Services, Inc. This market is highly competitive, and competition is based primarily on service, equipment availability, safety record, and price.
No single customer provided 10% or more of our total consolidated revenues during the year ended December 31, 2017.
Other Business Matters Backlog
The Compression Division’s equipment sales business consist of the fabrication and sale of standard
compressor packages, custom-designed compressor packages, and oilfield fluid pump systems that are fabricated to customer specifications and standard specifications, as applicable. The Division's custom-designed compressor packages are typically greater in size and complexity than standard fabrication packages, requiring more labor, materials, and overhead resources. This business requires diligent planning of those resources and project and backlog management in order to meet the customers' desired delivery dates and performance criteria, and achieve fabrication efficiencies. As of December 31, 2017, the Compression Division's equipment sales backlog was $47.5 million, all of which is expected to be recognized in 2018, based on title passing to the customer, the customer assuming the risks of ownership, reasonable assurance of collectability, and delivery occurring as directed by our customer. This backlog consists of firm customer orders for which a purchase or work order has been received, satisfactory credit or financing arrangements exist, and delivery has been scheduled. This backlog is a measure of marketing effectiveness that allows us to plan future labor and raw material needs and to measure our success in winning bids from our customers. Following a record single $66.7 million sales order received from a customer in early 2018, the Compression Division's equipment sales backlog has further increased significantly after December 31, 2017.
Other than these Compression Division operations, our products and services generally are either not sold under long-term contracts or do not require long lead times to procure or deliver.
Employees
As of December 31, 2017, we had approximately 2,600 employees. None of our U.S. employees are
presently covered by a collective bargaining agreement. Our foreign employees are generally members of labor
10
unions and associations in the countries in which they are employed. We believe that our relations with our employees are good.
Patents, Proprietary Technology and Trademarks
As of December 31, 2017, we owned or licensed fifty-six (56) issued U.S. patents and had seven (7) patent
applications pending in the United States. Twenty five (25) of the U.S. patents and the seven (7) patent applications pending in the U.S. are held by our Offshore Services segment, which was disposed in March 2018. We also had forty-five (45) owned or licensed patents and seven (7) patent applications pending in various other countries. Eight (8) of the foreign patents and one of the foreign patent applications are held by our Offshore Services segment. The foreign patents and patent applications are primarily foreign counterparts to certain of our U.S. patents or patent applications. The issued patents expire at various times through 2035. We have elected to maintain certain other internally developed technologies, know-how, and inventions as trade secrets. While we believe that our patents and trade secrets are important to our competitive positions in our businesses, we do not believe any one patent or trade secret is essential to our success.
It is our practice to enter into confidentiality agreements with key employees, consultants and third parties
to whom we disclose our confidential and proprietary information, and we have typical policies and procedures designed to maintain the confidentiality of such information. There can be no assurance, however, that these measures will prevent the unauthorized disclosure or use of our trade secrets and expertise, or that others may not independently develop similar trade secrets or expertise.
We sell various products and services under a variety of trademarks and service marks, some of which are
registered in the United States or other countries.
Health, Safety, and Environmental Affairs Regulations We believe that our service and sales operations and manufacturing plants are in substantial compliance
with all applicable U.S. and foreign health, safety, and environmental laws and regulations. We are committed to conducting all of our operations under the highest standards of safety and respect for the environment. However, risks of substantial costs and liabilities are inherent in certain of our operations and in the development and handling of certain products and equipment produced or used at our plants, well locations, and worksites. Because of these risks, there can be no assurance that significant costs and liabilities will not be incurred in the future. Changes in environmental and health and safety regulations could subject us to more rigorous standards. We cannot predict the extent to which our operations may be affected by future regulatory and enforcement policies.
We are subject to various federal, state, local, and foreign laws and regulations relating to health, safety, and the environment, including regulations regarding air emissions, wastewater and storm water discharges, and the disposal of certain hazardous and nonhazardous wastes. Compliance with laws and regulations may expose us to significant costs and liabilities, and cause us to incur significant capital expenditures in our operations. Failure to comply with these laws and regulations or associated permits may result in the assessment of fines and penalties and the imposition of other obligations.
Our operations in the United States are subject to various evolving environmental laws and regulations that
are enforced by the U.S. Environmental Protection Agency ("EPA"); the Bureau of Safety and Environmental Enforcement ("BSEE") of the U.S. Department of the Interior; the U.S. Coast Guard; and various other federal, state, and local environmental authorities. Similar laws and regulations, designed to protect the health and safety of our employees and visitors to our facilities, are enforced by the U.S. Occupational Safety and Health Administration, and other state and local agencies and authorities. Specific environmental laws and regulations applicable to our operations include: (i) the Federal Water Pollution Control Act of 1972; (ii) the Resource Conservation and Recovery Act of 1976; (iii) the Clean Air Act of 1977; (iv) the Comprehensive Environmental Response, Compensation and Liability Act of 1980 ("CERCLA"); (v) the Superfund Amendments and Reauthorization Act of 1986; (vi) the Federal Insecticide, Fungicide, and Rodenticide Act of 1947; (vii) the Toxic Substances Control Act of 1976; (viii) the Hazardous Materials Transportation Act of 1975; (ix) and the Pollution Prevention Act of 1990. Our operations outside the United States are subject to various foreign governmental laws and regulations relating to the environment, health and safety, and other regulated activities in the countries in which we operate.
We routinely deal with natural gas, oil, and other petroleum products. Hydrocarbons or other hazardous
wastes may have been released during our operations or by third parties on wellhead sites where we provide
11
services or store our equipment or on or under other locations where wastes have been taken for disposal. These properties may be subject to investigatory, remediation, and monitoring requirements under foreign, federal, state, and local environmental laws and regulations.
The U.S. Environmental Protection Agency (the “EPA”) has adopted regulations under the Clean Air Act to control emissions of hazardous air pollutants from reciprocal internal combustion engines and more recently the EPA adopted regulations that establish air emission controls for natural gas and natural gas liquids production, processing and transportation activities, including New Source Performance Standards as well as emission standards to address hazardous air pollutants. Certain CSI compressors are subject to these new requirements and additional control equipment and maintenance operations are required. While we do not believe that compliance with current regulatory requirements will have a material adverse effect on the business, additional regulations could impose new air permitting or pollution control requirements on our equipment that could require us to incur material costs.
The modification or interpretation of existing environmental laws or regulations, the more vigorous enforcement of existing environmental laws or regulations, or the adoption of new environmental laws or regulations may also adversely affect oil and natural gas exploration and production, which in turn could have an adverse effect on us.
We maintain various types of insurance intended to reimburse us for certain costs in the event of an accident, including an explosion or similar event involving our offshore operations. Our insurance program is reviewed not less than annually with our insurance brokers and underwriters. As part of our insurance program for offshore operations, we maintain Commercial General Liability, Protection and Indemnity, and Excess Liability policies that provide third-party liability coverage, including but not limited to death and personal injury, collision, damage to property including fixed and floating objects, pollution, and wreck removal up to the applicable policy limits. Additionally, related to our Offshore Services operations which we disposed in March 2018, we maintained a vessel pollution liability policy that provides coverage for oil or hazardous substance pollution emanating from a vessel, addressing both Oil Pollution Act of 1990 ("OPA") and CERCLA obligations. This policy also provides coverage for cost of defense, and limited coverage for fines, and penalties up to the applicable policy limits.
We provided services and products to customers in the Gulf of Mexico, generally pursuant to written master services agreements that created insurance and indemnity obligations for both parties. Following the March 2018 sale of our Offshore Division, Orinoco has assumed substantially all of the liabilities of our Offshore Division.
Item 1A. Risk Factors. Certain Business Risks
Although it is not possible to identify all of the risks we encounter, we have identified the following
significant risk factors that could affect our actual results and cause actual results to differ materially from any such results that might be projected, forecasted, or estimated by us in this report.
Market Risks
The demand and prices for our products and services are affected by several factors, including the supply,
demand, and prices for oil and natural gas.
Demand for our services and products is particularly sensitive to the level of exploration, development, and production activity of, and the corresponding capital spending by, oil and natural gas companies. The level of exploration, development, and production activity is directly affected by trends in oil and natural gas prices, which historically have been volatile and are likely to continue to be volatile. Prices for oil and natural gas are subject to large fluctuations in response to relatively minor changes in the supply of and demand for oil and natural gas, market uncertainty, and a variety of other economic factors that are beyond our control. Crude oil prices have fluctuated significantly since 2014, with West Texas Intermediate (WTI) oil spot prices declining from a high of $108 per barrel in June 2014 to a low of $26.19 per barrel in February 2016, a level which has not been experienced since 2003. Although crude oil prices have increased during the second half of 2017 and early 2018 with a high of $66.14 per barrel in January 2018, the volatility of crude oil prices continues
12
to be high. For more information, see “Management’s Discussion and Analysis of Financial Condition and Results of Operations - Business Environment and Results of Operations.”
The prolonged reduction in oil and natural gas prices depressed levels of exploration, development, and production activity in 2015 and 2016, and if current oil and natural gas prices decrease, they could have a material adverse effect on our business, consolidated results of operations, and consolidated financial condition. Should current market conditions worsen for an extended period of time, we may be required to record additional asset impairments. Such potential impairment charges could have a material adverse impact on our operating results. Even the perception of longer-term lower oil and natural gas prices by oil and natural gas companies can similarly reduce or defer major expenditures given the long-term nature of many large-scale development projects.
Factors affecting the prices of oil and natural gas include: the level of supply and demand for oil and natural gas; governmental regulations, including the policies of governments regarding the exploration for and production and development of their oil and natural gas reserves; weather conditions and natural disasters; worldwide political, military, and economic conditions; the ability or willingness of the Organization of Petroleum Exporting Countries (OPEC) to set and maintain oil production levels; the levels of oil production by non-OPEC countries; oil refining capacity and shifts in end-customer preferences toward fuel efficiency and the use of natural gas; the cost of producing and delivering oil and natural gas; and potential acceleration of the development of alternative fuels.
We encounter, and expect to continue to encounter, intense competition in the sale of our products and services.
We compete with numerous companies in each of our operating segments, many of which have
substantially greater financial and other resources than we have. Certain of our competitors have lower standards of quality and older equipment and safety, and offer services at lower prices than we do. Other competitors have newer equipment that is better suited to our customers' needs. Particularly during a period of low oil and natural gas pricing, to the extent competitors offer products or services at lower prices or higher quality, or more cost-effective products or services, our business could be materially and adversely affected. In addition, certain of our customers may elect to perform services internally in lieu of using our services, which could also materially and adversely affect our operations.
The profitability of our operations is dependent on other numerous factors beyond our control. Our operating results in general, and gross profit in particular, are determined by market conditions and the
products and services we sell in any period. Other factors, such as heightened competition, changes in sales and distribution channels, availability of skilled labor and contract services, shortages in raw materials, or inability to obtain supplies at reasonable prices, may also affect the cost of sales and the fluctuation of gross margin in future periods.
Other factors affecting our operating results and activity levels include oil and natural gas industry spending
levels for exploration and production, development, and acquisition activities, and impairments of long-lived assets. Several of our customers reduced their capital expenditures during 2016 and 2017 in light of the significant declines in the prices of oil and natural gas, and such reductions have had, and are expected to continue to have, a negative effect on the demand for many of our products and services. This has had, and is expected to continue to have, a negative effect on our revenues and results of operations. A large concentration of our operating activities is located in the onshore and offshore U.S. Gulf Coast region. Our revenues and profitability are particularly dependent upon oil and natural gas industry activity and spending levels in this region. Our operations may also be affected by technological advances, cost of capital, and tax policies. Adverse changes in any of these other factors may have a material adverse effect on our revenues and profitability.
Changes in the economic environment have resulted, and could further result, in further significant impairments of certain of our long-lived assets and goodwill.
During the first quarter of 2016, we recorded consolidated long-lived asset impairments (excluding goodwill
impairments) of approximately $10.7 million. During the fourth quarter of 2016, primarily as a result of the impact of significant decreases in oil and natural gas prices on certain of our long-lived assets, we recorded consolidated long-lived asset impairments of approximately $7.2 million. During the fourth quarter of 2017, consolidated long-lived asset impairments of approximately $14.9 million were recorded primarily due to the impairment of a certain
13
identified intangible asset resulting from decreased expected future operating cash flows from a Production Testing segment customer. During the two year period ending December 31, 2017, we have recorded a total of $33.0 million of long-lived asset impairments. Depressed commodity prices and/or adverse changes in the economic environment could result in a greater decrease in the demand for many of our products and services, which could impact the expected utilization rates of certain of our long-lived assets, including plant facilities, operating locations, barges and vessels, and other operating equipment. Under generally accepted accounting principles, we review the carrying value of our long-lived assets when events or changes in circumstances indicate that the carrying value of these assets may not be recoverable, based on their expected future cash flows. The impact of reduced expected future cash flow could require the write-down of all or a portion of the carrying value for these assets, which would result in additional impairments, resulting in decreased earnings.
During the two year period ending December 31, 2017, we have recorded a total of approximately $106.2
million of goodwill impairments. Following these goodwill impairments, as of December 31, 2017, our consolidated goodwill consists of the $6.6 million of goodwill attributed to our Fluids reporting unit. Under generally accepted accounting principles, we review the carrying value of our goodwill for possible impairment annually or when events or changes in circumstances indicate the carrying value may not be recoverable. Changes in circumstances indicating the carrying value of our goodwill may not be recoverable include a decline in our stock price or future cash flows and slower growth rates in our industry. If economic and market conditions decline, we may be required to record additional charges to earnings during the period in which any impairment of our goodwill is determined, resulting in a negative impact on our results of operations.
We are dependent on third-party suppliers for specific products and equipment necessary to provide certain of our products and services.
We sell a variety of clear brine fluids to the oil and gas industry and non-energy markets, including calcium
chloride, calcium bromide, zinc bromide, zinc calcium bromide, sodium bromide, and formate-based brines, some of which we manufacture and some of which are purchased from third parties. Sales of these products contribute significantly to our revenues. In our manufacture of calcium chloride, we use brines, hydrochloric acid, and other raw materials purchased from third parties. In our manufacture of brominated clear brine fluid products, we use elemental bromine, hydrobromic acid, and other raw materials that are purchased from third parties. We rely on Lanxess as a supplier of bromine for our brominated clear brine fluid products as well as tail brine for our El Dorado, Arkansas, calcium chloride plant. Although we have long-term supply agreements with Lanxess, if we were unable to acquire these raw materials at reasonable prices for a prolonged period, our business could be materially and adversely affected.
The fabrication of our compression packages, pump systems, and production testing, well monitoring, and rig cooling equipment requires the purchase of various components, some of which we obtain from a single source or a limited group of suppliers. Our reliance on these suppliers exposes us to the risk of price increases, inferior component quality, or an inability to obtain an adequate supply of required components in a timely manner. The profitability or future growth of our Compression and Production Testing Divisions may be adversely affected due to our dependence on these key suppliers.
Our success depends upon the continued contributions of our personnel, many of whom would be difficult to replace, and the continued ability to attract new employees.
Our success depends on our ability to attract, train, and retain skilled management and employees at
reasonable compensation levels. The delivery of our products and services requires personnel with specialized skills and experience. In addition, our ability to expand our operations depends in part on our ability to increase the size of our skilled labor force. The demand for skilled managers and workers in the U.S. Gulf Coast region and other regions in which we operate is high and the supply is limited. A lack of qualified personnel, could adversely affect operating results.
The demand for our products and services in the U.S. Gulf of Mexico could continue to be adversely impacted by increased regulation and continuing regulatory uncertainty.
Operations in the U.S. Gulf of Mexico have been subject to an increasingly stringent regulatory environment
including government regulations focused on offshore operating requirements, spill cleanup, and enforcement
14
matters. These regulations also implement additional safety and certification requirements applicable to offshore activities in the U.S. Gulf of Mexico. Demand for our products and services in the U.S. Gulf of Mexico continues to be affected by these regulations. Future regulatory requirements could delay our customers’ activities, reduce our revenues, and increase our operating costs, including the cost to insure offshore operations, resulting in reduced cash flows and profitability. Operating, Technological, and Strategic Risks
We may not fully realize the benefits from the SwiftWater acquisition. On February 28, 2018, pursuant to the SwiftWater Purchase Agreement dated February 13, 2018, we purchased all of the equity interests in SwiftWater, which is engaged in the business of providing water management and water solutions to oil and gas operators in the Permian Basin market of Texas.
We performed an inspection of SwiftWater's assets, which we believe to be generally consistent with industry practices. However, there could be unknown liabilities or other problems that are not necessarily observable even when the inspection is undertaken. If problems are identified after closing of the SwiftWater acquisition, the purchase agreement provides for limited recourse against the sellers.
We have technological and age-obsolescence risk, both with our products and services as well as with our equipment assets.
New drilling, completion, and production technologies and equipment are constantly evolving. If we are
unable to adapt to new advances in technology or replace older assets with new assets, we are at risk of losing customers and market share. In particular, many of our significant equipment assets, are approaching the end of their useful lives, which may adversely affect our ability to serve certain customers. Other equipment, such as a portion of our production testing equipment fleet, may be inadequate to meet the needs of our customers in certain markets. The permanent replacement or upgrade of any of our equipment will require significant capital. Due to the unique nature of many of these assets, finding a suitable or acceptable replacement may be difficult and/or cost prohibitive. The replacement or enhancement of these assets over the next several years may be necessary in order for us to effectively compete in the current marketplace.
We face risks related to our long-term growth strategy. Our long-term growth strategy includes both internal growth and growth through acquisitions. Internal
growth may require significant capital expenditures, some of which may become unrecoverable or fail to generate an acceptable level of cash flows. Internal growth also requires financial resources (including the use of available cash or additional long-term debt), management, and personnel resources. Acquisitions also require significant management resources, both at the time of the transaction and during the process of integrating the newly acquired business into our operations. If we overextend our current financial resources by growing too aggressively, we could face liquidity problems or have difficulty obtaining additional financing. Acquisitions could adversely affect our operations if we are unable to successfully integrate the newly acquired companies into our operations, are unable to hire adequate personnel, or are unable to retain existing personnel. We may not be able to consummate future acquisitions on favorable terms. Acquisition or internal growth assumptions developed to support our decisions could prove to be overly optimistic. Future acquisitions by us could result in issuances of equity securities or the rights associated with the equity securities, which could potentially dilute earnings per share. Future acquisitions could result in the incurrence of additional debt or contingent liabilities and amortization expenses related to intangible assets. These factors could adversely affect our future operating results and financial position.
Our operations involve significant operating risks and insurance coverage may not be available or cost-effective.
We are subject to operating hazards normally associated with the oilfield service industry, including
automobile accidents, fires, explosions, blowouts, formation collapse, mechanical problems, abnormally pressured formations, and environmental accidents. Environmental accidents could include, but are not limited to oil spills, gas leaks or ruptures, uncontrollable flows of oil, gas, or well fluids, or discharges of CBFs or toxic gases or other pollutants. These operating hazards may also include injuries to employees and third parties during the performance of our operations. Our operation of heavy equipment and chemical manufacturing plants involve particularly high levels of risk. In addition, certain of our former employees of the Offshore Services segment
15
performed services on offshore platforms and vessels and are covered by the provisions of the Jones Act, the Death on the High Seas Act, and general maritime law. These laws make the liability limits established by state workers’ compensation laws inapplicable to these employees and, instead, permit our affected employees or their representatives to pursue actions against us for damages for job-related injuries. Whenever possible, we obtained agreements from customers and suppliers that limit our exposure. However, the occurrence of certain operating hazards, including storms, could result in substantial losses to us due to injury or loss of life, damage to or destruction of property and equipment, pollution or environmental damage, and suspension of operations.
We have maintained a policy of insuring our risks of operational hazards that we believe is typical in the
industry. We believe that the limits of insurance coverage we have purchased are consistent with the exposures we face and the nature of our products and services. Due to economic conditions in the insurance industry, from time to time, we have increased our self-insured retentions for certain policies in order to minimize the increased costs of coverage, or we have reduced our limits of insurance coverage for, or not procured, named windstorm coverage. In certain areas of our business, we, from time to time, have elected to assume the risk of loss for specific assets. To the extent we suffer losses or claims that are not covered, or are only partially covered by insurance, our results of operations could be adversely affected.
Weather-Related Risks
Certain of our operations are seasonal and depend, in part, on weather conditions.
In certain markets, the Fluids Division’s onshore water management services can be dependent on adequate water supplies being available to its customers. To the extent severe drought or other weather-related conditions prevent our customers from obtaining needed water, frac water operations may not be possible and our Fluids Division business may be negatively affected.
Severe weather, including named windstorms, can cause damage and disruption to our businesses. A portion of our operations is susceptible to adverse weather conditions in the Gulf of Mexico, including
hurricanes and other extreme weather conditions. Even if we do not experience direct damage from storms, we may experience disruptions in our operations, because we are unable to operate or our customers or suppliers may curtail their activities due to damage to their wells, platforms, pipelines, and facilities. From time to time, our onshore operations are also negatively affected by adverse weather conditions, including sustained rain and flooding.
Financial Risks
Failure to comply with the financial ratios in our long-term debt agreements could result in defaults under those agreements.
As of December 31, 2017, our total long-term debt outstanding (excluding CCLP) of $117.7 million
consisted of the carrying amount of our 11% Senior Note, which was issued under our Amended and Restated Note Purchase Agreement dated as of July 1, 2016, as subsequently amended (the "Amended and Restated 11% Senior Note Agreement"). We currently have $0.0 million carrying amount outstanding under our credit agreement, as amended, with a syndicate of banks including JPMorgan Chase Bank, N.A. as administrative agent, which provides us with a secured revolving credit facility with a borrowing capacity of up to $200 million (subject to certain conditions) (the "Credit Agreement"). In addition, as of December 31, 2017 our consolidated balance sheet includes $512.2 million of long-term debt of CCLP, which consisted of (i) $224.0 million carrying amount under CCLP's credit agreement, dated as of August 4, 2014, as subsequently amended, with a syndicate of banks including Bank of America, N.A. as administrative agent, which provides CCLP with an asset-based revolving credit facility with a borrowing capacity of up to $315 million, subject to borrowing base requirements (the "CCLP Credit Agreement"), and (ii) $288.2 million carrying amount of CCLP's 7.25% Senior Notes due 2022 (the "CCLP 7.25% Senior Notes"), which were issued pursuant to an Indenture, dated as of August 4, 2014, with U.S. Bank National Association, as trustee (the "CCLP Indenture"). Debt service costs related to outstanding long-term debt represent a significant use of our operating cash flow and could increase our vulnerability to general adverse economic and industry conditions.

16
Each of the Credit Agreement and the Amended and Restated 11% Senior Note Agreement (collectively the "Long-Term Debt Agreements") contains covenants and other restrictions and requirements that, among other things, requires us to maintain certain financial ratios as of the end of each fiscal quarter. Deterioration of these ratios could result in a default under these agreements. Although our Long-Term Debt Agreements include cross-default provisions relating to each other and other indebtedness that we may incur that is greater than a defined amount, there are no cross default provisions, cross collateralization provisions, or cross guarantees between our Long-Term Debt Agreements and CCLP's Credit Agreement or the CCLP Indenture. If an event of default occurs under either of our Long-Term Debt Agreements and such event is not remedied in a timely manner, an event of default will occur under both of the Long-Term Debt Agreements. Any event of default, if not timely remedied, could result in a termination of all commitments of the lenders under the Credit Agreement, acceleration of all amounts owed thereunder and with regard to the 11% Senior Note, and foreclosure on the collateral securing both of the Long-Term Debt Agreements.
Following the Fifth Amendment to the Credit Agreement in December 2016, the financial ratios in the Credit Agreement include a minimum fixed charge coverage ratio (which is the ratio of a defined measure of earnings to interest, both measures over the trailing twelve months) of 1.25 to 1 and a maximum leverage ratio (which is the ratio of (i) outstanding debt under the Long-Term Debt Agreements and certain other obligations, including letters of credit outstanding, to (ii) a measure of our consolidated net earnings ("EBITDA"), all as defined in the Credit Agreement ) of (i) 5.00 to 1 at the end of the fiscal quarters ending during the period from and including March 31, 2017 through and including December 31, 2017, (ii) 4.75 to 1 at the end of the fiscal quarters ending March 31, 2018 and June 30, 2018, (iii) 4.50 to 1 at the end of the fiscal quarters ending September 30, 2018 and December 31, 2018, and (iv) 4.00 to 1 at the end of each of the fiscal quarters thereafter. EBITDA is defined in our Credit Agreement as the aggregate of our net income (or loss) and the net income (or loss) of our consolidated restricted subsidiaries (which excludes CCLP), including cash dividends and distributions (not the return of capital) received from persons (including CCLP) other than consolidated restricted subsidiaries and after allowances for taxes for such period determined on a consolidated basis in accordance with U.S. generally accepted accounting principles ("GAAP"), excluding certain items specifically described therein. This definition of consolidated net earnings excludes an amount of extraordinary and nonrecurring losses up to 25% of a measure of earnings. At December 31, 2016, our fixed charge coverage ratio was 3.05 to 1 and our leverage ratio was 1.66 to 1.
Under the Amended and Restated 11% Senior Note Agreement, the financial ratio requirements include a minimum fixed charge coverage ratio (which is identical to the minimum fixed charge coverage ratio under the Credit Agreement) of 1.25 to 1 and a maximum leverage ratio (which is identical to the maximum leverage ratio under the Credit Agreement) of (i) 5.00 to 1 at the end of the fiscal quarters ending during the period from and including March 31, 2017 through and including December 31, 2017, (ii) 4.75 to 1 at the end of the fiscal quarters ending March 31, 2018 and June 30, 2018, (iii) 4.50 to 1 at the end of the fiscal quarters ending September 30, 2018 and December 31, 2018, and (iv) 4.00 to 1 at the end of the fiscal quarters ending thereafter.
Our continuing ability to comply with covenants in our Long-Term Debt Agreements depends largely upon our ability to generate adequate earnings and operating cash flows. Due to the decreased demand for certain of our products and services by our customers in response to decreased oil and natural gas prices during 2015 and 2016, we reduced long-term debt from the use of equity offering proceeds took strategic cost reduction efforts, including headcount reductions, deferral of salary increases, salary reductions, benefit reductions, and other efforts to reduce costs and generate cash to mitigate the reduced demand for our products and services. We and CCLP are in compliance with all covenants of our respective long-term debt agreements as of December 31, 2017. Based on our financial forecasts as of March 2, 2018, which are based on certain operating and other business assumptions that we believe to be reasonable, we anticipate that, despite the current industry environment and activity levels, we will have sufficient liquidity, earnings and operating cash flows to maintain compliance with all covenants under our Long-Term Debt Agreements through March 2, 2019. However, there can be no assurance that the assumptions we have made will turn out to be accurate or that we will remain in compliance with these covenants going forward, and we could consequently be in default under our Long-Term Debt Agreements if we were unable to obtain a waiver or amendment from our lenders.
17
CCLP's failure to comply with the financial ratios in its long-term debt agreements could result in defaults under those agreements and reduced distributions to us.
The CCLP Credit Agreement provides CCLP with an asset-based revolving credit facility with a borrowing capacity of up to $315 million, subject to borrowing base requirements. As of December 31, 2017, CCLP's balance sheet includes $512.2 million of carrying value of long-term debt of CCLP consisting of (i) $224.0 million under the CCLP Credit Agreement and (ii) $288.2 million of CCLP 7.25% Senior Notes issued pursuant to the CCLP Indenture. Debt service costs related to CCLP's outstanding long-term debt represents a significant use of its operating cash flow and could increase its vulnerability to general adverse economic and industry conditions. Payment of CCLP's debt service obligations reduces cash available for distribution to its common unitholders, including us. Any breach of, or CCLP's inability to borrow under, the CCLP Credit Agreement, could impact CCLP's ability to fund distributions (if CCLP elected to do so), among other adverse impacts.
The CCLP Credit Agreement, as amended in May 2017, contains financial ratio covenants requiring CCLP to maintain (i) the consolidated total leverage ratio may not exceed (a) 5.95 to 1 as of March 31, 2017; (b) 6.75 to 1 as of June 30, 2017 and September 30, 2017; (c) 6.50 to 1 as of December 31, 2017 and March 31, 2018; (d) 6.25 to 1 as of June 30, 2018 and September 30, 2018; (e) 6.00 to 1 as of December 31, 2018; and (f) 5.75 to 1 as of March 31, 2019 and thereafter; and (ii) the consolidated secured leverage ratio may not exceed 3.25 to 1 as of the end of any fiscal quarter. The consolidated interest coverage ratio was not amended by the CCLP Fifth Amendment. In addition, the CCLP Fifth Amendment (i) increased the applicable margin by 0.25% in the event the consolidated total leverage ratio exceeds 6.00 to 1, resulting in a range for the applicable margin between 2.00% and 3.50% per annum for LIBOR-based loans and between 1.00% and 2.50% per annum for base-rate loans, depending on the consolidated total leverage ratio, and (ii) modified the appraisal delivery requirement from an annual requirement to a semi-annual requirement. In connection with the CCLP Fifth Amendment, the level of CCLP's cash distributions payable on its common units for the quarterly period ended June 30, 2017 will be limited to the current reduced level. The CCLP Fifth Amendment also included additional revisions that provide flexibility to CCLP for the issuance of preferred securities. At December 31, 2017, the CCLP consolidated total leverage ratio was 6.48 to 1 (compared to 6.50 to 1 maximum allowed under the CCLP Credit Agreement), its consolidated secured leverage ratio was 2.89 to 1 (compared to a 3.25 to 1 maximum ratio allowed under the CCLP Credit Agreement), and its interest coverage ratio was 2.55 to 1 (compared to a 2.25 to 1 minimum ratio required under the CCLP Credit Agreement).
Continued access to the CCLP Credit Agreement is dependent upon CCLP's compliance with the financial ratio covenants as well as the borrowing base and other provisions set forth in the CCLP Credit Agreement. The CCLP Credit Agreement contains additional restrictive provisions ("cash dominion provisions") that are imposed if an event of default has occurred and is continuing or "excess availability" falls below $30.0 million. The CCLP Credit Agreement provides that CCLP may make distributions to holders of its common units, but only if there is no default under the CCLP Credit Agreement and CCLP maintains excess availability of $30.0 million. CCLP's ability to comply with the covenants and restrictions contained in the CCLP Credit Agreement may be affected by events beyond its control, including prevailing economic, financial, and industry conditions. If market or other economic conditions deteriorate, CCLP's ability to comply with these covenants may be impaired. A failure to comply with the provisions of the CCLP Credit Agreement could result in an event of default. Upon an event of default, unless waived, the lenders under the CCLP Credit Agreement would have all remedies available to secured lenders and could elect to terminate their commitments, cease making further loans, require cash collateralization of letters of credit, cause their loans to become due and payable in full, institute foreclosure proceedings against CCLP or its subsidiaries’ assets, and force CCLP and its subsidiaries into bankruptcy or liquidation. If the payment of CCLP's debt is accelerated, its assets may be insufficient to repay such debt in full, and the holders of CCLP common units, including us, could experience a partial or total loss of their investment. An event of default by CCLP under the CCLP Credit Agreement may constitute an event of default under the CCLP 7.25% Senior Notes.
CCLP is in compliance with all covenants of the CCLP Credit Agreement as of December 31, 2017. As a result of the recent decreased demand and pricing for certain of CCLP's products and services by CCLP's customers in response to decreased oil and natural gas prices, CCLP reduced long-term debt from the use of the CCLP Preferred Units offering proceeds and taken strategic cost reduction efforts to reduce costs and generate cash. Based on CCLP's financial forecasts as of February 28, 2018, which are based on certain operating and other business assumptions that CCLP believes to be reasonable, CCLP anticipates that, despite the current industry environment and activity levels, it will have sufficient earnings and operating cash flows to maintain compliance with all covenants under the CCLP Credit Agreement through February 27, 2019. CCLP's plans and forecasts for 2018 include expectations that we will settle certain expenses owed to us by CCLP pursuant to an Omnibus Agreement previously entered into on June 20, 2011 (as amended, the "Omnibus Agreement") using CCLP common units in

18
lieu of cash. There can be no assurance that the assumptions CCLP made will turn out to be accurate or that CCLP will remain in compliance with these covenants going forward, and could consequently be in default under the CCLP Credit Agreement if it were unable to obtain a waiver or amendment from its lenders. Any such default under the CCLP Credit Agreement may constitute an event of default under the CCLP 7.25% Senior Notes. As a result, our cash flows could be further affected.
We have continuing exposure to abandonment and decommissioning obligations associated with oil and gas properties previously owned by Maritech.
From 2001 to 2012, Maritech sold oil and gas producing properties in numerous transactions to different
buyers. In connection with those sales, the buyers assumed the decommissioning liabilities associated with the properties sold (the "Legacy Liabilities") and generally became the successor operator. Some buyers of these Maritech properties subsequently sold certain of these properties to other buyers, who also assumed the financial responsibilities associated with the properties' operations, and these buyers also typically became the successor operator of the properties. To the extent that a buyer of these properties fails to perform the abandonment and decommissioning work required, a previous owner, including Maritech, may be required to perform the abandonment and decommissioning obligation. As the former parent company of Maritech, we also may be responsible for performing these abandonment and decommissioning obligations. A significant portion of the decommissioning liabilities that were assumed by the buyers of the Maritech properties in these previous sales remains unperformed, and we believe the amounts of these remaining liabilities are significant. We generally monitor the financial condition of the buyers of these properties, and if oil and natural gas pricing levels deteriorate, we expect that one or more of these buyers may be unable to perform the decommissioning work required on properties they acquired, either directly or indirectly from Maritech.
In March 2018, pursuant to a series of transactions, Maritech completed the sales of the remaining active
leases held by Maritech to Orinoco and, immediately thereafter, we sold all equity interest in Maritech to Orinoco. Under the Maritech Asset Purchase Agreement, Orinoco assumed all of Maritech's abandonment and decommissioning obligations related to the active leases (the “Orinoco Lease Liabilities”) and under the Maritech Equity Purchase Agreement Orinoco assumed all other liabilities of Maritech, including the Legacy Liabilities, subject to limited exceptions unrelated to the asset retirement obligations. Pursuant to a Bonding Agreement executed in connection with such purchase agreements, Orinoco provided non-revocable bonds in the aggregate amount of $47 million to secure their performance of Maritech’s abandonment and decommissioning obligations related to the Orinoco Lease Liabilities and Maritech’s remaining current abandonment and decommissioning obligations (not including the Legacy Liabilities). If in the future we become liable for any abandonment and decommissioning liability associated with any property previously owned by Maritech other than the Legacy Liabilities, the Bonding Agreement provides that, if we call any of these bonds to satisfy such liability and the amount of the bond payment is not sufficient to pay for such liability, Orinoco will pay us for the additional amount required. To the extent Orinoco is unable to cover any such deficiency or we become liable for a significant portion of the Legacy Liabilities, our financial condition and results of operations may be negatively affected.
We are exposed to significant credit risks. We face credit risk associated with the significant amounts of accounts receivable we have with our
customers in the energy industry. Many of our customers, particularly those associated with our onshore operations, are small- to medium-sized oil and gas operators that may be more susceptible to declines in oil and gas commodity prices or generally increased operating expenses than larger companies. Our ability to collect from our customers is impacted by the current decreased oil and natural gas price environment.
Our operating results and cash flows for certain of our subsidiaries are subject to foreign currency risk. The operations of certain of our subsidiaries are exposed to fluctuations between the U.S. dollar and certain
foreign currencies, particularly the euro, the British pound, the Mexican peso, and the Argentinian peso. Our plans to grow our international operations could cause this exposure from fluctuating currencies to increase. Historically, exchange rates of foreign currencies have fluctuated significantly compared to the U.S. dollar, and this exchange rate volatility is expected to continue. Significant fluctuations in foreign currencies against the U.S. dollar could adversely affect our balance sheet and results of operations.
19
The Series A Convertible Preferred Units of CCLP issued on August 2016 and September 2016 (the "CCLP Preferred Units") are senior in right of distributions, liquidation and voting to the common units of CCLP, and will result in the issuance of additional CCLP common units in the future, resulting in dilution of our existing common unit ownership in CCLP, and such dilution is potentially unlimited.
CCLP's partnership agreement does not limit the number of additional common units that CCLP may issue
at any time without the approval of its common unitholders. In addition, subject to the provisions of the CCLP partnership agreement and the CCLP Series A Preferred Unit Purchase Agreements, as herein defined, CCLP may issue an unlimited number of partnership units that are senior to the common units in right of distribution, liquidation, or voting. On August 8, 2016, CCLP issued an aggregate of 4,374,454 of CCLP Preferred Units for a cash purchase price of $11.43 per CCLP Preferred Unit (the “Issue Price”), resulting in total net proceeds, after deducting certain offering expenses, of $49.8 million. We purchased 874,891 of the CCLP Preferred Units at the Issue Price, for a purchase price of $10.0 million. Additionally, on September 20, 2016, CCLP issued an aggregate of 2,624,672 of Preferred Units for a cash purchase price of $11.43 per Preferred Unit, resulting in total net proceeds, after deducting certain offering expenses, of $29.0 million.
Pursuant to the initial CCLP Series A Preferred Unit Purchase Agreement, our wholly owned CSI Compressco GP Inc. subsidiary (the general partner of CCLP), executed the Second Amended and Restated Agreement of Limited Partnership of the Partnership (the “Amended and Restated CCLP Partnership Agreement”) to, among other things, authorize and establish the rights and preferences of the CCLP Preferred Units. The CCLP Preferred Units are a new class of equity security that ranks senior to CCLP's common units with respect to distribution rights and rights upon liquidation. The holders of CCLP Preferred Units (each, a “CCLP Preferred Unitholder”) will receive quarterly distributions in kind in additional Preferred Units, equal to an annual rate of 11.00% of the Issue Price ($1.2573 per unit annualized), subject to certain adjustments, including adjustments relating to any future issuances of common units below a set price, and any quarterly distributions on our common units in excess of $0.3775 per common unit. In the event CCLP fails to pay in full any quarterly distribution in additional Preferred Units, then until such failure is cured, CCLP is prohibited from making any distributions on its common units. Beginning March 8, 2017 and on the first trading day of each calendar month thereafter for a total of thirty months (each, a “Conversion Date”), the CCLP Preferred Units convert into common units in an amount equal to, with respect to each CCLP Preferred Unitholder, the number of CCLP Preferred Units held by such CCLP Preferred Unitholder divided by the number of Conversion Dates remaining. On June 7, 2017, as permitted under the Amended and Restated CCLP Partnership Agreement, CCLP elected to defer the monthly conversion of CCLP Preferred Units for each of the Conversion Dates during the three month period beginning July 2017. As a result, no CCLP Preferred Units were converted into CCLP common units during the three month period ended September 30, 2017, and future monthly conversions were increased beginning in October 2017. During 2017, conversions of the CCLP Preferred Units resulted in the issuance of 3.7 million CCLP common units. CCLP anticipates that the number of CCLP common units that will be issued upon conversions of the CCLP Preferred Units during 2018 will increase, as monthly conversions are expected during the full year of 2018 and due to the three month deferral of conversions during 2017. CCLP may, at its option, pay cash, or a combination of cash and common units, to the CCLP Preferred Unitholders instead of issuing common units on any Conversion Date, subject to certain restrictions as described in the Amended and Restated CCLP Partnership Agreement and the CCLP Credit Agreement.
Because we own 40% of the outstanding CCLP common units, 12.6% of the newly issued CCLP Preferred Units, and approximately 2% general partner interest in CCLP, as a result of the conversion of the CCLP Preferred Units into CCLP common units:
• our previously existing ownership interest in the common units of CCLP will decrease;• the amount of cash available for distribution on each CCLP common unit may decrease;• the voting power attributable to our previously existing CCLP common units will be diminished; and• the market price of CCLP common units may decline.
We and CCLP are exposed to interest rate risks with regard to our respective credit facility indebtedness. As of December 31, 2017, CCLP has a total of $224.0 million outstanding under its revolving credit facility,
and we did not have any outstanding borrowings under our revolving credit facility. In connection with the SwiftWater acquisition, we borrowed $40.0 million and we may borrow additional amounts under our revolving credit facility in the future. These revolving credit facilities consist of floating rate loans that bear interest at an agreed upon percentage rate spread (which is determined on our leverage ratio) above London Interbank Offered Rate ("LIBOR"). Accordingly, our cash flows and results of operations could be subject to interest rate risk exposure
20
associated with the level of the variable rate debt balance outstanding. We currently are not a party to an interest rate swap contract or other derivative instrument designed to hedge our exposure to interest rate fluctuation risk.
Our revolving credit facility is scheduled to mature on September 30, 2019. CCLP's revolving credit facility
is scheduled to mature on August 4, 2019. Our 11% Senior Note, which matures November 2022, and CCLP's 7.25% Senior Notes, which mature August 2022, bear interest at fixed interest rates. There can be no assurance that the financial market conditions or borrowing terms at the times these existing debt agreements are renegotiated will be as favorable as the current terms and interest rates.
Legal, Regulatory, and Political Risks Our operations are subject to extensive and evolving U.S. and foreign federal, state and local laws and
regulatory requirements that increase our operating costs and expose us to potential fines, penalties, and litigation. Laws and regulations govern our operations, including those relating to corporate governance, employees,
taxation, fees, importation and exportation restrictions, environmental affairs, health and safety, and the manufacture, storage, handling, transportation, use, and sale of chemical products. Certain foreign countries impose additional restrictions on our activities, such as currency restrictions and restrictions on various labor practices. These laws and regulations are becoming increasingly complex and stringent, and compliance is becoming increasingly expensive. Governmental authorities have the power to enforce compliance with these regulations, and violators are subject to civil and criminal penalties, including civil fines, and injunctions. Third parties may also have the right to pursue legal actions to enforce compliance with certain laws and regulations. It is possible that increasingly strict environmental, health and safety laws, regulations, and enforcement policies could result in substantial costs and liabilities to us.
The EPA is studying the environmental impact of hydraulic fracturing, a process used by the U.S. oil and
gas industry in the development of certain oil and gas reservoirs. Specifically, the EPA is reviewing the impact of hydraulic fracturing on drinking water resources. Certain environmental and other groups have suggested that additional federal, state, and local laws and regulations may be needed to more closely regulate the hydraulic fracturing process. Several states have adopted regulations that require operators to disclose the chemical constituents in hydraulic fracturing fluids. We cannot predict whether any federal, state or local laws or regulations will be enacted regarding hydraulic fracturing, and, if so, what actions any such laws or regulations would require or prohibit. If additional levels of regulation or permitting requirements were imposed on oil and gas operators through the adoption of new laws and regulations, the domestic demand for certain of our products and services could be decreased or subject to delays, particularly for our Production Testing, Compression, and Fluids Divisions.
We have operations that are either ongoing or scheduled to commence in the U.S. Gulf of Mexico. At this
time, we cannot predict the full impact that other regulatory actions that may be mandated by the federal government may have on our operations or the operations of our customers. Other governmental or regulatory actions could further reduce our revenues and increase our operating costs, including the cost to insure offshore operations, resulting in reduced cash flows and profitability.
Our onshore and offshore operations expose us to risks such as the potential for harmful substances
escaping into the environment and causing damages or injuries, which could be substantial. Although we maintain general liability and pollution liability insurance, these policies are subject to exceptions and coverage limits. We maintain limited environmental liability insurance covering named locations and environmental risks associated with contract services for oil and gas operations. We could be materially and adversely affected by an enforcement proceeding or a claim that is not covered or is only partially covered by insurance.
Because our business depends on the level of activity in the oil and natural gas industry, existing or future
laws, regulations, treaties, or international agreements that impose additional restrictions on the industry may adversely affect our financial results. Regulators are becoming more focused on air emissions from oil and gas operations, including volatile organic compounds, hazardous air pollutants, and greenhouse gases. In particular, the focus on greenhouse gases and climate change, including incentives to conserve energy or use alternative energy sources, could have a negative impact on our financial results if such laws, regulations, treaties, or international agreements reduce the worldwide demand for oil and natural gas or otherwise result in reduced economic activity generally. In addition, such laws, regulations, treaties, or international agreements could result in increased compliance costs, capital spending requirements, or additional operating restrictions for us, which may have a negative impact on our financial results.
21
In addition to increasing our risk of environmental liability, the rigorous enforcement of environmental laws and regulations has accelerated the growth of some of the markets we serve. Decreased regulation and enforcement in the future could materially and adversely affect the demand for certain of the services offered by our Offshore Services operations and, therefore, materially and adversely affect our business.
Our expansion into foreign countries exposes us to complex regulations and may present us with new
obstacles to growth. We plan to continue to grow both in the United States and in foreign countries. We have established
operations in, among other countries, Argentina, Brazil, Canada, Finland, Ghana, Mexico, Norway, Saudi Arabia, Sweden, and the United Kingdom. Foreign operations carry special risks. Our business in the countries in which we currently operate and those in which we may operate in the future could be limited or disrupted by:
• restrictions on repatriating cash back to the United States;• the impact of compliance with anti-corruption laws on our operations and competitive position in affected
countries and the risk that actions taken by us or our agents may violate those laws;• government controls and government actions, such as expropriation of assets and changes in legal and
regulatory environments;• import and export license requirements;• political, social, or economic instability;• trade restrictions;• changes in tariffs and taxes; and• our limited knowledge of these markets or our inability to protect our interests.
We and our affiliates operate in countries where governmental corruption has been known to exist. While
we and our subsidiaries are committed to conducting business in a legal and ethical manner, there is a risk of violating either the U.S. Foreign Corrupt Practices Act, the U.K Bribery Act, or laws or legislation promulgated pursuant to the 1997 OECD Convention on Combating Bribery of Foreign Public Officials in International Business Transactions or other applicable anti-corruption regulations that generally prohibit the making of improper payments to foreign officials for the purpose of obtaining or keeping business. Violation of these laws could result in monetary penalties against us or our subsidiaries and could damage our reputation and, therefore, our ability to do business.
Foreign governments and agencies often establish permit and regulatory standards different from those in
the U.S. If we cannot obtain foreign regulatory approvals, or if we cannot obtain them in a timely manner, our growth and profitability from foreign operations could be adversely affected.
Our operations in Argentina expose us to the changing economic, legal, and political environments in that country, including the changing regulations over repatriation of cash generated from our operations in Argentina.
The current economic, legal, and political environment in Argentina and recent devaluation of the Argentinian peso have created increased economic instability for foreign investment in Argentina. The Argentinian government is currently attempting to address the current high rate of inflation and the continuing devaluations pressure. Fiscal and monetary expansion in Argentina has led to devaluations of the Argentinian peso, particularly in late 2013, early 2014, and late 2015. Additional currency adjustment may be necessary to help boost the current Argentina economy, but may be accompanied by fiscal and monetary tightening, including additional restrictions on the purchase of U.S. dollars in Argentina.
As a result of our operations in Argentina, consolidated revenues and operating cash flow generated in Argentina have increased over the past three years. As of December 31, 2017, approximately $0.9 million of our consolidated cash balance is located in Argentina, and the process of repatriating this cash to the U.S. is subject to increasingly complex regulations. There can be no assurances that our growing Argentinian operations will not expose us to a loss of liquidity, foreign exchange losses, and other potential financial impacts.
Tax laws and regulations may change over time, and the recently passed comprehensive tax reform bill
could adversely affect our business and financial condition.
22
On December 22, 2017, H.R.1, “An Act to Provide the Reconciliation Pursuant to Titles II and V of the Concurrent Resolution on the Budget for Fiscal Year 2018” (the “Act”) (previously known as “The Tax Cuts and Jobs Act”) was signed into law making significant changes to the Internal Revenue Code. The Act, among other things, (i) permanently reduces the U.S. corporate income tax rate, (ii) repeals the corporate alternative minimum tax, (iii) eliminates the deduction for certain domestic production activities, (iv) imposes new limitations on the utilization of net operating losses, and (v) provides for more general changes to the taxation of corporations, including changes to cost recovery rules and to the deductibility of interest expense, which may impact the taxation of oil and gas companies. The Act is complex and far-reaching and we cannot predict with certainty the resulting impact its enactment has on us. The ultimate impact of the Act may differ from our estimates due to changes in interpretations and assumptions made by us as well as additional regulatory guidance that may be issued and any such changes in interpretations or assumptions could adversely affect our business and financial condition. See "Note E - Income Taxes" to our Consolidated Financial Statements for additional information.
Climate change legislation or regulations restricting emissions of “greenhouse gases” could result in increased operating costs and reduced demand for the oil and natural gas our customers produce, while the physical effects of climate change could disrupt production and cause us to incur costs in preparing for or responding to those effects.
The EPA has determined that greenhouse gases ("GHGs") present an endangerment to public health and
the environment, because emissions of such gases are, according to the EPA, contributing to warming of the earth’s atmosphere and other climatic changes. Based on these findings, the EPA has begun adopting and implementing regulations to restrict emissions of GHGs under existing provisions of the Clean Air Act ("CAA"). Such EPA rules regulate GHG emissions under the CAA and require a reduction in emissions of GHGs from motor vehicles and from certain large stationary sources. The EPA rules also require so-called “green” completions at hydraulically fractured natural gas wells beginning in 2015. In addition, the EPA also requires the annual reporting of GHG emissions from specified large GHG emission sources in the United States, including petroleum refineries, as well as from certain oil and gas production facilities.
In addition, in December 2015, over 190 countries, including the United States, reached an agreement to reduce global greenhouse gas emissions (the “Paris Agreement”). The Paris Agreement entered into force in November 2016 after more than 170 nations, including the United States, ratified or otherwise indicated their intent to be bound by the Paris Agreement. However, in June 2017, President Trump announced that the United States intends to withdraw from the Paris Agreement and to seek negotiations either to reenter the Paris Agreement on different terms or a separate agreement. In August 2017, the U.S. Department of State officially informed the United Nations of the United States’ intent to withdraw from the Paris Agreement. The Paris Agreement provides for a four-year exit process beginning when it took effect in November 2016, which would result in an effective exit date of November 2020. The United States’ adherence to the exit process and/or the terms on which the United States may re-enter the Paris Agreement or a separately negotiated agreement are unclear at this time. To the extent that the United States and other countries implement the Paris Agreement or impose other climate change regulations on the oil and natural gas industry, it could have an adverse effect on our business.
The adoption and implementation of any regulations imposing reporting obligations on, or limiting emissions of GHGs from, our facilities and operations could require us to incur costs. Further, Congress has considered and almost one-half of the states have adopted legislation that seeks to control or reduce emissions of GHGs from a wide range of sources. Any such legislation could adversely affect demand for the oil and natural gas our customers produce and, in turn, demand for our products and services. Finally, it should be noted that some scientists have concluded that increasing concentrations of GHGs in the Earth’s atmosphere may produce climate changes that have significant physical effects, such as increased frequency and severity of storms, floods, and other climatic events; if any such effects were to occur, they could have an adverse effect on our operations and cause us to incur costs in preparing for or responding to those effects.
Regulatory initiatives related to hydraulic fracturing in the countries where we and our customers operate could result in operating restrictions or delays in the completion of oil and gas wells that may reduce demand for our services.

23
Hydraulic fracturing is an important and common practice that is used to stimulate production of hydrocarbons from dense subsurface rock formations. The process involves the injection of water, sand or other proppants and chemical additives under pressure into targeted geological formations to fracture the surrounding rock and stimulate production.
Hydraulic fracturing typically is regulated by state oil and gas commissions or similar state agencies, but several federal agencies have asserted regulatory authority over certain aspects of the process. For example, the EPA asserted regulatory authority pursuant to the federal Safe Drinking Water Act (“SDWA”) Underground Injection Control (“UIC”) program over hydraulic fracturing activities involving the use of diesel and issued guidance covering such activities; published final rules under the federal CAA in 2012 and published additional final regulations in June 2016 governing methane and volatile organic compound (“VOC”) performance standards, including standards for the capture of air emissions released during for the oil and natural gas hydraulic fracturing industry; published in June 2016 an effluent limitations guidelines final rule prohibiting the discharge of waste water from shale natural-gas extraction operations before discharging to a treatment plant; and in 2014 published an Advance Notice of Proposed Rulemaking regarding Toxic Substances Control Act reporting of the chemical substances and mixtures used in hydraulic fracturing. Also, the U.S. Bureau of Land Management ("BLM") published a final rule in March 2015 that established new or more stringent standards for performing hydraulic fracturing on federal and Indian lands. However, in June 2016, a Wyoming federal judge struck down this final rule, finding that the BLM lacked authority to promulgate the rule, the BLM appealed the decision to the U.S. Circuit Court of Appeals for the Tenth Circuit in July 2016, the appellate court issued a ruling in September 2017 to vacate the Wyoming trial court decision and dismiss the lawsuit challenging the 2015 rule in response to the BLM’s issuance of a proposed rulemaking to rescind the 2015 rule and, in December 2017, the BLM published a final rule rescinding the March 2015 rule. In January 2018, litigation challenging the BLM’s rescission of the 2015 rule was brought in federal court, but, in June 2016, a Wyoming federal judge struck down this final rule, finding that the BLM lacked authority to promulgate the rule. That decision was appealed by the BLM to the U.S. Circuit Court of Appeals for the Tenth Circuit in 2016, but, in March 2017, the BLM filed a request with the Tenth Circuit to put the appeal on hold pending rescission of the 2015 final rule.
The U.S. Congress (“Congress”) has from time to time considered legislation to provide for federal regulation of hydraulic fracturing and to require disclosure of the chemicals used in the hydraulic fracturing process. At the state level, some states, including Texas, Oklahoma and New Mexico, where the drilling program is expected to operate, have adopted, and other states are considering adopting legal requirements that could impose new or more stringent permitting, public disclosure, or well construction requirements on hydraulic fracturing activities. States could elect to prohibit high volume hydraulic fracturing altogether, following the approach taken by the State of New York in 2015. Local governments also may seek to adopt ordinances within their jurisdictions regulating the time, place and manner of drilling activities in general or hydraulic fracturing activities in particular. If new or more stringent federal, state, or local legal restrictions relating to the hydraulic fracturing process are adopted in areas where the drilling program operates, including, for example, on federal and American Indian lands, the partnership could incur potentially significant added costs to comply with such requirements, experience delays or curtailment in the pursuit of exploration, development or production activities, and perhaps even be precluded from drilling wells. In December 2016, the EPA released its final report on the potential impacts of hydraulic fracturing on drinking water resources, concluding that “water cycle” activities associated with hydraulic fracturing may impact drinking water resources under some circumstances. “Water cycle” describes the use of water in hydraulic fracturing, from water withdrawals to the making of hydraulic fracturing fluids, through the mixing and injection of hydraulic fracturing fluids in oil and natural gas production wells, to the collection and disposal or reuse of produced water. Increased regulation and attention given to the hydraulic fracturing process could lead to greater opposition to oil and gas production activities using hydraulic fracturing techniques. Additional legislation or regulation could also lead to operational delays or increased operating costs for our customers in the production of oil and gas, including from the developing shale plays, or could make it more difficult to perform hydraulic fracturing. The adoption of any federal, state or local laws or the implementation of additional regulations regarding hydraulic fracturing could potentially cause a decrease in the completion of new oil and gas wells and an associated decrease in demand for our services and increased compliance costs and time, which could have a material adverse effect on our liquidity, consolidated results of operations, and consolidated financial condition.
24
Regulatory initiatives relating to the protection of endangered or threatened species in the United States, in other countries where we operate, could have an adverse impact on our and our customers’ ability to expand operations.
In the United States, the Endangered Species Act (the “ESA”) restricts activities that may affect endangered or threatened species or their habitats. Similar protections are offered to migratory birds under the Migratory Bird Treaty Act (the “MBTA”). To the extent species that are listed under the ESA or similar state laws, or are protected under the MBTA, live in the areas where we or our customers operate, both our and our customers’ abilities to conduct or expand operations and construct facilities could be limited or be forced to incur material additional costs. The designation of previously unidentified endangered or threatened species could indirectly cause us to incur additional costs, cause our or our customers’ operations to become subject to operating restrictions or bans, and limit future development activity in affected areas. In addition, as a result of a settlement approved by the United States for the District of Columbia in 2011, the U.S. Fish and Wildlife Service is required to make a determination of listing of numerous species as endangered or threatened under the Endangered Species Act prior to the completion of the agency’s 2017 fiscal year. The designation of previously unprotected species as threatened or endangered in areas where we or our customers might conduct operations could result in limitations or prohibitions on our operations and could adversely impact our business.
Our proprietary rights may be violated or compromised, which could damage our operations. We own numerous patents, patent applications, and unpatented trade secret technologies in the U.S. and
certain foreign countries. There can be no assurance that the steps we have taken to protect our proprietary rights will be adequate to deter misappropriation of these rights. In addition, independent third parties may develop competitive or superior technologies.
Our operations and reputation may be impaired if our information technology systems fail to perform adequately or if we are the subject of a data breach or cyberattack.
Our information technology systems are critically important to operating our business efficiently. We rely on our information technology systems to manage our business data, communications, supply chain, customer invoicing, employee information, and other business processes. We outsource certain business process functions to third-party providers and similarly rely on these third-parties to maintain and store confidential information on their systems. The failure of these information technology systems to perform as we anticipate could disrupt our business and could result in transaction errors, processing inefficiencies, and the loss of sales and customers, causing our business and results of operations to suffer.
Furthermore, our information technology systems may be vulnerable to security breaches beyond our control, including those involving cyberattacks using viruses, worms or other destructive software, process breakdowns, phishing or other malicious activities, or any combination of the foregoing. Such breaches have in the past and could again in the future result in unauthorized access to information including customer, supplier, employee, or other company confidential data. We do not carry insurance against these risks, although we do invest in security technology, perform penetration tests from time to time, and design our business processes to attempt to mitigate the risk of such breaches. However, there can be no assurance that security breaches will not occur. Moreover, the development and maintenance of these measures requires continuous monitoring as technologies change and efforts to overcome security measures evolve. We have experienced, and expect to continue to experience, cyber security threats and incidents, none of which has been material to us to date. However, a successful breach or attack could have a material negative impact on our operations or business reputation and subject us to consequences such as litigation and direct costs associated with incident response.
Item 1B. Unresolved Staff Comments.
None.
Item 2. Properties. Our properties consist primarily of our corporate headquarters facility, chemical plants, processing plants
and distribution facilities. Prior to the March 2018 sale of the Offshore Services segment, our properties also
25
included heavy lift barge rigs and dive support vessels, each of which are included in the assets owned as of December 31, 2017. The following information describes facilities that we leased or owned as of December 31, 2017. We believe our facilities are adequate for our present needs.
Facilities Fluids Division
Our Fluids Division facilities include seven chemical production plants located in the states of Arkansas,
California, Louisiana, and West Virginia, and the country of Finland, having a total production capacity of more than 1.5 million equivalent liquid tons per year. The two California locations consist of 29 square miles of leased mineral acreage and solar evaporation ponds, and related owned production and storage facilities.
As an inducement to locate our calcium chloride production plant in Union County, Arkansas, we received
certain ad valorem property tax incentives. Our facility is located just outside the city of El Dorado, Arkansas, on property that is leased from Union County, Arkansas. We have the option of purchasing the property at any time during the term of the lease for a nominal price. The term of the lease expires in 2035, at which time we also have the option to purchase the property at a nominal price. Under the terms of the lease, we are responsible for all costs incurred related to the facility.
In addition to the production facilities described above, the Fluids Division owns or leases multiple service
center facilities in the United States and in other countries. The Fluids Division also leases several offices and numerous terminal locations in the United States and in other countries.
We lease approximately 30,000 gross acres of bromine-containing brine reserves in Magnolia, Arkansas,
for possible future development and as a source of supply for our bromine and other raw materials.
Production Testing Division The Production Testing segment conducts its operations through production testing service centers (most of
which are leased) in the United States, located in Colorado, Louisiana, North Dakota, Oklahoma, Pennsylvania, Texas, West Virginia, and Wyoming. In addition, the Production Testing segment has leased facilities in Australia, Canada, Mexico, and certain countries in the United Kingdom, the Middle East and South America.
Compression Division
The Compression Division’s facilities include owned offices and fabrication facilities in Midland, Texas and Oklahoma City, Oklahoma, and several owned and leased service and sales facilities in Argentina, Canada, Mexico, and the United States. All obligations under the bank revolving credit facility for CCLP are secured by a first lien security interest in substantially all of CCLP’s assets, including the Midland, Texas and Oklahoma City, Oklahoma facilities.
For a profile of our compression fleet, see "Item 1. Business "Products and Services - Compression Division."
Offshore Division The Offshore Division conducts its operations through four offices and service facility locations (three of
which are leased) located in Texas and Louisiana. In addition, as of December 31, 2017, the Offshore Services segment owned the following fleet of vessels that it uses in performing its well abandonment, decommissioning, construction, and contract diving operations:
TETRA Hedron Derrick barge with 1,600-metric-ton revolving craneTETRA Arapaho Derrick barge with 725-metric-ton revolving craneEpic Explorer 210-foot dive support vessel with saturation diving system
We have access to additional leased vessels as needed to adjust to demand for our services. Each of the above properties were sold as part of the March 2018 disposition of our Offshore Division.
26
Corporate
Our headquarters is located in The Woodlands, Texas, in a 153,000 square foot office building, which is
located on 2.6 acres of land, under a lease that expires in 2027. In addition, we own a 28,000 square foot technical facility in The Woodlands, Texas, to service our Fluids Division operations.
Item 3. Legal Proceedings.
We are named defendants in numerous lawsuits and respondents in certain governmental proceedings arising in the ordinary course of business. While the outcome of lawsuits or other proceedings against us cannot be predicted with certainty, management does not consider it reasonably possible that a loss resulting from such lawsuits or other proceedings in excess of any amounts accrued has been incurred that is expected to have a material adverse effect on our financial condition, results of operations, or liquidity.
Environmental Proceedings
One of our subsidiaries, TETRA Micronutrients, Inc. ("TMI"), previously owned and operated a production
facility located in Fairbury, Nebraska. TMI is subject to an Administrative Order on Consent issued to American Microtrace, Inc. (n/k/a/ TETRA Micronutrients, Inc.) in the proceeding styled In the Matter of American Microtrace Corporation, EPA I.D. No. NED00610550, Respondent, Docket No. VII-98-H-0016, dated September 25, 1998 (the "Consent Order"), with regard to the Fairbury facility. TMI is liable for ongoing environmental monitoring at the Fairbury facility under the Consent Order; however, the current owner of the Fairbury facility is responsible for costs associated with the closure of that facility.
Item 4. Mine Safety Disclosures.
None.
PART II
Item 5. Market for Registrant’s Common Equity, Related Stockholder Matters, and Issuer Repurchases of Equity Securities. Price Range of Common Stock
Our common stock is traded on the New York Stock Exchange under the symbol “TTI.” As of March 2,
2018, there were approximately 359 holders of record of the common stock. The following table sets forth the high and low sale prices of the common stock for each calendar quarter in the two years ended December 31, 2017, as reported by the New York Stock Exchange.
High Low2017 First Quarter $ 5.23 $ 3.53Second Quarter 4.26 2.67Third Quarter 3.12 1.87Fourth Quarter 4.40 2.63
2016 First Quarter $ 7.81 $ 4.62Second Quarter 7.75 4.65Third Quarter 6.77 5.33Fourth Quarter 6.34 4.36
Market Price of Common Stock
The following graph compares the five-year cumulative total returns of our common stock, the Standard &
Poor’s 500 Composite Stock Price Index (S&P 500), and the Philadelphia Oil Service Sector Index (PHLX Oil
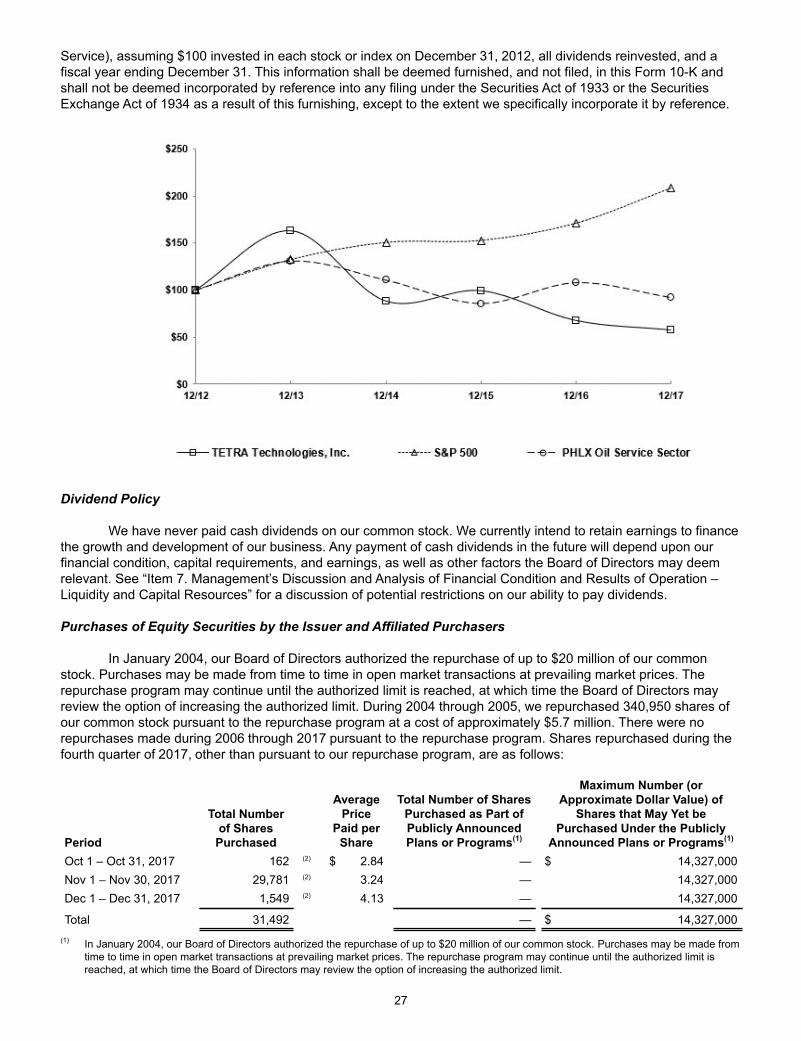
27
Service), assuming $100 invested in each stock or index on December 31, 2012, all dividends reinvested, and a fiscal year ending December 31. This information shall be deemed furnished, and not filed, in this Form 10-K and shall not be deemed incorporated by reference into any filing under the Securities Act of 1933 or the Securities Exchange Act of 1934 as a result of this furnishing, except to the extent we specifically incorporate it by reference.
Dividend Policy We have never paid cash dividends on our common stock. We currently intend to retain earnings to finance
the growth and development of our business. Any payment of cash dividends in the future will depend upon our financial condition, capital requirements, and earnings, as well as other factors the Board of Directors may deem relevant. See “Item 7. Management’s Discussion and Analysis of Financial Condition and Results of Operation – Liquidity and Capital Resources” for a discussion of potential restrictions on our ability to pay dividends. Purchases of Equity Securities by the Issuer and Affiliated Purchasers
In January 2004, our Board of Directors authorized the repurchase of up to $20 million of our common
stock. Purchases may be made from time to time in open market transactions at prevailing market prices. The repurchase program may continue until the authorized limit is reached, at which time the Board of Directors may review the option of increasing the authorized limit. During 2004 through 2005, we repurchased 340,950 shares of our common stock pursuant to the repurchase program at a cost of approximately $5.7 million. There were no repurchases made during 2006 through 2017 pursuant to the repurchase program. Shares repurchased during the fourth quarter of 2017, other than pursuant to our repurchase program, are as follows:
Period
Total Numberof Shares Purchased
AveragePrice
Paid per Share
Total Number of SharesPurchased as Part ofPublicly Announced Plans or Programs(1)
Maximum Number (orApproximate Dollar Value) of
Shares that May Yet bePurchased Under the Publicly
Announced Plans or Programs(1)
Oct 1 – Oct 31, 2017 162 (2) $ 2.84 — $ 14,327,000Nov 1 – Nov 30, 2017 29,781 (2) 3.24 — 14,327,000Dec 1 – Dec 31, 2017 1,549 (2) 4.13 — 14,327,000
Total 31,492 — $ 14,327,000(1) In January 2004, our Board of Directors authorized the repurchase of up to $20 million of our common stock. Purchases may be made from
time to time in open market transactions at prevailing market prices. The repurchase program may continue until the authorized limit is reached, at which time the Board of Directors may review the option of increasing the authorized limit.
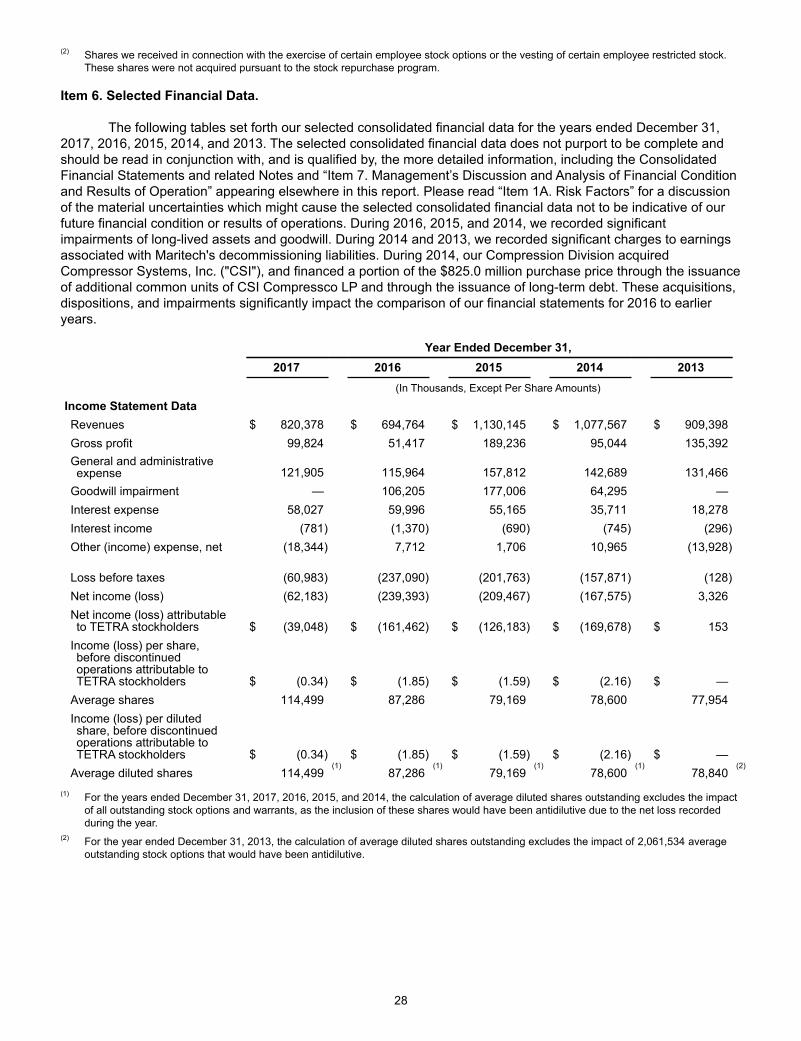
28
(2) Shares we received in connection with the exercise of certain employee stock options or the vesting of certain employee restricted stock. These shares were not acquired pursuant to the stock repurchase program.
Item 6. Selected Financial Data. The following tables set forth our selected consolidated financial data for the years ended December 31,
2017, 2016, 2015, 2014, and 2013. The selected consolidated financial data does not purport to be complete and should be read in conjunction with, and is qualified by, the more detailed information, including the Consolidated Financial Statements and related Notes and “Item 7. Management’s Discussion and Analysis of Financial Condition and Results of Operation” appearing elsewhere in this report. Please read “Item 1A. Risk Factors” for a discussion of the material uncertainties which might cause the selected consolidated financial data not to be indicative of our future financial condition or results of operations. During 2016, 2015, and 2014, we recorded significant impairments of long-lived assets and goodwill. During 2014 and 2013, we recorded significant charges to earnings associated with Maritech's decommissioning liabilities. During 2014, our Compression Division acquired Compressor Systems, Inc. ("CSI"), and financed a portion of the $825.0 million purchase price through the issuance of additional common units of CSI Compressco LP and through the issuance of long-term debt. These acquisitions, dispositions, and impairments significantly impact the comparison of our financial statements for 2016 to earlier years.
Year Ended December 31, 2017 2016 2015 2014 2013 (In Thousands, Except Per Share Amounts)
Income Statement Data
Revenues $ 820,378 $ 694,764 $ 1,130,145 $ 1,077,567 $ 909,398
Gross profit 99,824 51,417 189,236 95,044 135,392
General and administrativeexpense 121,905
115,964 157,812
142,689
131,466
Goodwill impairment — 106,205 177,006 64,295 —Interest expense 58,027 59,996 55,165 35,711 18,278
Interest income (781) (1,370) (690) (745) (296)
Other (income) expense, net (18,344) 7,712 1,706 10,965 (13,928)
Loss before taxes (60,983) (237,090) (201,763) (157,871) (128)
Net income (loss) (62,183) (239,393) (209,467) (167,575) 3,326
Net income (loss) attributableto TETRA stockholders $ (39,048)
$ (161,462) $ (126,183)
$ (169,678)
$ 153
Income (loss) per share,before discontinuedoperations attributable toTETRA stockholders $ (0.34)
$ (1.85) $ (1.59)
$ (2.16)
$ —
Average shares 114,499 87,286 79,169 78,600 77,954
Income (loss) per dilutedshare, before discontinuedoperations attributable toTETRA stockholders $ (0.34)
$ (1.85) $ (1.59)
$ (2.16)
$ —
Average diluted shares 114,499(1)
87,286(1)
79,169(1)
78,600(1)
78,840(2)
(1) For the years ended December 31, 2017, 2016, 2015, and 2014, the calculation of average diluted shares outstanding excludes the impact of all outstanding stock options and warrants, as the inclusion of these shares would have been antidilutive due to the net loss recorded during the year.
(2) For the year ended December 31, 2013, the calculation of average diluted shares outstanding excludes the impact of 2,061,534 average outstanding stock options that would have been antidilutive.
29
December 31, 2017 2016 2015 2014 2013 (In Thousands)
Balance Sheet Data Working capital $ 164,640 $ 158,906 $ 168,783 $ 121,476 $ 200,227Total assets 1,308,614 1,315,540 1,636,202 2,063,522 1,203,786Long-term debt, net 629,855 623,730 853,228 826,095 384,980
Decommissioning and other long-termliabilities 77,846 78,894 83,548 93,366 48,282
CCLP Series A Preferred Units 61,436 77,062 — — —Warrant Liability 13,202 18,503 — — —Total equity 352,561 400,466 514,180 765,601 597,498
30
Item 7. Management’s Discussion and Analysis of Financial Condition and Results of Operation. The following discussion is intended to analyze major elements of our consolidated financial statements
and provide insight into important areas of management’s focus. This section should be read in conjunction with the Consolidated Financial Statements and the accompanying Notes included elsewhere in this Annual Report. Statements in the following discussion may include forward-looking statements. These forward-looking statements involve risks and uncertainties. See “Item 1A. Risk Factors,” for additional discussion of these factors and risks.
Business Overview Improving oil and natural gas commodity pricing during late 2017 and early 2018 have spurred increased industry drilling and completion activity. As a result, we have seen improved demand for many of our products and services compared to 2016. Increased onshore rig counts are reflected in improved demand in many of our U.S. markets, particularly in the Permian Basin of Texas which is expected to continue with increased demand during the remainder of 2018. Despite flat offshore rig counts compared to 2016, demand from certain of our offshore Fluids Division customers continued to be strong during 2017. As a result, our Fluids and Production Testing Divisions reflect increased revenues and improved profitability during 2017 compared to 2016. These increases have occurred despite continuing customer pricing pressure for all of our businesses. Fluids Division revenues and operating cash flows are expected to further increase following the acquisition of SwiftWater Energy Services, LLC ("SwiftWater"), which is engaged in the business of providing water management and water solutions to oil and gas operators in the Permian Basin market of Texas. Our Compression Division, through our CSI Compressco LP subsidiary ("CCLP") continues to report improved utilization for its compressor equipment fleet, particularly for its high- and mid-level horsepower compression services. Following a record $66.7 million sales order received from a customer in early 2018, its new equipment sales backlog has significantly increased from the prior year. Increased overall industry activity levels are expected to continue in 2018, which should result in further easing of customer pricing pressures and result in continued increased revenues and profitability going forward for each of our businesses. For our Offshore Services segment, which was sold on March 1, 2018, increased activity levels resulted in increased revenues, although challenging weather conditions during 2017 resulted in reduced profitability. Despite the recent increase in operating activity levels, we continue to minimize headcount additions and seek to maintain the reduced operating and administrative cost structure implemented during the past three years, notwithstanding the reinstatement of company-wide wages and benefits to their levels prior to the reductions that were implemented during 2016. As a result of the above factors, consolidated revenues and gross profit each increased significantly during 2017 compared to 2016. Our consolidated pretax loss was also reduced compared to 2016 primarily due to goodwill impairments recorded during the prior year, fair market valuation gains associated with our warrants liability and the CCLP Series A Preferred Units recorded during 2017, and the net gain from litigation arbitration awards recorded during 2017.
On March 1, 2018, we closed a series of related transactions that resulted in the disposition of our Offshore Division. Pursuant to an Asset Purchase and Sale Agreement (the "Maritech Asset Purchase Agreement") with Orinoco Natural Resources, LLC ("Orinoco"), Orinoco purchased certain offshore oil, gas and mineral leases and related assets of Maritech (the "Maritech Properties"). Immediately thereafter, we closed a Membership Interest Purchase and Sale Agreement (the "Maritech Equity Purchase Agreement") with Orinoco, whereby Orinoco purchased all of the equity interests of Maritech (the "Maritech Equity Interests"). Immediately thereafter, we closed an Equity Interest Purchase Agreement (the "Offshore Services Purchase Agreement") with Epic Offshore Specialty, LLC, an affiliate of Orinoco ("Epic Offshore"), whereby Epic Offshore purchased (the "Offshore Services Sale") all of the equity in the wholly owned subsidiaries that comprise our Offshore Services segment operations (the "Offshore Services Equity Interests"). As a result of these transactions, we have effectively exited the businesses of our Offshore Services and Maritech segments.
Our consolidated cash provided by operating activities during the year ended December 31, 2017 increased by $8.9 million, or 16.1%, compared to the prior year. This increase in consolidated cash provided by operating activities was driven primarily by improved operating profitability, and despite cash being used during 2017 for working capital changes primarily related to the timing of collections of accounts receivable. We and CCLP continue to maintain our efforts to manage working capital. We and CCLP believe that maintaining reduced cost structures and monitoring our balance sheets and capital structures on an ongoing basis enhances our respective abilities to remain fiscally responsible as the current customer pricing environment continues to improve and positions each of us to capitalize on growth opportunities. Consolidated capital expenditures were $51.9 million during the year ended December 31, 2017, and included $25.9 million of capital expenditures by our Compression Division, compared to $21.1 million of consolidated capital expenditures during the prior year, including $11.6 million

31
by our Compression Division. Capital expenditure levels continue to be monitored carefully for each of our businesses, including CCLP, to insure that capital investments are made for the most attractive growth opportunities. Key objectives associated with our separate capital structure (excluding the capital structure of CCLP) include the ongoing management of amounts outstanding and available under our Credit Agreement and repayment of our 11% Senior Note.
We do not analyze or manage our capital structure on a consolidated basis, as there are no cross default provisions, cross collateralization provisions, or cross guarantees between CCLP's long-term debt and TETRA's long-term debt. Approximately $512.2 million of our consolidated debt balance is owed by CCLP, and is to be serviced by CCLP's existing cash balances and cash provided by CCLP's operations (less its capital expenditures) and is secured by the assets of CCLP.
The following table provides condensed consolidating balance sheet information reflecting our net assets and CCLP's net assets that service our and its respective capital structures.
December 31, 2017Condensed Consolidating
Balance Sheet TETRA CCLP Eliminations Consolidated(In Thousands)
Cash, excluding restricted cash $ 18,527 $ 7,601 $ — $ 26,128
Affiliate receivables 3,034 — (3,034) —
Other current assets 217,680 94,546 312,226
Property, plant and equipment, net 288,826 606,479 — 895,305Other assets, including investmentin CCLP 19 34,306 40,630 74,955
Total assets $ 528,086 $ 742,932 $ 37,596 $ 1,308,614
Affiliate payables $ — $ 3,034 $ (3,034) $ —
Current portion of long-term debt — — — —
Other current liabilities 112,742 60,972 — 173,714
Long-term debt, net 117,679 512,176 — 629,855
CCLP Series A Preferred Units — 70,260 (8,824) 61,436
Warrant liability 13,202 — — 13,202
Other non-current liabilities 76,383 1,463 77,846
Total equity 208,080 95,027 49,454 352,561
Total liabilities and equity $ 528,086 $ 742,932 $ 37,596 $ 1,308,614
TETRA’s debt is serviced by our existing cash balances and cash provided from operating activities (excluding CCLP) and the distributions we receive from CCLP in excess of our cash capital expenditures (excluding CCLP). During the year ended December 31, 2017, consolidated cash provided from operating activities was $64.6 million, which included approximately $39.1 million generated by CCLP. During 2017, we received $14.2 million from CCLP as our share of CCLP distributions. In April 2017, CCLP announced a reduction of approximately 50% in the level of cash distributions to its common unitholders, including us. Despite the current level of cash distributions from CCLP, we believe that current increased levels of operating activity along with the cost reduction steps we and CCLP have taken during the past two years will allow us and CCLP to continue to meet our respective financial obligations and fund our respective future growth plans as needed.
Future demand for our products and services depends primarily on activity in the oil and natural gas exploration and production industry, particularly including the level of expenditures for the exploration and production of oil and natural gas reserves, natural gas compression infrastructure, and for the plugging and decommissioning of abandoned offshore oil and natural gas properties. The future growth of certain of our businesses is dependent on improved future pricing levels of oil and natural gas. When oil and natural gas prices increase, we believe that there are growth opportunities for our products and services, supported primarily by:
• increases in technologically driven deepwater oil and gas well completions in the Gulf of Mexico;
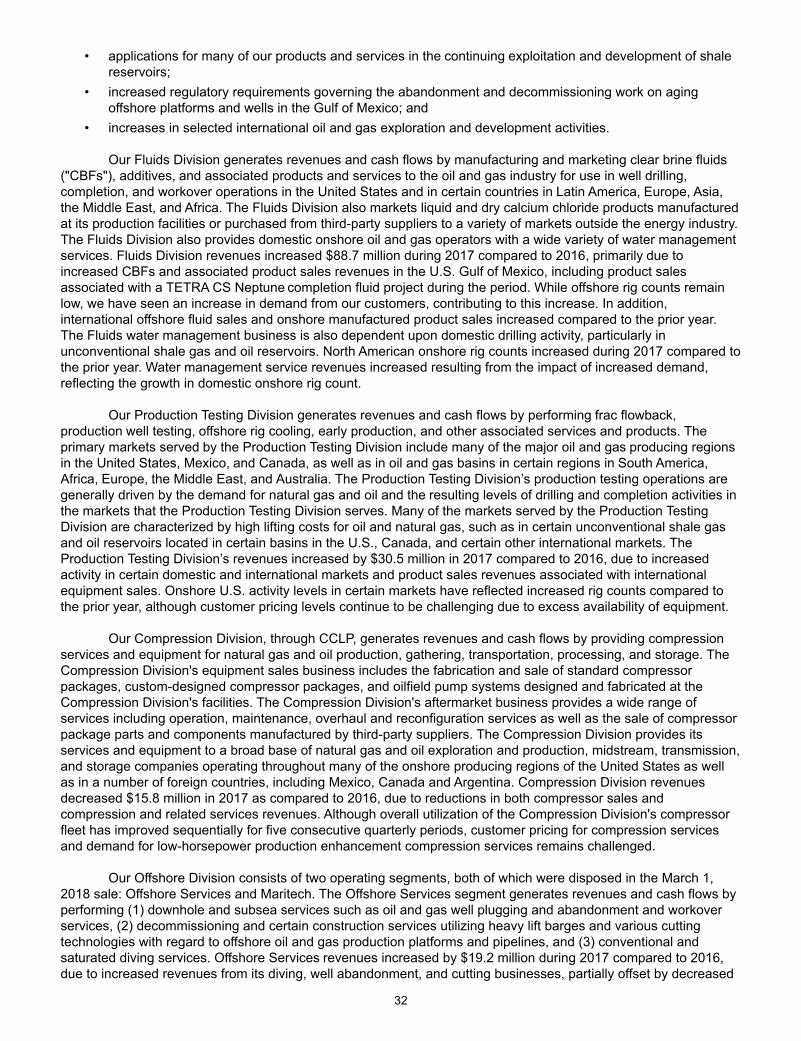
32
• applications for many of our products and services in the continuing exploitation and development of shale reservoirs;
• increased regulatory requirements governing the abandonment and decommissioning work on aging offshore platforms and wells in the Gulf of Mexico; and
• increases in selected international oil and gas exploration and development activities. Our Fluids Division generates revenues and cash flows by manufacturing and marketing clear brine fluids
("CBFs"), additives, and associated products and services to the oil and gas industry for use in well drilling, completion, and workover operations in the United States and in certain countries in Latin America, Europe, Asia, the Middle East, and Africa. The Fluids Division also markets liquid and dry calcium chloride products manufactured at its production facilities or purchased from third-party suppliers to a variety of markets outside the energy industry. The Fluids Division also provides domestic onshore oil and gas operators with a wide variety of water management services. Fluids Division revenues increased $88.7 million during 2017 compared to 2016, primarily due to increased CBFs and associated product sales revenues in the U.S. Gulf of Mexico, including product sales associated with a TETRA CS Neptune completion fluid project during the period. While offshore rig counts remain low, we have seen an increase in demand from our customers, contributing to this increase. In addition, international offshore fluid sales and onshore manufactured product sales increased compared to the prior year. The Fluids water management business is also dependent upon domestic drilling activity, particularly in unconventional shale gas and oil reservoirs. North American onshore rig counts increased during 2017 compared to the prior year. Water management service revenues increased resulting from the impact of increased demand, reflecting the growth in domestic onshore rig count.
Our Production Testing Division generates revenues and cash flows by performing frac flowback, production well testing, offshore rig cooling, early production, and other associated services and products. The primary markets served by the Production Testing Division include many of the major oil and gas producing regions in the United States, Mexico, and Canada, as well as in oil and gas basins in certain regions in South America, Africa, Europe, the Middle East, and Australia. The Production Testing Division’s production testing operations are generally driven by the demand for natural gas and oil and the resulting levels of drilling and completion activities in the markets that the Production Testing Division serves. Many of the markets served by the Production Testing Division are characterized by high lifting costs for oil and natural gas, such as in certain unconventional shale gas and oil reservoirs located in certain basins in the U.S., Canada, and certain other international markets. The Production Testing Division’s revenues increased by $30.5 million in 2017 compared to 2016, due to increased activity in certain domestic and international markets and product sales revenues associated with international equipment sales. Onshore U.S. activity levels in certain markets have reflected increased rig counts compared to the prior year, although customer pricing levels continue to be challenging due to excess availability of equipment.
Our Compression Division, through CCLP, generates revenues and cash flows by providing compression services and equipment for natural gas and oil production, gathering, transportation, processing, and storage. The Compression Division's equipment sales business includes the fabrication and sale of standard compressor packages, custom-designed compressor packages, and oilfield pump systems designed and fabricated at the Compression Division's facilities. The Compression Division's aftermarket business provides a wide range of services including operation, maintenance, overhaul and reconfiguration services as well as the sale of compressor package parts and components manufactured by third-party suppliers. The Compression Division provides its services and equipment to a broad base of natural gas and oil exploration and production, midstream, transmission, and storage companies operating throughout many of the onshore producing regions of the United States as well as in a number of foreign countries, including Mexico, Canada and Argentina. Compression Division revenues decreased $15.8 million in 2017 as compared to 2016, due to reductions in both compressor sales and compression and related services revenues. Although overall utilization of the Compression Division's compressor fleet has improved sequentially for five consecutive quarterly periods, customer pricing for compression services and demand for low-horsepower production enhancement compression services remains challenged.
Our Offshore Division consists of two operating segments, both of which were disposed in the March 1, 2018 sale: Offshore Services and Maritech. The Offshore Services segment generates revenues and cash flows by performing (1) downhole and subsea services such as oil and gas well plugging and abandonment and workover services, (2) decommissioning and certain construction services utilizing heavy lift barges and various cutting technologies with regard to offshore oil and gas production platforms and pipelines, and (3) conventional and saturated diving services. Offshore Services revenues increased by $19.2 million during 2017 compared to 2016, due to increased revenues from its diving, well abandonment, and cutting businesses, partially offset by decreased
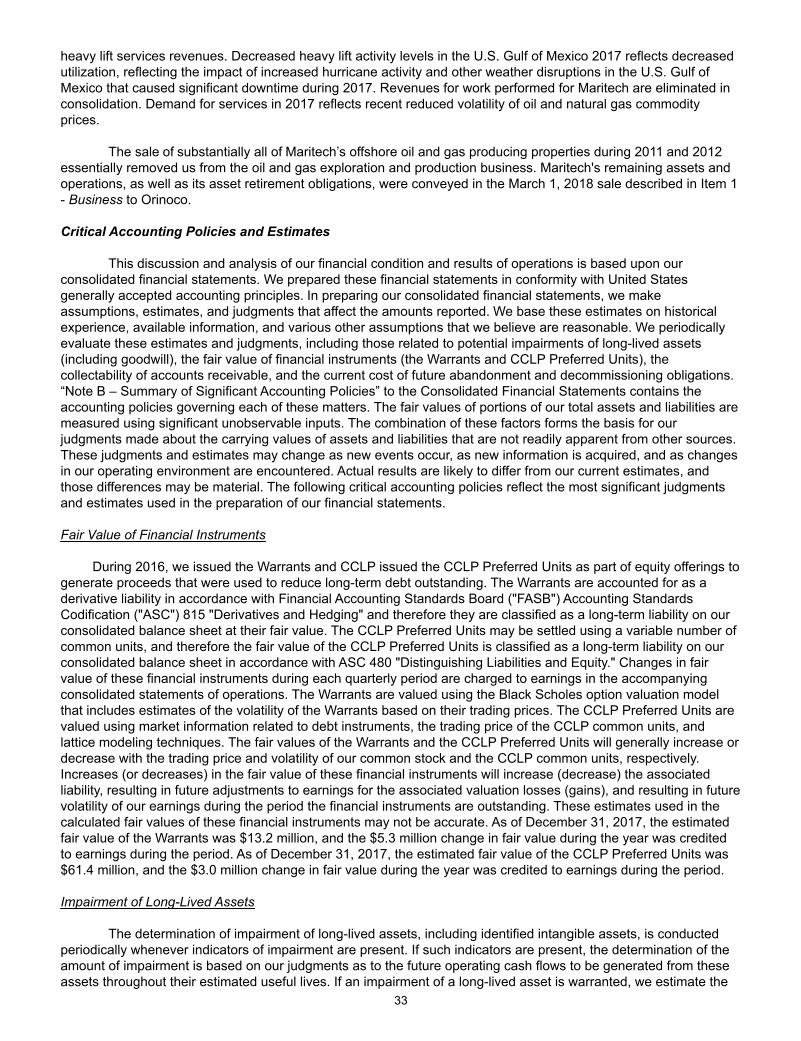
33
heavy lift services revenues. Decreased heavy lift activity levels in the U.S. Gulf of Mexico 2017 reflects decreased utilization, reflecting the impact of increased hurricane activity and other weather disruptions in the U.S. Gulf of Mexico that caused significant downtime during 2017. Revenues for work performed for Maritech are eliminated in consolidation. Demand for services in 2017 reflects recent reduced volatility of oil and natural gas commodity prices.
The sale of substantially all of Maritech’s offshore oil and gas producing properties during 2011 and 2012
essentially removed us from the oil and gas exploration and production business. Maritech's remaining assets and operations, as well as its asset retirement obligations, were conveyed in the March 1, 2018 sale described in Item 1 - Business to Orinoco.
Critical Accounting Policies and Estimates This discussion and analysis of our financial condition and results of operations is based upon our
consolidated financial statements. We prepared these financial statements in conformity with United States generally accepted accounting principles. In preparing our consolidated financial statements, we make assumptions, estimates, and judgments that affect the amounts reported. We base these estimates on historical experience, available information, and various other assumptions that we believe are reasonable. We periodically evaluate these estimates and judgments, including those related to potential impairments of long-lived assets (including goodwill), the fair value of financial instruments (the Warrants and CCLP Preferred Units), the collectability of accounts receivable, and the current cost of future abandonment and decommissioning obligations. “Note B – Summary of Significant Accounting Policies” to the Consolidated Financial Statements contains the accounting policies governing each of these matters. The fair values of portions of our total assets and liabilities are measured using significant unobservable inputs. The combination of these factors forms the basis for our judgments made about the carrying values of assets and liabilities that are not readily apparent from other sources. These judgments and estimates may change as new events occur, as new information is acquired, and as changes in our operating environment are encountered. Actual results are likely to differ from our current estimates, and those differences may be material. The following critical accounting policies reflect the most significant judgments and estimates used in the preparation of our financial statements.
Fair Value of Financial Instruments
During 2016, we issued the Warrants and CCLP issued the CCLP Preferred Units as part of equity offerings to generate proceeds that were used to reduce long-term debt outstanding. The Warrants are accounted for as a derivative liability in accordance with Financial Accounting Standards Board ("FASB") Accounting Standards Codification ("ASC") 815 "Derivatives and Hedging" and therefore they are classified as a long-term liability on our consolidated balance sheet at their fair value. The CCLP Preferred Units may be settled using a variable number of common units, and therefore the fair value of the CCLP Preferred Units is classified as a long-term liability on our consolidated balance sheet in accordance with ASC 480 "Distinguishing Liabilities and Equity." Changes in fair value of these financial instruments during each quarterly period are charged to earnings in the accompanying consolidated statements of operations. The Warrants are valued using the Black Scholes option valuation model that includes estimates of the volatility of the Warrants based on their trading prices. The CCLP Preferred Units are valued using market information related to debt instruments, the trading price of the CCLP common units, and lattice modeling techniques. The fair values of the Warrants and the CCLP Preferred Units will generally increase or decrease with the trading price and volatility of our common stock and the CCLP common units, respectively. Increases (or decreases) in the fair value of these financial instruments will increase (decrease) the associated liability, resulting in future adjustments to earnings for the associated valuation losses (gains), and resulting in future volatility of our earnings during the period the financial instruments are outstanding. These estimates used in the calculated fair values of these financial instruments may not be accurate. As of December 31, 2017, the estimated fair value of the Warrants was $13.2 million, and the $5.3 million change in fair value during the year was credited to earnings during the period. As of December 31, 2017, the estimated fair value of the CCLP Preferred Units was $61.4 million, and the $3.0 million change in fair value during the year was credited to earnings during the period.
Impairment of Long-Lived Assets The determination of impairment of long-lived assets, including identified intangible assets, is conducted
periodically whenever indicators of impairment are present. If such indicators are present, the determination of the amount of impairment is based on our judgments as to the future operating cash flows to be generated from these assets throughout their estimated useful lives. If an impairment of a long-lived asset is warranted, we estimate the

34
fair value of the asset based on a present value of these cash flows or the value that could be realized from disposing of the asset in a transaction between market participants. The oil and gas industry is cyclical, and our estimates of the amount of future cash flows, the period over which these estimated future cash flows will be generated, as well as the fair value of an impaired asset, are imprecise. Our failure to accurately estimate these future operating cash flows or fair values could result in certain long-lived assets being overstated, which could result in impairment charges in periods subsequent to the time in which the impairment indicators were first present. Alternatively, if our estimates of future operating cash flows or fair values are understated, impairments might be recognized unnecessarily or in excess of the appropriate amounts. During 2017, primarily as a result of the decreased expected future cash flows from a specific customer contract, we recorded consolidated long-lived asset impairments of $14.9 million. During periods of economic uncertainty, the likelihood of additional material impairments of long-lived assets is higher due to the possibility of decreased demand for our products and services.
Impairment of Goodwill
The impairment of goodwill is also assessed whenever impairment indicators are present, but not less than
once annually. As of December 31, 2017, consolidated goodwill consists of the $6.6 million goodwill attributed to our Fluids reporting unit. The assessment for goodwill impairment begins with a qualitative assessment of whether it is “more likely than not” that the fair value of each reporting unit is less than its carrying value. This qualitative assessment requires the evaluation, based on the weight of evidence, of the significance of all identified events and circumstances for each reporting unit. Based on this qualitative assessment, we determined that due to the reduced volatility of oil and natural gas commodity prices during 2017 and the improving demand for the products and services for our Fluids Division businesses, it was not “more likely than not” that the fair value of our Fluids reporting unit was less than its carrying value as of December 31, 2017.
When the qualitative analysis indicates that it is “more likely than not” that a reporting unit’s fair value is less than its carrying value, the resulting goodwill impairment test consists of a two-step accounting test performed on a reporting unit basis. The first step of the impairment test is to compare the estimated fair value with the recorded net book value (including goodwill) of our reporting units. If the estimated fair value is higher than the recorded net book value, no impairment is deemed to exist and no further testing is required. If, however, the carrying amount of the reporting unit exceeds its estimated fair value, an impairment loss is calculated by comparing the carrying amount of the reporting unit’s goodwill to our estimated implied fair value of that goodwill. Our estimates of reporting unit fair value, when required, are based on a combination of an income and market approach. These estimates are imprecise and are subject to our estimates of the future cash flows of each business and our judgment as to how these estimated cash flows translate into each business’ estimated fair value. These estimates and judgments are affected by numerous factors, including the general economic environment at the time of our assessment, which affects our overall market capitalization. If we overestimate the fair value of our reporting units, the balance of our goodwill asset may be overstated. Alternatively, if our estimated reporting unit fair values are understated, impairments might be recognized unnecessarily or in excess of the appropriate amounts.
Throughout 2015 and 2016, lower oil and natural gas commodity prices resulted in a decreased demand for many of the products and services of each of our reporting units. Specifically to our Compression Division, demand for low-horsepower wellhead compression services and for sales of compressor equipment was decreased significantly. Accordingly, the fair value for the Compression Division reporting unit, including the market capitalization for CCLP, was less than its carrying value as of December 31, 2015. In addition, during the first quarter of 2016, as the market for services of CCLP continued to decline, the market capitalization of CCLP dropped significantly from December 31, 2015. Accordingly, the fair value, including the market capitalization for CCLP, for the Compression reporting unit was less than its carrying value as of March 31, 2016, despite impairments recorded as of December 31, 2015. For our Production Testing Division reporting unit, demand for production testing services was decreased in each of the market areas in which we operate, resulting in decreased estimated future cash flows. As a result, the fair value of the Production Testing reporting unit was also less than its carrying value as of December 31, 2015. In addition, the market activity continued to decrease during the first quarter of 2016 and as a result the fair value of the Production Testing reporting unit was also less than its carrying value as of March 31, 2016, despite impairments recorded as of December 31, 2015. After making the hypothetical purchase price adjustments as part of the second step of the goodwill impairment test as of March 31, 2016, there was $0.0 million residual purchase price to be allocated to the goodwill of the Compression reporting unit and $0.0 million residual purchase price to be allocated to the goodwill of the Production Testing reporting unit. Based on this analysis, we concluded that a full impairment of $92.3 million of remaining recorded goodwill for Compression and a
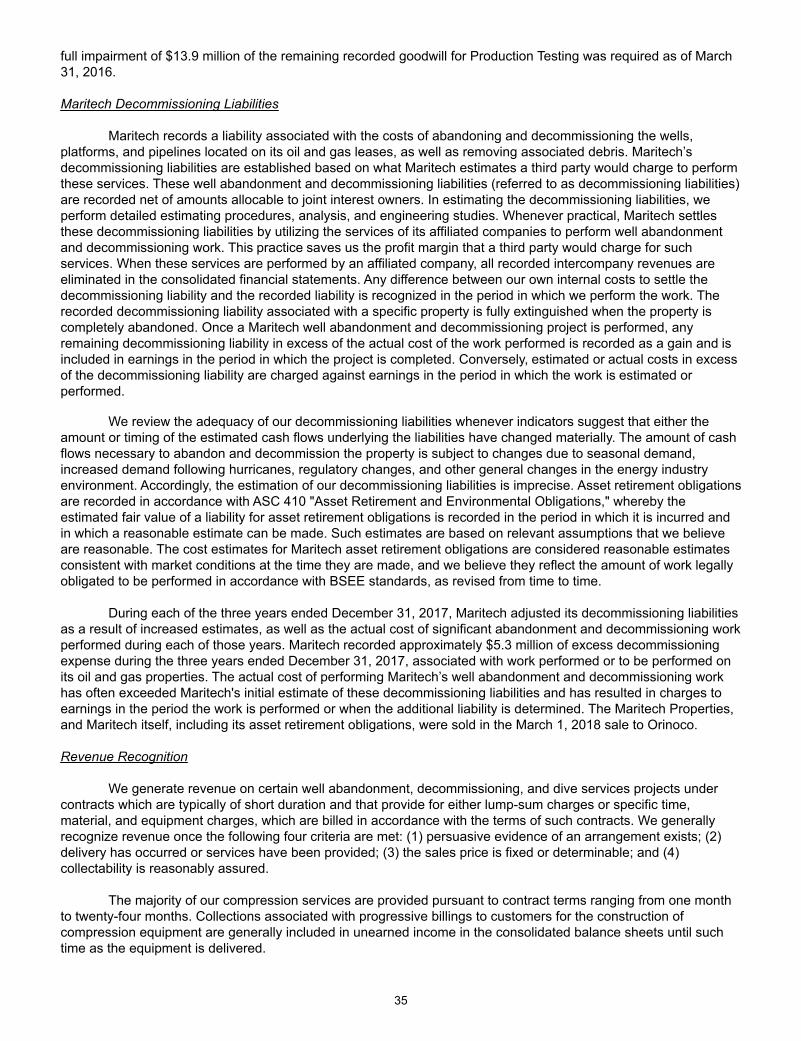
35
full impairment of $13.9 million of the remaining recorded goodwill for Production Testing was required as of March 31, 2016.
Maritech Decommissioning Liabilities Maritech records a liability associated with the costs of abandoning and decommissioning the wells,
platforms, and pipelines located on its oil and gas leases, as well as removing associated debris. Maritech’s decommissioning liabilities are established based on what Maritech estimates a third party would charge to perform these services. These well abandonment and decommissioning liabilities (referred to as decommissioning liabilities) are recorded net of amounts allocable to joint interest owners. In estimating the decommissioning liabilities, we perform detailed estimating procedures, analysis, and engineering studies. Whenever practical, Maritech settles these decommissioning liabilities by utilizing the services of its affiliated companies to perform well abandonment and decommissioning work. This practice saves us the profit margin that a third party would charge for such services. When these services are performed by an affiliated company, all recorded intercompany revenues are eliminated in the consolidated financial statements. Any difference between our own internal costs to settle the decommissioning liability and the recorded liability is recognized in the period in which we perform the work. The recorded decommissioning liability associated with a specific property is fully extinguished when the property is completely abandoned. Once a Maritech well abandonment and decommissioning project is performed, any remaining decommissioning liability in excess of the actual cost of the work performed is recorded as a gain and is included in earnings in the period in which the project is completed. Conversely, estimated or actual costs in excess of the decommissioning liability are charged against earnings in the period in which the work is estimated or performed.
We review the adequacy of our decommissioning liabilities whenever indicators suggest that either the
amount or timing of the estimated cash flows underlying the liabilities have changed materially. The amount of cash flows necessary to abandon and decommission the property is subject to changes due to seasonal demand, increased demand following hurricanes, regulatory changes, and other general changes in the energy industry environment. Accordingly, the estimation of our decommissioning liabilities is imprecise. Asset retirement obligations are recorded in accordance with ASC 410 "Asset Retirement and Environmental Obligations," whereby the estimated fair value of a liability for asset retirement obligations is recorded in the period in which it is incurred and in which a reasonable estimate can be made. Such estimates are based on relevant assumptions that we believe are reasonable. The cost estimates for Maritech asset retirement obligations are considered reasonable estimates consistent with market conditions at the time they are made, and we believe they reflect the amount of work legally obligated to be performed in accordance with BSEE standards, as revised from time to time. During each of the three years ended December 31, 2017, Maritech adjusted its decommissioning liabilities as a result of increased estimates, as well as the actual cost of significant abandonment and decommissioning work performed during each of those years. Maritech recorded approximately $5.3 million of excess decommissioning expense during the three years ended December 31, 2017, associated with work performed or to be performed on its oil and gas properties. The actual cost of performing Maritech’s well abandonment and decommissioning work has often exceeded Maritech's initial estimate of these decommissioning liabilities and has resulted in charges to earnings in the period the work is performed or when the additional liability is determined. The Maritech Properties, and Maritech itself, including its asset retirement obligations, were sold in the March 1, 2018 sale to Orinoco.
Revenue Recognition
We generate revenue on certain well abandonment, decommissioning, and dive services projects under
contracts which are typically of short duration and that provide for either lump-sum charges or specific time, material, and equipment charges, which are billed in accordance with the terms of such contracts. We generally recognize revenue once the following four criteria are met: (1) persuasive evidence of an arrangement exists; (2) delivery has occurred or services have been provided; (3) the sales price is fixed or determinable; and (4) collectability is reasonably assured.
The majority of our compression services are provided pursuant to contract terms ranging from one month to twenty-four months. Collections associated with progressive billings to customers for the construction of compression equipment are generally included in unearned income in the consolidated balance sheets until such time as the equipment is delivered.

36
Income Taxes We are a U.S. company and are subject to income taxes in the U.S. We also operate in a number of
countries under many legal forms. Our operations are taxed on various bases, including actual income before taxes, deemed profits (which are generally determined using a percentage of revenue rather than profits) and withholding taxes based on revenue. Determination of taxable income in any jurisdiction requires the interpretation of the applicable tax laws and regulations and the use of estimates and assumptions regarding significant future events such as the amount, timing, and character of deductions, permissible revenue recognition methods under the applicable tax laws, and the sources and character of income and tax credits.
We provide for income taxes by taking into account the differences between the financial statement treatment and tax treatment of certain transactions. Deferred tax assets and liabilities are recognized for the anticipated future tax consequences attributable to differences between the financial statement carrying amounts of existing assets and liabilities and their respective tax basis amounts. Deferred tax assets and liabilities are measured using enacted tax rates expected to apply to taxable income in the years in which those temporary differences are expected to be recovered or settled. The effect of a change in tax rates is recognized as income or expense in the period that includes the enactment date. Management must make certain assumptions regarding whether tax differences are permanent or temporary and must estimate the timing of their reversal, and whether taxable operating income in future periods will be sufficient to fully recognize any gross deferred tax assets.
We establish valuation allowances to reduce deferred tax assets when it is more likely than not that some portion or all of the deferred tax assets will not be realized. In determining the need for valuation allowances, management has considered and made judgments and estimates regarding estimated future taxable income and ongoing prudent and feasible tax planning strategies. Changes in state, federal, and foreign tax laws, as well as changes in our financial condition, could affect these estimates.
In addition, we maintain liabilities for estimated tax exposures and uncertainties in jurisdictions where we operate. The annual tax provision includes the impact of income tax provisions and benefits for changes to liabilities that we consider appropriate, as well as related interest and penalties. We consider many factors when evaluating and estimating income tax uncertainties. These factors include an evaluation of the technical merits of the tax position as well as the amounts and probabilities of the outcomes that could be realized upon ultimate settlement. The actual resolution of those uncertainties will inevitably differ from those estimates, and such differences may be material to the financial statements. We believe that an appropriate liability has been established for the estimated exposures associated with these uncertainties under the guidance in ASC 740 “Income Taxes.” However, the actual resolution of those uncertainties will inevitably differ from those estimates, and such differences may be material to our consolidated financial statements. On December 22, 2017, H.R.1, “An Act to Provide the Reconciliation Pursuant to Titles II and V of the Concurrent Resolution on the Budget for Fiscal Year 2018” (the “Act”) (previously known as “The Tax Cuts and Jobs Act”) was signed into law making significant changes to the Internal Revenue Code. Changes include, but are not limited to, a corporate tax rate decrease from 35% to 21% effective for tax years beginning after December 31, 2017, the transition of U.S. international taxation from a worldwide tax system to a territorial system, and a one-time transition tax on the mandatory deemed repatriation of cumulative foreign earnings as of December 31, 2017. We have calculated our best estimate of the impact of the Act in our year end income tax provision in accordance with our understanding of the Act and guidance available as of the date of this filing. See "Note E - Income Taxes" contained in the Notes to Consolidated Financial Statements for the effect on our 2017 tax provision.
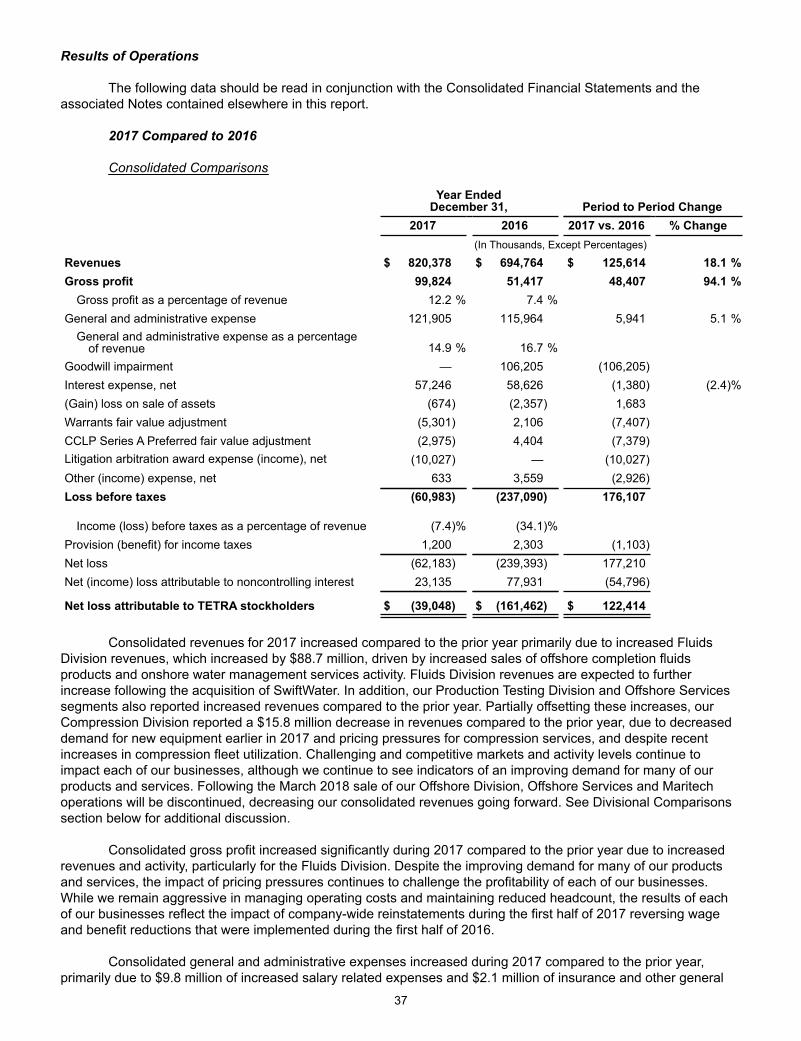
37
Results of Operations
The following data should be read in conjunction with the Consolidated Financial Statements and the associated Notes contained elsewhere in this report.
2017 Compared to 2016 Consolidated Comparisons
Year EndedDecember 31, Period to Period Change
2017 2016 2017 vs. 2016 % Change (In Thousands, Except Percentages)
Revenues $ 820,378 $ 694,764 $ 125,614 18.1 %Gross profit 99,824 51,417 48,407 94.1 %
Gross profit as a percentage of revenue 12.2 % 7.4 % General and administrative expense 121,905 115,964 5,941 5.1 %
General and administrative expense as a percentageof revenue 14.9 % 16.7 %
Goodwill impairment — 106,205 (106,205)Interest expense, net 57,246 58,626 (1,380) (2.4)%(Gain) loss on sale of assets (674) (2,357) 1,683 Warrants fair value adjustment (5,301) 2,106 (7,407)CCLP Series A Preferred fair value adjustment (2,975) 4,404 (7,379)Litigation arbitration award expense (income), net (10,027) — (10,027)Other (income) expense, net 633 3,559 (2,926) Loss before taxes (60,983) (237,090) 176,107
Income (loss) before taxes as a percentage of revenue (7.4)% (34.1)% Provision (benefit) for income taxes 1,200 2,303 (1,103)Net loss (62,183) (239,393) 177,210Net (income) loss attributable to noncontrolling interest 23,135 77,931 (54,796)
Net loss attributable to TETRA stockholders $ (39,048) $ (161,462) $ 122,414
Consolidated revenues for 2017 increased compared to the prior year primarily due to increased Fluids
Division revenues, which increased by $88.7 million, driven by increased sales of offshore completion fluids products and onshore water management services activity. Fluids Division revenues are expected to further increase following the acquisition of SwiftWater. In addition, our Production Testing Division and Offshore Services segments also reported increased revenues compared to the prior year. Partially offsetting these increases, our Compression Division reported a $15.8 million decrease in revenues compared to the prior year, due to decreased demand for new equipment earlier in 2017 and pricing pressures for compression services, and despite recent increases in compression fleet utilization. Challenging and competitive markets and activity levels continue to impact each of our businesses, although we continue to see indicators of an improving demand for many of our products and services. Following the March 2018 sale of our Offshore Division, Offshore Services and Maritech operations will be discontinued, decreasing our consolidated revenues going forward. See Divisional Comparisons section below for additional discussion.
Consolidated gross profit increased significantly during 2017 compared to the prior year due to increased revenues and activity, particularly for the Fluids Division. Despite the improving demand for many of our products and services, the impact of pricing pressures continues to challenge the profitability of each of our businesses. While we remain aggressive in managing operating costs and maintaining reduced headcount, the results of each of our businesses reflect the impact of company-wide reinstatements during the first half of 2017 reversing wage and benefit reductions that were implemented during the first half of 2016.
Consolidated general and administrative expenses increased during 2017 compared to the prior year, primarily due to $9.8 million of increased salary related expenses and $2.1 million of insurance and other general

38
expenses, partly offset by decreased professional services fees of $4.3 million and decreased bad debt expense of $1.5 million. Due to the increased consolidated revenues discussed above, general and administrative expense as a percentage of revenues decreased compared to the prior year.
During the first quarter of 2016, we updated our test of goodwill impairment in accordance with the Financial Accounting Standards Board ("FASB") Accounting Standards Codification ("ASC") 350-20 "Goodwill" due to the decreases in the price of our common stock and the common unit price of CCLP. The continued decreased oil and natural gas commodity prices had, and were expected to have, a continuing negative impact on industry drilling and capital expenditure activity, which affects the expected demand for products and services of each of our reporting units. Specifically, demand for our Compression Division's compression services and for sales of compressor equipment had decreased significantly and was expected to continue to be decreased for the foreseeable future. Demand for our Production Testing Division's services also had decreased as a result of decreased drilling and completion activity. This expected decreased demand, along with the decreases in the price of our common stock and the common unit price of our CCLP subsidiary, also caused an overall reduction in the fair values of each of our reporting units, particularly our Compression and Production Testing reporting units. As part of the test of goodwill impairment, we estimated the fair value of each of our reporting units, and determined, based on these estimated values, that impairments of the remaining goodwill of our Compression and Production Testing reporting units were necessary, primarily due to the market factors discussed above. Accordingly, during the first quarter of 2016, we recorded total impairment charges of $106.2 million associated with the goodwill of these reporting units. We did not recorded any goodwill impairment charges during 2017.
Consolidated interest expense, net, decreased in 2017 compared to the prior year primarily due to the decrease in Corporate interest expense, reflecting the decrease in long-term debt outstanding. Largely offsetting this decrease, Compression Division interest expense increased related to the paid in kind distributions on the CCLP Preferred Units that were issued during late 2016. Interest expense during 2017 and 2016 includes $4.7 million and $4.1 million, respectively, of finance cost amortization.
Gain on sales of assets decreased during 2017 compared to the prior year primarily due to significant gains
on sales of Production Testing Division assets during 2016.
The Warrants are accounted for as a derivative liability in accordance with ASC 815 and therefore they are classified as a long-term liability on our consolidated balance sheet at their fair value. Increases (or decreases) in the fair value of the Warrants are generally associated with the increase (or decrease) in the trading price of our common stock, resulting in adjustments to earnings for the associated valuation losses (gains), and resulting in future volatility of our earnings during the period the Warrants are outstanding.
The CCLP Preferred Units may be settled using a variable number of CCLP common units, and therefore the fair value of the CCLP Preferred Units is classified as a long-term liability on our consolidated balance sheet in accordance with ASC 480. Because the CCLP Preferred Units are convertible into CCLP common units at the option of the holder, the fair value of the CCLP Preferred Units will generally increase or decrease with the trading price of the CCLP common units, and this increase (decrease) in CCLP Preferred Unit fair value will be charged (credited) to earnings, resulting in future volatility of our earnings during the period the CCLP Preferred Units are outstanding.
In January 2017, our Fluids Division collected $12.8 million from a successful legal arbitration award, resulting in a credit to earnings. See Commitments and Contingencies - Litigation section below for additional discussion. Partially offsetting this award, the Offshore Services segment recorded a charge to earnings of $2.8 million associated with a litigation arbitration ruling related to a dispute over leased vessel charges.
Consolidated other (income) expense, net, was $0.6 million of expense during 2017 compared to $3.6 million of expense during the prior year, with the improvement primarily due to $2.1 million of issuance costs from the CCLP Preferred Units which were issued during the prior year and $1.8 million of unamortized deferred finance costs that were charged to earnings in the prior year as a result of the repayment of senior notes and senior secured notes. In addition, $0.6 million of insurance recoveries were credited to other income during 2017. Partially offsetting these decreases is $2.9 million of decreased other income associated with Maritech, $2.4 million of decreased currency gains, and $1.4 million of decreased net gains on the extinguishment of the CCLP 7.25% Senior Notes.
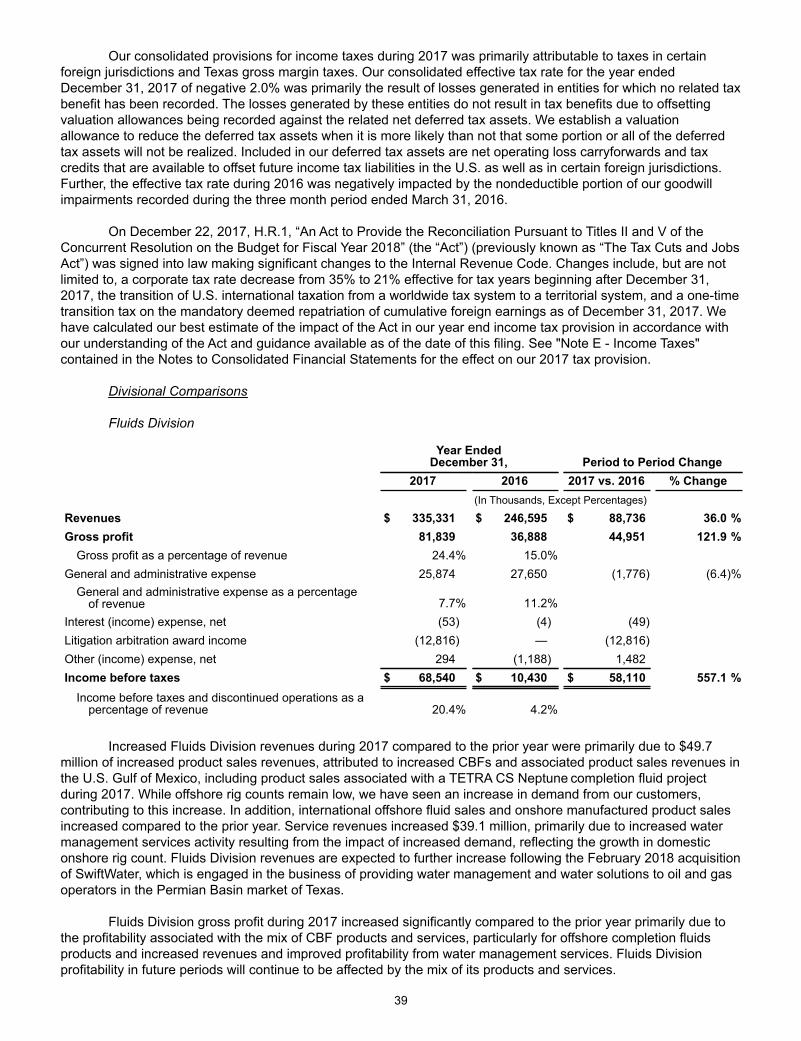
39
Our consolidated provisions for income taxes during 2017 was primarily attributable to taxes in certain foreign jurisdictions and Texas gross margin taxes. Our consolidated effective tax rate for the year ended December 31, 2017 of negative 2.0% was primarily the result of losses generated in entities for which no related tax benefit has been recorded. The losses generated by these entities do not result in tax benefits due to offsetting valuation allowances being recorded against the related net deferred tax assets. We establish a valuation allowance to reduce the deferred tax assets when it is more likely than not that some portion or all of the deferred tax assets will not be realized. Included in our deferred tax assets are net operating loss carryforwards and tax credits that are available to offset future income tax liabilities in the U.S. as well as in certain foreign jurisdictions. Further, the effective tax rate during 2016 was negatively impacted by the nondeductible portion of our goodwill impairments recorded during the three month period ended March 31, 2016.
On December 22, 2017, H.R.1, “An Act to Provide the Reconciliation Pursuant to Titles II and V of the Concurrent Resolution on the Budget for Fiscal Year 2018” (the “Act”) (previously known as “The Tax Cuts and Jobs Act”) was signed into law making significant changes to the Internal Revenue Code. Changes include, but are not limited to, a corporate tax rate decrease from 35% to 21% effective for tax years beginning after December 31, 2017, the transition of U.S. international taxation from a worldwide tax system to a territorial system, and a one-time transition tax on the mandatory deemed repatriation of cumulative foreign earnings as of December 31, 2017. We have calculated our best estimate of the impact of the Act in our year end income tax provision in accordance with our understanding of the Act and guidance available as of the date of this filing. See "Note E - Income Taxes" contained in the Notes to Consolidated Financial Statements for the effect on our 2017 tax provision.
Divisional Comparisons Fluids Division
Year EndedDecember 31, Period to Period Change
2017 2016 2017 vs. 2016 % Change (In Thousands, Except Percentages)
Revenues $ 335,331 $ 246,595 $ 88,736 36.0 %Gross profit 81,839 36,888 44,951 121.9 %
Gross profit as a percentage of revenue 24.4% 15.0% General and administrative expense 25,874 27,650 (1,776) (6.4)%
General and administrative expense as a percentageof revenue 7.7% 11.2%
Interest (income) expense, net (53) (4) (49) Litigation arbitration award income (12,816) — (12,816)Other (income) expense, net 294 (1,188) 1,482 Income before taxes $ 68,540 $ 10,430 $ 58,110 557.1 %
Income before taxes and discontinued operations as apercentage of revenue 20.4% 4.2%
Increased Fluids Division revenues during 2017 compared to the prior year were primarily due to $49.7
million of increased product sales revenues, attributed to increased CBFs and associated product sales revenues in the U.S. Gulf of Mexico, including product sales associated with a TETRA CS Neptune completion fluid project during 2017. While offshore rig counts remain low, we have seen an increase in demand from our customers, contributing to this increase. In addition, international offshore fluid sales and onshore manufactured product sales increased compared to the prior year. Service revenues increased $39.1 million, primarily due to increased water management services activity resulting from the impact of increased demand, reflecting the growth in domestic onshore rig count. Fluids Division revenues are expected to further increase following the February 2018 acquisition of SwiftWater, which is engaged in the business of providing water management and water solutions to oil and gas operators in the Permian Basin market of Texas.
Fluids Division gross profit during 2017 increased significantly compared to the prior year primarily due to the profitability associated with the mix of CBF products and services, particularly for offshore completion fluids products and increased revenues and improved profitability from water management services. Fluids Division profitability in future periods will continue to be affected by the mix of its products and services.
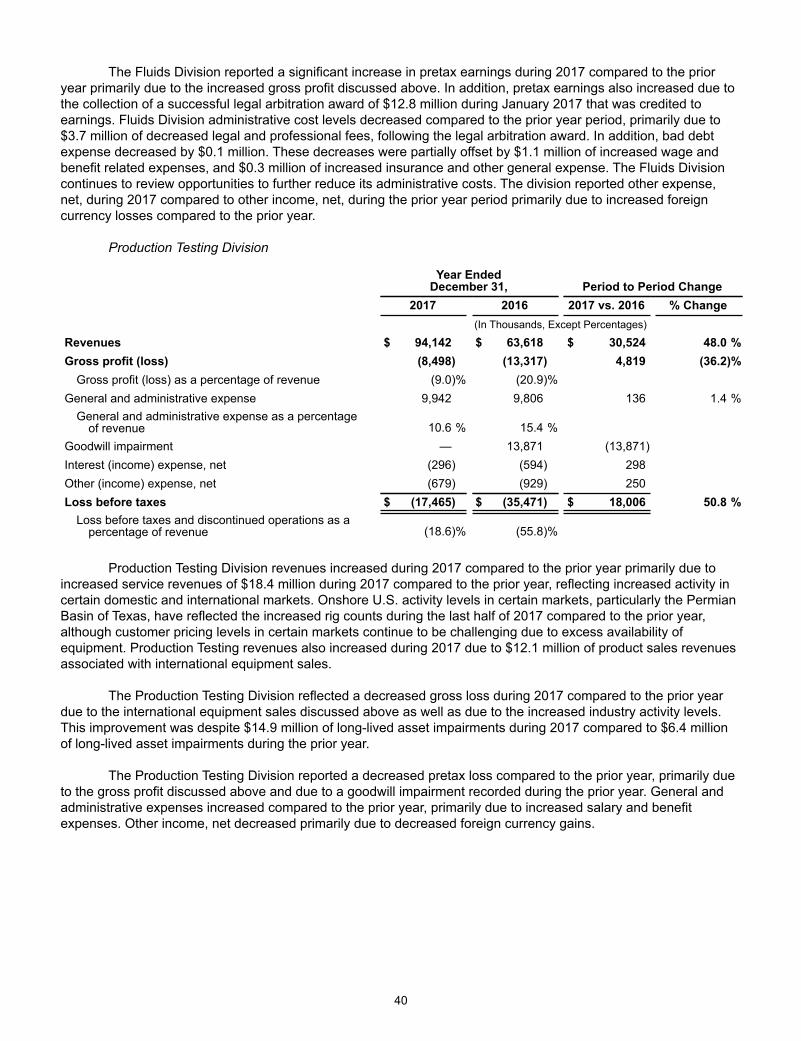
40
The Fluids Division reported a significant increase in pretax earnings during 2017 compared to the prior year primarily due to the increased gross profit discussed above. In addition, pretax earnings also increased due to the collection of a successful legal arbitration award of $12.8 million during January 2017 that was credited to earnings. Fluids Division administrative cost levels decreased compared to the prior year period, primarily due to $3.7 million of decreased legal and professional fees, following the legal arbitration award. In addition, bad debt expense decreased by $0.1 million. These decreases were partially offset by $1.1 million of increased wage and benefit related expenses, and $0.3 million of increased insurance and other general expense. The Fluids Division continues to review opportunities to further reduce its administrative costs. The division reported other expense, net, during 2017 compared to other income, net, during the prior year period primarily due to increased foreign currency losses compared to the prior year.
Production Testing Division
Year EndedDecember 31, Period to Period Change
2017 2016 2017 vs. 2016 % Change (In Thousands, Except Percentages)
Revenues $ 94,142 $ 63,618 $ 30,524 48.0 %Gross profit (loss) (8,498) (13,317) 4,819 (36.2)%
Gross profit (loss) as a percentage of revenue (9.0)% (20.9)% General and administrative expense 9,942 9,806 136 1.4 %
General and administrative expense as a percentageof revenue 10.6 % 15.4 %
Goodwill impairment — 13,871 (13,871)Interest (income) expense, net (296) (594) 298 Other (income) expense, net (679) (929) 250 Loss before taxes $ (17,465) $ (35,471) $ 18,006 50.8 %
Loss before taxes and discontinued operations as apercentage of revenue (18.6)% (55.8)%
Production Testing Division revenues increased during 2017 compared to the prior year primarily due to
increased service revenues of $18.4 million during 2017 compared to the prior year, reflecting increased activity in certain domestic and international markets. Onshore U.S. activity levels in certain markets, particularly the Permian Basin of Texas, have reflected the increased rig counts during the last half of 2017 compared to the prior year, although customer pricing levels in certain markets continue to be challenging due to excess availability of equipment. Production Testing revenues also increased during 2017 due to $12.1 million of product sales revenues associated with international equipment sales.
The Production Testing Division reflected a decreased gross loss during 2017 compared to the prior year due to the international equipment sales discussed above as well as due to the increased industry activity levels. This improvement was despite $14.9 million of long-lived asset impairments during 2017 compared to $6.4 million of long-lived asset impairments during the prior year.
The Production Testing Division reported a decreased pretax loss compared to the prior year, primarily due to the gross profit discussed above and due to a goodwill impairment recorded during the prior year. General and administrative expenses increased compared to the prior year, primarily due to increased salary and benefit expenses. Other income, net decreased primarily due to decreased foreign currency gains.
41
Compression Division
Year EndedDecember 31, Period to Period Change
2017 2016 2017 vs. 2016 % Change (In Thousands, Except Percentages)
Revenues $ 295,587 $ 311,374 $ (15,787) (5.1)%Gross profit 35,114 37,681 (2,567) (6.8)%
Gross profit as a percentage of revenue 11.9 % 12.1 % General and administrative expense 33,442 36,199 (2,757) (7.6)%
General and administrative expense as a percentageof revenue 11.3 % 11.6 %
Goodwill impairment — 92,334 (92,334)Interest (income) expense, net 42,082 38,055 4,027 CCLP Series A Preferred fair value adjustment (2,975) 5,036 (8,011)Other (income) expense, net (189) 2,384 (2,573) Income (loss) before taxes $ (37,246) $ (136,327) $ 99,081 (72.7)%
Income (loss) before taxes and discontinuedoperations as a percentage of revenue (12.6)% (43.8)%
Compression Division revenues decreased during 2017 compared to the prior year due to reductions in both compression and related services revenues and compressor sales revenues. The $10.7 million decrease in compression and related service revenues resulted primarily from the reduction in pricing for compression services, and was realized despite increased overall compressor fleet utilization. Increased demand is expected to result in improved customer pricing during 2018. Although overall utilization of the Compression Division's compressor fleet has improved sequentially for five consecutive quarterly periods, demand for low-horsepower production enhancement compression services remains challenged. Revenues from sales of compressor packages and parts during 2017 decreased $5.1 million compared to the prior year period primarily due to decreased sales of new compressor packages. However, given the significant increase in new compression equipment sales backlog during the last half of 2017 and early 2018, increased sales of compressor packages are expected beginning in 2018.
Compression Division gross profit decreased during 2017 compared to the prior year despite an approximately $2.4 million insurance recovery in 2017 for equipment that was damaged and impaired in the prior year, and despite a $10.2 million impairment of long-lived assets that was recorded during the prior year period. This decrease in gross profit was primarily due to the competitive compression services customer pricing pressures discussed above. Although some customer pricing still remains lower than early 2016 levels, pricing pressures have been easing, and pricing for compression services is expected to continue to improve going forward.
The Compression Division recorded a decreased pretax loss during 2017 compared to the prior year period primarily due to the impact of goodwill impairment recorded during the prior year. In addition, the fair value adjustment of the CCLP Preferred Units was credited to earnings during 2017 compared to a charge to earnings in the prior year. Changes in the fair value of the CCLP Preferred Units may generate additional volatility to our earnings going forward. Also, general and administrative expense levels decreased compared to the prior year, mainly due to decreased professional fees of $1.0 million, decreased bad debt expense of $0.7 million, decreased salary related expenses of $0.5 million and decreased other expenses of $0.3 million. The Compression Division recorded other income, net, during 2017 compared to other expense, net, during the prior year due to $2.1 million of CCLP Preferred Units issuance costs that were expensed during the prior year, and due to $0.6 million of insurance recoveries credited to other income during 2017. These decreased expenses were partially offset by the decreased gross profit discussed above, and due to increased interest expense, net, compared to the prior year due to the expense associated with paid in kind distributions on the CCLP Preferred Units, that were issued during the third quarter of 2016.
Offshore Division
On March 1, 2018, we closed a series of related transactions that resulted in the disposition of the Offshore Division. Pursuant to the Maritech Asset Purchase Agreement with Orinoco, Orinoco purchased the Maritech Properties. Immediately thereafter, we closed the Maritech Equity Purchase Agreement with Orinoco, whereby

42
Orinoco purchased the Maritech Equity Interests. Immediately thereafter, we closed the Offshore Services Purchase Agreement with Epic Offshore, an affiliate of Orinoco, whereby Epic Offshore purchased (the "Offshore Services Sale") all of the Offshore Services Equity Interests. As a result of these transactions, we have effectively exited the businesses of our Offshore Services and Maritech segments. As a result of these transactions, our consolidated results of operations for the quarterly period ending March 31, 2018, will include a loss on the disposal of our Offshore Division, estimated to range from approximately $33.0 million to $35.0 million.
Offshore Services Segment
Year EndedDecember 31, Period to Period Change
2017 2016 2017 vs. 2016 % Change (In Thousands, Except Percentages)
Revenues $ 96,741 $ 77,525 $ 19,216 24.8 %Gross profit (loss) (6,612) (5,574) (1,038) (18.6)%
Gross profit as a percentage of revenue (6.8)% (7.2)% General and administrative expense 5,708 6,454 (746) (11.6)%
General and administrative expense as a percentageof revenue 5.9 % 8.3 %
Litigation arbitration award expense 2,789 — 2,789Other (income) expense, net (342) (3) (339)
Loss before taxes $ (14,767) $ (12,025) $ (2,742) (22.8)%Loss before taxes and discontinued operations as a
percentage of revenue (15.3)% (15.5)%
Revenues for the Offshore Services segment increased during 2017 compared to the prior year due to increased revenues from its diving, well abandonment, and cutting services businesses. Heavy lift activity revenues decreased slightly during 2017, reflecting decreased utilization, due to the impact of increased hurricane activity and other weather disruptions in the U.S. Gulf of Mexico that caused significant downtime during 2017. Additionally, the remainder of Offshore Services businesses were also negatively impacted by the more significant weather downtime. There were no revenues from Offshore Services work performed for our Maritech segment during 2017.
The Offshore Services segment reported an increased gross loss for 2017 as the impact of decreased activity levels for heavy lift services more than offset the improved profitability from diving, well abandonment, and cutting services businesses. The gross loss was increased due to weather disruptions during 2017 as noted above. In addition, significant activity levels have resulted in the Offshore Services segment leasing third-party equipment to serve certain customers, resulting in increased operating costs. The Offshore Services segment also recorded a $1.1 million long-lived asset impairment during 2016.
Offshore Services segment loss before taxes increased compared to the prior year period primarily due to a
charge to earnings associated with a litigation arbitration ruling related to a dispute over leased vessel charges, as well as due to the increase gross loss discussed above. The increased segment pretax loss occurred despite a reduction in general and administrative expenses, that was primarily from reduced salary and employee related expenses of $0.9 million, partially offset by increased bad debt expenses of $0.2 million.
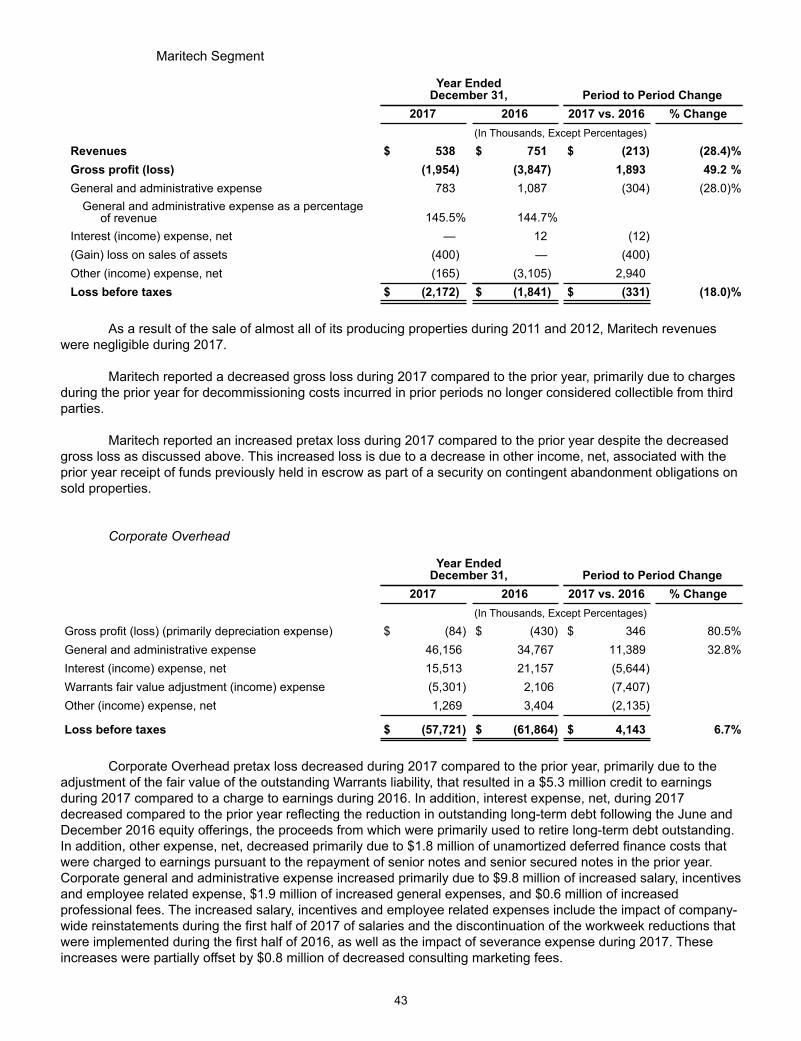
43
Maritech Segment
Year EndedDecember 31, Period to Period Change
2017 2016 2017 vs. 2016 % Change (In Thousands, Except Percentages)
Revenues $ 538 $ 751 $ (213) (28.4)%Gross profit (loss) (1,954) (3,847) 1,893 49.2 %General and administrative expense 783 1,087 (304) (28.0)%
General and administrative expense as a percentageof revenue 145.5% 144.7%
Interest (income) expense, net — 12 (12) (Gain) loss on sales of assets (400) — (400) Other (income) expense, net (165) (3,105) 2,940 Loss before taxes $ (2,172) $ (1,841) $ (331) (18.0)%
As a result of the sale of almost all of its producing properties during 2011 and 2012, Maritech revenues
were negligible during 2017.
Maritech reported a decreased gross loss during 2017 compared to the prior year, primarily due to charges during the prior year for decommissioning costs incurred in prior periods no longer considered collectible from third parties.
Maritech reported an increased pretax loss during 2017 compared to the prior year despite the decreased gross loss as discussed above. This increased loss is due to a decrease in other income, net, associated with the prior year receipt of funds previously held in escrow as part of a security on contingent abandonment obligations on sold properties.
Corporate Overhead
Year EndedDecember 31, Period to Period Change
2017 2016 2017 vs. 2016 % Change (In Thousands, Except Percentages)
Gross profit (loss) (primarily depreciation expense) $ (84) $ (430) $ 346 80.5%General and administrative expense 46,156 34,767 11,389 32.8%Interest (income) expense, net 15,513 21,157 (5,644) Warrants fair value adjustment (income) expense (5,301) 2,106 (7,407)Other (income) expense, net 1,269 3,404 (2,135)
Loss before taxes $ (57,721) $ (61,864) $ 4,143 6.7%
Corporate Overhead pretax loss decreased during 2017 compared to the prior year, primarily due to the
adjustment of the fair value of the outstanding Warrants liability, that resulted in a $5.3 million credit to earnings during 2017 compared to a charge to earnings during 2016. In addition, interest expense, net, during 2017 decreased compared to the prior year reflecting the reduction in outstanding long-term debt following the June and December 2016 equity offerings, the proceeds from which were primarily used to retire long-term debt outstanding. In addition, other expense, net, decreased primarily due to $1.8 million of unamortized deferred finance costs that were charged to earnings pursuant to the repayment of senior notes and senior secured notes in the prior year. Corporate general and administrative expense increased primarily due to $9.8 million of increased salary, incentives and employee related expense, $1.9 million of increased general expenses, and $0.6 million of increased professional fees. The increased salary, incentives and employee related expenses include the impact of company-wide reinstatements during the first half of 2017 of salaries and the discontinuation of the workweek reductions that were implemented during the first half of 2016, as well as the impact of severance expense during 2017. These increases were partially offset by $0.8 million of decreased consulting marketing fees.
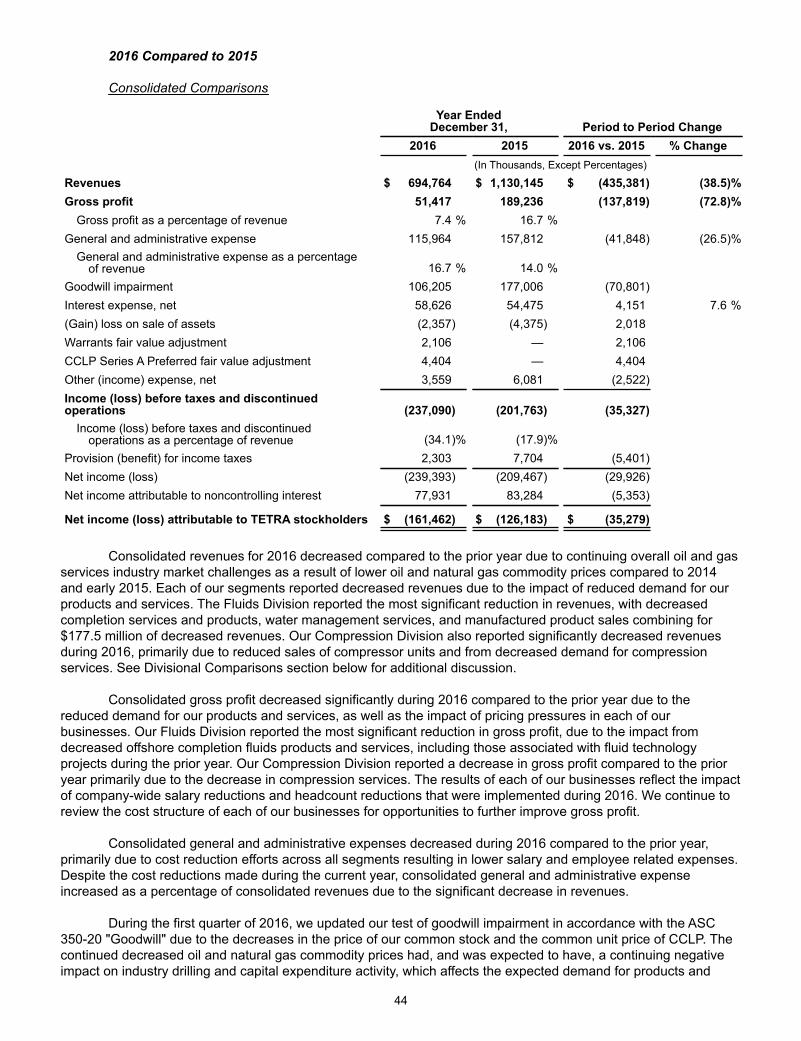
44
2016 Compared to 2015 Consolidated Comparisons
Year EndedDecember 31, Period to Period Change
2016 2015 2016 vs. 2015 % Change (In Thousands, Except Percentages)
Revenues $ 694,764 $ 1,130,145 $ (435,381) (38.5)%Gross profit 51,417 189,236 (137,819) (72.8)%
Gross profit as a percentage of revenue 7.4 % 16.7 % General and administrative expense 115,964 157,812 (41,848) (26.5)%
General and administrative expense as a percentageof revenue 16.7 % 14.0 %
Goodwill impairment 106,205 177,006 (70,801)Interest expense, net 58,626 54,475 4,151 7.6 %(Gain) loss on sale of assets (2,357) (4,375) 2,018 Warrants fair value adjustment 2,106 — 2,106CCLP Series A Preferred fair value adjustment 4,404 — 4,404Other (income) expense, net 3,559 6,081 (2,522) Income (loss) before taxes and discontinuedoperations (237,090) (201,763) (35,327)
Income (loss) before taxes and discontinuedoperations as a percentage of revenue (34.1)% (17.9)%
Provision (benefit) for income taxes 2,303 7,704 (5,401)Net income (loss) (239,393) (209,467) (29,926)Net income attributable to noncontrolling interest 77,931 83,284 (5,353)
Net income (loss) attributable to TETRA stockholders $ (161,462) $ (126,183) $ (35,279)
Consolidated revenues for 2016 decreased compared to the prior year due to continuing overall oil and gas services industry market challenges as a result of lower oil and natural gas commodity prices compared to 2014 and early 2015. Each of our segments reported decreased revenues due to the impact of reduced demand for our products and services. The Fluids Division reported the most significant reduction in revenues, with decreased completion services and products, water management services, and manufactured product sales combining for $177.5 million of decreased revenues. Our Compression Division also reported significantly decreased revenues during 2016, primarily due to reduced sales of compressor units and from decreased demand for compression services. See Divisional Comparisons section below for additional discussion.
Consolidated gross profit decreased significantly during 2016 compared to the prior year due to the reduced demand for our products and services, as well as the impact of pricing pressures in each of our businesses. Our Fluids Division reported the most significant reduction in gross profit, due to the impact from decreased offshore completion fluids products and services, including those associated with fluid technology projects during the prior year. Our Compression Division reported a decrease in gross profit compared to the prior year primarily due to the decrease in compression services. The results of each of our businesses reflect the impact of company-wide salary reductions and headcount reductions that were implemented during 2016. We continue to review the cost structure of each of our businesses for opportunities to further improve gross profit.
Consolidated general and administrative expenses decreased during 2016 compared to the prior year,
primarily due to cost reduction efforts across all segments resulting in lower salary and employee related expenses. Despite the cost reductions made during the current year, consolidated general and administrative expense increased as a percentage of consolidated revenues due to the significant decrease in revenues.
During the first quarter of 2016, we updated our test of goodwill impairment in accordance with the ASC
350-20 "Goodwill" due to the decreases in the price of our common stock and the common unit price of CCLP. The continued decreased oil and natural gas commodity prices had, and was expected to have, a continuing negative impact on industry drilling and capital expenditure activity, which affects the expected demand for products and
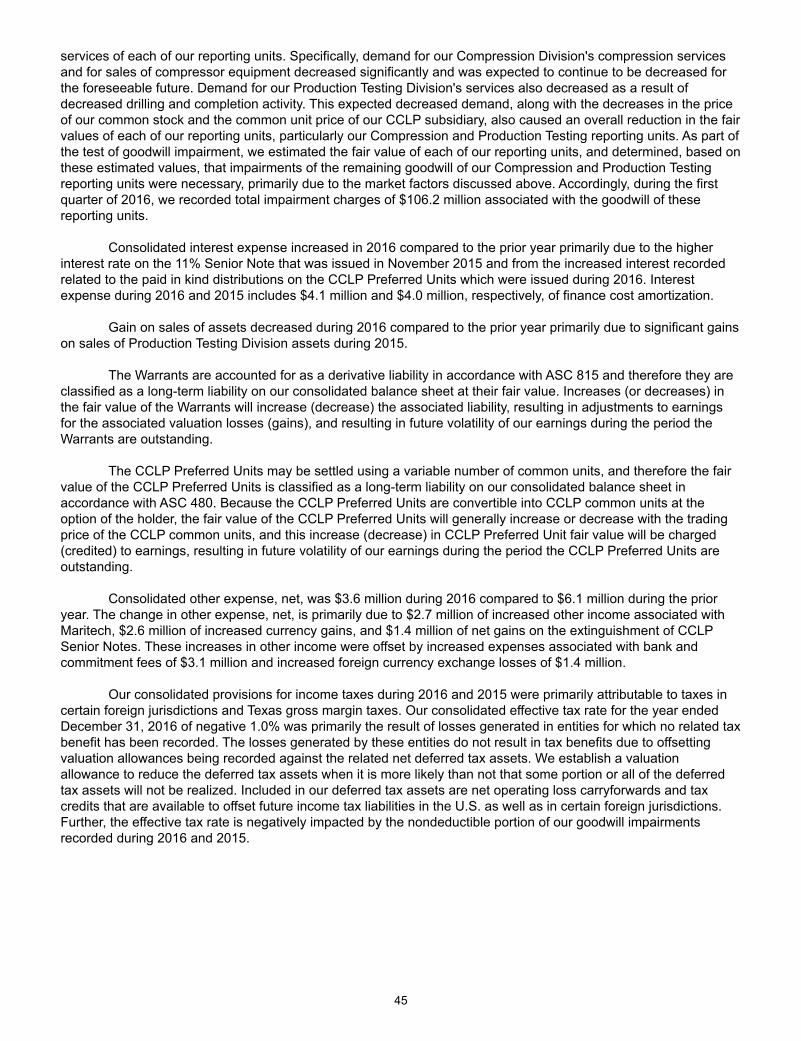
45
services of each of our reporting units. Specifically, demand for our Compression Division's compression services and for sales of compressor equipment decreased significantly and was expected to continue to be decreased for the foreseeable future. Demand for our Production Testing Division's services also decreased as a result of decreased drilling and completion activity. This expected decreased demand, along with the decreases in the price of our common stock and the common unit price of our CCLP subsidiary, also caused an overall reduction in the fair values of each of our reporting units, particularly our Compression and Production Testing reporting units. As part of the test of goodwill impairment, we estimated the fair value of each of our reporting units, and determined, based on these estimated values, that impairments of the remaining goodwill of our Compression and Production Testing reporting units were necessary, primarily due to the market factors discussed above. Accordingly, during the first quarter of 2016, we recorded total impairment charges of $106.2 million associated with the goodwill of these reporting units.
Consolidated interest expense increased in 2016 compared to the prior year primarily due to the higher interest rate on the 11% Senior Note that was issued in November 2015 and from the increased interest recorded related to the paid in kind distributions on the CCLP Preferred Units which were issued during 2016. Interest expense during 2016 and 2015 includes $4.1 million and $4.0 million, respectively, of finance cost amortization.
Gain on sales of assets decreased during 2016 compared to the prior year primarily due to significant gains
on sales of Production Testing Division assets during 2015.
The Warrants are accounted for as a derivative liability in accordance with ASC 815 and therefore they are classified as a long-term liability on our consolidated balance sheet at their fair value. Increases (or decreases) in the fair value of the Warrants will increase (decrease) the associated liability, resulting in adjustments to earnings for the associated valuation losses (gains), and resulting in future volatility of our earnings during the period the Warrants are outstanding.
The CCLP Preferred Units may be settled using a variable number of common units, and therefore the fair value of the CCLP Preferred Units is classified as a long-term liability on our consolidated balance sheet in accordance with ASC 480. Because the CCLP Preferred Units are convertible into CCLP common units at the option of the holder, the fair value of the CCLP Preferred Units will generally increase or decrease with the trading price of the CCLP common units, and this increase (decrease) in CCLP Preferred Unit fair value will be charged (credited) to earnings, resulting in future volatility of our earnings during the period the CCLP Preferred Units are outstanding.
Consolidated other expense, net, was $3.6 million during 2016 compared to $6.1 million during the prior year. The change in other expense, net, is primarily due to $2.7 million of increased other income associated with Maritech, $2.6 million of increased currency gains, and $1.4 million of net gains on the extinguishment of CCLP Senior Notes. These increases in other income were offset by increased expenses associated with bank and commitment fees of $3.1 million and increased foreign currency exchange losses of $1.4 million.
Our consolidated provisions for income taxes during 2016 and 2015 were primarily attributable to taxes in
certain foreign jurisdictions and Texas gross margin taxes. Our consolidated effective tax rate for the year ended December 31, 2016 of negative 1.0% was primarily the result of losses generated in entities for which no related tax benefit has been recorded. The losses generated by these entities do not result in tax benefits due to offsetting valuation allowances being recorded against the related net deferred tax assets. We establish a valuation allowance to reduce the deferred tax assets when it is more likely than not that some portion or all of the deferred tax assets will not be realized. Included in our deferred tax assets are net operating loss carryforwards and tax credits that are available to offset future income tax liabilities in the U.S. as well as in certain foreign jurisdictions. Further, the effective tax rate is negatively impacted by the nondeductible portion of our goodwill impairments recorded during 2016 and 2015.

46
Divisional Comparisons Fluids Division
Year EndedDecember 31, Period to Period Change
2016 2015 2016 vs. 2015 % Change (In Thousands, Except Percentages)
Revenues $ 246,595 $ 424,044 $ (177,449) (41.8)%Gross profit 36,888 111,969 (75,081) (67.1)%
Gross profit as a percentage of revenue 15.0% 26.4% General and administrative expense 27,650 32,576 (4,926) (15.1)%
General and administrative expense as a percentageof revenue 11.2% 7.7%
Interest (income) expense, net (4) (258) 254 Other (income) expense, net (1,188) (1,138) (50)
Income before taxes and discontinued operations $ 10,430 $ 80,789 $ (70,359) (87.1)%Income before taxes and discontinued operations as a
percentage of revenue 4.2% 19.1%
Decreased Fluids Division revenues during 2016 compared to the prior year were primarily due to $129.6
million of decreased product sales revenues, which were primarily due to decreased CBF and associated product sales revenues in the U.S. Gulf of Mexico, reflecting the decreased rig count activity compared to the prior year and a decrease resulting from a customer well completion project during the prior year using a completion fluid technology that was introduced during 2015. In addition, product sales revenues also decreased compared to the prior year due to decreased domestic manufactured products sales revenues (as a result of reduced energy industry demand and due to milder winter weather). Service revenues decreased $47.8 million, primarily due to reduced demand in the U.S. Gulf of Mexico for completion services as a result of a reduction in completion activity and due to decreased water management services activity resulting from the impact of lower oil and natural gas commodity prices. We began to see an increased demand in the U.S. Gulf of Mexico for our completion products and services during the second half of 2016.
Fluids Division gross profit during 2016 decreased compared to the prior year primarily due to continued pricing pressures on our products and services, lower revenues and decreased profitability associated with the mix of CBF products and services, particularly for offshore completion fluids products and services associated with the new fluid technology projects during the prior year. In addition, Fluids Division gross profit declined as a result of the reduced demand for manufactured products during 2016 compared to the prior year.
The Fluids Division reported a significant decrease in pretax earnings during 2016 compared to the prior
year primarily due to the decreased gross profit discussed above. Fluids Division administrative cost levels decreased compared to the prior year, primarily due to $4.2 million of decreased salary and employee expenses due to administrative cost and salary reductions and decreased general, office, and other administrative expenses of $1.9 million. This increase was offset primarily by $1.2 million of increased legal and professional fees associated with litigation involving our El Dorado, Arkansas calcium chloride plant. In January 2017, we received a $12.8 million settlement award as a result of this litigation. Partially offsetting the decreased gross profit, other income increased primarily due to increased foreign currency gains.

47
Production Testing Division
Year EndedDecember 31, Period to Period Change
2016 2015 2016 vs. 2015 % Change (In Thousands, Except Percentages)
Revenues $ 63,618 $ 133,904 $ (70,286) (52.5)%Gross profit (13,317) (3,046) (10,271) 337.2 %
Gross profit as a percentage of revenue (20.9)% (2.3)% General and administrative expense 9,806 17,726 (7,920) (44.7)%
General and administrative expense as a percentageof revenue 15.4 % 13.2 %
Goodwill impairment 13,871 37,562 (23,691)Interest (income) expense, net (594) (89) (505) Other (income) expense, net (929) (2,525) 1,596 Income (loss) before taxes and discontinuedoperations $ (35,471) $ (55,720) $ 20,249 36.3 %
Income (loss) before taxes and discontinuedoperations as a percentage of revenue (55.8)% (41.6)%
Production Testing Division revenues decreased significantly during 2016 compared to the prior year due to reduced overall market activity. Production Testing service revenues decreased $63.2 million during 2016 compared to the prior year, as the impact of lower oil and natural gas pricing has negatively impacted demand for services in each of the division's areas of operations, including certain shale reservoir markets that were a source of revenue growth during the past several years. Decreased U.S. demand reflects the significant decline in onshore rig count activity compared to the prior year. Although rig count activity has improved in early 2017 compared to 2016 levels, such activity levels are still significantly below early 2015 levels. In addition, increased competition for decreased market activity negatively affected pricing levels for services, particularly internationally. Production Testing product sales decreased $7.1 million, due to a sale of equipment that occurred during 2015.
The Production Testing Division had an increased gross loss during 2016 compared to the prior year due to the decreased industry activity and increased competition as discussed above. This increase in Production Testing Division gross loss was realized despite $6.4 million of long-lived intangible asset impairments during 2016 compared to $12.3 million of long-lived asset impairments recorded during 2015. The increased gross loss occurred despite significant cost reduction efforts, which have included headcount reductions, salary reductions, and other steps to adjust the Production Testing Division's cost structure in light of then current market conditions.
The Production Testing Division reported a decreased pretax loss during 2016 compared to the prior year,
primarily due to the reduced goodwill impairment recorded during 2016 compared to the prior year. We account for goodwill in accordance with ASC 350-20, and the impairments of goodwill reflect the significant decreases in future profitability and cash flows expected in the current market environment. General and administrative expenses also decreased due to $4.1 million of decreased general, office and bad debt expenses and $3.7 million of decreased employee-related expenses, primarily from reduced headcount, salary reductions, and other employee related cost reductions. The division continues to review additional opportunities to further reduce its operating and administrative cost levels in light of current market conditions. Other income decreased during 2016 compared to the prior year due to decreased gains on asset sales.
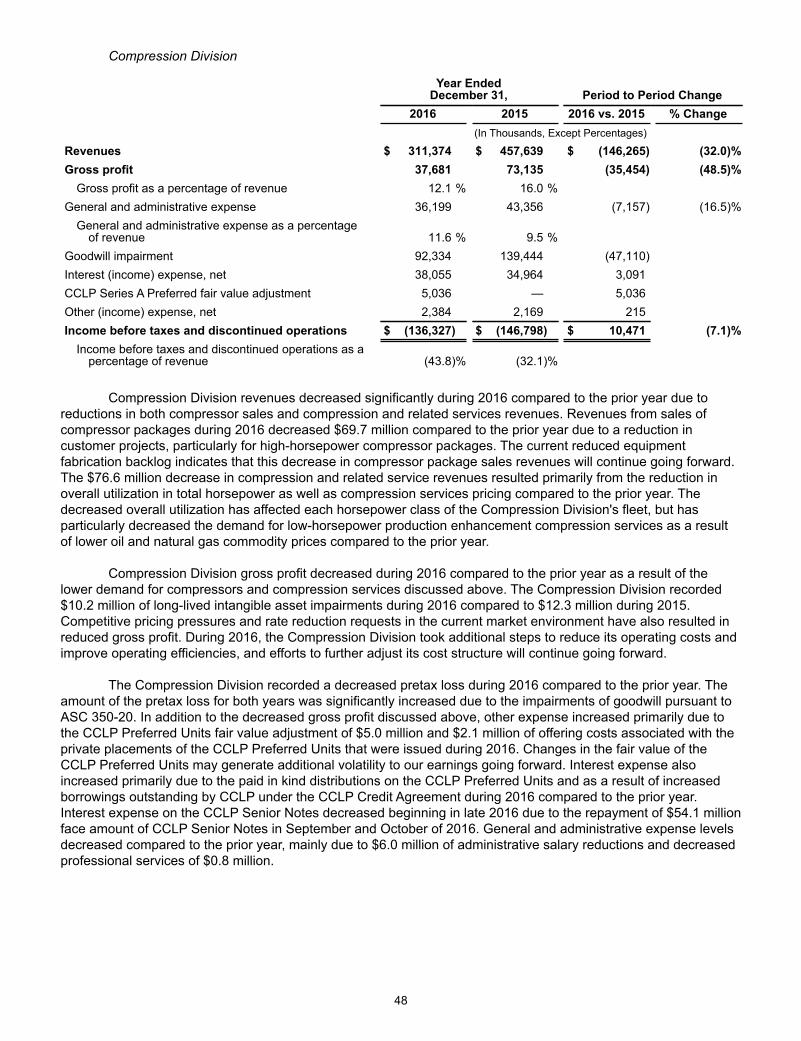
48
Compression Division
Year EndedDecember 31, Period to Period Change
2016 2015 2016 vs. 2015 % Change (In Thousands, Except Percentages)
Revenues $ 311,374 $ 457,639 $ (146,265) (32.0)%Gross profit 37,681 73,135 (35,454) (48.5)%
Gross profit as a percentage of revenue 12.1 % 16.0 % General and administrative expense 36,199 43,356 (7,157) (16.5)%
General and administrative expense as a percentageof revenue 11.6 % 9.5 %
Goodwill impairment 92,334 139,444 (47,110)Interest (income) expense, net 38,055 34,964 3,091 CCLP Series A Preferred fair value adjustment 5,036 — 5,036Other (income) expense, net 2,384 2,169 215 Income before taxes and discontinued operations $ (136,327) $ (146,798) $ 10,471 (7.1)%
Income before taxes and discontinued operations as apercentage of revenue (43.8)% (32.1)%
Compression Division revenues decreased significantly during 2016 compared to the prior year due to reductions in both compressor sales and compression and related services revenues. Revenues from sales of compressor packages during 2016 decreased $69.7 million compared to the prior year due to a reduction in customer projects, particularly for high-horsepower compressor packages. The current reduced equipment fabrication backlog indicates that this decrease in compressor package sales revenues will continue going forward. The $76.6 million decrease in compression and related service revenues resulted primarily from the reduction in overall utilization in total horsepower as well as compression services pricing compared to the prior year. The decreased overall utilization has affected each horsepower class of the Compression Division's fleet, but has particularly decreased the demand for low-horsepower production enhancement compression services as a result of lower oil and natural gas commodity prices compared to the prior year.
Compression Division gross profit decreased during 2016 compared to the prior year as a result of the lower demand for compressors and compression services discussed above. The Compression Division recorded $10.2 million of long-lived intangible asset impairments during 2016 compared to $12.3 million during 2015. Competitive pricing pressures and rate reduction requests in the current market environment have also resulted in reduced gross profit. During 2016, the Compression Division took additional steps to reduce its operating costs and improve operating efficiencies, and efforts to further adjust its cost structure will continue going forward.
The Compression Division recorded a decreased pretax loss during 2016 compared to the prior year. The amount of the pretax loss for both years was significantly increased due to the impairments of goodwill pursuant to ASC 350-20. In addition to the decreased gross profit discussed above, other expense increased primarily due to the CCLP Preferred Units fair value adjustment of $5.0 million and $2.1 million of offering costs associated with the private placements of the CCLP Preferred Units that were issued during 2016. Changes in the fair value of the CCLP Preferred Units may generate additional volatility to our earnings going forward. Interest expense also increased primarily due to the paid in kind distributions on the CCLP Preferred Units and as a result of increased borrowings outstanding by CCLP under the CCLP Credit Agreement during 2016 compared to the prior year. Interest expense on the CCLP Senior Notes decreased beginning in late 2016 due to the repayment of $54.1 million face amount of CCLP Senior Notes in September and October of 2016. General and administrative expense levels decreased compared to the prior year, mainly due to $6.0 million of administrative salary reductions and decreased professional services of $0.8 million.

49
Offshore Division
Offshore Services Segment
Year EndedDecember 31, Period to Period Change
2016 2015 2016 vs. 2015 % Change (In Thousands, Except Percentages)
Revenues $ 77,525 $ 122,194 $ (44,669) (36.6)%Gross profit (5,574) 10,602 (16,176) (152.6)%
Gross profit as a percentage of revenue (7.2)% 8.7 % General and administrative expense 6,454 10,689 (4,235) (39.6)%
General and administrative expense as a percentageof revenue 8.3 % 8.7 %
Interest (income) expense, net — — — Other (income) expense, net (3) 108 (111) Income (loss) before taxes and discontinuedoperations $ (12,025) $ (195) $ (11,830) (6,066.7)%
Income (loss) before taxes and discontinuedoperations as a percentage of revenue (15.5)% (0.2)%
Revenues for the Offshore Services segment decreased during 2016 compared to the prior year primarily due to reduced revenues from its well abandonment, diving, heavy lift decommissioning, and diving services businesses. Decreased well abandonment, cutting and diving services activity levels in the U.S. Gulf of Mexico during 2016 reflected an overall reduction in demand in this market, due to a postponement of certain well abandonment projects. Offshore Services revenues during 2016 include work performed for our Maritech segment, with $0.9 million of such work being performed during 2016 compared to $5.1 million of revenues during the prior year. Revenues for work performed for Maritech, which are eliminated in consolidation, are expected to continue to be lower in future periods.
The Offshore Services segment reported a gross loss during 2016 compared to gross profit during the prior year as the impact of decreased activity levels for well abandonment, cutting, and diving services as discussed above more than offset cost reduction measures and process efficiencies that have been implemented. In addition, the Offshore Services segment recorded a $1.1 million long-lived asset impairment during 2016.
Offshore Services segment loss before taxes increased during 2016 compared to the prior year primarily
due to the increased gross loss discussed above, and despite a reduction in general and administrative expenses, that was primarily from reduced headcount, salary and other employee related expenses of $2.2 million, decreased professional services of $0.4 million and other decreased general expenses of $1.6 million.
Maritech Segment
Year EndedDecember 31, Period to Period Change
2016 2015 2016 vs. 2015 % Change (In Thousands, Except Percentages)
Revenues $ 751 $ 2,438 $ (1,687) (69.2)%Gross profit (loss) (3,847) (2,523) (1,324) (52.5)%General and administrative expense 1,087 1,281 (194) (15.1)%
General and administrative expense as a percentageof revenue 144.7% 52.5%
Interest (income) expense, net 12 29 (17) (Gain) loss on sales of assets — — — Other (income) expense, net (3,105) — —
Loss before taxes and discontinued operations $ (1,841) $ (3,833) $ 1,992 52.0 %
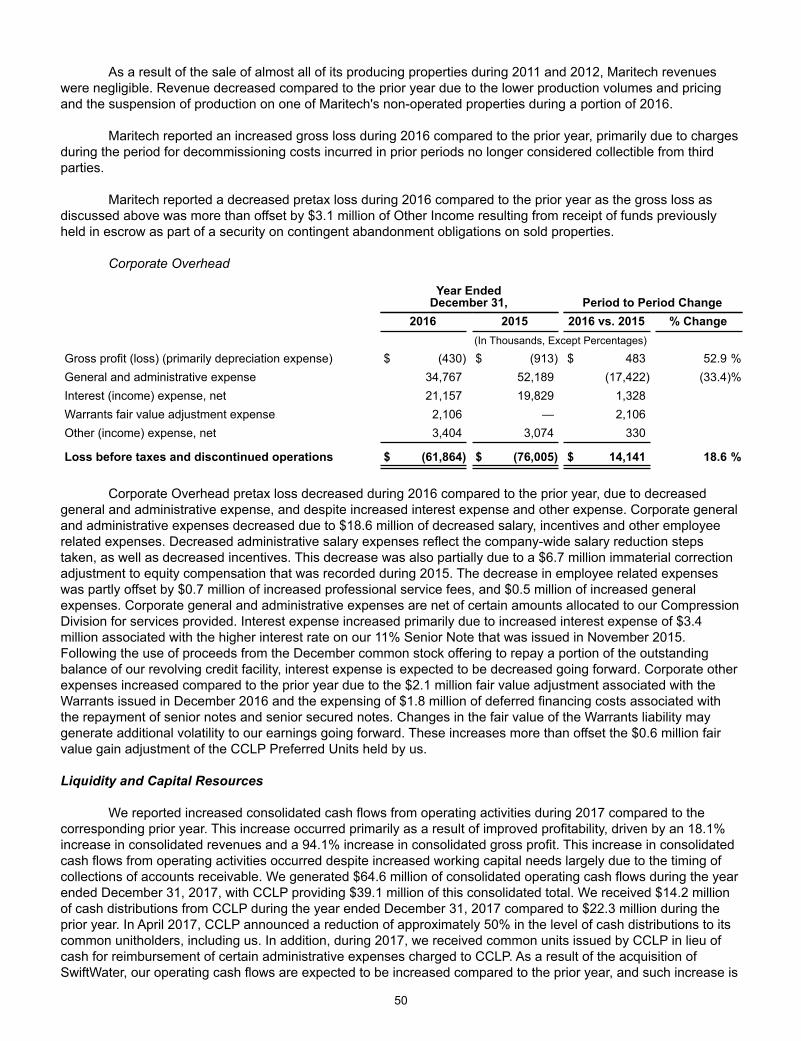
50
As a result of the sale of almost all of its producing properties during 2011 and 2012, Maritech revenues
were negligible. Revenue decreased compared to the prior year due to the lower production volumes and pricing and the suspension of production on one of Maritech's non-operated properties during a portion of 2016.
Maritech reported an increased gross loss during 2016 compared to the prior year, primarily due to charges
during the period for decommissioning costs incurred in prior periods no longer considered collectible from third parties.
Maritech reported a decreased pretax loss during 2016 compared to the prior year as the gross loss as discussed above was more than offset by $3.1 million of Other Income resulting from receipt of funds previously held in escrow as part of a security on contingent abandonment obligations on sold properties.
Corporate Overhead
Year EndedDecember 31, Period to Period Change
2016 2015 2016 vs. 2015 % Change (In Thousands, Except Percentages)
Gross profit (loss) (primarily depreciation expense) $ (430) $ (913) $ 483 52.9 %General and administrative expense 34,767 52,189 (17,422) (33.4)%Interest (income) expense, net 21,157 19,829 1,328 Warrants fair value adjustment expense 2,106 — 2,106Other (income) expense, net 3,404 3,074 330
Loss before taxes and discontinued operations $ (61,864) $ (76,005) $ 14,141 18.6 %
Corporate Overhead pretax loss decreased during 2016 compared to the prior year, due to decreased
general and administrative expense, and despite increased interest expense and other expense. Corporate general and administrative expenses decreased due to $18.6 million of decreased salary, incentives and other employee related expenses. Decreased administrative salary expenses reflect the company-wide salary reduction steps taken, as well as decreased incentives. This decrease was also partially due to a $6.7 million immaterial correction adjustment to equity compensation that was recorded during 2015. The decrease in employee related expenses was partly offset by $0.7 million of increased professional service fees, and $0.5 million of increased general expenses. Corporate general and administrative expenses are net of certain amounts allocated to our Compression Division for services provided. Interest expense increased primarily due to increased interest expense of $3.4 million associated with the higher interest rate on our 11% Senior Note that was issued in November 2015. Following the use of proceeds from the December common stock offering to repay a portion of the outstanding balance of our revolving credit facility, interest expense is expected to be decreased going forward. Corporate other expenses increased compared to the prior year due to the $2.1 million fair value adjustment associated with the Warrants issued in December 2016 and the expensing of $1.8 million of deferred financing costs associated with the repayment of senior notes and senior secured notes. Changes in the fair value of the Warrants liability may generate additional volatility to our earnings going forward. These increases more than offset the $0.6 million fair value gain adjustment of the CCLP Preferred Units held by us.
Liquidity and Capital Resources
We reported increased consolidated cash flows from operating activities during 2017 compared to the corresponding prior year. This increase occurred primarily as a result of improved profitability, driven by an 18.1% increase in consolidated revenues and a 94.1% increase in consolidated gross profit. This increase in consolidated cash flows from operating activities occurred despite increased working capital needs largely due to the timing of collections of accounts receivable. We generated $64.6 million of consolidated operating cash flows during the year ended December 31, 2017, with CCLP providing $39.1 million of this consolidated total. We received $14.2 million of cash distributions from CCLP during the year ended December 31, 2017 compared to $22.3 million during the prior year. In April 2017, CCLP announced a reduction of approximately 50% in the level of cash distributions to its common unitholders, including us. In addition, during 2017, we received common units issued by CCLP in lieu of cash for reimbursement of certain administrative expenses charged to CCLP. As a result of the acquisition of SwiftWater, our operating cash flows are expected to be increased compared to the prior year, and such increase is
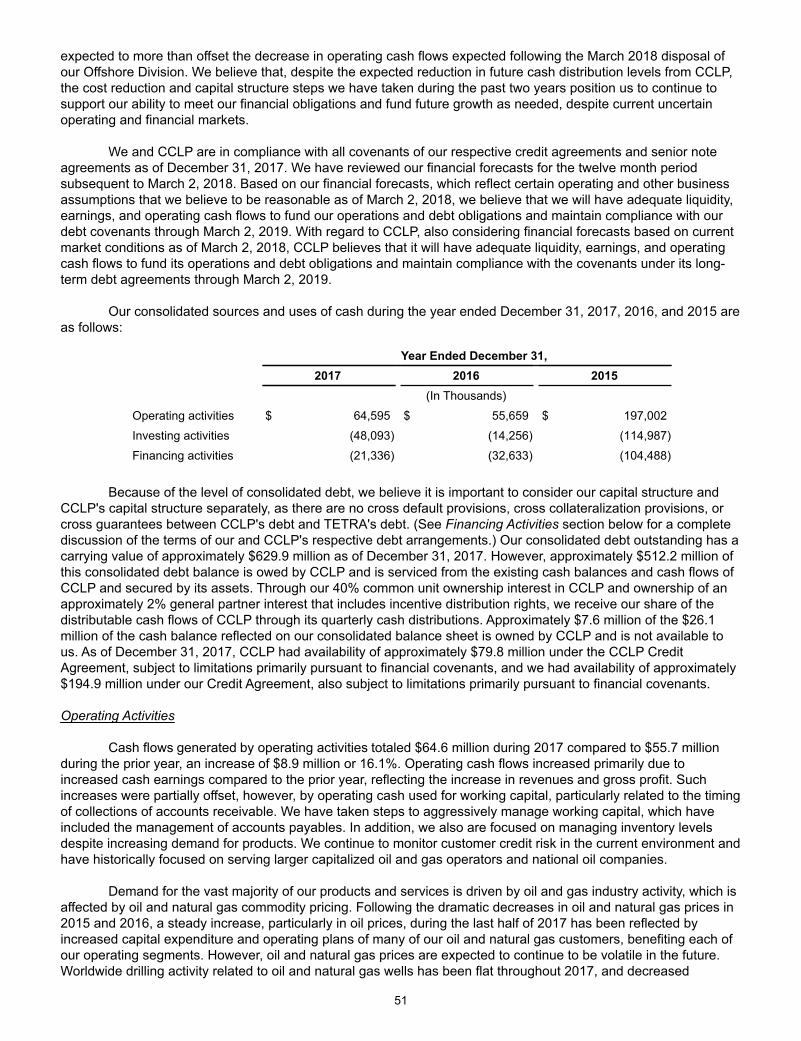
51
expected to more than offset the decrease in operating cash flows expected following the March 2018 disposal of our Offshore Division. We believe that, despite the expected reduction in future cash distribution levels from CCLP, the cost reduction and capital structure steps we have taken during the past two years position us to continue to support our ability to meet our financial obligations and fund future growth as needed, despite current uncertain operating and financial markets.
We and CCLP are in compliance with all covenants of our respective credit agreements and senior note agreements as of December 31, 2017. We have reviewed our financial forecasts for the twelve month period subsequent to March 2, 2018. Based on our financial forecasts, which reflect certain operating and other business assumptions that we believe to be reasonable as of March 2, 2018, we believe that we will have adequate liquidity, earnings, and operating cash flows to fund our operations and debt obligations and maintain compliance with our debt covenants through March 2, 2019. With regard to CCLP, also considering financial forecasts based on current market conditions as of March 2, 2018, CCLP believes that it will have adequate liquidity, earnings, and operating cash flows to fund its operations and debt obligations and maintain compliance with the covenants under its long-term debt agreements through March 2, 2019.
Our consolidated sources and uses of cash during the year ended December 31, 2017, 2016, and 2015 are as follows:
Year Ended December 31,2017 2016 2015
(In Thousands)
Operating activities $ 64,595 $ 55,659 $ 197,002
Investing activities (48,093) (14,256) (114,987)
Financing activities (21,336) (32,633) (104,488)
Because of the level of consolidated debt, we believe it is important to consider our capital structure and CCLP's capital structure separately, as there are no cross default provisions, cross collateralization provisions, or cross guarantees between CCLP's debt and TETRA's debt. (See Financing Activities section below for a complete discussion of the terms of our and CCLP's respective debt arrangements.) Our consolidated debt outstanding has a carrying value of approximately $629.9 million as of December 31, 2017. However, approximately $512.2 million of this consolidated debt balance is owed by CCLP and is serviced from the existing cash balances and cash flows of CCLP and secured by its assets. Through our 40% common unit ownership interest in CCLP and ownership of an approximately 2% general partner interest that includes incentive distribution rights, we receive our share of the distributable cash flows of CCLP through its quarterly cash distributions. Approximately $7.6 million of the $26.1 million of the cash balance reflected on our consolidated balance sheet is owned by CCLP and is not available to us. As of December 31, 2017, CCLP had availability of approximately $79.8 million under the CCLP Credit Agreement, subject to limitations primarily pursuant to financial covenants, and we had availability of approximately $194.9 million under our Credit Agreement, also subject to limitations primarily pursuant to financial covenants.
Operating Activities Cash flows generated by operating activities totaled $64.6 million during 2017 compared to $55.7 million
during the prior year, an increase of $8.9 million or 16.1%. Operating cash flows increased primarily due to increased cash earnings compared to the prior year, reflecting the increase in revenues and gross profit. Such increases were partially offset, however, by operating cash used for working capital, particularly related to the timing of collections of accounts receivable. We have taken steps to aggressively manage working capital, which have included the management of accounts payables. In addition, we also are focused on managing inventory levels despite increasing demand for products. We continue to monitor customer credit risk in the current environment and have historically focused on serving larger capitalized oil and gas operators and national oil companies.
Demand for the vast majority of our products and services is driven by oil and gas industry activity, which is affected by oil and natural gas commodity pricing. Following the dramatic decreases in oil and natural gas prices in 2015 and 2016, a steady increase, particularly in oil prices, during the last half of 2017 has been reflected by increased capital expenditure and operating plans of many of our oil and natural gas customers, benefiting each of our operating segments. However, oil and natural gas prices are expected to continue to be volatile in the future. Worldwide drilling activity related to oil and natural gas wells has been flat throughout 2017, and decreased
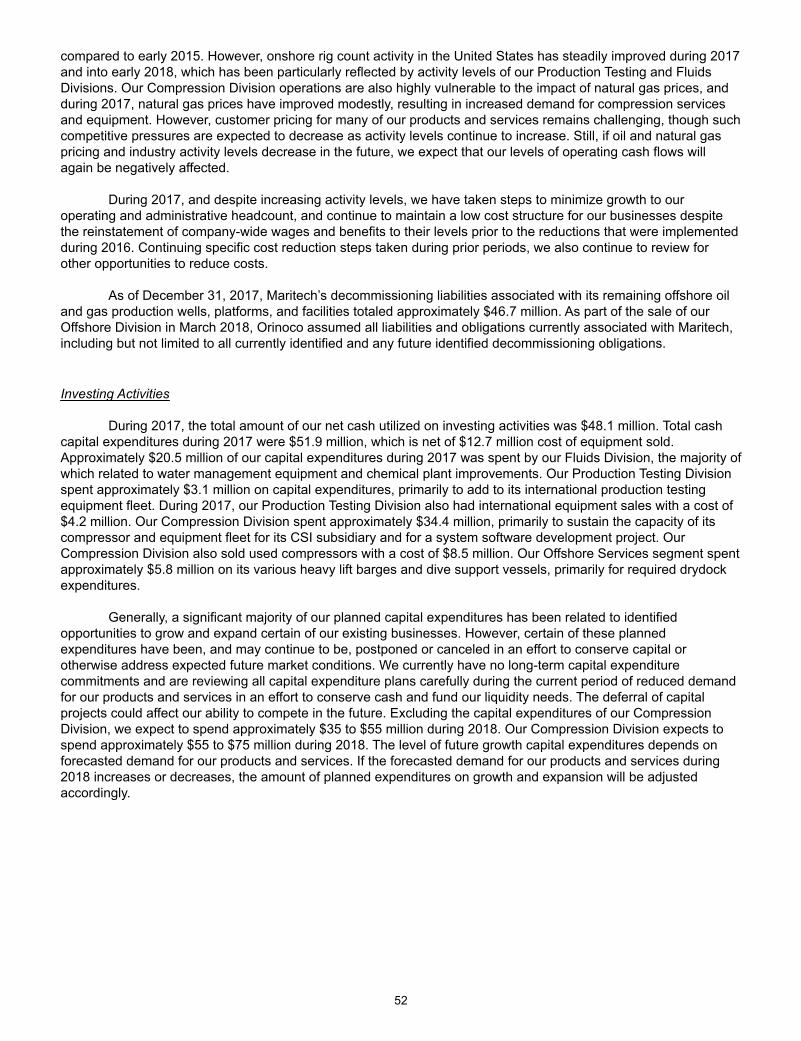
52
compared to early 2015. However, onshore rig count activity in the United States has steadily improved during 2017 and into early 2018, which has been particularly reflected by activity levels of our Production Testing and Fluids Divisions. Our Compression Division operations are also highly vulnerable to the impact of natural gas prices, and during 2017, natural gas prices have improved modestly, resulting in increased demand for compression services and equipment. However, customer pricing for many of our products and services remains challenging, though such competitive pressures are expected to decrease as activity levels continue to increase. Still, if oil and natural gas pricing and industry activity levels decrease in the future, we expect that our levels of operating cash flows will again be negatively affected.
During 2017, and despite increasing activity levels, we have taken steps to minimize growth to our operating and administrative headcount, and continue to maintain a low cost structure for our businesses despite the reinstatement of company-wide wages and benefits to their levels prior to the reductions that were implemented during 2016. Continuing specific cost reduction steps taken during prior periods, we also continue to review for other opportunities to reduce costs.
As of December 31, 2017, Maritech’s decommissioning liabilities associated with its remaining offshore oil and gas production wells, platforms, and facilities totaled approximately $46.7 million. As part of the sale of our Offshore Division in March 2018, Orinoco assumed all liabilities and obligations currently associated with Maritech, including but not limited to all currently identified and any future identified decommissioning obligations.
Investing Activities During 2017, the total amount of our net cash utilized on investing activities was $48.1 million. Total cash
capital expenditures during 2017 were $51.9 million, which is net of $12.7 million cost of equipment sold. Approximately $20.5 million of our capital expenditures during 2017 was spent by our Fluids Division, the majority of which related to water management equipment and chemical plant improvements. Our Production Testing Division spent approximately $3.1 million on capital expenditures, primarily to add to its international production testing equipment fleet. During 2017, our Production Testing Division also had international equipment sales with a cost of $4.2 million. Our Compression Division spent approximately $34.4 million, primarily to sustain the capacity of its compressor and equipment fleet for its CSI subsidiary and for a system software development project. Our Compression Division also sold used compressors with a cost of $8.5 million. Our Offshore Services segment spent approximately $5.8 million on its various heavy lift barges and dive support vessels, primarily for required drydock expenditures.
Generally, a significant majority of our planned capital expenditures has been related to identified opportunities to grow and expand certain of our existing businesses. However, certain of these planned expenditures have been, and may continue to be, postponed or canceled in an effort to conserve capital or otherwise address expected future market conditions. We currently have no long-term capital expenditure commitments and are reviewing all capital expenditure plans carefully during the current period of reduced demand for our products and services in an effort to conserve cash and fund our liquidity needs. The deferral of capital projects could affect our ability to compete in the future. Excluding the capital expenditures of our Compression Division, we expect to spend approximately $35 to $55 million during 2018. Our Compression Division expects to spend approximately $55 to $75 million during 2018. The level of future growth capital expenditures depends on forecasted demand for our products and services. If the forecasted demand for our products and services during 2018 increases or decreases, the amount of planned expenditures on growth and expansion will be adjusted accordingly.
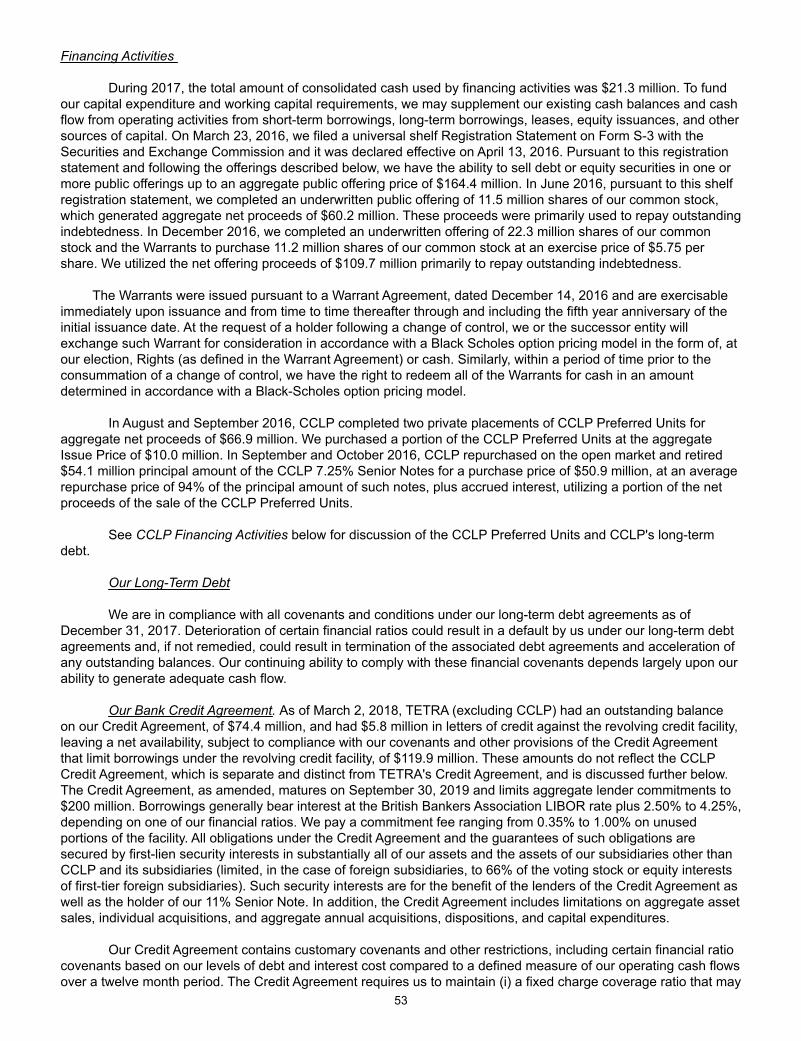
53
Financing Activities During 2017, the total amount of consolidated cash used by financing activities was $21.3 million. To fund
our capital expenditure and working capital requirements, we may supplement our existing cash balances and cash flow from operating activities from short-term borrowings, long-term borrowings, leases, equity issuances, and other sources of capital. On March 23, 2016, we filed a universal shelf Registration Statement on Form S-3 with the Securities and Exchange Commission and it was declared effective on April 13, 2016. Pursuant to this registration statement and following the offerings described below, we have the ability to sell debt or equity securities in one or more public offerings up to an aggregate public offering price of $164.4 million. In June 2016, pursuant to this shelf registration statement, we completed an underwritten public offering of 11.5 million shares of our common stock, which generated aggregate net proceeds of $60.2 million. These proceeds were primarily used to repay outstanding indebtedness. In December 2016, we completed an underwritten offering of 22.3 million shares of our common stock and the Warrants to purchase 11.2 million shares of our common stock at an exercise price of $5.75 per share. We utilized the net offering proceeds of $109.7 million primarily to repay outstanding indebtedness.
The Warrants were issued pursuant to a Warrant Agreement, dated December 14, 2016 and are exercisable immediately upon issuance and from time to time thereafter through and including the fifth year anniversary of the initial issuance date. At the request of a holder following a change of control, we or the successor entity will exchange such Warrant for consideration in accordance with a Black Scholes option pricing model in the form of, at our election, Rights (as defined in the Warrant Agreement) or cash. Similarly, within a period of time prior to the consummation of a change of control, we have the right to redeem all of the Warrants for cash in an amount determined in accordance with a Black-Scholes option pricing model.
In August and September 2016, CCLP completed two private placements of CCLP Preferred Units for aggregate net proceeds of $66.9 million. We purchased a portion of the CCLP Preferred Units at the aggregate Issue Price of $10.0 million. In September and October 2016, CCLP repurchased on the open market and retired $54.1 million principal amount of the CCLP 7.25% Senior Notes for a purchase price of $50.9 million, at an average repurchase price of 94% of the principal amount of such notes, plus accrued interest, utilizing a portion of the net proceeds of the sale of the CCLP Preferred Units.
See CCLP Financing Activities below for discussion of the CCLP Preferred Units and CCLP's long-term debt.
Our Long-Term Debt
We are in compliance with all covenants and conditions under our long-term debt agreements as of December 31, 2017. Deterioration of certain financial ratios could result in a default by us under our long-term debt agreements and, if not remedied, could result in termination of the associated debt agreements and acceleration of any outstanding balances. Our continuing ability to comply with these financial covenants depends largely upon our ability to generate adequate cash flow.
Our Bank Credit Agreement. As of March 2, 2018, TETRA (excluding CCLP) had an outstanding balance on our Credit Agreement, of $74.4 million, and had $5.8 million in letters of credit against the revolving credit facility, leaving a net availability, subject to compliance with our covenants and other provisions of the Credit Agreement that limit borrowings under the revolving credit facility, of $119.9 million. These amounts do not reflect the CCLP Credit Agreement, which is separate and distinct from TETRA's Credit Agreement, and is discussed further below. The Credit Agreement, as amended, matures on September 30, 2019 and limits aggregate lender commitments to $200 million. Borrowings generally bear interest at the British Bankers Association LIBOR rate plus 2.50% to 4.25%, depending on one of our financial ratios. We pay a commitment fee ranging from 0.35% to 1.00% on unused portions of the facility. All obligations under the Credit Agreement and the guarantees of such obligations are secured by first-lien security interests in substantially all of our assets and the assets of our subsidiaries other than CCLP and its subsidiaries (limited, in the case of foreign subsidiaries, to 66% of the voting stock or equity interests of first-tier foreign subsidiaries). Such security interests are for the benefit of the lenders of the Credit Agreement as well as the holder of our 11% Senior Note. In addition, the Credit Agreement includes limitations on aggregate asset sales, individual acquisitions, and aggregate annual acquisitions, dispositions, and capital expenditures.
Our Credit Agreement contains customary covenants and other restrictions, including certain financial ratio covenants based on our levels of debt and interest cost compared to a defined measure of our operating cash flows over a twelve month period. The Credit Agreement requires us to maintain (i) a fixed charge coverage ratio that may
54
not be less than 1.25 to 1 as of the end of any fiscal quarter; and (ii) a consolidated leverage ratio that may not exceed (a) 5.00 to 1 at the end of fiscal quarters ending during the period from and including March 31, 2017 through and including December 31, 2017, (b) 4.75 to 1 at the end of fiscal quarters ending March 31, 2018 and June 30, 2018, (c) 4.50 to 1 at the end of fiscal quarters ending September 30, 2018 and December 31, 2018, and (d) 4.00 to 1 at the end of each of the fiscal quarters thereafter. Following an amendment to the Credit Agreement in December 2016 (the "Fifth Amendment"), no consolidated leverage ratio covenant is applicable for the fiscal quarter ending December 31, 2016. At December 31, 2017, our consolidated leverage ratio was 1.66 to 1 (compared to a 5.00 to 1 maximum allowed under the Credit Agreement) and our fixed charge coverage ratio was 3.05 to 1 (compared to a 1.25 to 1 minimum required under the Credit Agreement). Deterioration of these financial ratios could result in a default by us under the Credit Agreement that, if not remedied, could result in termination of the Credit Agreement and acceleration of any outstanding balances. Any such default could also result in a cross-default under our 11% Senior Note. We have reviewed our financial forecasts as of March 2, 2018 for the subsequent twelve month period, which consider the current level of distributions expected to be received on the CCLP common units we own. Based on this review, and the current market conditions as of March 2, 2018, we anticipate that we will have sufficient liquidity, earnings, and operating cash flows to maintain compliance with the covenants under our debt agreements through March 2, 2019.
CCLP is an unrestricted subsidiary and is not a borrower or a guarantor under the Credit Agreement. The Credit Agreement includes cross-default provisions relating to any other indebtedness (excluding indebtedness of CCLP) greater than a defined amount. Our Credit Agreement also contains a covenant that restricts us from paying dividends in the event of a default or if such payment would result in an event of default.
Our Senior Note. Our senior note consists of the 11% Senior Note that was issued and sold in November 2015 and later amended (the "Amended and Restated 11% Senior Note Agreement"). As of March 2, 2018, the aggregate principal amount outstanding of the 11% Senior Note is $125.0 million.
The 11% Senior Note bears interest at the fixed rate of 11.0% and matures on November 5, 2022. Interest on the 11% Senior Note is due quarterly on March 15, June 15, September 15, and December 15 of each year. We may prepay the 11% Senior Note, in whole or in part at a prepayment price equal to (i) prior to November 20, 2018, 100% of the principal amount so prepaid, plus accrued and unpaid interest and a “make-whole” prepayment amount, (ii) during the period commencing on November 20, 2018, and ending on November 19, 2019, 104% of the principal amount so prepaid, plus accrued and unpaid interest, (iii) during the period commencing on November 20, 2019 and ending on November 19, 2020, 102% of the principal amount so prepaid, plus accrued and unpaid interest, (iv) during the period commencing on November 20, 2020, and ending on November 19, 2021, 101% of the principal amount so prepaid, plus accrued and unpaid interest, and (v) on or after November 20, 2021, 100% of the principal amount so prepaid, plus accrued and unpaid interest.
The 11% Senior Note is guaranteed by substantially all of our wholly owned U.S. subsidiaries. The 11% Senior Note Agreement contains customary covenants that limit our ability and the ability of certain of our restricted subsidiaries to, among other things: incur or guarantee additional indebtedness; incur or create liens; merge or consolidate or sell substantially all of our assets; engage in a different business; enter into transactions with affiliates; and make certain payments. In addition, the 11% Senior Note Agreement requires us to maintain certain financial ratios, including a maximum leverage ratio (ratio of debt and letters of credit outstanding to a defined measure of earnings). The maximum leverage ratio is further defined in our 11% Senior Note Agreement. Consolidated net earnings under the 11% Senior Note Agreement is the aggregate of our net income (or loss) and our consolidated restricted subsidiaries, including cash dividends and distributions (not the return of capital) received from persons other than consolidated restricted subsidiaries (such as CCLP) and after allowances for taxes for such period determined on a consolidated basis in accordance with U.S. generally accepted accounting principles ("GAAP"), excluding certain items more specifically described therein. CCLP is an unrestricted subsidiary and is not a borrower or a guarantor under our 11% Senior Note Agreement.
The 11% Senior Note Agreement includes cross-default provisions relating to other indebtedness (excluding indebtedness of CCLP) greater than a defined amount. Upon the occurrence and during the continuation of an event of default under the 11% Senior Note Agreement, the 11% Senior Note may become immediately due and payable, either automatically or by declaration of holders of more than 50% in principal amount of the 11% Senior Note at the time outstanding.
55
The Amended and Restated 11% Senior Note Agreement contains customary default provisions, as well as cross-default provisions. In addition, the Amended and Restated 11% Senior Note Agreement requires a minimum fixed charge coverage ratio at the end of any fiscal quarter of 1.25 to 1 and allows a maximum ratio of consolidated funded indebtedness at the end of any fiscal quarter of a defined measure of earnings ("EBITDA") of (a) 5.00 to 1 as of the end of any fiscal quarter ending during the period commencing March 31, 2017 and ending December 31, 2017, (b) 4.75 to 1 as of the end of any fiscal quarter ending March 31, 2018 and June 30, 2018 and (c) 4.50 to 1 as of the end of any fiscal quarter ending September 30, 2018 and December 31, 2018, and (d) 4.00 to 1 at the end of fiscal quarters ending thereafter. Pursuant to the Amended and Restated 11% Senior Note Agreement, the 11% Senior Note is secured by first-lien security interests in substantially all of our assets and the assets of our subsidiaries on a pari passu basis with the lenders under the Credit Agreement. See the above discussion of our Credit Agreement for a description of these security interests. The 11% Senior Note is pari passu in right of payment with all borrowings under the Credit Agreement and ranks at least pari passu in right of payment with all other outstanding indebtedness.
At December 31, 2017, our consolidated funded indebtedness to EBITDA ratio was 1.66 to 1, (compared to
5.00 to 1 maximum allowed under the Amended and Restated 11% Senior Note Agreement) and our fixed charge coverage ratio was 3.05 to 1 (compared to a 1.25 minimum required under the Amended and Restated 11% Senior Note Agreement). CCLP is an unrestricted subsidiary and is not a borrower or a guarantor under our Amended and Restated 11% Senior Note Agreement.
CCLP Financing Activities
CCLP Preferred Units. On August 8, 2016 and September 20, 2016, CCLP entered into Series A Preferred Unit Purchase Agreements (the “Unit Purchase Agreements”) with certain purchasers with regard to its issuance and sale in private placements (the "Initial Private Placement" and "Subsequent Private Placement," respectively) of an aggregate of 6,999,126 of CSI Compressco LP Series A Convertible Preferred Units representing limited partner interests in CCLP (the “CCLP Preferred Units”) for a cash purchase price of $11.43 per CCLP Preferred Unit (the “Issue Price”), resulting in total 2016 net proceeds, after deducting certain offering expenses, of approximately $77.3 million. We purchased 874,891 of the CCLP Preferred Units at the aggregate Issue Price of $10.0 million.
In connection with the closing of the Initial Private Placement, CSI Compressco GP Inc (our wholly owned subsidiary) executed the Amended and Restated CCLP Partnership Agreement to, among other things, authorize and establish the rights and preferences of the CCLP Preferred Units. The CCLP Preferred Units are a new class of equity security that will rank senior to all classes or series of equity securities of CCLP with respect to distribution rights and rights upon liquidation. We and the other holders of CCLP Preferred Units (each, a “CCLP Preferred Unitholder”) will receive quarterly distributions, which will be paid in kind in additional CCLP Preferred Units, equal to an annual rate of 11.00% of the Issue Price ($1.2573 per unit annualized), subject to certain adjustments. The rights of the CCLP Preferred Units include certain anti-dilution adjustments, including adjustments for economic dilution resulting from the issuance of common units in the future below a set price.
Ratable portions of the CCLP Preferred Units have been, and will continue to be, converted into CCLP common units on the eighth day of each month over a period of thirty months that began in March 2017 (each, a “Conversion Date”), subject to certain provisions of the Second Amended and Restated Agreement of Limited Partnership of CCLP (the "Amended and Restated CCLP Partnership Agreement") that may delay or accelerate all or a portion of such monthly conversions. On each Conversion Date, a portion of the CCLP Preferred Units will convert into CCLP common units representing limited partner interests in CCLP in an amount equal to, with respect to each CCLP Preferred Unitholder, the number of CCLP Preferred Units held by such CCLP Preferred Unitholder divided by the number of Conversion Dates remaining, subject to adjustment described in the Amended and Restated CCLP Partnership Agreement, with the conversion price (the "Conversion Price") determined by the trading prices of the common units over the prior month, among other factors, and as otherwise impacted by the existence of certain conditions related to the CCLP common units. On June, 7, 2017, as permitted under the Amended and Restated CCLP Partnership Agreement, CCLP elected to defer the monthly conversion of CCLP Preferred Units for each of the Conversion Dates during the three month period beginning July 8, 2017. As a result, no CCLP Preferred Units were converted into CCLP common units during the three month period ended September 30, 2017, and future monthly conversions will be increased beginning in October 2017. During 2017, conversions of the CCLP Preferred Units resulted in the issuance of 3.7 million CCLP common units. CCLP anticipates that the number of CCLP common units that will be issued upon conversions of the CCLP Preferred Units during 2018 will increase, as monthly conversions are expected during the full year of 2018 and due to the three month deferral of conversions during 2017. The maximum aggregate number of CCLP common units that could be required to be
56
issued pursuant to the conversion provisions of the CCLP Preferred Units is potentially unlimited; however, CCLP may, at its option, pay cash, or a combination of cash and CCLP common units, to the CCLP Preferred Unitholders instead of issuing CCLP common units on any Conversion Date, subject to certain restrictions as described in the Amended and Restated CCLP Partnership Agreement and the CCLP Credit Agreement. Including the impact of paid in kind distributions of CCLP Preferred Units and conversions of CCLP Preferred Units into CCLP common units, the total number of CCLP Preferred Units outstanding as of December 31, 2017, was 5,975,200, of which we held 750,417.
In addition, each purchaser may convert its CCLP Preferred Units, generally on a one-for-one basis and subject to adjustment for certain splits, combinations, reclassifications or other similar transactions and certain anti-dilution adjustments, in whole or in part, at any time following May 31, 2017 so long as any conversion is not for less than $250,000 or such lesser amount, if such conversion relates to all of such purchaser’s remaining CCLP Preferred Units. CCLP has the right to be reimbursed for any cash distributions paid with respect to common units issued in any such optional conversion until March 31, 2018. The CCLP Preferred Units will vote on an as-converted basis with the common units and will have certain other rights to vote as a class with respect to any amendment to the Amended and Restated CCLP Partnership Agreement that would affect any rights, preferences or privileges of the CCLP Preferred Units, as more fully described in the Amended and Restated CCLP Partnership Agreement.
Because the CCLP Preferred Units may be settled using a variable number of CCLP common units, the fair value of the CCLP Preferred Units is classified as a long-term liability on our consolidated balance sheet in accordance with ASC 480 "Distinguishing Liabilities and Equity." The fair value of the CCLP Preferred Units as of December 31, 2017 was $61.4 million. Changes in the fair value during each quarterly period, if any, are charged or credited to earnings in the accompanying consolidated statements of operations. Charges or credits to earnings for changes in the fair value of the CCLP Preferred Units, along with the interest expense for the accrual and payment of paid-in-kind distributions associated with the CCLP Preferred Units, are non-cash charges and credits associated with the CCLP Preferred Units.
In addition, the CCLP Unit Purchase Agreements include certain provisions regarding change of control, transfer of CCLP Preferred Units, indemnities, and other matters described in detail in the CCLP Unit Purchase Agreements. The CCLP Unit Purchase Agreements contain customary representations, warranties and covenants of CCLP and the purchasers
CCLP Long-Term Debt
CCLP’s Bank Credit Facility. As of February 28, 2018, CCLP has a balance outstanding under the CCLP bank credit agreement (as amended, the "CCLP Credit Agreement") of $245.0 million, has $8.5 million letters of credit and performance bonds outstanding, leaving availability under the CCLP Credit Agreement of $61.5 million. Availability under the CCLP Credit Agreement is subject to a borrowing base calculation based on components of accounts receivable, inventory, and equipment as well as subject to compliance with covenants and other provisions in the CCLP Credit Agreement that may limit borrowings under the CCLP Credit Agreement.
Under the CCLP Credit Agreement, CCLP and CSI Compressco Sub, Inc. are named as the borrowers and all obligations under the CCLP Credit Agreement are guaranteed by all of CCLP's existing and future, direct and indirect, domestic restricted subsidiaries (other than domestic subsidiaries that are wholly owned by foreign subsidiaries), and secured by substantially all of CCLP's assets and the assets of its domestic subsidiaries. We are not a borrower or a guarantor under the CCLP Credit Agreement. The CCLP Credit Agreement includes a maximum credit commitment of $315.0 million, and included within such amount is availability for letters of credit (with a sublimit of $20.0 million) and swingline loans (with a sublimit of $60.0 million). The CCLP Credit Agreement is an asset-based facility.
On May 5, 2017, CCLP entered into an amendment of the CCLP Credit Agreement (the "CCLP Fifth Amendment") that, among other things, modified certain financial covenants in the CCLP Credit Agreement. The CCLP Fifth Amendment also included additional revisions that provide flexibility to CCLP for the issuance of preferred securities.
The CCLP Credit Agreement is available to provide CCLP's working capital needs, letters of credit, and for general partnership purposes, including capital expenditures and potential future expansions or acquisitions. So long as CCLP is not in default, and maintains excess availability of $30.0 million, the CCLP Credit Agreement can
57
also be used to fund its quarterly common unit distributions at the option of the board of directors of its General Partner (provided that after giving effect to such distributions, CCLP will be in compliance with the financial covenants). Borrowings under the CCLP Credit Agreement are subject to the satisfaction of customary conditions, including the absence of a default. The CCLP Credit Agreement matures in August 2019.
Borrowings under the CCLP Credit Agreement generally bear interest at a rate per annum equal to, at CCLP's option, either (a) LIBOR (adjusted to reflect any required bank reserves) plus a leverage based margin that ranges between 2.00% and 3.25% per annum or (b) a base rate plus a leverage-based margin that ranges between 1.00% and 2.25% per annum; in each case depending on the applicable consolidated total leverage ratio. CCLP pays a commitment fee ranging from 0.375% to 0.50% per annum on the unused portion of the facility,
The CCLP Credit Agreement, as amended, requires CCLP to maintain (i) a minimum consolidated interest coverage ratio as of each quarter end period (defined ratio of consolidated earnings before interest, taxes, depreciation, and amortization ("EBITDA") to consolidated interest charges) of (a) 2.25 to 1 as of the fiscal quarters ended September 30, 2016 through June 30, 2018; (b) 2.50 to 1 as of September 30, 2018 and December 31, 2018; and (c) 2.75 to 1 as of March 31, 2019 and thereafter, (ii) a maximum consolidated total leverage ratio (ratio of consolidated total indebtedness to consolidated EBITDA ) of (a) 5.95 to 1 as of March 31, 2017; (b) 6.75 to 1 as of June 30, 2017 and September 30, 2017; (c) 6.50 to 1 as of December 31, 2017 and March 31, 2018; (d) 6.25 to 1 as of June 30, 2018 and September 30, 2018; (e) 6.00 to 1 as of December 31, 2018; and (f) 5.75 to 1 as of March 31, 2019 and thereafter, and (iii) a maximum consolidated secured leverage ratio (consolidated secured indebtedness to consolidated EBITDA) of (a) 3.25 to 1 as of the end of any fiscal quarter, calculated on a trailing four quarters basis. At December 31, 2017, CCLP's consolidated total leverage ratio was 6.48 to 1, its consolidated secured leverage ratio was 2.89 to 1, and its interest coverage ratio was 2.55 to 1. Deterioration of these financial ratios could result in a default by CCLP under the CCLP Credit Agreement that, if not remedied, could result in termination of the CCLP Credit Agreement and acceleration of any outstanding balances. Any such default could also result in a cross-default under the CCLP 7.25% Senior Notes.
The consolidated total leverage ratio and the consolidated secured leverage ratio, as both are calculated under the CCLP Credit Agreement, exclude the long-term liability for the CCLP Preferred Units, among other items, in the determination of total indebtedness.
The CCLP Credit Agreement includes other customary covenants that, among other things, limit CCLP's ability to incur additional debt, incur, or permit certain liens to exist, or make certain loans, investments, acquisitions, or other restricted payments. In addition, the CCLP Credit Agreement requires that, among other conditions, CCLP use designated consolidated cash and cash equivalent balances in excess of $35.0 million to prepay the loans; allows the prepayment or purchase of indebtedness with proceeds from the issuances of equity securities or in exchange for the issuances of equity securities; and restricts the amount of CCLP's permitted capital expenditures in the ordinary course of business during each fiscal year to $50.0 million in 2017 and 2018 and $75.0 million in 2019.
CCLP is in compliance with all covenants of the CCLP Credit Agreement as of December 31, 2017. CCLP has reviewed its financial forecasts as of March 2, 2018 for the subsequent twelve month period, which considers the current level of distributions to be paid on CCLP common units. CCLP believes that it will have adequate liquidity, earnings, and operating cash flows to fund its operations and debt obligations and maintain compliance with the covenants under its debt agreements through March 2, 2019.
CCLP 7.25% Senior Notes. The obligations under the CCLP 7.25% Senior Notes are jointly and severally and fully and unconditionally, guaranteed on a senior unsecured basis by each of CCLP’s domestic restricted subsidiaries (other than CSI Compressco Finance) that guarantee CCLP’s other indebtedness (the "Guarantors" and together with the Issuers, the "Obligors"). The CCLP 7.25% Senior Notes and the subsidiary guarantees thereof (together, the "CCLP Securities") were issued pursuant to an indenture described below. As of December 31, 2017, $295.9 million aggregate principal amount of CCLP 7.25% Senior Notes are outstanding.
The Obligors issued the CCLP Securities pursuant to the Indenture dated as of August 4, 2014 (the "Indenture") by and among the Obligors and U.S. Bank National Association, as trustee (the "Trustee"). The CCLP Senior Notes accrue interest at a rate of 7.25% per annum. Interest on the CCLP 7.25% Senior Notes is payable semi-annually in arrears on February 15 and August 15 of each year. The CCLP 7.25% Senior Notes are scheduled to mature on August 15, 2022.
58
The Indenture contains customary covenants restricting CCLP’s ability and the ability of its restricted subsidiaries to: (i) pay dividends and make certain distributions, investments and other restricted payments; (ii) incur additional indebtedness or issue certain preferred shares; (iii) create certain liens; (iv) sell assets; (v) merge, consolidate, sell or otherwise dispose of all or substantially all of its assets; (vi) enter into transactions with affiliates; and (vii) designate its subsidiaries as unrestricted subsidiaries under the Indenture. The Indenture also contains customary events of default and acceleration provisions relating to such events of default, which provide that upon an event of default under the Indenture, the Trustee or the holders of at least 25% in aggregate principal amount of the CCLP 7.25% Senior Notes then outstanding may declare all amounts owing under the CCLP 7.25% Senior Notes to be due and payable. CCLP is in compliance with all covenants of the CCLP Senior Note Purchase Agreement as of December 31, 2017.
Other Sources and Uses
In addition to the aforementioned revolving credit facilities, we and CCLP fund our respective short-term liquidity requirements from cash generated by our respective operations, leases, and from short-term vendor financing. Should additional capital be required, we believe that we have the ability to raise such capital through the issuance of additional debt or equity. However, instability or volatility in the capital markets at the times we need to access capital may affect the cost of capital and the ability to raise capital for an indeterminable length of time.
TETRA's Credit Agreement, as amended, matures in September 2019, the CCLP Credit Agreement matures in August 2019, TETRA's 11% Senior Note matures in November 2022, and the CCLP Senior Notes mature in August 2022. The replacement of these capital sources at similar or more favorable terms is not certain. If it is necessary to issue additional equity to fund our capital needs, additional dilution to our common stockholders will occur.
We maintain a long-term growth strategy for our core businesses and are seeking organic growth and acquisition opportunities while continuing to review capital expenditure plans carefully. Our and CCLP's long-term growth objectives are funded from cash available under their respective credit facilities, other borrowings, cash generated from the issuance of equity, as well as available cash.
On March 23, 2016, we filed a universal shelf Registration Statement on Form S-3 with the Securities and Exchange Commission ("SEC"). On April 13, 2016, the Registration Statement on Form S-3 was declared effective by the SEC. Pursuant to this registration statement, we currently have the ability to sell debt or equity securities in one or more public offerings up to an aggregate public offering price of $164.4 million. This shelf registration statement currently provides us additional flexibility with regard to potential financings that we may undertake when market conditions permit or our financial condition may require.
As part of our long-term strategic growth plans, we will evaluate opportunities to acquire businesses and assets that may involve the payment of cash. Such acquisitions may be funded with existing cash balances, funds under credit facilities, or cash generated from the issuance of equity or debt securities.
CCLP’s Partnership Agreement requires that within 45 days after the end of each quarter, it distribute all of its available cash, as defined in the Partnership Agreement, to its unitholders of record on the applicable record date. During the year ended December 31, 2017, CCLP distributed approximately $33.1 million, including approximately $18.8 million to its public unitholders. The amount of quarterly distributions is determined based on a variety of factors, including estimates of CCLP's cash needs to fund its future operating, investing, and debt service requirements. There can be no assurance that quarterly distributions from CCLP will increase from this amount per unit, or that there will not be future decreases in the amount of distributions going forward.
Off Balance Sheet Arrangements An “off balance sheet arrangement” is defined as any contractual arrangement to which an entity that is not
consolidated with us is a party, under which we have, or in the future may have:• any obligation under a guarantee contract that requires initial recognition and measurement under U.S.
Generally Accepted Accounting Principles;• a retained or contingent interest in assets transferred to an unconsolidated entity or similar arrangement
that serves as credit, liquidity, or market risk support to that entity for the transferred assets;• any obligation under certain derivative instruments; or
59
• any obligation under a material variable interest held by us in an unconsolidated entity that provides financing, liquidity, market risk or credit risk support to us, or engages in leasing, hedging, or research and development services with us. As of December 31, 2017 and 2016, we had no “off balance sheet arrangements” that may have a current
or future material effect on our consolidated financial condition or results of operations. For a discussion of operating leases, including the lease of our corporate headquarters facility, see “Note D – Leases” in the Notes to Consolidated Financial Statements.
Commitments and Contingencies
Litigation We are named defendants in several lawsuits and respondents in certain governmental proceedings arising
in the ordinary course of business. While the outcome of lawsuits or other proceedings against us cannot be predicted with certainty, management does not consider it reasonably possible that a loss resulting from such lawsuits or other proceedings in excess of amounts accrued has been incurred that is expected to have a material adverse impact on our financial condition, results of operations, or liquidity.
On March 18, 2011, we filed a lawsuit in the Circuit Court of Union County, Arkansas, asserting claims of professional negligence, breach of contract and other claims against the engineering firm we hired for engineering design, equipment, procurement, advisory, testing and startup services for our El Dorado, Arkansas chemical production facility. The engineering firm disputed our claims and promptly filed a motion to compel the matter to arbitration. After a lengthy procedural dispute in Arkansas state court, arbitration proceedings were initiated on November 15, 2013. Ultimately, on December 16, 2016, the arbitration panel ruled in our favor, declared us as the prevailing party, and awarded us a total net amount of $12.8 million. We received full payment of the $12.8 million final award on January 5, 2017.
From May 2009 to December 2014, EPIC Diving & Marine Services, LLC (“EPIC”), a wholly-owned subsidiary, was the charterer of a dive support vessel from a service provider. At the time of redelivery of the vessel there was a dispute between EPIC and the service provider that was submitted to arbitration in London pursuant to the dispute resolution provision of the charter agreement. Just prior to the scheduled arbitration proceedings in June 2017, EPIC reached a favorable settlement in relation to certain of the service provider's claims against EPIC. EPIC’s dispute with the service provider regarding a fee was due at the time of redelivery of the vessel proceeded to arbitration on June 20, 2017. On July 6, 2017, the arbitration panel issued its ruling against EPIC, awarding the service provider $3.0 million, plus interest and fees. A net exposure of $2.8 million was accrued and charged to earnings during 2017.
Environmental
One of our subsidiaries, TETRA Micronutrients, Inc. (TMI), previously owned and operated a production
facility located in Fairbury, Nebraska. TMI is subject to an Administrative Order on Consent issued to American Microtrace, Inc. (n/k/a/ TETRA Micronutrients, Inc.) in the proceeding styled In the Matter of American Microtrace Corporation, EPA I.D. No. NED00610550, Respondent, Docket No. VII-98-H-0016, dated September 25, 1998 (the Consent Order), with regard to the Fairbury facility. TMI is liable for ongoing environmental monitoring at the Fairbury facility under the Consent Order; however, the current owner of the Fairbury facility is responsible for costs associated with the closure of that facility. While the outcome cannot be predicted with certainty, management does not consider it reasonably possible that a loss in excess of any amounts accrued has been incurred or is expected to have a material adverse impact on our financial condition, results of operations, or liquidity. Product Purchase Obligations
In the normal course of our Fluids Division operations, we enter into supply agreements with certain
manufacturers of various raw materials and finished products. Some of these agreements have terms and conditions that specify a minimum or maximum level of purchases over the term of the agreement. Other agreements require us to purchase the entire output of the raw material or finished product produced by the manufacturer. Our purchase obligations under these agreements apply only with regard to raw materials and finished products that meet specifications set forth in the agreements. We recognize a liability for the purchase of such products at the time we receive them. As of December 31, 2017, the aggregate amount of the fixed and
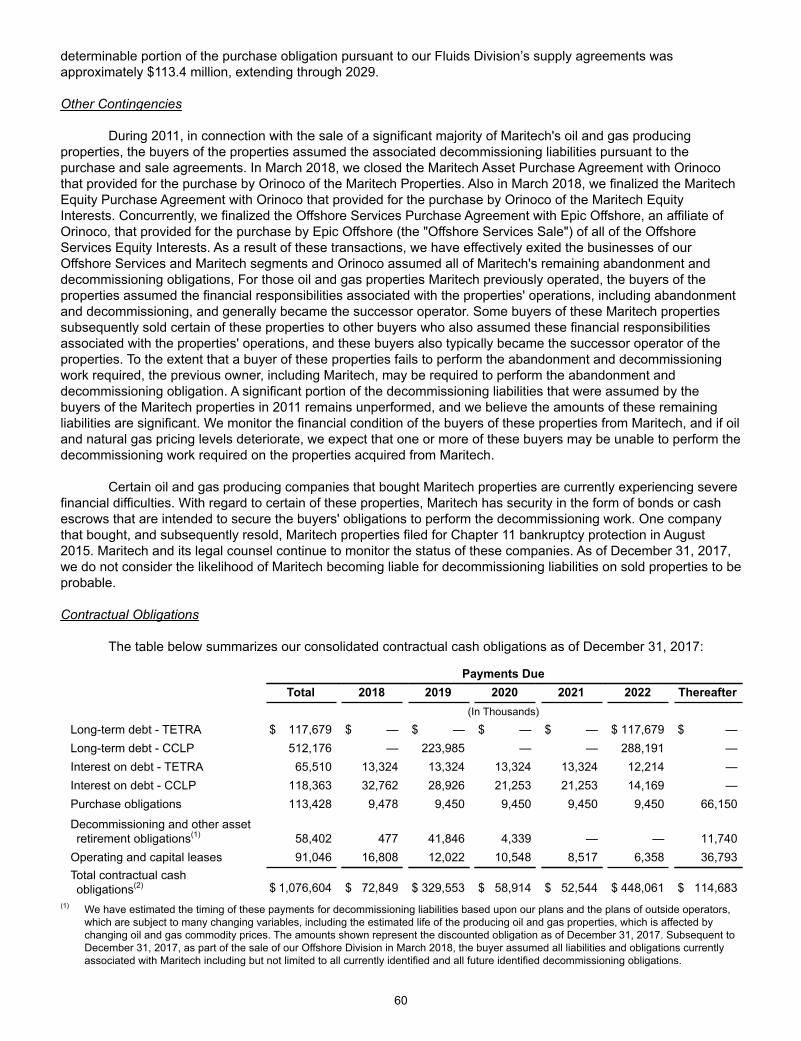
60
determinable portion of the purchase obligation pursuant to our Fluids Division’s supply agreements was approximately $113.4 million, extending through 2029.
Other Contingencies During 2011, in connection with the sale of a significant majority of Maritech's oil and gas producing
properties, the buyers of the properties assumed the associated decommissioning liabilities pursuant to the purchase and sale agreements. In March 2018, we closed the Maritech Asset Purchase Agreement with Orinoco that provided for the purchase by Orinoco of the Maritech Properties. Also in March 2018, we finalized the Maritech Equity Purchase Agreement with Orinoco that provided for the purchase by Orinoco of the Maritech Equity Interests. Concurrently, we finalized the Offshore Services Purchase Agreement with Epic Offshore, an affiliate of Orinoco, that provided for the purchase by Epic Offshore (the "Offshore Services Sale") of all of the Offshore Services Equity Interests. As a result of these transactions, we have effectively exited the businesses of our Offshore Services and Maritech segments and Orinoco assumed all of Maritech's remaining abandonment and decommissioning obligations, For those oil and gas properties Maritech previously operated, the buyers of the properties assumed the financial responsibilities associated with the properties' operations, including abandonment and decommissioning, and generally became the successor operator. Some buyers of these Maritech properties subsequently sold certain of these properties to other buyers who also assumed these financial responsibilities associated with the properties' operations, and these buyers also typically became the successor operator of the properties. To the extent that a buyer of these properties fails to perform the abandonment and decommissioning work required, the previous owner, including Maritech, may be required to perform the abandonment and decommissioning obligation. A significant portion of the decommissioning liabilities that were assumed by the buyers of the Maritech properties in 2011 remains unperformed, and we believe the amounts of these remaining liabilities are significant. We monitor the financial condition of the buyers of these properties from Maritech, and if oil and natural gas pricing levels deteriorate, we expect that one or more of these buyers may be unable to perform the decommissioning work required on the properties acquired from Maritech.
Certain oil and gas producing companies that bought Maritech properties are currently experiencing severe financial difficulties. With regard to certain of these properties, Maritech has security in the form of bonds or cash escrows that are intended to secure the buyers' obligations to perform the decommissioning work. One company that bought, and subsequently resold, Maritech properties filed for Chapter 11 bankruptcy protection in August 2015. Maritech and its legal counsel continue to monitor the status of these companies. As of December 31, 2017, we do not consider the likelihood of Maritech becoming liable for decommissioning liabilities on sold properties to be probable.
Contractual Obligations The table below summarizes our consolidated contractual cash obligations as of December 31, 2017:
Payments Due Total 2018 2019 2020 2021 2022 Thereafter (In Thousands)
Long-term debt - TETRA $ 117,679 $ — $ — $ — $ — $ 117,679 $ —Long-term debt - CCLP 512,176 — 223,985 — — 288,191 —Interest on debt - TETRA 65,510 13,324 13,324 13,324 13,324 12,214 —Interest on debt - CCLP 118,363 32,762 28,926 21,253 21,253 14,169 —Purchase obligations 113,428 9,478 9,450 9,450 9,450 9,450 66,150
Decommissioning and other asset retirement obligations(1) 58,402 477 41,846 4,339 — — 11,740
Operating and capital leases 91,046 16,808 12,022 10,548 8,517 6,358 36,793Total contractual cash obligations(2) $ 1,076,604 $ 72,849 $ 329,553 $ 58,914 $ 52,544 $ 448,061 $ 114,683
(1) We have estimated the timing of these payments for decommissioning liabilities based upon our plans and the plans of outside operators, which are subject to many changing variables, including the estimated life of the producing oil and gas properties, which is affected by changing oil and gas commodity prices. The amounts shown represent the discounted obligation as of December 31, 2017. Subsequent to December 31, 2017, as part of the sale of our Offshore Division in March 2018, the buyer assumed all liabilities and obligations currently associated with Maritech including but not limited to all currently identified and all future identified decommissioning obligations.
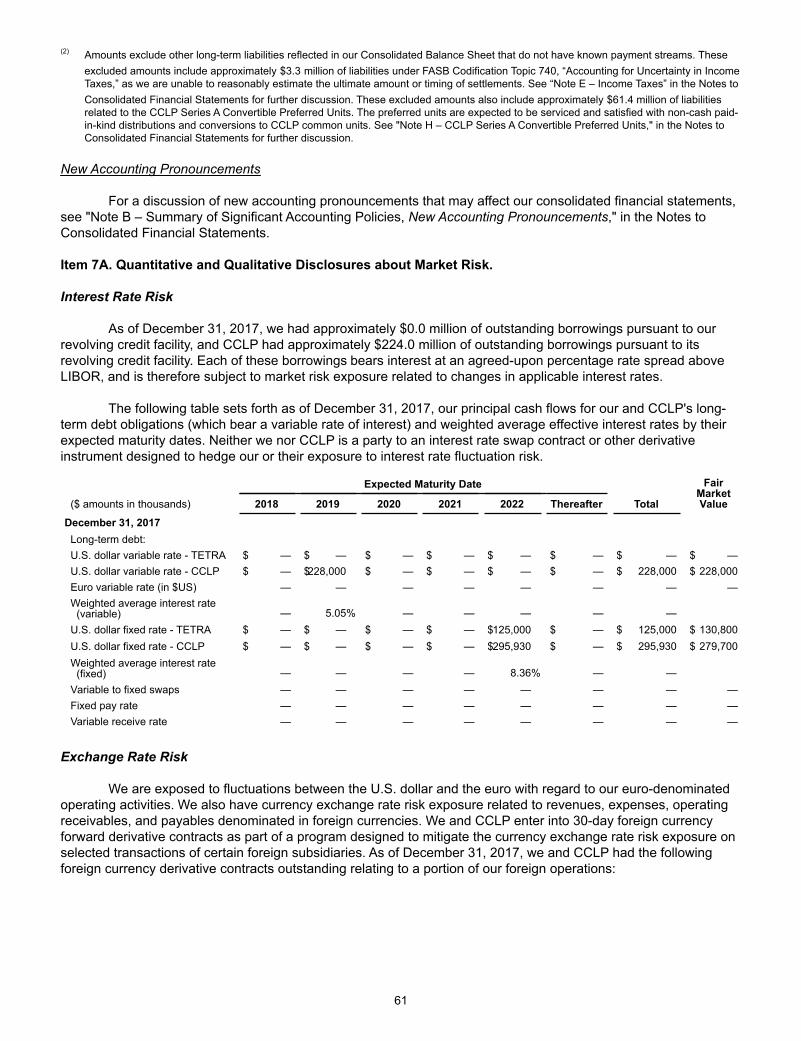
61
(2) Amounts exclude other long-term liabilities reflected in our Consolidated Balance Sheet that do not have known payment streams. These excluded amounts include approximately $3.3 million of liabilities under FASB Codification Topic 740, “Accounting for Uncertainty in Income Taxes,” as we are unable to reasonably estimate the ultimate amount or timing of settlements. See “Note E – Income Taxes” in the Notes to Consolidated Financial Statements for further discussion. These excluded amounts also include approximately $61.4 million of liabilities related to the CCLP Series A Convertible Preferred Units. The preferred units are expected to be serviced and satisfied with non-cash paid-in-kind distributions and conversions to CCLP common units. See "Note H – CCLP Series A Convertible Preferred Units," in the Notes to Consolidated Financial Statements for further discussion.
New Accounting Pronouncements
For a discussion of new accounting pronouncements that may affect our consolidated financial statements, see "Note B – Summary of Significant Accounting Policies, New Accounting Pronouncements," in the Notes to Consolidated Financial Statements.
Item 7A. Quantitative and Qualitative Disclosures about Market Risk. Interest Rate Risk
As of December 31, 2017, we had approximately $0.0 million of outstanding borrowings pursuant to our
revolving credit facility, and CCLP had approximately $224.0 million of outstanding borrowings pursuant to its revolving credit facility. Each of these borrowings bears interest at an agreed-upon percentage rate spread above LIBOR, and is therefore subject to market risk exposure related to changes in applicable interest rates.
The following table sets forth as of December 31, 2017, our principal cash flows for our and CCLP's long-
term debt obligations (which bear a variable rate of interest) and weighted average effective interest rates by their expected maturity dates. Neither we nor CCLP is a party to an interest rate swap contract or other derivative instrument designed to hedge our or their exposure to interest rate fluctuation risk.
Expected Maturity Date FairMarketValue($ amounts in thousands) 2018 2019 2020 2021 2022 Thereafter Total
December 31, 2017 Long-term debt: U.S. dollar variable rate - TETRA $ — $ — $ — $ — $ — $ — $ — $ —U.S. dollar variable rate - CCLP $ — $228,000 $ — $ — $ — $ — $ 228,000 $ 228,000Euro variable rate (in $US) — — — — — — — —Weighted average interest rate
(variable) — 5.05% — — — — — U.S. dollar fixed rate - TETRA $ — $ — $ — $ — $125,000 $ — $ 125,000 $ 130,800U.S. dollar fixed rate - CCLP $ — $ — $ — $ — $295,930 $ — $ 295,930 $ 279,700Weighted average interest rate
(fixed) — — — — 8.36% — — Variable to fixed swaps — — — — — — — —Fixed pay rate — — — — — — — —Variable receive rate — — — — — — — —
Exchange Rate Risk
We are exposed to fluctuations between the U.S. dollar and the euro with regard to our euro-denominated operating activities. We also have currency exchange rate risk exposure related to revenues, expenses, operating receivables, and payables denominated in foreign currencies. We and CCLP enter into 30-day foreign currency forward derivative contracts as part of a program designed to mitigate the currency exchange rate risk exposure on selected transactions of certain foreign subsidiaries. As of December 31, 2017, we and CCLP had the following foreign currency derivative contracts outstanding relating to a portion of our foreign operations:
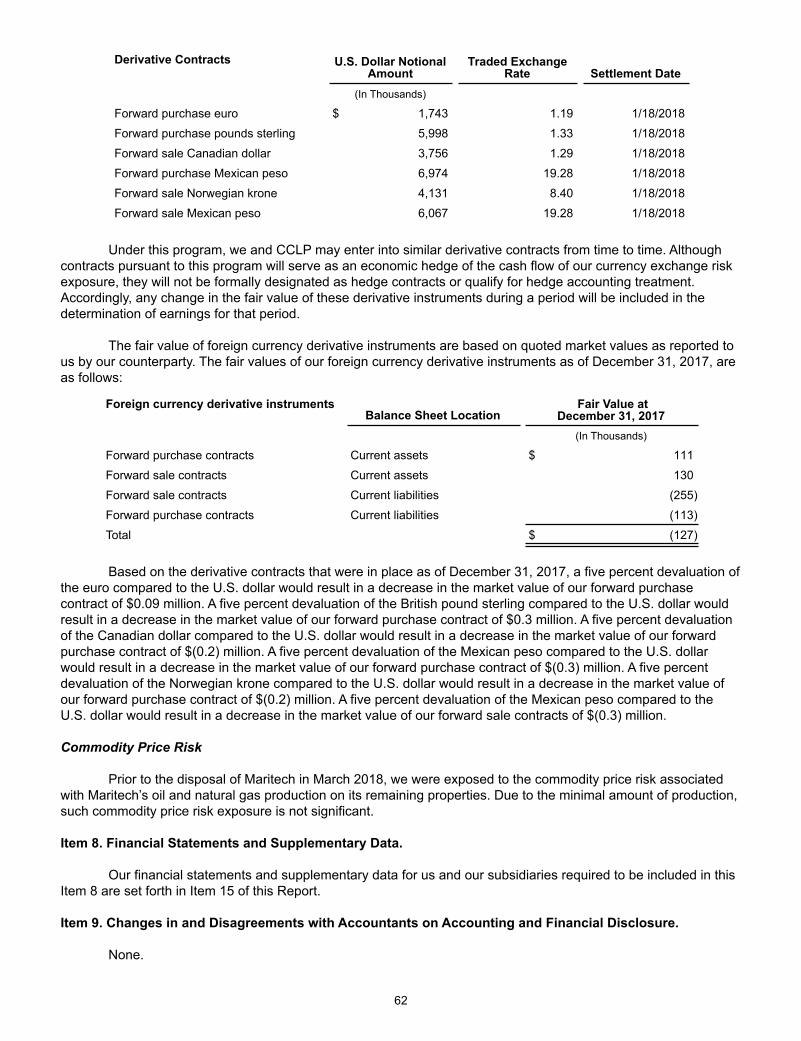
62
Derivative Contracts U.S. Dollar Notional Amount
Traded ExchangeRate Settlement Date
(In Thousands)
Forward purchase euro $ 1,743 1.19 1/18/2018
Forward purchase pounds sterling 5,998 1.33 1/18/2018
Forward sale Canadian dollar 3,756 1.29 1/18/2018
Forward purchase Mexican peso 6,974 19.28 1/18/2018
Forward sale Norwegian krone 4,131 8.40 1/18/2018
Forward sale Mexican peso 6,067 19.28 1/18/2018
Under this program, we and CCLP may enter into similar derivative contracts from time to time. Although contracts pursuant to this program will serve as an economic hedge of the cash flow of our currency exchange risk exposure, they will not be formally designated as hedge contracts or qualify for hedge accounting treatment. Accordingly, any change in the fair value of these derivative instruments during a period will be included in the determination of earnings for that period.
The fair value of foreign currency derivative instruments are based on quoted market values as reported to us by our counterparty. The fair values of our foreign currency derivative instruments as of December 31, 2017, are as follows:
Foreign currency derivative instrumentsBalance Sheet Location
Fair Value at December 31, 2017
(In Thousands)
Forward purchase contracts Current assets $ 111
Forward sale contracts Current assets 130
Forward sale contracts Current liabilities (255)
Forward purchase contracts Current liabilities (113)
Total $ (127)
Based on the derivative contracts that were in place as of December 31, 2017, a five percent devaluation of the euro compared to the U.S. dollar would result in a decrease in the market value of our forward purchase contract of $0.09 million. A five percent devaluation of the British pound sterling compared to the U.S. dollar would result in a decrease in the market value of our forward purchase contract of $0.3 million. A five percent devaluation of the Canadian dollar compared to the U.S. dollar would result in a decrease in the market value of our forward purchase contract of $(0.2) million. A five percent devaluation of the Mexican peso compared to the U.S. dollar would result in a decrease in the market value of our forward purchase contract of $(0.3) million. A five percent devaluation of the Norwegian krone compared to the U.S. dollar would result in a decrease in the market value of our forward purchase contract of $(0.2) million. A five percent devaluation of the Mexican peso compared to the U.S. dollar would result in a decrease in the market value of our forward sale contracts of $(0.3) million.
Commodity Price Risk
Prior to the disposal of Maritech in March 2018, we were exposed to the commodity price risk associated with Maritech’s oil and natural gas production on its remaining properties. Due to the minimal amount of production, such commodity price risk exposure is not significant.
Item 8. Financial Statements and Supplementary Data. Our financial statements and supplementary data for us and our subsidiaries required to be included in this
Item 8 are set forth in Item 15 of this Report.
Item 9. Changes in and Disagreements with Accountants on Accounting and Financial Disclosure. None.

63
Item 9A. Controls and Procedures. Conclusion Regarding the Effectiveness of Disclosure Controls and Procedures
Under the supervision and with the participation of our management, including our Chief Executive Officer
and Chief Financial Officer, we conducted an evaluation of our disclosure controls and procedures, as such term is defined under Rule 13a-15(e) promulgated under the Securities Exchange Act of 1934, as amended (the "Exchange Act") as of the end of the period covered by this report. Based on this evaluation, our Chief Executive Officer and Chief Financial Officer concluded that our disclosure controls and procedures were effective as of December 31, 2017.
Management’s Report on Internal Control over Financial Reporting
Our management is responsible for establishing and maintaining adequate internal control over financial
reporting, as such term is defined in Exchange Act Rule 13a-15(f). Under the supervision and with the participation of management, including our Chief Executive Officer and Chief Financial Officer, an evaluation of the effectiveness of our internal control over financial reporting as of December 31, 2017, was conducted based on the framework in Internal Control – Integrated Framework issued by the Committee of Sponsoring Organizations of the Treadway Commission (2013 framework) ("COSO"). Based on this assessment, management has determined that our internal control over financial reporting was effective as of December 31, 2017. Ernst & Young LLP, our independent registered public accounting firm, has issued an attestation report on the effectiveness of our internal control over financial reporting as of December 31, 2017. Ernst & Young LLP's report on our internal control over financial reporting is included herein.
Changes in Internal Control over Financial Reporting
There were no changes in our internal control over financial reporting that occurred during the fiscal quarter ended December 31, 2017, that have materially affected, or are reasonably likely to materially affect, our internal control over financial reporting.
Item 9B. Other Information. During the fourth quarter of 2017, and in connection with the preparation of our financial statements for the
period ended December 31, 2017, consolidated long-lived asset impairments of approximately $14.9 million were recorded primarily due to the impairment of a certain identified intangible asset resulting from decreased expected future operating cash flows from a Production Testing segment customer.
The impairment charges described above are not expected to result in future capital expenditures. For additional information, see "Note B – Summary of Significant Accounting Policies, Impairment of Long-Lived Assets" contained in the Notes to Consolidated Financial Statements.
64
PART III
Item 10. Directors, Executive Officers, and Corporate Governance. The information required by this Item is hereby incorporated by reference from the information appearing
under the captions “Proposal No. 1: Election of Directors,” “Executive Officers,” “Corporate Governance,” “Board Meetings and Committees,” and “Section 16(a) Beneficial Ownership Reporting Compliance” in our definitive proxy statement (the "Proxy Statement") for the annual meeting of stockholders to be held on May 4, 2018, which involves the election of directors and is to be filed with the SEC pursuant to the Securities Exchange Act of 1934 as amended (the "Exchange Act") within 120 days of the end of our fiscal year on December 31, 2017.
Item 11. Executive Compensation. The information required by this Item is hereby incorporated by reference from the information appearing
under the captions “Management and Compensation Committee Report,” “Management and Compensation Committee Interlocks and Insider Participation,” “Compensation Discussion and Analysis,” “Compensation of Executive Officers,” and “Director Compensation” in our Proxy Statement. Notwithstanding the foregoing, in accordance with the instructions to Item 407 of Regulation S-K, the information contained in our Proxy Statement under the subheading “Management and Compensation Committee Report” shall be deemed furnished, and not filed, in this Form 10-K, and shall not be deemed incorporated by reference into any filing under the Securities Act of 1933, or the Exchange Act, as a result of this furnishing, except to the extent we specifically incorporate it by reference.
Item 12. Security Ownership of Certain Beneficial Owners and Management and Related Stockholder Matters.
The information required by this Item is hereby incorporated by reference from the information appearing
under the captions “Beneficial Stock Ownership of Certain Stockholders and Management” and “Equity Compensation Plan Information” in our Proxy Statement.
Item 13. Certain Relationships and Related Transactions, and Director Independence. The information required by this Item is hereby incorporated by reference from the information appearing
under the captions “Certain Transactions” and “Director Independence” in our Proxy Statement.
Item 14. Principal Accounting Fees and Services. The information required by this Item is hereby incorporated by reference from the information appearing
under the caption “Fees Paid to Principal Accounting Firm” in our Proxy Statement.
65
PART IV
Item 15. Exhibits and Financial Statement Schedules. (a) List of documents filed as part of this Report
1. Financial Statements of the Company Page Reports of Independent Registered Public Accounting Firm
Consolidated Balance Sheets at December 31, 2017 and 2016 Consolidated Statements of Operations for the years ended December 31, 2017, 2016, and 2015
Consolidated Statements of Comprehensive Income (Loss) for the years ended December 31, 2017, 2016, and 2015
Consolidated Statements of Equity for the years ended December 31, 2017, 2016, and 2015 Consolidated Statements of Cash Flows for the years ended December 31, 2017, 2016, and 2015 Notes to Consolidated Financial Statements2. Financial statement schedules
Schedule I - Condensed Financial Information of Registrant (Parent Only) F-54All other schedules for which provision is made in the applicable accounting regulation of the Securities and Exchange Commission are not required under the related instructions or are inapplicable and therefore have been omitted.
3. List of Exhibits
3.1 Restated Certificate of Incorporation of TETRA Technologies, Inc. (incorporated by reference to Exhibit 4.1 to the Company’s Registration Statement on Form S-8 filed on December 22, 2016 (SEC File No. 333-215283)).
3.2 Amended and Restated Bylaws of TETRA Technologies, Inc. (incorporated by reference to Exhibit 4.6 to the Company’s Registration Statement on Form S-8 filed on May 4, 2006 (SEC File No. 333-133790)).
3.3 Certificate of Amendment of Restated Certificate of Incorporation of Tetra Technologies, Inc. (incorporated by reference to Exhibit 3.1 to the Company's Quarterly Report filed on August 9, 2017 (SEC File No. 001-13455)).
4.1 Senior Secured Note due April 1, 2017 (incorporated by reference to Exhibit 4.1 to the Company's Form 8-K filed on May 6, 2015 (SEC File No. 001-13455)).
4.2 Subsidiary Guaranty, dated April 30, 2015, executed by Compressco Field Services, L.L.C., Epic Diving & Marine Services, LLC, TETRA International Incorporated, TETRA Production Testing Services, LLC and TETRA Applied Technologies, LLC, in favor of Wells Fargo Energy Capital, Inc., in its capacity as noteholder representative for the benefit of the noteholders (incorporated by reference to Exhibit 4.2 to the Company's Form 8-K filed on May 6, 2015 (SEC File No. 001-13455)).
4.3 Note Purchase Agreement, dated November 5, 2015, by and between TETRA Technologies, Inc. and GSO Tetra Holdings LP (incorporated by reference to Exhibit 4.1 to the Company's Form 8-K filed on November 6, 2015 (SEC File No. 001-13455)).
4.4 Form of 11.00% Senior Notes due November 5, 2022 (incorporated by reference to Exhibit 4.2 to the Company's Form 8-K filed on November 6, 2015 (SEC File No. 001-13455)).
4.5 Second Amendment to Note Purchase Agreement, dated as of November 5, 2015, by and among TETRA Technologies, Inc., Wells Fargo Energy Capital, Inc. and certain other noteholders party thereto (incorporated by reference to Exhibit 4.3 to the Company's Form 8-K filed on November 6, 2015 (SEC File No. 001-13455)).
4.6 Form of Subsidiary Guaranty to be executed by Compressco Field Services, L.L.C., Epic Diving & Marine Services, LLC, TETRA Applied Technologies, LLC, TETRA International Incorporated and TETRA Production Testing Services, LLC, in favor of the holders of the 11.00% Senior Notes due November 5, 2022 (incorporated by reference to Exhibit 4.4 to the Company's Form 8-K filed on November 6, 2015 (SEC File No. 001-13455)).
4.7 Form of 11.00% Senior Note due November 5, 2022 (incorporated by reference to Exhibit 4.1 to the Company's Form 8-K filed on November 20, 2015 (SEC File No. 001-13455)).
F-1F-3F-5F-6
F-7F-8F-9
66
4.8 Subsidiary Guaranty, dated November 20, 2015, executed by Compressco Field Services, L.L.C., Epic Diving & Marine Services, LLC, TETRA Applied Technologies, LLC, TETRA International Incorporated and TETRA Production Testing Services, LLC, in favor of the holders from time to time of the 11.00% Senior Notes due November 5, 2022 (incorporated by reference to Exhibit 4.2 to the Company's Form 8-K filed on November 20, 2015 (SEC File No. 001-13455)).
4.9 Note Purchase Agreement, dated March 18, 2015, by and among TETRA Technologies, Inc., Wells Fargo Energy Capital, Inc., as Noteholder Representative, and Wells Fargo Energy Capital, Inc. as the sole Initial Purchaser listed on Schedule A thereto (incorporated by reference to Exhibit 4.1 to the Company's Form 8-K filed on March 24, 2015 (SEC File No. 001-13455)).
4.10 Pledge and Security Agreement, dated as of April 30, 2015, by and among TETRA Technologies, Inc., Compressco Field Services, L.L.C., Epic Diving & Marine Services, LLC, TETRA International Incorporated, TETRA Production Testing Services, LLC, CSI Compressco GP Inc., TETRA Applied Technologies, LLC and CSI Compressco Investment LLC, as the grantors, and Wells Fargo Energy Capital, Inc., in its capacity as noteholder representative and collateral agent (incorporated by reference to Exhibit 10.1 to the Company's Form 8-K filed on May 6, 2015 (SEC File No. 001-13455)).
4.11 Registration Rights Agreement, dated as of April 30, 2015, by and among CSI Compressco LP, TETRA Technologies, Inc., and Wells Fargo Energy Capital, Inc., in its capacity as noteholder representative (incorporated by reference to Exhibit 10.2 to the Company's Form 8-K filed on May 6, 2015 (SEC File No. 001-13455)).
4.12 Form of Senior Indenture (including form of senior debt security) (incorporated by reference to Exhibit 4.24 to the Company's Registration Statement on Form S-3 filed on March 23, 2016 (SEC File No. 333-210335)).
4.13 Form of Subordinated Indenture (incorporated by reference to Exhibit 4.25 to the Company's Registration Statement on Form S-3 filed on March 23, 2016 (SEC File No. 333-210335)).
4.14 Amended and Restated Note Purchase Agreement, dated July 1, 2016, between TETRA Technologies, Inc. and GSO Tetra Holdings LP (incorporated by reference to Exhibit 4.1 to the Company's Form 8-K filed on July 1, 2016 (SEC File No. 001-13455)).
4.15 Warrant Agreement, dated December 14, 2016, between TETRA Technologies, Inc. and Computershare Trust Company, N.A. (incorporated by reference to Exhibit 4.1 to the Company's Form 8-K filed on December 14, 2016 (SEC File No. 001-13455)).
4.16 Form of Warrant Certificate, dated December 14, 2016, between TETRA Technologies, Inc. and Computershare Trust Company, N.A. (incorporated by reference to Exhibit 4.2 to the Company's Form 8-K filed on December 14, 2016 (SEC File No. 001-13455)).
4.17 First Amendment to Amended and Restated Note Purchase Agreement, dated December 22, 2016, between TETRA Technologies, Inc. and GSO Tetra Holdings LP (incorporated by reference to Exhibit 4.1 to the Company's Form 8-K filed on December 22, 2016 (SEC File No. 001-13455)).
10.1*** 1996 Stock Option Plan for Nonexecutive Employees and Consultants (incorporated by reference to Exhibit 99.1 to the Company’s Registration Statement on Form S-8 filed on November 19, 1997 (SEC File No. 333-61988)).
10.2*** TETRA Technologies, Inc. 2006 Equity Incentive Compensation Plan (incorporated by reference to Exhibit 4.12 to the Company’s Registration Statement on Form S-8 filed on May 4, 2006 (SEC File No. 333-133790)).
10.3*** Forms of Employee Incentive Stock Option Agreement, Employee Nonqualified Stock Option Agreement, and Employee Restricted Stock Agreement under the TETRA Technologies, Inc. 2006 Equity Incentive Compensation Plan (incorporated by reference to Exhibits 10.1, 10.2, and 10.3 to the Company’s Form 8-K filed on May 8, 2006 (SEC File No. 001-13455)).
10.4 Credit Agreement, as amended and restated, dated as of June 27, 2006, among TETRA Technologies, Inc. and certain of its subsidiaries, as borrowers, JPMorgan Chase Bank, N.A., as administrative agent, Bank of America, National Association and Wells Fargo Bank, N.A., as syndication agents, and Comerica Bank, as documentation agent, and the lenders party thereto (incorporated by reference to Exhibit 10.1 to the Company’s Form 8-K filed on June 30, 2006 (SEC File No. 001-13455)).
10.5 Agreement and First Amendment to Credit Agreement, dated as of December 15, 2006, among TETRA Technologies, Inc. and certain of its subsidiaries, as borrowers, JPMorgan Chase Bank, N.A., as administrative agent, Bank of America, National Association and Wells Fargo Bank, N.A., as syndication agents, and Comerica Bank, as documentation agent, and the lenders party thereto (incorporated by reference to Exhibit 10.1 to the Company’s Form 8-K filed on January 10, 2007 (SEC File No. 001-13455)).
10.6*** Summary Description of the Compensation of Non-Employee Directors of TETRA Technologies, Inc. (incorporated by reference to Exhibit 10.6 to the Company’s Form 10-K filed on March 01, 2017 (SEC File No. 001-13455)).
67
10.7*** Summary Description of Named Executive Officer Compensation (incorporated by reference to Exhibit 10.7 to the Company’s Form 10-K filed on March 01, 2017 (SEC File No. 001-13455)).
10.8*** TETRA Technologies, Inc. Nonqualified Deferred Compensation Plan (incorporated by reference to Exhibit 10.9 to the Company’s Form 10-Q filed on August 13, 2002 (SEC File No. 001-13455)).
10.9*** TETRA Technologies, Inc. Nonqualified Deferred Compensation Plan and The Executive Excess Plan Adoption Agreement effective on June 30, 2005 (incorporated by reference to Exhibit 10.2 to the Company’s Form 10-Q/A filed on March 16, 2006 (SEC File No. 001-13455)).
10.10*** TETRA Technologies, Inc. 2007 Equity Incentive Compensation Plan (incorporated by reference to Exhibit 4.12 to the Company’s Registration Statement on Form S-8 filed on May 4, 2007 (SEC File No. 333-142637)).
10.11*** Forms of Employee Incentive Stock Option Agreement, Employee Nonqualified Stock Option Agreement, and Employee Restricted Stock Agreement under the TETRA Technologies, Inc. 2007 Equity Incentive Compensation Plan (incorporated by reference to Exhibits 4.13, 4.14, and 4.15 to the Company’s Registration Statement on Form S-8 filed on May 4, 2007 (SEC File No. 333-142637)).
10.12*** TETRA Technologies, Inc. 401(k) Retirement Plan, as amended and restated (incorporated by reference to Exhibit 99.1 to the Company’s Registration Statement on Form S-8 filed on February 22, 2008 (SEC File No. 333-149348)).
10.13*** TETRA Technologies, Inc. Amended and Restated 2007 Equity Incentive Compensation Plan (incorporated by reference to Exhibit 4.12 to the Company’s Registration Statement on Form S-8 filed on May 9, 2008 (SEC File No. 333-150783)).
10.14*** Forms of Employee Incentive Stock Option Agreement, Employee Nonqualified Stock Option Agreement, Employee Restricted Stock Agreement, and Non-Employee Director Restricted Stock Agreement under the TETRA Technologies, Inc. Amended and Restated 2007 Equity Incentive Compensation Plan (incorporated by reference to Exhibits 4.13, 4.14, 4.15 and 4.16 to the Company’s Registration Statement on Form S-8 filed on May 9, 2008 (SEC File No. 333-150783)).
10.15*** TETRA Technologies, Inc. Cash Incentive Compensation Plan (incorporated by reference to Exhibit 4.1 to the Company’s Form 10-Q filed on May 10, 2010 (SEC File No. 001-13455)).
10.16*** TETRA Technologies, Inc. 2007 Long Term Incentive Compensation Plan (incorporated by reference to Exhibit 4.11 to the Company’s Registration Statement on Form S-8 filed on May 5, 2010 (SEC File No. 333-166537)).
10.17*** Forms of Employee Incentive Stock Option Agreement, Employee Nonqualified Stock Option Agreement, Employee Restricted Stock Agreement, Non-Employee Consultant Nonqualified Stock Option Agreement, Non-Employee Consultant Restricted Stock Agreement, and Non-Employee Director Restricted Stock Agreement under the TETRA Technologies, Inc. 2007 Long Term Incentive Compensation Plan (incorporated by reference to Exhibits 4.12, 4.13, 4.14, 4.15, 4.16 and 4.17 to the Company’s Registration Statement on Form S-8 filed on May 5, 2010 (SEC File No. 333-166537)).
10.18 Agreement and Second Amendment to Credit Agreement dated as of October 29, 2010, among TETRA Technologies, Inc. and certain of its subsidiaries, as borrowers, JPMorgan Chase Bank, N.A., as administrative agent, Bank of America, National Association and Wells Fargo Bank, N.A. as syndication agents, and Comerica Bank, as documentation agent, and the lenders party thereto (incorporated by reference to Exhibit 10.1 to the Company’s Form 8-K filed on November 3, 2010 (SEC File No. 001-13455)).
10.19 Contribution, Conveyance and Assumption Agreement, dated June 20, 2011, by and among Compressco, Inc., Compressco Field Services, Inc., Compressco Canada, Inc., Compressco de Mexico, S. de R.L. de C.V., Compressco Partners GP Inc., Compressco Partners, L.P., Compressco Partners Operating, LLC, Compressco Netherlands B.V., Compressco Holdings, LLC, Compressco Netherlands Cooperatief U.A., Compressco Partners Sub, Inc., TETRA International Incorporated, Production Enhancement Mexico, S. de R.L. de C.V. and TETRA Technologies, Inc. (incorporated by reference to Exhibit 10.1 to the Company’s Form 8-K filed on June 30, 2011 (SEC File No. 001-13455)).
10.20 Omnibus Agreement dated June 20, 2011, by and among Compressco Partners, L.P., TETRA Technologies, Inc. and Compressco Partners GP Inc. (incorporated by reference to Exhibit 10.2 to the Company’s Form 8-K filed on June 30, 2011 (SEC File No. 001-13455)).
10.21 Purchase and Sale Agreement, dated April 1, 2011, by and between Maritech Resources, Inc. as Seller and Tana Exploration Company LLC as Buyer (incorporated by reference to Exhibit 10.3 to the Company’s Form 10-Q filed on August 9, 2011 (SEC File No. 001-13455)).
10.22*** TETRA Technologies, Inc. 2011 Long-Term Incentive Compensation Plan (incorporated by reference to Exhibit 4.11 to the Company’s Registration Statement on Form S-8 filed on May 10, 2011 (SEC File No. 333-174090)).
68
10.23*** Forms of Employee Incentive Stock Option Agreement, Employee Nonqualified Stock Option Agreement, Employee Restricted Stock Agreement, Non-Employee Consultant Nonqualified Stock Option Agreement, Non-Employee Consultant Restricted Stock Agreement and Non-Employee Director Restricted Stock Agreement under the TETRA Technologies, Inc. 2011 Long Term Incentive Compensation Plan (incorporated by reference to Exhibits 4.12, 4.13, 4.14, 4.15, 4.16 and 4.17 to the Company’s Registration Statement on Form S-8 filed on May 10, 2011 (SEC File No. 333-174090)).
10.24*** Employee Restricted Stock Agreement between TETRA Technologies, Inc. and Peter J. Pintar dated November 15, 2011 (incorporated by reference to Exhibit 4.11 to the Company’s Registration Statement on Form S-8 filed on November 15, 2011 (SEC File No. 333-177995)).
10.25*** Employee Equity Award Agreement dated August 15, 2012 by and between TETRA Technologies, Inc. and Elijio V. Serrano (incorporated by reference to Exhibit 10.1 to the Company’s Form 8-K filed on August 16, 2012 (SEC File No. 001-13455)).
10.26 Lease Agreement dated December 31, 2012 by and between Tetris Property LP and TETRA Technologies, Inc. (incorporated by reference to Exhibit 10.36 to the Company's Form 10-K filed on March 4, 2013 (SEC File No. 001-13455)).
10.27*** TETRA Technologies, Inc. 2011 Amended and Restated Long Term Incentive Compensation Plan (incorporated by reference to Exhibit 4.9 to the Company’s Registration Statement on Form S-8 filed on May 9, 2013 (SEC File No. 333-188494)).
10.28*** Forms of Employee Incentive Stock Option Agreement, Employee Nonqualified Stock Option Agreement, Employee Restricted Stock Agreement, Non-Employee Director Restricted Stock Agreement, Non-Employee Nonqualified Stock Option Agreement and Non-Employee Restricted Stock Agreement under the TETRA Technologies, Inc. 2011 Amended and Restated Long Term Incentive Compensation Plan (incorporated by reference to Exhibits 4.10, 4.11, 4.12, 4.13, 4.14 and 4.15, respectively to the Company’s Registration Statement on Form S-8 filed on May 9, 2013 (SEC File No. 333-188494)).
10.29*** Form of Change in Control Agreement (incorporated by reference to Exhibit 10.1 to the Company’s Form 8-K filed on June 4, 2013 (SEC File No. 001-13455)).
10.30 Credit Agreement, dated October 15, 2013, by and among Compressco Partners, L.P., Compressco Partners Operating, LLC, Compressco Partners Sub, Inc., Compressco Holdings, LLC, Compressco Leasing, LLC, Compressco Field Services International, LLC, and Compressco International, LLC, as the borrowers, JP Morgan Chase Bank, N.A., as Administrative Agent, and JPMorgan Chase Bank, N.A., Bank of America, N.A., and PNC Bank, National Association, as lenders (incorporated by reference to Exhibit 10.1 to Compressco Partners, L.P.’s Current Report on Form 8-K filed on October 18, 2013 (SEC File No. 001-35195)).
10.31*** Employee Restricted Stock Award Agreement dated June 16, 2014 by and between TETRA Technologies, Inc. and Joseph Elkhoury (incorporated by reference to Exhibit 10.1 to the Company's Form 8-K filed on June 16, 2014 (SEC File No. 001-13455)).
10.32 First Amendment to Omnibus Agreement, dated June 20, 2014, by and among TETRA Technologies, Inc., Compressco Partners, L.P., and Compressco Partners GP Inc. (incorporated by reference to Exhibit 10.1 to the Company's Form 8-K filed on June 26, 2014 (SEC File No. 001-13455)).
10.33 Stock Purchase Agreement, dated as of July 20, 2014, by and between Warren Equipment Company and Compressco Partners Sub, Inc. (incorporated by reference to Exhibit 2.1 to the Company's Form 8-K filed on July 21, 2014 (SEC File No. 001-13455)).
10.34 Indenture, dated as of August 4, 2014, by and among Compressco Partners, L.P., Compressco Finance Inc., the Guarantors party thereto and U.S. Bank National Association, as Trustee (incorporated by reference to Exhibit 4.1 to the Company's Form 8-K filed on August 5, 2014 (SEC File No. 001-13455)).
10.35 Guaranty, dated July 20, 2014, by Compressco Partners, L.P. in favor of Warren Equipment Company (incorporated by reference to Exhibit 10.1 to the Company's Form 8-K filed on July 21, 2014 (SEC File No. 001-13455)).
10.36 Contribution and Unit Purchase Agreement, dated as of July 20, 2014, by and among Compressco Partners, L.P., Compresso Partners GP, Inc. and TETRA Technologies, Inc. (incorporated by reference to Exhibit 10.2 to the Company's Form 8-K filed on July 21, 2014 (SEC File No. 001-13455)).
10.37 Purchase Agreement, dated as of July 29, 2014, by and among Compressco Partners, L.P., Compressco Finance Inc., the Guarantors party thereto and Merrill Lynch, Pierce, Fenner & Smith Incorporated as representative of the Initial Purchasers named therein (incorporated by reference to Exhibit 10.1 to the Company's Form 8-K filed on August 5, 2014 (SEC File No. 001-13455)).
10.38 Purchase Agreement Joinder, dated as of August 4, 2014, by and among the Guarantors party thereto and Merrill Lynch, Pierce, Fenner & Smith Incorporated, as Representative of the Initial Purchasers named therein (incorporated by reference to Exhibit 10.2 to the Company's Form 8-K filed on August 5, 2014 (SEC File No. 001-13455)).
69
10.39 Credit Agreement, dated as of August 4, 2014, by and among Compressco Partners, L.P., Compressco Partners Sub, Inc., the lenders from time to time party thereto, Bank of America, N.A., in its capacity as administrative agent for the lenders and collateral agent, and the other parties thereto (incorporated by reference to Exhibit 10.3 to the Company's Form 8-K filed on August 5, 2014 (SEC File No. 001-13455)).
10.40 Agreement and Third Amendment to Credit Agreement dated as of September 30, 2014, among TETRA Technologies, Inc. and certain of its subsidiaries as borrowers, JPMorgan Chase Bank, N.A., as administrative agent, Bank of America, National Association, as syndication agent, Comerica Bank, as documentation agent, and the lender parties thereto (incorporated by reference to Exhibit 10.1 to the Company's Form 8-K filed on October 6, 2014 (SEC File No. 001-13455)).
10.41*** TETRA Technologies, Inc. Amended and Restated 2007 Long Term Incentive Compensation Plan, as amended through February 20, 2015 (incorporated by reference to Exhibit 10.3 to the Company's Form 10-Q filed on August 10, 2015 (SEC File No. 001-13455)).
10.42*** TETRA Technologies, Inc. Second Amended and Restated 2011 Long Term Incentive Compensation Plan, as amended through February 20, 2015 (incorporated by reference to Exhibit 10.4 to the Company's Form 10-Q filed on August 10, 2015 (SEC File No. 001-13455)).
10.43*** Amendment No. 2 to the TETRA Technologies, Inc. Cash Incentive Compensation Plan (incorporated by reference to Exhibit 10.1 to the Company's Form 8-K filed on February 26, 2016 (SEC File No. 001-13455)).
10.44*** Third Amended and Restated 2011 Long Term Incentive Compensation Plan (incorporated by reference to Exhibit 10.1 to the Company's Form 8-K filed on May 6, 2016 (SEC File No. 001-13455)).
10.45 Third Amendment to Credit Agreement dated May 25, 2016, by and among CSI Compressco LP, CSI Compressco Sub Inc., Bank of America, N.A., in its capacity as administrative agent, collateral agent, lender, letter of credit issuer and swing line issuer, and the other lenders and loan parties a party thereto (incorporated by reference to Exhibit 10.1 to the Company's Form 8-K filed on May 25, 2016 (SEC File No. 001-13455)).
10.46 Agreement and Fourth Amendment to Credit Agreement dated as of July 1, 2016, among TETRA Technologies, Inc., and certain of its subsidiaries as borrowers, JPMorgan Chase Bank, N.A., as administrative agent, and the lender parties thereto (incorporated by reference to Exhibit 10.1 to the Company's Form 8-K filed on July 1, 2016 (SEC File No. 001-13455)).
10.47 Security Agreement dated as of July 1, 2016, among TETRA Technologies, Inc., and certain of its subsidiaries as pledgors, JPMorgan Chase Bank, N.A., in its capacity as collateral agent (incorporated by reference to Exhibit 10.2 to the Company's Form 8-K filed on July 1, 2016 (SEC File No. 001-13455)).
10.48 Series A Preferred Unit Purchase Agreement, dated as of August 8, 2016, by and among CSI Compressco LP and the Purchasers party thereto (incorporated by reference to Exhibit 10.1 to the Company's Form 8-K filed on August 9, 2016 (SEC File No. 001-13455)).
10.49 Registration Rights Agreement, dated as of August 8, 2016, by and among CSI Compressco LP and the other parties signatory thereto (incorporated by reference to Exhibit 10.2 to the Company's Form 8-K filed on August 9, 2016 (SEC File No. 001-13455)).
10.50 Agreement and Fifth Amendment to Credit Agreement dated as of December 22, 2016, among TETRA Technologies, Inc., and certain of its subsidiaries as borrowers, JPMorgan Chase Bank, N.A., as administrative agent, and the lender parties thereto (incorporated by reference to Exhibit 10.1 to the Company's Form 8-K filed on December 23, 2016 (SEC File No. 001-13455)).
10.51*** Forms of Employee Incentive Stock Option Agreement, Employee Nonqualified Stock Option Agreement, Employee Restricted Stock Agreement, Non-Employee Director Restricted Stock Agreement, Non-Employee Consultant Nonqualified Stock Option Agreement and Non-Employee Consultant Restricted Stock Agreement under the TETRA Technologies, Inc. Third Amended and Restated 2011 Long Term Incentive Compensation Plan (incorporated by reference to Exhibits 4.7, 4.8, 4.9, 4.10, 4.11 and 4.12, respectively to the Company’s Registration Statement on Form S-8 filed on December 22, 2016 (SEC File No. 333-215283)).
10.52*** Form of Employee Incentive Stock Option Agreement under the TETRA Technologies, Inc. Amended and Restated 2007 Equity Incentive Compensation Plan (incorporated by reference to Exhibit 10.53 to the Company's Form 10-K filed on March 1, 2017 (SEC File No. 001-13455)).
10.53*** Form of Employee Nonqualified Stock Option Agreement under the TETRA Technologies, Inc. Amended and Restated 2007 Equity Incentive Compensation Plan (incorporated by reference to Exhibit 10.54 to the Company's Form 10-K filed on March 1, 2017 (SEC File No. 001-13455)).
10.54*** Form of Employee Restricted Stock Agreement under the TETRA Technologies, Inc. Amended and Restated 2007 Equity Incentive Compensation Plan (incorporated by reference to Exhibit 10.55 to the Company's Form 10-K filed on March 1, 2017 (SEC File No. 001-13455)).
10.55*** Form of Non-Employee Director Restricted Stock Agreement under the TETRA Technologies, Inc. Amended and Restated 2007 Equity Incentive Compensation Plan (incorporated by reference to Exhibit 10.56 to the Company's Form 10-K filed on March 1, 2017 (SEC File No. 001-13455)).
70
10.56*** Form of Non-Employee Nonqualified Stock Option Agreement under the TETRA Technologies, Inc. Amended and Restated 2007 Equity Incentive Compensation Plan (incorporated by reference to Exhibit 10.57 to the Company's Form 10-K filed on March 1, 2017 (SEC File No. 001-13455)).
10.57*** Form of Non-Employee Restricted Stock Agreement under the TETRA Technologies, Inc. Amended and Restated 2007 Equity Incentive Compensation Plan (incorporated by reference to Exhibit 10.58 to the Company's Form 10-K filed on March 1, 2017 (SEC File No. 001-13455)).
10.58 Fifth Amendment to Credit Agreement, dated May 5, 2017, by and among CSI Compressco LP, CSI Compressco Sub Inc., the other loan parties party thereto, Bank of America, N.A., as administrative agent, and collateral agent, and the lenders party thereto (incorporated by reference to Exhibit 4.1 to the Quarterly Report filed on August 9, 2017 (SEC File No. 001-13455)).
10.59*** Separation and Release Agreement, dated June 1, 2017, by and between TETRA Technologies, Inc. and Joseph Elkhoury (incorporated by reference to Exhibit 10.1 to the Compnay's Current Report on Form 8-K filed on June 2, 2017 (SEC File No. 001-13455)).
10.60*** Stand-Alone Cash-Settled Stock Appreciation Rights Award Agreement, dated August 9, 2017, between TETRA Technologies, Inc. and Stuart M. Brightman (incorporated by reference to Exhibit 10.1 to the Company's Quarterly Report filed on November 9, 2017 (SEC File No. 001-13455)).
10.61*** TETRA Technologies, Inc. 2018 Inducement Restricted Stock Plan (incorporated by reference to Exhibit 4.5 to the Company’s Registration Statement on Form S-8 filed on February 12, 2018 ((SEC File No. 333-222976)).
10.62*** Form of Restricted Stock Award Agreement under the TETRA Technologies, Inc. 2018 Inducement Restricted Stock Plan (incorporated by reference to Exhibit 4.6 to the Company’s Registration Statement on Form S-8 filed on February 12, 2018 (SEC File No. 333-222976)).
21+ Subsidiaries of the Company.
23.1+ Consent of Ernst & Young, LLP.
31.1+ Certification Pursuant to Rule 13(a)-14(a) or 15(d)-14(a) of the Exchange Act, As Adopted Pursuant to Section 302 of the Sarbanes-Oxley Act of 2002.
31.2+ Certification Pursuant to Rule 13(a)-14(a) or 15(d)-14(a) of the Exchange Act, As Adopted Pursuant to Section 302 of the Sarbanes-Oxley Act of 2002.
32.1** Certification Furnished Pursuant to 18 U.S.C. Section 1350, As Adopted Pursuant to Section 906 of the Sarbanes-Oxley Act of 2002 (Chief Executive Officer).
32.2** Certification Furnished Pursuant to 18 U.S.C. Section 1350, As Adopted Pursuant to Section 906 of the Sarbanes-Oxley Act of 2002 (Chief Financial Officer).
101.INS++ XBRL Instance Document.
101.SCH++ XBRL Taxonomy Extension Schema Document.
101.CAL++ XBRL Taxonomy Extension Calculation Linkbase Document.
101.LAB++ XBRL Taxonomy Extension Label Linkbase Document.
101.PRE++ XBRL Taxonomy Extension Presentation Linkbase Document.
101.DEF++ XBRL Taxonomy Extension Definition Linkbase Document.
+ Filed with this report** Furnished with this report.*** Management contract or compensatory plan or arrangement.++ Attached as Exhibit 101 to this report are the following documents formatted in XBRL (Extensible Business Reporting Language): (i)
Consolidated Statements of Operations for the years ended December 31, 2017, 2016 and 2015; (ii) Consolidated Balance Sheets as of December 31, 2017 and December 31, 2016; (iii) Consolidated Statements of Comprehensive Income for the years ended December 31, 2017, 2016 and 2015; (iv) Consolidated Statements of Cash Flows for the years ended December 31, 2017, 2016 and 2015; (v) Consolidated Statements of Stockholders’ Equity for the years ended December 31, 2017, 2016 and 2015; and (vi) Notes to Consolidated Financial Statements for the year ended December 31, 2017.
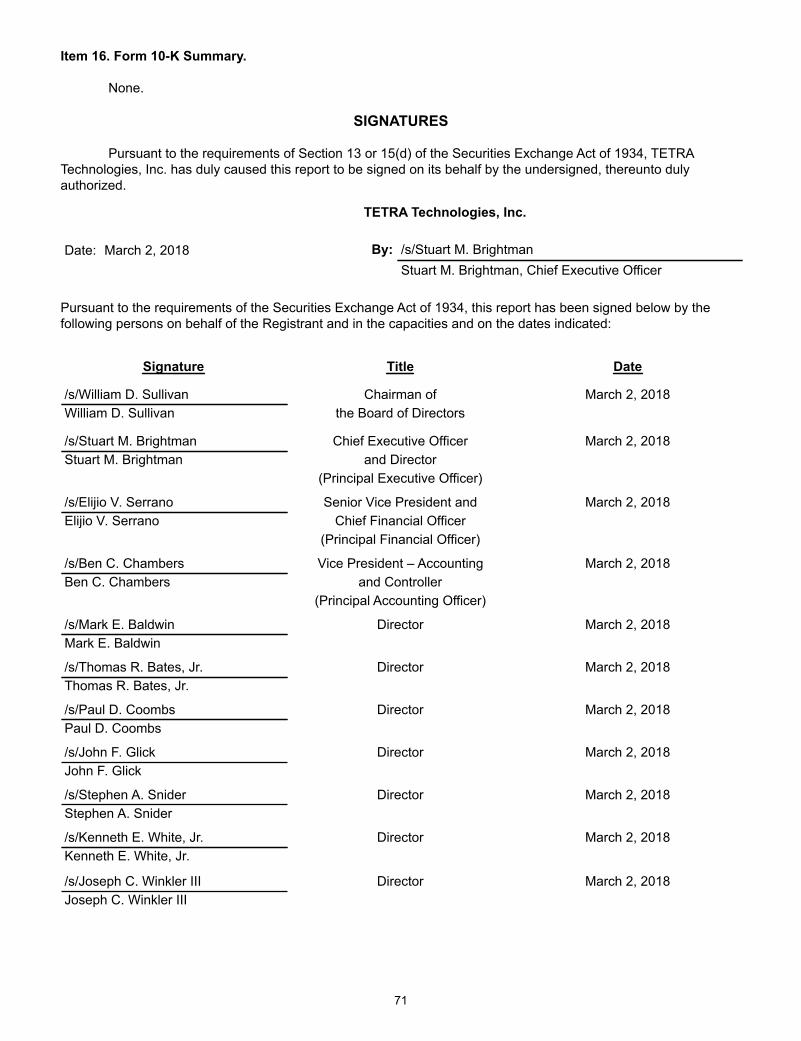
71
Item 16. Form 10-K Summary.
None.
SIGNATURES Pursuant to the requirements of Section 13 or 15(d) of the Securities Exchange Act of 1934, TETRA
Technologies, Inc. has duly caused this report to be signed on its behalf by the undersigned, thereunto duly authorized.
TETRA Technologies, Inc.
Date: March 2, 2018 By: /s/Stuart M. Brightman Stuart M. Brightman, Chief Executive Officer
Pursuant to the requirements of the Securities Exchange Act of 1934, this report has been signed below by the following persons on behalf of the Registrant and in the capacities and on the dates indicated:
Signature Title Date
/s/William D. Sullivan Chairman of March 2, 2018William D. Sullivan the Board of Directors
/s/Stuart M. Brightman Chief Executive Officer March 2, 2018Stuart M. Brightman and Director (Principal Executive Officer)
/s/Elijio V. Serrano Senior Vice President and March 2, 2018Elijio V. Serrano Chief Financial Officer (Principal Financial Officer)
/s/Ben C. Chambers Vice President – Accounting March 2, 2018Ben C. Chambers and Controller
(Principal Accounting Officer)
/s/Mark E. Baldwin Director March 2, 2018Mark E. Baldwin
/s/Thomas R. Bates, Jr. Director March 2, 2018Thomas R. Bates, Jr.
/s/Paul D. Coombs Director March 2, 2018Paul D. Coombs
/s/John F. Glick Director March 2, 2018John F. Glick
/s/Stephen A. Snider Director March 2, 2018Stephen A. Snider
/s/Kenneth E. White, Jr. Director March 2, 2018Kenneth E. White, Jr.
/s/Joseph C. Winkler III Director March 2, 2018Joseph C. Winkler III

F-1
REPORT OF INDEPENDENT REGISTERED PUBLIC ACCOUNTING FIRM
Board of Directors and Stockholders ofTETRA Technologies, Inc. and Subsidiaries Opinion on the Financial StatementsWe have audited the accompanying consolidated balance sheets of TETRA Technologies, Inc. and subsidiaries (the Company) as of December 31, 2017 and 2016, and the related consolidated statements of operations, comprehensive income (loss), equity, and cash flows for each of the three years in the period ended December 31, 2017, and the related notes and financial statement schedule listed in the Index at Item 15a (collectively referred to as the “consolidated financial statements”). In our opinion, the consolidated financial statements present fairly, in all material respects, the financial position of the Company at December 31, 2017 and 2016, and the results of its operations and its cash flows for each of the three years in the period ended December 31, 2017, in conformity with U.S. generally accepted accounting principles.
We also have audited, in accordance with the standards of the Public Company Accounting Oversight Board (United States) (PCAOB), the Company's internal control over financial reporting as of December 31, 2017, based on criteria established in Internal Control - Integrated Framework issued by the Committee of Sponsoring Organizations of the Treadway Commission (2013 Framework) and our report dated March 2, 2018, expressed an unqualified opinion thereon.
Basis for OpinionThese financial statements are the responsibility of the Company’s management. Our responsibility is to express an opinion on the Company’s financial statements based on our audits. We are a public accounting firm registered with the PCAOB and are required to be independent with respect to the Company in accordance with the U.S. federal securities laws and the applicable rules and regulations of the Securities and Exchange Commission and the PCAOB.
We conducted our audits in accordance with the standards of the PCAOB. Those standards require that we plan and perform the audit to obtain reasonable assurance about whether the financial statements are free of material misstatement, whether due to error or fraud. Our audits included performing procedures to assess the risks of material misstatement of the financial statements, whether due to error or fraud, and performing procedures that respond to those risks. Such procedures include examining, on a test basis, evidence regarding the amounts and disclosures in the financial statements. Our audits also included evaluating the accounting principles used and significant estimates made by management, as well as evaluating the overall presentation of the financial statements. We believe that our audits provide a reasonable basis for our opinion.
/s/ERNST & YOUNG LLP
We have served as the Company's auditor since 1981.
Houston, TexasMarch 2, 2018

F-2
REPORT OF INDEPENDENT REGISTERED PUBLIC ACCOUNTING FIRM
Board of Directors and Stockholders ofTETRA Technologies, Inc. and Subsidiaries Opinion on Internal Control over Financial ReportingWe have audited TETRA Technologies, Inc. and subsidiaries’ internal control over financial reporting as of December 31, 2017, based on criteria established in Internal Control-Integrated Framework issued by the Committee of Sponsoring Organizations of the Treadway Commission (2013 Framework) (the COSO criteria). In our opinion, TETRA Technologies, Inc. (the Company) maintained, in all material respects, effective internal control over financial reporting as of December 31, 2017, based on the COSO criteria.
We also have audited, in accordance with the standards of the Public Company Accounting Oversight Board (United States) (PCAOB), the consolidated balance sheets of the Company as of December 31, 2017 and 2016, and the related consolidated statements of operations, comprehensive income (loss), equity and cash flows for each of the three years in the period ended December 31, 2017 and our report dated March 2, 2018, expressed an unqualified opinion thereon.
Basis for OpinionThe Company's management is responsible for maintaining effective internal control over financial reporting, and for its assessment of the effectiveness of internal control over financial reporting included in the accompanying “Management’s Report on Internal Control Over Financial Reporting.” Our responsibility is to express an opinion on the Company’s internal control over financial reporting based on our audit. We are a public accounting firm registered with the PCAOB and are required to be independent with respect to the Company in accordance with the U.S. federal securities laws and the applicable rules and regulations of the Securities and Exchange Commission and the PCAOB.
We conducted our audit in accordance with the standards of the PCAOB. Those standards require that we plan and perform the audit to obtain reasonable assurance about whether effective internal control over financial reporting was maintained in all material respects.
Our audit included obtaining an understanding of internal control over financial reporting, assessing the risk that a material weakness exists, testing and evaluating the design and operating effectiveness of internal control based on the assessed risk, and performing such other procedures as we considered necessary in the circumstances. We believe that our audit provides a reasonable basis for our opinion.
Definition and Limitations of Internal Control Over Financial ReportingA company’s internal control over financial reporting is a process designed to provide reasonable assurance regarding the reliability of financial reporting and the preparation of financial statements for external purposes in accordance with generally accepted accounting principles. A company’s internal control over financial reporting includes those policies and procedures that (1) pertain to the maintenance of records that, in reasonable detail, accurately and fairly reflect the transactions and dispositions of the assets of the company; (2) provide reasonable assurance that transactions are recorded as necessary to permit preparation of financial statements in accordance with generally accepted accounting principles, and that receipts and expenditures of the company are being made only in accordance with authorizations of management and directors of the company; and (3) provide reasonable assurance regarding prevention or timely detection of unauthorized acquisition, use, or disposition of the company’s assets that could have a material effect on the financial statements.
Because of its inherent limitations, internal control over financial reporting may not prevent or detect misstatements. Also, projections of any evaluation of effectiveness to future periods are subject to the risk that controls may become inadequate because of changes in conditions, or that the degree of compliance with the policies or procedures may deteriorate.
/s/ERNST & YOUNG LLP Houston, TexasMarch 2, 2018
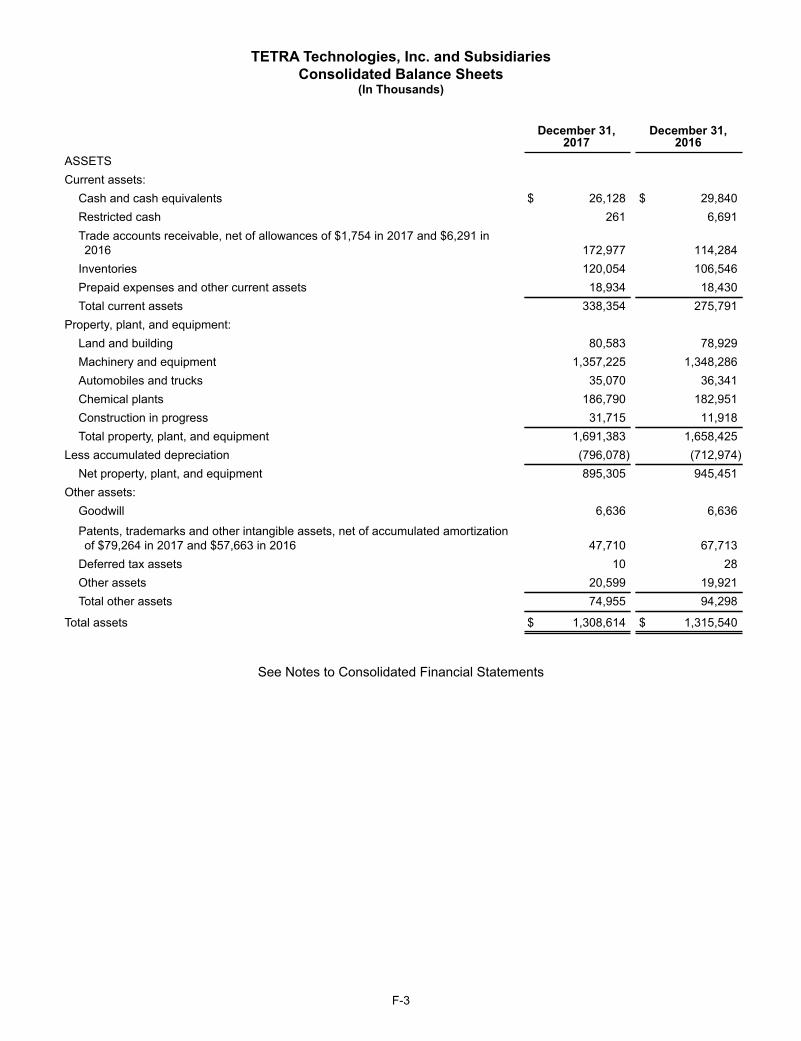
F-3
TETRA Technologies, Inc. and SubsidiariesConsolidated Balance Sheets
(In Thousands)
December 31,2017
December 31,2016
ASSETS Current assets:
Cash and cash equivalents $ 26,128 $ 29,840Restricted cash 261 6,691Trade accounts receivable, net of allowances of $1,754 in 2017 and $6,291 in2016 172,977 114,284
Inventories 120,054 106,546Prepaid expenses and other current assets 18,934 18,430Total current assets 338,354 275,791
Property, plant, and equipment: Land and building 80,583 78,929Machinery and equipment 1,357,225 1,348,286Automobiles and trucks 35,070 36,341Chemical plants 186,790 182,951Construction in progress 31,715 11,918Total property, plant, and equipment 1,691,383 1,658,425
Less accumulated depreciation (796,078) (712,974)Net property, plant, and equipment 895,305 945,451
Other assets: Goodwill 6,636 6,636
Patents, trademarks and other intangible assets, net of accumulated amortizationof $79,264 in 2017 and $57,663 in 2016 47,710 67,713
Deferred tax assets 10 28Other assets 20,599 19,921Total other assets 74,955 94,298
Total assets $ 1,308,614 $ 1,315,540
See Notes to Consolidated Financial Statements
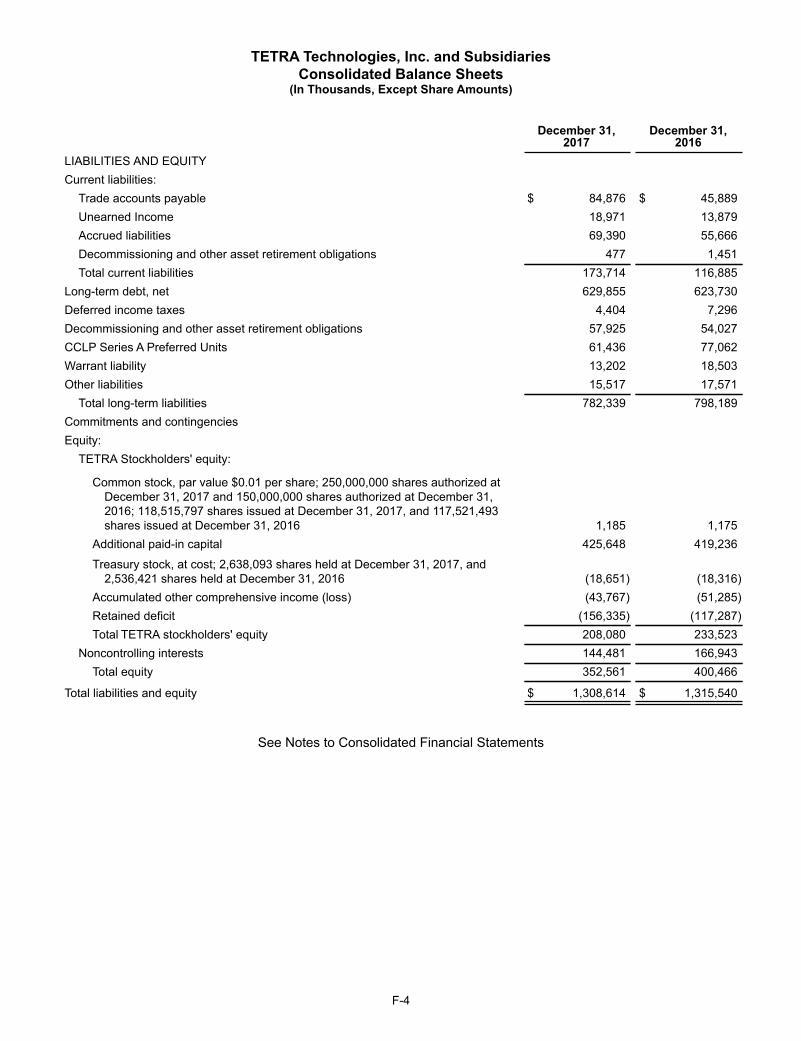
F-4
TETRA Technologies, Inc. and SubsidiariesConsolidated Balance Sheets
(In Thousands, Except Share Amounts)
December 31,
2017December 31,
2016LIABILITIES AND EQUITY Current liabilities:
Trade accounts payable $ 84,876 $ 45,889Unearned Income 18,971 13,879Accrued liabilities 69,390 55,666Decommissioning and other asset retirement obligations 477 1,451Total current liabilities 173,714 116,885
Long-term debt, net 629,855 623,730Deferred income taxes 4,404 7,296Decommissioning and other asset retirement obligations 57,925 54,027CCLP Series A Preferred Units 61,436 77,062Warrant liability 13,202 18,503Other liabilities 15,517 17,571
Total long-term liabilities 782,339 798,189Commitments and contingencies Equity:
TETRA Stockholders' equity:
Common stock, par value $0.01 per share; 250,000,000 shares authorized atDecember 31, 2017 and 150,000,000 shares authorized at December 31,2016; 118,515,797 shares issued at December 31, 2017, and 117,521,493shares issued at December 31, 2016 1,185 1,175
Additional paid-in capital 425,648 419,236
Treasury stock, at cost; 2,638,093 shares held at December 31, 2017, and2,536,421 shares held at December 31, 2016 (18,651) (18,316)
Accumulated other comprehensive income (loss) (43,767) (51,285)Retained deficit (156,335) (117,287)Total TETRA stockholders' equity 208,080 233,523
Noncontrolling interests 144,481 166,943Total equity 352,561 400,466
Total liabilities and equity $ 1,308,614 $ 1,315,540
See Notes to Consolidated Financial Statements
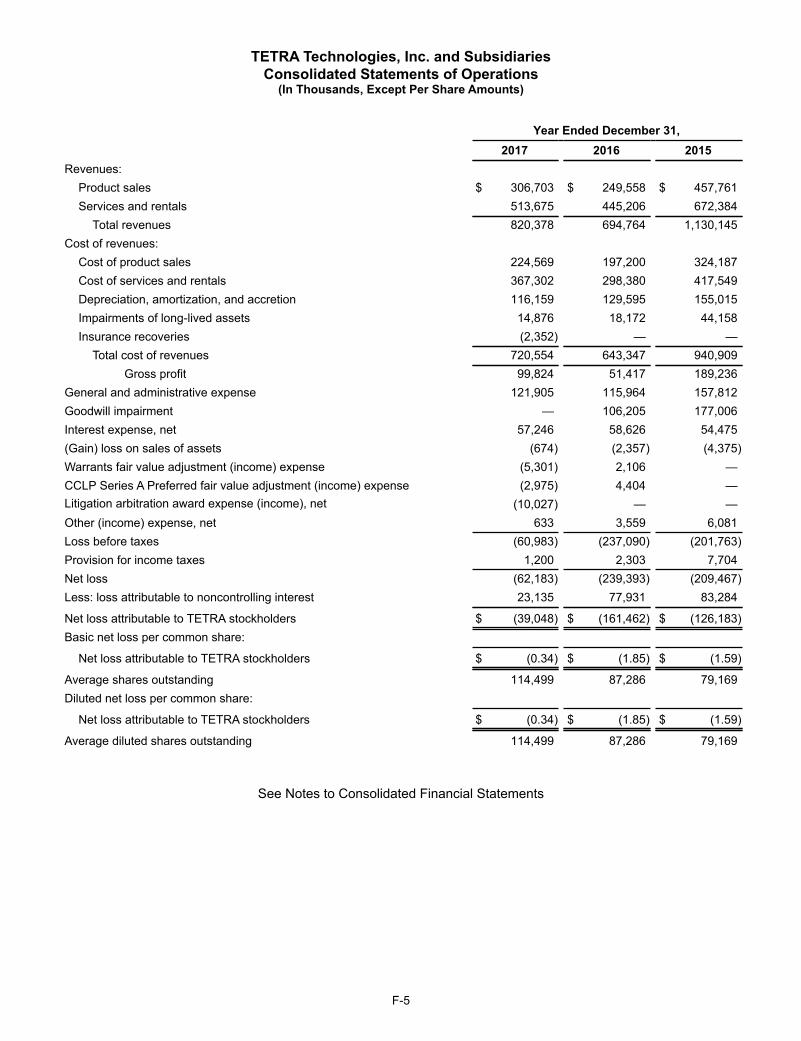
F-5
TETRA Technologies, Inc. and SubsidiariesConsolidated Statements of Operations
(In Thousands, Except Per Share Amounts)
Year Ended December 31, 2017 2016 2015Revenues:
Product sales $ 306,703 $ 249,558 $ 457,761Services and rentals 513,675 445,206 672,384
Total revenues 820,378 694,764 1,130,145Cost of revenues:
Cost of product sales 224,569 197,200 324,187Cost of services and rentals 367,302 298,380 417,549Depreciation, amortization, and accretion 116,159 129,595 155,015Impairments of long-lived assets 14,876 18,172 44,158Insurance recoveries (2,352) — —
Total cost of revenues 720,554 643,347 940,909Gross profit 99,824 51,417 189,236
General and administrative expense 121,905 115,964 157,812Goodwill impairment — 106,205 177,006Interest expense, net 57,246 58,626 54,475(Gain) loss on sales of assets (674) (2,357) (4,375)Warrants fair value adjustment (income) expense (5,301) 2,106 —CCLP Series A Preferred fair value adjustment (income) expense (2,975) 4,404 —Litigation arbitration award expense (income), net (10,027) — —Other (income) expense, net 633 3,559 6,081Loss before taxes (60,983) (237,090) (201,763)Provision for income taxes 1,200 2,303 7,704Net loss (62,183) (239,393) (209,467)Less: loss attributable to noncontrolling interest 23,135 77,931 83,284
Net loss attributable to TETRA stockholders $ (39,048) $ (161,462) $ (126,183)Basic net loss per common share:
Net loss attributable to TETRA stockholders $ (0.34) $ (1.85) $ (1.59)
Average shares outstanding 114,499 87,286 79,169Diluted net loss per common share:
Net loss attributable to TETRA stockholders $ (0.34) $ (1.85) $ (1.59)
Average diluted shares outstanding 114,499 87,286 79,169
See Notes to Consolidated Financial Statements
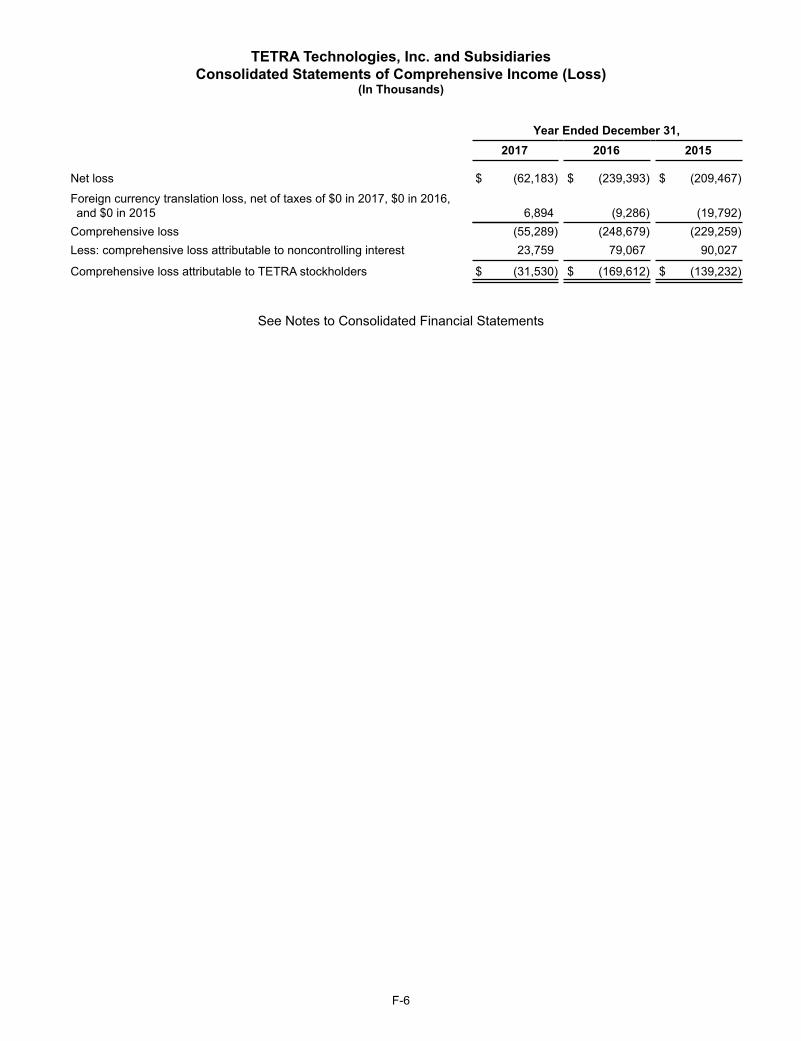
F-6
TETRA Technologies, Inc. and SubsidiariesConsolidated Statements of Comprehensive Income (Loss)
(In Thousands)
Year Ended December 31, 2017 2016 2015
Net loss $ (62,183) $ (239,393) $ (209,467)
Foreign currency translation loss, net of taxes of $0 in 2017, $0 in 2016,and $0 in 2015 6,894 (9,286) (19,792)
Comprehensive loss (55,289) (248,679) (229,259)Less: comprehensive loss attributable to noncontrolling interest 23,759 79,067 90,027
Comprehensive loss attributable to TETRA stockholders $ (31,530) $ (169,612) $ (139,232)
See Notes to Consolidated Financial Statements
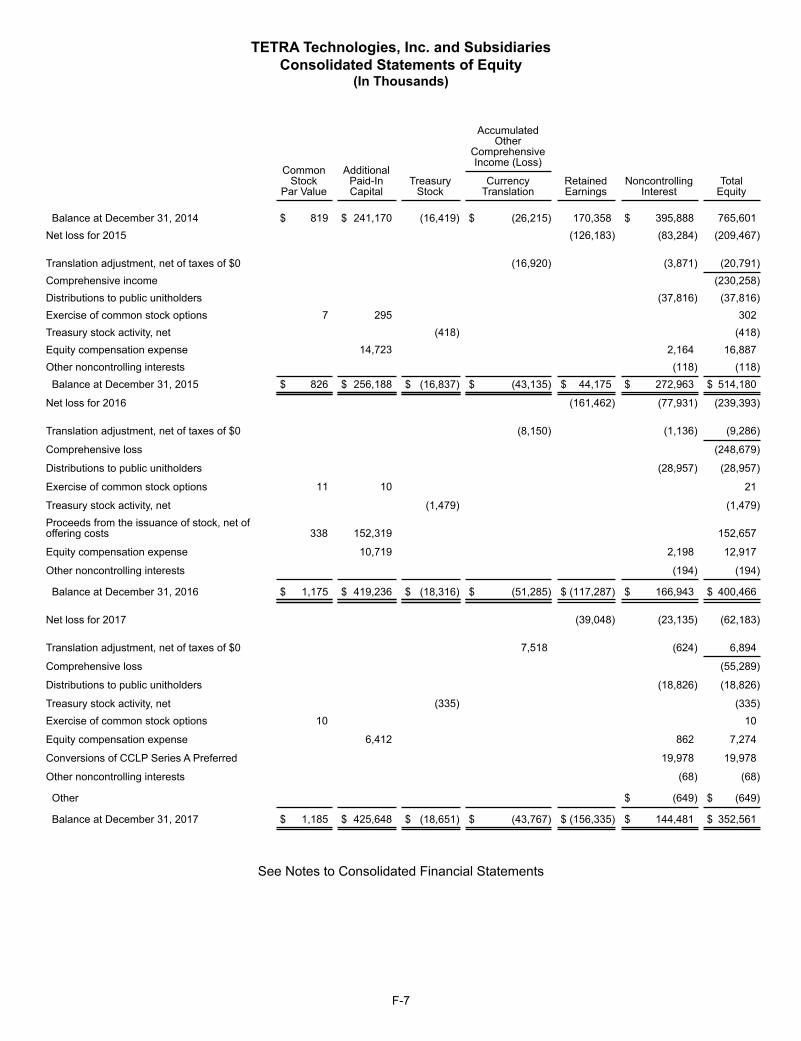
F-7
TETRA Technologies, Inc. and SubsidiariesConsolidated Statements of Equity
(In Thousands)
Common Stock
Par Value
Additional Paid-InCapital
TreasuryStock
Accumulated Other
Comprehensive Income (Loss)
RetainedEarnings
NoncontrollingInterest
TotalEquity
CurrencyTranslation
Balance at December 31, 2014 $ 819 $ 241,170 (16,419) $ (26,215) 170,358 $ 395,888 765,601Net loss for 2015 (126,183) (83,284) (209,467)
Translation adjustment, net of taxes of $0 (16,920) (3,871) (20,791)Comprehensive income (230,258)Distributions to public unitholders (37,816) (37,816)Exercise of common stock options 7 295 302Treasury stock activity, net (418) (418)Equity compensation expense 14,723 2,164 16,887Other noncontrolling interests (118) (118)
Balance at December 31, 2015 $ 826 $ 256,188 $ (16,837) $ (43,135) $ 44,175 $ 272,963 $ 514,180
Net loss for 2016 (161,462) (77,931) (239,393)
Translation adjustment, net of taxes of $0 (8,150) (1,136) (9,286)
Comprehensive loss (248,679)
Distributions to public unitholders (28,957) (28,957)
Exercise of common stock options 11 10 21
Treasury stock activity, net (1,479) (1,479)Proceeds from the issuance of stock, net of offering costs 338 152,319 152,657
Equity compensation expense 10,719 2,198 12,917
Other noncontrolling interests (194) (194)
Balance at December 31, 2016 $ 1,175 $ 419,236 $ (18,316) $ (51,285) $ (117,287) $ 166,943 $ 400,466
Net loss for 2017 (39,048) (23,135) (62,183)
Translation adjustment, net of taxes of $0 7,518 (624) 6,894
Comprehensive loss (55,289)
Distributions to public unitholders (18,826) (18,826)
Treasury stock activity, net (335) (335)Exercise of common stock options 10 10
Equity compensation expense 6,412 862 7,274
Conversions of CCLP Series A Preferred 19,978 19,978
Other noncontrolling interests (68) (68)
Other $ (649) $ (649)
Balance at December 31, 2017 $ 1,185 $ 425,648 $ (18,651) $ (43,767) $ (156,335) $ 144,481 $ 352,561
See Notes to Consolidated Financial Statements
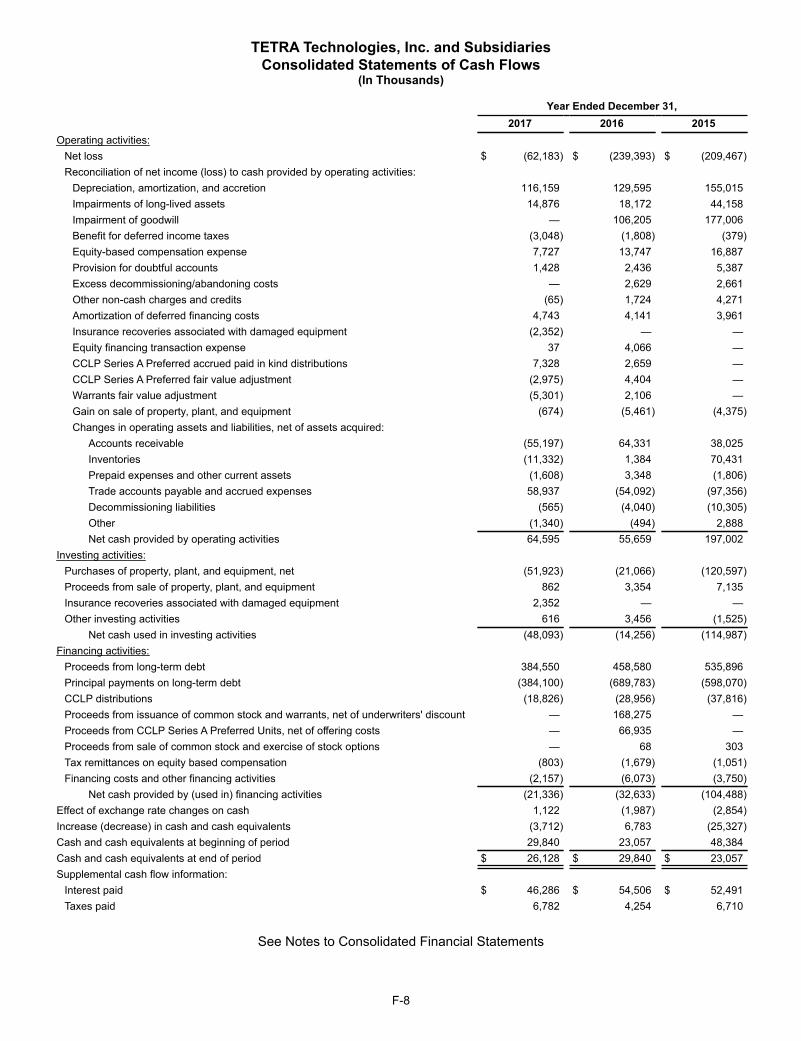
F-8
TETRA Technologies, Inc. and SubsidiariesConsolidated Statements of Cash Flows
(In Thousands)
Year Ended December 31, 2017 2016 2015Operating activities:
Net loss $ (62,183) $ (239,393) $ (209,467)Reconciliation of net income (loss) to cash provided by operating activities:
Depreciation, amortization, and accretion 116,159 129,595 155,015Impairments of long-lived assets 14,876 18,172 44,158Impairment of goodwill — 106,205 177,006Benefit for deferred income taxes (3,048) (1,808) (379)Equity-based compensation expense 7,727 13,747 16,887Provision for doubtful accounts 1,428 2,436 5,387Excess decommissioning/abandoning costs — 2,629 2,661Other non-cash charges and credits (65) 1,724 4,271Amortization of deferred financing costs 4,743 4,141 3,961Insurance recoveries associated with damaged equipment (2,352) — —Equity financing transaction expense 37 4,066 —CCLP Series A Preferred accrued paid in kind distributions 7,328 2,659 —CCLP Series A Preferred fair value adjustment (2,975) 4,404 —Warrants fair value adjustment (5,301) 2,106 —Gain on sale of property, plant, and equipment (674) (5,461) (4,375)Changes in operating assets and liabilities, net of assets acquired:
Accounts receivable (55,197) 64,331 38,025Inventories (11,332) 1,384 70,431Prepaid expenses and other current assets (1,608) 3,348 (1,806)Trade accounts payable and accrued expenses 58,937 (54,092) (97,356)Decommissioning liabilities (565) (4,040) (10,305)Other (1,340) (494) 2,888Net cash provided by operating activities 64,595 55,659 197,002
Investing activities: Purchases of property, plant, and equipment, net (51,923) (21,066) (120,597)Proceeds from sale of property, plant, and equipment 862 3,354 7,135Insurance recoveries associated with damaged equipment 2,352 — —Other investing activities 616 3,456 (1,525)
Net cash used in investing activities (48,093) (14,256) (114,987)Financing activities:
Proceeds from long-term debt 384,550 458,580 535,896Principal payments on long-term debt (384,100) (689,783) (598,070)CCLP distributions (18,826) (28,956) (37,816)Proceeds from issuance of common stock and warrants, net of underwriters' discount — 168,275 —Proceeds from CCLP Series A Preferred Units, net of offering costs — 66,935 —Proceeds from sale of common stock and exercise of stock options — 68 303Tax remittances on equity based compensation (803) (1,679) (1,051)Financing costs and other financing activities (2,157) (6,073) (3,750)
Net cash provided by (used in) financing activities (21,336) (32,633) (104,488)Effect of exchange rate changes on cash 1,122 (1,987) (2,854)Increase (decrease) in cash and cash equivalents (3,712) 6,783 (25,327)Cash and cash equivalents at beginning of period 29,840 23,057 48,384Cash and cash equivalents at end of period $ 26,128 $ 29,840 $ 23,057Supplemental cash flow information:
Interest paid $ 46,286 $ 54,506 $ 52,491Taxes paid 6,782 4,254 6,710
See Notes to Consolidated Financial Statements
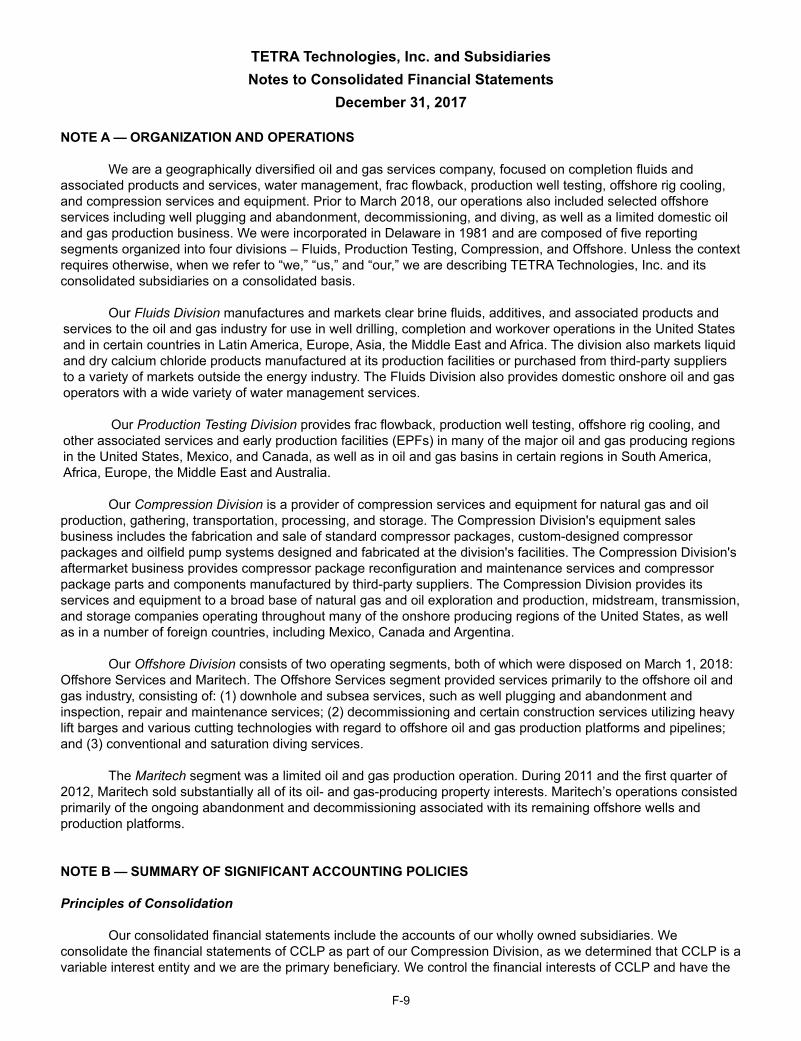
F-9
TETRA Technologies, Inc. and SubsidiariesNotes to Consolidated Financial Statements
December 31, 2017
NOTE A — ORGANIZATION AND OPERATIONS We are a geographically diversified oil and gas services company, focused on completion fluids and
associated products and services, water management, frac flowback, production well testing, offshore rig cooling, and compression services and equipment. Prior to March 2018, our operations also included selected offshore services including well plugging and abandonment, decommissioning, and diving, as well as a limited domestic oil and gas production business. We were incorporated in Delaware in 1981 and are composed of five reporting segments organized into four divisions – Fluids, Production Testing, Compression, and Offshore. Unless the context requires otherwise, when we refer to “we,” “us,” and “our,” we are describing TETRA Technologies, Inc. and its consolidated subsidiaries on a consolidated basis.
Our Fluids Division manufactures and markets clear brine fluids, additives, and associated products and services to the oil and gas industry for use in well drilling, completion and workover operations in the United States and in certain countries in Latin America, Europe, Asia, the Middle East and Africa. The division also markets liquid and dry calcium chloride products manufactured at its production facilities or purchased from third-party suppliers to a variety of markets outside the energy industry. The Fluids Division also provides domestic onshore oil and gas operators with a wide variety of water management services.
Our Production Testing Division provides frac flowback, production well testing, offshore rig cooling, and other associated services and early production facilities (EPFs) in many of the major oil and gas producing regions in the United States, Mexico, and Canada, as well as in oil and gas basins in certain regions in South America, Africa, Europe, the Middle East and Australia.
Our Compression Division is a provider of compression services and equipment for natural gas and oil production, gathering, transportation, processing, and storage. The Compression Division's equipment sales business includes the fabrication and sale of standard compressor packages, custom-designed compressor packages and oilfield pump systems designed and fabricated at the division's facilities. The Compression Division's aftermarket business provides compressor package reconfiguration and maintenance services and compressor package parts and components manufactured by third-party suppliers. The Compression Division provides its services and equipment to a broad base of natural gas and oil exploration and production, midstream, transmission, and storage companies operating throughout many of the onshore producing regions of the United States, as well as in a number of foreign countries, including Mexico, Canada and Argentina.
Our Offshore Division consists of two operating segments, both of which were disposed on March 1, 2018: Offshore Services and Maritech. The Offshore Services segment provided services primarily to the offshore oil and gas industry, consisting of: (1) downhole and subsea services, such as well plugging and abandonment and inspection, repair and maintenance services; (2) decommissioning and certain construction services utilizing heavy lift barges and various cutting technologies with regard to offshore oil and gas production platforms and pipelines; and (3) conventional and saturation diving services.
The Maritech segment was a limited oil and gas production operation. During 2011 and the first quarter of 2012, Maritech sold substantially all of its oil- and gas-producing property interests. Maritech’s operations consisted primarily of the ongoing abandonment and decommissioning associated with its remaining offshore wells and production platforms.
NOTE B — SUMMARY OF SIGNIFICANT ACCOUNTING POLICIES Principles of Consolidation
Our consolidated financial statements include the accounts of our wholly owned subsidiaries. We
consolidate the financial statements of CCLP as part of our Compression Division, as we determined that CCLP is a variable interest entity and we are the primary beneficiary. We control the financial interests of CCLP and have the
F-10
ability to direct the activities of CCLP that most significantly impact its economic performance through our ownership of its general partner. The share of CCLP net assets and earnings that is not owned by us is presented as noncontrolling interest in our consolidated financial statements. Our cash flows from our investment in CCLP are limited to the quarterly distributions we receive on our CCLP common units and general partner interest (including incentive distribution rights) and the amounts collected for services we perform on behalf of CCLP, as TETRA's capital structure and CCLP's capital structure are separate, and do not include cross default provisions, cross collateralization provisions, or cross guarantees. As of December 31, 2017, our consolidated balance sheet includes $95.0 million of restricted net assets, consisting of the consolidated net assets of CCLP. As our proportionate share of CCLP's net assets exceeds 25.0% of our consolidated net assets, we have provided condensed parent company financial information in a supplemental schedule accompanying these consolidated financial statements. Our interests in oil and gas properties are proportionately consolidated. All intercompany accounts and transactions have been eliminated in consolidation.
Use of Estimates The preparation of financial statements in conformity with U.S. generally accepted accounting principles
("GAAP") requires management to make estimates and assumptions that affect the reported amounts of assets and liabilities and disclose contingent assets and liabilities at the date of the financial statements and the reported amounts of revenues, expenses, and impairments during the reporting period. Actual results could differ from those estimates, and such differences could be material.
Basis of Presentation
During the fourth quarter of 2016, we adopted the provisions of Accounting Standards Update ("ASU") 2014-15, "Presentation of Financial Statements - Going Concern" ("ASU 2014-15") which requires management to evaluate an entity's ability to continue as a going concern within one year after the date that the financial statements are issued. Disclosures in the notes to the financial statements are required if we conclude that substantial doubt exists or that our plans alleviate substantial doubt that was raised. Pursuant to the provisions of ASU 2014-15, we have determined that, based on our financial forecasts, there are no conditions or events, considered in the aggregate, that raise substantial doubt about our ability to continue as a going concern through one year from the date of issuance of the financial statements. These forecasts are based on certain operating and other business assumptions that we believe to be reasonable as of March 2, 2018.
Pursuant to the provisions of ASU 2014-15, CCLP has determined, based on its financial forecasts, that there are no conditions or events, considered in the aggregate, that raise substantial doubt about CCLP's ability to continue as a going concern through one year from the date of issuance of the financial statements. These forecasts are based on certain operating and other business assumptions that CCLP believes to be reasonable as of March 2, 2018.
Reclassifications and Adjustments
Certain previously reported financial information has been reclassified to conform to the current year's presentation. The impact of such reclassifications was not significant to the prior year's overall presentation.
Cash Equivalents
We consider all highly liquid cash investments with a maturity of three months or less when purchased to
be cash equivalents.
Restricted Cash Restricted cash is classified as a current asset when it is expected to be repaid or settled in the next twelve
month period. Restricted cash reported on our balance sheet as of December 31, 2016, consisted primarily of escrowed cash associated with our July 2011 purchase of a heavy lift derrick barge, which was released to the sellers during the third quarter of 2017 and therefore no longer reflected on our balance sheet as of December 31, 2017.
F-11
Financial Instruments Financial instruments that subject us to concentrations of credit risk consist principally of trade receivables
with companies in the energy industry. Our policy is to evaluate, prior to providing goods or services, each customer's financial condition and to determine the amount of open credit to be extended. We generally require appropriate, additional collateral as security for credit amounts in excess of approved limits. Our customers consist primarily of major, well-established oil and gas producers and independent oil and gas companies. Payment terms are on a short-term basis. The risk of loss from the inability to collect trade receivables, including certain long-term contractual receivables of our Maritech segment, is heightened during prolonged periods of low oil and natural gas commodity prices.
We have currency exchange rate risk exposure related to transactions denominated in a foreign currency
as well as to investments in certain of our international operations. Our risk management activities include the use of foreign currency forward purchase and sale derivative contracts as part of a program designed to mitigate the currency exchange rate risk exposure on selected international operations.
As a result of the outstanding balances under our and CCLP's variable rate revolving credit facilities, we face market risk exposure related to changes in applicable interest rates. Although we have no interest rate swap contracts outstanding to hedge this potential risk exposure, we and CCLP each have fixed interest rate notes, which are each scheduled to mature in 2022 and which mitigate this risk on our consolidated total outstanding borrowings.
Allowances for Doubtful Accounts
Allowances for doubtful accounts are determined generally and on a specific identification basis when we
believe that the collection of specific amounts owed to us is not probable. The changes in allowances for doubtful accounts for the three year period ended December 31, 2017, are as follows:
Year Ended December 31, 2017 2016 2015 (In Thousands)
At beginning of period $ 6,291 $ 7,847 $ 2,485Activity in the period: Provision for doubtful accounts 1,428 2,436 5,387Account (chargeoffs) recoveries (5,965) (3,992) (25)
At end of period $ 1,754 $ 6,291 $ 7,847
Inventories
Inventories are stated at the lower of cost or market value. Except for work in progress inventory discussed below, cost is determined using the weighted average method. Components of inventories are as follows:
December 31, 2017 2016 (In Thousands)
Finished goods $ 66,377 $ 62,064Raw materials 4,027 2,429Parts and supplies 38,248 35,548Work in progress 11,402 6,505
Total inventories $ 120,054 $ 106,546
Finished goods inventories include newly manufactured clear brine fluids as well as used brines that are
repurchased from certain customers for recycling. Recycled brines are recorded at cost, using the weighted average method. Work in progress inventory consists primarily of new compressor packages located in the CCLP fabrication facility in Midland, Texas. The cost of work in progress is determined using the specific identification method. We write down the value of inventory by an amount equal to the difference between its cost and its estimated market value.
F-12
Property, Plant, and Equipment Property, plant, and equipment are stated at cost. Expenditures that increase the useful lives of assets are
capitalized. The cost of repairs and maintenance is charged to operations as incurred. For financial reporting purposes, we provide for depreciation using the straight-line method over the estimated useful lives of assets, which are generally as follows:
Buildings 15 – 40 yearsBarges and vessels 5 – 30 yearsMachinery and equipment 2 – 20 yearsAutomobiles and trucks 3 – 4 yearsChemical plants 15 – 30 yearsCompressors 12 – 20 years
Leasehold improvements are depreciated over the shorter of the remaining term of the associated lease or
its useful life. Depreciation expense, excluding long-lived asset impairments for the years ended December 31, 2017, 2016, and 2015 was $107.9 million, $120.3 million, and $138.2 million, respectively.
Construction in progress as of December 31, 2017 consists primarily of equipment fabrication projects. Construction in progress as of December 31, 2016 consists primarily of capitalized system software development costs incurred which was placed in operation during 2017. Interest capitalized for the years ended December 31, 2017, 2016, and 2015 was $1.6 million, $0.5 million, and $0.4 million, respectively. Intangible Assets other than Goodwill
Patents, trademarks, and other intangible assets are recorded on the basis of cost and are amortized on a
straight-line basis over their estimated useful lives, ranging from 2 to 20 years. Amortization expense of patents, trademarks, and other intangible assets was $6.2 million, $7.0 million, and $14.8 million for the years ended December 31, 2017, 2016, and 2015, respectively, and is included in depreciation, amortization and accretion. The estimated future annual amortization expense of patents, trademarks, and other intangible assets is $4.7 million for 2018, $4.7 million for 2019, $4.7 million for 2020, $4.4 million for 2021, and $3.9 million for 2022.
Intangible assets are tested for recoverability whenever events or changes in circumstances indicate that the carrying value of the asset may not be recoverable. In such an event, we will determine the fair value of the asset using an undiscounted cash flow analysis of the asset at the lowest level for which identifiable cash flows exist. If an impairment has occurred, we will recognize a loss for the difference between the carrying value and the estimated fair value of the intangible asset. During 2017, 2016, and 2015, certain intangible assets were impaired. See "Impairments of Long-Lived Assets" section below.
Goodwill
Goodwill represents the excess of cost over the fair value of the net assets of businesses acquired in
purchase transactions. We perform a goodwill impairment test on an annual basis or whenever indicators of impairment are present. We perform the annual test of goodwill impairment following the fourth quarter of each year. The assessment for goodwill impairment begins with a qualitative assessment of whether it is “more likely than not” that the fair value of each reporting unit is less than its carrying value. This qualitative assessment requires the evaluation, based on the weight of evidence, of the significance of all identified events and circumstances for each reporting unit. Based on this qualitative assessment, we determined that due to the reduced volatility of oil and natural gas commodity prices during 2017 and the improving demand for the products and services for our Fluids Division businesses, it was not “more likely than not” that the fair value of our Fluids reporting unit was less than its carrying value as of December 31, 2017.
When the qualitative analysis indicates that it is “more likely than not” that a reporting unit’s fair value is less than its carrying value, the resulting goodwill impairment test consists of a two-step accounting test performed on a reporting unit basis. The first step of the impairment test is to compare the estimated fair value with the recorded net book value (including goodwill) of our reporting units. If the estimated fair value is higher than the recorded net book value, no impairment is deemed to exist and no further testing is required. If, however, the carrying amount of the
F-13
reporting unit exceeds its estimated fair value, an impairment loss is calculated by comparing the carrying amount of the reporting unit’s goodwill to our estimated implied fair value of that goodwill. Our estimates of reporting unit fair value, when required, are based on a combination of an income and market approach. These estimates are imprecise and are subject to our estimates of the future cash flows of each business and our judgment as to how these estimated cash flows translate into each business’ estimated fair value. These estimates and judgments are affected by numerous factors, including the general economic environment at the time of our assessment, which affects our overall market capitalization.
Because quoted market prices for our reporting units other than Compression are not available, our management must apply judgment in determining the estimated fair value of these reporting units for purposes of performing the goodwill impairment test. Management uses all available information to make these fair value determinations, including the present value of expected future cash flows using discount rates commensurate with the risks involved in the assets. The resultant fair values calculated for the reporting units are then compared to observable metrics for other companies in our industry or to mergers and acquisitions in our industry to determine whether those valuations, in our judgment, appear reasonable.
The accounting principles regarding goodwill acknowledge that the observed market prices of individual trades of a company’s stock (and thus its computed market capitalization) may not be representative of the fair value of the company as a whole. Substantial value may arise from the ability to take advantage of synergies and other benefits that flow from control over another entity. Consequently, measuring the fair value of a collection of assets and liabilities that operate together in a controlled entity is different from measuring the fair value of a single share of that entity’s common stock. Therefore, once the fair value of the reporting units was determined, we also added a control premium to the calculations. This control premium is judgmental and is based on observed mergers and acquisitions in our industry.
As part of our internal annual business outlook for each of our reporting units that we performed during 2015 and 2016, we considered changes in the global economic environment that affected our stock price and market capitalization. As a result of these factors, we determined that it was “more likely than not” that the fair values of certain of our reporting units were less than their respective carrying values as of December 31, 2015 and 2016. As of December 31, 2015, as a result of decreased demand for our products and services due to decreased oil and natural gas commodity prices, and due to decrease in the price of our common stock and the price per common unit of CCLP, we determined that it was "more likely than not" that the fair values of our Compression and Production Testing reporting units were less than their respective carrying values as of December 31, 2015. With regard to the 2016 impairments, due to the decrease in the price of our common stock and the price per common unit of CCLP during the first three months of 2016, our and CCLP's market capitalizations as of March 31, 2016, were below their respective recorded net book values, including remaining goodwill. In addition, the continuing low oil and natural gas commodity price environment resulted in a further negative impact on demand for the products and services for each of our reporting units. As a result of these factors, we determined that it was “more likely than not” that the fair values of our Compression and Production Testing reporting units were less than their respective carrying values as of March 31, 2016. As a result of the goodwill impairment process, we recorded impairments of goodwill of $177.0 million and $106.2 million as of December 31, 2015 and March 31, 2016, respectively. Following these goodwill impairments, as of December 31, 2017, our consolidated goodwill consists of the $6.6 million of goodwill attributed to our Fluids reporting unit.
As of December 31, 2017, the carrying amount of goodwill for the Fluids, Production Testing, Compression, and Offshore Services reporting units are net of $23.8 million, $111.8 million, $231.8 million and $27.2 million, respectively, of accumulated impairment losses. The changes in the carrying amount of goodwill by reporting unit for the three year period ended December 31, 2017, are as follows:

F-14
Fluids
ProductionTesting Compression
OffshoreServices Maritech Total
(In Thousands)
Balance as of December 31, 2014 $ 6,636 $ 53,682 $ 233,548 $ — $ — $ 293,866Goodwill adjustments — (39,775) (141,146) — — (180,921)Balance as of December 31, 2015 6,636 13,907 92,402 — — 112,945Goodwill adjustments — (13,907) (92,402) — — (106,309)Balance as of December 31, 2016 6,636 — — — — 6,636
Goodwill adjustments — — — — $ — —
Balance as of December 31, 2017 $ 6,636 $ — $ — $ — $ — $ 6,636
Impairments of Long-Lived Assets
Impairments of long-lived assets, including identified intangible assets, are determined periodically when
indicators of impairment are present. If such indicators are present, the determination of the amount of impairment is based on our judgments as to the future undiscounted operating cash flows to be generated from these assets throughout their remaining estimated useful lives. If these undiscounted cash flows are less than the carrying amount of the related asset, an impairment is recognized for the excess of the carrying value over its fair value. Assets held for disposal are recorded at the lower of carrying value or estimated fair value less estimated selling costs.
During the fourth quarter of 2017, consolidated long-lived asset impairments of approximately $14.9 million were recorded primarily due to the impairment of a certain identified intangible asset resulting from decreased expected future operating cash flows from a Production Testing segment customer.
During the first quarter of 2016, our Compression and Production Testing segments recorded impairments of approximately $7.9 million and $2.8 million, respectively, due to expected decreased demand due to current market conditions. During the fourth quarter of 2016, our Compression, Offshore, Fluids, and Production Testing segments recorded certain consolidated long-lived asset impairments of approximately $2.4 million, $1.1 million, $0.5 million, and $3.6 million, respectively, due to expected decreased demand due to current market conditions.
During the fourth quarter of 2015, our Compression and Production Testing segments recorded impairments of approximately $6.3 million and $12.3 million, respectively, associated with a portion of the carrying value of certain of long-lived assets due to expected decreased demand, and our Compression segment recorded approximately $5.7 million of impairments associated with certain identified intangible assets. Our Fluids Division also recorded impairments of approximately $19.9 million associated with certain of its water management business assets. Decommissioning Liabilities
Related to Maritech’s remaining oil and gas property decommissioning liabilities, we estimate the third-party
fair values (including an estimated profit) to plug and abandon wells, decommission the pipelines and platforms, and clear the sites, and we use these estimates to record Maritech’s decommissioning liabilities, net of amounts allocable to joint interest owners. In March 2018, we closed the Maritech Asset Purchase Agreement with Orinoco that provided for the purchase by Orinoco of the Maritech Properties. Also in March 2018, we finalized the Maritech Equity Purchase Agreement with Orinoco, that provided for the purchase by Orinoco of the Maritech Equity Interests. As a result of these transactions, Orinoco assumed all of Maritech's remaining abandonment and decommissioning obligations,
In estimating the decommissioning liabilities, we performed detailed estimating procedures, analysis, and
engineering studies. Whenever practical and cost effective, Maritech utilized the services of its affiliated companies to perform well abandonment and decommissioning work. When these services were performed by an affiliated company, all recorded intercompany revenues were eliminated in the consolidated financial statements. The recorded decommissioning liability associated with a specific property is fully extinguished when the property is completely abandoned. The recorded liability is first reduced by all cash expenses incurred to abandon and decommission the property. If the recorded liability exceeds (or is less than) our actual out-of-pocket costs, the difference is credited (or charged) to earnings in the period in which the work is performed. We review the adequacy
F-15
of our decommissioning liabilities whenever indicators suggest that the estimated cash flows underlying the liabilities have changed materially. The amount of work performed or estimated to be performed on a Maritech property asset retirement obligation may often exceed amounts previously estimated for numerous reasons. Property conditions encountered, including subsea, geological, or downhole conditions, may be different from those anticipated at the time of estimation due to the age of the property and the quality of information available about the particular property conditions. Additionally, the cost of performing work at locations damaged by hurricanes is particularly difficult to estimate due to the unique conditions encountered, including the uncertainty regarding the extent of physical damage to many of the structures. Lastly, previously plugged and abandoned wells have later exhibited a buildup of pressure, which is evidenced by gas bubbles coming from the plugged well head. Remediation work at previously abandoned well sites is particularly costly due to the lack of a platform from which to base these activities. Decommissioning work performed for the years 2017, 2016, and 2015 was $0.6 million, $4.0 million, and $10.3 million, respectively. For a further discussion of adjustments and other activity related to Maritech’s decommissioning liabilities, see Note I – Decommissioning and Other Asset Retirement Obligations. Environmental Liabilities
Environmental expenditures that result in additions to property and equipment are capitalized, while other
environmental expenditures are expensed. Environmental remediation liabilities are recorded on an undiscounted basis when environmental assessments or cleanups are probable and the costs can be reasonably estimated. Estimates of future environmental remediation expenditures often consist of a range of possible expenditure amounts, a portion of which may be in excess of amounts of liabilities recorded. In such an instance, we disclose the full range of amounts reasonably possible of being incurred. Any changes or developments in environmental remediation efforts are accounted for and disclosed each quarter as they occur. Any recoveries of environmental remediation costs from other parties are recorded as assets when their receipt is deemed probable.
Complexities involving environmental remediation efforts can cause estimates of the associated liability to
be imprecise. Factors that cause uncertainties regarding the estimation of future expenditures include, but are not limited to, the effectiveness of the anticipated work plans in achieving targeted results and changes in the desired remediation methods and outcomes as prescribed by regulatory agencies. Uncertainties associated with environmental remediation contingencies are pervasive and often result in wide ranges of reasonably possible outcomes. Estimates developed in the early stages of remediation can vary significantly. Normally, a finite estimate of cost does not become fixed and determinable at a specific point in time. Rather, the costs associated with environmental remediation become estimable as the work is performed and the range of ultimate cost becomes more defined. It is possible that cash flows and results of operations could be materially affected by the impact of the ultimate resolution of these contingencies.
Revenue Recognition
We recognize revenue using the following criteria: (a) persuasive evidence of an exchange arrangement
exists; (b) delivery has occurred or services have been rendered; (c) the buyer’s price is fixed or determinable; and (d) collectability is reasonably assured. Sales terms for our products are FOB shipping point, with title transferring at the point of shipment. Revenue is recognized at the point of transfer of title. Collections associated with progressive billings to customers for the construction of compression equipment by our Compression Division is included in unearned income in the consolidated balance sheets.
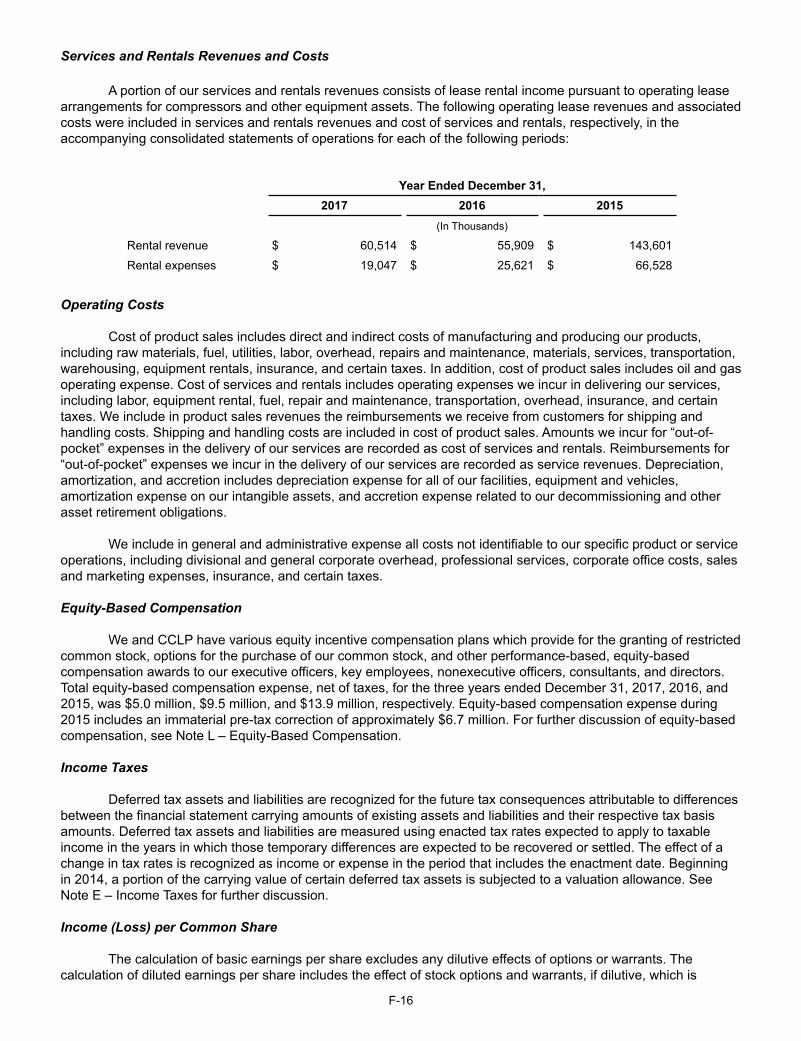
F-16
Services and Rentals Revenues and Costs
A portion of our services and rentals revenues consists of lease rental income pursuant to operating lease arrangements for compressors and other equipment assets. The following operating lease revenues and associated costs were included in services and rentals revenues and cost of services and rentals, respectively, in the accompanying consolidated statements of operations for each of the following periods:
Year Ended December 31,2017 2016 2015
(In Thousands)
Rental revenue $ 60,514 $ 55,909 $ 143,601
Rental expenses $ 19,047 $ 25,621 $ 66,528
Operating Costs Cost of product sales includes direct and indirect costs of manufacturing and producing our products,
including raw materials, fuel, utilities, labor, overhead, repairs and maintenance, materials, services, transportation, warehousing, equipment rentals, insurance, and certain taxes. In addition, cost of product sales includes oil and gas operating expense. Cost of services and rentals includes operating expenses we incur in delivering our services, including labor, equipment rental, fuel, repair and maintenance, transportation, overhead, insurance, and certain taxes. We include in product sales revenues the reimbursements we receive from customers for shipping and handling costs. Shipping and handling costs are included in cost of product sales. Amounts we incur for “out-of-pocket” expenses in the delivery of our services are recorded as cost of services and rentals. Reimbursements for “out-of-pocket” expenses we incur in the delivery of our services are recorded as service revenues. Depreciation, amortization, and accretion includes depreciation expense for all of our facilities, equipment and vehicles, amortization expense on our intangible assets, and accretion expense related to our decommissioning and other asset retirement obligations.
We include in general and administrative expense all costs not identifiable to our specific product or service
operations, including divisional and general corporate overhead, professional services, corporate office costs, sales and marketing expenses, insurance, and certain taxes.
Equity-Based Compensation
We and CCLP have various equity incentive compensation plans which provide for the granting of restricted common stock, options for the purchase of our common stock, and other performance-based, equity-based compensation awards to our executive officers, key employees, nonexecutive officers, consultants, and directors. Total equity-based compensation expense, net of taxes, for the three years ended December 31, 2017, 2016, and 2015, was $5.0 million, $9.5 million, and $13.9 million, respectively. Equity-based compensation expense during 2015 includes an immaterial pre-tax correction of approximately $6.7 million. For further discussion of equity-based compensation, see Note L – Equity-Based Compensation.
Income Taxes Deferred tax assets and liabilities are recognized for the future tax consequences attributable to differences
between the financial statement carrying amounts of existing assets and liabilities and their respective tax basis amounts. Deferred tax assets and liabilities are measured using enacted tax rates expected to apply to taxable income in the years in which those temporary differences are expected to be recovered or settled. The effect of a change in tax rates is recognized as income or expense in the period that includes the enactment date. Beginning in 2014, a portion of the carrying value of certain deferred tax assets is subjected to a valuation allowance. See Note E – Income Taxes for further discussion.
Income (Loss) per Common Share
The calculation of basic earnings per share excludes any dilutive effects of options or warrants. The
calculation of diluted earnings per share includes the effect of stock options and warrants, if dilutive, which is
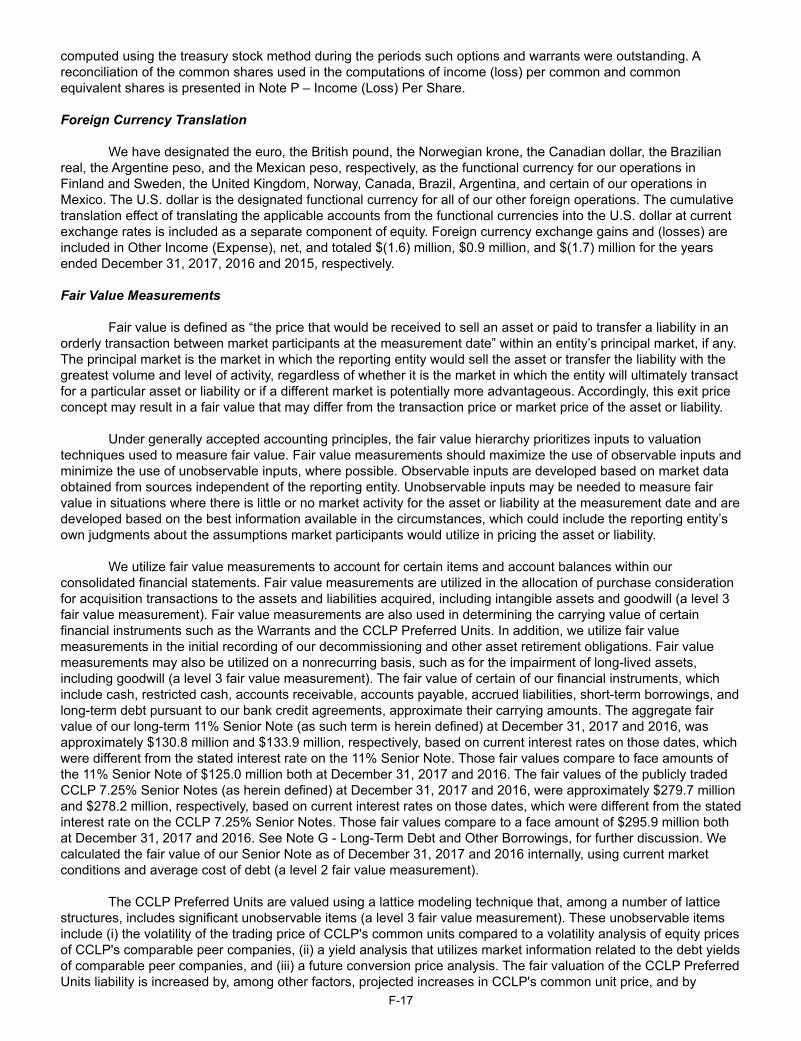
F-17
computed using the treasury stock method during the periods such options and warrants were outstanding. A reconciliation of the common shares used in the computations of income (loss) per common and common equivalent shares is presented in Note P – Income (Loss) Per Share.
Foreign Currency Translation
We have designated the euro, the British pound, the Norwegian krone, the Canadian dollar, the Brazilian
real, the Argentine peso, and the Mexican peso, respectively, as the functional currency for our operations in Finland and Sweden, the United Kingdom, Norway, Canada, Brazil, Argentina, and certain of our operations in Mexico. The U.S. dollar is the designated functional currency for all of our other foreign operations. The cumulative translation effect of translating the applicable accounts from the functional currencies into the U.S. dollar at current exchange rates is included as a separate component of equity. Foreign currency exchange gains and (losses) are included in Other Income (Expense), net, and totaled $(1.6) million, $0.9 million, and $(1.7) million for the years ended December 31, 2017, 2016 and 2015, respectively.
Fair Value Measurements
Fair value is defined as “the price that would be received to sell an asset or paid to transfer a liability in an
orderly transaction between market participants at the measurement date” within an entity’s principal market, if any. The principal market is the market in which the reporting entity would sell the asset or transfer the liability with the greatest volume and level of activity, regardless of whether it is the market in which the entity will ultimately transact for a particular asset or liability or if a different market is potentially more advantageous. Accordingly, this exit price concept may result in a fair value that may differ from the transaction price or market price of the asset or liability.
Under generally accepted accounting principles, the fair value hierarchy prioritizes inputs to valuation
techniques used to measure fair value. Fair value measurements should maximize the use of observable inputs and minimize the use of unobservable inputs, where possible. Observable inputs are developed based on market data obtained from sources independent of the reporting entity. Unobservable inputs may be needed to measure fair value in situations where there is little or no market activity for the asset or liability at the measurement date and are developed based on the best information available in the circumstances, which could include the reporting entity’s own judgments about the assumptions market participants would utilize in pricing the asset or liability.
We utilize fair value measurements to account for certain items and account balances within our consolidated financial statements. Fair value measurements are utilized in the allocation of purchase consideration for acquisition transactions to the assets and liabilities acquired, including intangible assets and goodwill (a level 3 fair value measurement). Fair value measurements are also used in determining the carrying value of certain financial instruments such as the Warrants and the CCLP Preferred Units. In addition, we utilize fair value measurements in the initial recording of our decommissioning and other asset retirement obligations. Fair value measurements may also be utilized on a nonrecurring basis, such as for the impairment of long-lived assets, including goodwill (a level 3 fair value measurement). The fair value of certain of our financial instruments, which include cash, restricted cash, accounts receivable, accounts payable, accrued liabilities, short-term borrowings, and long-term debt pursuant to our bank credit agreements, approximate their carrying amounts. The aggregate fair value of our long-term 11% Senior Note (as such term is herein defined) at December 31, 2017 and 2016, was approximately $130.8 million and $133.9 million, respectively, based on current interest rates on those dates, which were different from the stated interest rate on the 11% Senior Note. Those fair values compare to face amounts of the 11% Senior Note of $125.0 million both at December 31, 2017 and 2016. The fair values of the publicly traded CCLP 7.25% Senior Notes (as herein defined) at December 31, 2017 and 2016, were approximately $279.7 million and $278.2 million, respectively, based on current interest rates on those dates, which were different from the stated interest rate on the CCLP 7.25% Senior Notes. Those fair values compare to a face amount of $295.9 million both at December 31, 2017 and 2016. See Note G - Long-Term Debt and Other Borrowings, for further discussion. We calculated the fair value of our Senior Note as of December 31, 2017 and 2016 internally, using current market conditions and average cost of debt (a level 2 fair value measurement).
The CCLP Preferred Units are valued using a lattice modeling technique that, among a number of lattice structures, includes significant unobservable items (a level 3 fair value measurement). These unobservable items include (i) the volatility of the trading price of CCLP's common units compared to a volatility analysis of equity prices of CCLP's comparable peer companies, (ii) a yield analysis that utilizes market information related to the debt yields of comparable peer companies, and (iii) a future conversion price analysis. The fair valuation of the CCLP Preferred Units liability is increased by, among other factors, projected increases in CCLP's common unit price, and by
F-18
increases in the volatility and decreases in the debt yields of CCLP's comparable peer companies. Increases (or decreases) in the fair value of CCLP Preferred Units will increase (decrease) the associated liability and result in future adjustments to earnings for the associated valuation losses (gains).
The Warrants are valued either by using their traded market prices (a level 1 fair value measurement) or, for periods when market prices are not available, by using the Black Scholes option valuation model that includes estimates of the volatility of the Warrants implied by their trading prices (a level 3 fair value measurement). The fair valuation of the Warrants liability is increased by, among other factors, increases in our common stock price, and by increases in the volatility of our common stock price. Increases (or decreases) in the fair value of the Warrants will increase (decrease) the associated liability and result in future adjustments to earnings for the associated valuation losses (gains).
We also utilize fair value measurements on a recurring basis in the accounting for our foreign currency forward sale derivative contracts. For these fair value measurements, we utilize the quoted value as determined by our counterparty financial institution (a level 2 fair value measurement).
During the third quarter of 2017, we issued a stand-alone, cash-settled stock appreciation rights award to an executive officer. This award is valued by using the Black Scholes option valuation model and such fair value is recognized based on the portion of the requisite service period satisfied as of each valuation date. The fair valuation of the stock appreciation rights liability is increased by, among other factors, increases in our common stock price, and by increases in the volatility of our common stock price. This stock appreciation rights award is reflected as an accrued liability in our consolidated balance sheet. Increases (or decreases) in the fair value of the stock appreciation rights award will increase (decrease) the associated liability and result in future adjustments to earnings for the associated valuation losses (gains).
A summary of these recurring fair value measurements as of December 31, 2017, is as follows:
Fair Value Measurements Using
Total as of
Quoted Pricesin Active
Markets forIdenticalAssets
or Liabilities
SignificantOther
ObservableInputs
SignificantUnobservable
InputsDescription Dec 31, 2017 (Level 1) (Level 2) (Level 3)
(In Thousands)
CCLP Series A Preferred Units $ (61,436) $ — $ — $ (61,436)Warrants liability (13,202) — — (13,202)Cash-settled stock appreciationrights (97) — — (97)
Asset for foreign currencyderivative contracts 241 — 241 —
Liability for foreign currencyderivative contracts (378) — (378) —
Total $ (74,872)
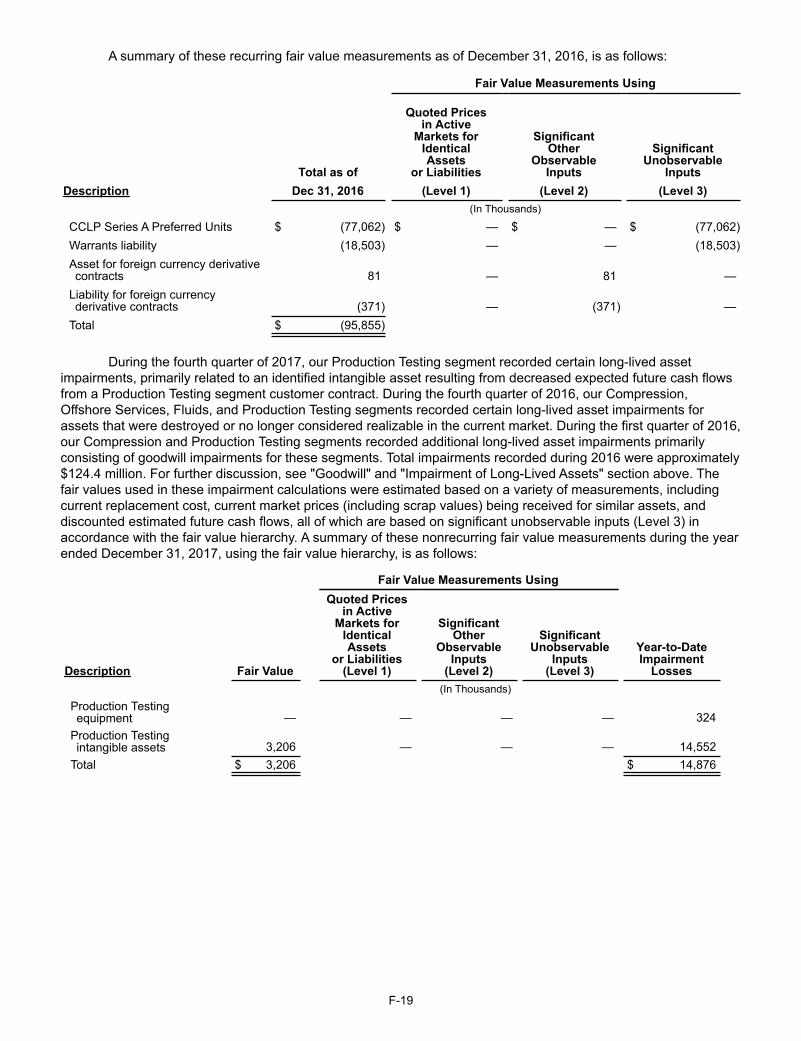
F-19
A summary of these recurring fair value measurements as of December 31, 2016, is as follows:
Fair Value Measurements Using
Total as of
Quoted Pricesin Active
Markets forIdenticalAssets
or Liabilities
SignificantOther
ObservableInputs
SignificantUnobservable
InputsDescription Dec 31, 2016 (Level 1) (Level 2) (Level 3)
(In Thousands)
CCLP Series A Preferred Units $ (77,062) $ — $ — $ (77,062)Warrants liability (18,503) — — (18,503)Asset for foreign currency derivativecontracts 81 — 81 —
Liability for foreign currencyderivative contracts (371) — (371) —
Total $ (95,855)
During the fourth quarter of 2017, our Production Testing segment recorded certain long-lived asset impairments, primarily related to an identified intangible asset resulting from decreased expected future cash flows from a Production Testing segment customer contract. During the fourth quarter of 2016, our Compression, Offshore Services, Fluids, and Production Testing segments recorded certain long-lived asset impairments for assets that were destroyed or no longer considered realizable in the current market. During the first quarter of 2016, our Compression and Production Testing segments recorded additional long-lived asset impairments primarily consisting of goodwill impairments for these segments. Total impairments recorded during 2016 were approximately $124.4 million. For further discussion, see "Goodwill" and "Impairment of Long-Lived Assets" section above. The fair values used in these impairment calculations were estimated based on a variety of measurements, including current replacement cost, current market prices (including scrap values) being received for similar assets, and discounted estimated future cash flows, all of which are based on significant unobservable inputs (Level 3) in accordance with the fair value hierarchy. A summary of these nonrecurring fair value measurements during the year ended December 31, 2017, using the fair value hierarchy, is as follows:
Fair Value Measurements Using Quoted Prices
in ActiveMarkets for
IdenticalAssets
or Liabilities(Level 1)
SignificantOther
ObservableInputs
(Level 2)
SignificantUnobservable
Inputs (Level 3)
Year-to-DateImpairment
LossesDescription Fair Value (In Thousands)Production Testingequipment — — — — 324
Production Testingintangible assets 3,206 — — — 14,552
Total $ 3,206 $ 14,876
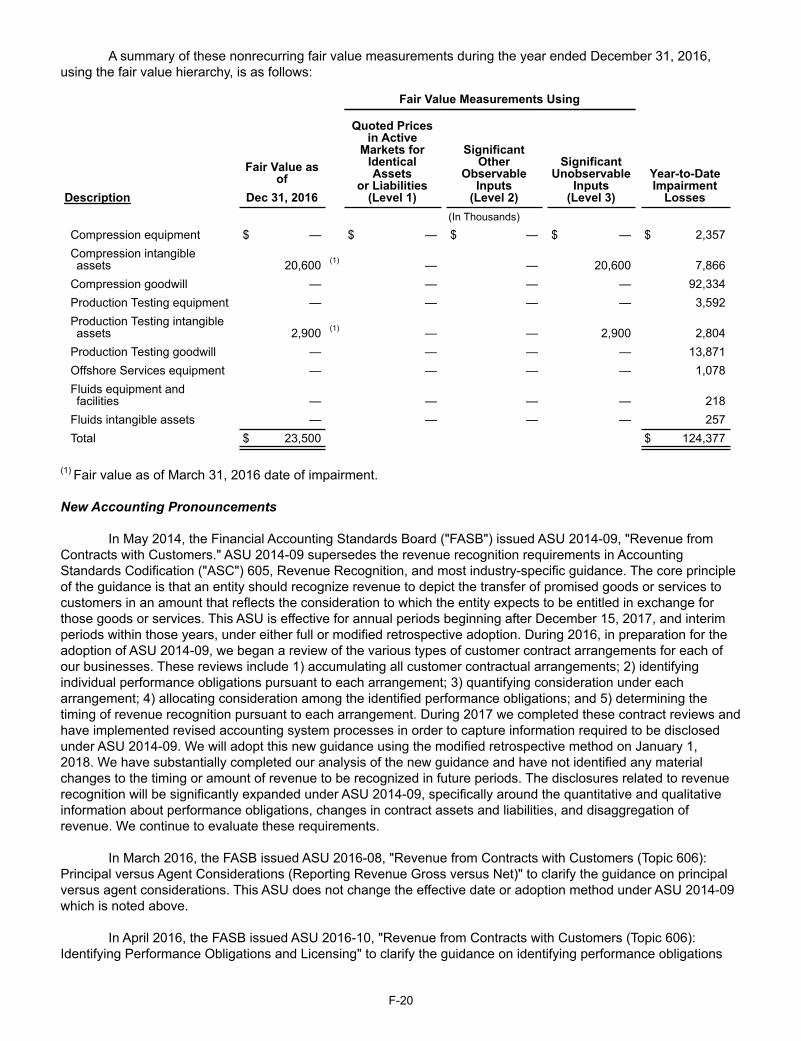
F-20
A summary of these nonrecurring fair value measurements during the year ended December 31, 2016, using the fair value hierarchy, is as follows:
Fair Value Measurements Using
Fair Value asof
Quoted Pricesin Active
Markets forIdenticalAssets
or Liabilities(Level 1)
SignificantOther
ObservableInputs
(Level 2)
SignificantUnobservable
Inputs (Level 3)
Year-to-DateImpairment
LossesDescription Dec 31, 2016 (In Thousands)
Compression equipment $ — $ — $ — $ — $ 2,357Compression intangibleassets 20,600 (1) — — 20,600 7,866
Compression goodwill — — — — 92,334Production Testing equipment — — — — 3,592Production Testing intangibleassets 2,900 (1) — — 2,900 2,804
Production Testing goodwill — — — — 13,871Offshore Services equipment — — — — 1,078Fluids equipment andfacilities — — — — 218
Fluids intangible assets — — — — 257Total $ 23,500 $ 124,377
(1) Fair value as of March 31, 2016 date of impairment.
New Accounting Pronouncements In May 2014, the Financial Accounting Standards Board ("FASB") issued ASU 2014-09, "Revenue from Contracts with Customers." ASU 2014-09 supersedes the revenue recognition requirements in Accounting Standards Codification ("ASC") 605, Revenue Recognition, and most industry-specific guidance. The core principle of the guidance is that an entity should recognize revenue to depict the transfer of promised goods or services to customers in an amount that reflects the consideration to which the entity expects to be entitled in exchange for those goods or services. This ASU is effective for annual periods beginning after December 15, 2017, and interim periods within those years, under either full or modified retrospective adoption. During 2016, in preparation for the adoption of ASU 2014-09, we began a review of the various types of customer contract arrangements for each of our businesses. These reviews include 1) accumulating all customer contractual arrangements; 2) identifying individual performance obligations pursuant to each arrangement; 3) quantifying consideration under each arrangement; 4) allocating consideration among the identified performance obligations; and 5) determining the timing of revenue recognition pursuant to each arrangement. During 2017 we completed these contract reviews and have implemented revised accounting system processes in order to capture information required to be disclosed under ASU 2014-09. We will adopt this new guidance using the modified retrospective method on January 1, 2018. We have substantially completed our analysis of the new guidance and have not identified any material changes to the timing or amount of revenue to be recognized in future periods. The disclosures related to revenue recognition will be significantly expanded under ASU 2014-09, specifically around the quantitative and qualitative information about performance obligations, changes in contract assets and liabilities, and disaggregation of revenue. We continue to evaluate these requirements.
In March 2016, the FASB issued ASU 2016-08, "Revenue from Contracts with Customers (Topic 606): Principal versus Agent Considerations (Reporting Revenue Gross versus Net)" to clarify the guidance on principal versus agent considerations. This ASU does not change the effective date or adoption method under ASU 2014-09 which is noted above.
In April 2016, the FASB issued ASU 2016-10, "Revenue from Contracts with Customers (Topic 606): Identifying Performance Obligations and Licensing" to clarify the guidance on identifying performance obligations
F-21
and the licensing implementation guidance. This ASU does not change the effective date or adoption method under ASU 2014-09, which is noted above.
Additionally, in May 2016, the FASB issued ASU 2016-12, "Revenue from Contracts with Customers (Topic 606): Narrow-Scope Improvements and Practical Expedients." This ASU addresses and amends several aspects of ASU 2014-09, but does not change the core principle of the guidance. This ASU does not change the effective date or adoption method under ASU 2014-09 which is noted above.
In July 2015, the FASB issued ASU 2015-11, “Simplifying the Measurement of Inventory” (Topic 330), which simplifies the subsequent measurement of inventory by requiring entities to measure inventory at the lower of cost or net realizable value, except for inventory measured using the last-in, first-out (LIFO) or the retail inventory methods. The ASU requires entities to compare the cost of inventory to one measure - net realizable value. Net realizable value is the estimated selling price in the ordinary course of business, less reasonably predictable costs of completion, disposal and transportation. The ASU is effective for annual periods beginning after December 15, 2016, and interim periods within those annual periods, and is to be applied prospectively with early adoption permitted. As a result of the adoption of this standard during the first quarter of 2017, there was no material impact on our consolidated financial statements.
In February 2016, the FASB issued ASU 2016-02, "Leases" (Topic 842) to increase comparability and transparency among different organizations. Organizations are required to recognize lease assets and lease liabilities on the balance sheet and disclose key information about the leasing arrangements and cash flows. The ASU is effective for annual periods beginning after December 15, 2018, and interim periods within those annual periods, under a modified retrospective adoption with early adoption permitted. We are currently assessing the potential effects of these changes to our consolidated financial statements.
In March 2016, the FASB issued ASU 2016-09, "Compensation-Stock Compensation (Topic 718): Improvements to Employee Share-Based Payment Accounting" as part of a simplification initiative. The update addresses and simplifies several aspects of accounting for share-based payment transactions. The ASU is effective for annual periods beginning after December 15, 2016, and interim periods within those annual periods, with early adoption permitted, and is to be applied using either modified retrospective, retrospective, or prospective transition method based on which amendment is being applied. Upon adoption of ASU 2016-09, we elected to change our accounting policy to account for forfeitures as they occur, using a modified retrospective method and determined that a cumulative-effect adjustment to retained earnings would be immaterial at transition during the first quarter of 2017. Amendments related to accounting for excess tax benefits have been adopted using a prospective transition method and there were no unrealized excess tax benefits prior to adoption that would require a modified retrospective transition method. Prospectively, excess tax benefits for share-based payments, if any, are now included in cash flows from operating activities rather than financing activities. The ASU also requires entities to classify as financing activities on the statement of cash flows, the cash paid to tax authorities when shares are withheld to satisfy the employer’s statutory income tax withholding obligation, with the application of this requirement to be applied retrospectively. As a result of share-based compensation that vested during 2017 and 2016, the impact to the Consolidated Statements of Cash Flows was $0.8 million and $1.7 million, respectively, of tax remittances on equity based compensation as a financing activity.
In June 2016, the FASB issued ASU 2016-13, "Financial Instruments - Credit Losses (Topic 326): Measurement of Credit Losses on Financial Instruments." ASU 2016-13 amends the impairment model to utilize an expected loss methodology in place of the currently used incurred loss methodology, which will result in more timely recognition of losses. ASU 2016-13, which has an effective date of the first quarter of fiscal 2022, also applies to employee benefit plan accounting. We are currently assessing the potential effects of these changes to our consolidated financial statements and employee benefit plan accounting.
In August 2016, the FASB issued ASU 2016-15, "Statement of Cash Flows (Topic 230): Classification of Certain Cash Receipts and Cash Payments" to reduce diversity in practice in classification of certain transactions in the statement of cash flows. The ASU is effective for annual periods beginning after December 15, 2017, and interim periods within those annual periods, with early adoption permitted, under a retrospective transition adoption. We are currently assessing the potential effects of these changes to our consolidated financial statements.
In November 2016, the FASB issued ASU 2016-16, "Intra-Entity Transfers of Assets Other Than Inventory" which requires companies to account for the income tax effects of intercompany transfers of assets other than inventory when the transfer occurs. The ASU is effective for annual periods beginning after December 15, 2017,

F-22
and interim periods within those annual periods, with early adoption permitted, under a modified retrospective transition adoption. We are currently assessing the potential effects of these changes to our consolidated financial statements.
Additionally, in November 2016, the FASB issued ASU 2016-18, "Statement of Cash Flows (Topic 230): Restricted Cash" to reduce diversity in the presentation of restricted cash and restricted cash equivalents in the statement of cash flows. The ASU is effective for annual periods beginning after December 15, 2017, and interim periods within those annual periods, with early adoption permitted, under a retrospective transition adoption. We are currently assessing the potential effects of these changes to our consolidated financial statements.
In January 2017, the FASB issued ASU 2017-04, "Intangibles-Goodwill and Other (Topic 350): Simplifying the Test for Goodwill Impairment" which simplifies how an entity is required to test goodwill for impairment by eliminating Step 2 from the goodwill impairment test. The ASU is effective for annual periods beginning after December 15, 2020, and interim periods within those annual periods, with early adoption permitted, under a prospective adoption. We do not expect the adoption of this standard to have a material impact on our consolidated financial statements.
In May 2017, the FASB issued ASU 2017-09, "Compensation-Stock Compensation (Topic 718): Scope of Modification Accounting" to clarify when to account for a change to the terms or conditions of a share-based payment award as a modification. The ASU is effective for annual periods beginning after December 15, 2017, and interim periods within those annual periods, with early adoption permitted. We do not expect the adoption of this standard to have a material impact on our consolidated financial statements.
In July 2017, the FASB issued ASU 2017-11, "Earnings Per Share (Topic 260); Distinguishing Liabilities from Equity (Topic 480); Derivatives and Hedging (Topic 815): (Part I) Accounting for Certain Financial Instruments with Down Round Features, (Part II) Replacement of the Indefinite Deferral for Mandatorily Redeemable Financial Instruments of Certain Nonpublic Entities and Certain Mandatorily Redeemable Noncontrolling Interests with a Scope Exception" to consider “down round” features when determining whether certain equity-linked financial instruments or embedded features are indexed to an entity’s own stock. Entities that present EPS under ASC 260 will recognize the effect of a down round feature in a freestanding equity-classified financial instrument only when it is triggered. The effect of triggering such a feature will be recognized as a dividend and a reduction to income available to common shareholders in basic EPS. The ASU is effective for annual periods beginning after December 15, 2018, and interim periods within those annual periods. We are currently assessing the potential effects of these changes to our consolidated financial statements.
In August 2017, the FASB issued ASU 2017-12, "Derivatives and Hedging (Topic 815): Targeted Improvements to Accounting for Hedging Activities" to change how companies account for and disclose hedges. The ASU is effective for annual periods beginning after December 15, 2018, and interim periods within those annual periods. We are currently assessing the potential effects of these changes to our consolidated financial statements.
NOTE C — ACQUISITIONS AND DISPOSITIONS
Acquisition of SwiftWater Energy Services
On February 28, 2018, pursuant to a purchase agreement dated February 13, 2018 (the "SwiftWater Purchase Agreement"), we purchased all of the equity interests in SwiftWater Energy Services, LLC ("SwiftWater"), which is engaged in the business of providing water management and water solutions to oil and gas operators in the Permian Basin market of Texas. Under the terms of the SwiftWater Purchase Agreement, consideration of $40.0 million of cash, subject to a working capital adjustment, and 7,772,021 shares of our common stock were paid at closing. The sellers will also have the right to receive contingent consideration payments, in an aggregate amount of up to $15.0 million, calculated on EBITDA and revenue (each as defined in the SwiftWater Purchase Agreement) of the combined water management business of both SwiftWater and our pre-existing operations in the Permian Basin in respect of the period from January 1, 2018 through December 31, 2019. The contingent consideration may be paid in cash or shares of our common stock, at our election. As of March 2, 2018, a preliminary allocation of the SwiftWater purchase price had yet to be calculated, but will be determined during the first quarter of 2018.
Sale of Offshore Division
On March 1, 2018, we closed a series of related transactions that resulted in the disposition of our Offshore Division. Pursuant to an Asset Purchase and Sale Agreement (the "Maritech Asset Purchase Agreement") with
F-23
Orinoco Natural Resources, LLC ("Orinoco") Orinoco purchased certain offshore oil, gas and mineral leases and related assets of Maritech (the "Maritech Properties"). Immediately thereafter, we closed a Membership Interest Purchase and Sale Agreement (the "Maritech Equity Purchase Agreement") with Orinoco, whereby Orinoco purchased all of the equity interests of Maritech (the "Maritech Equity Interests"). Immediately thereafter, we closed an Equity Interest Purchase Agreement (the "Offshore Services Purchase Agreement") with Epic Offshore Specialty, LLC, an affiliate of Orinoco ("Epic Offshore"), whereby Epic Offshore (the "Offshore Services Sale") purchased all of the equity interests in the wholly owned subsidiaries that comprise our Offshore Services segment operations (the "Offshore Services Equity Interests"). Under the terms of the Maritech Asset Purchase Agreement, the Maritech Equity Purchase Agreement, and the Offshore Services Purchase Agreement, the consideration delivered by Orinoco and Epic Offshore for the Maritech Properties, the Maritech Equity Interests and the Offshore Services Equity Interests consisted of (i) the assumption by Orinoco of all of the liabilities and obligations relating to the ownership, operation and condition of the Maritech Properties and the provision of certain indemnities by Orinoco to us under the Maritech Asset Purchase Agreement, (ii) the assumption by Orinoco of all of the liabilities of Maritech and the provision of certain indemnities by Orinoco under the Maritech Equity Purchase Agreement, (iii) the assumption by Epic Offshore of substantially all of the liabilities of the Offshore Services Equity Interests relating to the periods following the closing of the Offshore Services Sale and the provision of certain indemnities by Epic Offshore under the Offshore Services Purchase Agreement, (iv) cash in the amount $3.1 million which is equal to the value of the fuel in the vessels owned by Offshore Services as of the closing plus the value (determined to be sixty percent of the amount paid by Offshore Services therefore) of all usable spare parts and supply inventory of Offshore Services, (v) a promissory note in the original principal amount of $7.5 million payable by Epic Offshore to us in full, together with interest at a rate of 1.52% per annum, on December 31, 2019, (vi) performance by Orinoco under a Bonding Agreement executed in connection with the Maritech Asset Purchase Agreement and the Maritech Equity Purchase Agreement whereby Orinoco provided at closing non-revocable performance bonds in an amount equal to $46.8 million to cover the performance by Orinoco and Maritech of the asset retirement obligations of Maritech, to be replaced within 90 days of the closing with non-revocable performance bonds, meeting certain requirements, in the sum of $47.0 million, and (vii) the delivery of a personal guaranty agreement from Thomas M. Clarke and Ana M. Clarke guaranteeing the payment obligations of Orinoco under the Bonding Agreement (collectively, the "Transaction Consideration").
As a result of these transactions, we are effectively exiting the businesses of our Offshore Services and Maritech segments, and these operations will be reflected as discontinued operations in our consolidated financial statements in future filings beginning with the quarterly period ending March 31, 2018. As a result of these transactions, our consolidated results of operations for the quarterly period ending March 31, 2018, will include a loss on the disposal of our Offshore Division, estimated to range from approximately $33.0 million to $35.0 million.
NOTE D — LEASES We lease some of our transportation equipment, office space, warehouse space, operating locations, and
machinery and equipment. Certain facility storage tanks being constructed are leased pursuant to a ten year term, which is classified as a capital lease. Capitalized costs pursuant to a capital lease are depreciated over the term of the lease. The office, warehouse, and operating location leases, which vary from one to twenty-five year terms that expire at various dates through 2034 and are generally renewable for three and five year periods on similar terms, are classified as operating leases. Transportation equipment leases expire at various dates through 2029 and are also classified as operating leases. The office, warehouse, and operating location leases, and machinery and equipment leases generally require us to pay all maintenance and insurance costs.
Future minimum lease payments by year and in the aggregate, under non-cancelable capital and operating
leases with terms of one year or more, and including the headquarters facility lease discussed above, consist of the following at December 31, 2017:
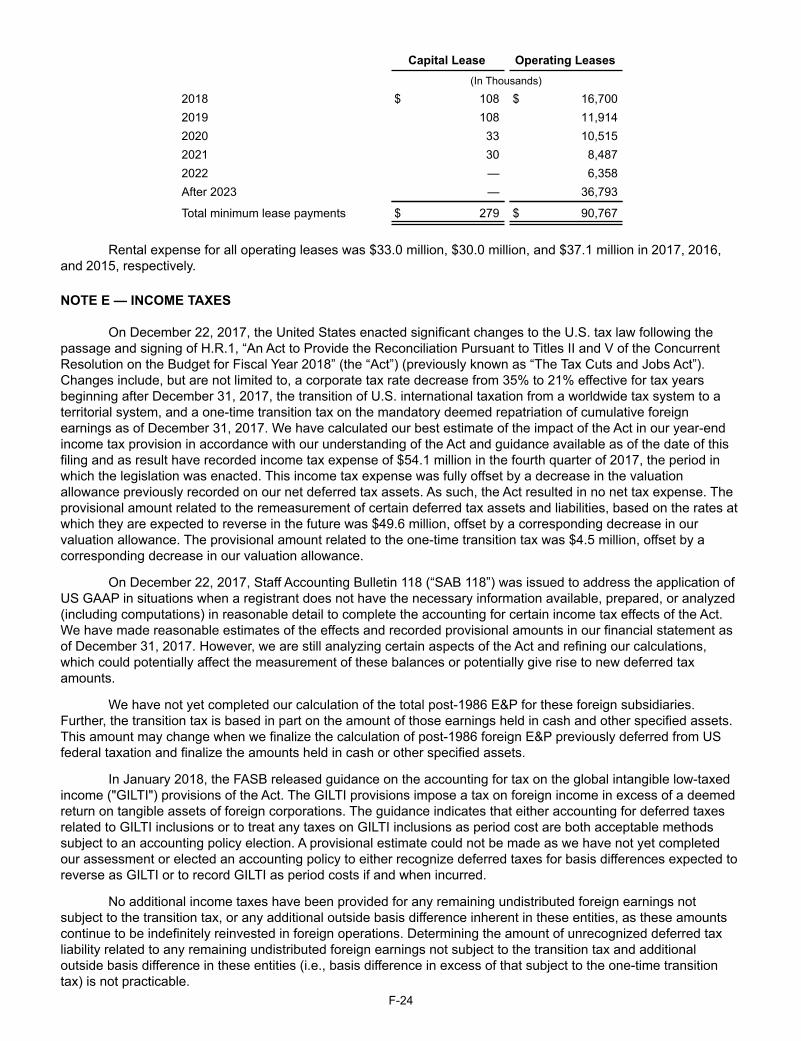
F-24
Capital Lease Operating Leases (In Thousands)
2018 $ 108 $ 16,7002019 108 11,9142020 33 10,5152021 30 8,4872022 — 6,358After 2023 — 36,793
Total minimum lease payments $ 279 $ 90,767
Rental expense for all operating leases was $33.0 million, $30.0 million, and $37.1 million in 2017, 2016,
and 2015, respectively.
NOTE E — INCOME TAXES
On December 22, 2017, the United States enacted significant changes to the U.S. tax law following the passage and signing of H.R.1, “An Act to Provide the Reconciliation Pursuant to Titles II and V of the Concurrent Resolution on the Budget for Fiscal Year 2018” (the “Act”) (previously known as “The Tax Cuts and Jobs Act”). Changes include, but are not limited to, a corporate tax rate decrease from 35% to 21% effective for tax years beginning after December 31, 2017, the transition of U.S. international taxation from a worldwide tax system to a territorial system, and a one-time transition tax on the mandatory deemed repatriation of cumulative foreign earnings as of December 31, 2017. We have calculated our best estimate of the impact of the Act in our year-end income tax provision in accordance with our understanding of the Act and guidance available as of the date of this filing and as result have recorded income tax expense of $54.1 million in the fourth quarter of 2017, the period in which the legislation was enacted. This income tax expense was fully offset by a decrease in the valuation allowance previously recorded on our net deferred tax assets. As such, the Act resulted in no net tax expense. The provisional amount related to the remeasurement of certain deferred tax assets and liabilities, based on the rates at which they are expected to reverse in the future was $49.6 million, offset by a corresponding decrease in our valuation allowance. The provisional amount related to the one-time transition tax was $4.5 million, offset by a corresponding decrease in our valuation allowance.
On December 22, 2017, Staff Accounting Bulletin 118 (“SAB 118”) was issued to address the application of US GAAP in situations when a registrant does not have the necessary information available, prepared, or analyzed (including computations) in reasonable detail to complete the accounting for certain income tax effects of the Act. We have made reasonable estimates of the effects and recorded provisional amounts in our financial statement as of December 31, 2017. However, we are still analyzing certain aspects of the Act and refining our calculations, which could potentially affect the measurement of these balances or potentially give rise to new deferred tax amounts.
We have not yet completed our calculation of the total post-1986 E&P for these foreign subsidiaries. Further, the transition tax is based in part on the amount of those earnings held in cash and other specified assets. This amount may change when we finalize the calculation of post-1986 foreign E&P previously deferred from US federal taxation and finalize the amounts held in cash or other specified assets.
In January 2018, the FASB released guidance on the accounting for tax on the global intangible low-taxed income ("GILTI") provisions of the Act. The GILTI provisions impose a tax on foreign income in excess of a deemed return on tangible assets of foreign corporations. The guidance indicates that either accounting for deferred taxes related to GILTI inclusions or to treat any taxes on GILTI inclusions as period cost are both acceptable methods subject to an accounting policy election. A provisional estimate could not be made as we have not yet completed our assessment or elected an accounting policy to either recognize deferred taxes for basis differences expected to reverse as GILTI or to record GILTI as period costs if and when incurred.
No additional income taxes have been provided for any remaining undistributed foreign earnings not subject to the transition tax, or any additional outside basis difference inherent in these entities, as these amounts continue to be indefinitely reinvested in foreign operations. Determining the amount of unrecognized deferred tax liability related to any remaining undistributed foreign earnings not subject to the transition tax and additional outside basis difference in these entities (i.e., basis difference in excess of that subject to the one-time transition tax) is not practicable.

F-25
The income tax provision (benefit) attributable to continuing operations for the years ended December 31, 2017, 2016, and 2015, consists of the following:
Year Ended December 31, 2017 2016 2015 (In Thousands)
Current Federal $ (651) $ — $ (1,310)State 799 783 2,022Foreign 4,100 3,328 7,371
4,248 4,111 8,083Deferred Federal 686 — 191State (648) (610) (1,613)Foreign (3,086) (1,198) 1,043 (3,048) (1,808) (379)
Total tax provision (benefit) $ 1,200 $ 2,303 $ 7,704
A reconciliation of the provision (benefit) for income taxes attributable to continuing operations, computed
by applying the federal statutory rate to income (loss) before income taxes and the reported income taxes, is as follows:
Year Ended December 31, 2017 2016 2015 (In Thousands)Income tax provision (benefit) computed at statutory federal income tax rates $ (21,344) $ (82,982) $ (70,617)
State income taxes (net of federal benefit) 1,664 (2,960) (608)Nondeductible meals and entertainment 472 419 909Impact of international operations 10,860 7,567 (1,880)Impact of U.S. tax law change 54,092 — —Goodwill impairments — 12,990 20,412Impact of noncontrolling interest 5,151 2,247 1,411Valuation allowance (55,850) 58,846 55,392Other 6,155 6,176 2,685
Total tax provision (benefit) $ 1,200 $ 2,303 $ 7,704
Other reconciling items for 2017 include $6.2 million related to a cumulative correcting cost allocation
adjustment between CCLP U.S. subsidiary entities from prior years, the net impact from which is considered immaterial.
Income (loss) before taxes and discontinued operations includes the following components:
Year Ended December 31, 2017 2016 2015 (In Thousands)
Domestic $ (46,356) $ (235,394) $ (195,815)International (14,627) (1,696) (5,948)
Total $ (60,983) $ (237,090) $ (201,763)
A reconciliation of the beginning and ending amount of our gross unrecognized tax benefit liability is as follows:
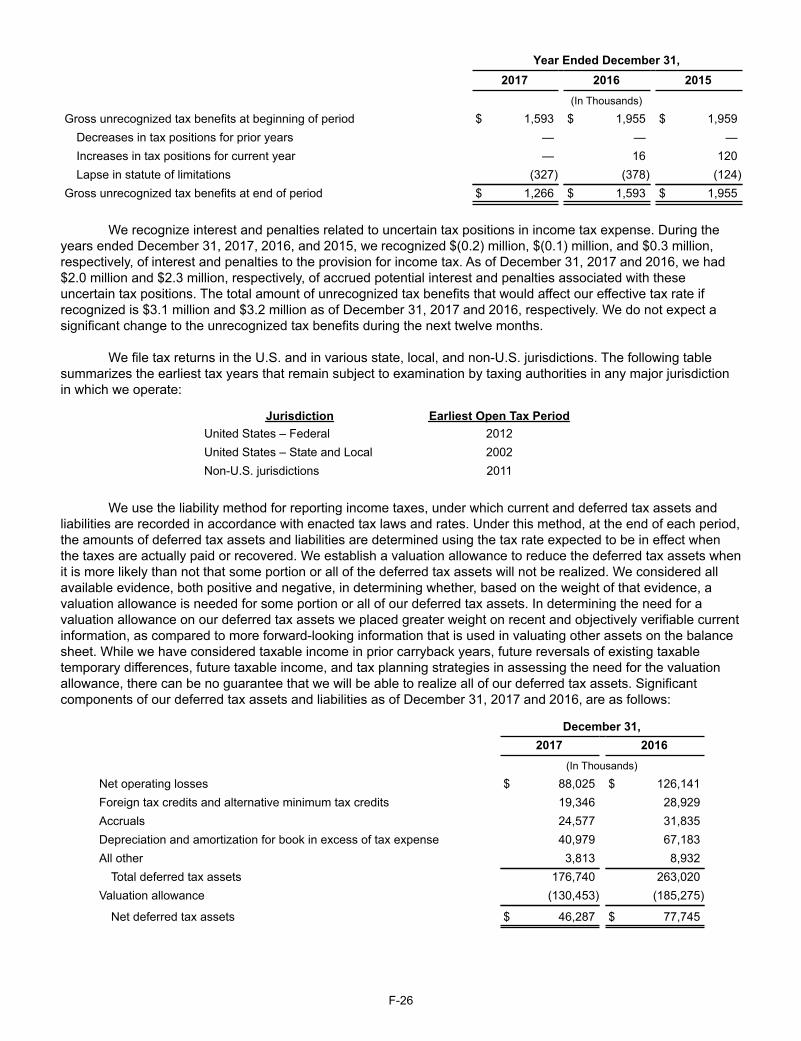
F-26
Year Ended December 31, 2017 2016 2015 (In Thousands)
Gross unrecognized tax benefits at beginning of period $ 1,593 $ 1,955 $ 1,959Decreases in tax positions for prior years — — —Increases in tax positions for current year — 16 120Lapse in statute of limitations (327) (378) (124)
Gross unrecognized tax benefits at end of period $ 1,266 $ 1,593 $ 1,955
We recognize interest and penalties related to uncertain tax positions in income tax expense. During the
years ended December 31, 2017, 2016, and 2015, we recognized $(0.2) million, $(0.1) million, and $0.3 million, respectively, of interest and penalties to the provision for income tax. As of December 31, 2017 and 2016, we had $2.0 million and $2.3 million, respectively, of accrued potential interest and penalties associated with these uncertain tax positions. The total amount of unrecognized tax benefits that would affect our effective tax rate if recognized is $3.1 million and $3.2 million as of December 31, 2017 and 2016, respectively. We do not expect a significant change to the unrecognized tax benefits during the next twelve months.
We file tax returns in the U.S. and in various state, local, and non-U.S. jurisdictions. The following table
summarizes the earliest tax years that remain subject to examination by taxing authorities in any major jurisdiction in which we operate:
Jurisdiction Earliest Open Tax PeriodUnited States – Federal 2012United States – State and Local 2002Non-U.S. jurisdictions 2011
We use the liability method for reporting income taxes, under which current and deferred tax assets and
liabilities are recorded in accordance with enacted tax laws and rates. Under this method, at the end of each period, the amounts of deferred tax assets and liabilities are determined using the tax rate expected to be in effect when the taxes are actually paid or recovered. We establish a valuation allowance to reduce the deferred tax assets when it is more likely than not that some portion or all of the deferred tax assets will not be realized. We considered all available evidence, both positive and negative, in determining whether, based on the weight of that evidence, a valuation allowance is needed for some portion or all of our deferred tax assets. In determining the need for a valuation allowance on our deferred tax assets we placed greater weight on recent and objectively verifiable current information, as compared to more forward-looking information that is used in valuating other assets on the balance sheet. While we have considered taxable income in prior carryback years, future reversals of existing taxable temporary differences, future taxable income, and tax planning strategies in assessing the need for the valuation allowance, there can be no guarantee that we will be able to realize all of our deferred tax assets. Significant components of our deferred tax assets and liabilities as of December 31, 2017 and 2016, are as follows:
December 31, 2017 2016 (In Thousands)
Net operating losses $ 88,025 $ 126,141Foreign tax credits and alternative minimum tax credits 19,346 28,929Accruals 24,577 31,835Depreciation and amortization for book in excess of tax expense 40,979 67,183All other 3,813 8,932
Total deferred tax assets 176,740 263,020Valuation allowance (130,453) (185,275)
Net deferred tax assets $ 46,287 $ 77,745
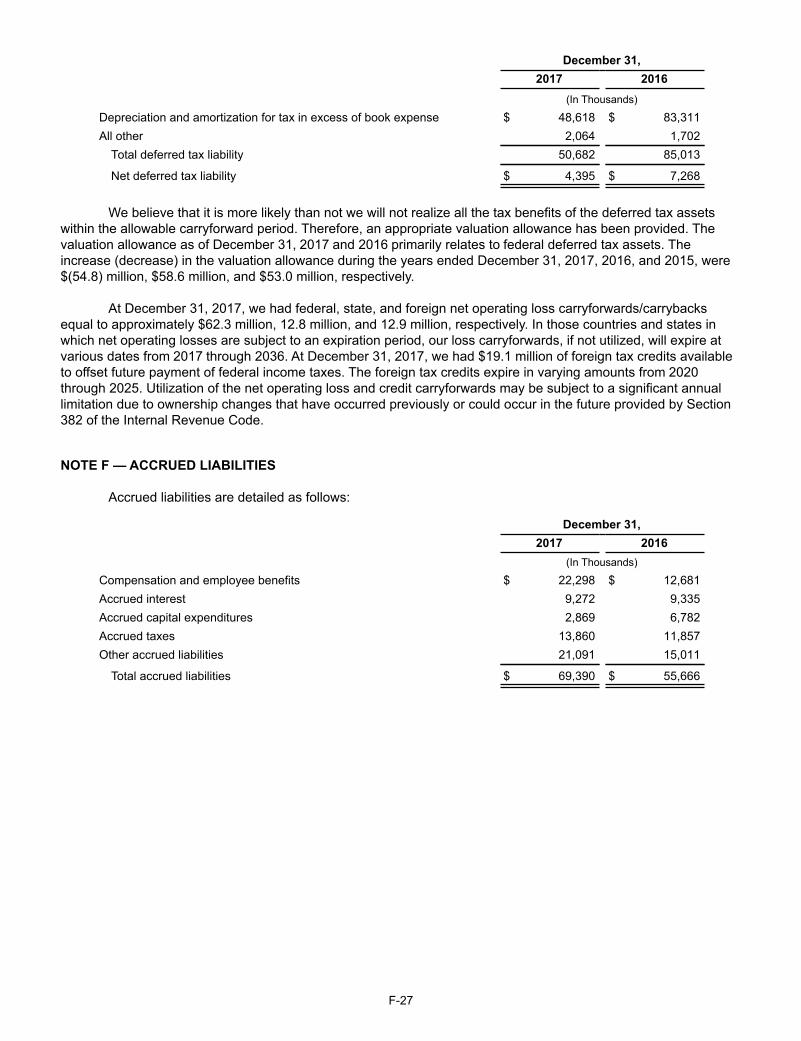
F-27
December 31, 2017 2016 (In Thousands)
Depreciation and amortization for tax in excess of book expense $ 48,618 $ 83,311All other 2,064 1,702
Total deferred tax liability 50,682 85,013
Net deferred tax liability $ 4,395 $ 7,268
We believe that it is more likely than not we will not realize all the tax benefits of the deferred tax assets
within the allowable carryforward period. Therefore, an appropriate valuation allowance has been provided. The valuation allowance as of December 31, 2017 and 2016 primarily relates to federal deferred tax assets. The increase (decrease) in the valuation allowance during the years ended December 31, 2017, 2016, and 2015, were $(54.8) million, $58.6 million, and $53.0 million, respectively.
At December 31, 2017, we had federal, state, and foreign net operating loss carryforwards/carrybacks
equal to approximately $62.3 million, 12.8 million, and 12.9 million, respectively. In those countries and states in which net operating losses are subject to an expiration period, our loss carryforwards, if not utilized, will expire at various dates from 2017 through 2036. At December 31, 2017, we had $19.1 million of foreign tax credits available to offset future payment of federal income taxes. The foreign tax credits expire in varying amounts from 2020 through 2025. Utilization of the net operating loss and credit carryforwards may be subject to a significant annual limitation due to ownership changes that have occurred previously or could occur in the future provided by Section 382 of the Internal Revenue Code.
NOTE F — ACCRUED LIABILITIES Accrued liabilities are detailed as follows:
December 31, 2017 2016 (In Thousands)
Compensation and employee benefits $ 22,298 $ 12,681Accrued interest 9,272 9,335Accrued capital expenditures 2,869 6,782Accrued taxes 13,860 11,857Other accrued liabilities 21,091 15,011
Total accrued liabilities $ 69,390 $ 55,666

F-28
NOTE G — LONG-TERM DEBT AND OTHER BORROWINGS We believe TETRA's capital structure and CCLP's capital structure should be considered separately, as
there are no cross default provisions, cross collateralization provisions, or cross guarantees between CCLP's debt and TETRA's debt.
Long-term debt consists of the following:
December 31,2017
December 31,2016
(In Thousands)TETRA Scheduled Maturity
Bank revolving line of credit facility (presented net of theunamortized deferred financing costs of $2.3 million asof December 31, 2016) September 30, 2019 $ — $ 3,229
11.0% Senior Note, Series 2015 (presented net of theunamortized discount of $3.9 million as of December 31,2017 and $4.4 million as of December 31, 2016 and netof unamortized deferred financing costs of $3.4 millionas of December 31, 2017 and $4.2 million as ofDecember 31, 2016) November 5, 2022 117,679 116,411
TETRA total debt 117,679 119,640
Less current portion — —
TETRA total long-term debt $ 117,679 $ 119,640
CCLPCCLP Bank Credit Facility (presented net of theunamortized deferred financing costs of $4.0 million asof December 31, 2017 and $4.5 million as of December31, 2016) August 4, 2019 223,985 217,467
CCLP 7.25% Senior Notes (presented net of theunamortized discount of $2.8 million as of December 31,2017 and $3.3 million as of December 31, 2016 and netof unamortized deferred financing costs of $5.0 millionas of December 31, 2017 and $6.0 million as ofDecember 31, 2016) August 15, 2022 288,191 286,623
CCLP total debt 512,176 504,090
Less current portion — —
CCLP total long-term debt 512,176 504,090
Consolidated total long-term debt $ 629,855 $ 623,730
Scheduled maturities for the next five years and thereafter are as follows:
December 31, 2017 (In Thousands)
TETRA CCLP Consolidated2018 $ — $ — $ —2019 — 223,985 223,9852020 — — —2021 — — —2022 117,679 288,191 405,870Thereafter — — —Total maturities $ 117,679 $ 512,176 $ 629,855
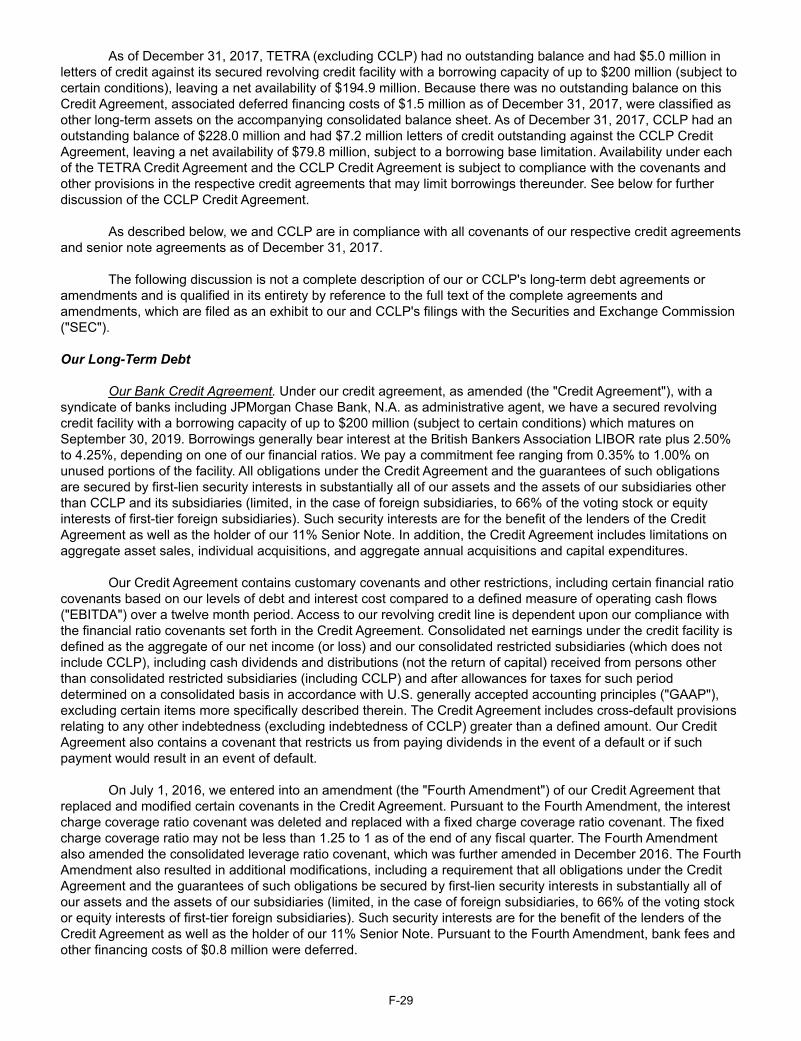
F-29
As of December 31, 2017, TETRA (excluding CCLP) had no outstanding balance and had $5.0 million in letters of credit against its secured revolving credit facility with a borrowing capacity of up to $200 million (subject to certain conditions), leaving a net availability of $194.9 million. Because there was no outstanding balance on this Credit Agreement, associated deferred financing costs of $1.5 million as of December 31, 2017, were classified as other long-term assets on the accompanying consolidated balance sheet. As of December 31, 2017, CCLP had an outstanding balance of $228.0 million and had $7.2 million letters of credit outstanding against the CCLP Credit Agreement, leaving a net availability of $79.8 million, subject to a borrowing base limitation. Availability under each of the TETRA Credit Agreement and the CCLP Credit Agreement is subject to compliance with the covenants and other provisions in the respective credit agreements that may limit borrowings thereunder. See below for further discussion of the CCLP Credit Agreement.
As described below, we and CCLP are in compliance with all covenants of our respective credit agreements and senior note agreements as of December 31, 2017.
The following discussion is not a complete description of our or CCLP's long-term debt agreements or amendments and is qualified in its entirety by reference to the full text of the complete agreements and amendments, which are filed as an exhibit to our and CCLP's filings with the Securities and Exchange Commission ("SEC").
Our Long-Term Debt
Our Bank Credit Agreement. Under our credit agreement, as amended (the "Credit Agreement"), with a syndicate of banks including JPMorgan Chase Bank, N.A. as administrative agent, we have a secured revolving credit facility with a borrowing capacity of up to $200 million (subject to certain conditions) which matures on September 30, 2019. Borrowings generally bear interest at the British Bankers Association LIBOR rate plus 2.50% to 4.25%, depending on one of our financial ratios. We pay a commitment fee ranging from 0.35% to 1.00% on unused portions of the facility. All obligations under the Credit Agreement and the guarantees of such obligations are secured by first-lien security interests in substantially all of our assets and the assets of our subsidiaries other than CCLP and its subsidiaries (limited, in the case of foreign subsidiaries, to 66% of the voting stock or equity interests of first-tier foreign subsidiaries). Such security interests are for the benefit of the lenders of the Credit Agreement as well as the holder of our 11% Senior Note. In addition, the Credit Agreement includes limitations on aggregate asset sales, individual acquisitions, and aggregate annual acquisitions and capital expenditures.
Our Credit Agreement contains customary covenants and other restrictions, including certain financial ratio covenants based on our levels of debt and interest cost compared to a defined measure of operating cash flows ("EBITDA") over a twelve month period. Access to our revolving credit line is dependent upon our compliance with the financial ratio covenants set forth in the Credit Agreement. Consolidated net earnings under the credit facility is defined as the aggregate of our net income (or loss) and our consolidated restricted subsidiaries (which does not include CCLP), including cash dividends and distributions (not the return of capital) received from persons other than consolidated restricted subsidiaries (including CCLP) and after allowances for taxes for such period determined on a consolidated basis in accordance with U.S. generally accepted accounting principles ("GAAP"), excluding certain items more specifically described therein. The Credit Agreement includes cross-default provisions relating to any other indebtedness (excluding indebtedness of CCLP) greater than a defined amount. Our Credit Agreement also contains a covenant that restricts us from paying dividends in the event of a default or if such payment would result in an event of default.
On July 1, 2016, we entered into an amendment (the "Fourth Amendment") of our Credit Agreement that replaced and modified certain covenants in the Credit Agreement. Pursuant to the Fourth Amendment, the interest charge coverage ratio covenant was deleted and replaced with a fixed charge coverage ratio covenant. The fixed charge coverage ratio may not be less than 1.25 to 1 as of the end of any fiscal quarter. The Fourth Amendment also amended the consolidated leverage ratio covenant, which was further amended in December 2016. The Fourth Amendment also resulted in additional modifications, including a requirement that all obligations under the Credit Agreement and the guarantees of such obligations be secured by first-lien security interests in substantially all of our assets and the assets of our subsidiaries (limited, in the case of foreign subsidiaries, to 66% of the voting stock or equity interests of first-tier foreign subsidiaries). Such security interests are for the benefit of the lenders of the Credit Agreement as well as the holder of our 11% Senior Note. Pursuant to the Fourth Amendment, bank fees and other financing costs of $0.8 million were deferred.

F-30
On December 22, 2016, we entered into an amendment (the "Fifth Amendment") of our Credit Agreement that replaced and modified certain covenants. Pursuant to the Fifth Amendment, the consolidated leverage ratio may not exceed (a) 5.00 to 1 at the end of fiscal quarters ending during the period from and including March 31, 2017 through and including December 31, 2017, (b) 4.75 to 1 at the end of fiscal quarters ending March 31, 2018 and June 30, 2018, (c) 4.50 to 1 at the end of fiscal quarters ending September 30, 2018 and December 31, 2018, and (d) 4.00 to 1 at the end of each of the fiscal quarters thereafter. In addition, the Fifth Amendment provides for the reduction of the maximum aggregate lender commitments from $225 million to $200 million, along with various other changes that can be found in the Fifth Amendment. Borrowings under our Credit Agreement following the Fifth Amendment generally bear interest at the British Bankers Association LIBOR rate, or an alternate base rate, in each case plus 2.50% to 4.25%, depending on our consolidated leverage ratio. We pay a commitment fee ranging from 0.35% to 1.00% on unused portions of the facility, also depending on our consolidated leverage ratio. Pursuant to the Fifth Amendment, bank fees and other financing costs of $0.8 million were deferred. As a result of the reduction of the aggregate lender commitments pursuant to the Fifth Amendment, unamortized deferred finance costs of $0.2 million were charged to interest expense during the year ended December 31, 2016.
At December 31, 2017, our consolidated leverage ratio was 1.66 to 1 (compared to a 5.00 to 1 maximum allowed under the Credit Agreement). Our fixed charge coverage ratio as of December 31, 2017 was 3.05 to 1 (compared to a 1.25 to 1 minimum required under the Credit Agreement).
Our 11% Senior Note. As of December 31, 2017, our senior note consists of the 11% Senior Note that was issued and sold in November 2015 pursuant to our 11% Senior Note Agreement with GSO Tetra Holdings LP ("GSO") whereby we issued and sold $125.0 million in principal amount of our 11% Senior Note (the "11% Senior Note"). The 11% Senior Note bears interest at the fixed rate of 11.0% and matures on November 5, 2022. Interest on the 11% Senior Note is due quarterly on March 15, June 15, September 15, and December 15 of each year. We may prepay the 11% Senior Note, in whole or in part at a prepayment price equal to (i) prior to November 20, 2018, 100% of the principal amount so prepaid, plus accrued and unpaid interest and a “make-whole” prepayment amount, (ii) during the period commencing on November 20, 2018, and ending on November 19, 2019, 104% of the principal amount so prepaid, plus accrued and unpaid interest, (iii) during the period commencing on November 20, 2019 and ending on November 19, 2020, 102% of the principal amount so prepaid, plus accrued and unpaid interest, (iv) during the period commencing on November 20, 2020, and ending on November 19, 2021, 101% of the principal amount so prepaid, plus accrued and unpaid interest, and (v) on or after November 20, 2021, 100% of the principal amount so prepaid, plus accrued and unpaid interest.
The 11% Senior Note is guaranteed by substantially all of our wholly owned U.S. subsidiaries. The 11% Senior Note Agreement contains customary covenants that limit our ability and the ability of certain of our restricted subsidiaries to, among other things: incur or guarantee additional indebtedness; incur or create liens; merge or consolidate or sell substantially all of our assets; engage in a different business; enter into transactions with affiliates; and make certain payments. In addition, the 11% Senior Note Agreement requires us to maintain certain financial ratios, including a maximum leverage ratio (ratio of debt and letters of credit outstanding to a defined measure of earnings). The maximum leverage ratio is further defined in our 11% Senior Note Agreement. Consolidated net earnings under the 11% Senior Note Agreement is the aggregate of our net income (or loss) and our consolidated restricted subsidiaries, including cash dividends and distributions (not the return of capital) received from persons other than consolidated restricted subsidiaries (such as CCLP) and after allowances for taxes for such period determined on a consolidated basis in accordance with U.S. GAAP, excluding certain items more specifically described therein. CCLP is an unrestricted subsidiary and is not a borrower or a guarantor under our 11% Senior Note Agreement.
The 11% Senior Note Agreement includes cross-default provisions relating to other indebtedness (excluding CCLP) greater than a defined amount. Upon the occurrence and during the continuation of an event of default under the 11% Senior Note Agreement, the 11% Senior Note may become immediately due and payable, either automatically or by declaration of holders of more than 50% in principal amount of the 11% Senior Note at the time outstanding.
F-31
On July 1, 2016, we entered into an Amended and Restated Note Purchase Agreement (the "Amended and Restated 11% Senior Note Agreement") with GSO to amend and replace the previous note purchase agreement. The Amended and Restated 11% Senior Note Agreement contains customary default provisions, as well as cross-default provisions. In addition, the Amended and Restated 11% Senior Note Agreement required a minimum fixed charge coverage ratio at the end of any fiscal quarter of 1.1 to 1. The Amended and Restated 11% Senior Note Agreement also amended the consolidated leverage ratio covenant, which was further amended in December 2016 (see discussion below). Pursuant to the Amended and Restated 11% Senior Note Agreement, the 11% Senior Note is secured by first-lien security interests in substantially all of our assets and the assets of our subsidiaries. See the above discussion of our Credit Agreement for a description of these security interests. The 11% Senior Note is pari passu in right of payment with all borrowings under the Credit Agreement and rank at least pari passu in right of payment with all other outstanding indebtedness. The Amended and Restated 11% Senior Note Agreement contains customary covenants that limit our ability to, among other things; incur or guarantee additional indebtedness; incur or create liens; merge or consolidate or sell substantially all of our assets; engage in a different business; enter into transactions with affiliates; and make certain payments as set forth in the Amended and Restated 11% Senior Note Agreement. Pursuant to the Amended and Restated 11% Senior Note Agreement, lender fees and other financing costs of $1.3 million were deferred, netting against the carrying value of the amount outstanding.
On December 22, 2016, we entered into a First Amendment to Amended and Restated 11% Senior Note Purchase Agreement (the “Amended and Restated 11% Senior Note Agreement Amendment”) with GSO. The Amended and Restated 11% Senior Note Agreement Amendment replaced and modified certain financial covenants in the Amended and Restated 11% Senior Note Agreement by providing that 1) the minimum fixed charge coverage ratio be increased to 1.25 to 1 as of the end of any fiscal quarter; 2) the ratio of consolidated funded indebtedness to EBITDA may not exceed (a) 5.00 to 1 at the end of fiscal quarters ending during the period from and including March 31, 2017 through and including December 31, 2017, (b) 4.75 to 1 at the end of fiscal quarters ending March 31, 2018 and June 30, 2018, (c) 4.50 to 1 at the end of fiscal quarters ending September 30, 2018 and December 31, 2018, and (d) 4.00 to 1 at the end of fiscal quarters ending thereafter. The Amended and Restated 11% Senior Note Agreement Amendment provides that no consolidated leverage ratio is applicable for the fiscal quarter ended December 31, 2016. Pursuant to the Amended and Restated 11% Senior Note Agreement Amendment, lender fees and other financing costs of $0.4 million were deferred, netting against the carrying value of the amount outstanding.
At December 31, 2017, our consolidated funded indebtedness to EBITDA ratio was 1.66 to 1 (compared to 5.00 to 1 maximum allowed under the Amended and Restated 11% Senior Note Agreement). There is no consolidated funded indebtedness ratio requirement as of December 31, 2017 as a result of the Amended and Restated 11% Senior Note Agreement. At December 31, 2017, our fixed charge coverage ratio was 3.05 to 1 (compared to a 1.25 minimum required under the Amended and Restated 11% Senior Note Agreement).
CCLP Long-Term Debt
CCLP Bank Credit Agreement. Under CCLP's credit agreement, as amended (the "CCLP Credit Agreement"), with a syndicate of banks including Bank of America, N.A. as administrative agent, CCLP has an asset-based revolving credit facility with a borrowing capacity of up to $315 million, subject to certain requirements, which matures August 4, 2019. The CCLP Credit Agreement is available to provide CCLP's working capital needs, letters of credit, and for general partnership purposes, including capital expenditures and potential future expansions or acquisitions. The CCLP Credit Agreement provides that CCLP can make distributions to holders of its common units, but only if there is no default or event of default under the facility and CCLP maintains excess availability of $30.0 million under the CCLP Credit Agreement. Borrowings under the CCLP Credit Agreement bear interest at a rate per annum equal to, at CCLP's option, either (a) LIBOR (adjusted to reflect any required bank reserves) for an interest period equal to one, two, three, or six months (as selected by CCLP), plus a leverage-based margin that ranges between 2.00% and 3.25% per annum or (b) a base rate plus a leverage-based margin that ranges between 1.00% and 2.25% per annum; such base rate shall be determined by reference to the highest of (1) the prime rate of interest per annum announced from time to time by Bank of America, N.A., (2) the Federal Funds rate plus 0.50% per annum, and (3) LIBOR (adjusted to reflect any required bank reserves) for a one month interest period on such day plus 1.00% per annum. In addition to paying interest on outstanding principal under the CCLP Credit Agreement, CCLP is required to pay a commitment fee ranging from 0.35% to 0.50% per annum in respect of the unutilized commitments. CCLP is also required to pay a customary letter of credit fee equal to the applicable margin on revolving credit LIBOR loans, fronting fees, and other fees, agreed to with the administrative agent and lenders.

F-32
Under the CCLP Credit Agreement, CCLP and CSI Compressco Sub Inc. are named as the borrowers, and all obligations under the CCLP Credit Agreement are guaranteed by all of CCLP's existing and future, direct and indirect, domestic restricted subsidiaries (other than domestic subsidiaries that are wholly owned by foreign subsidiaries). We are not a borrower or a guarantor under the CCLP Credit Agreement. The CCLP Credit Agreement includes customary covenants that, among other things, limit CCLP's ability to incur additional debt, incur, or permit certain liens to exist, or make certain loans, investments, acquisitions, or other restricted payments. The CCLP Credit Agreement includes a maximum credit commitment of $315 million and included within the maximum amount is availability for letters of credit (with a sublimit of $20.0 million) and swingline loans (with a sublimit of $60.0 million). The amount of borrowings under the CCLP Credit Agreement is subject to certain limitations, including a borrowing base calculation as described below and borrowing limitations as a result of financial covenants.
On May 25, 2016, CCLP entered into an amendment (the "CCLP Third Amendment") to the CCLP Credit Agreement that, among other things, modified certain financial covenants in the CCLP Credit Agreement. As discussed below, these financial covenants were further amended in November 2016. In addition, the CCLP Third Amendment provided for other changes related to the CCLP Credit Agreement including, among other amendments (i) reducing the maximum aggregate lender commitments from $400.0 million to $340.0 million, (ii) increasing the applicable margin by 0.25% with a range between 2.00% and 3.00% per annum for LIBOR-based loans and 1.00% to 2.00% per annum for base-rate loans, based on the applicable consolidated total leverage ratio, and (iii) imposing a requirement that CCLP uses designated consolidated cash and cash equivalent balances in excess of $35.0 million to prepay the loans. As a result of the reduction of the maximum lender commitment pursuant to the CCLP Third Amendment, unamortized deferred finance costs of $0.71 million were charged to interest expense during the year ended December 31, 2016. Pursuant to the CCLP Third Amendment, bank fees of $0.71 million were incurred during the year ended December 31, 2016 and were deferred, netting against the carrying value of the amount outstanding under the CCLP Credit Agreement. On November 3, 2016, CCLP entered into an additional amendment (the "CCLP Fourth Amendment") to the CCLP Credit Agreement that, among other changes, further modified certain covenants in the CCLP Credit Agreement. The CCLP Fourth Amendment converted the CCLP Credit Agreement from a secured revolving credit facility into an asset-based revolving credit facility ("ABL Facility"). Borrowings under the CCLP Credit Agreement, as amended, may not exceed a borrowing base equal to the sum of (i) 80% of the aggregate net amount of our eligible accounts receivable, plus (ii) 20% of the aggregate value of any eligible parts inventory, in the event we elect to include eligible parts inventory pursuant to a notice to the administrative agent, plus (iii) 80% of the net in-place eligible compressor equipment, decreased each month by the amount of associated depreciation expense, plus (iv) 80% of the cost of new eligible compressor equipment, and minus (v) the amount of any reserves established by the administrative agent in its discretion. In addition, the CCLP Fourth Amendment imposed other requirements, including requirements related to borrowing base reporting on a monthly basis and provisions to permit periodic appraisal and inspection of collateral assets. Pursuant to the CCLP Fourth Amendment, certain additional restrictive provisions ("cash dominion provisions") are imposed if an event of default has occurred and is continuing or excess availability under the ABL Facility falls below $30.0 million. In addition, the CCLP Fourth Amendment reduced the maximum aggregate lender commitments from $340.0 million to $315.0 million. As a result of the further reduction of the aggregate lender commitments pursuant to the CCLP Fourth Amendment, unamortized deferred finance costs of $0.3 million were charged to interest expense during the year ended December 31, 2016. Pursuant to the CCLP Fourth Amendment, bank fees of $0.8 million were incurred during the year ended December 31, 2016 and were deferred, netting against the carrying value of the amount outstanding under the CCLP Credit Agreement.
On May 5, 2017, CCLP entered into an amendment of the CCLP Credit Agreement (the "CCLP Fifth Amendment") that, among other things, modified certain financial covenants in the CCLP Credit Agreement, providing that (i) the consolidated total leverage ratio may not exceed (a) 5.95 to 1 as of March 31, 2017; (b) 6.75 to 1 as of June 30, 2017 and September 30, 2017; (c) 6.50 to 1 as of December 31, 2017 and March 31, 2018; (d) 6.25 to 1 as of June 30, 2018 and September 30, 2018; (e) 6.00 to 1 as of December 31, 2018; and (f) 5.75 to 1 as of March 31, 2019 and thereafter; and (ii) the consolidated secured leverage ratio may not exceed 3.25 to 1 as of the end of any fiscal quarter. The consolidated interest coverage ratio was not amended by the CCLP Fifth Amendment. In addition, the CCLP Fifth Amendment (i) increased the applicable margin by 0.25% in the event the consolidated total leverage ratio exceeds 6.00 to 1, resulting in a range for the applicable margin between 2.00% and 3.50% per annum for LIBOR-based loans and between 1.00% and 2.50% per annum for base-rate loans, depending on the consolidated total leverage ratio, and (ii) modified the appraisal delivery requirement from an annual requirement to a semi-annual requirement. In connection with the CCLP Fifth Amendment, the level of CCLP's cash distributions payable on its common units for the quarterly period ended June 30, 2017 will be limited
F-33
to the current reduced level. The CCLP Fifth Amendment also included additional revisions that provide flexibility to CCLP for the issuance of preferred securities.
The weighted average interest rate on borrowings outstanding under the CCLP Credit Agreement as of December 31, 2017, was 5% per annum. At December 31, 2017, CCLP's consolidated total leverage ratio was 6.48 to 1 (compared to 6.50 to 1 maximum allowed under the CCLP Credit Agreement), its consolidated secured leverage ratio was 2.89 to 1 (compared to 3.25 to 1 maximum allowed under the CCLP Credit Agreement), and its consolidated interest coverage ratio was 2.55 to 1 (compared to a 2.25 to 1 minimum required under the CCLP Credit Agreement). The consolidated total leverage ratio and the consolidated secured leverage ratio, as both are calculated under the CCLP Credit Agreement, exclude the long-term liability for the CCLP Preferred Units in the determination of total indebtedness.
CCLP is in compliance with all covenants of the CCLP Credit Agreement as of December 31, 2017. CCLP has reviewed its financial forecasts as of March 2, 2018 for the subsequent twelve month period, which considers the current level of distributions to be paid on CCLP common units. CCLP believes that it will have adequate liquidity, earnings, and operating cash flows to fund its operations and debt obligations and maintain compliance with the covenants under its debt agreements through March 2, 2019.
CCLP 7.25% Senior Notes. The obligations under the CCLP 7.25% Senior Notes are jointly and severally, and fully and unconditionally, guaranteed on a senior unsecured basis by each of CCLP’s domestic restricted subsidiaries (other than CSI Compressco Finance) that guarantee CCLP’s other indebtedness (the "Guarantors" and together with the Issuers, the "Obligors"). The CCLP 7.25% Senior Notes and the subsidiary guarantees thereof (together, the "CCLP Securities") were issued pursuant to an indenture described below. As of December 31, 2017, $295.9 million in aggregate principal amount of CCLP 7.25% Senior Notes are outstanding.
The Obligors issued the CCLP Securities pursuant to the Indenture dated as of August 4, 2014, (the "Indenture") by and among the Obligors and U.S. Bank National Association, as trustee (the "Trustee"). The CCLP 7.25% Senior Notes accrue interest at a rate of 7.25% per annum. Interest on the CCLP 7.25% Senior Notes is payable semi-annually in arrears on February 15 and August 15 of each year. The CCLP 7.25% Senior Notes are scheduled to mature on August 15, 2022.
The Indenture contains customary covenants restricting CCLP’s ability and the ability of its restricted subsidiaries to: (i) pay dividends and make certain distributions, investments and other restricted payments; (ii) incur additional indebtedness or issue certain preferred shares; (iii) create certain liens; (iv) sell assets; (v) merge, consolidate, sell or otherwise dispose of all or substantially all of its assets; (vi) enter into transactions with affiliates; and (vii) designate its subsidiaries as unrestricted subsidiaries under the Indenture. The Indenture also contains customary events of default and acceleration provisions relating to such events of default, which provide that upon an event of default under the Indenture, the Trustee or the holders of at least 25% in aggregate principal amount of the CCLP 7.25% Senior Notes then outstanding may declare all amounts owing under the CCLP 7.25% Senior Notes to be due and payable.
During September and October 2016, CCLP repurchased on the open market and retired $54.1 million aggregate principal amount of its CCLP 7.25% Senior Notes for a purchase price of $50.9 million, at an average repurchase price of 94% of the principal amount of such notes, plus accrued interest, utilizing a portion of the net proceeds from the sale of the CCLP Preferred Units. In connection with the repurchase of these CCLP 7.25% Senior Notes, $1.4 million of early extinguishment net gain was credited to other expense during the year ended December 31, 2016, representing the difference between the repurchase price and the $54.1 million aggregate principal amount of the CCLP 7.25% Senior Notes repurchased, and $1.8 million of remaining unamortized deferred finance costs and discounts associated with the repurchased CCLP 7.25% Senior Notes.
NOTE H — CCLP SERIES A CONVERTIBLE PREFERRED UNITS
On August 8, 2016 and September 20, 2016, CCLP entered into Series A Preferred Unit Purchase Agreements (the “CCLP Unit Purchase Agreements”) with certain purchasers to issue and sell in private placements (the "Initial Private Placement" and "Subsequent Private Placement," respectively) an aggregate of 6,999,126 of CCLP Preferred Units for a cash purchase price of $11.43 per CCLP Preferred Unit (the “Issue Price”), resulting in total 2016 net proceeds to CCLP, after deducting certain offering expenses, of $77.3 million. We purchased 874,891 of the CCLP Preferred Units in the Initial Private Placement at the aggregate Issue Price of $10.0 million.
F-34
We and the other holders of CCLP Preferred Units (each, a “CCLP Preferred Unitholder”) will receive quarterly distributions, which are paid in kind in additional CCLP Preferred Units, equal to an annual rate of 11.00% of the Issue Price ($1.2573 per unit annualized), subject to certain adjustments. The rights of the CCLP Preferred Units include certain anti-dilution adjustments, including adjustments for economic dilution resulting from the issuance of CCLP common units in the future below a set price.
A ratable portion of the CCLP Preferred Units have been, and will continue to be, converted into CCLP common units on the eighth day of each month over a period of thirty months that began in March 2017 (each, a “Conversion Date”), subject to certain provisions of the Amended and Restated CCLP Partnership Agreement that may delay or accelerate all or a portion of such monthly conversions. On each Conversion Date, a portion of the CCLP Preferred Units will convert into CCLP common units representing limited partner interests in CCLP in an amount equal to, with respect to each CCLP Preferred Unitholder, the number of CCLP Preferred Units held by such CCLP Preferred Unitholder divided by the number of Conversion Dates remaining, subject to adjustment described in the Amended and Restated CCLP Partnership Agreement, with the conversion price (the "Conversion Price") determined by the trading prices of the common units over the prior month, among other factors, and as otherwise impacted by the existence of certain conditions related to the CCLP common units. On June, 7, 2017, as permitted under the Amended and Restated CCLP Partnership Agreement, CCLP elected to defer the monthly conversion of CCLP Preferred Units for each of the Conversion Dates during the three month period beginning July 8, 2017. As a result, no CCLP Preferred Units were converted into CCLP common units during the three month period ended September 30, 2017, and future monthly conversions were increased beginning in October 2017. Based on the number of Preferred Units outstanding as of December 31, 2017, the maximum aggregate number of CCLP common units that could be required to be issued pursuant to the conversion provisions of the CCLP Preferred Units is approximately 34.1 million CCLP common units; however, CCLP may, at its option, pay cash, or a combination of cash and common units, to the CCLP Preferred Unitholders instead of issuing common units on any Conversion Date, subject to certain restrictions as described in the Amended and Restated CCLP Partnership Agreement and the CCLP Credit Agreement. The total number of CCLP Preferred Units outstanding as of December 31, 2017 was 5,975,200, of which we held 750,417.
Because the CCLP Preferred Units may be settled using a variable number of CCLP common units, the fair value of the CCLP Preferred Units, net of the units we purchased, is classified as long-term liabilities on our consolidated balance sheet in accordance with ASC 480 "Distinguishing Liabilities and Equity." The fair value of the CCLP Preferred Units as of December 31, 2017 was $61.4 million. Changes in the fair value during each quarterly period, including the $3.0 million net decrease and $4.4 million net increase in fair value during 2017 and 2016, respectively, are charged or credited to earnings in the accompanying consolidated statements of operations. Based on the conversion provisions of the CCLP Preferred Units, and using the Conversion Price calculated as of December 31, 2017, the theoretical number of CCLP common units that would be issued if all of the outstanding CCLP Preferred Units were converted on December 31, 2017 on the same basis as the monthly conversions would be approximately 14.6 million CCLP common units, with an aggregate market value of $79.9 million. A $1 decrease in the Conversion Price would result in the issuance of 3.8 million additional CCLP common units pursuant to these conversion provisions.
NOTE I — DECOMMISSIONING AND OTHER ASSET RETIREMENT OBLIGATIONS The large majority of our asset retirement obligations as of December 31, 2016 and 2017 consists of the
remaining future well abandonment and decommissioning costs for offshore oil and gas properties and platforms owned by our Maritech subsidiary, including the decommissioning and debris removal costs associated with its remaining offshore platforms previously destroyed by hurricanes. As part of the sale of our Offshore Division in March 2018, Orinoco assumed all of the liabilities and obligations currently associated with Maritech, including but not limited to all currently identified and any future identified asset retirement obligations. The amount of decommissioning liabilities recorded by Maritech is reduced by amounts allocable to joint interest owners in these properties and platforms.
We also operate facilities in various U.S. and foreign locations that are used in the manufacture, storage, and sale of our products, inventories, and equipment. These facilities are a combination of owned and leased assets. The values of these asset retirement obligations for non-Maritech properties were approximately $11.7 million and $9.4 million as of December 31, 2017 and 2016, respectively. We are required to take certain actions in connection with the retirement of these assets. We have reviewed our obligations in this regard in detail and estimated the cost of these actions. The original estimates are the fair values that have been recorded for retiring
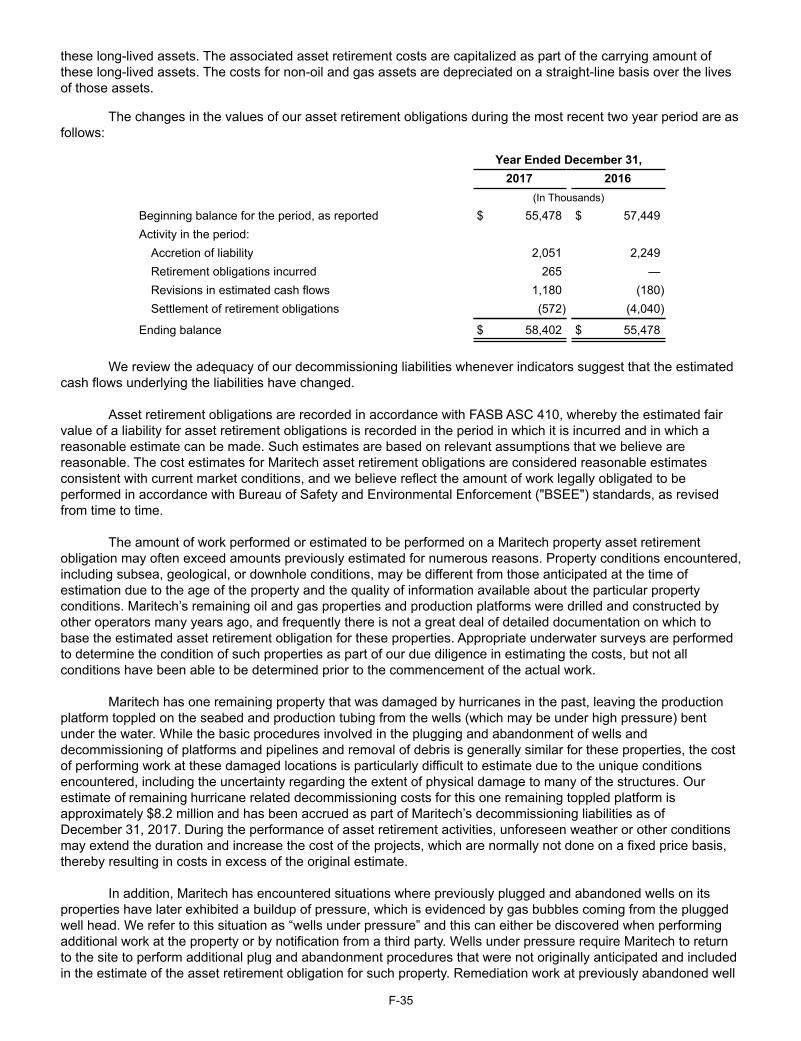
F-35
these long-lived assets. The associated asset retirement costs are capitalized as part of the carrying amount of these long-lived assets. The costs for non-oil and gas assets are depreciated on a straight-line basis over the lives of those assets.
The changes in the values of our asset retirement obligations during the most recent two year period are as
follows:
Year Ended December 31, 2017 2016 (In Thousands)
Beginning balance for the period, as reported $ 55,478 $ 57,449Activity in the period:
Accretion of liability 2,051 2,249Retirement obligations incurred 265 —Revisions in estimated cash flows 1,180 (180)Settlement of retirement obligations (572) (4,040)
Ending balance $ 58,402 $ 55,478
We review the adequacy of our decommissioning liabilities whenever indicators suggest that the estimated
cash flows underlying the liabilities have changed.
Asset retirement obligations are recorded in accordance with FASB ASC 410, whereby the estimated fair value of a liability for asset retirement obligations is recorded in the period in which it is incurred and in which a reasonable estimate can be made. Such estimates are based on relevant assumptions that we believe are reasonable. The cost estimates for Maritech asset retirement obligations are considered reasonable estimates consistent with current market conditions, and we believe reflect the amount of work legally obligated to be performed in accordance with Bureau of Safety and Environmental Enforcement ("BSEE") standards, as revised from time to time.
The amount of work performed or estimated to be performed on a Maritech property asset retirement obligation may often exceed amounts previously estimated for numerous reasons. Property conditions encountered, including subsea, geological, or downhole conditions, may be different from those anticipated at the time of estimation due to the age of the property and the quality of information available about the particular property conditions. Maritech’s remaining oil and gas properties and production platforms were drilled and constructed by other operators many years ago, and frequently there is not a great deal of detailed documentation on which to base the estimated asset retirement obligation for these properties. Appropriate underwater surveys are performed to determine the condition of such properties as part of our due diligence in estimating the costs, but not all conditions have been able to be determined prior to the commencement of the actual work.
Maritech has one remaining property that was damaged by hurricanes in the past, leaving the production platform toppled on the seabed and production tubing from the wells (which may be under high pressure) bent under the water. While the basic procedures involved in the plugging and abandonment of wells and decommissioning of platforms and pipelines and removal of debris is generally similar for these properties, the cost of performing work at these damaged locations is particularly difficult to estimate due to the unique conditions encountered, including the uncertainty regarding the extent of physical damage to many of the structures. Our estimate of remaining hurricane related decommissioning costs for this one remaining toppled platform is approximately $8.2 million and has been accrued as part of Maritech’s decommissioning liabilities as of December 31, 2017. During the performance of asset retirement activities, unforeseen weather or other conditions may extend the duration and increase the cost of the projects, which are normally not done on a fixed price basis, thereby resulting in costs in excess of the original estimate.
In addition, Maritech has encountered situations where previously plugged and abandoned wells on its properties have later exhibited a buildup of pressure, which is evidenced by gas bubbles coming from the plugged well head. We refer to this situation as “wells under pressure” and this can either be discovered when performing additional work at the property or by notification from a third party. Wells under pressure require Maritech to return to the site to perform additional plug and abandonment procedures that were not originally anticipated and included in the estimate of the asset retirement obligation for such property. Remediation work at previously abandoned well

F-36
sites is particularly costly, due to the lack of a platform from which to base these activities. Maritech is the last operator of record for its plugged wells, and, as Maritech's parent company, we and Maritech bear the risk of additional future work required as a result of wells becoming pressurized in the future. For oil and gas properties previously operated by Maritech, the purchaser of the properties generally became the successor operator and assumed the financial responsibilities associated with the properties’ operations and abandonment and decommissioning. However, to the extent that purchasers of these oil and gas properties fail to perform the abandonment and decommissioning work required and there is insufficient bonding or other security, the previous owners and operators of the properties, including Maritech and us as Maritech's parent company, may be required to assume responsibility for the abandonment and decommissioning obligations.
NOTE J — COMMITMENTS AND CONTINGENCIES Litigation
We are named defendants in several lawsuits and respondents in certain governmental proceedings arising
in the ordinary course of business. While the outcome of lawsuits or other proceedings against us cannot be predicted with certainty, management does not consider it reasonably possible that a loss resulting from such lawsuits or other proceedings in excess of any amounts accrued has been incurred that is expected to have a material adverse impact on our financial condition, results of operations, or liquidity.
On March 18, 2011, we filed a lawsuit in the Circuit Court of Union County, Arkansas, asserting claims of professional negligence, breach of contract and other claims against the engineering firm we hired for engineering design, equipment, procurement, advisory, testing and startup services for our El Dorado, Arkansas chemical production facility. The engineering firm disputed our claims and promptly filed a motion to compel the matter to arbitration. After a lengthy procedural dispute in Arkansas state court, arbitration proceedings were initiated on November 15, 2013. Ultimately, on December 16, 2016, the arbitration panel ruled in our favor, declared us as the prevailing party, and awarded us a total net amount of $12.8 million. We received full payment of the $12.8 million final award on January 5, 2017, and this amount was credited to earnings during the first quarter of 2017.
From May 2009 to December 2014, EPIC Diving & Marine Services, LLC (“EPIC”), a wholly-owned subsidiary, was the charterer of a dive support vessel from a service provider. At the time of redelivery of the vessel there was a dispute between EPIC and the service provider that was submitted to arbitration in London pursuant to the dispute resolution provision of the charter agreement. Just prior to the scheduled arbitration proceedings in June 2017, EPIC reached a favorable settlement in relation to certain of the service provider's claims against EPIC. EPIC’s dispute with the service provider that a fee was due at the time of redelivery of the vessel proceeded to arbitration on June 20, 2017. On July 6, 2017, the arbitration panel issued its ruling against EPIC, awarding the service provider $3.0 million, plus interest and fees. A net exposure of $2.8 million was accrued and charged to earnings during 2017. Environmental
One of our subsidiaries, TETRA Micronutrients, Inc. (TMI), previously owned and operated a production
facility located in Fairbury, Nebraska. TMI is subject to an Administrative Order on Consent issued to American Microtrace, Inc. (n/k/a/ TETRA Micronutrients, Inc.) in the proceeding styled In the Matter of American Microtrace Corporation, EPA I.D. No. NED00610550, Respondent, Docket No. VII-98-H-0016, dated September 25, 1998 (the "Consent Order"), with regard to the Fairbury facility. TMI is liable for ongoing environmental monitoring at the Fairbury facility under the Consent Order; however, the current owner of the Fairbury facility is responsible for costs associated with the closure of that facility. While the outcome cannot be predicted with certainty, management does not consider it reasonably possible that a loss in excess of any amounts accrued has been incurred or is expected to have a material adverse impact on our financial condition, results of operations, or liquidity.
Product Purchase Obligations
In the normal course of our Fluids Division operations, we enter into supply agreements with certain
manufacturers of various raw materials and finished products. Some of these agreements have terms and conditions that specify a minimum or maximum level of purchases over the term of the agreement. Other agreements require us to purchase the entire output of the raw material or finished product produced by the manufacturer. Our purchase obligations under these agreements apply only with regard to raw materials and
F-37
finished products that meet specifications set forth in the agreements. We recognize a liability for the purchase of such products at the time we receive them. As of December 31, 2017, the aggregate amount of the fixed and determinable portion of the purchase obligation pursuant to our Fluids Division’s supply agreements was approximately $113.4 million, including $9.5 million during 2018, $9.5 million during 2019, $9.5 million during 2020, $9.5 million during 2021, $9.5 million during 2022, and $66.2 million thereafter, extending through 2029. Amounts purchased under these agreements for each of the years ended December 31, 2017, 2016, and 2015, was $16.1 million, $13.3 million, and $22.0 million, respectively.
Other Contingencies
During 2011, in connection with the sale of a significant majority of Maritech's oil and gas producing properties, the buyers of the properties assumed the associated decommissioning liabilities pursuant to the purchase and sale agreements. In March 2018, we closed the Maritech Asset Purchase Agreement with Orinoco that provided for the purchase by Orinoco of the Maritech Properties. Also in March 2018, we finalized the Maritech Equity Purchase Agreement with Orinoco, that provided for the purchase by Orinoco of the Maritech Equity Interests. As a result of these transactions, we have effectively exited the businesses of our Offshore Services and Maritech segments and Orinoco assumed all of Maritech's remaining abandonment and decommissioning obligations, For those oil and gas properties Maritech previously operated, the buyers of the properties assumed the financial responsibilities associated with the properties' operations, including abandonment and decommissioning, and generally became the successor operator. Some buyers of these Maritech properties subsequently sold certain of these properties to other buyers who also assumed these financial responsibilities associated with the properties' operations, and these buyers also typically became the successor operator of the properties. To the extent that a buyer of these properties fails to perform the abandonment and decommissioning work required, the previous owner, including Maritech, may be required to perform the abandonment and decommissioning obligation. A significant portion of the decommissioning liabilities that were assumed by the buyers of the Maritech properties in 2011 remains unperformed, and we believe the amounts of these remaining liabilities are significant. We monitor the financial condition of the buyers of these properties from Maritech, and if oil and natural gas pricing levels deteriorate, we expect that one or more of these buyers may be unable to perform the decommissioning work required on the properties acquired from Maritech.
Certain oil and gas producing companies that bought Maritech properties are currently experiencing severe financial difficulties. With regard to certain of these properties, Maritech has security in the form of bonds or cash escrows intended to secure the buyers' obligations to perform the decommissioning work. One company that bought, and subsequently sold, Maritech properties filed for Chapter 11 bankruptcy protection in August 2015. Maritech and its legal counsel continue to monitor the status of these companies. As of December 31, 2017, we do not consider the likelihood of Maritech becoming liable for decommissioning liabilities on sold properties to be probable.
NOTE K — CAPITAL STOCK AND WARRANTS Our Restated Certificate of Incorporation, as amended during 2017, authorizes us to issue 250,000,000
shares of common stock, par value $.01 per share, and 5,000,000 shares of preferred stock, par value $.01 per share. As of December 31, 2017, we had 115,877,704 shares of common stock outstanding, with 2,638,093 shares held in treasury, and no shares of preferred stock outstanding. The voting, dividend, and liquidation rights of the holders of common stock are subject to the rights of the holders of preferred stock. The holders of common stock are entitled to one vote for each share held. There is no cumulative voting. Dividends may be declared and paid on common stock as determined by our Board of Directors, subject to any preferential dividend rights of any then outstanding preferred stock.
Issuances of Common Stock. On June 21, 2016, we completed an underwritten public offering of 11.5 million shares of our common stock, which included 1.5 million shares of common stock pursuant to an option granted to the underwriters to purchase additional shares, at a price to the public of $5.50 per share ($5.2525 per share net of underwriting discounts). We utilized the net offering proceeds of $60.2 million to repay the remaining balance outstanding of certain senior secured notes, to reduce the balance outstanding under our Credit Agreement, to pay offering related discounts and expenses, and for general corporate purposes. The offering was made pursuant to a shelf registration statement filed with the Securities and Exchange Commission on March 23, 2016.
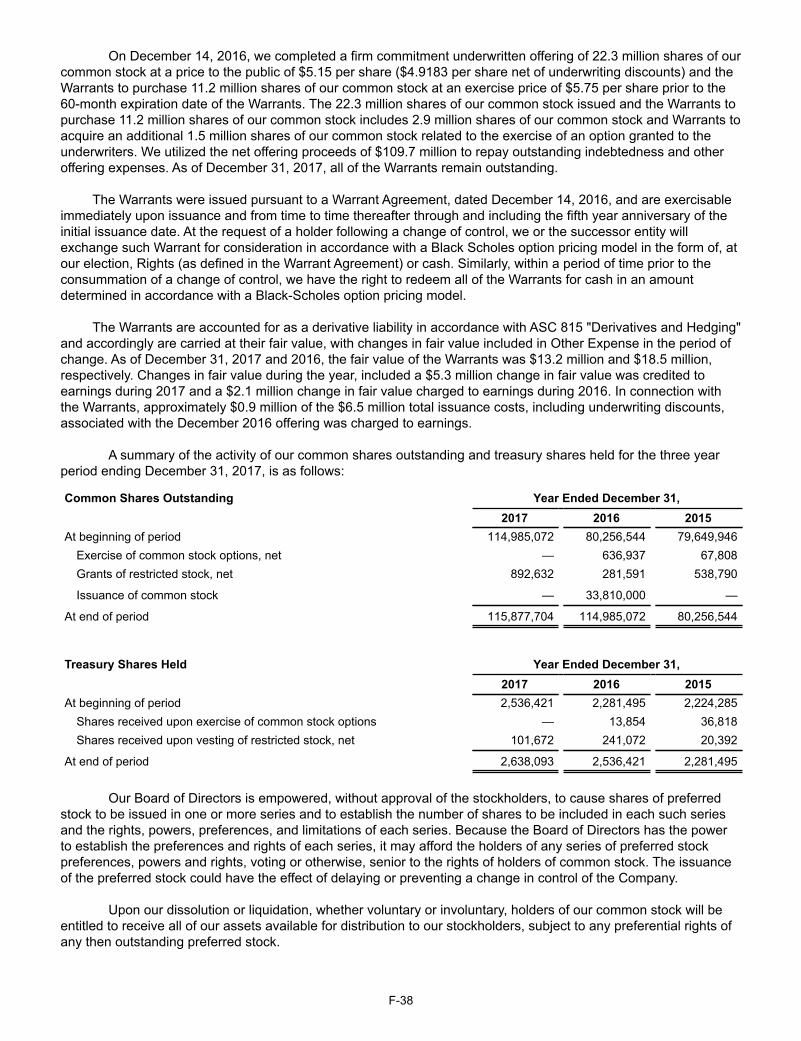
F-38
On December 14, 2016, we completed a firm commitment underwritten offering of 22.3 million shares of our common stock at a price to the public of $5.15 per share ($4.9183 per share net of underwriting discounts) and the Warrants to purchase 11.2 million shares of our common stock at an exercise price of $5.75 per share prior to the 60-month expiration date of the Warrants. The 22.3 million shares of our common stock issued and the Warrants to purchase 11.2 million shares of our common stock includes 2.9 million shares of our common stock and Warrants to acquire an additional 1.5 million shares of our common stock related to the exercise of an option granted to the underwriters. We utilized the net offering proceeds of $109.7 million to repay outstanding indebtedness and other offering expenses. As of December 31, 2017, all of the Warrants remain outstanding.
The Warrants were issued pursuant to a Warrant Agreement, dated December 14, 2016, and are exercisable immediately upon issuance and from time to time thereafter through and including the fifth year anniversary of the initial issuance date. At the request of a holder following a change of control, we or the successor entity will exchange such Warrant for consideration in accordance with a Black Scholes option pricing model in the form of, at our election, Rights (as defined in the Warrant Agreement) or cash. Similarly, within a period of time prior to the consummation of a change of control, we have the right to redeem all of the Warrants for cash in an amount determined in accordance with a Black-Scholes option pricing model.
The Warrants are accounted for as a derivative liability in accordance with ASC 815 "Derivatives and Hedging" and accordingly are carried at their fair value, with changes in fair value included in Other Expense in the period of change. As of December 31, 2017 and 2016, the fair value of the Warrants was $13.2 million and $18.5 million, respectively. Changes in fair value during the year, included a $5.3 million change in fair value was credited to earnings during 2017 and a $2.1 million change in fair value charged to earnings during 2016. In connection with the Warrants, approximately $0.9 million of the $6.5 million total issuance costs, including underwriting discounts, associated with the December 2016 offering was charged to earnings.
A summary of the activity of our common shares outstanding and treasury shares held for the three year period ending December 31, 2017, is as follows:
Common Shares Outstanding Year Ended December 31, 2017 2016 2015At beginning of period 114,985,072 80,256,544 79,649,946
Exercise of common stock options, net — 636,937 67,808Grants of restricted stock, net 892,632 281,591 538,790
Issuance of common stock — 33,810,000 —
At end of period 115,877,704 114,985,072 80,256,544
Treasury Shares Held Year Ended December 31, 2017 2016 2015At beginning of period 2,536,421 2,281,495 2,224,285
Shares received upon exercise of common stock options — 13,854 36,818Shares received upon vesting of restricted stock, net 101,672 241,072 20,392
At end of period 2,638,093 2,536,421 2,281,495
Our Board of Directors is empowered, without approval of the stockholders, to cause shares of preferred
stock to be issued in one or more series and to establish the number of shares to be included in each such series and the rights, powers, preferences, and limitations of each series. Because the Board of Directors has the power to establish the preferences and rights of each series, it may afford the holders of any series of preferred stock preferences, powers and rights, voting or otherwise, senior to the rights of holders of common stock. The issuance of the preferred stock could have the effect of delaying or preventing a change in control of the Company.
Upon our dissolution or liquidation, whether voluntary or involuntary, holders of our common stock will be entitled to receive all of our assets available for distribution to our stockholders, subject to any preferential rights of any then outstanding preferred stock.
F-39
In January 2004, our Board of Directors authorized the repurchase of up to $20.0 million of our common stock. During the three years ending December 31, 2017, we made no purchases of our common stock pursuant to this authorization.
NOTE L — EQUITY-BASED COMPENSATION We have various equity incentive compensation plans which provide for the granting of restricted common
stock, options for the purchase of our common stock, and other performance-based, equity-based compensation awards to our executive officers, key employees, nonexecutive officers, consultants, and directors. Stock options are exercisable for periods of up to ten years. Compensation cost for all share-based payments is based on the grant date fair value and is recognized in earnings over the requisite service period. Total equity-based compensation expense, before tax, for the three years ended December 31, 2017, 2016, and 2015, was $7.8 million, $13.7 million, and $16.9 million, respectively, and is included in general and administrative expense. Total equity-based compensation expense, net of taxes, for the three years ended December 31, 2017, 2016, and 2015, was $5.0 million, $9.5 million, and $13.9 million, respectively. During 2015, we automated the computation of equity-based compensation expense, converting from a manual calculation of the overall impact of forfeitures and vesting on the amount of expense. As a result of this conversion, and performing a retroactive review of equity-based compensation expense for all periods from 2006 to 2015, we recorded a correcting pre-tax adjustment of $6.7 million during the fourth quarter of 2015. Management does not consider the impact of this cumulative adjustment to be material to any individual annual period.
Stock Incentive Plans
The TETRA Technologies, Inc. 1990 Stock Option Plan (the "1990 Plan") was initially adopted in 1985 and subsequently amended to change the name, the number, and the type of options that could be granted, as well as the time period for granting stock options. As of December 31, 2004, no further options may be granted under the 1990 Plan. We granted performance stock options under the 1990 Plan to certain executive officers. These granted options have an exercise price per share of not less than the market value at the date of issuance and are fully vested and exercisable.
During 1996, we adopted the 1996 Stock Option Plan for Nonexecutive Employees and Consultants (the "Nonqualified Plan") to enable us to award nonqualified stock options to nonexecutive employees and consultants who are key to our performance. As of May 2, 2006, no further options may be granted under the Nonqualified Plan.
In May 2006, our stockholders approved the adoption of the TETRA Technologies, Inc. 2006 Equity
Incentive Compensation Plan. Pursuant to the TETRA Technologies, Inc. 2006 Equity Incentive Compensation Plan, we were authorized to grant up to 1,300,000 shares in the form of stock options (including incentive stock options and nonqualified stock options); restricted stock; bonus stock; stock appreciation rights; and performance awards to employees, consultants, and non-employee directors. As a result of the May 2006 adoption and approval of the TETRA Technologies, Inc. 2006 Equity Incentive Compensation Plan, no further awards may be granted under our other previously existing plans. As of May 4, 2008, no further awards may be granted under the TETRA Technologies, Inc. 2006 Equity Incentive Compensation Plan.
In May 2007, our stockholders approved the adoption of the TETRA Technologies, Inc. 2007 Equity
Incentive Compensation Plan. In May 2008, our stockholders approved the adoption of the TETRA Technologies, Inc. Amended and Restated 2007 Equity Incentive Compensation Plan, which among other changes, resulted in an increase in the maximum number of shares authorized for issuance. In May 2010, our stockholders approved further amendments to the TETRA Technologies, Inc. Amended and Restated 2007 Equity Incentive Compensation Plan (renamed as the 2007 Long Term Incentive Compensation Plan) which, among other changes, resulted in an additional increase in the maximum number of shares authorized for issuance. Pursuant to the 2007 Long Term Incentive Compensation Plan, we are authorized to grant up to 5,590,000 shares in the form of stock options (including incentive stock options and nonqualified stock options); restricted stock; bonus stock; stock appreciation rights; and performance awards to employees, consultants, and non-employee directors.
In May 2011, our stockholders approved the adoption of the TETRA Technologies, Inc. 2011 Long Term
Incentive Compensation Plan. Pursuant to this plan, we were authorized to grant up to 2,200,000 shares in the form of stock options, restricted stock, bonus stock, stock appreciation rights, and performance awards to employees, consultants, and non-employee directors. On May 3, 2013, shareholders approved the TETRA Technologies, Inc.
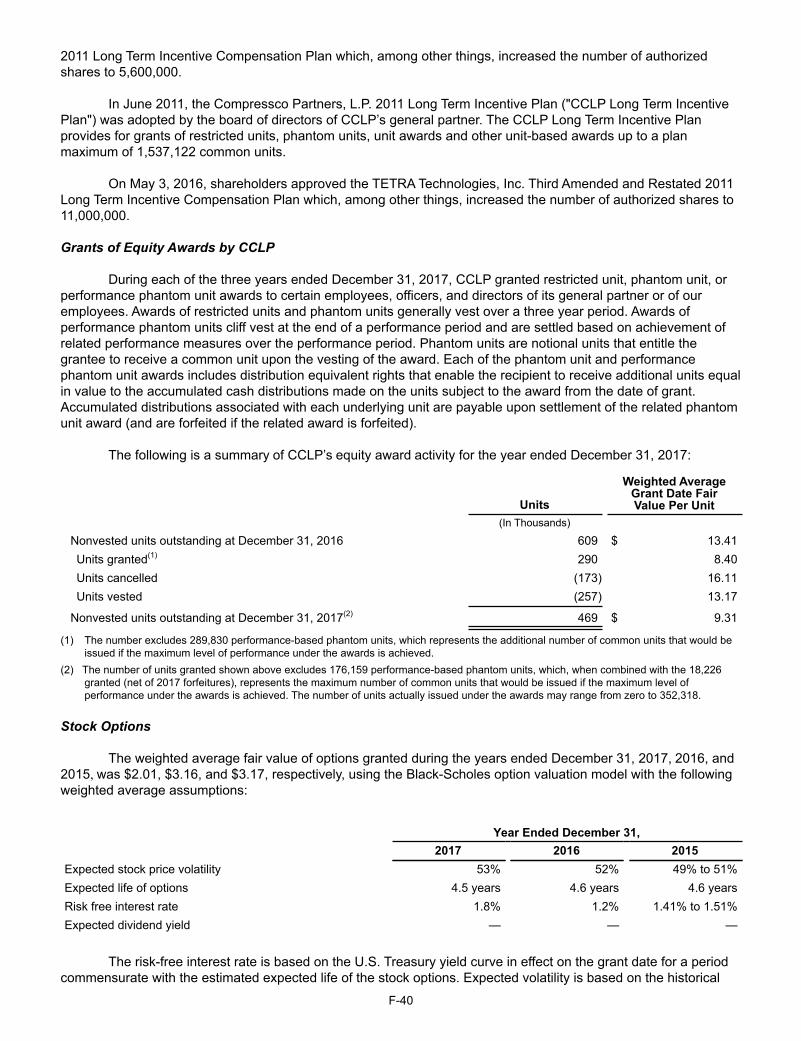
F-40
2011 Long Term Incentive Compensation Plan which, among other things, increased the number of authorized shares to 5,600,000.
In June 2011, the Compressco Partners, L.P. 2011 Long Term Incentive Plan ("CCLP Long Term Incentive
Plan") was adopted by the board of directors of CCLP’s general partner. The CCLP Long Term Incentive Plan provides for grants of restricted units, phantom units, unit awards and other unit-based awards up to a plan maximum of 1,537,122 common units.
On May 3, 2016, shareholders approved the TETRA Technologies, Inc. Third Amended and Restated 2011 Long Term Incentive Compensation Plan which, among other things, increased the number of authorized shares to 11,000,000.
Grants of Equity Awards by CCLP
During each of the three years ended December 31, 2017, CCLP granted restricted unit, phantom unit, or performance phantom unit awards to certain employees, officers, and directors of its general partner or of our employees. Awards of restricted units and phantom units generally vest over a three year period. Awards of performance phantom units cliff vest at the end of a performance period and are settled based on achievement of related performance measures over the performance period. Phantom units are notional units that entitle the grantee to receive a common unit upon the vesting of the award. Each of the phantom unit and performance phantom unit awards includes distribution equivalent rights that enable the recipient to receive additional units equal in value to the accumulated cash distributions made on the units subject to the award from the date of grant. Accumulated distributions associated with each underlying unit are payable upon settlement of the related phantom unit award (and are forfeited if the related award is forfeited).
The following is a summary of CCLP’s equity award activity for the year ended December 31, 2017:
Units
Weighted AverageGrant Date FairValue Per Unit
(In Thousands)
Nonvested units outstanding at December 31, 2016 609 $ 13.41Units granted(1) 290 8.40Units cancelled (173) 16.11Units vested (257) 13.17
Nonvested units outstanding at December 31, 2017(2) 469 $ 9.31
(1) The number excludes 289,830 performance-based phantom units, which represents the additional number of common units that would be issued if the maximum level of performance under the awards is achieved.
(2) The number of units granted shown above excludes 176,159 performance-based phantom units, which, when combined with the 18,226 granted (net of 2017 forfeitures), represents the maximum number of common units that would be issued if the maximum level of performance under the awards is achieved. The number of units actually issued under the awards may range from zero to 352,318.
Stock Options
The weighted average fair value of options granted during the years ended December 31, 2017, 2016, and 2015, was $2.01, $3.16, and $3.17, respectively, using the Black-Scholes option valuation model with the following weighted average assumptions:
Year Ended December 31, 2017 2016 2015Expected stock price volatility 53% 52% 49% to 51%Expected life of options 4.5 years 4.6 years 4.6 yearsRisk free interest rate 1.8% 1.2% 1.41% to 1.51%Expected dividend yield — — —
The risk-free interest rate is based on the U.S. Treasury yield curve in effect on the grant date for a period commensurate with the estimated expected life of the stock options. Expected volatility is based on the historical
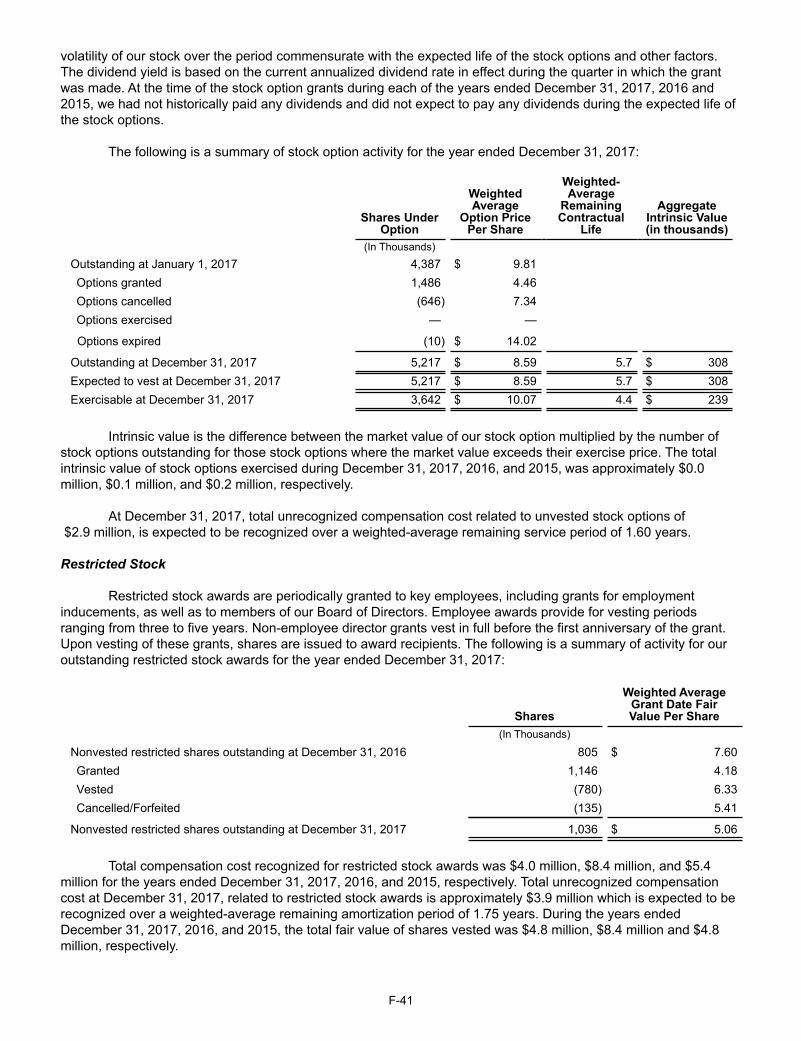
F-41
volatility of our stock over the period commensurate with the expected life of the stock options and other factors. The dividend yield is based on the current annualized dividend rate in effect during the quarter in which the grant was made. At the time of the stock option grants during each of the years ended December 31, 2017, 2016 and 2015, we had not historically paid any dividends and did not expect to pay any dividends during the expected life of the stock options.
The following is a summary of stock option activity for the year ended December 31, 2017:
Shares UnderOption
Weighted Average
Option PricePer Share
Weighted-Average
RemainingContractual
Life
AggregateIntrinsic Value(in thousands)
(In Thousands)Outstanding at January 1, 2017 4,387 $ 9.81Options granted 1,486 4.46Options cancelled (646) 7.34Options exercised — —
Options expired (10) $ 14.02
Outstanding at December 31, 2017 5,217 $ 8.59 5.7 $ 308Expected to vest at December 31, 2017 5,217 $ 8.59 5.7 $ 308Exercisable at December 31, 2017 3,642 $ 10.07 4.4 $ 239
Intrinsic value is the difference between the market value of our stock option multiplied by the number of stock options outstanding for those stock options where the market value exceeds their exercise price. The total intrinsic value of stock options exercised during December 31, 2017, 2016, and 2015, was approximately $0.0 million, $0.1 million, and $0.2 million, respectively.
At December 31, 2017, total unrecognized compensation cost related to unvested stock options of $2.9 million, is expected to be recognized over a weighted-average remaining service period of 1.60 years.
Restricted Stock
Restricted stock awards are periodically granted to key employees, including grants for employment inducements, as well as to members of our Board of Directors. Employee awards provide for vesting periods ranging from three to five years. Non-employee director grants vest in full before the first anniversary of the grant. Upon vesting of these grants, shares are issued to award recipients. The following is a summary of activity for our outstanding restricted stock awards for the year ended December 31, 2017:
Shares
Weighted AverageGrant Date FairValue Per Share
(In Thousands)
Nonvested restricted shares outstanding at December 31, 2016 805 $ 7.60Granted 1,146 4.18Vested (780) 6.33Cancelled/Forfeited (135) 5.41
Nonvested restricted shares outstanding at December 31, 2017 1,036 $ 5.06
Total compensation cost recognized for restricted stock awards was $4.0 million, $8.4 million, and $5.4
million for the years ended December 31, 2017, 2016, and 2015, respectively. Total unrecognized compensation cost at December 31, 2017, related to restricted stock awards is approximately $3.9 million which is expected to be recognized over a weighted-average remaining amortization period of 1.75 years. During the years ended December 31, 2017, 2016, and 2015, the total fair value of shares vested was $4.8 million, $8.4 million and $4.8 million, respectively.

F-42
During 2017, 2016, and 2015, we received 101,669, 254,858 and 57,336 shares, respectively, of our common stock related to the vesting of certain employee restricted stock. Such surrendered shares received by us are included in treasury stock. At December 31, 2017, net of options previously exercised pursuant to our various equity compensation plans, we have a maximum of 3,646,152 shares of common stock issuable pursuant to awards previously granted and outstanding and awards authorized to be granted in the future.
Cash-Settled Stock Appreciation Rights
During the third quarter of 2017, we issued a stand-alone, cash-settled stock appreciation rights ("SAR") award to an executive officer. This award is valued by using the Black Scholes option valuation model and such fair value is recognized based on the portion of the requisite service period satisfied as of each valuation date. The fair valuation of the stock appreciation rights liability is increased by, among other factors, increases in our common stock price, and by increases in the volatility of our common stock price. This stock appreciation rights award is reflected as an accrued liability in our consolidated balance sheet. Increases (or decreases) in the fair value of the stock appreciation rights award will increase (decrease) the associated liability and result in future adjustments to earnings for the associated valuation losses (gains).
The following table presents the 2017 changes in our outstanding SARs and the associated weighted average exercise price:
Number of SARs
Weighted Average Fair
Value
Weighted Average
Exercise Price(In Thousands)
Outstanding at December 31, 2016 — $ — $ — Granted 134 2.94 4.51 Exercised — — — Forfeited — — —
Outstanding at December 31, 2017 134 $ 2.94 $ 4.51
We recognized compensation expense associated with our outstanding SARs of $0.1 million in 2017. Outstanding SARs had total intrinsic values of $0.0 million at year-end 2017.
We used the following assumptions to determine the fair value of the SARs granted in 2017:
Year Ended December 31,2017
Expected stock price volatility 63.2%Expected life of SARs 9.1 yearsRisk free interest rate 2.37%Expected dividend yield —
NOTE M — 401(k) PLAN We have a 401(k) retirement plan (the "Plan") that covers substantially all employees and entitles them to
contribute up to 70% of their annual compensation, subject to maximum limitations imposed by the Internal Revenue Code. We have historically matched 50% of each employee’s contribution up to 6% of annual compensation, subject to certain limitations as outlined in the Plan. Beginning in May 2016, we suspended the matching of employee contributions for an indefinite period. In August 2017, the matching of employee contributions was reinstated. In addition, we can make discretionary contributions which are allocable to participants in accordance with the Plan. Total expense related to our 401(k) plan was $0.9 million, $1.4 million, and $4.2 million in 2017, 2016, and 2015, respectively.
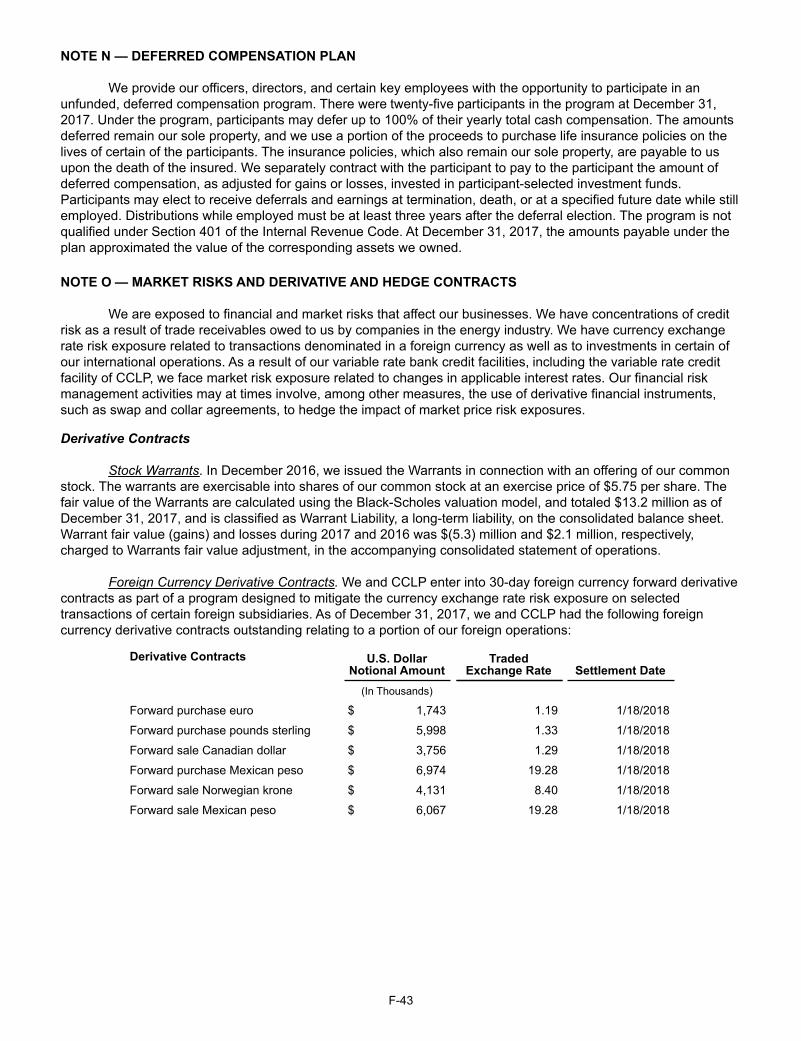
F-43
NOTE N — DEFERRED COMPENSATION PLAN We provide our officers, directors, and certain key employees with the opportunity to participate in an
unfunded, deferred compensation program. There were twenty-five participants in the program at December 31, 2017. Under the program, participants may defer up to 100% of their yearly total cash compensation. The amounts deferred remain our sole property, and we use a portion of the proceeds to purchase life insurance policies on the lives of certain of the participants. The insurance policies, which also remain our sole property, are payable to us upon the death of the insured. We separately contract with the participant to pay to the participant the amount of deferred compensation, as adjusted for gains or losses, invested in participant-selected investment funds. Participants may elect to receive deferrals and earnings at termination, death, or at a specified future date while still employed. Distributions while employed must be at least three years after the deferral election. The program is not qualified under Section 401 of the Internal Revenue Code. At December 31, 2017, the amounts payable under the plan approximated the value of the corresponding assets we owned.
NOTE O — MARKET RISKS AND DERIVATIVE AND HEDGE CONTRACTS We are exposed to financial and market risks that affect our businesses. We have concentrations of credit
risk as a result of trade receivables owed to us by companies in the energy industry. We have currency exchange rate risk exposure related to transactions denominated in a foreign currency as well as to investments in certain of our international operations. As a result of our variable rate bank credit facilities, including the variable rate credit facility of CCLP, we face market risk exposure related to changes in applicable interest rates. Our financial risk management activities may at times involve, among other measures, the use of derivative financial instruments, such as swap and collar agreements, to hedge the impact of market price risk exposures.
Derivative Contracts
Stock Warrants. In December 2016, we issued the Warrants in connection with an offering of our common
stock. The warrants are exercisable into shares of our common stock at an exercise price of $5.75 per share. The fair value of the Warrants are calculated using the Black-Scholes valuation model, and totaled $13.2 million as of December 31, 2017, and is classified as Warrant Liability, a long-term liability, on the consolidated balance sheet. Warrant fair value (gains) and losses during 2017 and 2016 was $(5.3) million and $2.1 million, respectively, charged to Warrants fair value adjustment, in the accompanying consolidated statement of operations.
Foreign Currency Derivative Contracts. We and CCLP enter into 30-day foreign currency forward derivative contracts as part of a program designed to mitigate the currency exchange rate risk exposure on selected transactions of certain foreign subsidiaries. As of December 31, 2017, we and CCLP had the following foreign currency derivative contracts outstanding relating to a portion of our foreign operations:
Derivative Contracts U.S. Dollar Notional Amount
TradedExchange Rate Settlement Date
(In Thousands)
Forward purchase euro $ 1,743 1.19 1/18/2018
Forward purchase pounds sterling $ 5,998 1.33 1/18/2018
Forward sale Canadian dollar $ 3,756 1.29 1/18/2018
Forward purchase Mexican peso $ 6,974 19.28 1/18/2018
Forward sale Norwegian krone $ 4,131 8.40 1/18/2018
Forward sale Mexican peso $ 6,067 19.28 1/18/2018
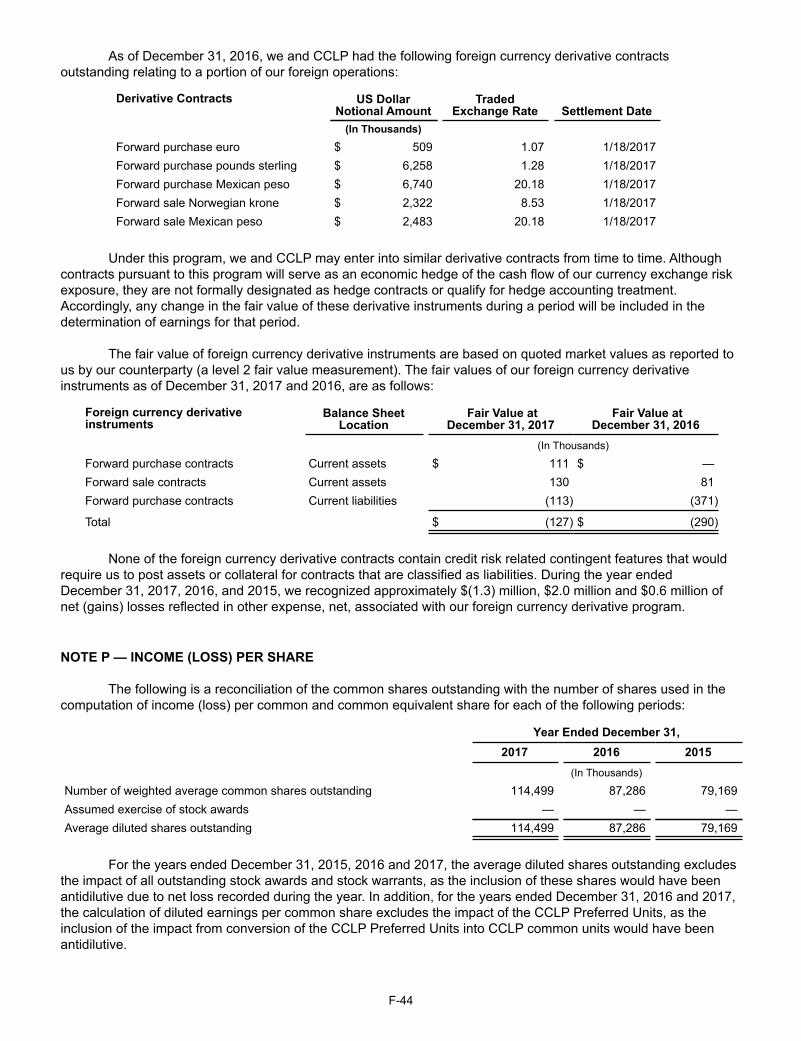
F-44
As of December 31, 2016, we and CCLP had the following foreign currency derivative contracts outstanding relating to a portion of our foreign operations:
Derivative Contracts US Dollar Notional Amount
Traded Exchange Rate Settlement Date
(In Thousands)
Forward purchase euro $ 509 1.07 1/18/2017Forward purchase pounds sterling $ 6,258 1.28 1/18/2017Forward purchase Mexican peso $ 6,740 20.18 1/18/2017Forward sale Norwegian krone $ 2,322 8.53 1/18/2017Forward sale Mexican peso $ 2,483 20.18 1/18/2017
Under this program, we and CCLP may enter into similar derivative contracts from time to time. Although contracts pursuant to this program will serve as an economic hedge of the cash flow of our currency exchange risk exposure, they are not formally designated as hedge contracts or qualify for hedge accounting treatment. Accordingly, any change in the fair value of these derivative instruments during a period will be included in the determination of earnings for that period.
The fair value of foreign currency derivative instruments are based on quoted market values as reported to us by our counterparty (a level 2 fair value measurement). The fair values of our foreign currency derivative instruments as of December 31, 2017 and 2016, are as follows:
Foreign currency derivativeinstruments
Balance SheetLocation
Fair Value at December 31, 2017
Fair Value at December 31, 2016
(In Thousands)
Forward purchase contracts Current assets $ 111 $ —Forward sale contracts Current assets 130 81Forward purchase contracts Current liabilities (113) (371)
Total $ (127) $ (290)
None of the foreign currency derivative contracts contain credit risk related contingent features that would require us to post assets or collateral for contracts that are classified as liabilities. During the year ended December 31, 2017, 2016, and 2015, we recognized approximately $(1.3) million, $2.0 million and $0.6 million of net (gains) losses reflected in other expense, net, associated with our foreign currency derivative program.
NOTE P — INCOME (LOSS) PER SHARE The following is a reconciliation of the common shares outstanding with the number of shares used in the
computation of income (loss) per common and common equivalent share for each of the following periods:
Year Ended December 31, 2017 2016 2015 (In Thousands)
Number of weighted average common shares outstanding 114,499 87,286 79,169Assumed exercise of stock awards — — —Average diluted shares outstanding 114,499 87,286 79,169
For the years ended December 31, 2015, 2016 and 2017, the average diluted shares outstanding excludes
the impact of all outstanding stock awards and stock warrants, as the inclusion of these shares would have been antidilutive due to net loss recorded during the year. In addition, for the years ended December 31, 2016 and 2017, the calculation of diluted earnings per common share excludes the impact of the CCLP Preferred Units, as the inclusion of the impact from conversion of the CCLP Preferred Units into CCLP common units would have been antidilutive.
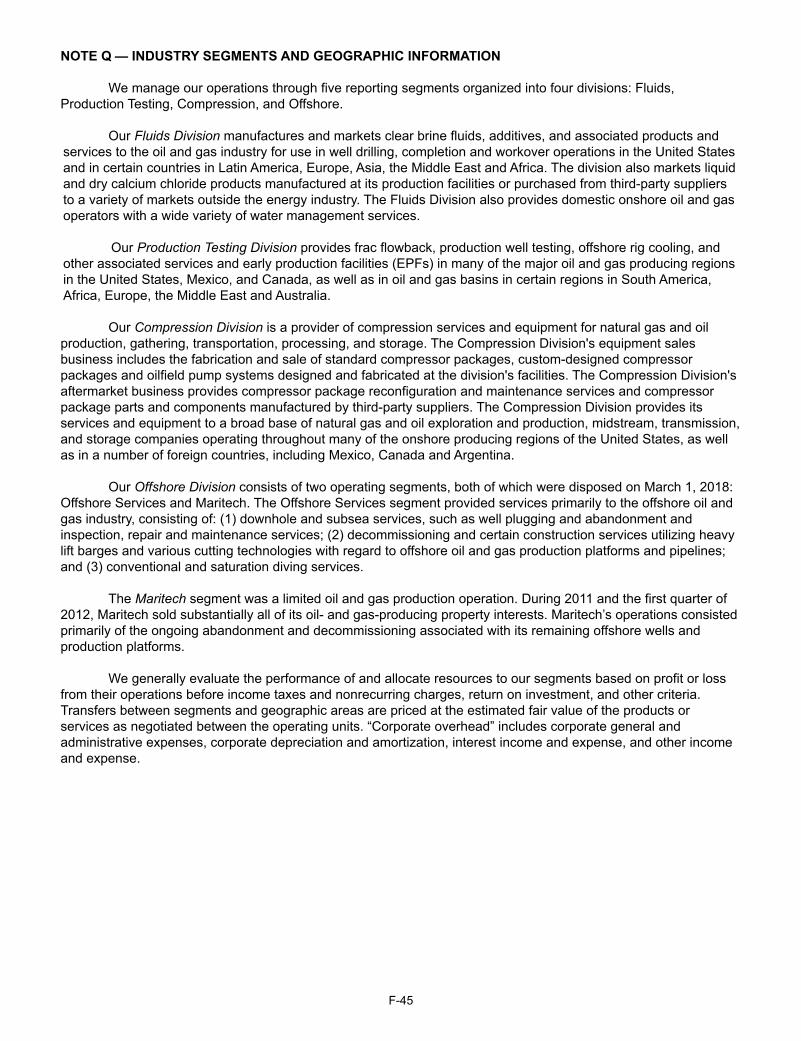
F-45
NOTE Q — INDUSTRY SEGMENTS AND GEOGRAPHIC INFORMATION We manage our operations through five reporting segments organized into four divisions: Fluids,
Production Testing, Compression, and Offshore. Our Fluids Division manufactures and markets clear brine fluids, additives, and associated products and
services to the oil and gas industry for use in well drilling, completion and workover operations in the United States and in certain countries in Latin America, Europe, Asia, the Middle East and Africa. The division also markets liquid and dry calcium chloride products manufactured at its production facilities or purchased from third-party suppliers to a variety of markets outside the energy industry. The Fluids Division also provides domestic onshore oil and gas operators with a wide variety of water management services.
Our Production Testing Division provides frac flowback, production well testing, offshore rig cooling, and other associated services and early production facilities (EPFs) in many of the major oil and gas producing regions in the United States, Mexico, and Canada, as well as in oil and gas basins in certain regions in South America, Africa, Europe, the Middle East and Australia.
Our Compression Division is a provider of compression services and equipment for natural gas and oil production, gathering, transportation, processing, and storage. The Compression Division's equipment sales business includes the fabrication and sale of standard compressor packages, custom-designed compressor packages and oilfield pump systems designed and fabricated at the division's facilities. The Compression Division's aftermarket business provides compressor package reconfiguration and maintenance services and compressor package parts and components manufactured by third-party suppliers. The Compression Division provides its services and equipment to a broad base of natural gas and oil exploration and production, midstream, transmission, and storage companies operating throughout many of the onshore producing regions of the United States, as well as in a number of foreign countries, including Mexico, Canada and Argentina.
Our Offshore Division consists of two operating segments, both of which were disposed on March 1, 2018: Offshore Services and Maritech. The Offshore Services segment provided services primarily to the offshore oil and gas industry, consisting of: (1) downhole and subsea services, such as well plugging and abandonment and inspection, repair and maintenance services; (2) decommissioning and certain construction services utilizing heavy lift barges and various cutting technologies with regard to offshore oil and gas production platforms and pipelines; and (3) conventional and saturation diving services.
The Maritech segment was a limited oil and gas production operation. During 2011 and the first quarter of 2012, Maritech sold substantially all of its oil- and gas-producing property interests. Maritech’s operations consisted primarily of the ongoing abandonment and decommissioning associated with its remaining offshore wells and production platforms.
We generally evaluate the performance of and allocate resources to our segments based on profit or loss from their operations before income taxes and nonrecurring charges, return on investment, and other criteria. Transfers between segments and geographic areas are priced at the estimated fair value of the products or services as negotiated between the operating units. “Corporate overhead” includes corporate general and administrative expenses, corporate depreciation and amortization, interest income and expense, and other income and expense.

F-46
Summarized financial information concerning the business segments is as follows:
Year Ended December 31, 2017 2016 2015 (In Thousands)
Revenues from external customers Product sales
Fluids Division $ 226,606 $ 176,882 $ 306,307Production Testing Division 12,108 — 6,944Compression Division 66,691 71,809 141,461Offshore Division
Offshore Services 760 116 611Maritech 538 751 2,438
Total Offshore Division 1,298 867 3,049Consolidated $ 306,703 $ 249,558 $ 457,761
Services and rentals Fluids Division $ 108,694 $ 69,625 $ 117,459Production Testing Division 80,104 59,509 122,292Compression Division 228,896 239,566 316,178Offshore Division
Offshore Services 95,981 76,506 116,455Maritech — — —Intersegment eliminations — — —
Total Offshore Division 95,981 76,506 116,455Corporate overhead — — —
Consolidated $ 513,675 $ 445,206 $ 672,384
Interdivision revenues Fluids Division $ 31 $ 87 $ 278Production Testing Division 1,930 4,109 4,668Compression Division — — —Offshore Division
Offshore Services — 903 5,128Maritech — — —Intersegment eliminations — (903) (5,128)
Total Offshore Division — — —Interdivision eliminations (1,961) (4,196) (4,946)
Consolidated $ — $ — $ —
Total revenues Fluids Division $ 335,331 $ 246,595 $ 424,044Production Testing Division 94,142 63,618 133,904Compression Division 295,587 311,374 457,639Offshore Division
Offshore Services 96,741 77,525 122,194Maritech 538 751 2,438Intersegment eliminations — (903) (5,128)
Total Offshore Division 97,279 77,373 119,504Corporate overhead — — —Interdivision eliminations (1,961) (4,196) (4,946)
Consolidated $ 820,378 $ 694,764 $ 1,130,145
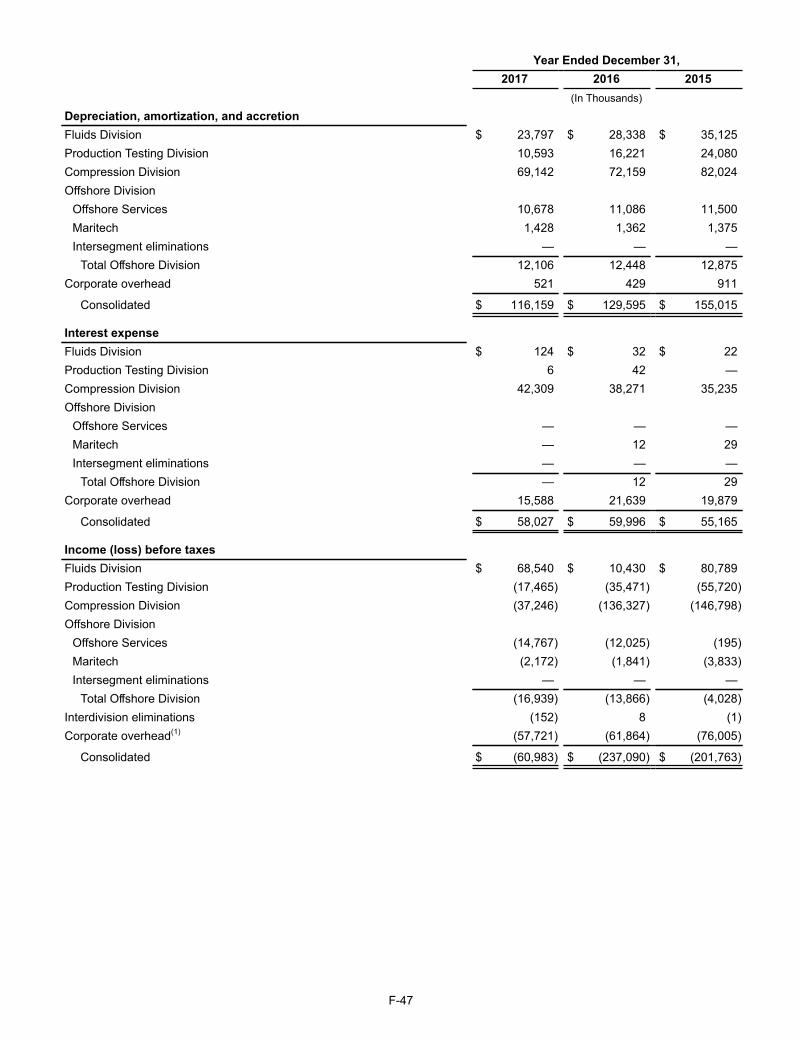
F-47
Year Ended December 31, 2017 2016 2015 (In Thousands)
Depreciation, amortization, and accretion Fluids Division $ 23,797 $ 28,338 $ 35,125Production Testing Division 10,593 16,221 24,080Compression Division 69,142 72,159 82,024Offshore Division
Offshore Services 10,678 11,086 11,500Maritech 1,428 1,362 1,375Intersegment eliminations — — —
Total Offshore Division 12,106 12,448 12,875Corporate overhead 521 429 911
Consolidated $ 116,159 $ 129,595 $ 155,015
Interest expense Fluids Division $ 124 $ 32 $ 22Production Testing Division 6 42 —Compression Division 42,309 38,271 35,235Offshore Division
Offshore Services — — —Maritech — 12 29Intersegment eliminations — — —
Total Offshore Division — 12 29Corporate overhead 15,588 21,639 19,879
Consolidated $ 58,027 $ 59,996 $ 55,165
Income (loss) before taxes Fluids Division $ 68,540 $ 10,430 $ 80,789Production Testing Division (17,465) (35,471) (55,720)Compression Division (37,246) (136,327) (146,798)Offshore Division
Offshore Services (14,767) (12,025) (195)Maritech (2,172) (1,841) (3,833)Intersegment eliminations — — —
Total Offshore Division (16,939) (13,866) (4,028)Interdivision eliminations (152) 8 (1)Corporate overhead(1) (57,721) (61,864) (76,005)
Consolidated $ (60,983) $ (237,090) $ (201,763)
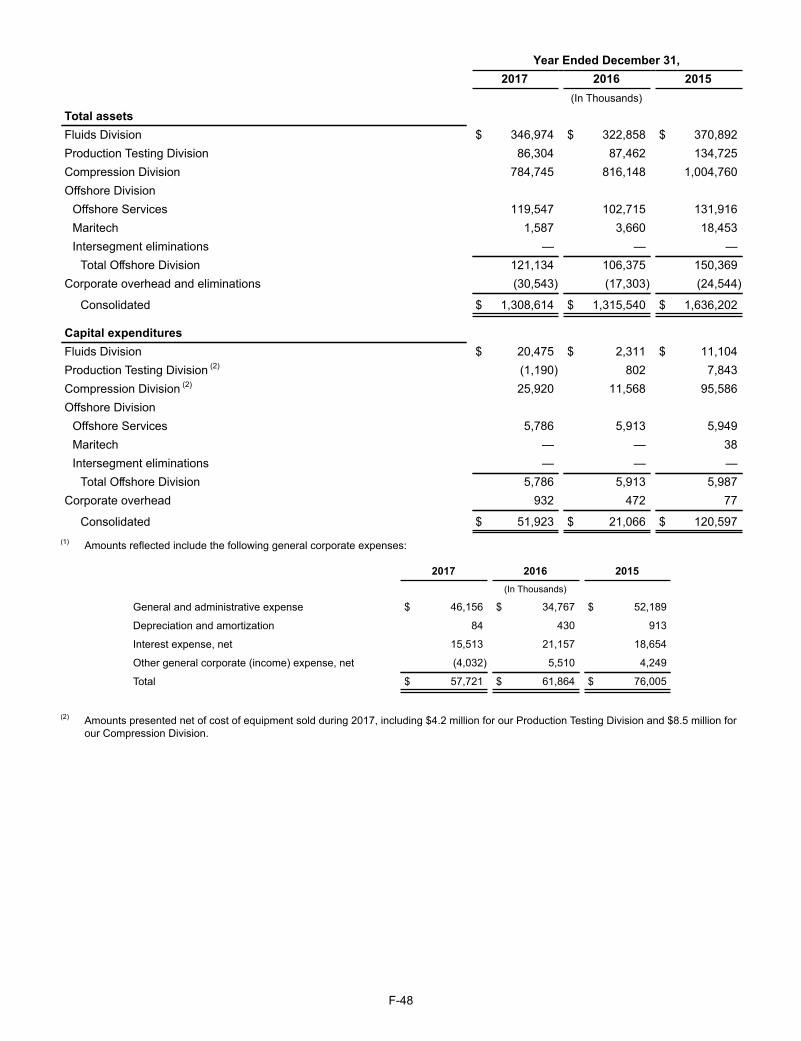
F-48
Year Ended December 31, 2017 2016 2015 (In Thousands)
Total assets Fluids Division $ 346,974 $ 322,858 $ 370,892Production Testing Division 86,304 87,462 134,725Compression Division 784,745 816,148 1,004,760Offshore Division
Offshore Services 119,547 102,715 131,916Maritech 1,587 3,660 18,453Intersegment eliminations — — —
Total Offshore Division 121,134 106,375 150,369Corporate overhead and eliminations (30,543) (17,303) (24,544)
Consolidated $ 1,308,614 $ 1,315,540 $ 1,636,202
Capital expenditures Fluids Division $ 20,475 $ 2,311 $ 11,104Production Testing Division (2) (1,190) 802 7,843Compression Division (2) 25,920 11,568 95,586Offshore Division
Offshore Services 5,786 5,913 5,949Maritech — — 38Intersegment eliminations — — —
Total Offshore Division 5,786 5,913 5,987Corporate overhead 932 472 77
Consolidated $ 51,923 $ 21,066 $ 120,597(1) Amounts reflected include the following general corporate expenses:
2017 2016 2015
(In Thousands)
General and administrative expense $ 46,156 $ 34,767 $ 52,189
Depreciation and amortization 84 430 913
Interest expense, net 15,513 21,157 18,654
Other general corporate (income) expense, net (4,032) 5,510 4,249
Total $ 57,721 $ 61,864 $ 76,005
(2) Amounts presented net of cost of equipment sold during 2017, including $4.2 million for our Production Testing Division and $8.5 million for our Compression Division.
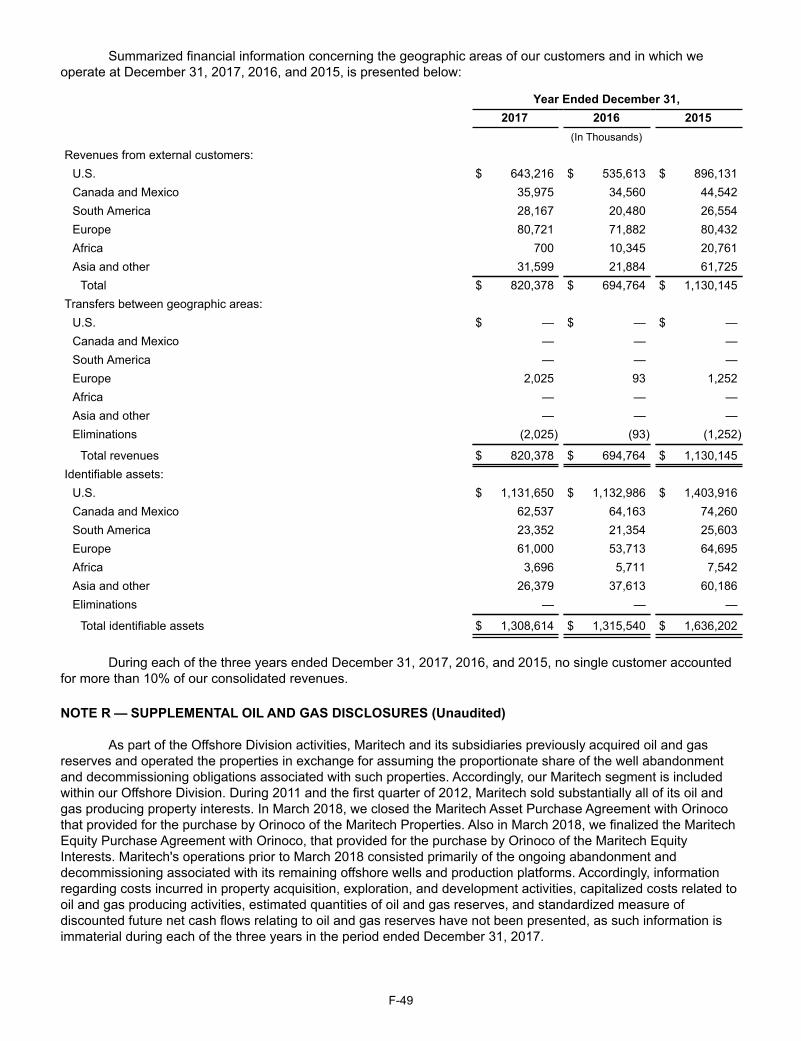
F-49
Summarized financial information concerning the geographic areas of our customers and in which we operate at December 31, 2017, 2016, and 2015, is presented below:
Year Ended December 31, 2017 2016 2015 (In Thousands)
Revenues from external customers: U.S. $ 643,216 $ 535,613 $ 896,131Canada and Mexico 35,975 34,560 44,542South America 28,167 20,480 26,554Europe 80,721 71,882 80,432Africa 700 10,345 20,761Asia and other 31,599 21,884 61,725
Total $ 820,378 $ 694,764 $ 1,130,145Transfers between geographic areas:
U.S. $ — $ — $ —Canada and Mexico — — —South America — — —Europe 2,025 93 1,252Africa — — —Asia and other — — —Eliminations (2,025) (93) (1,252)
Total revenues $ 820,378 $ 694,764 $ 1,130,145Identifiable assets:
U.S. $ 1,131,650 $ 1,132,986 $ 1,403,916Canada and Mexico 62,537 64,163 74,260South America 23,352 21,354 25,603Europe 61,000 53,713 64,695Africa 3,696 5,711 7,542Asia and other 26,379 37,613 60,186Eliminations — — —
Total identifiable assets $ 1,308,614 $ 1,315,540 $ 1,636,202
During each of the three years ended December 31, 2017, 2016, and 2015, no single customer accounted
for more than 10% of our consolidated revenues.
NOTE R — SUPPLEMENTAL OIL AND GAS DISCLOSURES (Unaudited) As part of the Offshore Division activities, Maritech and its subsidiaries previously acquired oil and gas
reserves and operated the properties in exchange for assuming the proportionate share of the well abandonment and decommissioning obligations associated with such properties. Accordingly, our Maritech segment is included within our Offshore Division. During 2011 and the first quarter of 2012, Maritech sold substantially all of its oil and gas producing property interests. In March 2018, we closed the Maritech Asset Purchase Agreement with Orinoco that provided for the purchase by Orinoco of the Maritech Properties. Also in March 2018, we finalized the Maritech Equity Purchase Agreement with Orinoco, that provided for the purchase by Orinoco of the Maritech Equity Interests. Maritech's operations prior to March 2018 consisted primarily of the ongoing abandonment and decommissioning associated with its remaining offshore wells and production platforms. Accordingly, information regarding costs incurred in property acquisition, exploration, and development activities, capitalized costs related to oil and gas producing activities, estimated quantities of oil and gas reserves, and standardized measure of discounted future net cash flows relating to oil and gas reserves have not been presented, as such information is immaterial during each of the three years in the period ended December 31, 2017.
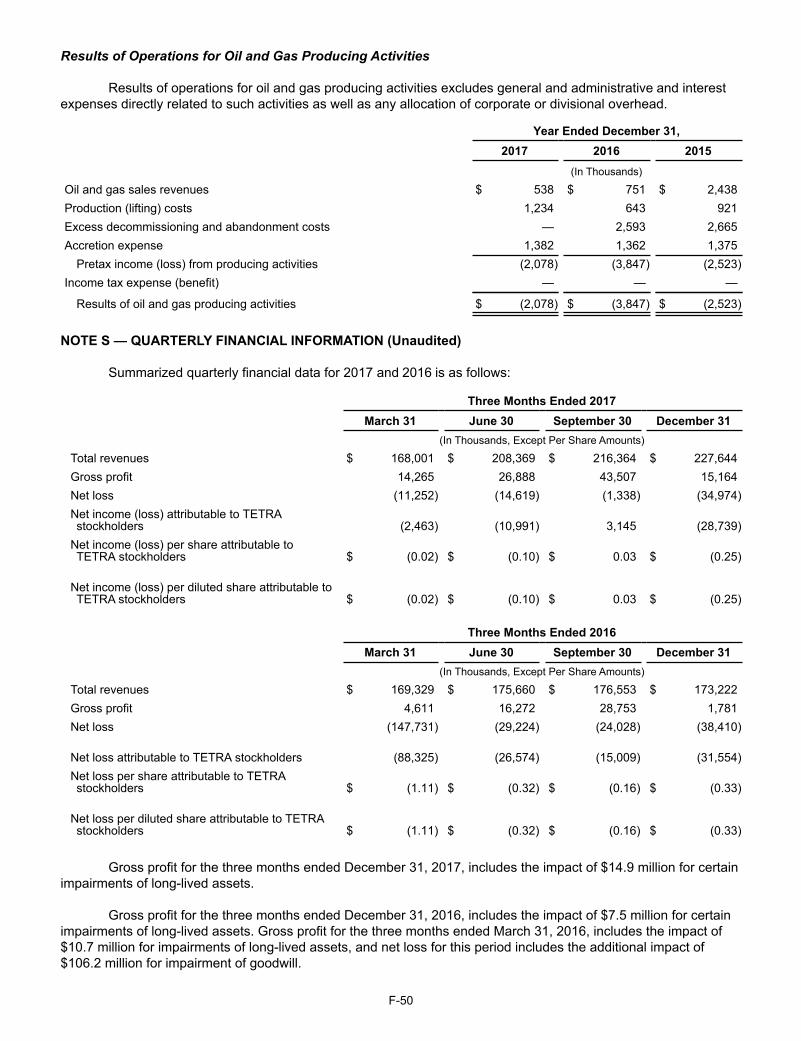
F-50
Results of Operations for Oil and Gas Producing Activities Results of operations for oil and gas producing activities excludes general and administrative and interest
expenses directly related to such activities as well as any allocation of corporate or divisional overhead.
Year Ended December 31, 2017 2016 2015 (In Thousands)
Oil and gas sales revenues $ 538 $ 751 $ 2,438Production (lifting) costs 1,234 643 921Excess decommissioning and abandonment costs — 2,593 2,665Accretion expense 1,382 1,362 1,375
Pretax income (loss) from producing activities (2,078) (3,847) (2,523)Income tax expense (benefit) — — —
Results of oil and gas producing activities $ (2,078) $ (3,847) $ (2,523)
NOTE S — QUARTERLY FINANCIAL INFORMATION (Unaudited) Summarized quarterly financial data for 2017 and 2016 is as follows:
Three Months Ended 2017 March 31 June 30 September 30 December 31 (In Thousands, Except Per Share Amounts)
Total revenues $ 168,001 $ 208,369 $ 216,364 $ 227,644Gross profit 14,265 26,888 43,507 15,164Net loss (11,252) (14,619) (1,338) (34,974)Net income (loss) attributable to TETRAstockholders (2,463) (10,991) 3,145 (28,739)
Net income (loss) per share attributable toTETRA stockholders $ (0.02) $ (0.10) $ 0.03 $ (0.25)
Net income (loss) per diluted share attributable toTETRA stockholders $ (0.02) $ (0.10) $ 0.03 $ (0.25)
Three Months Ended 2016 March 31 June 30 September 30 December 31 (In Thousands, Except Per Share Amounts)
Total revenues $ 169,329 $ 175,660 $ 176,553 $ 173,222Gross profit 4,611 16,272 28,753 1,781Net loss (147,731) (29,224) (24,028) (38,410)
Net loss attributable to TETRA stockholders (88,325) (26,574) (15,009) (31,554)Net loss per share attributable to TETRAstockholders $ (1.11) $ (0.32) $ (0.16) $ (0.33)
Net loss per diluted share attributable to TETRAstockholders $ (1.11) $ (0.32) $ (0.16) $ (0.33)
Gross profit for the three months ended December 31, 2017, includes the impact of $14.9 million for certain
impairments of long-lived assets.
Gross profit for the three months ended December 31, 2016, includes the impact of $7.5 million for certain impairments of long-lived assets. Gross profit for the three months ended March 31, 2016, includes the impact of $10.7 million for impairments of long-lived assets, and net loss for this period includes the additional impact of $106.2 million for impairment of goodwill.
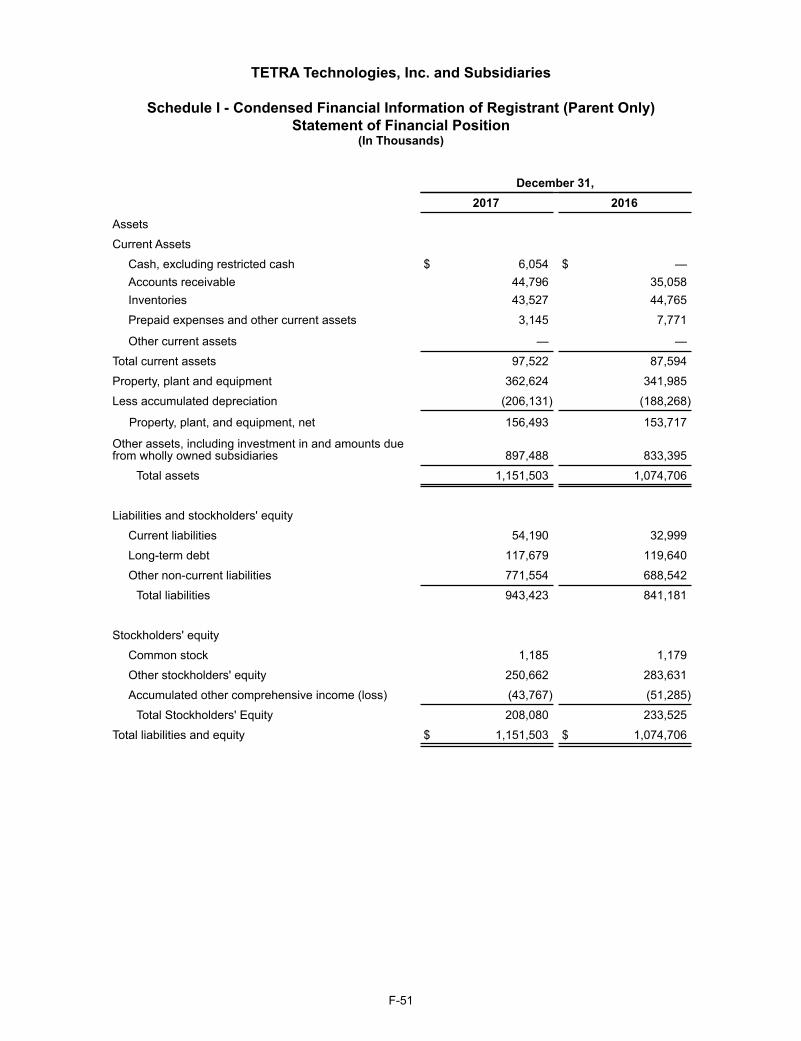
F-51
TETRA Technologies, Inc. and Subsidiaries
Schedule I - Condensed Financial Information of Registrant (Parent Only) Statement of Financial Position
(In Thousands)
December 31,2017 2016
Assets
Current Assets
Cash, excluding restricted cash $ 6,054 $ —Accounts receivable 44,796 35,058Inventories 43,527 44,765
Prepaid expenses and other current assets 3,145 7,771
Other current assets — —
Total current assets 97,522 87,594
Property, plant and equipment 362,624 341,985
Less accumulated depreciation (206,131) (188,268)
Property, plant, and equipment, net 156,493 153,717
Other assets, including investment in and amounts due from wholly owned subsidiaries 897,488 833,395
Total assets 1,151,503 1,074,706
Liabilities and stockholders' equity
Current liabilities 54,190 32,999
Long-term debt 117,679 119,640
Other non-current liabilities 771,554 688,542
Total liabilities 943,423 841,181
Stockholders' equity
Common stock 1,185 1,179
Other stockholders' equity 250,662 283,631
Accumulated other comprehensive income (loss) (43,767) (51,285)
Total Stockholders' Equity 208,080 233,525
Total liabilities and equity $ 1,151,503 $ 1,074,706
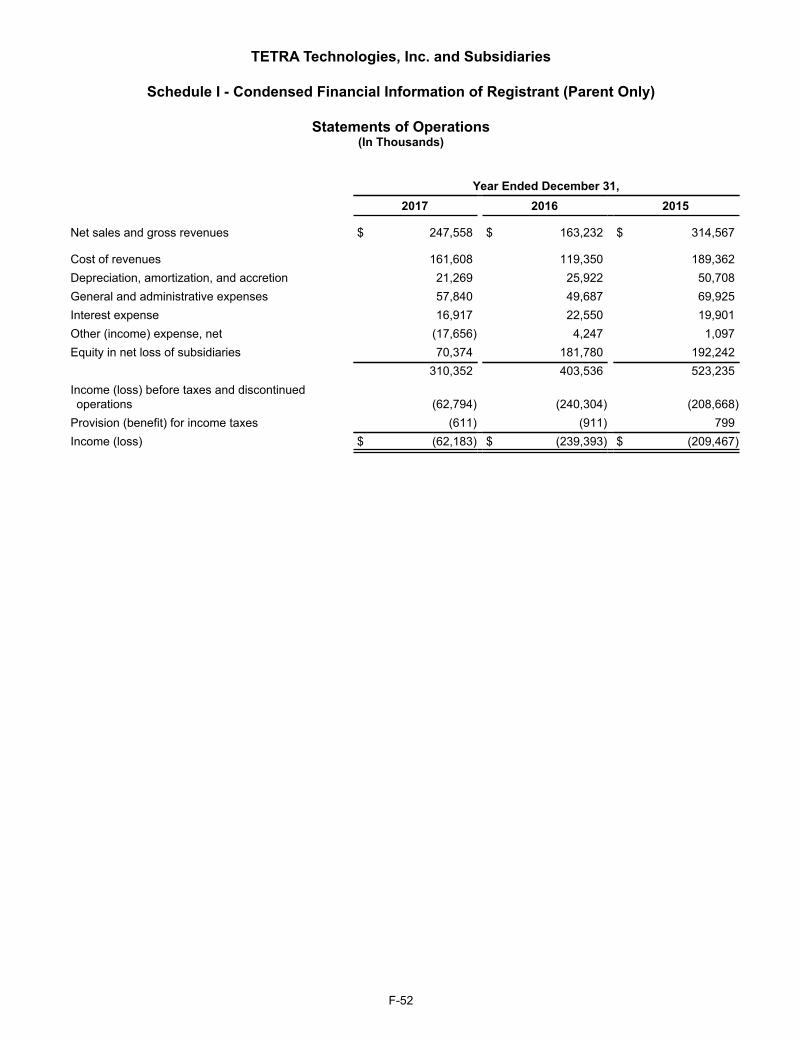
F-52
TETRA Technologies, Inc. and Subsidiaries
Schedule I - Condensed Financial Information of Registrant (Parent Only)
Statements of Operations(In Thousands)
Year Ended December 31,2017 2016 2015
Net sales and gross revenues $ 247,558 $ 163,232 $ 314,567
Cost of revenues 161,608 119,350 189,362Depreciation, amortization, and accretion 21,269 25,922 50,708General and administrative expenses 57,840 49,687 69,925Interest expense 16,917 22,550 19,901Other (income) expense, net (17,656) 4,247 1,097Equity in net loss of subsidiaries 70,374 181,780 192,242
310,352 403,536 523,235Income (loss) before taxes and discontinued operations (62,794) (240,304) (208,668)
Provision (benefit) for income taxes (611) (911) 799Income (loss) $ (62,183) $ (239,393) $ (209,467)
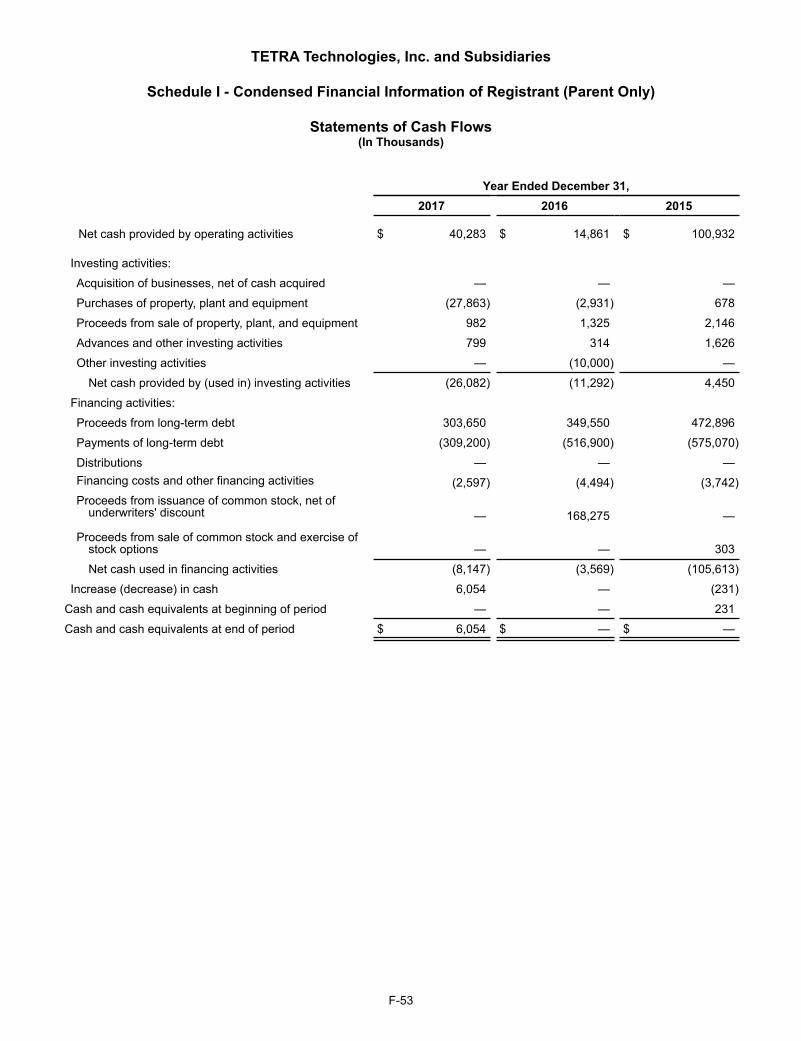
F-53
TETRA Technologies, Inc. and Subsidiaries
Schedule I - Condensed Financial Information of Registrant (Parent Only)
Statements of Cash Flows(In Thousands)
Year Ended December 31,2017 2016 2015
Net cash provided by operating activities $ 40,283 $ 14,861 $ 100,932
Investing activities:
Acquisition of businesses, net of cash acquired — — —
Purchases of property, plant and equipment (27,863) (2,931) 678
Proceeds from sale of property, plant, and equipment 982 1,325 2,146
Advances and other investing activities 799 314 1,626
Other investing activities — (10,000) —
Net cash provided by (used in) investing activities (26,082) (11,292) 4,450
Financing activities:
Proceeds from long-term debt 303,650 349,550 472,896
Payments of long-term debt (309,200) (516,900) (575,070)
Distributions — — —Financing costs and other financing activities (2,597) (4,494) (3,742)Proceeds from issuance of common stock, net of
underwriters' discount — 168,275 —
Proceeds from sale of common stock and exercise of stock options — — 303
Net cash used in financing activities (8,147) (3,569) (105,613)
Increase (decrease) in cash 6,054 — (231)
Cash and cash equivalents at beginning of period — — 231
Cash and cash equivalents at end of period $ 6,054 $ — $ —
F-54
TETRA Technologies, Inc. and Subsidiaries
Schedule I - Condensed Financial Information of Registrant (Parent Only)
NOTE A - BASIS OF PRESENTATION
In the parent-company-only financial statements, the Company's investment in subsidiaries is stated at cost plus equity in undistributed earnings of subsidiaries since the date of the respective acquisition. The Company's share of net income of its unconsolidated subsidiaries is included in consolidated income using the equity method. The parent-company-only financial statements should be read in conjunction with the Company's consolidated financial statements.
Previously reported financial statement information for financial position, results of operations, and cash flows has been modified to conform to the current period presentation.

BOARD OF DIRECTORS
MARK E. BALDWIN (1*)
Retired Executive Vice President and Chief Financial Officer of Dresser-Rand Group, Inc. Director of KBR, Inc. Director of Nine Energy Service Inc. Director of TETRA Technologies, Inc. since 2014.
THOMAS R. BATES, JR. (2*)
Chairman of the Board of Directors of Independence Contract Drilling Inc. Chairman of the Board of Directors of Tidewater Inc. Chairman of the Board of Directors of Vantage Drilling International. Director of Alcer Gold Corporation. Adjunct Professor at the Neely School of Business, Texas Christian University. Director of TETRA Technologies, Inc. since 2011.
STUART M. BRIGHTMANChief Executive Officer of TETRA Technologies, Inc. Chairman of the Board of Directors of CSI Compressco GP Inc. Director of C&J Energy Services, Inc. Director of TETRA Technologies, Inc. since 2009.
PAUL D. COOMBS (1, 3)
Director of Balchem Corporation. Director of CSI Compressco GP Inc. Director of TETRA Technologies, Inc. since 1994.
JOHN F. GLICK (2, 3*)
Retired President, Chief Executive Officer, and a Director of Lufkin Industries, Inc. Chairman of the Board of Directors of Hunting PLC. Vice Chairman of the Board of Directors of CHI St. Luke’s Health. Director of CHI St. Luke’s Memorial Health. Director of TETRA Technologies, Inc. since 2014.
STEPHEN A. SNIDER (2, 3)
Retired President, Chief Executive Officer, and a Director of the general partner of Exterran Partners, L.P. Director of Thermon Group Holdings, Inc. Director of TETRA Technologies, Inc. since 2015.
WILLIAM D. SULLIVAN (Ex-Officio member of each board committee)Chairman of the Board of Directors of TETRA Technologies, Inc. Retired Executive Vice President, E&P, Anadarko Petroleum Corporation. Chairman of the Board of Directors of SM Energy Company. Director of Legacy Reserves GP, LLC. Director of CSI Compressco GP Inc. Director of TETRA Technologies, Inc. since 2007.
KENNETH E. WHITE, JR. (1,2)
Retired President and Chief Operating Officer of Torch Energy Advisors. Director of TETRA Technologies, Inc. since 2002.
JOSEPH C. WINKLER III (1)
Retired Chief Executive Officer and Chairman of the Board of Directors of Complete Production Services, Inc. Director of Hi-Crush Partners LP. Director of Commercial Metals Company. Director of Eclipse Resources Corporation. Director of TETRA Technologies, Inc. since 2015.
EXECUTIVE OFFICERS
STUART M. BRIGHTMANChief Executive Officer
BRADY M. MURPHYPresident and Chief Operating Officer
ELIJIO V. SERRANOSenior Vice President and Chief Financial Officer
BASS C. WALLACE, JR.Senior Vice President and General Counsel
MATTHEW J. SANDERSONSenior Vice President
OWEN A. SERJEANTPresident — CSI Compressco GP Inc.
JAMES H. FUNKEVice President
BEN C. CHAMBERSVice President — Accounting and Controller
ELISABETH K. EVANSVice President — Human Resources
JOSEPH J. MEYERVice President — Finance and Treasurer
STOCKHOLDER INFORMATION
CORPORATE HEADQUARTERSTETRA Technologies, Inc.24955 Interstate 45 NorthThe Woodlands, TX 77380+1 281.367.1983www.tetratec.com
STOCKHOLDER RELATIONS
TETRA Technologies, Inc.24955 Interstate 45 NorthThe Woodlands, TX 77380
TRANSFER AGENT AND REGISTRAR
Computershare Investor Services350 Indiana Street, Suite 800Golden, CO 80401+1 303.262.0600
STOCK LISTING
Shares of common stock of TETRA Technologies, Inc., trade on the New York Stock Exchange under the ticker symbol TTI.
INDEPENDENT AUDITORS
Ernst & Young LLP5 Houston Center1401 McKinney Street, Suite 1200Houston, TX 77010
FORM 10-K
The Company’s Form 10-K for the year ended December 31, 2017, is included in this Annual Report. Additional copies may be obtained free of charge by visiting the Company’s website (www.tetratec.com) or by writing to:Stockholder RelationsTETRA Technologies, Inc.24955 Interstate 45 NorthThe Woodlands, TX 77380
ANNUAL MEETING
The annual meeting of stockholders will be held at 11:00 a.m. local time on Friday, May 4, 2018, at our Corporate Headquarters in The Woodlands, Texas.
DISCLOSURE CERTIFICATION
As required by the NYSE listing standards, Stuart M. Brightman, our Chief Executive Officer, certified on May 22, 2017, that he was not aware of any violation by the Company of NYSE corporate governance listing standards. The certification required by Section 302 of the Sarbanes-Oxley Act was filed with the SEC on March 2, 2018, as an exhibit to our Annual Report on Form 10-K
(1) Member, Audit Committee(2) Member, Compensation Committee(3) Member, Nominating and Corporate Governance Committee(*) Indicates Committee Chairmanship
Copyright ©2018 TETRA Technologies, Inc. All Right Reserved.
The following tables set forth our selected consolidated financial data for the years ended December 31, 2017, 2016, 2015, 2014, and 2013. The selected consolidated financial data does not purport to be complete and should be read in conjunction with, and is qualified by the more detailed information, including the Consolidated Financial Statements and related Notes and “Item 7. Management’s Discussion and Analysis of Financial Condition and Results of Operation” appearing elsewhere in this report. Please read “Item 1A. Risk Factors” for a discussion of the material uncertainties which might cause the selected consolidated financial data not to be indicative of our future financial condition or results of operations. During 2016, 2015, and 2014, we recorded significant impairments of long-lived assets and goodwill. During 2014 and 2013, we recorded significant charges to earnings associated with Maritech's decommissioning liabilities. During 2014, our Compression Division acquired CSI and financed a portion of the $825.0 million purchase price through the issuance of additional common units of CSI Compressco LP and through the issuance of long-term debt. These acquisitions, dispositions, and impairments significantly impact the comparison of our financial statements for 2017 to earlier years.
(1) For the years ended December 31, 2017, 2016, 2015, and 2014, the calculation of average diluted shares outstanding excludes the impact of all outstanding stock options and warrants, as the inclusion of these shares would have been antidilutive due to the net loss recorded during the year.
(2) For the year ended December 31, 2013, the calculation of average diluted shares outstanding excludes the impact of 2,061,534 average outstanding stock options that would have been antidilutive.
FINANCIAL HIGHLIGHTS
Year Ended December 31, 2017 2016 2015 2014 2013
Income Statement Data
Revenues $ 820,378 $ 694,764 $ 1,130,145 $ 1,077,567 $ 909,398
Gross profit 99,824 51,417 189,236 95,044 135,392
General and administrative expense 121,905 115,964 157,812 142,689 131,466
Goodwill impairment — 106,205 177,006 64,295 —
Interest expense, net 57,246 58,626 54,475 34,965 17,982
Other (income) expense, net (18,344) 7,712 1,706 10,965 (13,928)
Loss before taxes (60,983) (237,090) (201,763) (157,871) (128)
Net income (loss)
$
(62,183)
$
(239,393)
$
(209,467)
$
(167,575)
$
3,326
Net income (loss) attributable to TETRA stockholders (39,048) (161,462) (126,183) (169,687) 153
Income (loss) per share, before discontinuedoperations attributable to TETRA stockholders (0.34) (1.85) (1.59) (2.16) —
Average shares outstanding 114,499 87,286 79,169 78,600 77,954
Income (loss) per diluted share, before discontinuedoperations attributable to TETRA stockholders (0.34) (1.85) (1.59) (2.16) —
Average diluted shares outstanding 114,499 (1) 87,286 (1) 79,169 (1) 78,600 (1) 78,840 (2)
December 31, 2017 2016 2015 2014 2013
Balance Sheet Data
Working capital $ 164,640 $ 158,906 $ 168,783 $ 121,476 $ 200,227
Total assets 1,308,614 1,315,540 1,636,202 2,063,522 1,203,786
Long-term debt, net 629,855 623,730 853,228 826,095 384,980
Decommissioning and other long-term liabilities 77,846 78,894 83,548 93,366 48,282
CCLP Series A Preferred Units 61,436 77,062 — — —
Warrant Liability 13,202 18,503 — — —
Equity 352,561 400,466 514,180 765,601 597,498
in thousands, except per share amounts
in thousands
336476_Tetra_AR_CVR_R1.indd 4-6 3/12/18 9:04 PM
TETRA Technologies, Inc. 2017 A
NN
UA
L REPORT
TETRA Technologies, Inc.GLOBAL HEADQUARTERS24955 Interstate 45 NorthThe Woodlands, TX 77380
+1.281.367.1983tetratec.com
ANNUAL REPORT2017
02
01
03 04 05 06
2017 saw the successful completion of a multi-year project in the Gulf of Mexico for a major operator, during which our TETRA CS Neptune® completion fluids system was utilized. This transformational technology is an example of the environmentally friendly, value-added solutions that TETRA is developing for our customers.
TETRA’s Production Testing business delivered a fast-tracked EPF installation for a customer in the Middle East in 2017 by dismantling and reworking a former facility, mobilizing to a new location and engineering and delivering the changes required to achieve the aims of this new customer. This facility was delivered to the mechanical completion stage within three months and handed over to the customer.
Four of our flagship G3516 3-stage 1,380HP compressors are providing gas lift service on a well in Conroe, Texas. All of CSI Compressco’s horsepower categories achieved utilization increases in 2017 as compared to the prior year.
TETRA Advanced Displacement System (TADS™), another innovative completion fluids system, was introduced to the market in 2017 through our TETRA Innovation Group (TIG). The TADS™ fluids system performed well for a Gulf of Mexico customer, successfully demonstrating effective wellbore cleaning performance and water-wetting of tubular surfaces.
TETRA introduced a new water management technology in the Permian Basin in 2017. Our Automated Distribution Manifold is shown efficiently managing two distinct produced water tank batteries at a customer’s reuse facility.
Production of our TETRA CS Neptune® heavy-brine completion fluid was accomplished at our offshore fluids production facility located in Galveston, Texas. TETRA’s new zinc- and formate-free completion fluid is the cost-effective alternative to traditional zinc bromides and cesium formate high-density completion fluids.
01
02
03
04
05
06
ON THE COVER
336476_Tetra_AR_CVR_R1.indd 1-3 3/12/18 9:04 PM