tetracycline resistance gene tet(w) abundances in … · · 2017-02-05tetracycline resistance...
TRANSCRIPT
University of Colorado, BoulderCU Scholar
Undergraduate Honors Theses Honors Program
Spring 2015
Tetracycline resistance gene tet(W) abundances insettled dust of North Carolina residencesEmily E. MorganUndergraduate, [email protected]
Follow this and additional works at: http://scholar.colorado.edu/honr_theses
Part of the Molecular Biology Commons, and the Other Ecology and Evolutionary BiologyCommons
This Thesis is brought to you for free and open access by Honors Program at CU Scholar. It has been accepted for inclusion in Undergraduate HonorsTheses by an authorized administrator of CU Scholar. For more information, please contact [email protected].
Recommended CitationMorgan, Emily E., "Tetracycline resistance gene tet(W) abundances in settled dust of North Carolina residences" (2015).Undergraduate Honors Theses. Paper 938.
Tetracycline resistance gene tet(W) abundances in settled dust of
North Carolina residences
Emily E. Morgan
Spring 2015 Honors Thesis
University of Colorado at Boulder
Dept. of Molecular, Cellular, and Developmental Biology
Defended April 7th, 2015
Advisor: Dr. Noah Fierer Dept. of Ecology and Evolutionary Biology
Honors Council Representative: Dr. Christy Fillman Dept. of Molecular, Cellular, and Developmental Biology
Committee: Dr. Corrella Detweiler Dept. of Molecular, Cellular, and Developmental Biology
ABSTRACT
As antibiotic resistance has become a notable public health issue, increasing studies have
characterized antibiotic resistance genes (ARGs) throughout environments with high risk for
antibiotic resistance, particularly hospitals and confined animal feeding operations (CAFOs).
However, relatively little research has been devoted to studying ARGs in the residential home,
where the risk factors for non-nosocomial antibiotic resistant infections may be assessed. This
study tested for ribosomal protection tetracycline resistance genes tet(O), tet(M), tet(Q), and
tet(W) using PCR on community DNA of 90 homes in North Carolina. Only tet(W) was
detected. Using quantitative PCR (qPCR), the abundance of tet(W) per bacterial genome was
determined, and outdoor sample subsets were found to correlate to total livestock density and
bacterial families Clostridiaceae, Streptococcaceae, and Bacteroidaceae. However, the central
result of this study was the detection of tet(W) in the majority of samples but of none of the other
genes, contrary to studies that find both tet(W) and tet(M) throughout environments unaffected
by human activity.
KEY WORDS
Antibiotic resistance genes; tetracycline; tet(W); residential microbial community
INTRODUCTION
Antimicrobial agents are considered one of the greatest public health achievements of the
20th century (Gandara et al., 2006). However, the spread of antibiotic-resistant microbes through
misuse of such agents in medical institutions and large scale livestock operations has become a
source of global concern for the treatment of human and animal diseases. The CDC reports at
least 23,000 deaths from antibiotic resistant infections annually in the US alone (U.S. Dept. of
Health and Human Services, 2013). Pathogenic bacteria can gain resistance to antibiotics through
horizontal gene transfer of naturally occurring antibiotic resistance genes (ARGs) native to other
microbes or de novo mutations under environmental pressure (Hoffman 2001). An estimated 16
million kg of antibiotic compounds are used annually in the US alone, with about 70% going to
non-therapeutic uses (accurate amounts are hard to obtain due to lack of reporting) (Sarmah et
al., 2006, p. 728). The ubiquitous use of antimicrobial agents in hospitals provides strong
pressure for multi-drug resistance gene selection, and nosocomial antibiotic resistant infections
have become a detrimental public health problem (Schaberg et al., 1991). Over-prescription and
under-dosing of clinical antibiotics foster the spread of ARGs.
In the US, confined animal feeding operations (CAFOs) use antibiotics heavily, not only
for disease treatment, but also prophylactically and as growth promoters (Khan et al. 2008).
These compounds are poorly absorbed and incompletely metabolized in the livestock
gastrointestinal tract, thus the usage of antibiotics in CAFOs selects for ARGs both within the
livestock microbiome and by accumulating antimicrobial compounds in the environment (Khan
et al. 2008). Significantly elevated levels of antibiotic resistant and multidrug resistant bacteria
have been found in the wastewater lagoons of CAFOs often used as crop fertilizer (Hӧlzel 2010;
Peak et al. 2007; Koike et al. 2007), in ground and surface water downstream of CAFOs (West et
al. 2011, Koike et. al., 2007; Sapkota et al. 2007), and in air around and downwind of CAFOs
(Chapin et al. 2005; Gibbs et al. 2006; Alvarado et al. 2012; McEachran et al. 2015). The role of
CAFOs in increasing environmental levels of ARGs in microbes has been established but the
transmission of ARGs originating in CAFOs to human communities has been less characterized.
Antibiotic resistant microbes have been found to colonize previously uncolonized farm
workers and, to a limited degree, neighboring populations (Levy et al., 1976; Armand-Lefevre et
al., 2005; Voss et al. 2005). Antibiotic resistant bacteria have been isolated from commercially
available ground meat (White et al., 2001). Due to a lack of research on indoor air in general,
there are few studies that characterize the extent of ARGs in microbial communities of
residential homes, despite clear evidence for potential health risks from airborne ARGs. Cases of
antibiotic resistant infections like MRSA and VRSA are increasingly being acquired outside of
higher risk environments, like hospitals and prisons (Herold et al., 1998; Elstrøm et al., 2012;
Dufour et al., 2002). However, the work that has studied ARGs in indoor airborne bacteria has
found ARGs have significantly higher concentrations indoor than in outdoor air (Rosas et al.,
1997; Gandara et al., 2006).
This study seeks to examine the presence of genes for antibiotic resistance to a
particularly widely used antibiotic, tetracycline, in the community DNA of settled dust in
residential homes of North Carolina. Three main questions are sought to be answered by this
study: 1) whether there is a significant difference between indoor and outdoor tetracycline
resistance gene abundances, 2) if the amount of tetracycline resistance can be predicted by home
location, and 3) whether the abundances of bacterial families by sample can be used to predict
the source of tetracycline resistance genes. Characterizing differences between indoor and
outdoor levels is important in determining which factors are most relevant to community
exposure to ARGs. Whether the indoor bacterial ARGs, the community that occupants of homes
likely have a greater contact to, are driven the outdoor community, that is factors of the location
of the home, or driven by behaviors like vocation or purchase of agricultural goods is important
in targeting the sources of antibiotic resistant disease.
Methods of molecular biology were used to address these questions – namely quantitative
PCR (qPCR) for determination of amount of ARGs and direct PCR and high throughput
sequencing of a portion of the 16S rRNA gene to assess bacterial community composition of
each collected dust sample. A large portion of previous studies have cultured bacteria to
determine the presence of ARGs (Rosas et al., 1997; Gandara et al., 2006), but these methods are
not amenable to the efficient characterization of ARGs across a broad range of bacteria, like
obligate anaerobes. The molecular method of qPCR includes the entire microbial community and
makes gene detection precise and rapid (Koike et al., 2007, p. 4814). Bioinformatic techniques
were then be used to efficiently compare sample descriptors with levels of ARGs.
Tetracycline resistance genes were chosen as the focus of this study because of the high
prevalence of tetracycline in the environment. Tetracycline, a broad spectrum antibiotic, is used
for all USDA approved antibiotic use categories in U.S. CAFOs (growth promotion, prophylaxis,
and treatment of infections), it is commonly prescribed for human infections, and resistance
against it has been well characterized previously (Macauley et al., 2007, p. 1307; Peak et al.,
2006). Tetracycline resistance occurs either by a ribosomal protection protein (RPP) or an efflux
pump protein (Chopra & Roberts, 2001). RPP encoding genes tet(O), tet(M), tet(Q), and tet(W),
often found to be more abundant than efflux genes, were quantified with quantitative PCR
(qPCR) due to their previously described presence in CAFOs and indoor settings (Macauley et
al., 2007; Peak et al., 2006; Koike et al., 2007; Macovei & Zurek, 2006; Wang et al., 2005).
Storteboom et al. (2010) found tet(M) and tet(W) to be present across a “pristine” environment,
CAFOs, and wastewater treatment plants (WWTPs) but in lesser frequencies and with distinct
sequences from CAFOs and WWTPs in the pristine environment. tet(Q) was found to be highly
correlated to CAFOs and tet(O) related to WWTPs. Thus, these four particular genes have been
shown to be useful indicators the source environments of ARGs.
Hypothesized results of this study were that the indoor samples would have a differently
structured bacterial community and higher levels of resistance than the outdoor due to behaviors
like shaking bed sheets and drapes and previous findings of higher antibiotic resistance indoors
(Gandara et al., 2006). The outdoor samples particularly of homes at a location of high livestock
density were expected to have higher overall levels of ARGs with tet(Q) presence compared to
those in a low density livestock area. Phylotypes having previously been shown to have
tetracycline resistance genes are expected to have high abundances in samples with high
abundance of tetracycline resistance.
Among the four tetracycline resistance genes screened for, only tet(W) was detected. The
sample exhibited variable abundance of tet(W) per bacterial genome equivalent, from 0 to 2 and
outliers around 5 and 6 tet(W) copies per bacterial genome. Although indoor and outdoor
proportional tet(W) abundances were not significantly different across the homes with both data
(n = 31), they did not exhibit the same trends with environmental factors. The proportional
tet(W) abundances of the outdoor subset were significantly correlated to total livestock density
by county and three bacterial family abundances previously described to have tet(W) containing
strains, but the same trend was not seen in the indoor subset. Because of the prevalence of tet(W)
in so called pristine environments as well as those affected by human institutions, it is difficult to

differentiate the possible source of resistance. However, the fact that tet(W) alone among tet(O),
tet(M), tet(Q), and tet(W) was detected is significant and a site for further study.
MATERIALS & METHODS
Sampling. A subset of samples from the Wild Life of Our Homes project
(homes.yourwildlife.org), a citizen science project across North America, were used in this
study. Over a thousand participants were recruited through the website, social media, and email
campaigns from January 2012 to March 2013. Participants instructed to use a microbe sampling
kit containing dual-tipped sterile BBLTM CultureSwabsTM and provided a written Informed
Consent form approved by North Carolina State University’s Human Research Committee
(Approval No. 2177). This study focuses on dust samples that participants collected from the
upper door trim of an exterior door, one the outside and inside surface. This sampling location
was chosen because it is found in every home, unlikely to be cleaned frequently, and serves as a
passive collector of aerosols and dust with little to no direct contact from home occupants.
Participants returned swabs over the period March 2012 to May 2013 by first-class mail. The
swabs were then stored in a -20 ºC freezer until processed. The samples used in this study were
the subset from North Carolina because of the state’s exceptionally high density of CAFOs –
North Carolina is the second state in the US for swine sales
(2012 Census of Agriculture), but also because of the large
number of participants in North Carolina (n=90 for this
study).
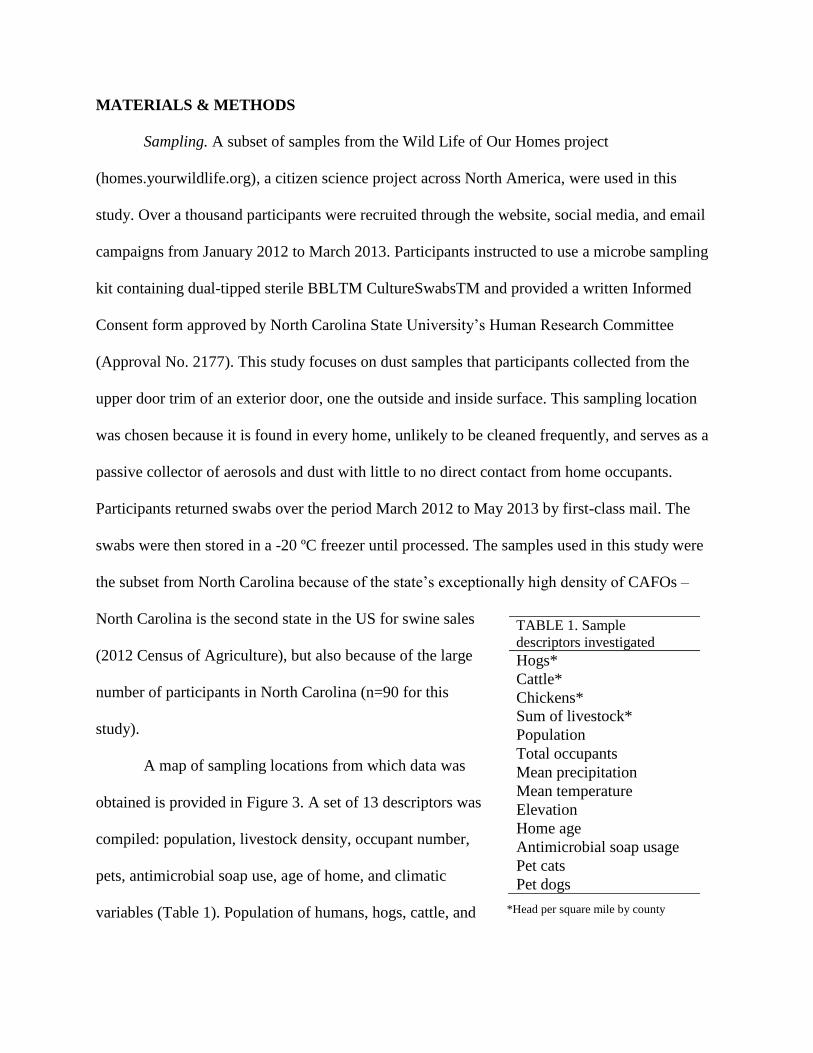
A map of sampling locations from which data was
obtained is provided in Figure 3. A set of 13 descriptors was
compiled: population, livestock density, occupant number,
pets, antimicrobial soap use, age of home, and climatic
variables (Table 1). Population of humans, hogs, cattle, and
TABLE 1. Sample
descriptors investigated
Hogs*
Cattle*
Chickens*
Sum of livestock*
Population
Total occupants
Mean precipitation
Mean temperature
Elevation
Home age
Antimicrobial soap usage
Pet cats
Pet dogs
*Head per square mile by county
chickens for all sampled locations were obtained from the 2012 U.S. Census Bureau data
(www.census.gov).
Characterization of Community Tetracycline Resistance. DNA was extracted from swabs
using a MoBio PowerSoil-htp Soil DNA Isolation Kit (MoBio Inc., Carlsbad, CA) by placing
one of the two swabs in a single bead tube under sterile conditions as previously described
(Fierer et al., 2008; Leff & Fierer, 2013). PCR was performed as a screen for ARGs tet(O),
tet(M), tet(Q), and tet(W) using previously described primers (Aminov et al., 2001) for a marker
sequence and amplification programs as follows: 94 °C 5 min, 40 cycles of (94 °C 30 s,
annealing temp 30 s, 72 °C 30 s), 72 °C 7 min, 4 °C hold (Table 2). PCR was also performed
with 515F (GTGCCAGCMGCCGCGGTAA) and 806R (GGACTACHVGGGTWTCTAAT)
primers used to amplify the V4-V5 region of bacterial and archaeal 16S rRNA genes to ensure
DNA extraction was successful (Caporaso et al., 2013). The 16S targeting PCR program was as
follows: 94 °C for 3 min, 35 cycles of (94 °C 45 s, 50 °C 1 min, 72 °C 1.5 min), 72 °C 10 min,
and a 4 °C hold. PCR reactions for tet genes were performed with 12.5 μL 2× ProMega GoTaq
Colorless Master Mix (ProMega Corp., Madison, WI), 0.5 μL of each appropriate F and R
primer, (1 μL total, starting concentration 10 μM), 9.5 μL of PCR-grad water, and 2 μL DNA
template, and for 16S with 12.5 μL 2× ProMega GoTaq Colorless Master Mix (ProMega Corp.,
Madison, WI), 0.5 μL of each appropriate F and R primer, (1 μL total, starting concentration 10
μM), 10.5 μL of PCR-grad water, and 1 μL DNA template. Negative controls were included to
test for contamination. After amplification, reactions were visualized on an agarose gel along
with negative controls.
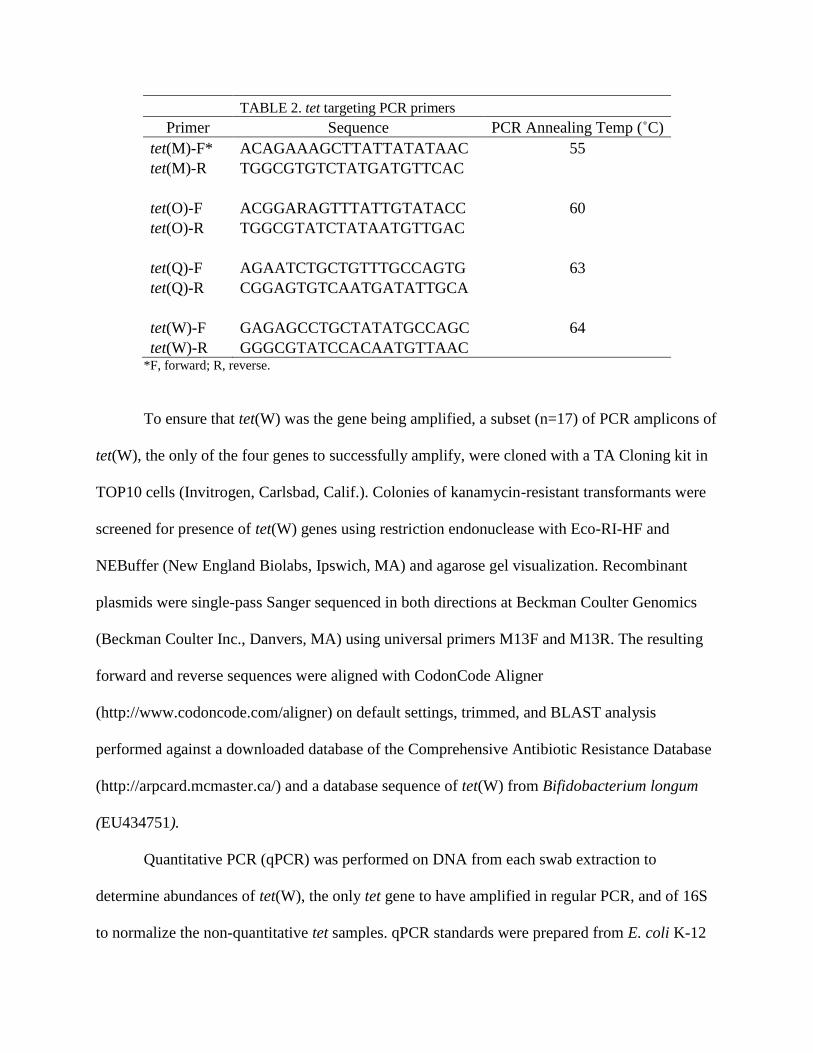
TABLE 2. tet targeting PCR primers
Primer Sequence PCR Annealing Temp (˚C)
tet(M)-F* ACAGAAAGCTTATTATATAAC 55
tet(M)-R TGGCGTGTCTATGATGTTCAC
tet(O)-F ACGGARAGTTTATTGTATACC 60
tet(O)-R TGGCGTATCTATAATGTTGAC
tet(Q)-F AGAATCTGCTGTTTGCCAGTG 63
tet(Q)-R CGGAGTGTCAATGATATTGCA
tet(W)-F GAGAGCCTGCTATATGCCAGC 64
tet(W)-R GGGCGTATCCACAATGTTAAC *F, forward; R, reverse.
To ensure that tet(W) was the gene being amplified, a subset (n=17) of PCR amplicons of
tet(W), the only of the four genes to successfully amplify, were cloned with a TA Cloning kit in
TOP10 cells (Invitrogen, Carlsbad, Calif.). Colonies of kanamycin-resistant transformants were
screened for presence of tet(W) genes using restriction endonuclease with Eco-RI-HF and
NEBuffer (New England Biolabs, Ipswich, MA) and agarose gel visualization. Recombinant
plasmids were single-pass Sanger sequenced in both directions at Beckman Coulter Genomics
(Beckman Coulter Inc., Danvers, MA) using universal primers M13F and M13R. The resulting
forward and reverse sequences were aligned with CodonCode Aligner
(http://www.codoncode.com/aligner) on default settings, trimmed, and BLAST analysis
performed against a downloaded database of the Comprehensive Antibiotic Resistance Database
(http://arpcard.mcmaster.ca/) and a database sequence of tet(W) from Bifidobacterium longum
(EU434751).
Quantitative PCR (qPCR) was performed on DNA from each swab extraction to
determine abundances of tet(W), the only tet gene to have amplified in regular PCR, and of 16S
to normalize the non-quantitative tet samples. qPCR standards were prepared from E. coli K-12

(for 16S rRNA) and extracted plasmid DNA of a sequenced clone described above (for tet). The
standards’ concentration was determined with a QuantiT PicoGreen dsDNA assay (Invitrogen
Life Technologies, Grand Island, NY), and a standard curve for each 96-well qPCR plate was
generated with seven 10-fold dilutions. Because of E. coli standard, the 16S rRNA gene results
are in relation to E. coli genome equivalents as an estimate of total bacterial cells to normalize tet
values. The primers described above were used (Table 2). Each reaction was comprised of 12.5
μL 2× qPCR mix (Absolute QPCR SYBR Green Mix, no ROX, Fermentas Inc., Boston, MA),
1.25 μL of the respective F and R primers (2.5 μL total, 10 μM starting concentration), 5 μL of
PCR-grade water, and 5 μL of template DNA. Triplicate qPCR reactions were run for each
dilution of the appropriate standard and for each swab sample on a Mastercycler ep realplex
thermal cycler (Eppendorf, Hamburg, Germany) in 96-well plates. Cycler conditions for tet(W)
were as described above with an initial step of 95 °C 15 min and conditions for 16S were as
described above with an initial 95 °C 15 min and 40 cycles instead of 35. The estimated copy
number of tet(W) and genome copy number of 16S was obtained from comparisons to the
appropriate standard curve. The lower detection limit of this method was set to 100 copies. This
study reports the ratio of tet(W) copies to E. coli genome copy numbers. Due to loss of sample
DNA in thermal cycler malfunctions, the number of samples for downstream analysis was 70
indoor and 40 outdoor.
Determination of Community Taxa. The second of the two swabs for each sample was
prepared for high-throughput sequencing with direct PCR technique described previously
(Flores, Henley, & Fierer, 2012). Swab tips with appropriate negative controls were loaded
directly into 2 mL 96-well plates (Axygen Inc.) and were processed using Extract-N-Amp PCR
kit (Sigma-Aldrich, Inc.) using a modified version of the manufacturers’ instructions. Following
the addition of 250 μL of the Extract-N-Amp Extraction solution, the plate was sealed securely
with a 96 round well Impermamat Silicon Sealing Mat (Axygen, Inc.) and heated at 90 ºC for 10
minutes in a dry bath. Next, extract-N-Amp Dilution solution was added to the wells at a 1:1
ratio to the extraction solution and mixed gently by pipetting. The plate was resealed with the
mat and stored at 4 ºC. Then, 20 μL triplicate reactions per sample were conducted using 10 μL
of Extract-N-Amp Ready Mix, 1 μL of the forward and reverse primers, 5 μL of PCR-grade
water, and 4 μL of the Extract-N-Amp sample solutions from the 96-well plate. High-throughput
sequencing methods were used to assess microbial diversity by the variation in marker gene
sequences. The same 515F/806R primers described above were used but appropriate Illumina
adapters were added as well as an error-correcting 12-bp barcode unique to each sample on
reverse primers to permit multiplexing of samples. The PicoGreen dsDNA assay was used to
quantify PCR products of all samples. The samples were pooled in equimolar concentrations for
sequencing on either an Illumina HiSeq or MiSeq instrument (Illumina Inc., San Diego, CA).
Sequencing runs were performed at the University of Colorado Next Generation Sequencing
Facility.
High-Throughput Sequence Processing. A custom Python script
(https://github.com/leffj/helper-code-for-uparse), with quality filtering and phylotype clustering,
was conducted to demultiplex the 100-bp sequences using the UPARSE pipeline (Edgar, 2013).
Prior to phylotype determination, sequences were dereplicated and singletons were removed.
Phylotype taxonomy was determined using the Greengenes 13 8 database for 16S rRNA
sequences as previously described (McDonald et al., 2012; Flores, Henley, & Fierer, 2012).
Direct PCR reagent contamination was controlled for by removing Mycoplasma, Pseudomonas,
Serratia, mitochondrial, and chloroplast classified sequences as well as any phylotypes present in
25% or more of the negative controls (Flores, Henley, & Fierer, 2012). To account for potential
amplicon sequencing biases, samples with less than 10,000 sequences were removed and the
remaining sequences were normalized and rarified to 10,000 sequences per sample as previously
described (Paulson et al., 2013).
Statistical Analyses. Comparisons of tet(W) abundances to bacterial genome abundances
as well as proportional tet(W) abundances to sample descriptors were performed. The tet(W)
abundances were divided by bacterial genome abundances to obtain proportional tet(W)
abundances. Linear regression analysis was run for tet(W) abundance to bacterial genome
abundance. A paired t test was carried out on the home samples with both indoor and outdoor
proportional tet(W) abundance data. Linear regression analysis was used to compare each sample
descriptors to proportional tet(W) abundances for indoor and outdoor samples.
All further analyses were performed in in the R environment (www.r-project.org).
Sample locations by proportional tet(W) abundances were mapped by inverse distance weighting
interpolation using the gstat package (https://r-forge.r-project.org/projects/gstat/). A list of
bacterial species found to have the tet(W) gene was compiled for a targeted comparison to the
bacterial phylotypic abundances (Table 3). A BLAST search of the top 10,000 matches to B.
longum tet(W) reference sequence (EU434751) was performed using the NCBI database. All
sequences that did not match ≥ 97% were removed as well as all uncultured representatives and
replicates by species. Spearman correlations with a false detection rate correction were run
between proportional tet(W) abundances and the 11 families known to have tet(W) carrying
strains.
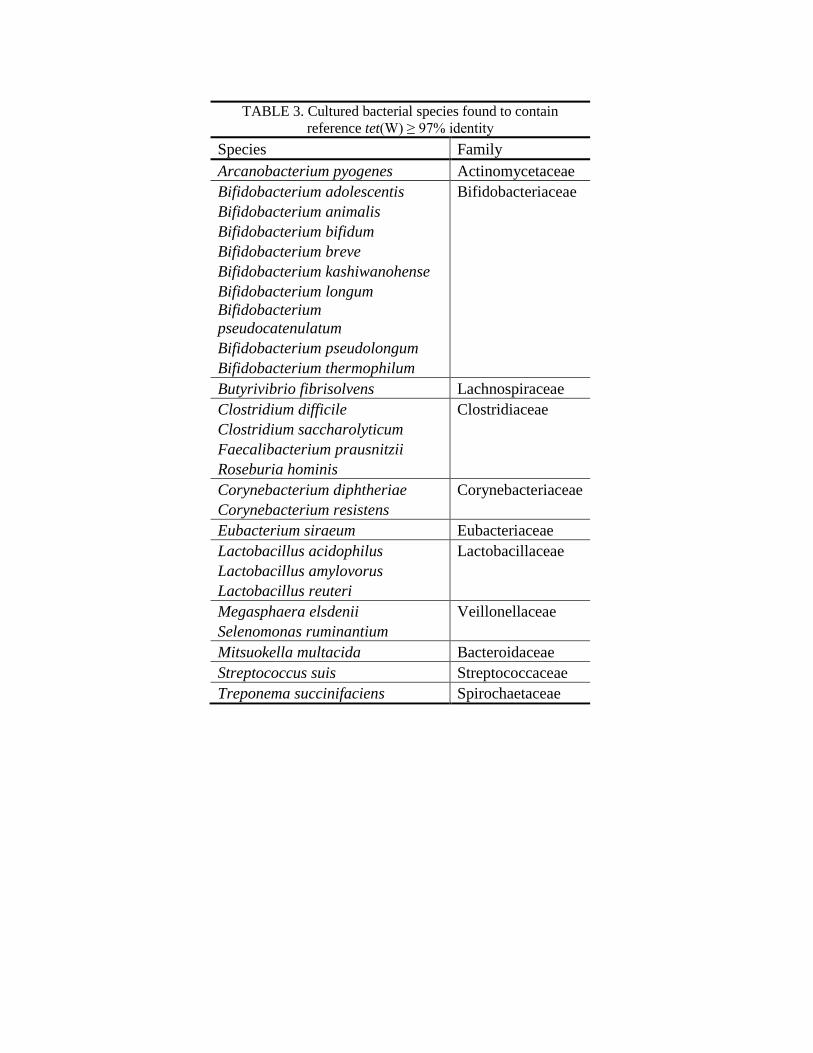
TABLE 3. Cultured bacterial species found to contain
reference tet(W) ≥ 97% identity
Species Family
Arcanobacterium pyogenes Actinomycetaceae
Bifidobacterium adolescentis Bifidobacteriaceae
Bifidobacterium animalis
Bifidobacterium bifidum
Bifidobacterium breve
Bifidobacterium kashiwanohense
Bifidobacterium longum
Bifidobacterium
pseudocatenulatum
Bifidobacterium pseudolongum
Bifidobacterium thermophilum
Butyrivibrio fibrisolvens Lachnospiraceae
Clostridium difficile Clostridiaceae
Clostridium saccharolyticum
Faecalibacterium prausnitzii
Roseburia hominis
Corynebacterium diphtheriae Corynebacteriaceae
Corynebacterium resistens
Eubacterium siraeum Eubacteriaceae
Lactobacillus acidophilus Lactobacillaceae
Lactobacillus amylovorus
Lactobacillus reuteri
Megasphaera elsdenii Veillonellaceae
Selenomonas ruminantium
Mitsuokella multacida Bacteroidaceae
Streptococcus suis Streptococcaceae
Treponema succinifaciens Spirochaetaceae
RESULTS & DISCUSSION
Presence of Tetracycline Resistance Genes. PCR and gel visualization with primers for
tet(O), tet(M), tet(Q), and tet(W) markers showed successful amplification of tet(W) only. In
roughly 80% of samples screened for tet(W), the expected band for the tet(W) marker sequence
at about 168 bp was observed. All other samples had no visible bands. The fact that only tet(W)
genes were identified among four common RPP genes and in such a large percentage of samples
is surprising. This is not likely due to differential gene location and DNA extraction bias – i.e.
tet(W) on the chromosome and the extraction method favoring chromosomal DNA – because
tet(M) is most often located on the chromosome and tet(O) and tet(Q) can be chromosomal
(Storteboom et al., 2010; Kazimierczak, Flint, & Scott, 2006). The amplification of only tet(W)
is incongruent with the fact that tet(M) has been shown to populate even pristine environments at
similar levels to tet(W) (Storteboom et al., 2010, p. 1949). The detection of only tet(W) certainly
calls for further exploration. A subset of the samples that successfully amplified were Sanger
sequenced, and BLAST analysis determined all sequenced samples to have between 99 and 100
percent identity with the tet(W) reference sequence of B. longum and no other ARGs.
Storteboom et al. (2010) have shown that tet(W) sequence data can be used to differentiate genes
of pristine environments, CAFOs, and WWTPs, but the sequences obtained in this study were
not of the full gene, only a marker sequence. Therefore, sequencing of the full 1937 bp gene may
help elucidate the reason for sole detection of tet(W) in future studies of residential tetracycline
resistance.
Correlating Factors to tet(W) Abundance. The estimated tet(W) concentrations were
compared to bacterial genome equivalents using the results of qPCR for the indoor and outdoor
samples respectively to determine if there is a direct relationship between tet(W) copies and

bacteria in the settled dust. For the indoor subset, the tet(W) copy number was shown to be
correlated to the number of bacterial genome equivalents in each home (Pearson’s R = 0.26, p =
0.04). The trend can be roughly visualized in Figure 1. There was not a significant correlation
among the outdoor subset between tet(W) copy number and bacterial genome equivalents
(Pearson R = 0.2, p = 0.2). Due to thermal cycler malfunctions, a large portion of samples were
lost during qPCR without enough
DNA to perform another
amplification. Thus, the indoor
sample set happens to be larger than
the outdoor set (n = 70 and 40
respectively), and the indoor set may
be better suited for statistical
analysis. In the indoor sample set
certainly, greater abundances of all
bacteria are correlated to greater
abundances of tet(W), suggesting the
ubiquity of tet(W).
For all further analyses, the
ratio of tet(W) abundance to
bacterial abundance was used such
that the non-quantitatively obtained
samples could be compared
quantitatively. Homes exhibited a
FIGURE 1. Quantitative PCR (qPCR) measurements of bacterial
abundances vs. tet(W) abundances per home on a log scale with
linear trendline for visualization in (A) indoor and (B) outdoor trim
dust samples.
y = 6.1024x + 43594R² = 0.0617
1
10
100
1000
10000
100000
1000000
10000000
0.1 1 10 100 1000 10000 100000
Co
py
Nu
mb
er 1
6S
rRN
A
Copy Number tet(W)
A. INDOOR
y = 0.929x + 26858R² = 0.0445
1
10
100
1000
10000
100000
1000000
0 1 10 100 1000 10000 100000
Co
py
Nu
mb
er 1
6S
rRN
A
Copy Number tet(W)
B. OUTDOOR
wide range of proportions of tet(W): from no tet(W) genes to almost two for every bacterial
genome, with outliers at about five to six genes for every bacterial genome (Figure 3). As far as
indoor versus outdoor abundances, the tet(W) abundance per bacterial genome was not
significantly different or correlated over the limited number of homes with data from both indoor
and outdoor trim (n = 31, paired t test, p = 0.4). Potential tet(W) sources, indoor or outdoor
factors, cannot be hypothesized based on the proportion of tet(W) genes in the community from
this study. This contradicts the patterns of multidrug resistance in homes found by Gandara et al.
(2006) in which concentration of resistant bacteria was significantly higher inside the home than
outside. However, Gandara et al. (2006) cultured bacteria to characterize resistance rather than
quantifying ARGs across the bacterial community. It cannot be determined how many bacteria
are antibiotic resistant with this study, only the amount of genes across the community, so these
results can’t be definitively compared to those of Gandara et al. However, this discrepancy may
indicate that methods of culturing miss a large portion of bacteria that have the potential for
transferring ARGs.
A selection of environmental factors were tested for correlation to proportion of tet(W)
(Table 1). The only factor to yield a significant correlation was the outdoor sample’s total head
of livestock per square mile by county (Pearson’s R = 0.579, p = 0.001), the trend approximately
visualized in Figure 2A. The indoor sample set showed insignificant correlation (Pearson’s R =
0.1, p = 0.4), also in Figure 2A. However, both correlations are highly driven by a single outlier,
and without the outlier both appear to have a relationship to high livestock density – the median
and mean proportional tet(W) abundance are higher in the high livestock density samples –
although the correlation is not significant (Figure 2B). Total livestock density is therefore a good
candidate for further study on sources of residential ARGs. To further explicate this possible
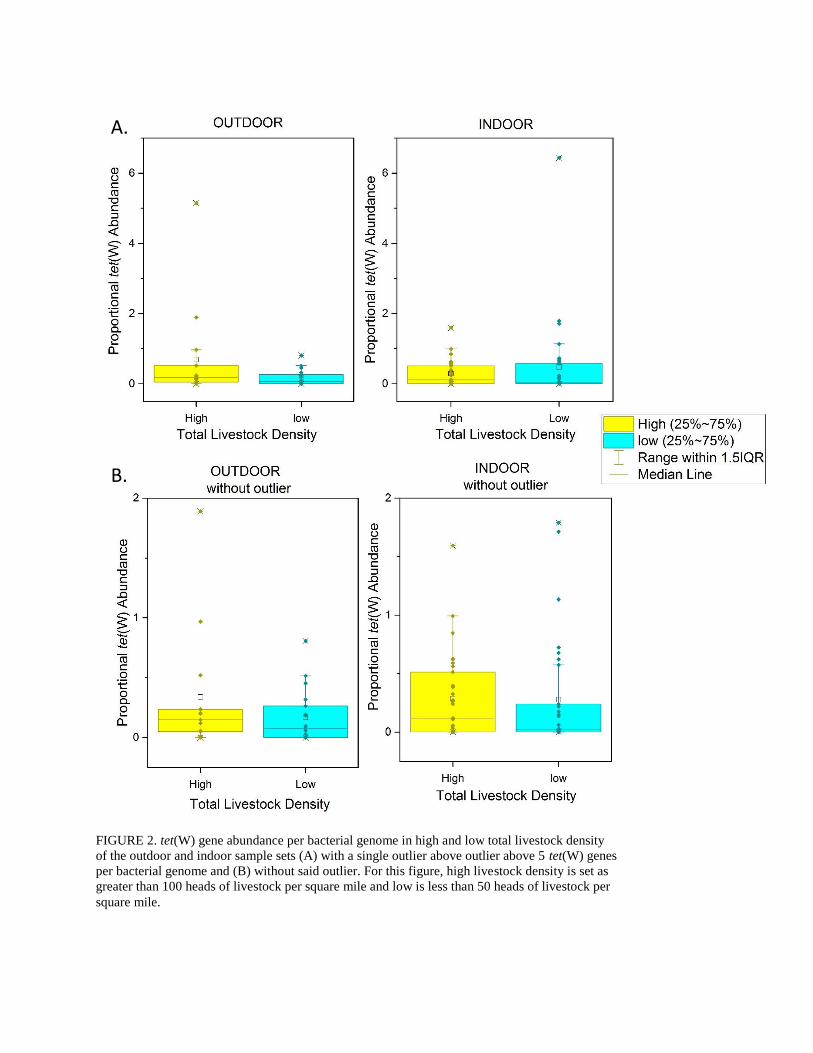
FIGURE 2. tet(W) gene abundance per bacterial genome in high and low total livestock density
of the outdoor and indoor sample sets (A) with a single outlier above outlier above 5 tet(W) genes
per bacterial genome and (B) without said outlier. For this figure, high livestock density is set as
greater than 100 heads of livestock per square mile and low is less than 50 heads of livestock per
square mile.
A.
B.
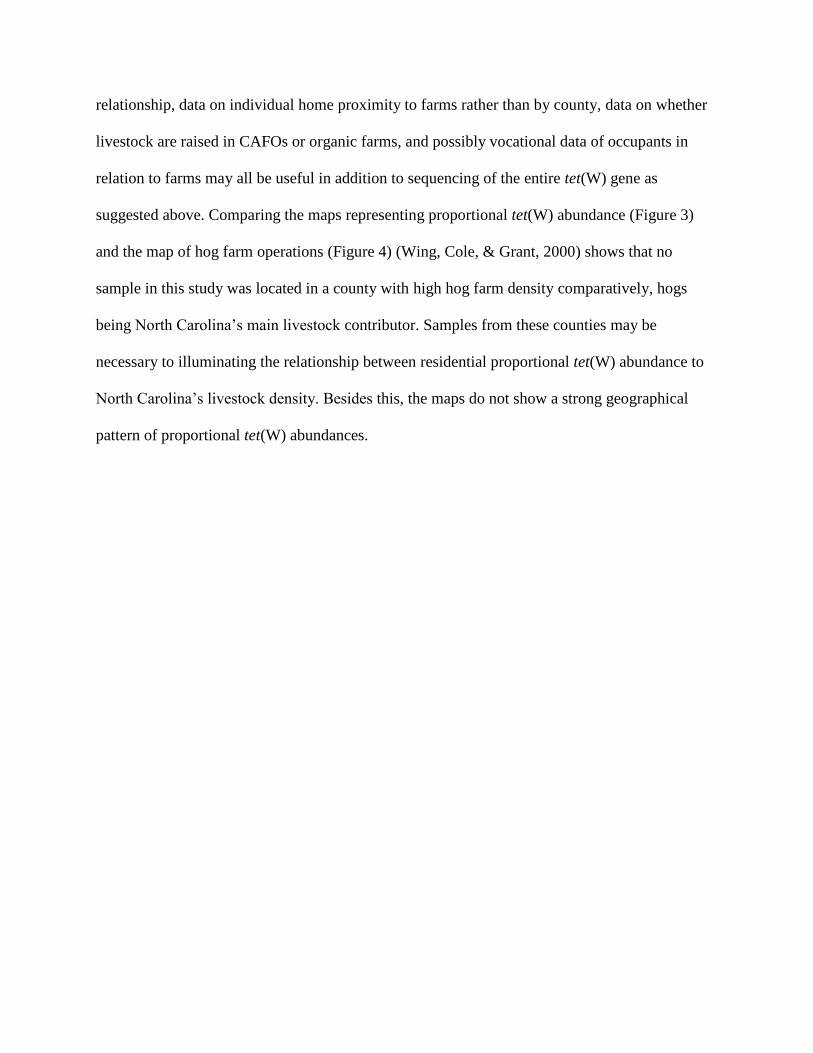
relationship, data on individual home proximity to farms rather than by county, data on whether
livestock are raised in CAFOs or organic farms, and possibly vocational data of occupants in
relation to farms may all be useful in addition to sequencing of the entire tet(W) gene as
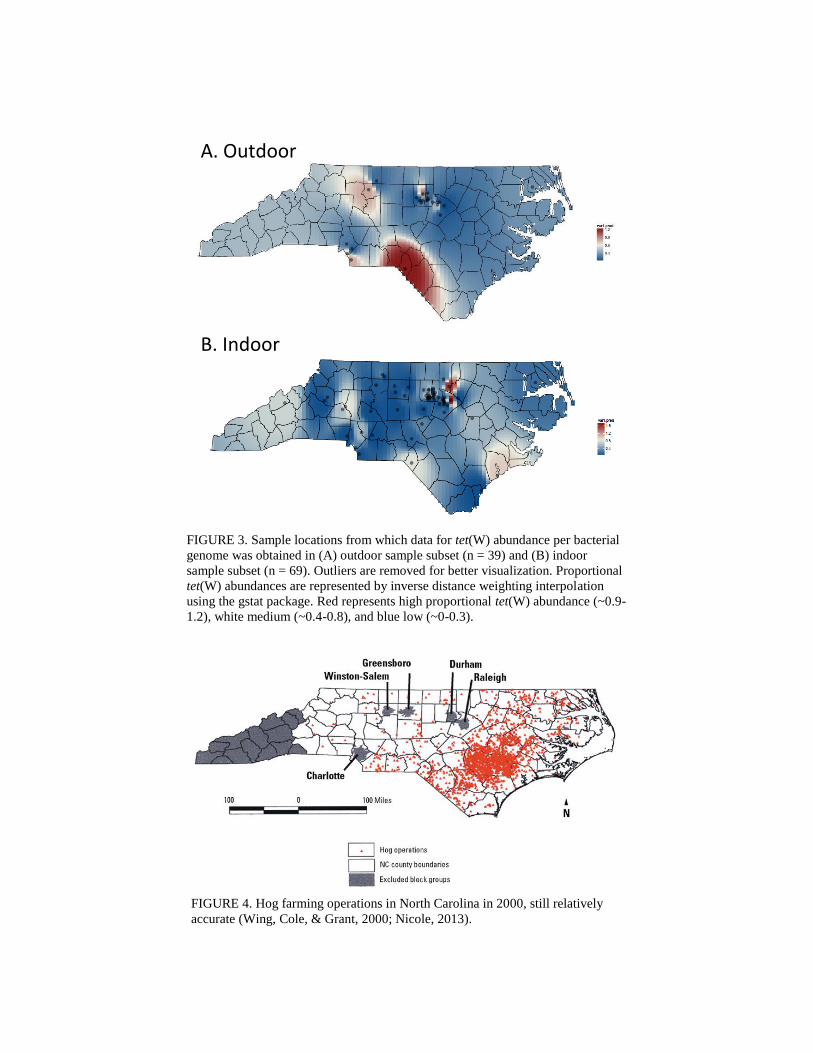
suggested above. Comparing the maps representing proportional tet(W) abundance (Figure 3)
and the map of hog farm operations (Figure 4) (Wing, Cole, & Grant, 2000) shows that no
sample in this study was located in a county with high hog farm density comparatively, hogs
being North Carolina’s main livestock contributor. Samples from these counties may be
necessary to illuminating the relationship between residential proportional tet(W) abundance to
North Carolina’s livestock density. Besides this, the maps do not show a strong geographical
pattern of proportional tet(W) abundances.
A. Outdoor
B. Indoor
FIGURE 3. Sample locations from which data for tet(W) abundance per bacterial
genome was obtained in (A) outdoor sample subset (n = 39) and (B) indoor
sample subset (n = 69). Outliers are removed for better visualization. Proportional
tet(W) abundances are represented by inverse distance weighting interpolation
using the gstat package. Red represents high proportional tet(W) abundance (~0.9-
1.2), white medium (~0.4-0.8), and blue low (~0-0.3).
FIGURE 4. Hog farming operations in North Carolina in 2000, still relatively
accurate (Wing, Cole, & Grant, 2000; Nicole, 2013).
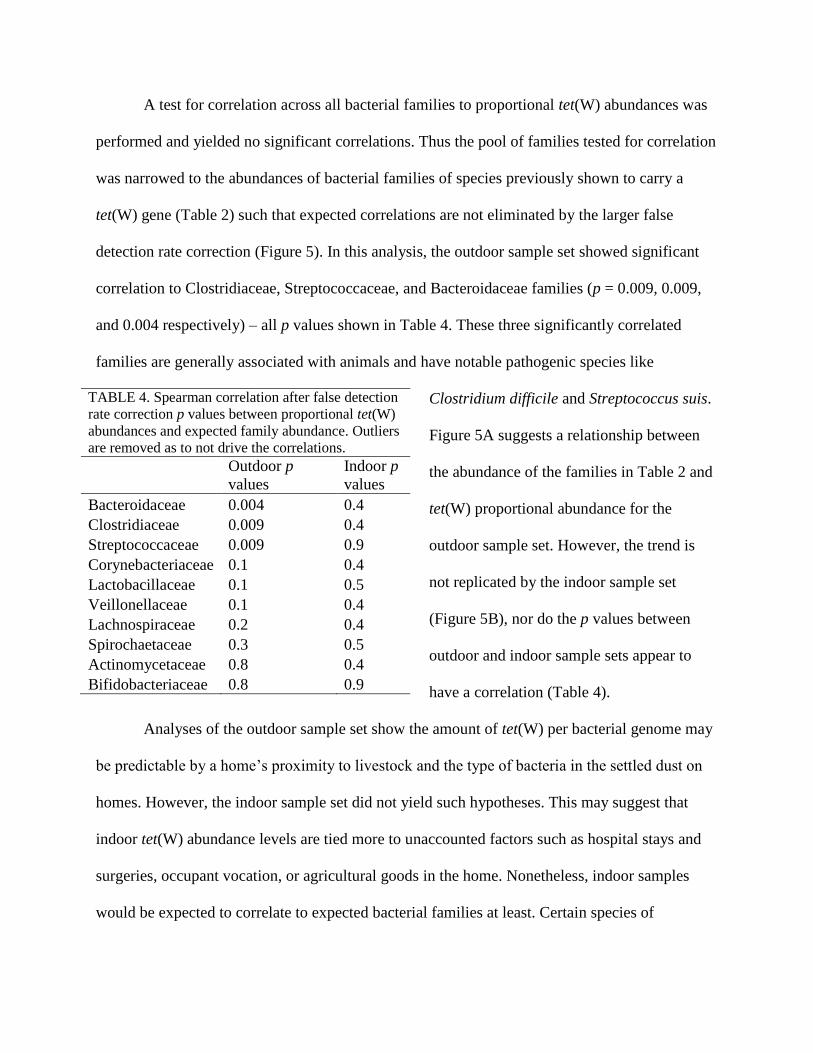
A test for correlation across all bacterial families to proportional tet(W) abundances was
performed and yielded no significant correlations. Thus the pool of families tested for correlation
was narrowed to the abundances of bacterial families of species previously shown to carry a
tet(W) gene (Table 2) such that expected correlations are not eliminated by the larger false
detection rate correction (Figure 5). In this analysis, the outdoor sample set showed significant
correlation to Clostridiaceae, Streptococcaceae, and Bacteroidaceae families (p = 0.009, 0.009,
and 0.004 respectively) – all p values shown in Table 4. These three significantly correlated
families are generally associated with animals and have notable pathogenic species like
Clostridium difficile and Streptococcus suis.
Figure 5A suggests a relationship between
the abundance of the families in Table 2 and
tet(W) proportional abundance for the
outdoor sample set. However, the trend is
not replicated by the indoor sample set
(Figure 5B), nor do the p values between
outdoor and indoor sample sets appear to
have a correlation (Table 4).
Analyses of the outdoor sample set show the amount of tet(W) per bacterial genome may
be predictable by a home’s proximity to livestock and the type of bacteria in the settled dust on
homes. However, the indoor sample set did not yield such hypotheses. This may suggest that
indoor tet(W) abundance levels are tied more to unaccounted factors such as hospital stays and
surgeries, occupant vocation, or agricultural goods in the home. Nonetheless, indoor samples
would be expected to correlate to expected bacterial families at least. Certain species of
TABLE 4. Spearman correlation after false detection
rate correction p values between proportional tet(W)
abundances and expected family abundance. Outliers
are removed as to not drive the correlations.
Outdoor p
values
Indoor p
values
Bacteroidaceae 0.004 0.4
Clostridiaceae 0.009 0.4
Streptococcaceae 0.009 0.9
Corynebacteriaceae 0.1 0.4
Lactobacillaceae 0.1 0.5
Veillonellaceae 0.1 0.4
Lachnospiraceae 0.2 0.4
Spirochaetaceae 0.3 0.5
Actinomycetaceae 0.8 0.4
Bifidobacteriaceae 0.8 0.9
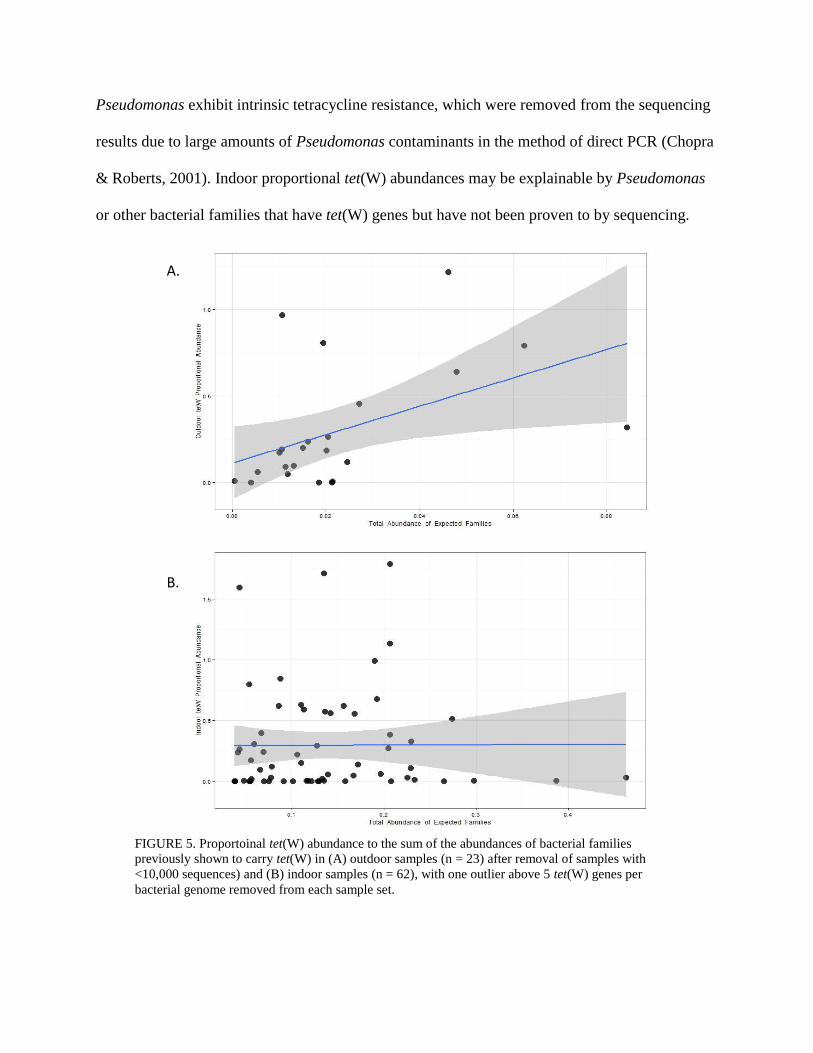
Pseudomonas exhibit intrinsic tetracycline resistance, which were removed from the sequencing
results due to large amounts of Pseudomonas contaminants in the method of direct PCR (Chopra
& Roberts, 2001). Indoor proportional tet(W) abundances may be explainable by Pseudomonas
or other bacterial families that have tet(W) genes but have not been proven to by sequencing.
A.
B.
FIGURE 5. Proportoinal tet(W) abundance to the sum of the abundances of bacterial families
previously shown to carry tet(W) in (A) outdoor samples (n = 23) after removal of samples with
<10,000 sequences) and (B) indoor samples (n = 62), with one outlier above 5 tet(W) genes per
bacterial genome removed from each sample set.

CONCLUSION
This study observed the presence of detectable levels of tetracycline resistance gene
tet(W) in the majority of 90 North Carolina residential settled dust samples from inside and
outside door trim, and the absence of detectable levels of tet(O), tet(M), and tet(Q). The amount
of tet(W) per bacterial genome was shown to vary across samples with a number of samples
having one tet(W) gene per bacterial genome. Among the environmental factors studied (Table
1), only the total livestock density of outdoor samples with an outlier suggested a significant
correlating factor. A significant correlation was found between the abundance of Clostridiaceae,
Streptococcaceae, and Bacteroidaceae families and the proportional tet(W) abundances for the
outdoor samples alone as well.
Future directions of this project would seek to elucidate the nearly ubiquitous detection of
tet(W) and the total absence of tet(O), tet(M), and tet(Q). Perhaps the best way to approach this
could be through sequencing of the full, 1937 bp tet(W) gene as did Storteboom et al. (2010)
such that it can be determined if the residential tet(W) is due to the naturally occurring resistance
in some bacteria or if there are instances of human activity’s influence. It would also be valuable
to run test qPCR screens for tet(O), tet(M), and tet(Q), because qPCR is a much more sensitive
detection system than visualized PCR, along with other RPP tetracycline resistance genes like
tet(S), tet(T), and tetB(P).
Another necessary direction to the continuation of this project would be the addition of
samples from areas of the greatest hog farm concentration to get a more complete picture of
North Carolina residences. The two outliers above five tet(W) genes per bacterial genome
continually removed from analyses in this study may prove to be examples of the influence of
human antibiotic use above the baseline of this study’s samples. If this is the case, the samples
from the high livestock density counties of North Carolina would be hypothesized to look more
like the outliers found in this study. In addition, data on occupant vocations, time in a hospital,
and usage of antibiotics should be collected which could elucidate the cause of the outliers as
well.
Tetracycline is a first-line antibiotic and resistance has become widespread.
Characterization of the abundance and sources of other, less benign resistance to last-resort
antibiotics is a field that could be explored in the air-borne bacterial community of residences to
combat the annual number of deaths from antibiotic resistant infections. The residential air
environment is understudied considering the fact that it is where most Americans live out a
significant portion of their lives, and there is much to be explored in this environment’s bacterial
communities.
ACKNOWLEDGEMENTS
I would like to thank all the wonderful members of the Fierer lab who gave me the
opportunity to engage in the scientific conversation and whose support was vital in every step of
my project, particularly Dr. Noah Fierer, Dr. Joanne Emerson, Dr. Anne Madden, Jessica
Henley, Holly Archer, Jon Leff, Dr. Albert Barberán, and Tess Brewer.
REFERENCES
Alvarado, C. S., Gibbs, S. G., Gandara, A., Flores, C., Hurd, W. W., & Green, C. F. (2012). The Potential
for Community Exposures to Pathogens From an Urban Dairy. Journal of Environmental Health,
74(7), 22-8.
Armand-Lefevre, L., Ruimy, R., & Andremont, A. (2005). Clonal Comparison of Staphylococcus aureus
Isolates from Healthy Pig Farmers, Human Controls, and Pigs. Emergent Infectious Disease,
11(5), 711-714.
Chapin, A., Rule, A., Gibson, K., Buckley, T., & Schwab, K. (2005). Airborne Multi-drug Resistant
Bacteria Isolated From A Concentrated Swine Feeding Operation. Environmental Health
Perspectives, 113(2), 137-42.
Chopra, I., & Roberts, M. (2001). Tetracycline Antibiotics: Mode Of Action, Applications, Molecular
Biology, And Epidemiology Of Bacterial Resistance. Microbiology and Molecular Biology
Reviews, 65(2), 232-260.
Dufour, P., Gillet, Y., Le Bes, M., Lina, G., Vandenesch, F., Floret, D., ... Riche, H. (2002). Community-
Acquired Methicillin-Resistant Staphylococcus aureus Infections in France: Emergence of a
Single Clone That Produces Panton-Valentine Leukocidin. Clinical Infectious Diseases, 35, 819-
824.
Elstrøm, P., Kacelnik, O., Bruun, T., Iversen, B., Hauge, S., & Aavitsland, P. (2012). Meticillin-resistant
Staphylococcus aureus in Norway, a low-incidence country, 2006–2010. Journal of Hospital
Infection, 80(1), 36-40.
Flores, G., Henley, J., & Fierer, N. (2012). A Direct PCR Approach to Accelerate Analyses of Human-
Associated Microbial Communities. PLoS ONE, E44563-E44563.
Gandara, A., Mota, L., Flores, C., Perez, H., Green, C., & Gibbs, S. (2006). Isolation Of Staphylococcus
Aureus And Antibiotic Resistant Staphylococcus Aureus From Residential Indoor Bioaerosols.
Environmental Health Perspectives, 114(12), 1859-1864.
Gibbs, S. G., Green, C. F., Tarwater, P. M., Mota, L. C., Mena, K. D., & Scarpino, P. V. (2006). Isolation
Of Antibiotic Resistant Bacteria From The Air Plume Downwind Of A Swine Confined Or
Concentrated Animal Feeding Operation. Environmental Health Perspectives, 114(7), 1032-7.
Herold, B., Immergluck, L., Maranan, M., Lauderdale, D., Gaskin, R., Boyle-Vavra, S., ... Daum, R.
(1998). Community-Acquired Methicillin-Resistant Staphylococcus aureus in Children With No
Identified Predisposing Risk. JAMA: The Journal of the American Medical Association, 279(8),
593-598.
Hoffman, S. (2001). Mechanisms of Antibiotic Resistance. Compendium, 23(5), 464-473.
Hölzel, C., Schwaiger, K., Harms, K., Küchenhoff, H., Kunz, A., Meyer, K., Bauer, J., et al. (2010).
Sewage sludge and liquid pig manure as possible sources of antibiotic resistant bacteria.
Environmental Research, 110(4), 318-326. Khan, S., Roser, D., Davies, C., Peters, G., Stuetz, R.,
Tucker, R., & Ashbolt, N. (2008). Chemical contaminants in feedlot wastes: Concentrations,
effects and attenuation. Environment International, 34(6), 839-859.
Kazimierczak, K., Flint, H., & Scott, K. (2006). Comparative Analysis of Sequences Flanking tet(W)
Resistance Genes in Multiple Species of Gut Bacteria. Antimicrobial Agents And Chemotherapy,
50(8), 2632-2639.
Koike, S., Krapac, I. G., Oliver, H. D., Yannarell, A. C., Chee-Sanford, J. C., Aminov, R. I., et al. (2007).
Monitoring And Source Tracking Of Tetracycline Resistance Genes In Lagoons And
Groundwater Adjacent To Swine Production Facilities Over A 3-Year Period. Applied and
Environmental Microbiology, 73(15), 4813-23.
Levy, S., Fitzgerald, G., & Macone, A. (1976). Spread of anti- biotic-resistant plasmids from chicken to
chicken and from chicken to man. Nature, 260, 40-42.
Macauley, J. J., Adams, C. D., & Mormile, M. R. (2007). Diversity Of tet Resistance Genes In
Tetracycline-resistant Bacteria Isolated From A Swine Lagoon With Low Antibiotic Impact.
Canadian Journal of Microbiology, 53(12), 1307-15.
Mcdonald, D., Price, M., Goodrich, J., Nawrocki, E., Desantis, T., Probst, A., . . . Hugenholtz, P. (2011).
An improved Greengenes taxonomy with explicit ranks for ecological and evolutionary analyses
of bacteria and archaea. The ISME Journal, 6(3), 610-618.
MacEachran, A., Blackwell, B., Hanson, J., Welton, K., Mayer, G., Cox, S., & Smith, P. (2015).
Antibiotics, Bacteria, and Antibiotic Resistance Genes: Aerial Transport from Cattle Feed Yards
via Particulate Matter. Environmental Health Perspectives.
Macovei, L., & Zurek, L. (2006). Ecology of Antibiotic Resistance Genes: Characterization of
Enterococci from Houseflies Collected in Food Settings. Applied and Environmental
Microbiology, 72(6), 4028-4035.
Nicole, W. (2013). CAFOs and Environmental Justice: The Case of North Carolina. Environmental
Health Perspectives, 121, A182-A189.
Paulson, J., Stine, O., Bravo, H., & Pop, M. (2013). Differential abundance analysis for microbial marker-
gene surveys. Nature Methods, 10, 1200-1202.
Peak, N., Knapp, C. W., Yang, R. K., Hanfelt, M. M., Smith, M. S., Aga, D. S., et al. (2007). Abundance
Of Six Tetracycline Resistance Genes In Wastewater Lagoons At Cattle Feedlots With Different
Antibiotic Use Strategies. Environmental Microbiology, 9(1), 143-151.
Rosas, I., Salinas, E., Yela, A., Calva, E., Eslava, C., & Cravioto, A. (1997). Escherichia coli in Settled-
Dust and Air Samples Collected in Residential Environments in Mexico City. Applied and
Environmental Microbiology, 63(10), 4093-4095.
Sapkota, A. R., Curriero, F. C., & Gibson, K. E. (2007). Antibiotic-Resistant Enterococci and Fecal
Indicators in Surface Water and Groundwater Impacted by a Concentrated Swine Feeding
Operation. Environmental Health Perspectives, 115(7), 1040-5.
Sarmah, A. K., Meyer, M. T., & Boxall, A. B. A. (2006). A Global Perspective On The Use, Sales,
Exposure Pathways, Occurrence, Fate And Effects Of Veterinary Antibiotics (VAs) In The
Environment. Chemosphere, 65(5), 725-59.
Schaberg, D., Culver, D., & Gaynes, R. (1991). Major trends in the microbial etiology of nosocomial
infection. The American Journal of Medicine, 91(3B), S72-S75.
Storteboom, H., Arabi, M., Davis, J., Crimi, B., & Pruden, A. (2010). Identification of Antibiotic-
Resistance-Gene Molecular Signatures Suitable as Tracers of Pristine River, Urban, and
Agricultural Sources. Environmental Science & Technology, 44, 1947-1953.
U.S. Dept. of Health and Human Services. (2013). National Summary Data. Antibiotic Resistance Threats
in the United States, 2013, 13-14.
Voss, A., Loeffen, F., Klaassen, C., & Wulf, M. (2005). Methicillin- resistant Staphylococcus aureus in
pig farming. Emergent Infectious Disease, 11(12), 1965-1966.
Wang, H., Manuzon, M., Wan, K., Luo, H., Wittum, T., Yousef, A., & Bakaletz, L. (2006). Food
commensalmicrobes as a potentially important avenue intransmittingantibiotic resistance genes.
FEMS Microbiology Letters, 254, 226-231.
West, B. M., Liggit, P., Clemans, D. L., & Francoeur, S. N. (2011). Antibiotic Resistance, Gene Transfer,
and Water Quality Patterns Observed in Waterways near CAFO Farms and Wastewater
Treatment Facilities. Water, Air, and Soil Pollution, 217, 473-89.
White, D., Zhao, S., Sudler, R., Ayers, S., Friedman, S., Chen, S., ... Meng, J. (2001). The Isolation Of
Antibiotic-Resistant Salmonella From Retail Ground Meats. New England Journal of Medicine,
345, 1147-1154
Wing, S., Cole, D., & Grant, G. (2000). Environmental Injustice in North Carolina's Hog Industry.
Environmental Health Perspectives, 108(3), 225-231.