teva investor & analyst meeting - iis windows...
TRANSCRIPT

1
Teva Investor & Analyst Meeting Shlomo YanaiPresident and CEOFebruary 18th, 2009
President and CEO

Forward Looking Statements
TODAY’S PRESENTATION CONTAINS FORWARD-LOOKING STATEMENTS, WHICH EXPRESS THE CURRENT BELIEFS AND EXPECTATIONSOF MANAGEMENT. SUCH STATEMENTS ARE BASED ON MANAGEMENT'S CURRENT BELIEFS AND EXPECTATIONS AND INVOLVE ANUMBER OF KNOWN AND UNKNOWN RISKS AND UNCERTAINTIES THAT COULD CAUSE OUR FUTURE RESULTS, PERFORMANCE ORACHIEVEMENTS TO DIFFER SIGNIFICANTLY FROM THE RESULTS, PERFORMANCE OR ACHIEVEMENTS EXPRESSED OR IMPLIED BY SUCHFORWARD-LOOKING STATEMENTS. IMPORTANT FACTORS THAT COULD CAUSE OR CONTRIBUTE TO SUCH DIFFERENCES INCLUDE RISKSRELATING TO: OUR ABILITY TO SUCCESSFULLY DEVELOP AND COMMERCIALIZE ADDITIONAL PHARMACEUTICAL PRODUCTS, THEINTRODUCTION OF COMPETING GENERIC EQUIVALENTS, THE EXTENT TO WHICH WE MAY OBTAIN U.S. MARKET EXCLUSIVITY FORCERTAIN OF OUR NEW GENERIC PRODUCTS AND REGULATORY CHANGES THAT MAY PREVENT US FROM UTILIZING EXCLUSIVITYCERTAIN OF OUR NEW GENERIC PRODUCTS AND REGULATORY CHANGES THAT MAY PREVENT US FROM UTILIZING EXCLUSIVITYPERIODS, COMPETITION FROM BRAND-NAME COMPANIES THAT ARE UNDER INCREASED PRESSURE TO COUNTER GENERIC PRODUCTS,OR COMPETITORS THAT SEEK TO DELAY THE INTRODUCTION OF GENERIC PRODUCTS, THE IMPACT OF CONSOLIDATION OF OURDISTRIBUTORS AND CUSTOMERS, POTENTIAL LIABILITY FOR SALES OF GENERIC PRODUCTS PRIOR TO A FINAL RESOLUTION OFOUTSTANDING PATENT LITIGATION, INCLUDING THAT RELATING TO THE GENERIC VERSIONS OF NEURONTIN®, LOTREL® ANDPROTONIX®, THE EFFECTS OF COMPETITION ON OUR INNOVATIVE PRODUCTS, ESPECIALLY COPAXONE® SALES, THE IMPACT OFPHARMACEUTICAL INDUSTRY REGULATION AND PENDING LEGISLATION THAT COULD AFFECT THE PHARMACEUTICAL INDUSTRY THEPHARMACEUTICAL INDUSTRY REGULATION AND PENDING LEGISLATION THAT COULD AFFECT THE PHARMACEUTICAL INDUSTRY, THEDIFFICULTY OF PREDICTING U.S. FOOD AND DRUG ADMINISTRATION, EUROPEAN MEDICINES AGENCY AND OTHER REGULATORYAUTHORITY APPROVALS, THE REGULATORY ENVIRONMENT AND CHANGES IN THE HEALTH POLICIES AND STRUCTURES OF VARIOUSCOUNTRIES, OUR ABILITY TO ACHIEVE EXPECTED RESULTS THOUGH OUR INNOVATIVE R&D EFFORTS, OUR ABILITY TO SUCCESSFULLYIDENTIFY, CONSUMMATE AND INTEGRATE ACQUISITIONS, INCLUDING THE INTEGRATION OF BARR PHARMACEUTICALS INC., POTENTIALEXPOSURE TO PRODUCT LIABILITY CLAIMS TO THE EXTENT NOT COVERED BY INSURANCE, DEPENDENCE ON THE EFFECTIVENESS OFOUR PATENTS AND OTHER PROTECTIONS FOR INNOVATIVE PRODUCTS SIGNIFICANT OPERATIONS WORLDWIDE THAT MAY BEOUR PATENTS AND OTHER PROTECTIONS FOR INNOVATIVE PRODUCTS, SIGNIFICANT OPERATIONS WORLDWIDE THAT MAY BEADVERSELY AFFECTED BY TERRORISM, POLITICAL OR ECONOMICAL INSTABILITY OR MAJOR HOSTILITIES, SUPPLY INTERRUPTIONS ORDELAYS THAT COULD RESULT FROM THE COMPLEX MANUFACTURING OF OUR PRODUCTS AND OUR GLOBAL SUPPLY CHAIN,ENVIRONMENTAL RISKS, FLUCTUATIONS IN CURRENCY, EXCHANGE AND INTEREST RATES, AND OTHER FACTORS THAT ARE DISCUSSEDIN THIS REPORT AND IN OUR OTHER FILINGS WITH THE U.S. SECURITIES AND EXCHANGE COMMISSION ("SEC").
2
3
2008 at a glance2008 at a glance
The future of generics
Biogenerics
Outlook

42008 2008 –– An Extraordinary YearAn Extraordinary YearStrong Financial ResultsStrong Financial Results
1111 085085Sales 99 408408
2007 2008* Change
++1818%%1111,,085085Sales$m
99,,408408 ++1818%%
Net income$m
22,,37437411,,952952 ++2222%%$m
EPS$
22..868622..3838 ++2020%%
* Net income and EPS are non-GAAP results
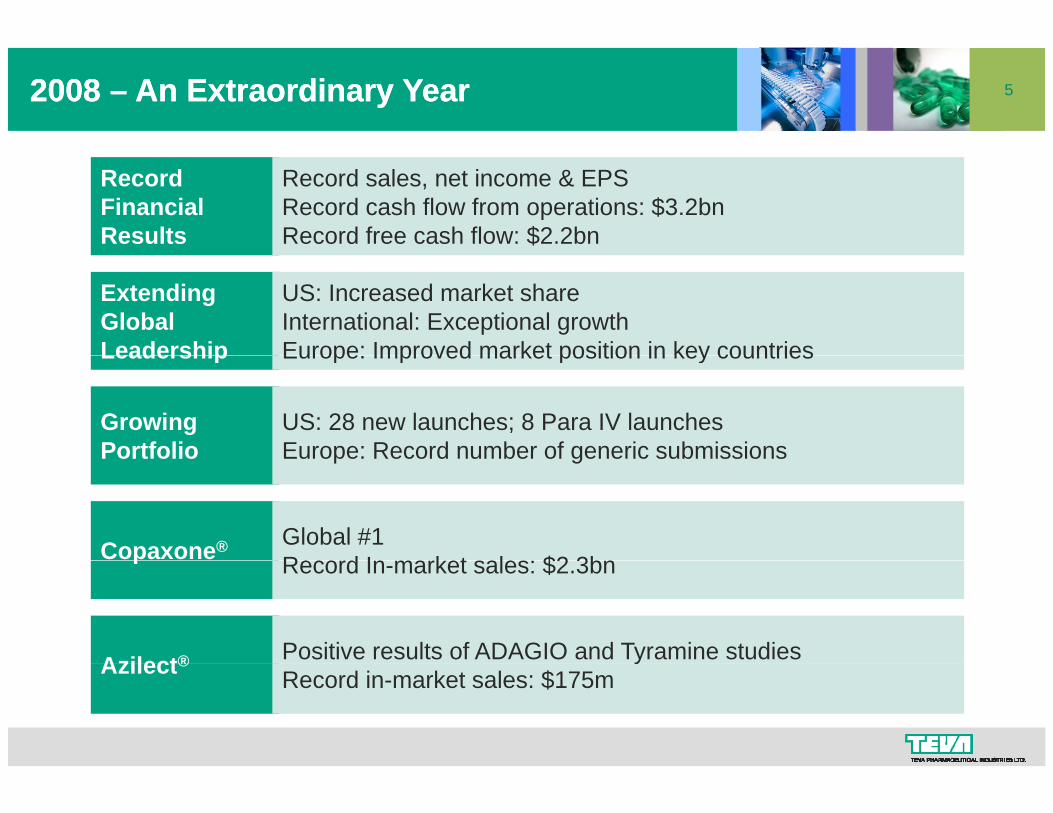
52008 2008 –– An Extraordinary YearAn Extraordinary Year
Record FinancialResults
Record sales, net income & EPSRecord cash flow from operations: $3.2bnRecord free cash flow: $2.2bn
20082008: an extraordinary year: an extraordinary yearExtending Global Leadership
US: Increased market share International: Exceptional growthEurope: Improved market position in key countriesLeadership Europe: Improved market position in key countries
GrowingPortfolio
US: 28 new launches; 8 Para IV launchesEurope: Record number of generic submissionsPortfolio Europe: Record number of generic submissions
Copaxone® Global #1R d I k t l $2 3bp Record In-market sales: $2.3bn
Azilect® Positive results of ADAGIO and Tyramine studiesAzilect® yRecord in-market sales: $175m
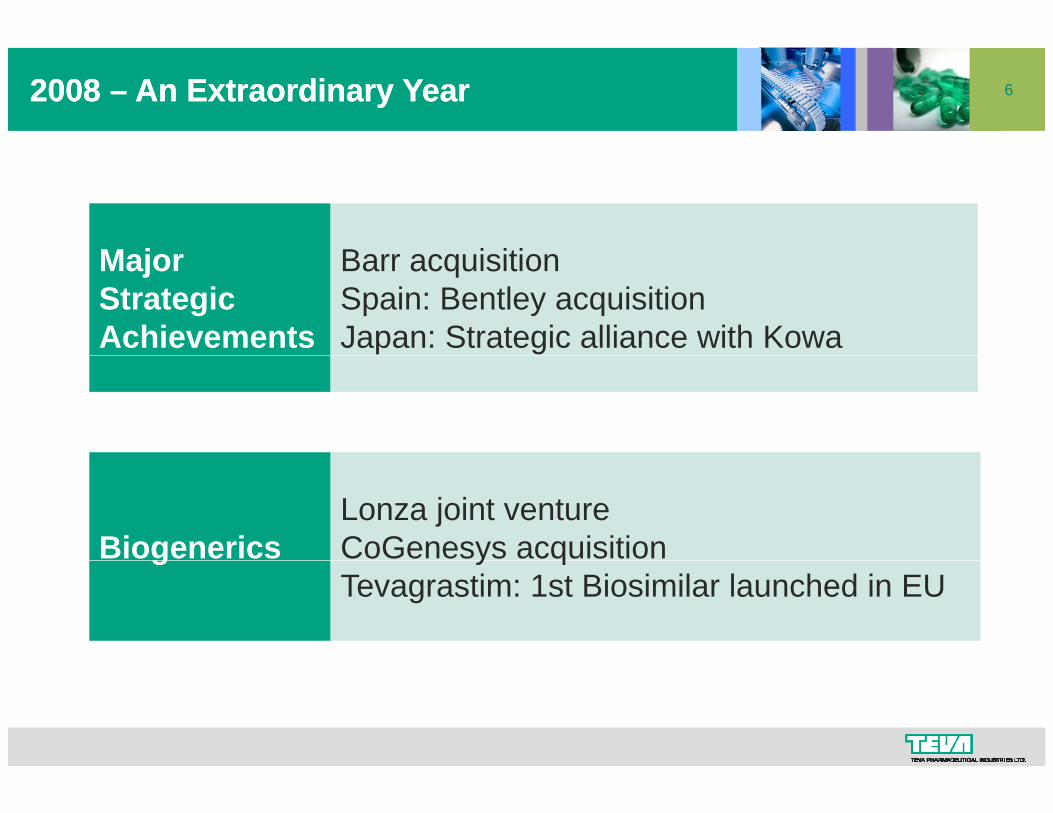
62008 2008 –– An Extraordinary YearAn Extraordinary Year
M j B i itiMajorStrategic Achievements
Barr acquisitionSpain: Bentley acquisitionJapan: Strategic alliance with Kowa
BiogenericsLonza joint ventureCoGenesys acquisitiong y qTevagrastim: 1st Biosimilar launched in EU
7
2008 at a glance
The future of generics The future of generics
Biogenerics
Outlook
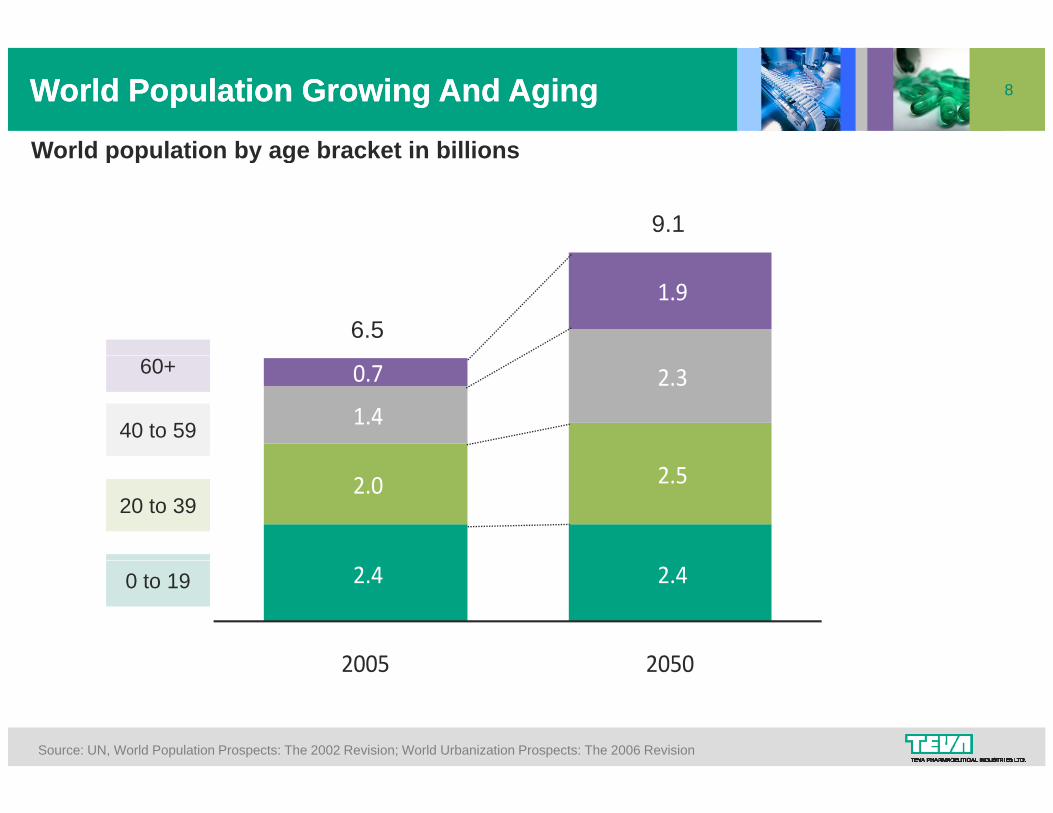
8World Population Growing And AgingWorld Population Growing And Aging
World population by age bracket in billionsWorld population by age bracket in billions
9.1
1.9
6.5
1.4
2.3 0.7 60+
40 to 59
2.0 2.5 20 to 39
2.4 2.4
2005 2050
0 to 19
2005 2050
Source: UN, World Population Prospects: The 2002 Revision; World Urbanization Prospects: The 2006 Revision
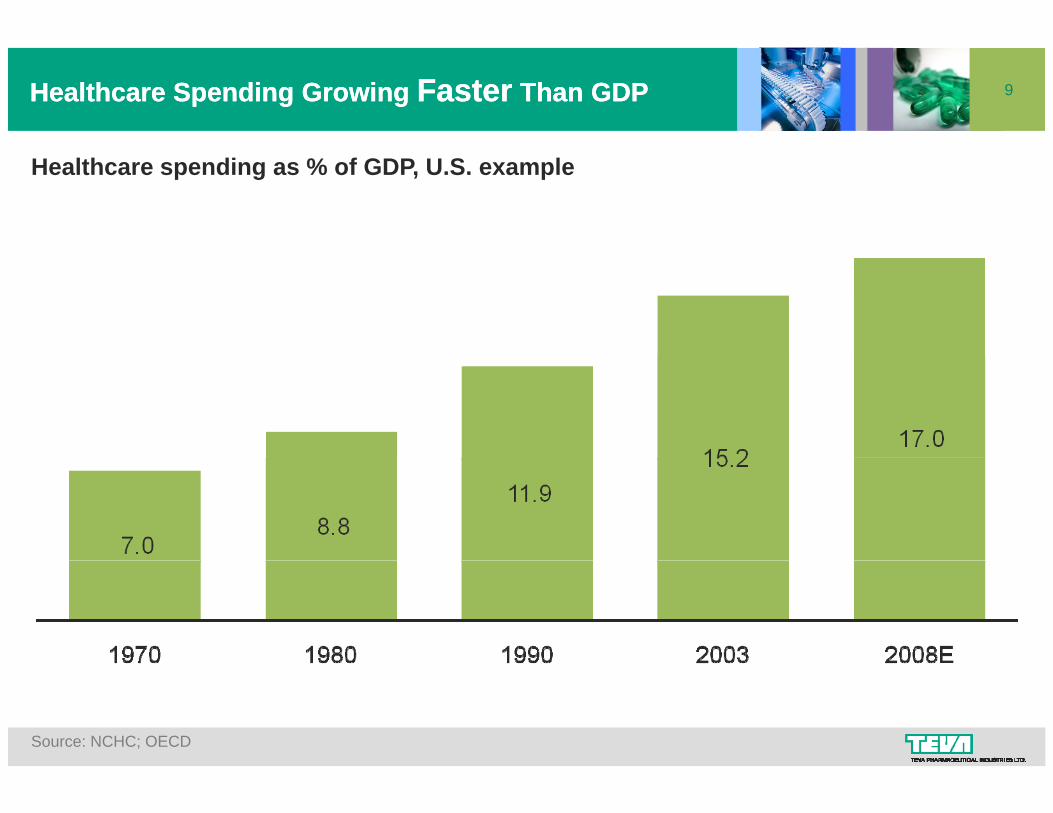
9Healthcare Spending Growing Healthcare Spending Growing FasterFaster Than GDPThan GDP
Healthcare spending as % of GDP, U.S. example
Source: NCHC; OECD
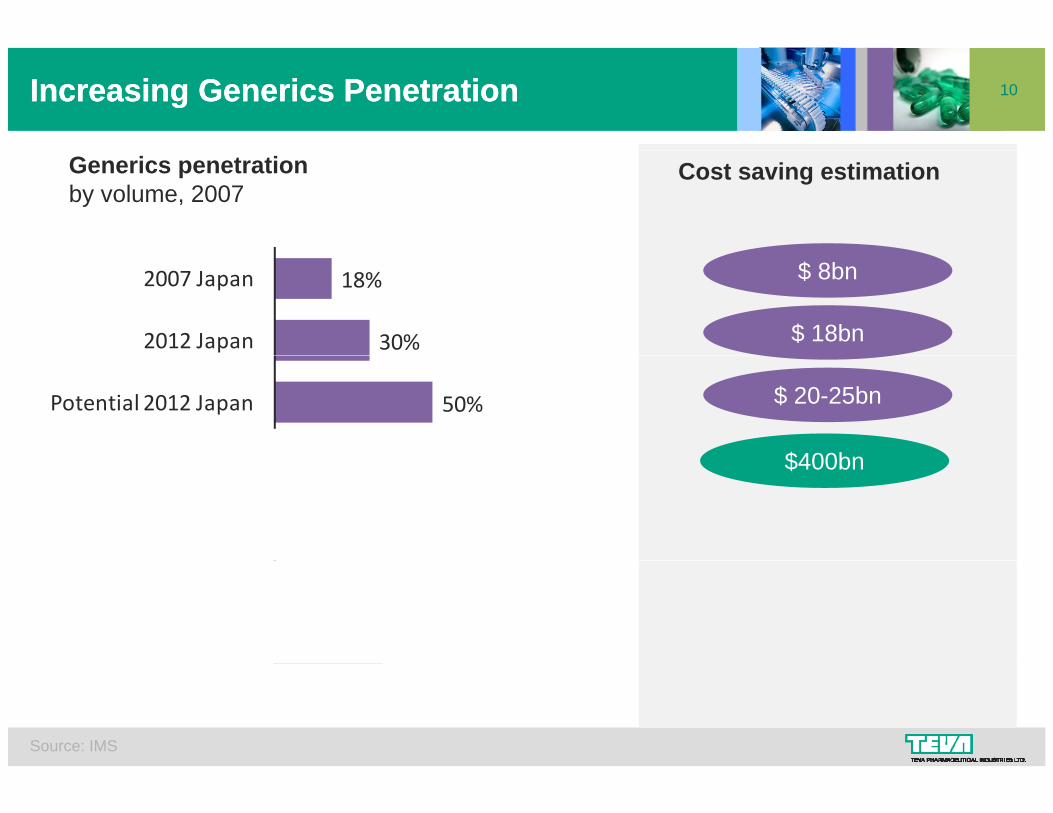
10Increasing Generics PenetrationIncreasing Generics Penetration
Generics penetrationby volume, 2007
Cost saving estimation
18%
30%
2007 Japan
2012 Japan
$ 8bn
$ 18bn
50%Potential 2012 Japan
US
$ 20-25bn
$400bn68%
65%
US
UK
$400bn
54%
34%
Germany
Spain
Source: IMS

11Growing Acceptance Of GenericsGrowing Acceptance Of Generics
“…increasing the use of generic drugs in public programs,and taking on drug companies that block cheaper generic medicines from the market.”
Q a
- Obama Administration Health Care Policy
“These data suggest no evidence of superiority of brand-name to generic drugs in measured clinical outcomes among these studies ”among these studies.”
“… between October 2006 and December 2008, the proportion of adults who would choose generic drugs in preference to brand name prescription drugs haspreference to brand name prescription drugs has increased from 68% to 81%.”
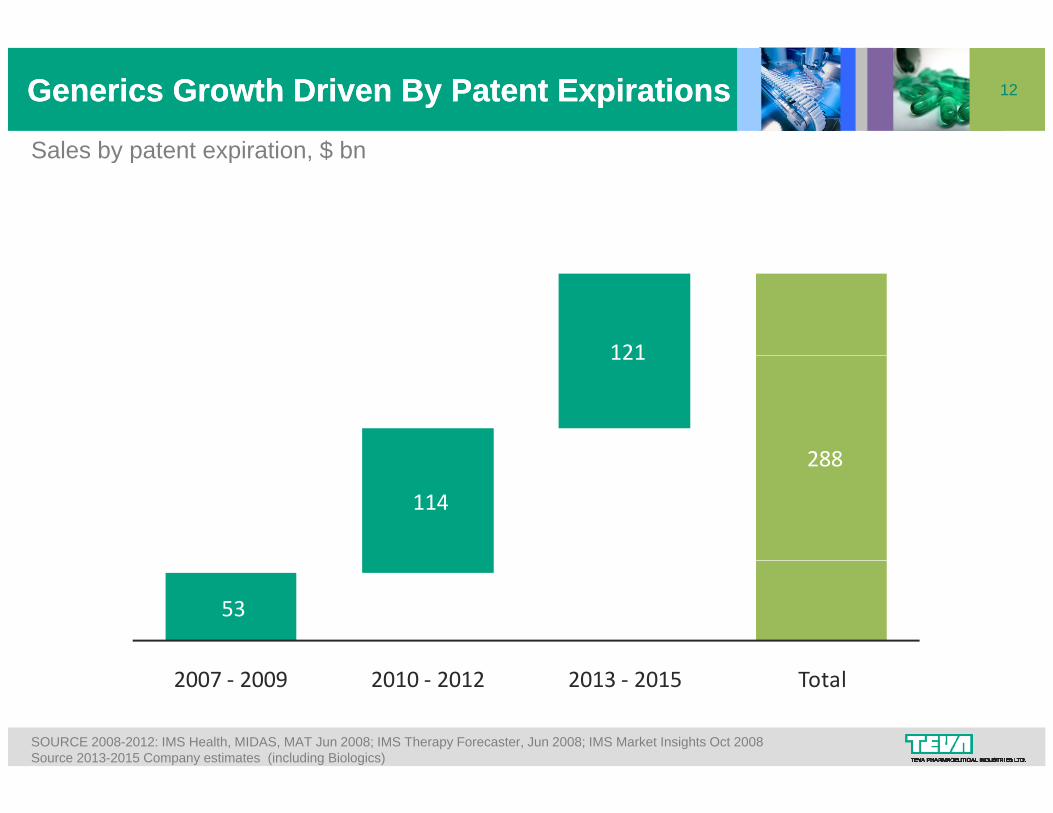
12Generics Growth Driven By Patent ExpirationsGenerics Growth Driven By Patent Expirations
Sales by patent expiration $ bnSales by patent expiration, $ bn
121121
288
114
288
53
2007 ‐ 2009 2010 ‐ 2012 2013 ‐ 2015 Total
SOURCE 2008-2012: IMS Health, MIDAS, MAT Jun 2008; IMS Therapy Forecaster, Jun 2008; IMS Market Insights Oct 2008Source 2013-2015 Company estimates (including Biologics)

13
2008 at a glance
The future of generics
BiogenericsBiogenerics
Outlook
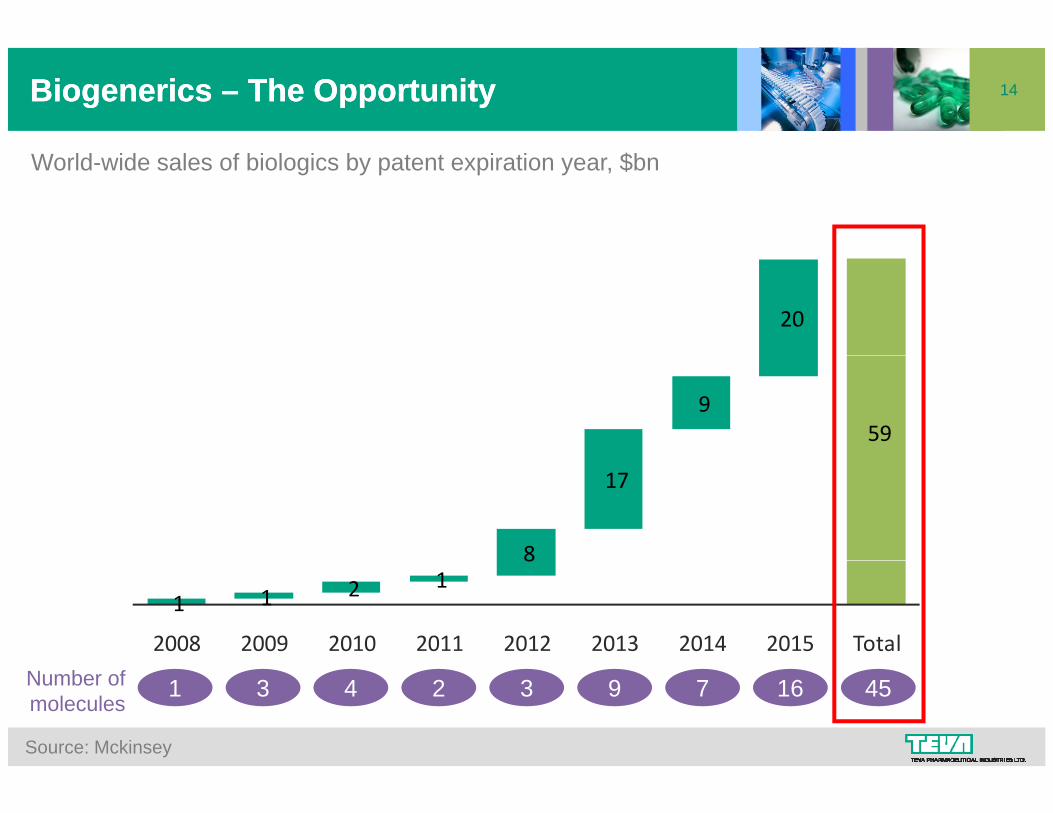
14BiogenericsBiogenerics –– The OpportunityThe Opportunity
World-wide sales of biologics by patent expiration year, $bn
20
9 59
8
17
1 1 2 1 8
2008 2009 2010 2011 2012 2013 2014 2015 Total
1 3 4 2 3 9 7 4516Number ofmolecules
Source: Mckinsey
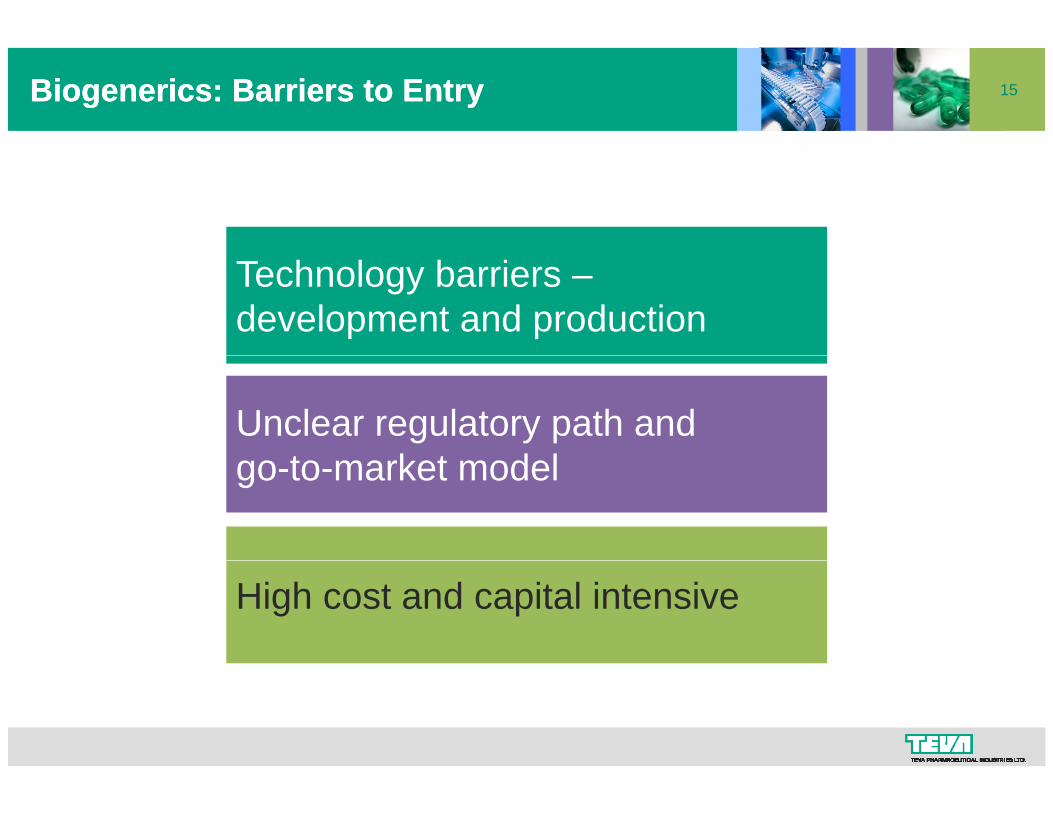
15Biogenerics: Barriers to EntryBiogenerics: Barriers to Entry
Technology barriers –development and production
Unclear regulatory path andt k t d lgo-to-market model
High cost and capital intensive
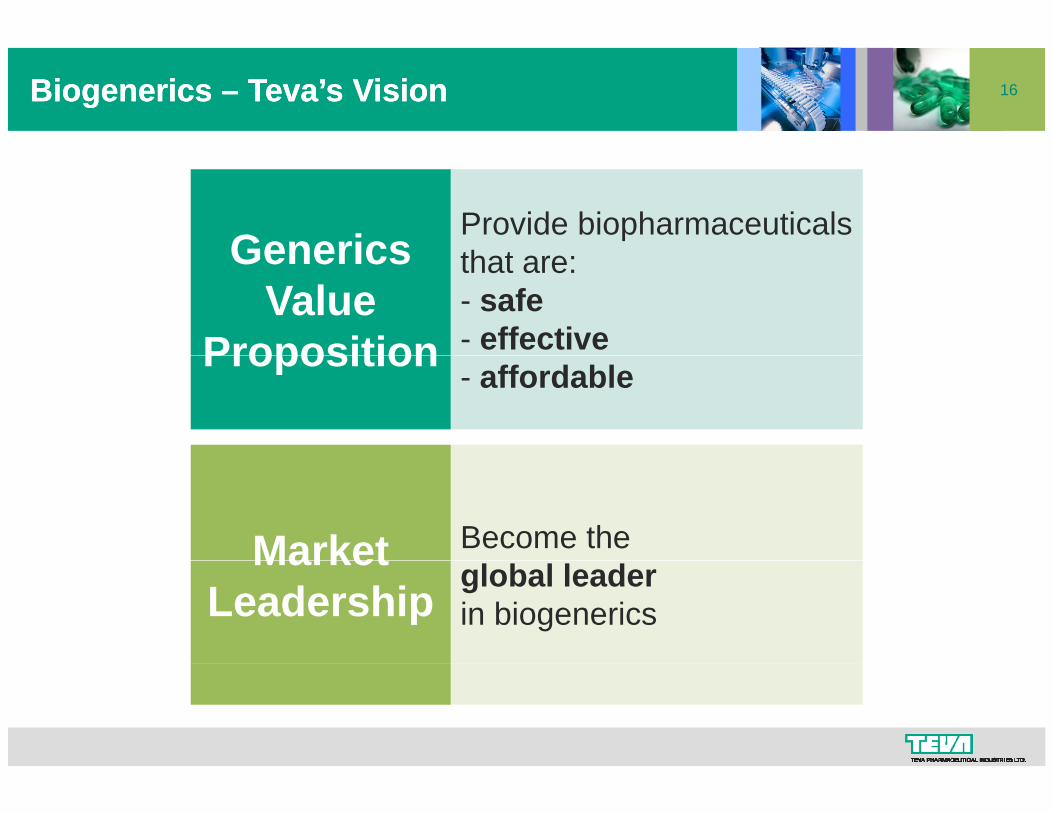
16Biogenerics Biogenerics –– Teva’s VisionTeva’s Vision
Provide biopharmaceuticalsth tGenerics that are:- safe- effective
Generics Value
Proposition- affordableProposition
Become theMarket global leaderin biogenerics
Market Leadership
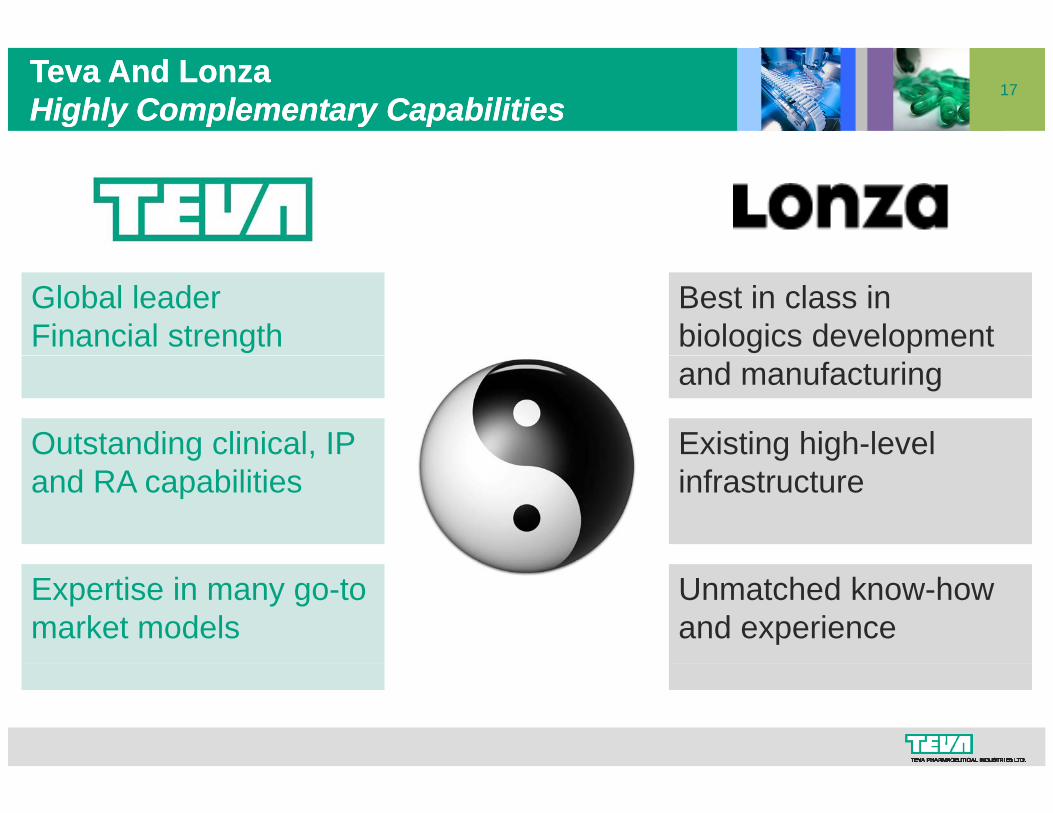
17Teva And LonzaTeva And LonzaHighly Complementary CapabilitiesHighly Complementary Capabilities
Global leaderFinancial strength
Best in class in biologics development
Outstanding clinical, IP
and manufacturing
Existing high-level g ,and RA capabilities
g ginfrastructure
Expertise in many go-to market models
Unmatched know-how and experience
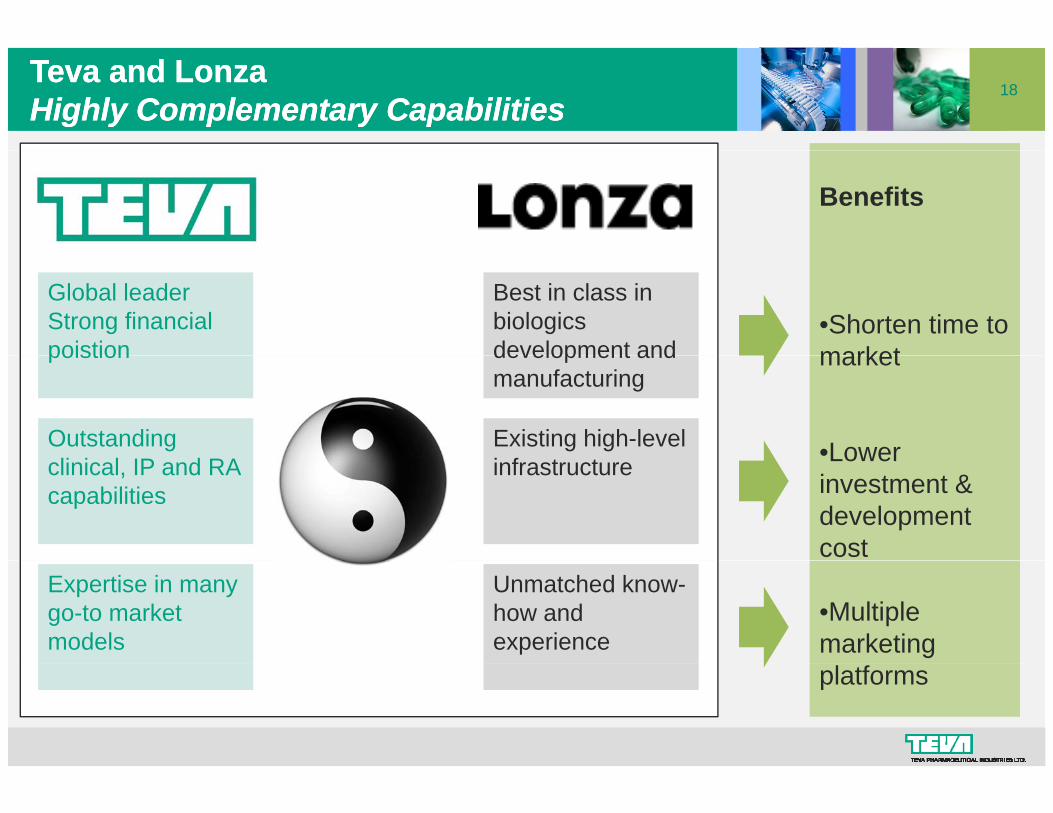
18TevaTeva and and LonzaLonzaHighly Complementary CapabilitiesHighly Complementary Capabilities
Benefits
Global leaderStrong financial poistion
Best in class in biologics development and
•Shorten time to marketpoistion
Outstanding li i l IP d RA
development and manufacturing
Existing high-level i f
market
•Lowerclinical, IP and RA capabilities
infrastructure Lower investment & development cost
Expertise in many go-to market models
Unmatched know-how and experience
•Multiple marketing platforms

19Teva and LonzaTeva and LonzaJV Fundamentals JV Fundamentals
50 / 50 j i t t50 / 50 joint venture
Targeting $30bn in brand value
JV’s contribution as early as 2014
20
2008 at a glance
The future of generics
Biogenerics
OutlookOutlook

21Barr IntegrationBarr Integration
Cost Over $400m vs. initial estimateSynergies of $300M
Accretion Q3 2009 vs. initial estimateof Q4 2009of Q4 2009
Financial Strength
Financial leverage to return to pre-Barr level in 1 year

22OutlookOutlook
Sales $14 1bn $14 6bn2009 Sales $14.1bn - $14.6bn
EPS* $3.20 - $3.40
*Non-GAAP
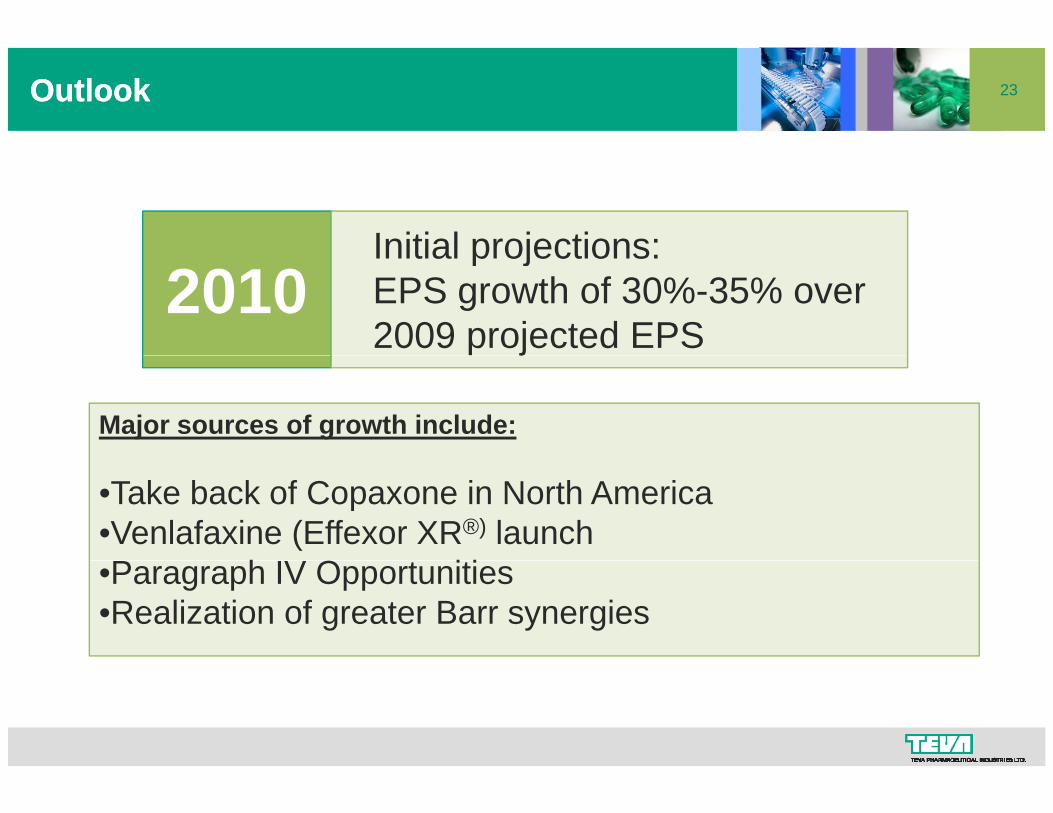
23OutlookOutlook
Initial projections:2010
Initial projections:EPS growth of 30%-35% over 2009 projected EPSj
Major sources of growth include:
•Take back of Copaxone in North America•Venlafaxine (Effexor XR®) launchP h IV O i i•Paragraph IV Opportunities
•Realization of greater Barr synergies
24
Teva Investor & Analyst Meeting Bill MarthPresident and CEO Teva North AmericaFebruary 18th, 2009
President and CEO, Teva North America

25Leadership in U.S. generics% of total Rx’s full year generics only 2008
59823.8 24.0 Teva
% of total Rx s, full year, generics only 20082007Rx’s
thousand
307
223
12.2
8.9
11.9
9.4
Mylan
Watson
189
95
7.5
3.8
8.2
3.9
Sandoz
Mallinckrodt
93
90
3.7
3.6
2.6
3.5
Apotex
Qualitest
~1 6 million Rx’s per day~1 6 million Rx’s per day
78
823.3
3.1
3 1
3.4
3.6
Greenstone
Actavis
~1.6 million Rx s per day
50% more than #2
~1.6 million Rx s per day
50% more than #2
613.1 1.3 Lupin
Source: IMS National Prescription Audit MAT December 2008
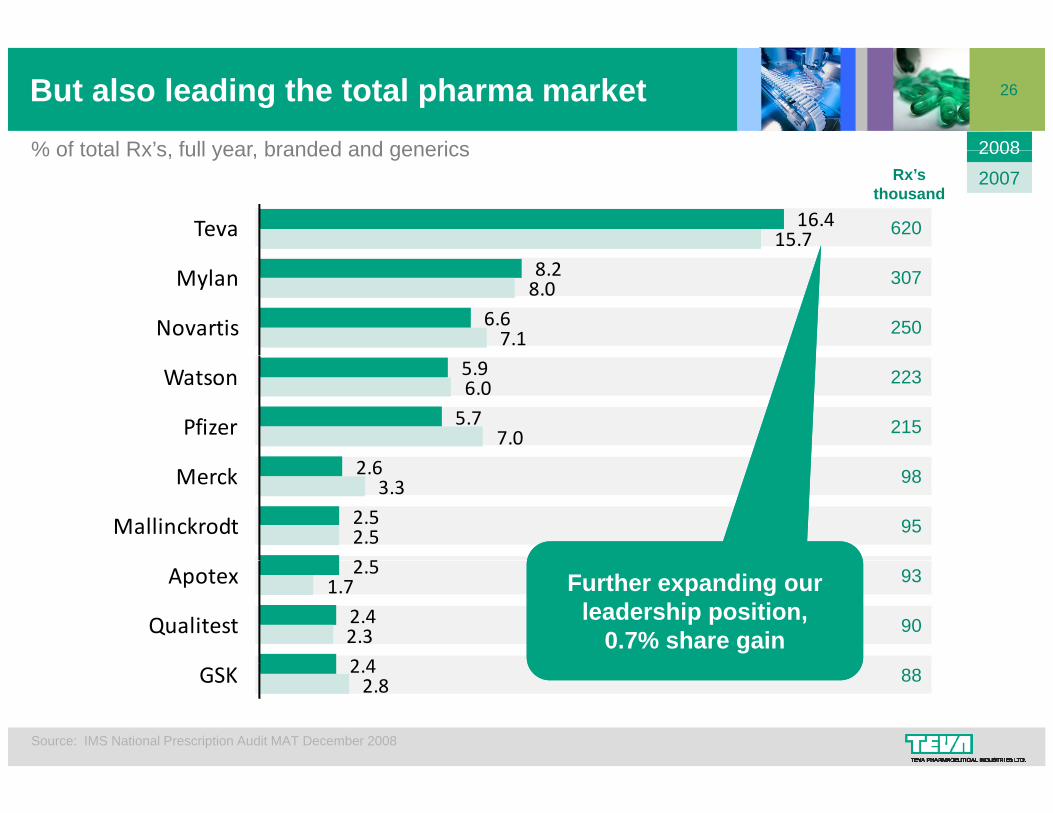
26But also leading the total pharma market% of total Rx’s full year branded and generics 2008
620
% of total Rx s, full year, branded and generics
16.4 15.7 Teva
20082007Rx’s
thousand
307
250
8.2
6.6 8.0
7.1
Mylan
Novartis
223
215
5.9
5.7 6.0
7.0
Watson
Pfizer
98
95
2.6
2.5
2 5
3.3
2.5
Merck
Mallinckrodt
90
932.5
2.4
2 4
1.7
2.3
Apotex
Qualitest
Further expanding our leadership position,
0.7% share gain
Further expanding our leadership position,
0.7% share gain882.4
2.8 GSK
Source: IMS National Prescription Audit MAT December 2008
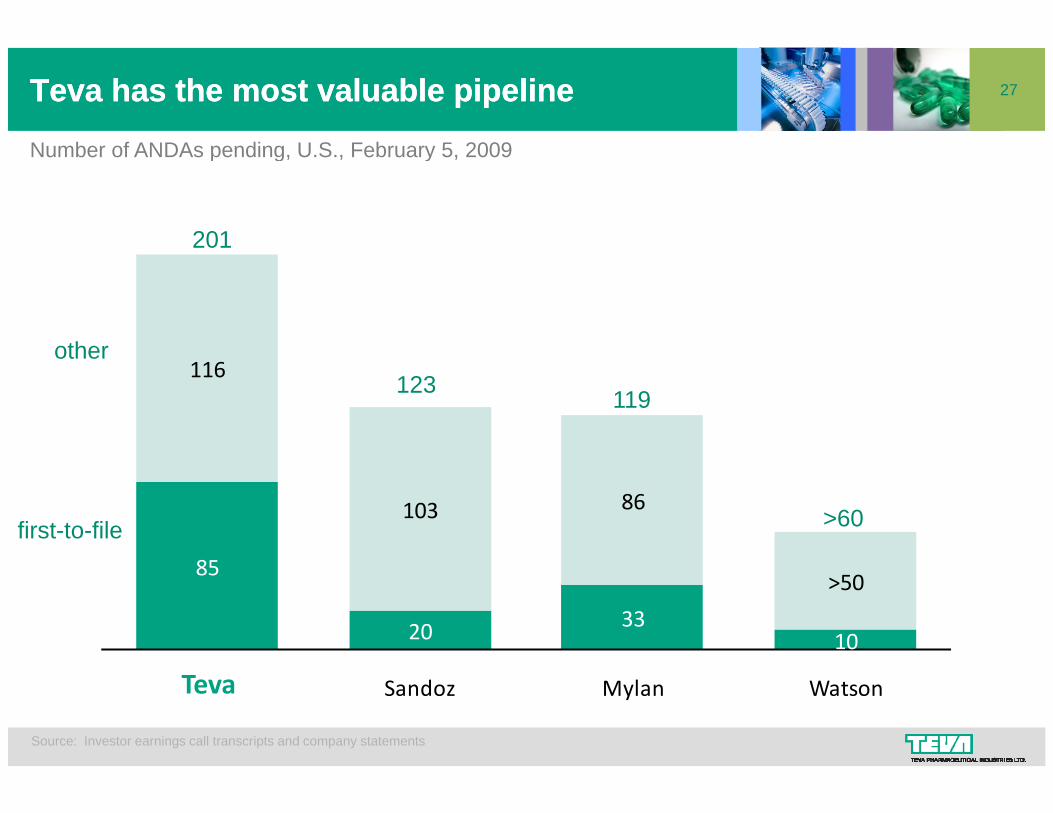
27TevaTeva has the most valuable pipelinehas the most valuable pipeline
Number of ANDAs pending U S February 5 2009Number of ANDAs pending, U.S., February 5, 2009
201
other116
other123 119
85
103 86first-to-file >60
85
20 3310
>50
Teva + Barr Sandoz Mylan Watson
Source: Investor earnings call transcripts and company statements
Teva
28
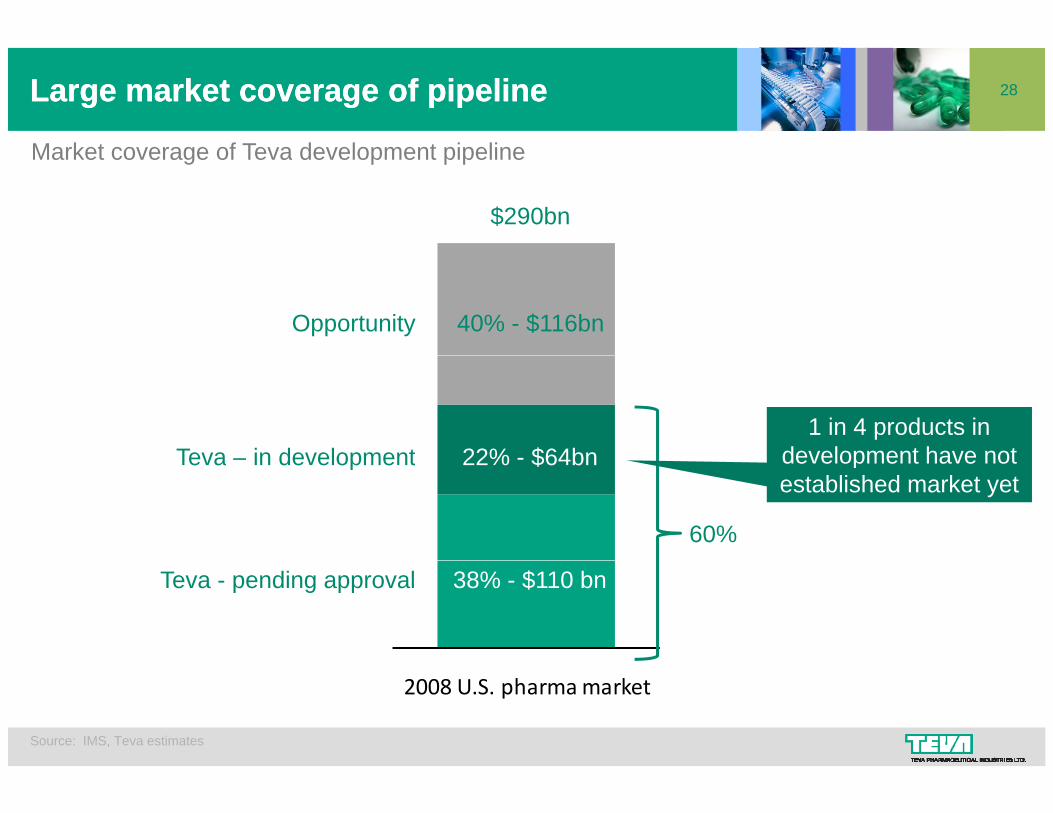
Market coverage of Teva development pipeline
Large market coverage of pipelineLarge market coverage of pipeline
$290bn
Market coverage of Teva development pipeline
40% - $116bnOpportunity
22% - $64bnTeva in development1 in 4 products in
development have not22% - $64bnTeva – in development development have not established market yet
60%
38% - $110 bnTeva - pending approval
2008 U.S. pharma market
Source: IMS, Teva estimates
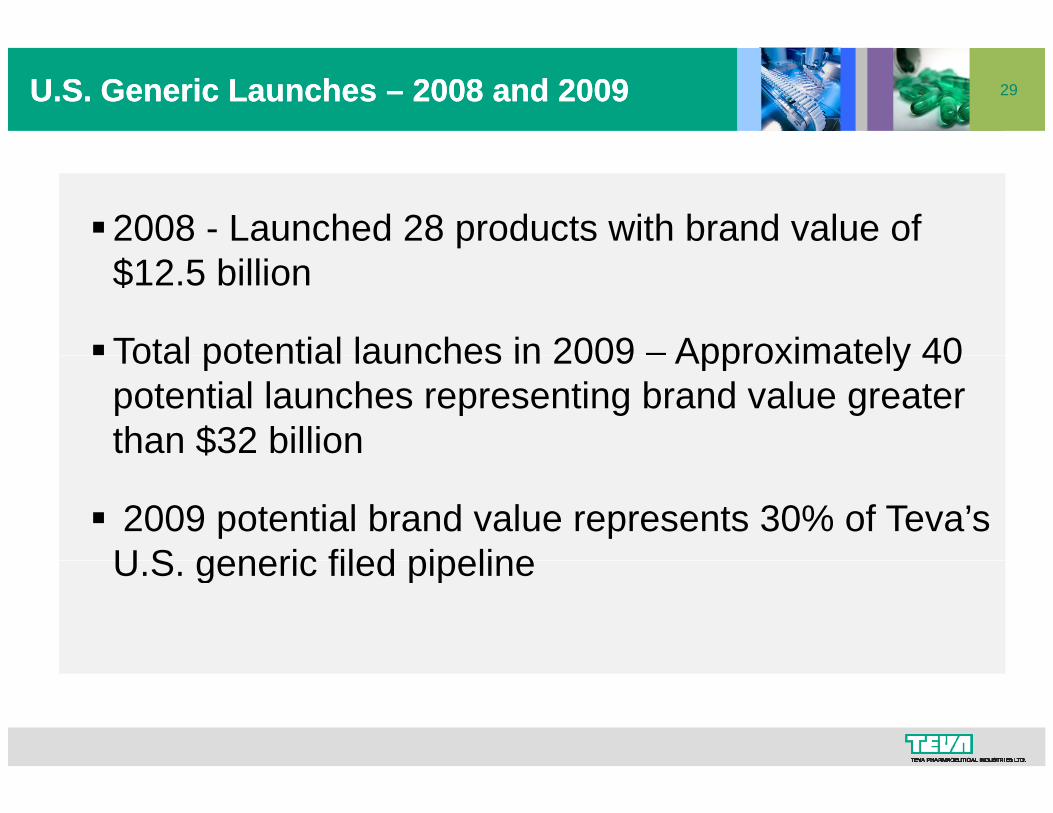
29U.S. Generic Launches U.S. Generic Launches –– 2008 2008 and and 20092009
2008 - Launched 28 products with brand value of $12.5 billion
Total potential launches in 2009 – Approximately 40Total potential launches in 2009 Approximately 40 potential launches representing brand value greater than $32 billion
2009 potential brand value represents 30% of Teva’s U S generic filed pipelineU.S. generic filed pipeline
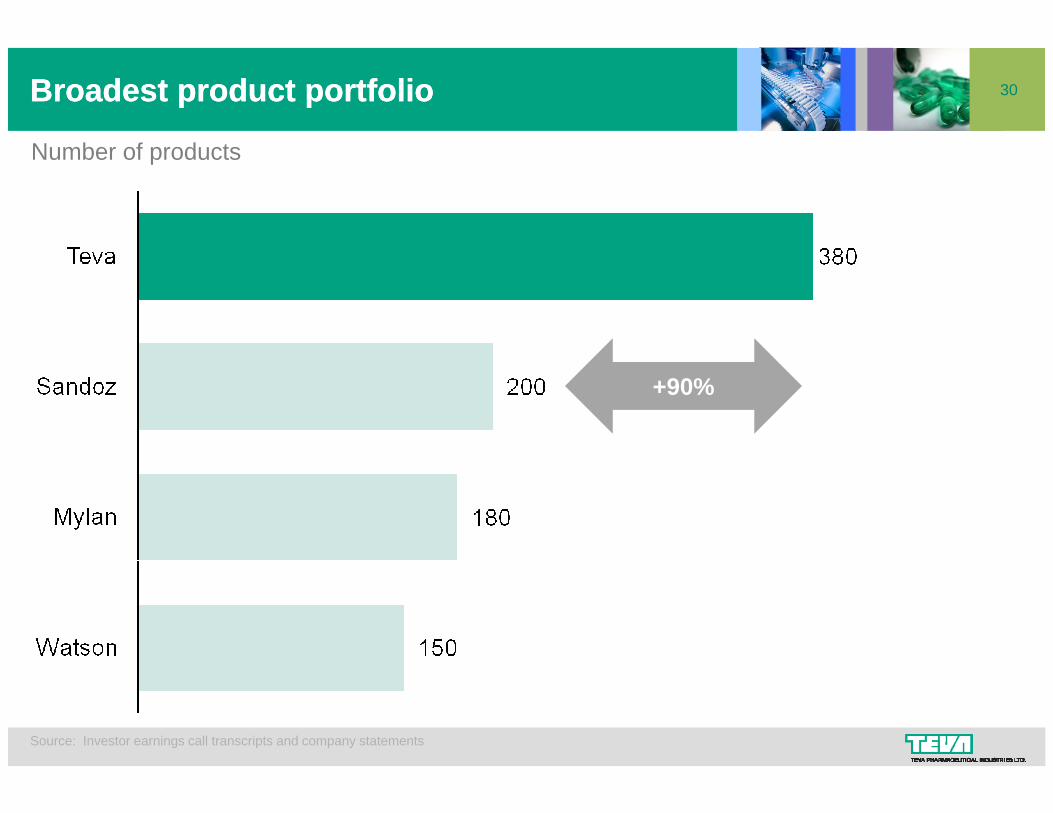
30Broadest product portfolioBroadest product portfolio
Number of productsNumber of products
+90%
Source: Investor earnings call transcripts and company statements

31The legislative landscapeThe legislative landscape
2009 - a new administration,a foc s on healthcare reforma focus on healthcare reform
Impact of increased role of government as payer of Rx drugs will influence policymakingpayer of Rx drugs will influence policymaking
25th anniversary of Hatch-Waxman –legislation that saved consumers billions oflegislation, that saved consumers billions of dollars
Biogenerics legislation will open the market toBiogenerics legislation will open the market to competition, creating savings especially important in current economic climate

32Biologics in the U.S.Biologics in the U.S.
Broad agreement that the regulatory pathway
STATUS OF ISSUES
g g y p yshould be:- science driven- led by FDATop of legislative agenda - without unnecessary delays
Need for a process to resolve patent disputes, Teva wants a streamlined process
in 2009 – 2010
Strong consensus for generic biologics Teva wants a streamlined process
Exclusivity remains a focal point of debate,Teva supports a period that makes sense for
generic biologicsamong payers, consumer groups
pp pconsumers, and encourages a healthy/competitive market

33Broader government affairs issuesBroader government affairs issues
Patent settlements
Drug quality and foreign inspections
FDA Funding
Patent reform
34
Teva Investor & Analyst Meeting Eyal DeshehCFOFebruary 18th, 2009
CFO
35
All figures $bn except EPS $
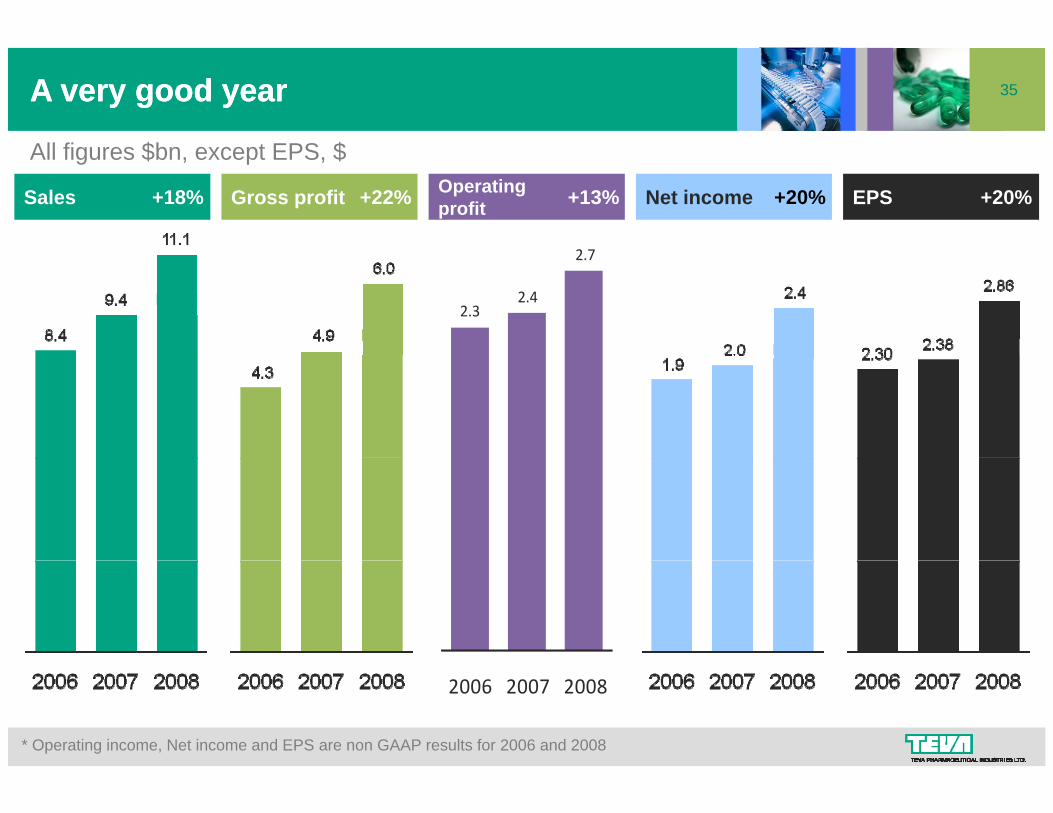
A very good yearA very good year
2 7
Sales Gross profit Operatingprofit Net income EPS
All figures $bn, except EPS, $
+18% +22% +13% +20% +20%
2.32.4
2.7
2006 2007 2008
* Operating income, Net income and EPS are non GAAP results for 2006 and 2008
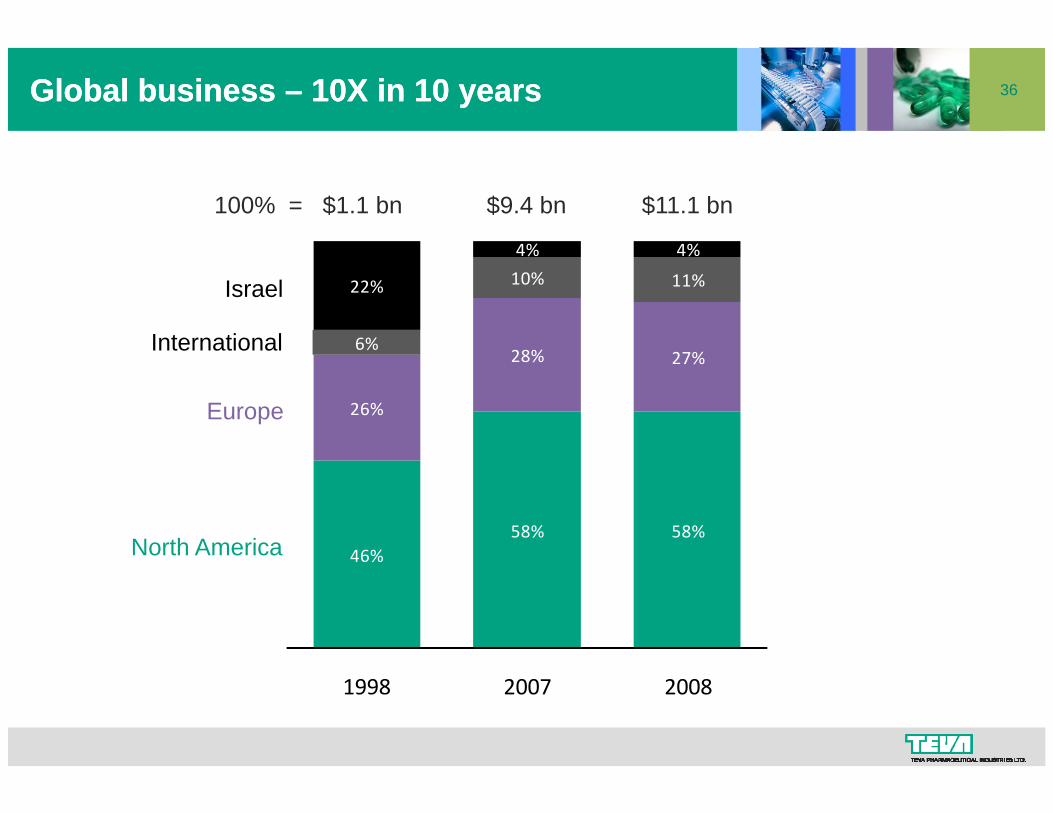
36Global business Global business –– 1010X in X in 10 10 years years
$11.1 bn$9.4 bn
4% 4%
100% = $1.1 bn $11.1 bn$9.4 bn
Israel
International28% 27%
6%
10% 11%22%
4% 4%
Europe 26%
28% 27%
North America 46%58% 58%
46%
1998 2007 2008

37Foreign exchange rate effect Foreign exchange rate effect –– quarterlyquarterly
$ million unless stated otherwise
Q4 2007
FX effect
Q4 2008
FX effectgrowth real
growth
$ million unless stated otherwise
Total sales 2,576 -1302,848 -5%+11% +16%
Operating profit 661 -28704 -4%+7% +11%
N th A i 1 435 171 652 1%15% 16%North America 1,435 -171,652 -1%+15% +16%
Europe 664 -88668 -13%+1% +14%
International 337 -21382 -6%+13% +19%
API 140 -7146 -3%+4% +7%
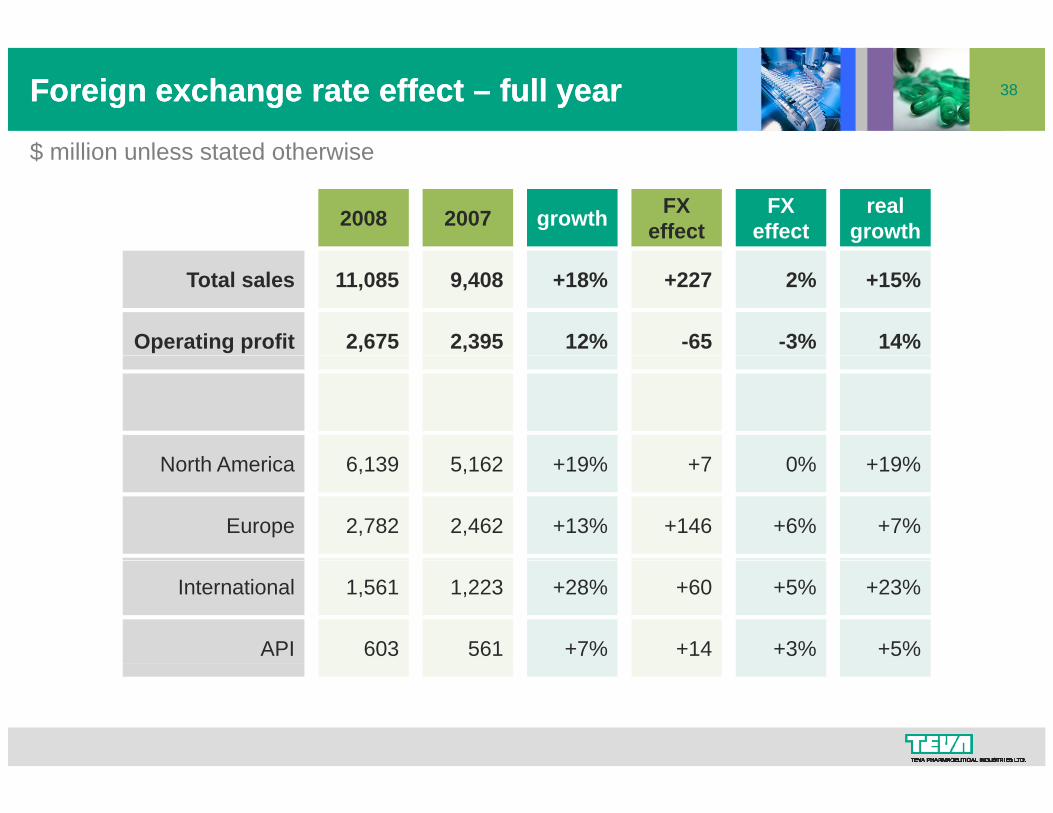
38Foreign exchange rate effect Foreign exchange rate effect –– full yearfull year
$ million unless stated otherwise
2007 FX effect2008 FX
effectgrowth real growth
$ million unless stated otherwise
Total sales 9,408 +22711,085 2%+18% +15%
Operating profit 2,395 -652,675 -3%12% 14%
N th A i 5 162 76 139 0%19% 19%North America 5,162 +76,139 0%+19% +19%
Europe 2,462 +1462,782 +6%+13% +7%
International 1,223 +601,561 +5%+28% +23%
API 561 +14603 +3%+7% +5%
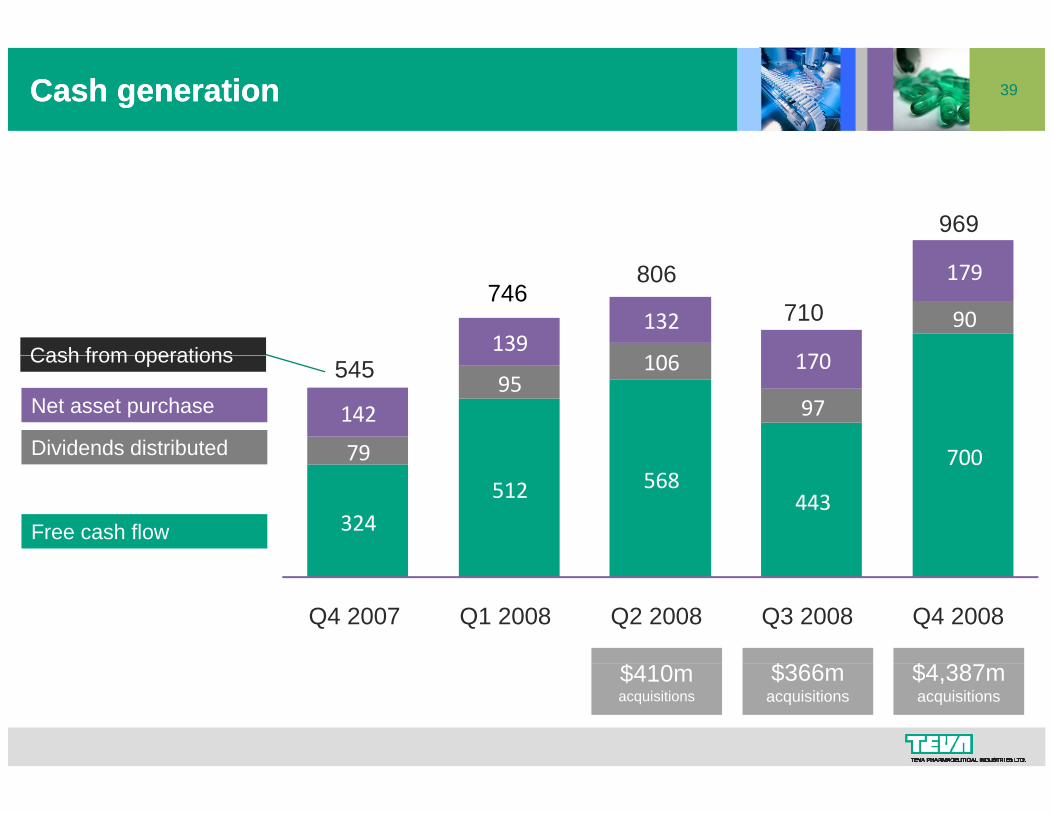
39Cash generationCash generation
969
106
90139
132
170
179746
806
Cash from operations
710
70079
95106
97142
170
Net asset purchase
Dividends distributed
545Cash from operations
324512 568
443
70079
Free cash flow
Q4 2007 Q1 2008 Q2 2008 Q3 2008 Q4 2008
$ $ $$410macquisitions
$366macquisitions
$4,387macquisitions

40
$ bn
Balance sheetBalance sheet
$ bn
ASSETS LIABILITIES
12/31/2007
2.96.0
12/31/2008
1.98.1
Cash and investmentsInventory, receivables
Short-term debtConvertible debentures
12/31/2007
1.81.4
12/31/2008
2.30.6
1.09.9
0.6
1.511.5
0.4
y,Other short-term assets
Short-term assets
Long-term investments
Other short-term liab.Short-term liabilities
Long-term debt
2.15.4
4.3
5.68.5
8.12.5
10.413.6
3.717.321.4
gNet fixed assets
Other long-term assetsLong-term assets
g
Equity 13.8 16.3
23.4 32.9Total assets Total liabilities 23.4 32.9
27% 34%Leverage
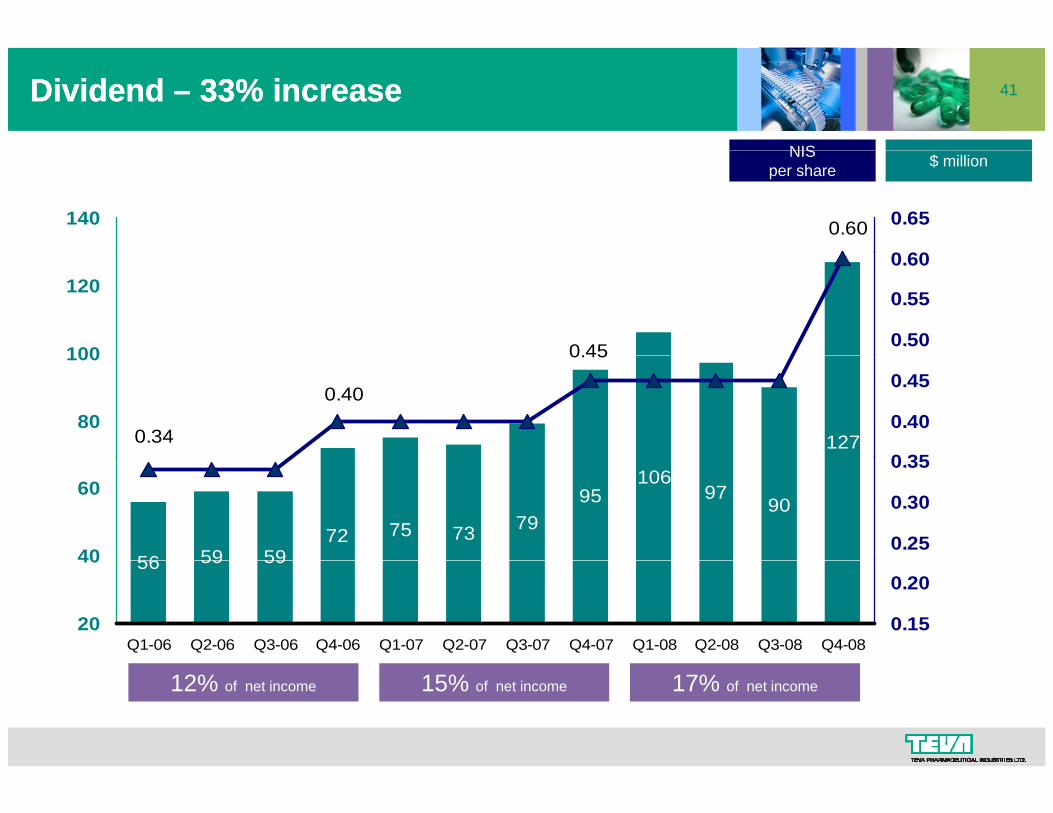
41Dividend Dividend –– 3333% increase% increase
NIS
0.60140
0 60
0.65
$ millionNISper share
0.45100
120
0.50
0.55
0.60
127
0.45
0.40
0.3480
100
0 35
0.40
0.45
56 59 5972 75 73 79
95106
9790
40
60
0.25
0.30
0.35
56 59 59
20
40
Q1-06 Q2-06 Q3-06 Q4-06 Q1-07 Q2-07 Q3-07 Q4-07 Q1-08 Q2-08 Q3-08 Q4-080.15
0.20
12% of net income 15% of net income 17% of net income

42New nonNew non--GAAP GAAP EPSEPS
2006* 2007 2008* 08-09 2009E** 08-09E
$m $m $m % $m %
Reported net income 1,867 1,952 2,374 22% 2,608to 2,791 10%-18%
$m $m $m % $m %
Amortization***
Non-GAAP net income
154
2 021
171
2 123
142
2 516 19%
477
2,928 16%-24%Non GAAP net income
Reported EPS
2,021
2.30
2,123
2.38
2,516
2.86
19%
20%
to 3,111
2.85to 3.05
16% 24%
0%-7%
Amortization***
Non GAAP EPS
0.19
2 49
0.21
2 59
0.17
3 03 17%
0.35
3.20
0.35
6% 12%
* 2006 and 2008 reported net income and EPS are non-GAAP results** 2009 net income and EPS assumes 915 million shares; *** Net of tax
Non-GAAP EPS 2.49 2.59 3.03 17% to 3.40 6%-12%
43
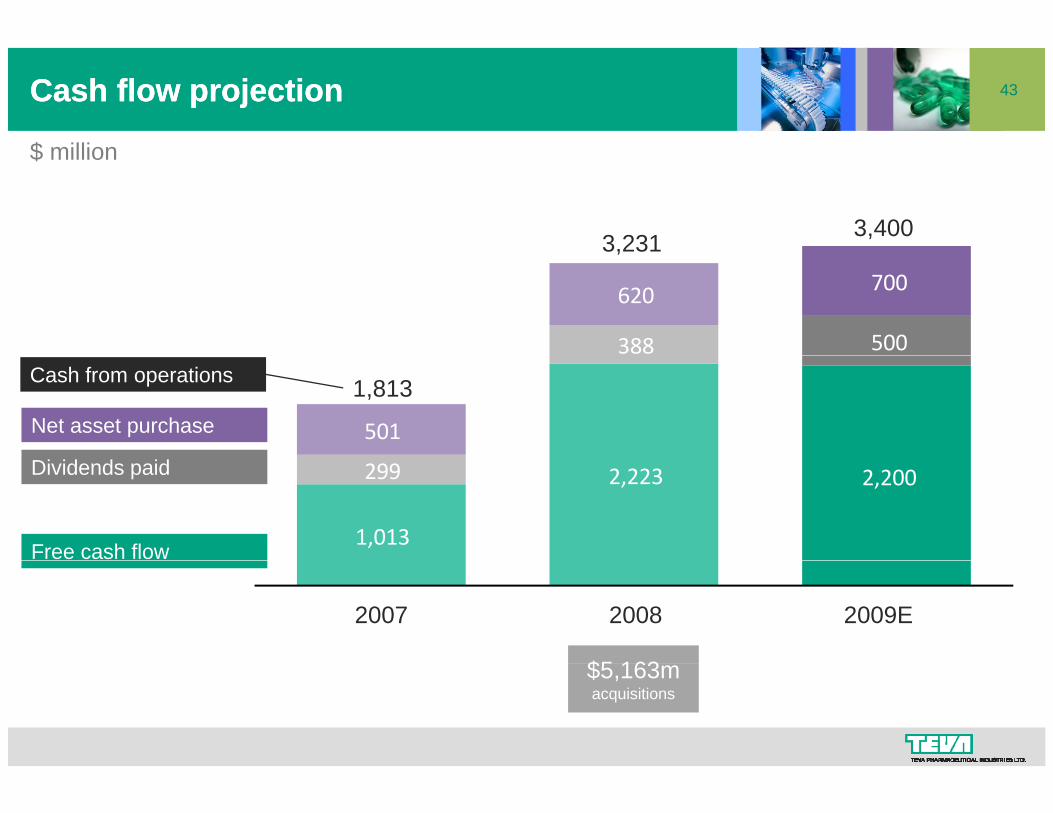
$ million
Cash flow projectionCash flow projection
$ million
3,231 3,400
388 500
620 700
,
501 Net asset purchase
1,813Cash from operations
1,013
2,223 2,200 299 Dividends paid
Free cash flow
2007 2008 2009E
$5 163$5,163macquisitions
44
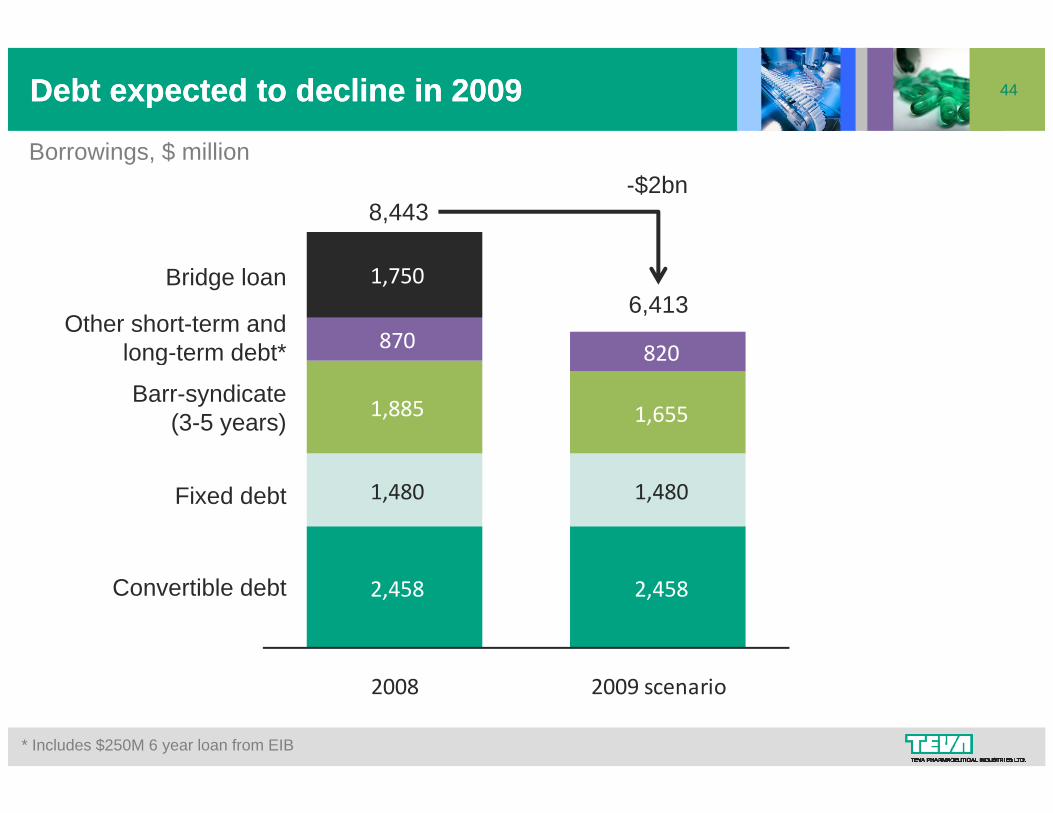
Borrowings $ million
Debt expected to decline in Debt expected to decline in 20092009
Borrowings, $ million
8,443-$2bn
870 820
1,750
Other short-term andlong-term debt*
Bridge loan6,413
1,885 1,655
820 long term debt
Barr-syndicate(3-5 years)
1,480 1,480 Fixed debt
2,458 2,458 Convertible debt
2008 2009 scenario
* Includes $250M 6 year loan from EIB
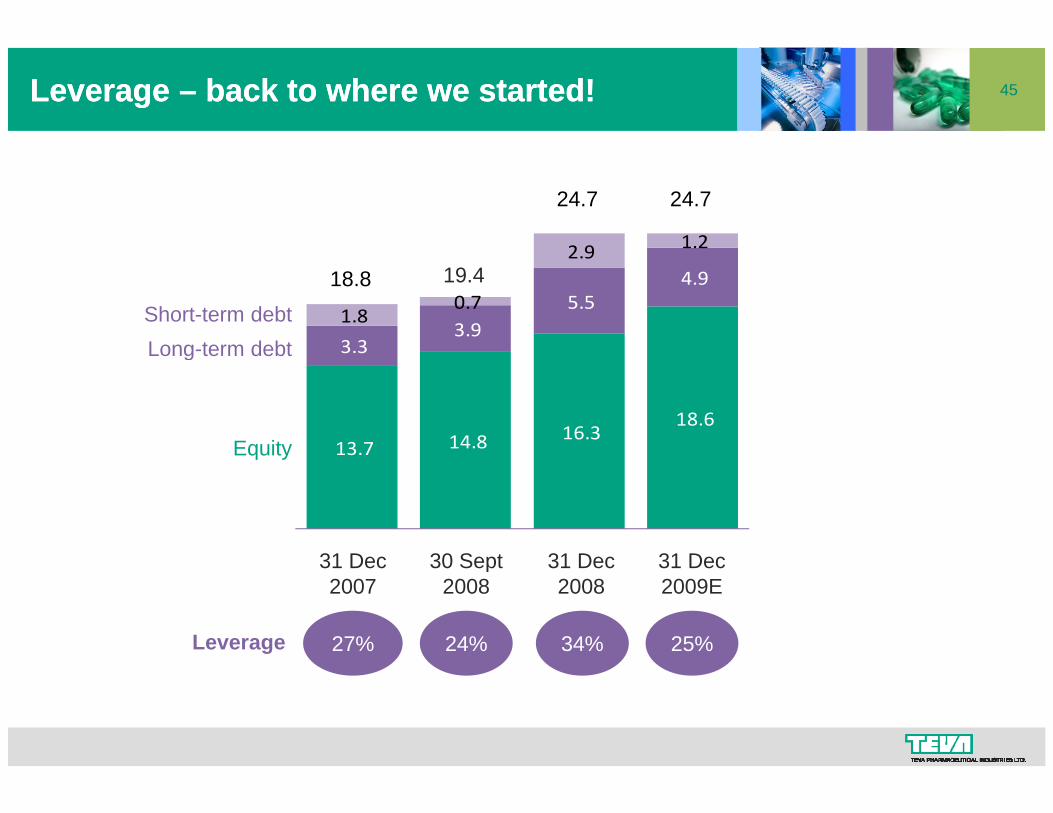
45Leverage Leverage –– back to where we started!back to where we started!
2 9 1.2
24.7 24.7
3.3 3.9
5.5 4.9
1.8 0.7
2.9 18.8 19.4
Long-term debtShort-term debt
13.7 14.8 16.3 18.6
Equity
Long term debt
31 Dec 30 Sept 31 Dec 31 Dec
q y
31 Dec2007
30 Sept2008
31 Dec2008
27% 24% 34%Leverage
31 Dec2009E
25%
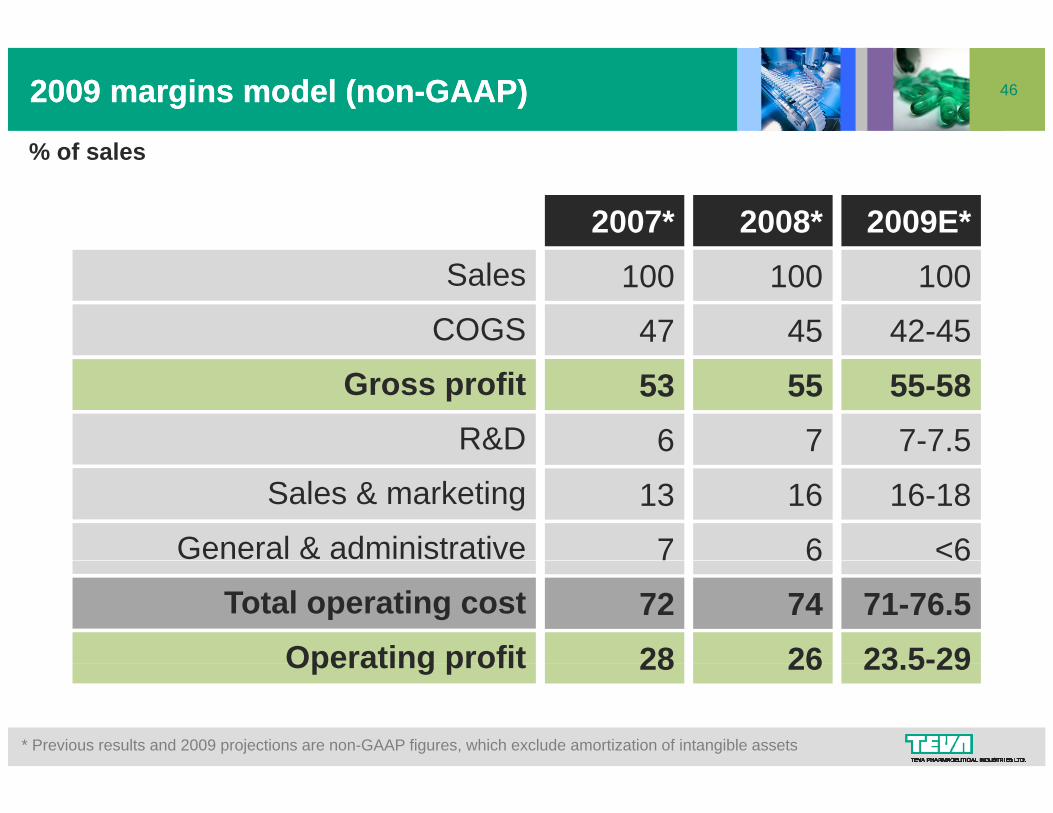
462009 2009 margins model (nonmargins model (non--GAAP)GAAP)
% of sales
2007* 2008* 2009E*
% of sales
Sales
COGS100 100 100
47 45 42-45
Gross profitR&D
53 55 55-586 7 7-7.5
Sales & marketing
General & administrative13 16 16-18
7 6 <6Total operating cost
Operating profit
6 6
72 74 71-76.528 26 23 5-29Operating profit 28 26 23.5-29
* Previous results and 2009 projections are non-GAAP figures, which exclude amortization of intangible assets
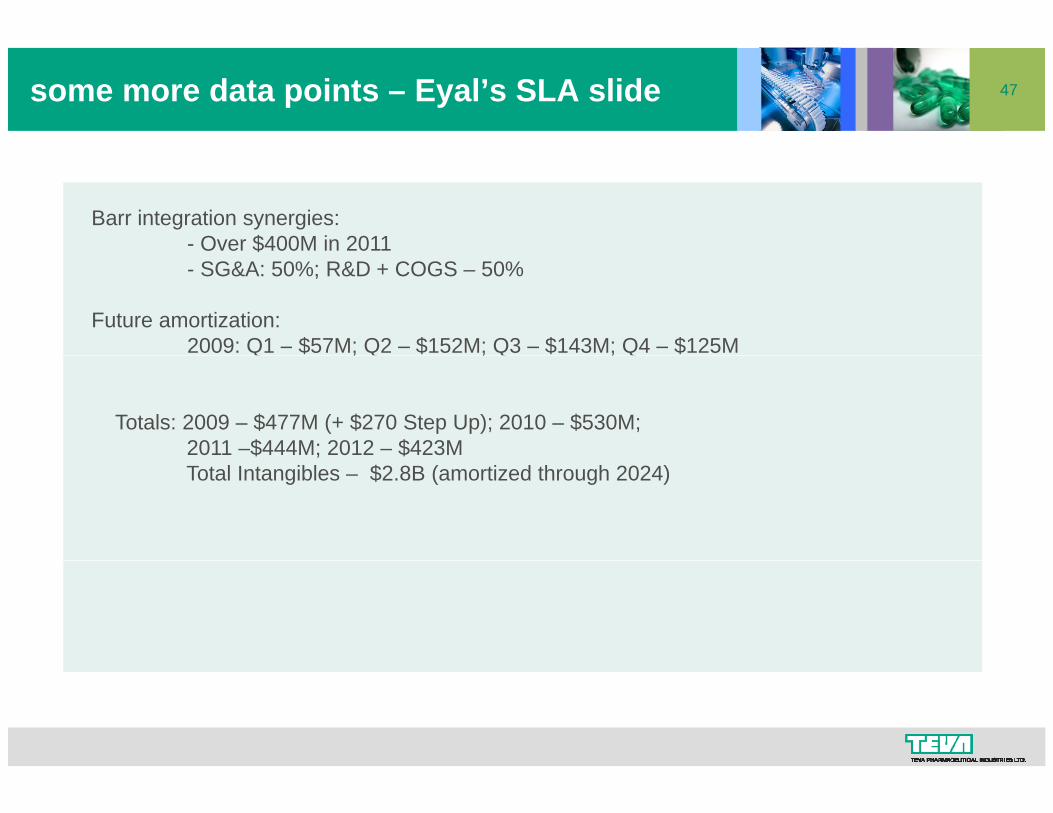
47Eyal’s SLA slide–some more data points
Barr integration synergies:- Over $400M in 2011- SG&A: 50%; R&D + COGS – 50%
Future amortization:2009: Q1 – $57M; Q2 – $152M; Q3 – $143M; Q4 – $125M; ; ;
Totals: 2009 – $477M (+ $270 Step Up); 2010 – $530M; 2011 –$444M; 2012 – $423MTotal Intangibles – $2.8B (amortized through 2024)
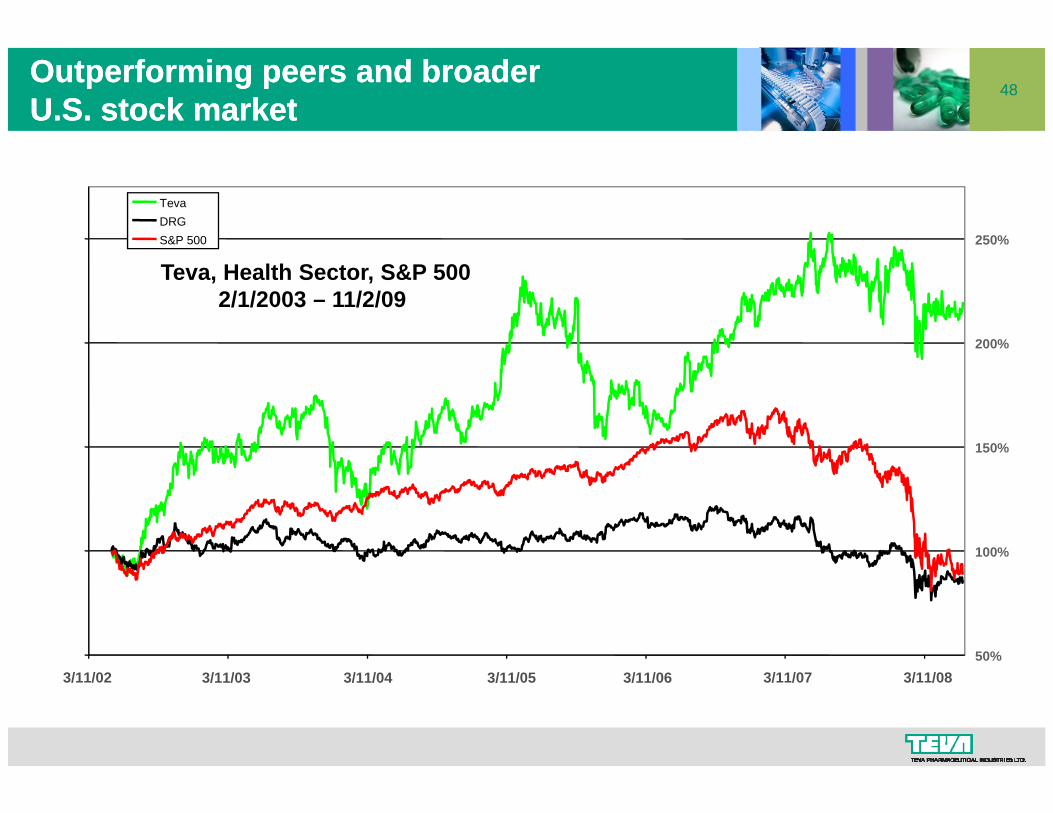
48Outperforming peers and broader Outperforming peers and broader U.S. stock marketU.S. stock market
250%
TevaDRGS&P 500
200%
Teva, Health Sector, S&P 5002/1/2003 – 11/2/09
150%
100%
50%3/11/02 3/11/03 3/11/04 3/11/05 3/11/06 3/11/07 3/11/08
49
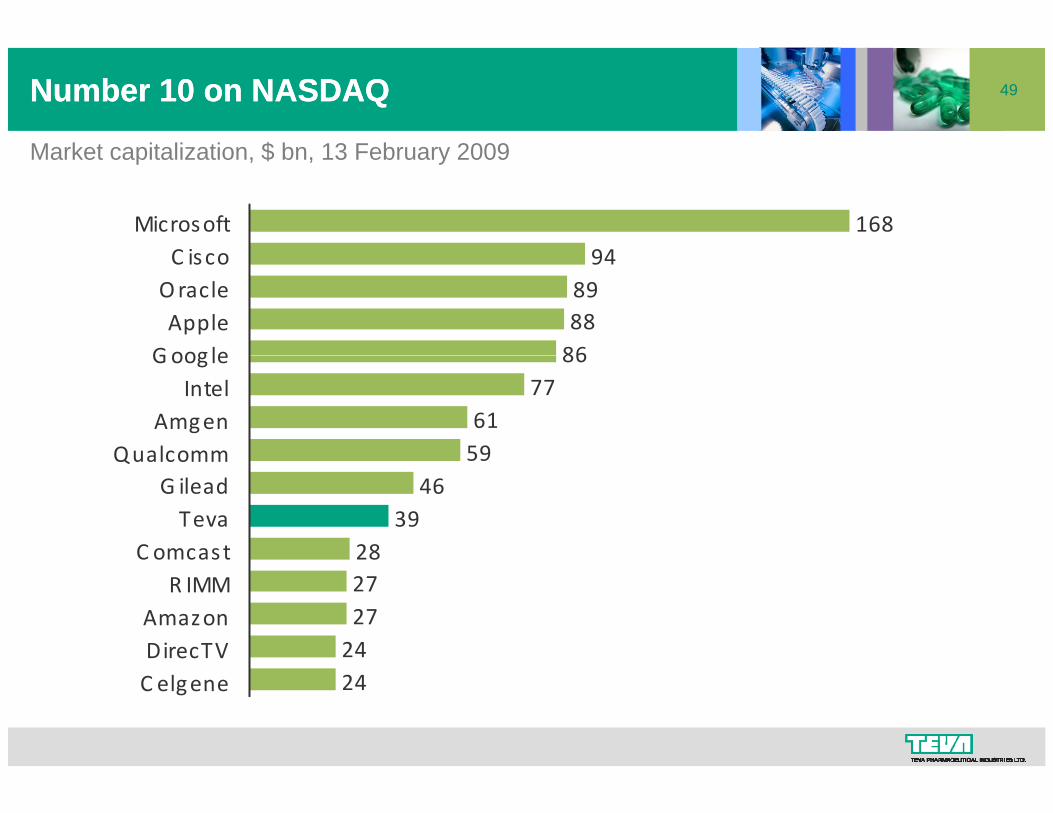
Market capitalization $ bn 13 February 2009
Number Number 10 10 on NASDAQon NASDAQ
Market capitalization, $ bn, 13 February 2009
16894
MicrosoftC i 94
898886
C iscoOracleApple
Goog le 8677
6159
Goog leIntel
AmgenQualcomm 59
4639
28
QualcommG ileadTeva
C omcast272724
R IMMAmazonDirecTV
24C elgene
50SummarySummary
A very strong ending to a better then forecasted year
2009 and 2010 look good!
Foreign exchange impact
Very strong cash generationVery strong cash generation
Solid balance sheet, leverage better than planned
Barr integration – better than originally anticipated

51
THANK YOU!