texas instruments 2006 annual report
TRANSCRIPT

2 0 0 6 A N N U A L R E P O R T
T

TEXAS INSTRUMENTS 2006 ANNUAL REPORT
2006 2005Net revenue $ 14,255 $ 12,335Cost of revenue 6,996 6,319Gross profit 7,259 6,016Gross profit % of revenue 50.9% 48.8 %Research and development (R&D) 2,195 1,986R&D % of revenue 15.4% 16.1%Selling, general and administrative (SG&A) 1,697 1,471SG&A % of revenue 11.9% 11.9 %Profit from operations 3,367 2,559Operating profit % of revenue 23.6% 20.7 %Other income (expense) net 265 205Interest expense on loans 7 9Income from continuing operations before income taxes 3,625 2,755Provision for income taxes 987 582Income from continuing operations 2,638 2,173Income from discontinued operations, net of income taxes 1,703 151Net income $ 4,341 $ 2,324Diluted earnings per common share:Income from continuing operations $ 1.69 $ 1.30Net income $ 2.78 $ 1.39Average shares outstanding, diluted 1,560 1,671
* See financial statements for complete statements and notes.
TABLE OF CONTENTS
1 Letter to Our Shareholders
2 Summary of Operations
4 Analog Snapshot
5 Financial Statements
60 Stockholder andOther Information
61 Board of Directors,Executive Officers andTI Fellows
ABOUT TI
Texas Instruments Incorporated provides innovative analog and DSP technologies to meetour customers’ real-world signal processing requirements. In addition to Semiconductor,the company includes the Education Technology business. TI is headquartered in Dallas,Texas, and has manufacturing, design or sales operations in more than 25 countries.
Texas Instruments is traded on the New York Stock Exchange under the symbol TXN.More information is located at www.ti.com.
Statement of Operations Selected Items*(In millions, except per-share amounts)
Rich Templeton (left), President and Chief Executive Officer, andTom Engibous, Chairman of the Board
Except as noted, financial results are forcontinuing operations.

TEXAS INSTRUMENTS 2006 ANNUAL REPORT 1
TO OUR SHAREHOLDERS
Thomas J. Engibous
Chairman of the Board Richard K.Templeton
President and Chief Executive Officer
All of us at Texas Instruments are committed to building a great company. That means developing products that drive innovationand fit the needs of the market, as well as providing our customers with industry-leading support. In 2006, we made significantprogress in both these areas. We strengthened our focus on analog and digital signal processors (DSPs), and delivered new products to help our customers get to market faster with features few thought possible just a few years before. In addition, weinvested in making ourselves available everywhere our customers are, opening new support locations in Asia and Eastern Europeand increasing the number of TI analog field applications engineers by 45 percent. As a result, we have better aligned ourselveswith our customers’ needs and can respond more quickly to changes in the marketplace.
We still have plenty of road to travel before reaching our goal of “great,” but our efforts last year made a real difference to our customers – and, as a result, a real difference to TI. In 2006, we grew faster than the semiconductor market, gaining share forthe fifth consecutive year and taking our total revenue beyond the $14 billion mark for the first time in our company’s history. Inaddition, we achieved our goal of growing earnings per share faster than revenue and delivering greater value to our share-holders. These results came, in part, from improving the efficiency of our operations, but primarily from becoming more respon-sive to our customers’ global needs and making it easier for them to choose TI.
TI analog revenue grew robustly last year and was an important part of the TI story – and we expect its role to increase in theyears ahead. As the digital revolution speeds forward, advances in analog have become critical to a wide range of electronicdevices, from the multimedia cell phones connecting people around the world, to heart defibrillators that help save lives. TI iscommitted to pushing the boundaries of technology and helping customers provide greater mobility, as well as more convenience,comfort and safety.
As we move forward on the analog front, DSPs remain a vital area of strength, especially in serving the growing demand forvideo technologies. The success of our DaVinciTM product line supports our belief that video is fast becoming an indispensablemedium for communicating information. Also important in charting our DSP course are the needs of emerging economies acrossthe globe. TI’s single-chip cell phone solutions are bringing down handset costs, but as we continue to innovate on the single-chipplatform, we are helping transform today’s “low cost” cell phone into a multimedia smartphone that connects and entertains billions of new consumers.
Together, sales growth of TI’s higher margin analog products and the effectiveness of combining in-house and foundry manu-facturing continue to deliver marked improvements in our financial performance. Despite periodic shifts in demand, our hybridmanufacturing strategy has enabled us to meet customer needs more efficiently and to ensure more consistent usage of our factories. As a result, TI’s profitability reached a new record, and we increased our return on invested capital. Moreover, strongcash flow from operations in 2006 allowed us to provide our shareholders with higher dividends and increased stock repurchases,which reduced the number of shares outstanding by 9 percent.
We take on 2007 with the goal of delivering even greater value to our customers, our shareholders and the world at large. Allof us at TI believe we have just begun to realize our potential, and there are countless opportunities still out there for TI productsand expertise to make a difference. As the world continues to embrace digital technology, advances in both analog and DSP willbe critical to developing new and more effective ways to improve people’s lives. And TI is committed to staying at the forefront,expanding the possibilities for electronics innovation and demonstrating the amazing power of semiconductor technology.
138397_TI_R8 2/23/07 1:13 PM Page 4
TEXAS INSTRUMENTS 2006 ANNUAL REPORT2
SUMMARY OF OPERATIONS
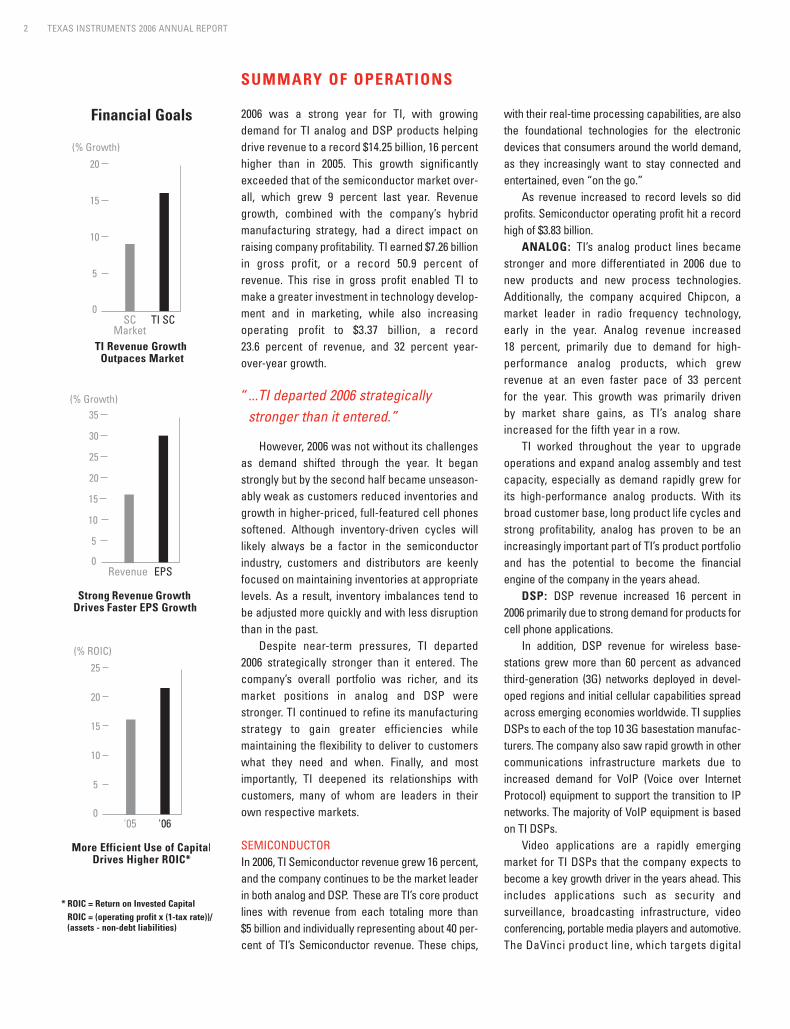
2006 was a strong year for TI, with growingdemand for TI analog and DSP products helpingdrive revenue to a record $14.25 billion, 16 percenthigher than in 2005. This growth significantlyexceeded that of the semiconductor market over-all, which grew 9 percent last year. Revenuegrowth, combined with the company’s hybridmanufacturing strategy, had a direct impact onraising company profitability. TI earned $7.26 billionin gross profit, or a record 50.9 percent of revenue. This rise in gross profit enabled TI tomake a greater investment in technology develop-ment and in marketing, while also increasingoperating profit to $3.37 billion, a record 23.6 percent of revenue, and 32 percent year-over-year growth.
However, 2006 was not without its challengesas demand shifted through the year. It beganstrongly but by the second half became unseason-ably weak as customers reduced inventories andgrowth in higher-priced, full-featured cell phonessoftened. Although inventory-driven cycles willlikely always be a factor in the semiconductorindustry, customers and distributors are keenlyfocused on maintaining inventories at appropriatelevels. As a result, inventory imbalances tend tobe adjusted more quickly and with less disruptionthan in the past.
Despite near-term pressures, TI departed2006 strategically stronger than it entered. Thecompany’s overall portfolio was richer, and itsmarket positions in analog and DSP werestronger. TI continued to refine its manufacturingstrategy to gain greater efficiencies whilemaintaining the flexibility to deliver to customerswhat they need and when. Finally, and mostimportantly, TI deepened its relationships withcustomers, many of whom are leaders in theirown respective markets.
SEMICONDUCTORIn 2006, TI Semiconductor revenue grew 16 percent,and the company continues to be the market leaderin both analog and DSP. These are TI’s core productlines with revenue from each totaling more than $5 billion and individually representing about 40 per-cent of TI’s Semiconductor revenue. These chips,
with their real-time processing capabilities, are alsothe foundational technologies for the electronicdevices that consumers around the world demand,as they increasingly want to stay connected andentertained, even “on the go.”
As revenue increased to record levels so didprofits. Semiconductor operating profit hit a recordhigh of $3.83 billion.
ANALOG: TI’s analog product lines becamestronger and more differentiated in 2006 due tonew products and new process technologies.Additionally, the company acquired Chipcon, amarket leader in radio frequency technology,early in the year. Analog revenue increased18 percent, primarily due to demand for high-performance analog products, which grewrevenue at an even faster pace of 33 percentfor the year. This growth was primarily drivenby market share gains, as TI’s analog shareincreased for the fifth year in a row.
TI worked throughout the year to upgradeoperations and expand analog assembly and testcapacity, especially as demand rapidly grew forits high-performance analog products. With itsbroad customer base, long product life cycles andstrong profitability, analog has proven to be anincreasingly important part of TI’s product portfolioand has the potential to become the financialengine of the company in the years ahead.
DSP: DSP revenue increased 16 percent in2006 primarily due to strong demand for products forcell phone applications.
In addition, DSP revenue for wireless base-stations grew more than 60 percent as advancedthird-generation (3G) networks deployed in devel-oped regions and initial cellular capabilities spreadacross emerging economies worldwide. TI suppliesDSPs to each of the top 10 3G basestation manufac-turers. The company also saw rapid growth in othercommunications infrastructure markets due toincreased demand for VoIP (Voice over InternetProtocol) equipment to support the transition to IPnetworks. The majority of VoIP equipment is basedon TI DSPs.
Video applications are a rapidly emergingmarket for TI DSPs that the company expects tobecome a key growth driver in the years ahead. Thisincludes applications such as security and surveillance, broadcasting infrastructure, videoconferencing, portable media players and automotive.The DaVinci product line, which targets digital
video ayear wand a sapplica
KEYucts s16 percacross ing on technosor (DR“LoCoshelp spin eme6 millio2006, ththe endmanufahandsethis susamplinproducto mid-
In tcationsclear mexperieshippedsors, aproduc
In 15 percof theproducevisioncan bemarketprojectmodelsscreen
MAful of semicothan haand th
“ Videemecomgrow
Financial Goals
* ROIC = Return on Invested Capital ROIC = (operating profit x (1-tax rate))/ (assets - non-debt liabilities)
“ ...TI departed 2006 strategically stronger than it entered.”
138397_TI_R8 2/23/07 1:13 PM Page 5
TEXAS INSTRUMENTS 2006 ANNUAL REPORT 3
are alsoectronicdemand,ted and
s so dida record
becamedue to
ologies.pcon, anology,
creasedor high-
grewpercent
driveng share
upgradeand testrew for
With itscles ando be anportfolioinancial
rcent inucts for
s base-dvancedn devel-
spreadsuppliesanufac-in otherdue toInterneton to IPs based
mergingpects toad. Thisty and , video
omotive. digital
video applications, gained momentum during theyear with the introduction of six new devicesand a suite of powerful design tools that cater toapplications developers.
KEY END MARKETS: Revenue from TI prod-ucts sold into the cellular market increased 16 percent in 2006. TI engaged with customersacross the breadth of its product portfolio, build-ing on its legacy of innovation. Combining DSPtechnology with differentiated digital RF proces-sor (DRP™) technology, TI began production of its“LoCosto” single-chip products for cell phones tohelp speed adoption of cost-effective cell phonesin emerging economies. TI shipped more than 6 million “LoCosto” units in the fourth quarter of2006, the chip’s first full quarter of production. Bythe end of the year, more than 15 different handsetmanufacturers were developing more than 50 newhandset models based on this product. Building onthis success, in 2007 the company will begin sampling its “eCosto” single-chip cell phoneproduct to bring the benefits of this architectureto mid-range, multimedia handsets.
In the cell phone market, TI’s OMAP™ appli-cations processor maintained its position as theclear market leader, bringing rich, multimediaexperiences to consumers. In total, TI hasshipped more than 100 million of these proces-sors, and in 2006 more than 50 new OMAP-basedproducts came to market.
In DLP® products, revenue increased 15 percent for the year. Growth occurred in all of the company’s targeted markets for this product line – front projectors, high-definition tel-evisions (HDTVs) and cinema. DLP technologycan be found in an array of products on themarket today, including more than 350 DLP frontprojector models, more than 100 DLP HDTVmodels and more than 3,000 DLP Cinema®
screens deployed worldwide.MANUFACTURING: As one of only a hand-
ful of companies able to produce advanced semiconductors in volume, TI has shipped morethan half a billion chips in 90-nanometer technology,and the company now has 65-nanometer
technology in volume production. In addition, TI’sanalog process technologies are among the mostadvanced in the industry, enabling TI to manufac-ture analog chips with breakthrough capabilities.
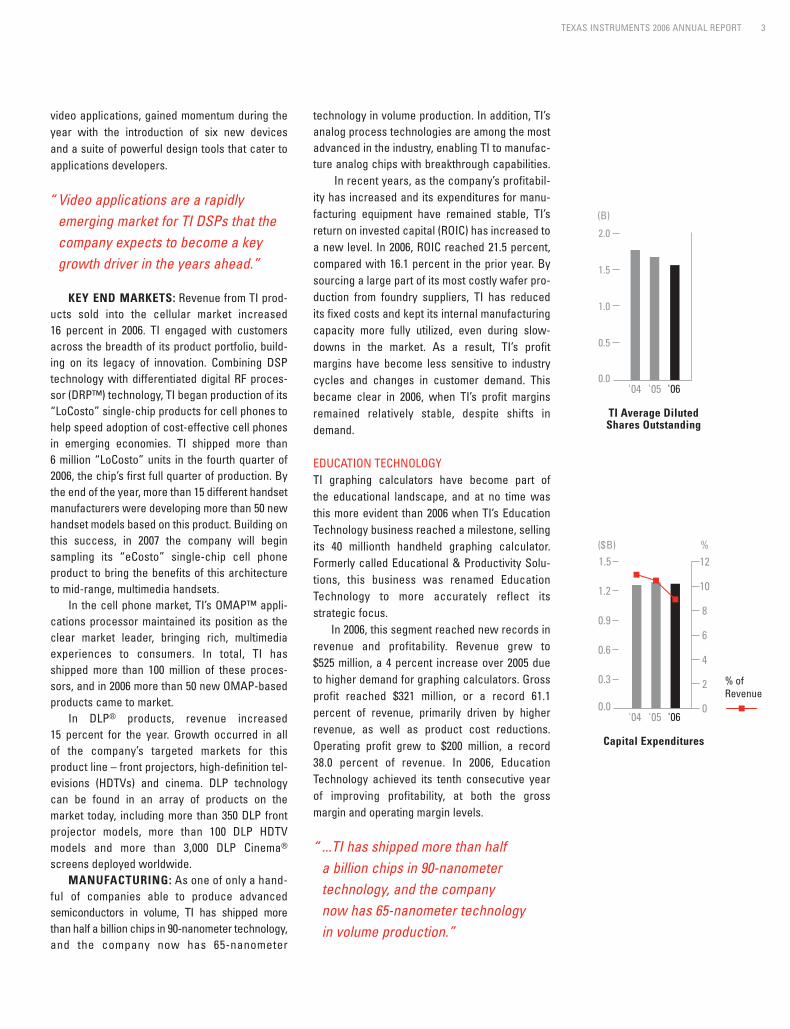
In recent years, as the company’s profitabil-ity has increased and its expenditures for manu-facturing equipment have remained stable, TI’sreturn on invested capital (ROIC) has increased toa new level. In 2006, ROIC reached 21.5 percent,compared with 16.1 percent in the prior year. Bysourcing a large part of its most costly wafer pro-duction from foundry suppliers, TI has reducedits fixed costs and kept its internal manufacturingcapacity more fully utilized, even during slow-downs in the market. As a result, TI’s profitmargins have become less sensitive to industrycycles and changes in customer demand. Thisbecame clear in 2006, when TI’s profit marginsremained relatively stable, despite shifts indemand.
EDUCATION TECHNOLOGY TI graphing calculators have become part ofthe educational landscape, and at no time wasthis more evident than 2006 when TI’s EducationTechnology business reached a milestone, sellingits 40 millionth handheld graphing calculator.Formerly called Educational & Productivity Solu-tions, this business was renamed EducationTechnology to more accurately reflect itsstrategic focus.
In 2006, this segment reached new records inrevenue and profitability. Revenue grew to$525 million, a 4 percent increase over 2005 dueto higher demand for graphing calculators. Grossprofit reached $321 million, or a record 61.1percent of revenue, primarily driven by higherrevenue, as well as product cost reductions.Operating profit grew to $200 million, a record38.0 percent of revenue. In 2006, EducationTechnology achieved its tenth consecutive yearof improving profitability, at both the grossmargin and operating margin levels.
“ Video applications are a rapidly emerging market for TI DSPs that thecompany expects to become a key growth driver in the years ahead.”
“ ...TI has shipped more than half a billion chips in 90-nanometertechnology, and the company now has 65-nanometer technologyin volume production.”
138397_TI_R8 2/23/07 1:13 PM Page 6

TEXAS INSTRUMENTS 2006 ANNUAL REPORT4
FIANALOG SNAPSHOT
Digital Revolution Drives Analog Growth
Analog is expected to become an increasinglyimportant part of the company in the years ahead.
Every electronics product requires analog tech-nologies, even in the digital world. The greatparadox is that as more and more electronicdevices – like cell phones, televisions and radios– move to digital for processing and transmittingdata, it is the increasingly important analogtechnology that gathers the sights, sounds andtextures of the real world and enables us to expe-rience the movies we see and the music we hear.
Mobility, too, depends upon analog. Today’scommunications and entertainment devices aremade portable through analog advances thatdeliver greater efficiency and longer battery life.Similarly, analog is becoming a powerful force inhealth care. Analog technology is opening up newpossibilities for medical devices that improvethe quality and extend the length of people’slives. As a result, today’s analog market is morethan $35 billion and growing, which creates anexciting opportunity for TI.
TI’s success in analog depends upon threekey areas: expanding and improving the productportfolio, maintaining an industry-leading fieldsales and support network, and having the bestanalog engineering talent in the world. The com-pany’s presence and reputation with customers isunmatched due to the size of its field sales andsupport network as well as the breadth andquality of its portfolio. In addition, TI has theresources to invest in R&D to develop innovativeanalog process technologies and chip designs, aswell as manufacturing facilities. As a result, TI’sanalog product line has gained market share forfive years in a row.
Also attractive to TI is the role innovationplays in the high-performance analog marketwhere chip capabilities translate directly to customers’ ability to differentiate their own products.Customers’ buying decisions are primarily basedon product performance and functionality,
rather than price, so innovation is rewarded with higher profit margins and a solid return on R&D investments.
To provide both the products and supportcustomers need, TI has developed a great base ofanalog engineering talent and technology througha combination of organic growth and selectacquisitions of companies with specializedanalog products and skills. The goal is to supportthe full range of customers’ system design needsfor analog products. Quickly integrating the ana-log expertise gained through acquisitions withTI’s manufacturing process capabilities enabledthe company to define and develop the cutting-edge processes and tools that allowed its newlyacquired talent to develop best-in-class products.Today, with more than 15,000 high-performanceanalog products and hundreds of new products in the pipeline, TI’s portfolio has become stronger,more differentiated and more attractive to abroader set of customers. Moreover, it enablesthe company to create products that are highlytuned for targeted opportunities, such as cellphones, hard-disk drives and automobiles.
Analog now represents about 40 percent of TI’stotal Semiconductor revenue and will be an impor-tant driver of the company’s future growth. As analog continues to become a bigger part of TIin the years ahead, the benefits it brings to the company – higher profit margins, less capitalintensity, more diverse markets – will help TI toimprove its financial performance and delivereven greater returns to its shareholders. Althoughthe company is now the world leader in analog,TI’s share of this market is only about 13 percent,leaving plenty of room for expansion. Providingthe analog products and support customers need,combined with fostering a workplace where analog engineers are free to innovate and createextraordinary products, is making a difference tothe company, its customers and shareholders.TI stands ready to not only meet the demands ofthe changing digital world, but to help shapethem.
“ ...TI’s analog product line has gained market share for five years in a row.”
138397_TI_R8 2/23/07 1:13 PM Page 7

TEXAS INSTRUMENTS 2006 ANNUAL REPORT 5
6 Consolidated Statements of Income
7 Consolidated Statements of Comprehensive Income
8 Consolidated Balance Sheets
9 Consolidated Statements of Cash Flows
10 Consolidated Statements of Stockholders’ Equity
11 Notes to Financial Statements- Description of Business and Significant
Accounting Policies and Practices- Discontinued Operations - Cash Equivalents and Short-term Investments- Equity and Other Long-term Investments- Goodwill and Other Acquisition-related Intangibles- Debt and Lines of Credit- Financial Instruments and Risk Concentration- Stockholders’ Equity
39 Report of Independent Registered Public Accounting Firm
40 Report by Management on Internal Control over Financial Reporting
41 Report of Independent Registered Public Accounting Firm on Internal Control over Financial Reporting
42 Summary of Selected Financial Data
43 Management’s Discussion and Analysis of Financial Condition and Results of Operations - Overview - Results of Operations - Prior Results of Operations - Financial Condition- Liquidity and Capital Resources
56 Quarterly Financial Data
57 Common Stock Prices and Dividends
Comparison of Total Shareholder Return
Safe Harbor Statement
FINANCIAL STATEMENTS TABLE OF CONTENTS
- Stock-based Compensation- Postretirement Benefit Plans- Profit Sharing and Savings Plans- Segment and Geographic Area Data- Income Taxes- Commitments and Contingencies- Supplemental Financial Information- Subsequent Event
ed with on R&D
supportbase ofthrough
selectcializedsupportn needshe ana-ns withenabledcutting-s newlyoducts.rmanceroducts tronger,
ve to aenablese highlyas cell. nt of TI’sn impor-growth. art of TIs to the
capitallp TI todeliver
lthoughanalog,
percent,rovidingrs need,
where d createence toholders.ands of
shape
- Long-term Contractual Obligations- Critical Accounting Policies- Changes in Accounting Standards- Quantitative and Qualitative Disclosures
about Market Risk
138397_TI_R8 2/23/07 1:13 PM Page 8
5
5
8
9

CONSOLIDATED STATEMENTS OF INCOME(Millions of dollars, except share and per-share amounts)
TEXAS INSTRUMENTS 2006 ANNUAL REPORT6
FOR THE YEARS ENDED DECEMBER 31,
2006 2005 2004
Net revenue . . . . . . . . . . . . . . . . . . . . . . . . . . . . . . . . . . . . . . . . . . . . . . . . . . . . . . . . . . . . . . $ 14,255 $ 12,335 $ 11,552 Operating costs and expenses:
Cost of revenue . . . . . . . . . . . . . . . . . . . . . . . . . . . . . . . . . . . . . . . . . . . . . . . . . . . . . . . . . 6,996 6,319 6,295 Research and development (R&D) . . . . . . . . . . . . . . . . . . . . . . . . . . . . . . . . . . . . . . . . 2,195 1,986 1,946 Selling, general and administrative (SG&A) . . . . . . . . . . . . . . . . . . . . . . . . . . . . . . . . 1,697 1,471 1,351 Total . . . . . . . . . . . . . . . . . . . . . . . . . . . . . . . . . . . . . . . . . . . . . . . . . . . . . . . . . . . . . . . . . . . 10,888 9,776 9,592
Profit from operations . . . . . . . . . . . . . . . . . . . . . . . . . . . . . . . . . . . . . . . . . . . . . . . . . . . . . 3,367 2,559 1,960 Other income (expense) net . . . . . . . . . . . . . . . . . . . . . . . . . . . . . . . . . . . . . . . . . . . . . . . . 265 205 233 Interest expense on loans . . . . . . . . . . . . . . . . . . . . . . . . . . . . . . . . . . . . . . . . . . . . . . . . . . 7 9 21 Income from continuing operations before income taxes . . . . . . . . . . . . . . . . . . . . . . 3,625 2,755 2,172 Provision for income taxes . . . . . . . . . . . . . . . . . . . . . . . . . . . . . . . . . . . . . . . . . . . . . . . . . 987 582 481 Income from continuing operations . . . . . . . . . . . . . . . . . . . . . . . . . . . . . . . . . . . . . . . . . 2,638 2,173 1,691 Income from discontinued operations, net of income taxes . . . . . . . . . . . . . . . . . . . . 1,703 151 170 Net income . . . . . . . . . . . . . . . . . . . . . . . . . . . . . . . . . . . . . . . . . . . . . . . . . . . . . . . . . . . . . . . $ 4,341 $ 2,324 $ 1,861 Basic earnings per common share:
Income from continuing operations . . . . . . . . . . . . . . . . . . . . . . . . . . . . . . . . . . . . . . . $ 1.73 $ 1.33 $ 0.98 Net income . . . . . . . . . . . . . . . . . . . . . . . . . . . . . . . . . . . . . . . . . . . . . . . . . . . . . . . . . . . . . $ 2.84 $ 1.42 $ 1.08
Diluted earnings per common share: Income from continuing operations . . . . . . . . . . . . . . . . . . . . . . . . . . . . . . . . . . . . . . . $ 1.69 $ 1.30 $ 0.96 Net income . . . . . . . . . . . . . . . . . . . . . . . . . . . . . . . . . . . . . . . . . . . . . . . . . . . . . . . . . . . . . $ 2.78 $ 1.39 $ 1.05
Average shares outstanding (millions): Basic . . . . . . . . . . . . . . . . . . . . . . . . . . . . . . . . . . . . . . . . . . . . . . . . . . . . . . . . . . . . . . . . . . 1,528 1,640 1,730 Diluted . . . . . . . . . . . . . . . . . . . . . . . . . . . . . . . . . . . . . . . . . . . . . . . . . . . . . . . . . . . . . . . . . 1,560 1,671 1,768
Cash dividends declared per share of common stock . . . . . . . . . . . . . . . . . . . . . . . . . . $ 0.130 $ 0.105 $ 0.089
See accompanying notes.

CONSOLIDATED STATEMENTS OF COMPREHENSIVE INCOME(Millions of dollars)
TEXAS INSTRUMENTS 2006 ANNUAL REPORT 7
FOR THE YEARS ENDEDDECEMBER 31,
2006 2005 2004
Income from continuing operations . . . . . . . . . . . . . . . . . . . . . . . . . . . . . . . . . . . . . . . . . . . . $ 2,638 $ 2,173 $ 1,691Other comprehensive income (loss):
Change in minimum pension liability adjustment:Annual adjustment, net of tax benefit (expense) of ($33), ($79) and $7 . . . . . . . . . 48 103 (8)
Changes in available-for-sale investments:Annual adjustment, net of tax benefit (expense) of ($2), $2 and $11 . . . . . . . . . . . . 5 (3) (21)Reclassification of recognized transactions, net of tax benefit (expense)
of $0, ($1) and ($3) . . . . . . . . . . . . . . . . . . . . . . . . . . . . . . . . . . . . . . . . . . . . . . . . . . . . . . (1) 2 5Total . . . . . . . . . . . . . . . . . . . . . . . . . . . . . . . . . . . . . . . . . . . . . . . . . . . . . . . . . . . . . . . . . . . . . . 52 102 (24)
Total comprehensive income from continuing operations . . . . . . . . . . . . . . . . . . . . . . . . . 2,690 2,275 1,667
Income from discontinued operations, net of income taxes . . . . . . . . . . . . . . . . . . . . . . . 1,703 151 170Total comprehensive income . . . . . . . . . . . . . . . . . . . . . . . . . . . . . . . . . . . . . . . . . . . . . . . . . . $ 4,393 $ 2,426 $ 1,837See accompanying notes.

TEXAS INSTRUMENTS 2006 ANNUAL REPORT8
DECEMBER 31,
2006 2005
AssetsCurrent assets:
Cash and cash equivalents . . . . . . . . . . . . . . . . . . . . . . . . . . . . . . . . . . . . . . . . . . . . . . . . . . . . . . . . . . . . . $ 1,183 $ 1,214 Short-term investments . . . . . . . . . . . . . . . . . . . . . . . . . . . . . . . . . . . . . . . . . . . . . . . . . . . . . . . . . . . . . . . . 2,534 4,116 Accounts receivable, net of allowances . . . . . . . . . . . . . . . . . . . . . . . . . . . . . . . . . . . . . . . . . . . . . . . . . 1,774 1,648 Inventories . . . . . . . . . . . . . . . . . . . . . . . . . . . . . . . . . . . . . . . . . . . . . . . . . . . . . . . . . . . . . . . . . . . . . . . . . . . 1,437 1,185 Deferred income taxes . . . . . . . . . . . . . . . . . . . . . . . . . . . . . . . . . . . . . . . . . . . . . . . . . . . . . . . . . . . . . . . . . 741 619 Prepaid expenses and other current assets . . . . . . . . . . . . . . . . . . . . . . . . . . . . . . . . . . . . . . . . . . . . . . 181 135 Assets of discontinued operations . . . . . . . . . . . . . . . . . . . . . . . . . . . . . . . . . . . . . . . . . . . . . . . . . . . . . . 4 495 Total current assets . . . . . . . . . . . . . . . . . . . . . . . . . . . . . . . . . . . . . . . . . . . . . . . . . . . . . . . . . . . . . . . . . . . 7,854 9,412
Property, plant and equipment at cost . . . . . . . . . . . . . . . . . . . . . . . . . . . . . . . . . . . . . . . . . . . . . . . . . . . . . 7,751 8,374 Less accumulated depreciation . . . . . . . . . . . . . . . . . . . . . . . . . . . . . . . . . . . . . . . . . . . . . . . . . . . . . . . . . (3,801) (4,644)Property, plant and equipment, net . . . . . . . . . . . . . . . . . . . . . . . . . . . . . . . . . . . . . . . . . . . . . . . . . . . . . . 3,950 3,730
Equity and other long-term investments . . . . . . . . . . . . . . . . . . . . . . . . . . . . . . . . . . . . . . . . . . . . . . . . . . . 287 236 Goodwill . . . . . . . . . . . . . . . . . . . . . . . . . . . . . . . . . . . . . . . . . . . . . . . . . . . . . . . . . . . . . . . . . . . . . . . . . . . . . . . 792 677 Acquisition-related intangibles . . . . . . . . . . . . . . . . . . . . . . . . . . . . . . . . . . . . . . . . . . . . . . . . . . . . . . . . . . . 118 60 Deferred income taxes . . . . . . . . . . . . . . . . . . . . . . . . . . . . . . . . . . . . . . . . . . . . . . . . . . . . . . . . . . . . . . . . . . . 601 393 Capitalized software licenses, net . . . . . . . . . . . . . . . . . . . . . . . . . . . . . . . . . . . . . . . . . . . . . . . . . . . . . . . . 188 243 Overfunded retirement plans . . . . . . . . . . . . . . . . . . . . . . . . . . . . . . . . . . . . . . . . . . . . . . . . . . . . . . . . . . . . . 58 —Prepaid retirement costs . . . . . . . . . . . . . . . . . . . . . . . . . . . . . . . . . . . . . . . . . . . . . . . . . . . . . . . . . . . . . . . . . — 199 Other assets . . . . . . . . . . . . . . . . . . . . . . . . . . . . . . . . . . . . . . . . . . . . . . . . . . . . . . . . . . . . . . . . . . . . . . . . . . . . 82 113 Total assets . . . . . . . . . . . . . . . . . . . . . . . . . . . . . . . . . . . . . . . . . . . . . . . . . . . . . . . . . . . . . . . . . . . . . . . . . . . . $ 13,930 $ 15,063
Liabilities and Stockholders’ EquityCurrent liabilities:
Loans payable and current portion of long-term debt . . . . . . . . . . . . . . . . . . . . . . . . . . . . . . . . . . . . . . $ 43 $ 301 Accounts payable . . . . . . . . . . . . . . . . . . . . . . . . . . . . . . . . . . . . . . . . . . . . . . . . . . . . . . . . . . . . . . . . . . . . . 560 702 Accrued expenses and other liabilities . . . . . . . . . . . . . . . . . . . . . . . . . . . . . . . . . . . . . . . . . . . . . . . . . . 1,029 948 Income taxes payable . . . . . . . . . . . . . . . . . . . . . . . . . . . . . . . . . . . . . . . . . . . . . . . . . . . . . . . . . . . . . . . . . . 284 154 Accrued profit sharing and retirement . . . . . . . . . . . . . . . . . . . . . . . . . . . . . . . . . . . . . . . . . . . . . . . . . . . 162 121 Liabilities of discontinued operations . . . . . . . . . . . . . . . . . . . . . . . . . . . . . . . . . . . . . . . . . . . . . . . . . . . . — 151 Total current liabilities . . . . . . . . . . . . . . . . . . . . . . . . . . . . . . . . . . . . . . . . . . . . . . . . . . . . . . . . . . . . . . . . . 2,078 2,377
Long-term debt . . . . . . . . . . . . . . . . . . . . . . . . . . . . . . . . . . . . . . . . . . . . . . . . . . . . . . . . . . . . . . . . . . . . . . . . . — 329 Underfunded retirement plans . . . . . . . . . . . . . . . . . . . . . . . . . . . . . . . . . . . . . . . . . . . . . . . . . . . . . . . . . . . . 208 —Accrued retirement costs . . . . . . . . . . . . . . . . . . . . . . . . . . . . . . . . . . . . . . . . . . . . . . . . . . . . . . . . . . . . . . . . — 136 Deferred income taxes . . . . . . . . . . . . . . . . . . . . . . . . . . . . . . . . . . . . . . . . . . . . . . . . . . . . . . . . . . . . . . . . . . . 23 23 Deferred credits and other liabilities . . . . . . . . . . . . . . . . . . . . . . . . . . . . . . . . . . . . . . . . . . . . . . . . . . . . . . 261 261 Total liabilities . . . . . . . . . . . . . . . . . . . . . . . . . . . . . . . . . . . . . . . . . . . . . . . . . . . . . . . . . . . . . . . . . . . . . . . . . . 2,570 3,126 Stockholders’ equity:
Preferred stock, $25 par value. Authorized – 10,000,000 shares.Participating cumulative preferred. None issued . . . . . . . . . . . . . . . . . . . . . . . . . . . . . . . . . . . . . . . . — —
Common stock, $1 par value. Authorized – 2,400,000,000 shares.Shares issued: 2006 – 1,739,108,694; 2005 – 1,738,780,512 . . . . . . . . . . . . . . . . . . . . . . . . . . . . . . . . 1,739 1,739
Paid-in capital . . . . . . . . . . . . . . . . . . . . . . . . . . . . . . . . . . . . . . . . . . . . . . . . . . . . . . . . . . . . . . . . . . . . . . . . 885 742 Retained earnings . . . . . . . . . . . . . . . . . . . . . . . . . . . . . . . . . . . . . . . . . . . . . . . . . . . . . . . . . . . . . . . . . . . . . 17,529 13,394 Less treasury common stock at cost.
Shares: 2006 – 289,078,450; 2005 – 142,190,707 . . . . . . . . . . . . . . . . . . . . . . . . . . . . . . . . . . . . . . . . . (8,430) (3,856)Accumulated other comprehensive income (loss), net of tax:
Postretirement benefit plans . . . . . . . . . . . . . . . . . . . . . . . . . . . . . . . . . . . . . . . . . . . . . . . . . . . . . . . . . . (351) (65)Unrealized gain (loss) on available-for-sale investments . . . . . . . . . . . . . . . . . . . . . . . . . . . . . . . . . (12) (16)
Unearned compensation . . . . . . . . . . . . . . . . . . . . . . . . . . . . . . . . . . . . . . . . . . . . . . . . . . . . . . . . . . . . . . . — (1)Total stockholders’ equity . . . . . . . . . . . . . . . . . . . . . . . . . . . . . . . . . . . . . . . . . . . . . . . . . . . . . . . . . . . . . . 11,360 11,937
Total liabilities and stockholders’ equity . . . . . . . . . . . . . . . . . . . . . . . . . . . . . . . . . . . . . . . . . . . . . . . . . . . $ 13,930 $ 15,063 See accompanying notes.
CONSOLIDATED BALANCE SHEETS(Millions of dollars, except share amounts)

CONSOLIDATED STATEMENTS OF CASH FLOWS(Millions of dollars)
TEXAS INSTRUMENTS 2006 ANNUAL REPORT 9
FOR THE YEARS ENDEDDECEMBER 31,
2006 2005 2004
Cash flows from operating activities:Net income. . . . . . . . . . . . . . . . . . . . . . . . . . . . . . . . . . . . . . . . . . . . . . . . . . . . . . . . . . . . . . . . $ 4,341 $ 2,324 $ 1,861Adjustments to reconcile net income to cash provided by operating activities of continuing operations:
Income from discontinued operations . . . . . . . . . . . . . . . . . . . . . . . . . . . . . . . . . . . . . (1,703) (151) (170)Depreciation . . . . . . . . . . . . . . . . . . . . . . . . . . . . . . . . . . . . . . . . . . . . . . . . . . . . . . . . . . . . 1,052 1,346 1,449Stock-based compensation . . . . . . . . . . . . . . . . . . . . . . . . . . . . . . . . . . . . . . . . . . . . . . . 332 175 18Amortization of capitalized software . . . . . . . . . . . . . . . . . . . . . . . . . . . . . . . . . . . . . . 110 126 119Amortization of acquisition-related intangibles . . . . . . . . . . . . . . . . . . . . . . . . . . . . . 59 55 69Deferred income taxes . . . . . . . . . . . . . . . . . . . . . . . . . . . . . . . . . . . . . . . . . . . . . . . . . . . (200) (194) 70
Increase (decrease) from changes in:Accounts receivable . . . . . . . . . . . . . . . . . . . . . . . . . . . . . . . . . . . . . . . . . . . . . . . . . . . . . (116) (127) (214)Inventories . . . . . . . . . . . . . . . . . . . . . . . . . . . . . . . . . . . . . . . . . . . . . . . . . . . . . . . . . . . . . (248) (23) (257)Prepaid expenses and other current assets . . . . . . . . . . . . . . . . . . . . . . . . . . . . . . . . (96) 111 155Accounts payable and accrued expenses . . . . . . . . . . . . . . . . . . . . . . . . . . . . . . . . . . (104) 254 (68)Income taxes payable . . . . . . . . . . . . . . . . . . . . . . . . . . . . . . . . . . . . . . . . . . . . . . . . . . . . (716) 35 54Accrued profit sharing and retirement . . . . . . . . . . . . . . . . . . . . . . . . . . . . . . . . . . . . . 28 (140) 227
Funding of retirement plans and accrued retirement costs . . . . . . . . . . . . . . . . . . . . (210) (154) (202)Other . . . . . . . . . . . . . . . . . . . . . . . . . . . . . . . . . . . . . . . . . . . . . . . . . . . . . . . . . . . . . . . . . . . . (76) (29) (138)
Net cash provided by operating activities of continuing operations . . . . . . . . . . . . . . . 2,453 3,608 2,973
Cash flows from investing activities:Additions to property, plant and equipment . . . . . . . . . . . . . . . . . . . . . . . . . . . . . . . . . . (1,272) (1,288) (1,260)Proceeds from sales of assets . . . . . . . . . . . . . . . . . . . . . . . . . . . . . . . . . . . . . . . . . . . . . . 3,000 42 —Purchases of cash investments . . . . . . . . . . . . . . . . . . . . . . . . . . . . . . . . . . . . . . . . . . . . . (6,821) (5,851) (3,674)Sales and maturities of cash investments . . . . . . . . . . . . . . . . . . . . . . . . . . . . . . . . . . . . 8,418 5,430 3,809Purchases of equity investments . . . . . . . . . . . . . . . . . . . . . . . . . . . . . . . . . . . . . . . . . . . . (40) (17) (22)Sales of equity and other long-term investments . . . . . . . . . . . . . . . . . . . . . . . . . . . . . 11 53 32Acquisition of businesses, net of cash acquired . . . . . . . . . . . . . . . . . . . . . . . . . . . . . . (205) — —
Net cash provided by (used in) investing activities of continuing operations . . . . . . . 3,091 (1,631) (1,115)
Cash flows from financing activities:Proceeds from loans and long-term debt . . . . . . . . . . . . . . . . . . . . . . . . . . . . . . . . . . . . — 275 —Payments on loans and long-term debt . . . . . . . . . . . . . . . . . . . . . . . . . . . . . . . . . . . . . . (586) (11) (435)Dividends paid on common stock . . . . . . . . . . . . . . . . . . . . . . . . . . . . . . . . . . . . . . . . . . . (199) (173) (154)Sales and other common stock transactions . . . . . . . . . . . . . . . . . . . . . . . . . . . . . . . . . 419 461 192Excess tax benefit from stock option exercises . . . . . . . . . . . . . . . . . . . . . . . . . . . . . . . 100 59 —Stock repurchases . . . . . . . . . . . . . . . . . . . . . . . . . . . . . . . . . . . . . . . . . . . . . . . . . . . . . . . . (5,302) (4,151) (753)
Net cash used in financing activities of continuing operations . . . . . . . . . . . . . . . . . . . . (5,568) (3,540) (1,150)
Cash flows from discontinued operations:Operating activities . . . . . . . . . . . . . . . . . . . . . . . . . . . . . . . . . . . . . . . . . . . . . . . . . . . . . . . 7 164 173Investing activities . . . . . . . . . . . . . . . . . . . . . . . . . . . . . . . . . . . . . . . . . . . . . . . . . . . . . . . . (16) (56) (46)
Net cash (used in) provided by discontinued operations . . . . . . . . . . . . . . . . . . . . . . . . . (9) 108 127
Effect of exchange rate changes on cash . . . . . . . . . . . . . . . . . . . . . . . . . . . . . . . . . . . . . . 2 6 15
Net (decrease) increase in cash and cash equivalents . . . . . . . . . . . . . . . . . . . . . . . . . . (31) (1,449) 850Cash and cash equivalents at beginning of year . . . . . . . . . . . . . . . . . . . . . . . . . . . . . . . . 1,214 2,663 1,813Cash and cash equivalents at end of year . . . . . . . . . . . . . . . . . . . . . . . . . . . . . . . . . . . . . . $ 1,183 $ 1,214 $ 2,663See accompanying notes.

TEXAS INSTRUMENTS 2006 ANNUAL REPORT10
CommonStock
Paid-inCapital
RetainedEarnings
TreasuryCommon
Stock
AccumulatedOther
ComprehensiveIncome (Loss)
UnearnedCompensation
Balance, December 31, 2003 . . . . . . . . . . . . . . . . $ 1,738 $ 901 $ 9,535 $ (135) $ (159) $ (16)Net income . . . . . . . . . . . . . . . . . . . . . . . . . . . . . — — 1,861 — — —Dividends declared on common stock
($ .089 per share) . . . . . . . . . . . . . . . . . . . . . . — — (154) — — —Common stock issued on exercise
of stock options . . . . . . . . . . . . . . . . . . . . . . . — (209) — 403 — —Stock repurchases . . . . . . . . . . . . . . . . . . . . . . — — — (748) — —Tax benefit from exercise of options . . . . . . . — 58 — — — —Other comprehensive loss,
net of tax . . . . . . . . . . . . . . . . . . . . . . . . . . . . . — — — — (24) —Unearned compensation amortization . . . . . — — — — — 12
Balance, December 31, 2004 . . . . . . . . . . . . . . . . 1,738 750 11,242 (480) (183) (4)Net income . . . . . . . . . . . . . . . . . . . . . . . . . . . . . — — 2,324 — — —Dividends declared on common stock
($ .105 per share) . . . . . . . . . . . . . . . . . . . . . . — — (173) — — —Common stock issued on exercise
of stock options . . . . . . . . . . . . . . . . . . . . . . . 1 (338) — 815 — —Stock repurchases . . . . . . . . . . . . . . . . . . . . . . — — — (4,191) — —Stock-based compensation transactions . . — 198 — — — —Tax benefit from exercise of options . . . . . . . — 132 — — — —Other comprehensive income,
net of tax . . . . . . . . . . . . . . . . . . . . . . . . . . . . . — — — — 102 —Unearned compensation amortization . . . . . — — — — — 3Other . . . . . . . . . . . . . . . . . . . . . . . . . . . . . . . . . . — — 1 — — —
Balance, December 31, 2005 . . . . . . . . . . . . . . . . 1,739 742 13,394 (3,856) (81) (1)Net income . . . . . . . . . . . . . . . . . . . . . . . . . . . . . — — 4,341 — — —Dividends declared on common stock
($.130 per share) . . . . . . . . . . . . . . . . . . . . . . — — (199) — — —Common stock issued on exercise of
stock options . . . . . . . . . . . . . . . . . . . . . . . . . — (329) — 754 — —Stock repurchases . . . . . . . . . . . . . . . . . . . . . . — — — (5,328) — —Stock-based compensation transactions . . — 332 — — — —Tax benefit from exercise of options . . . . . . — 146 — — — —Other comprehensive income,
net of tax . . . . . . . . . . . . . . . . . . . . . . . . . . . . . — — — — 52 —Adjustment for implementation of
SFAS 158 (a) . . . . . . . . . . . . . . . . . . . . . . . . . . — — (6) — (334) —Unearned compensation amortization . . . . . — — — — — 1Other . . . . . . . . . . . . . . . . . . . . . . . . . . . . . . . . . . — (6) (1) — — —
Balance, December 31, 2006 . . . . . . . . . . . . . . . . $ 1,739 $ 885 $ 17,529 $ (8,430) $ (363) $ —
(a) Reflects the impact of recording the funded status of pension and other postretirement plans and the change in measurement date of non-U.S. pension plans (see Note 10).
See accompanying notes.
CONSOLIDATED STATEMENTS OF STOCKHOLDERS' EQUITY(Millions of dollars, except per-share amounts)

TEXAS INSTRUMENTS 2006 ANNUAL REPORT 11
NOTES TO FINANCIAL STATEMENTS
1. Description of Business and Significant Accounting Policies and Practices
Business: Texas Instruments (TI) makes, markets and sells high-technology components; more than 50,000 customers all over the world buy TI products. We have two reportable operating segments: Semiconductor, which accounted for 96 percent of our revenue in 2006, and Education Technology, formerly called Educational & Productivity Solutions (see Note 12 for a discussion of this name change). Over time, Semiconductor averages a higher growth rate than Education Technology, although the semiconductor market is characterized by wide swings in growth rates from year to year. The former Sensors & Controls business has been reflected as discontinued operations (see below and Note 2). Additionally, the radio frequency identification (RFID) systems operations that had been part of the Sensors & Controls segment are included in the Semiconductor segment.
In January 2006, we acquired 100 percent of the equity of Chipcon Group ASA (Chipcon), a leading company in the design of short-range, low-power wireless radio frequency semiconductors, based in Oslo, Norway, for $183 million in cash. The acquisition will enhance our ability to offer customers complete short-range wireless solutions for consumer, home and building automation applications.
The acquisition was accounted for as a purchase business combination and the results of operations of this business have been included in the Semiconductor segment from the date of acquisition. Pro forma information has not been presented as it would not be materially different from amounts reported. As a result of the acquisition, we recorded a $5 million charge for in-process R&D in Corporate. We also recognized $115 million of goodwill and $86 million of other acquisition-related intangible assets, acquired $6 million of cash and assumed $29 million of other net liabilities (see Note 5 for a summary of the other intangible assets acquired).
In the second quarter of 2006, we made another acquisition primarily to obtain a patent portfolio. This acquisition was not material and was also integrated into the Semiconductor segment.
In January 2006, we entered into a definitive agreement to sell substantially all of our Sensors & Controls segment, excluding the RFID systems operations, to an affiliate of Bain Capital, LLC, a leading global private equity investment firm, for $3 billionin cash. The sale was completed on April 27, 2006. The operations and cash flows of the former Sensors & Controls business have been eliminated from the ongoing operations of TI and as we have no significant continuing involvement in the operations of the sold business, the former Sensors & Controls business is presented as discontinued operations. Prior period financial statements, including segment information, have been reclassified to reflect these changes for all periods presented (see Note 2 for detailed information on discontinued operations and Note 12 for segment information).
Basis of Presentation: The consolidated financial statements have been prepared in accordance with accounting principles generally accepted in the United States (U.S. GAAP). They were prepared on the same basis as the audited financial statements included in the 2005 annual report, as revised for reporting discontinued operations in our current report on Form 8-K dated November 3, 2006, with three exceptions. The exceptions are:
• the inclusion of compensation expense for stock options beginning July 1, 2005 (see Effects of Stock-based Compensation below and the discussion in Note 9),
• a change in depreciation method beginning January 1, 2006, (see Change in Depreciation Method below) and• the adoption of a new accounting standard on pensions and other postretirement benefits as of December 31, 2006
(see Changes in Accounting Standards below and the discussion in Note 10).
The consolidated financial statements include the accounts of all subsidiaries. All intercompany balances and transactions have been eliminated in consolidation. All dollar amounts in the financial statements and tables in the notes, except per-share amounts, are stated in millions of U.S. dollars unless otherwise indicated. All amounts in the notes reference continuing operations unless otherwise indicated. Certain amounts in the prior periods’ financial statements have been reclassified to conform to the 2006 presentation.
The preparation of financial statements requires the use of estimates from which final results may vary.
Foreign Currency: For financial reporting purposes, the functional currency for non-U.S. subsidiaries is the U.S. dollar.Accounts recorded in currencies other than U.S. dollars are remeasured into the functional currency. Current assets (except inventories), deferred income taxes, other assets, current liabilities and long-term liabilities are remeasured at exchange rates in effect at the end of each reporting period. Inventories and property, plant and equipment and depreciation thereon are remeasured at historic exchange rates. Revenue and expense accounts other than depreciation for each month are

TEXAS INSTRUMENTS 2006 ANNUAL REPORT1212
remeasured at the appropriate daily rate of exchange. Net currency exchange gains and losses from remeasurement are charged or credited on a current basis to other income (expense) net.
Derivatives: We use derivative financial instruments to manage exposure to foreign currency and interest rate risk. We enter into certain foreign currency derivative instruments that do not meet hedge accounting criteria. These instruments are primarily forward currency exchange contracts that are intended as economic hedges to minimize the adverse earnings impact from the effect of exchange rate fluctuations on our non-U.S. dollar net balance sheet exposures. Gains and losses from these forward currency exchange contracts are credited or charged on a current basis to other income (expense) net.
With respect to long-term debt and its associated interest expense, we may utilize interest rate swaps designated as fair value hedges to change the characteristics of the interest rate stream on the debt from fixed rates to short-term variable rates. The net effects of interest rate swaps are included on an accrual basis in interest expense. There is no hedge ineffectiveness related to these swaps.
We do not use derivatives for speculative or trading purposes.
Revenue Recognition: Revenue from sales of our products, including shipping fees, is recognized when title to the products is transferred to the customer, which usually occurs upon shipment or delivery, depending upon the terms of the sales order.Estimates of returns for product quality reasons and of price allowances (calculated based upon historical experience, analysis of product shipments and contractual arrangements with customers), are recorded when revenue is recognized.Allowances include discounts for prompt payment, as well as volume-based incentives and special pricing arrangements.In addition, allowances for doubtful accounts are recorded for estimated amounts of accounts receivable that may not be collected.
Revenue from sales of our products to distributors is recognized, net of allowances, based upon delivery of the products to the distributors. At the time of delivery, title transfers to the distributors and payment from the distributors is due on our standard commercial terms; payment terms are not contingent upon resale of the products. Credit allowances for the distributors are calculated based on historical data, current economic conditions and contractual terms. For instance, we sell our products to distributors at standard published prices, but we may grant price adjustment credits to distributors in response to individual competitive opportunities they may have. To estimate allowances for this type of credit, we use statistical percentages of revenue, determined quarterly based upon recent historical adjustment trends.
We also provide distributors an allowance to scrap certain slow-moving or obsolete products in their inventory, estimated as a negotiated fixed percentage of each distributor’s purchases from us. In addition, if we publish a new price for a product that is lower than that paid by distributors for the same product still in distributor on-hand inventory, we may credit the distributors for the difference between those prices. The allowance for this type of credit is based on the identified product price difference applied to estimated distributor on-hand inventory of that product.
We believe we can reasonably and reliably estimate allowances for credits to distributors in a timely manner.
Our contractual agreements with our intellectual property licensees determine the amount and timing of royalty revenue.Royalty revenue is recognized when earned according to the terms of the agreements and when realization of payment is considered probable by management. Where royalties are based upon licensee sales, we recognize royalty revenue upon the sale by the licensee of royalty-bearing products, as estimated by us based on historical experience and analysis of annual sales results of licensees. Where warranted, revenue from licensees may be recognized on a cash basis.
Shipping and handling costs are included in cost of revenue.
Advertising Costs: Advertising and other promotional costs are expensed as incurred. This expense was $190 million in 2006, $126 million in 2005 and $92 million in 2004.
Impairments of Long-lived Assets: Reviews are regularly performed to determine whether facts or circumstances exist that indicate the carrying values of fixed assets, intangible assets or capitalized software licenses are impaired. We assess the recoverability of assets by comparing the projected undiscounted net cash flows associated with those assets to their respective carrying amounts. Impairment, if any, is based on the excess of the carrying amount over the fair value of those assets. Fair value is determined by available market valuations, if applicable, or by discounted cash flows.
Income Taxes: We account for income taxes using an asset and liability approach. We record the amount of taxes payable or refundable for the current year and the deferred tax assets and liabilities for the future tax consequences of events that have been recognized in the financial statements or tax returns. When it is more likely than not that some portion or all of the deferred tax assets will not be realized, a valuation allowance is recorded.

TEXAS INSTRUMENTS 2006 ANNUAL REPORT 1313
Earnings per Share (EPS): Computation and reconciliation of earnings per common share from continuing operations, on a basic and diluted basis, are as follows (shares in millions):
2006 2005 2004
Incomefrom
ContinuingOperations Shares EPS
Incomefrom
ContinuingOperations Shares EPS
Incomefrom
ContinuingOperations Shares EPS
Basic EPS . . . . . . . . . . . . . . . . . . . . . $ 2,638 1,528 $ 1.73 $ 2,173 1,640 $ 1.33 $ 1,691 1,730 $ 0.98Dilutives:
Stock-based compensation plans . . . . . . . . . . . . . . . . . . . . . . — 32 — 31 — 38
Diluted EPS . . . . . . . . . . . . . . . . . . . . $ 2,638 1,560 $ 1.69 $ 2,173 1,671 $ 1.30 $ 1,691 1,768 $ 0.96
Options to purchase 93 million, 82 million and 113 million shares of common stock were outstanding during 2006, 2005 and 2004 that were not included in the computation of diluted earnings per share because the options’ exercise price was greater than the average market price of the common shares and, therefore, the effect would be antidilutive.
Effects of Stock-based Compensation: We have several stock-based employee compensation plans that are more fully described in Note 9. Prior to July 1, 2005, we accounted for awards granted under those plans following the recognition and measurement principles of Accounting Principles Board (APB) Opinion No. 25, “Accounting for Stock Issued to Employees,”and related interpretations. No compensation cost was reflected in net income for stock options, as all options granted under the plans have an exercise price equal to the market value of the underlying common stock on the date of the grant (except options granted under employee stock purchase plans and acquisition-related stock option awards). Compensation cost has previously been recognized for restricted stock units (RSUs).
Effective July 1, 2005, we adopted the fair value recognition provisions of Financial Accounting Standards Board (FASB) Statement of Financial Accounting Standards (SFAS) No. 123(R), “Share-Based Payments,” using the modified prospective application method. Under this transition method, compensation cost recognized for the years ended December 31, 2006 and 2005, includes the applicable amounts of: (a) compensation cost of all stock-based payments granted prior to, but not yet vested as of, July 1, 2005 (based on the grant-date fair value estimated in accordance with the original provisions of SFAS 123 and previously presented in pro forma footnote disclosures), and (b) compensation cost for all stock-based payments granted subsequent to July 1, 2005 (based on the grant-date fair value estimated in accordance with the new provisions of SFAS 123(R)). Results for prior periods have not been restated.
The amounts of stock-based compensation expense recognized in the periods presented are as follows:
2006 2005 2004
Stock-based compensation expense recognized:Cost of revenue . . . . . . . . . . . . . . . . . . . . . . . . . . . . . . . . . . . . . . . . . . . . . . . . . . . . . . . . . . . . . . . . . . . . . $ 64 $ 32 $ —Research & development (R&D) . . . . . . . . . . . . . . . . . . . . . . . . . . . . . . . . . . . . . . . . . . . . . . . . . . . . . . 101 53 —Selling, general & administrative (SG&A) . . . . . . . . . . . . . . . . . . . . . . . . . . . . . . . . . . . . . . . . . . . . . . 167 90 18 Total . . . . . . . . . . . . . . . . . . . . . . . . . . . . . . . . . . . . . . . . . . . . . . . . . . . . . . . . . . . . . . . . . . . . . . . . . . . . . . . $ 332 $ 175 $ 18
The amounts above include the impact of recognizing compensation expense related to RSUs, nonqualified stock options and stock options offered under the employee stock purchase plans. For the periods before our implementation of SFAS 123(R) on July 1, 2005, only compensation expense related to RSUs was recognized and included in SG&A.
Stock-based compensation expense has not been allocated between segments, but is reflected in Corporate.

TEXAS INSTRUMENTS 2006 ANNUAL REPORT1414
Prior Period Pro Forma Presentations:
Under the modified prospective application method, results for prior periods have not been restated to reflect the effects of implementing SFAS 123(R). The following pro forma information, as required by SFAS No. 148, “Accounting for Stock-Based Compensation – Transition and Disclosure, an amendment of FASB Statement No. 123,” is presented for comparative purposes and illustrates the pro forma effect on income from continuing operations and related per share amounts as if we had applied the original fair value recognition provisions of SFAS 123 to stock-based employee compensation for periods prior to implementation of SFAS 123(R).
2005 2004
Income from continuing operations, as reported . . . . . . . . . . . . . . . . . . . . . . . . . . . . . . . . . . . . . . . . . . . . . . . $ 2,173 $ 1,691 Add: Stock-based compensation expense included in reported income from continuing
operations, net of ($58) and ($6) tax (including actual SFAS 123(R) total stock-basedcompensation expense recognized since July 1, 2005) . . . . . . . . . . . . . . . . . . . . . . . . . . . . . . . . . . . . . . . . 117 12
Deduct: Total stock-based compensation expense determined under fair value-based method for all awards, net of $122 and $184 tax . . . . . . . . . . . . . . . . . . . . . . . . . . . . . . . . . . . . . . . . . . . . . . (250) (367)
Deduct: Adjustment for retirement-eligible employees, net of $49 tax . . . . . . . . . . . . . . . . . . . . . . . . . . . . (93) —Adjusted income from continuing operations . . . . . . . . . . . . . . . . . . . . . . . . . . . . . . . . . . . . . . . . . . . . . . . . . . $ 1,947 $ 1,336 Earnings per common share from continuing operations:
Basic – as reported . . . . . . . . . . . . . . . . . . . . . . . . . . . . . . . . . . . . . . . . . . . . . . . . . . . . . . . . . . . . . . . . . . . . . . . $ 1.33 $ 0.98 Basic – as adjusted for stock-based compensation expense . . . . . . . . . . . . . . . . . . . . . . . . . . . . . . . . . . $ 1.19 $ 0.77 Diluted – as reported . . . . . . . . . . . . . . . . . . . . . . . . . . . . . . . . . . . . . . . . . . . . . . . . . . . . . . . . . . . . . . . . . . . . . $ 1.30 $ 0.96 Diluted – as adjusted for stock-based compensation expense . . . . . . . . . . . . . . . . . . . . . . . . . . . . . . . . . $ 1.17 $ 0.76
In our first-quarter 2005 pro forma footnote disclosures, we included a $93 million ($0.05 per share) inception-to-date adjustment of fair value-based compensation expense to reduce the attribution period for both retirement-eligible employees and employees who would become retirement eligible prior to vesting of certain grants of nonqualified stock options.Effective January 1, 2005, stock-based compensation expense for retirement-eligible employees is recognized over a six-month required service period, and for non-retirement-eligible employees, over the shorter of the period from the grant date to the date they become retirement eligible (but not less than the six-month required service period) or the normal four-year vesting period.
Assumptions:
The fair values for the nonqualified stock options and stock options offered under the TI Employees 2002 Stock Purchase Plan (both actual and pro forma) were estimated using the Black-Scholes option-pricing model with the weighted-average assumptions listed below.
2006 2005 2004
Long-term Plans (a)Weighted average grant date fair value, per share . . . . . . . . . . . . . . . . . . . . . . . . . . . . $ 11.82 $ 10.07 $ 15.61 Weighted average assumptions used:
Expected volatility . . . . . . . . . . . . . . . . . . . . . . . . . . . . . . . . . . . . . . . . . . . . . . . . . . . . . . 34 % 50 % 56 % Expected lives . . . . . . . . . . . . . . . . . . . . . . . . . . . . . . . . . . . . . . . . . . . . . . . . . . . . . . . . . . 5 yrs 5 yrs 5 yrsRisk-free interest rates . . . . . . . . . . . . . . . . . . . . . . . . . . . . . . . . . . . . . . . . . . . . . . . . . . . 4.50 % 3.77 % 3.16 % Expected dividend yields . . . . . . . . . . . . . . . . . . . . . . . . . . . . . . . . . . . . . . . . . . . . . . . . . 0.37 % 0.48 % 0.33 %
Stock Purchase Plans (b)Weighted average fair value, per share . . . . . . . . . . . . . . . . . . . . . . . . . . . . . . . . . . . . . . $ 4.68 $ 4.56 $ 4.66 Weighted average assumptions used:
Expected volatility . . . . . . . . . . . . . . . . . . . . . . . . . . . . . . . . . . . . . . . . . . . . . . . . . . . . . . — 36 % 35 % Expected lives . . . . . . . . . . . . . . . . . . . . . . . . . . . . . . . . . . . . . . . . . . . . . . . . . . . . . . . . . . — .58 yrs .58 yrsRisk-free interest rates . . . . . . . . . . . . . . . . . . . . . . . . . . . . . . . . . . . . . . . . . . . . . . . . . . — 2.44 % 1.61 % Expected dividend yields . . . . . . . . . . . . . . . . . . . . . . . . . . . . . . . . . . . . . . . . . . . . . . . . . — 0.45 % 0.42 %
(a) Includes stock options under the long-term incentive plans and the director plans.(b) Includes assumptions for the TI Employees 2002 Stock Purchase Plan. The TI Employees 2005 Stock Purchase Plan, which began October 1, 2005, is a
discount-purchase plan. Consequently, the Black-Scholes option pricing model is not used to determine the fair value per share of these awards. The fair value per share under this plan is equal to the amount of the discount.

TEXAS INSTRUMENTS 2006 ANNUAL REPORT 1515
Effective July 1, 2005, we changed our method of determining expected volatility on all options granted after that date to rely solely on available implied volatility rates rather than an analysis of historical volatility. After giving consideration to available regulatory guidance, we believe that market-based measures of implied volatility are currently the best available indicators of the expected volatility used in these estimates.
Expected lives of options are determined based on the historical share option exercise experience of our optionees, using a rolling 10-year average. We believe the historical experience method is the best estimate of future exercise patterns currently available.
Risk-free interest rates are determined using the implied yield currently available for zero-coupon U.S. government issues with a remaining term equal to the expected life of the options.
Expected dividend yields are based on the approved annual dividend rate in effect and the current market price of TI common stock at the time of grant. No assumption for a future dividend rate change has been included unless there is an approved plan to change the dividend in the near term.
Inventories: Inventories are stated at the lower of cost or estimated net realizable value. Cost is generally computed on a currently adjusted standard cost basis, which approximates costs on a first-in, first-out basis. Prior to January 1, 2006, standard costs were based on the optimal utilization of installed factory capacity. With the adoption of SFAS No. 151, “Inventory Costs, an amendment of ARB No. 43, Chapter 4,” effective January 1, 2006, standard costs are based on the normal utilization of installed factory capacity, which is not materially different from the optimal rates previously used. The primary impact to our inventory valuation methodology was to change how the fixed production overhead costs included in inventory are calculated. The effect of this change for the year ended December 31, 2006, on inventory and net income was not material.Costs associated with underutilization of capacity are expensed as incurred.
We conduct quarterly inventory reviews for salability and obsolescence. A specific allowance is provided for inventory considered unlikely to be sold. Remaining inventory has a salability and obsolescence allowance based upon the historical disposal percentage. Inventory is written off in the period in which disposal occurs.
Property, Plant and Equipment and Other Capitalized Costs: Property, plant and equipment are stated at cost and depreciated over their estimated useful lives. In 2006, these assets were depreciated using the straight-line method. Prior to 2006, these assets were depreciated primarily using the 150 percent declining-balance method (see Change in Depreciation Method below). Leasehold improvements are amortized using the straight-line method over the shorter of the remaining lease term or the estimated useful lives of the improvements. Acquisition-related costs are amortized on a straight-line basis over the estimated economic life of the assets. Capitalized software licenses generally are amortized on a straight-line basis over the term of the license. Fully depreciated or amortized assets are written off against accumulated depreciation or amortization.
Change in Depreciation Method: Effective January 1, 2006, as a result of a study made of the pattern of usage of our long-lived depreciable assets, we adopted the straight-line method of depreciation for all property, plant and equipment. Under the provisions of SFAS No. 154, “Accounting Changes and Error Corrections, a replacement of APB Opinion No. 20 and FASB Statement No. 3,” which became effective as of January 1, 2006, a change in depreciation method is treated on a prospective basis as a change in estimate. Prior period results have not been restated. We believe that the change from the 150 percent declining-balance method to the straight-line method better reflects the pattern of consumption of the future benefits to be derived from those assets being depreciated and provides a better matching of costs and revenues over the assets’ estimated useful lives. The effect of the change in depreciation method for the year ended December 31, 2006, was to reduce depreciation expense by $156 million and increase both income from continuing operations and net income by $77 million ($0.05 per share).
Equity and Other Long-term Investments: All investments in equity and debt securities are classified as available for saleexcept for investments in certain mutual funds (described below) that are held to offset deferred compensation liabilities.Equity investments held at December 31, 2006 and 2005, include publicly traded marketable securities and private investments, which are generally non-marketable. Investments in marketable equity and debt securities are stated at fair value, which is based on market quotes. Adjustments to fair value of these investments are recorded as an increase or decrease in the accumulated other comprehensive income section of stockholders’ equity except where losses are considered to be other than temporary, in which case the losses are recorded as expenses in other income (expense) net. Marketable equity securities and other long-term investments are considered other-than-temporarily impaired if they have traded below theircost basis for more than six months.
Investments in non-marketable equity securities, primarily comprised of investments in early stage development companies and various venture capital funds, are stated at historical cost and are subject to a periodic impairment review. Any

TEXAS INSTRUMENTS 2006 ANNUAL REPORT1616
impairment considered other than temporary is recorded in other income (expense) net. Cost or amortized cost, as appropriate, is determined on a specific identification basis.
Investments in certain mutual funds are classified as trading and are stated at fair value. These mutual funds hold a variety of debt and equity investments and are intended to generate returns that offset changes in certain liabilities related to deferred compensation arrangements, thus they are classified as long-term investments. Adjustments to fair value of both the mutual funds and the related deferred compensation liabilities are recorded in SG&A expense (see Note 10 for a discussion of Deferred Compensation Arrangements).
Goodwill and Intangible Assets: Goodwill is not amortized but is reviewed for impairment annually, or more frequently if certain indicators arise. We complete our annual goodwill impairment tests as of October 1 of each year for our operating segments, which have been designated as reporting units based on an analysis of economic characteristics and how we operate the business. This annual test is performed by comparing the fair value for each reporting unit to its associated book value including goodwill. For each of the periods presented, the fair value exceeded the carrying value including goodwill, therefore no impairment was indicated.
Intangible assets are amortized on a straight-line basis over their estimated lives. Fully amortized intangible assets are written off against accumulated amortization.
Changes in Accounting Standards: In September 2006, the FASB issued SFAS No. 158, “Employers’ Accounting for Defined Benefit Pension and Other Postretirement Plans, an amendment of FASB Statements No. 87, 88, 106, and 132(R).” Part of this Statement is effective as of December 31, 2006, and requires companies that have defined benefit pension plans and other postretirement benefit plans to recognize the funded status of those plans on the balance sheet on a prospective basis from the effective date. In addition, SFAS 158 requires that companies using a measurement date for their defined benefit pension plans and other postretirement benefit plans other than their fiscal year end, change to a fiscal year end measurement date effective for years ending after December 15, 2008. Our balance sheet as of December 31, 2006, has been adjusted to reflect the required recognition of the funded status for our defined benefit pension plans and other postretirement benefit plans as of that date, as well as the effect of early adopting the change in the measurement dates for all of our non-U.S. defined benefit pension plans from a September 30 to a December 31 date (see Note 10 for a discussion of the effects of adopting this new standard and of the change in measurement dates).
In July 2006, the FASB issued FASB Interpretation (FIN) No. 48, “Accounting for Uncertainty in Income Taxes—AnInterpretation of FASB Statement No. 109.” This Interpretation clarifies the accounting for uncertainty in income taxes recognized in a company’s financial statements. FIN 48 requires companies to determine that it is “more likely than not” that a tax position will be sustained upon examination by the appropriate taxing authorities before any part of the benefit can be recorded in the financial statements. It also provides guidance on the recognition, measurement and classification of income tax uncertainties, along with any related interest and penalties. FIN 48 will also require significant additional disclosures. This Interpretation will be effective for fiscal years beginning after December 15, 2006. We will implement this Interpretation in the first quarter of 2007 on a prospective basis. We are currently evaluating the potential impact this Interpretation will have on our financial position and results of operations.
In September 2006, the FASB issued SFAS No. 157, “Fair Value Measurements,” which provides guidance on how to measure assets and liabilities that use fair value. SFAS 157 will apply whenever another U.S. GAAP standard requires or permits assets or liabilities to be measured at fair value. SFAS 157 does not expand the use of fair value to any new circumstances. This standard will also require additional disclosures in both annual and quarterly reports. SFAS 157 will be effective for financial statements issued for fiscal years beginning after November 15, 2007, and will be adopted by us beginning in the first quarter of 2008. We are currently evaluating the potential impact this standard will have on our financial position and results of operations.
In September 2006, the SEC staff issued Staff Accounting Bulletin (SAB) No. 108, “Considering the Effects of Prior Year Misstatements when Quantifying Misstatements in Current Year Financial Statements.” SAB 108 was issued in order to eliminate the diversity of practice in how public companies quantify misstatements of financial statements, including misstatements that were not material to prior years’ financial statements. We have adopted the provisions of SAB 108 forthe year ending December 31, 2006, and have determined it does not have an impact on our financial position and results of operations for the period then ended.
In June 2006, the FASB ratified Emerging Issues Task Force (EITF) Issue No. 06-3, “How Taxes Collected from Customers and Remitted to Governmental Authorities Should Be Presented in the Income Statement (That Is, Gross Versus Net Presentation).” This standard allows companies to present in their statements of income any taxes assessed by a

TEXAS INSTRUMENTS 2006 ANNUAL REPORT 1717
governmental authority that are directly imposed on revenue-producing transactions between a seller and a customer, such as sales, use, value-added and some excise taxes, on either a gross (included in revenue and costs) or a net (excluded from revenue) basis. This standard will be effective for us in interim periods and fiscal years beginning after December 15, 2006.We present these transactions on a net basis and, therefore, the adoption of this standard will have no impact on our financial position and results of operations.
2. Discontinued Operations
In January 2006, we entered into an agreement to sell substantially all of the Sensors & Controls segment, excluding the RFID systems operations, to an affiliate of Bain Capital, LLC, for $3 billion in cash. The sale was completed on April 27, 2006. The former Sensors & Controls business acquired by Bain Capital, LLC was renamed Sensata Technologies (Sensata).
The results of operations of the former Sensors & Controls business are being presented as discontinued operations. The following summarizes results of the discontinued operations for the years ended December 31, 2006, 2005 and 2004, included in the consolidated statements of income:
2006 2005 2004
Net revenue . . . . . . . . . . . . . . . . . . . . . . . . . . . . . . . . . . . . . . . . . . . . . . . . . . . . . . . . . . . . . . . . . . . $ 375 $ 1,057 $ 1,028 Operating costs and expenses . . . . . . . . . . . . . . . . . . . . . . . . . . . . . . . . . . . . . . . . . . . . . . . . . . . 327 825 779 Income from discontinued operations before income taxes . . . . . . . . . . . . . . . . . . . . . . . . . 48 232 249 Provision for income taxes . . . . . . . . . . . . . . . . . . . . . . . . . . . . . . . . . . . . . . . . . . . . . . . . . . . . . . 19 81 79 Income from discontinued operations, net of income taxes . . . . . . . . . . . . . . . . . . . . . . . . . 29 151 170
Gain on sale of discontinued operations . . . . . . . . . . . . . . . . . . . . . . . . . . . . . . . . . . . . . . . . . . 2,554 — —Provision for income taxes . . . . . . . . . . . . . . . . . . . . . . . . . . . . . . . . . . . . . . . . . . . . . . . . . . . . . . 880 — —Gain on sale of discontinued operations, net of income taxes . . . . . . . . . . . . . . . . . . . . . . . 1,674 — —Total income from discontinued operations . . . . . . . . . . . . . . . . . . . . . . . . . . . . . . . . . . . . . . . $ 1,703 $ 151 $ 170 Income from discontinued operations per common share: (a)
Basic . . . . . . . . . . . . . . . . . . . . . . . . . . . . . . . . . . . . . . . . . . . . . . . . . . . . . . . . . . . . . . . . . . . . . . . $ 1.11 $ 0.09 $ 0.10 Diluted. . . . . . . . . . . . . . . . . . . . . . . . . . . . . . . . . . . . . . . . . . . . . . . . . . . . . . . . . . . . . . . . . . . . . . . $ 1.09 $ 0.09 $ 0.10
(a) Earnings per share amounts from continuing and discontinued operations may not add to net income per share due to rounding.
As of December 31, 2006, the remaining assets of the former Sensors & Controls business, included in assets of discontinued operations, are attributable to pension plans in our Japan subsidiary that are expected to be settled in 2007.
Continuing Involvement: Upon closing of the sales transaction, we entered into a Transition Services Agreement (TSA) with Sensata to provide various temporary support services that are reasonably necessary to facilitate the continuation of the normal conduct of business of the former Sensors & Controls business such as finance and accounting, human resources, information technology, warehousing and logistics, and records retention and storage. Such services are expected to be provided for up to twelve months from the closing date, although certain information technology-related services may be provided for up to two years. The fees for these services are generally equivalent to our cost. In addition, we entered into certain cross-license agreements to allow each party to continue to use the associated technology and intellectual property in the conduct of their respective business. However, these cross-license agreements generally do not involve the receipt or payment of any royalties and, therefore, are not considered to be a component of continuing involvement.
Although the services provided under the TSA generate continuing cash flows between us and Sensata, the amounts are not considered to be significant to the ongoing operations of either entity. In addition, we have no contractual ability through the TSA or any other agreement to significantly influence the operating or financial policies of Sensata. Under the provisions of EITF Issue No. 03-13, “Applying the Conditions of Paragraph 42 of FASB Statement No. 144 in Determining Whether to Report Discontinued Operations,” we therefore have no significant continuing involvement in the operations of the former Sensors & Controls business and have classified the historical results of that business as discontinued operations.

TEXAS INSTRUMENTS 2006 ANNUAL REPORT1818
3. Cash Equivalents and Short-term Investments
We generally invest cash in highly liquid debt securities that are classified as available for sale and are reflected in the balance sheet based on their maturity dates. Investments with serial maturities are allocated to their asset classification based on their individual expected average lives. Investments in debt securities with original maturities of three months or less are considered to be cash equivalents. We consider investments in debt securities with maturities or average lives beyond three months from the date of our investment as being available for use in current operations as needed and, as a result, include those investments in short-term investments. These investments in debt securities are stated at fair value.Adjustments to fair value are recorded as an increase or decrease in the accumulated other comprehensive income section of stockholders’ equity. We also invest in auction-rate securities. These securities have long-term underlying maturities; however, the market is highly liquid and the securities are re-auctioned periodically, generally every seven, 28 or 35 days. Our intent is not to hold these securities to maturity, but rather to use the frequent auction feature to provide liquidity as needed.Our practice is to invest in these securities for higher after-tax yields compared with those available on cash equivalents.
DECEMBER 31, 2006 DECEMBER 31, 2005
Cash Investments
Cash & Cash
EquivalentsShort-term
Investments
Cash & Cash
EquivalentsShort-term
Investments
Corporate securities . . . . . . . . . . . . . . . . . . . . . . . . . . . . . . . . . . . . . . . . . . . . $ 41 $ — $ 61 $ 107 Asset-backed fixed income securities . . . . . . . . . . . . . . . . . . . . . . . . . . . . 543 729 252 1,121 Investment funds with constant net asset values . . . . . . . . . . . . . . . . . . 395 — 468 —U.S. government agency securities . . . . . . . . . . . . . . . . . . . . . . . . . . . . . . — 30 — 84 Tax-exempt/municipal securities:
Auction-rate securities . . . . . . . . . . . . . . . . . . . . . . . . . . . . . . . . . . . . . . . — 1,680 — 2,191 Variable-rate demand notes . . . . . . . . . . . . . . . . . . . . . . . . . . . . . . . . . . . — 30 — 595 Tax-exempt bonds . . . . . . . . . . . . . . . . . . . . . . . . . . . . . . . . . . . . . . . . . . . . — 65 — —Tax-exempt commercial paper . . . . . . . . . . . . . . . . . . . . . . . . . . . . . . . . . — — 202 18
Cash on hand . . . . . . . . . . . . . . . . . . . . . . . . . . . . . . . . . . . . . . . . . . . . . . . . . . 204 — 231 —Total . . . . . . . . . . . . . . . . . . . . . . . . . . . . . . . . . . . . . . . . . . . . . . . . . . . . . . . . . . $ 1,183 $ 2,534 $ 1,214 $ 4,116
The following table presents the aggregate maturities or average lives of cash equivalents and short-term investments at year-end 2006:
DueMarket Value
One year or less . . . . . . . . . . . . . . . . . . . . . . . . . . . . . . . . . . . . . . . . . . . . . . . . . . . . . . . . . . . . . . . . . . . . . . . . . . . . . . . . . . . . . . $ 1,155 Two to three years . . . . . . . . . . . . . . . . . . . . . . . . . . . . . . . . . . . . . . . . . . . . . . . . . . . . . . . . . . . . . . . . . . . . . . . . . . . . . . . . . . . 360 Three to ten years . . . . . . . . . . . . . . . . . . . . . . . . . . . . . . . . . . . . . . . . . . . . . . . . . . . . . . . . . . . . . . . . . . . . . . . . . . . . . . . . . . . . 393 Thereafter (a) . . . . . . . . . . . . . . . . . . . . . . . . . . . . . . . . . . . . . . . . . . . . . . . . . . . . . . . . . . . . . . . . . . . . . . . . . . . . . . . . . . . . . . . . 1,605
(a) Maturities over 10 years are primarily auction-rate securities.
Unrealized holding gains for these securities were zero at the end of both 2006 and 2005, and $1 million at the end of 2004.Unrealized holding losses for these securities were $23 million, $25 million and $27 million at the end of 2006, 2005 and 2004.Proceeds from sales of these securities before their maturity were $5.34 billion, $4.18 billion and $1.95 billion in 2006, 2005 and 2004. Gross realized gains and losses from the sales of these securities were immaterial for all periods presented.

TEXAS INSTRUMENTS 2006 ANNUAL REPORT 1919
4. Equity and Other Long-term Investments
Following is information on the investments at December 31, 2006 and 2005:
Unrealized FairValueCost Gains (Losses) Net
December 31, 2006Equity investments:
Marketable . . . . . . . . . . . . . . . . . . . . . . . . . . . . . . . . . . . . . . . . . . . . . . . . . . $ 2 $ 3 $ — $ 3 $ 5Non-marketable . . . . . . . . . . . . . . . . . . . . . . . . . . . . . . . . . . . . . . . . . . . . . 110 — — — 110
Mutual funds and other . . . . . . . . . . . . . . . . . . . . . . . . . . . . . . . . . . . . . . . . . 172 — — — 172 Total . . . . . . . . . . . . . . . . . . . . . . . . . . . . . . . . . . . . . . . . . . . . . . . . . . . . . . . . . . $ 284 $ 3 $ — $ 3 $ 287
December 31, 2005Equity investments:
Marketable . . . . . . . . . . . . . . . . . . . . . . . . . . . . . . . . . . . . . . . . . . . . . . . . . . $ 4 $ 1 $ — $ 1 $ 5Non-marketable . . . . . . . . . . . . . . . . . . . . . . . . . . . . . . . . . . . . . . . . . . . . . . 82 — — — 82
Mutual funds and other. . . . . . . . . . . . . . . . . . . . . . . . . . . . . . . . . . . . . . . . . . 149 — — — 149 Total . . . . . . . . . . . . . . . . . . . . . . . . . . . . . . . . . . . . . . . . . . . . . . . . . . . . . . . . . . $ 235 $ 1 $ — $ 1 $ 236
There were $6 million, $13 million and $12 million of gross realized gains and zero, $3 million and zero of gross realized losses from sales of these investments in 2006, 2005 and 2004. Other-than-temporary declines and impairments in the values of available-for-sale investments recognized in the income statement were $8 million, $8 million and $13 million in 2006, 2005 and 2004.
5. Goodwill and Other Acquisition-related Intangibles
DECEMBER 31,
Amortization Period 2006 2005
Goodwill – net . . . . . . . . . . . . . . . . . . . . . . . . . . . . . . . . . . . . . . . . . . . . . . . . . . . . . . . . . . . . . . Not amortized $ 792 $677 Acquisition-related intangibles – net:
Developed technology . . . . . . . . . . . . . . . . . . . . . . . . . . . . . . . . . . . . . . . . . . . . . . . . . . . . . 3–10 years $ 72 $ 48 Other intangibles . . . . . . . . . . . . . . . . . . . . . . . . . . . . . . . . . . . . . . . . . . . . . . . . . . . . . . . . . . 2–10 years 46 12 Total . . . . . . . . . . . . . . . . . . . . . . . . . . . . . . . . . . . . . . . . . . . . . . . . . . . . . . . . . . . . . . . . . . . . . $ 118 $ 60
All of our goodwill is attributable to our Semiconductor segment. Goodwill is reviewed for impairment annually, or more frequently if certain impairment indicators arise. There was no impairment of goodwill indicated during 2006, 2005 or 2004. The goodwill balances shown are net of total accumulated amortization of $221 million at year-end 2006 and 2005.
In January 2006, we recognized $115 million of goodwill and $86 million of other acquisition-related intangible assets due to the acquisition of Chipcon. The following table contains a summary of the other intangible assets acquired:
Acquired Intangible Assets AmountAmortization
Period
Developed technology . . . . . . . . . . . . . . . . . . . . . . . . . . . . . . . . . . . . . . . . . . . . . . . . . . . . . . . . . . . . . . . . . . . . . $ 65 5 yearsCustomer relationships . . . . . . . . . . . . . . . . . . . . . . . . . . . . . . . . . . . . . . . . . . . . . . . . . . . . . . . . . . . . . . . . . . . . 13 5 yearsNon-compete agreements . . . . . . . . . . . . . . . . . . . . . . . . . . . . . . . . . . . . . . . . . . . . . . . . . . . . . . . . . . . . . . . . . 6 2 yearsTrademark/trade name . . . . . . . . . . . . . . . . . . . . . . . . . . . . . . . . . . . . . . . . . . . . . . . . . . . . . . . . . . . . . . . . . . . . 2 3 yearsTotal . . . . . . . . . . . . . . . . . . . . . . . . . . . . . . . . . . . . . . . . . . . . . . . . . . . . . . . . . . . . . . . . . . . . . . . . . . . . . . . . . . . . . $ 86

TEXAS INSTRUMENTS 2006 ANNUAL REPORT2020
The following table reflects the components of acquisition-related intangible assets, excluding goodwill, that are subject to amortization:
DECEMBER 31, 2006 DECEMBER 31, 2005
Amortized Intangible Assets
GrossCarryingAmount
AccumulatedAmortization
GrossCarryingAmount
AccumulatedAmortization
Developed and core technology . . . . . . . . . . . . . . . . . . . . . . . . . . . . . . . . . . $ 209 $ 137 $ 202 $ 156 Customer relationships . . . . . . . . . . . . . . . . . . . . . . . . . . . . . . . . . . . . . . . . . . 45 30 32 24 Patents and trademarks . . . . . . . . . . . . . . . . . . . . . . . . . . . . . . . . . . . . . . . . . . 32 4 2 1Non-compete agreements . . . . . . . . . . . . . . . . . . . . . . . . . . . . . . . . . . . . . . . 6 3 57 53 Other . . . . . . . . . . . . . . . . . . . . . . . . . . . . . . . . . . . . . . . . . . . . . . . . . . . . . . . . . . 1 1 2 1Total . . . . . . . . . . . . . . . . . . . . . . . . . . . . . . . . . . . . . . . . . . . . . . . . . . . . . . . . . . . $ 293 $ 175 $ 295 $ 235
Amortization of acquisition-related intangibles was $59 million, $55 million and $69 million for 2006, 2005 and 2004, primarily related to developed technology. Fully amortized assets are written off against accumulated amortization.
The following table sets forth the estimated amortization of acquisition-related intangibles for the years ended December 31:
2007 . . . . . . . . . . . . . . . . . . . . . . . . . . . . . . . . . . . . . . . . . . . . . . . . . . . . . . . . . . . . . . . . . . . . . . . . . . . . . . . . . . . . . . . . . . . . . . . . . . . . . . $ 42 2008 . . . . . . . . . . . . . . . . . . . . . . . . . . . . . . . . . . . . . . . . . . . . . . . . . . . . . . . . . . . . . . . . . . . . . . . . . . . . . . . . . . . . . . . . . . . . . . . . . . . . . . 25 2009 . . . . . . . . . . . . . . . . . . . . . . . . . . . . . . . . . . . . . . . . . . . . . . . . . . . . . . . . . . . . . . . . . . . . . . . . . . . . . . . . . . . . . . . . . . . . . . . . . . . . . . 20 2010 . . . . . . . . . . . . . . . . . . . . . . . . . . . . . . . . . . . . . . . . . . . . . . . . . . . . . . . . . . . . . . . . . . . . . . . . . . . . . . . . . . . . . . . . . . . . . . . . . . . . . . 20 2011 . . . . . . . . . . . . . . . . . . . . . . . . . . . . . . . . . . . . . . . . . . . . . . . . . . . . . . . . . . . . . . . . . . . . . . . . . . . . . . . . . . . . . . . . . . . . . . . . . . . . . . 5Thereafter . . . . . . . . . . . . . . . . . . . . . . . . . . . . . . . . . . . . . . . . . . . . . . . . . . . . . . . . . . . . . . . . . . . . . . . . . . . . . . . . . . . . . . . . . . . . . . . . . 6
6. Debt and Lines of Credit
DECEMBER 31,
Long-term Debt 2006 2005
8.75% notes due 2007 . . . . . . . . . . . . . . . . . . . . . . . . . . . . . . . . . . . . . . . . . . . . . . . . . . . . . . . . . . . . . . . . . . . . . . . . . . . . . . $ 43 $ 43 6.125% notes due 2006 . . . . . . . . . . . . . . . . . . . . . . . . . . . . . . . . . . . . . . . . . . . . . . . . . . . . . . . . . . . . . . . . . . . . . . . . . . . . . — 300 Variable-rate bank notes due 2008/2010 . . . . . . . . . . . . . . . . . . . . . . . . . . . . . . . . . . . . . . . . . . . . . . . . . . . . . . . . . . . . . — 275 Other . . . . . . . . . . . . . . . . . . . . . . . . . . . . . . . . . . . . . . . . . . . . . . . . . . . . . . . . . . . . . . . . . . . . . . . . . . . . . . . . . . . . . . . . . . . . — 12
43 630 Less current portion long-term debt . . . . . . . . . . . . . . . . . . . . . . . . . . . . . . . . . . . . . . . . . . . . . . . . . . . . . . . . . . . . . . . . . 43 301 Total . . . . . . . . . . . . . . . . . . . . . . . . . . . . . . . . . . . . . . . . . . . . . . . . . . . . . . . . . . . . . . . . . . . . . . . . . . . . . . . . . . . . . . . . . . . . . $ — $ 329
In 1996, the coupon rates for the notes due 2006 were swapped for LIBOR-based variable rates through 2006, for an effective interest rate of approximately 3.61% as of December 31, 2005. This swap expired in 2006 at the maturity of the related notes.In 2001, the coupon rates for the notes due 2007 were swapped for LIBOR-based variable rates through 2007, for an effective interest rate of approximately 9.10% and 8.27% as of December 31, 2006 and 2005. The effect of these interest rate swaps was to reduce interest expense by zero, $11 million and $19 million in 2006, 2005 and 2004.
In November 2005, in connection with the repatriation of non-U.S. earnings under provisions of the American Jobs Creation Act of 2004 (AJCA), our Japan subsidiary entered into a five-year syndicated credit agreement with a consortium of banks to borrow $275 million at a LIBOR-based variable rate. During the second quarter of 2006, the $275 million was prepaid. The agreement continues to provide a revolving credit facility for an additional $175 million that would carry a variable rate of interest, if drawn.
We also maintain lines of credit to support commercial paper borrowings and to provide additional liquidity through short-term bank loans. In August 2006, we replaced our 364-day $500 million revolving credit facility with a five-year $1 billion facility.These lines of credit were not used in 2006 or 2005. The new facility would carry a variable rate, if drawn.
At December 31, 2006, both revolving credit facilities remained undrawn and no commercial paper was outstanding.

TEXAS INSTRUMENTS 2006 ANNUAL REPORT 2121
Interest incurred on loans in 2006, 2005 and 2004 was $12 million, $14 million and $24 million. Of these amounts, $5 million in 2006, $5 million in 2005 and $3 million in 2004 were capitalized as a component of capital asset construction costs.
Our remaining long-term debt as of December 31, 2006, of $43 million matures April 1, 2007.
7. Financial Instruments and Risk Concentration
Financial Instruments: The carrying amounts and related estimated fair values at December 31 of our long-term debt were $43 million and $44 million for 2006 and $630 million and $634 million for 2005. The fair value of long-term debt was based primarily on the net present value of the expected cash flows using current market interest rates.
We have derivative financial instruments such as interest rate swaps, forward purchase contracts, investment warrants and forward currency exchange contracts, the carrying value and fair values of which were not significant as of December 31, 2006 or 2005. Our forward currency exchange contracts outstanding at December 31, 2006, had a face value of $268 million to hedge net balance sheet exposures (including $85 million to sell euros, $82 million to sell British pounds and $48 million to sell Japanese yen). Our forward currency exchange contracts outstanding at December 31, 2005, had a face value of $191 million to hedge net balance sheet exposures (including $67 million to sell euros, $41 million to sell Japanese yen and $17 million to buy Korean won).
Short-term investments are carried at fair value. The carrying values for other current financial assets and liabilities, such as accounts receivable and accounts payable, approximate fair value due to the short maturity of such instruments.
Risk Concentration: Financial instruments that potentially subject us to concentrations of credit risk are primarily cash investments, accounts receivable and equity investments. In order to manage our exposure to credit risk, we place cash investments in investment-grade debt securities and limit the amount of credit exposure to any one issuer. We also limit counterparties on forward currency exchange contracts and interest rate swaps to investment-grade-rated financial institutions.
Concentrations of credit risk with respect to accounts receivable are limited due to the large number of customers in our customer base and their dispersion across different industries and geographic areas. We maintain an allowance for losses based upon the expected collectibility of accounts receivable. These allowances are deducted from accounts receivable in the balance sheets. Details of these allowances are as follows:
Accounts Receivable Allowances
Balance at Beginning
of Year
Additions Charged to Operating
Results
Recoveries and Write-
offs, Net
Balance at End of Year
2006 . . . . . . . . . . . . . . . . . . . . . . . . . . . . . . . . . . . . . . . . . . . . . . . . . . . . . . . . . . . . . . $ 34 $ 2 $ (10) $ 262005 . . . . . . . . . . . . . . . . . . . . . . . . . . . . . . . . . . . . . . . . . . . . . . . . . . . . . . . . . . . . . . $ 36 $ 1 $ (3) $ 34 2004. . . . . . . . . . . . . . . . . . . . . . . . . . . . . . . . . . . . . . . . . . . . . . . . . . . . . . . . . . . . . . . $ 42 $ — $ (6) $ 36
8. Stockholders’ Equity
We are authorized to issue 10,000,000 shares of preferred stock; however, no preferred stock is currently outstanding.
Each outstanding share of TI common stock carries one-fourth of a stock purchase right. Under certain circumstances, each right may be exercised to purchase one one-thousandth of a share of TI participating cumulative preferred stock for $200.Under certain circumstances following the acquisition of 20 percent or more of outstanding TI common stock by an acquiring person (as defined in the rights agreement), each right (other than rights held by an acquiring person) may be exercised to purchase the common stock of TI or a successor company with a market value of twice the $200 exercise price. The rights, which are redeemable by us at one cent per right, expire in June 2008.
In 2004, the TI board of directors approved the repurchases of up to 21 million shares and an additional $1 billion of TI common stock under our stock repurchase program. In 2005, the board of directors authorized the repurchase of $4 billion of TI common stock in addition to previous authorizations. In January 2006, the board of directors authorized additional repurchases of up to $5 billion of TI common stock and in September 2006, the board of directors added a new authorization to repurchase up to $5 billion of TI common stock. These authorizations were in addition to previously announced stock repurchase authorizations.

TEXAS INSTRUMENTS 2006 ANNUAL REPORT2222
No expiration date has been specified for these authorizations. As of December 31, 2006, $5.49 billion of these authorizations remain.
Treasury shares acquired in connection with the board-authorized stock repurchase program in 2006, 2005 and 2004 were 173,580,794 shares; 154,143,706 shares; and 30,102,546 shares.
In the third quarter of 2005, the board of directors approved an increase in our quarterly cash dividend (to $0.03 per share from $0.025 per share). In the third quarter of 2006, the board of directors increased our quarterly cash dividend (to $0.04 per share), and, on October 19, 2006, declared a dividend at the new quarterly rate.
9. Stock-based Compensation
Information in this note is inclusive of both continuing and discontinued operations, except as noted.
Long-term Incentive and Director Compensation Plans
We have stock options outstanding to participants under the Texas Instruments 2000 Long-Term Incentive Plan and the Texas Instruments 2003 Long-Term Incentive Plan. Options are also outstanding under the 1996 Long-Term Incentive Plan, but no further options may be granted under this plan. We also assumed stock options granted under the Burr-Brown 1993 Stock Incentive Plan and the Radia Communications, Inc. 2000 Stock Option/Stock Issuance Plan. Unless the options are acquisition-related replacement options, the option price per share may not be less than 100 percent of the fair market value on the date of the grant. Substantially all the options have a 10-year term. Except for options granted as part of a special retention grant in February 2003 (which vest beginning in the second year after grant at a rate of 50%/25%/25% per year), options granted subsequent to 1996 generally vest ratably over four years. Options generally provide for the continuation of vesting after the option recipient retires.
We have RSUs outstanding under the 2000 Long-Term Incentive Plan and the 2003 Long-Term Incentive Plan. Each RSU represents the right to receive one share of TI common stock on the vesting date, which is generally four years after the date of grant. Upon vesting, the shares are subject to issuance without payment by the grantee.
Under the 2000 Long-Term Incentive Plan, we may grant stock options, including incentive stock options, restricted stock and RSUs, performance units and other stock-based awards. The plan provides for the issuance of 120,000,000 shares of TI common stock. In addition, if any stock-based award under the 1996 Long-Term Incentive Plan terminates, then any unissued shares subject to the terminated award become available for granting awards under the 2000 Long-Term Incentive Plan. No more than 13,400,000 shares of common stock may be awarded as restricted stock, RSUs or other stock-based awards under the plan.
Under the 2003 Long-Term Incentive Plan, we may grant stock options (other than incentive stock options), restricted stock and RSUs, performance units and other stock-based awards to non-management employees. The plan provides for the issuance of 240,000,000 shares of TI common stock. Executive officers and approximately 250 managers are ineligible to receive awards under this plan.
Under the Texas Instruments Stock Option Plan for Non-Employee Directors adopted in April 1998, we granted stock options to each non-employee director once per year, in the period beginning January 1999 and extending through January 2003.Each grant under the plan was an option to purchase 5,000 shares (10,000 shares beginning January 2001) with an option price equal to fair market value on the date of grant. In April 2003, the plan, together with the Texas Instruments Restricted Stock Unit Plan for Directors and the Texas Instruments Directors Deferred Compensation Plan, was replaced by the Texas Instruments 2003 Director Compensation Plan. Under this plan, we may grant stock options, RSUs and other stock-based awards to non-employee directors, as well as issue TI common stock upon the distribution of stock units credited to deferred-compensation accounts established for such directors. The plan provides for the grant of a stock option to each non-employee director once per year in the period from January 2004 through 2010. Each grant is an option to purchase 15,000 shares with an option price equal to fair market value on the date of grant. Under the plan, we also make a one-time grant of 2,000 RSUs to each new non-employee director of TI. The plan provides for the issuance of 2,000,000 shares of TI common stock. Effective in 2007, the plan reduces to 7,000 shares the annual stock option grant and includes an annual grant of 2,500 RSUs to each non-employee director.

TEXAS INSTRUMENTS 2006 ANNUAL REPORT 2323
Stock option and RSU transactions under the above mentioned long-term incentive and director compensation plans during 2006 were as follows:
STOCK OPTIONS RESTRICTED STOCK UNITS
Shares
WeightedAverageExercisePrice per
Share Shares
WeightedAverage
Grant-DateFair Valueper Share
Outstanding grants, December 31, 2005 . . . . . . . . . . . . . . . . . . . . . 228,279,712 $ 27.15 3,517,768 $ 23.13 Granted . . . . . . . . . . . . . . . . . . . . . . . . . . . . . . . . . . . . . . . . . . . . . . . . . . 19,804,037 32.43 1,889,300 31.36 Vested (RSUs) . . . . . . . . . . . . . . . . . . . . . . . . . . . . . . . . . . . . . . . . . . . . — — (555,600) 20.38Forfeited . . . . . . . . . . . . . . . . . . . . . . . . . . . . . . . . . . . . . . . . . . . . . . . . . (4,824,263) 33.75 (111,100) 26.91Exercised . . . . . . . . . . . . . . . . . . . . . . . . . . . . . . . . . . . . . . . . . . . . . . . . (24,487,538) 15.04 — —Outstanding grants, December 31, 2006 . . . . . . . . . . . . . . . . . . . . . . 218,771,948 $ 28.81 4,740,368 $ 26.37
As of July 1, 2005, we adopted SFAS 123(R) and began recording compensation expense related to stock options measured at their fair value as of the grant date (see Note 1 for a discussion of Effects of Stock-based Compensation). Prior to that date, we recorded no compensation expense for non-acquisition-related stock option awards but did recognize compensation expense related to awards of RSUs. The fair values of RSUs are determined based on the price of TI common stock on the date of grant. Compensation expense associated with RSUs, which was all in continuing operations, totaled $29 million, $18 million and $18 million in 2006, 2005 and 2004.
The weighted average grant-date fair value of stock options granted during the years 2006, 2005 and 2004 was $11.82, $10.07and $15.61 per share. The weighted average grant-date fair value of RSUs granted during the years 2006, 2005 and 2004 was $31.36, $24.42 and $31.20 per share.
Summarized information about stock options outstanding under the various long-term plans mentioned above at December 31, 2006, is as follows:
STOCK OPTIONS OUTSTANDING OPTIONS EXERCISABLE
Range ofExercise
Share Prices
NumberOutstanding
(shares)
WeightedAverage
RemainingContractualLife (years)
WeightedAverageExercisePrice per
Share
NumberExercisable
(shares)
WeightedAverageExercisePrice per
Share
$ .24 to 10.00 4,481,510 0.6 $ 7.78 4,466,429 $ 7.7910.01 to 20.00 51,840,635 4.7 15.06 40,007,883 14.7120.01 to 30.00 67,863,425 5.2 24.61 50,544,424 25.4830.01 to 40.00 61,509,414 6.8 33.11 30,799,600 33.8040.01 to 50.00 998,544 3.2 43.65 998,544 43.6550.01 to 84.32 32,078,420 3.5 54.11 32,076,420 54.11
$ .24 to 84.32 218,771,948 5.2 $ 28.81 158,893,300 $ 29.78
As of December 31, 2006, the aggregate intrinsic value (i.e., the difference in the year-end closing market price of $28.80 and the exercise price to be paid by the optionee) of stock options outstanding, excluding the effects of expected forfeitures, was $1.09 billion. The aggregate intrinsic value of exercisable stock options at that date was $0.83 billion.
During the years ended December 31, 2006 and 2005, the total intrinsic value of options exercised (i.e., the difference in the market price at the exercise date and the price paid by the employee to exercise the option) under these plans was $419 million and $394 million.
For the years ended December 31, 2006 and 2005, the total fair value of shares vested from RSU grants was $13 million and $24 million.

TEXAS INSTRUMENTS 2006 ANNUAL REPORT2424
Summarized information as of December 31, 2006, about outstanding stock options that are vested and expected to vest, as well as stock options that are currently exercisable, are as follows:
Outstanding Stock Options (Fully Vested
and Expected to Vest)(a)
OptionsExercisable
Number of outstanding (shares) . . . . . . . . . . . . . . . . . . . . . . . . . . . . . . . . . . . . . . . . . . . . . . . 217,155,947 158,893,300 Weighted average remaining contractual life . . . . . . . . . . . . . . . . . . . . . . . . . . . . . . . . . . . 5.2 years 4.2 years Weighted average exercise price per share . . . . . . . . . . . . . . . . . . . . . . . . . . . . . . . . . . . . $ 28.77 $ 29.78 Intrinsic value . . . . . . . . . . . . . . . . . . . . . . . . . . . . . . . . . . . . . . . . . . . . . . . . . . . . . . . . . . . . . . . $ 1,088 $ 827
(a) Includes effects of expected forfeitures.
As of December 31, 2006, the total future compensation cost related to non-vested stock options and RSUs not yet recognized in the statement of income was $371 million and $68 million, with weighted-average periods over which these awards are expected to be recognized of 1.1 years and 1.4 years. Of that total, $231 million, $128 million, $73 million and $7 million will be recognized in 2007, 2008, 2009 and 2010.
Employee Stock Purchase Plans
Under the TI Employees 2005 Stock Purchase Plan (the 2005 Plan), which replaced the TI Employees 2002 Stock Purchase Plan, options are offered to all eligible employees in amounts based on a percentage of the employee’s compensation. Under the 2005 Plan, the option price per share is 85 percent of the fair market value on the exercise date. Options under the 2005 Plan have a three-month term.
The stock options outstanding under the 2005 Plan at December 31, 2006, had an exercise price of $24.48 per share (85 percent of the fair market value of TI common stock on January 3, 2007, the date of automatic exercise). Of the total outstanding options, none were exercisable at year-end 2006.
Employee stock purchase plan transactions during 2006 were as follows:
Employee Stock
Purchase Plan(shares)(a)
Weighted Average Exercise
Price
Outstanding grants, December 31, 2005 . . . . . . . . . . . . . . . . . . . . . . . . . . . . . . . . . . . . . . . . . . . . . . . . 537,979 $ 27.82 Granted . . . . . . . . . . . . . . . . . . . . . . . . . . . . . . . . . . . . . . . . . . . . . . . . . . . . . . . . . . . . . . . . . . . . . . . . . . . . . 2,247,127 26.54Exercised . . . . . . . . . . . . . . . . . . . . . . . . . . . . . . . . . . . . . . . . . . . . . . . . . . . . . . . . . . . . . . . . . . . . . . . . . . . (2,163,868) 27.45 Outstanding grants, December 31, 2006 . . . . . . . . . . . . . . . . . . . . . . . . . . . . . . . . . . . . . . . . . . . . . . . . 621,238 $ 24.48
(a) Excludes options offered but not granted.
During the year ended December 31, 2006 and 2005, the total intrinsic value of options exercised under these plans was $10 million and $59 million.
Effect on Shares Outstanding and Treasury Shares
Stock option plan exercises were settled using previously unissued shares of 49,100 shares, 53,855 shares and 416,961 shares for 2006, 2005 and 2004. They also were settled using treasury shares of 26,602,306 shares, 31,997,416 shares and 15,488,357 shares for 2006, 2005 and 2004.
Previously unissued common shares issued for RSUs in 2006, 2005 and 2004 were 279,082 shares, 570,042 shares and 402,009 shares. Treasury shares issued upon vesting of RSUs were 128,578 shares in 2006. No treasury shares were issued upon vesting of RSUs in 2005 and 2004.
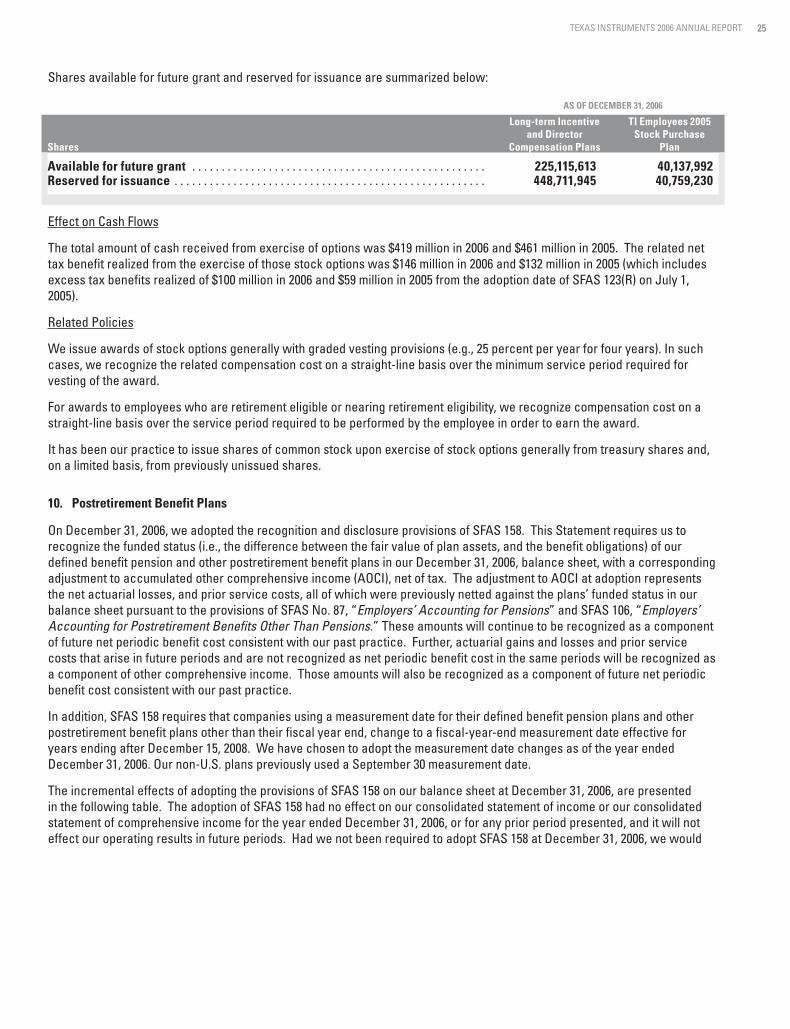
TEXAS INSTRUMENTS 2006 ANNUAL REPORT 2525
Shares available for future grant and reserved for issuance are summarized below:
AS OF DECEMBER 31, 2006
Shares
Long-term Incentiveand Director
Compensation Plans
TI Employees 2005Stock Purchase
Plan
Available for future grant . . . . . . . . . . . . . . . . . . . . . . . . . . . . . . . . . . . . . . . . . . . . . . . . . . 225,115,613 40,137,992Reserved for issuance . . . . . . . . . . . . . . . . . . . . . . . . . . . . . . . . . . . . . . . . . . . . . . . . . . . . . 448,711,945 40,759,230
Effect on Cash Flows
The total amount of cash received from exercise of options was $419 million in 2006 and $461 million in 2005. The related net tax benefit realized from the exercise of those stock options was $146 million in 2006 and $132 million in 2005 (which includes excess tax benefits realized of $100 million in 2006 and $59 million in 2005 from the adoption date of SFAS 123(R) on July 1, 2005).
Related Policies
We issue awards of stock options generally with graded vesting provisions (e.g., 25 percent per year for four years). In such cases, we recognize the related compensation cost on a straight-line basis over the minimum service period required for vesting of the award.
For awards to employees who are retirement eligible or nearing retirement eligibility, we recognize compensation cost on a straight-line basis over the service period required to be performed by the employee in order to earn the award.
It has been our practice to issue shares of common stock upon exercise of stock options generally from treasury shares and, on a limited basis, from previously unissued shares.
10. Postretirement Benefit Plans
On December 31, 2006, we adopted the recognition and disclosure provisions of SFAS 158. This Statement requires us to recognize the funded status (i.e., the difference between the fair value of plan assets, and the benefit obligations) of our defined benefit pension and other postretirement benefit plans in our December 31, 2006, balance sheet, with a corresponding adjustment to accumulated other comprehensive income (AOCI), net of tax. The adjustment to AOCI at adoption represents the net actuarial losses, and prior service costs, all of which were previously netted against the plans’ funded status in our balance sheet pursuant to the provisions of SFAS No. 87, “Employers’ Accounting for Pensions” and SFAS 106, “Employers’Accounting for Postretirement Benefits Other Than Pensions.” These amounts will continue to be recognized as a component of future net periodic benefit cost consistent with our past practice. Further, actuarial gains and losses and prior servicecosts that arise in future periods and are not recognized as net periodic benefit cost in the same periods will be recognized as a component of other comprehensive income. Those amounts will also be recognized as a component of future net periodic benefit cost consistent with our past practice.
In addition, SFAS 158 requires that companies using a measurement date for their defined benefit pension plans and other postretirement benefit plans other than their fiscal year end, change to a fiscal-year-end measurement date effective for years ending after December 15, 2008. We have chosen to adopt the measurement date changes as of the year ended December 31, 2006. Our non-U.S. plans previously used a September 30 measurement date.
The incremental effects of adopting the provisions of SFAS 158 on our balance sheet at December 31, 2006, are presented in the following table. The adoption of SFAS 158 had no effect on our consolidated statement of income or our consolidatedstatement of comprehensive income for the year ended December 31, 2006, or for any prior period presented, and it will not effect our operating results in future periods. Had we not been required to adopt SFAS 158 at December 31, 2006, we would
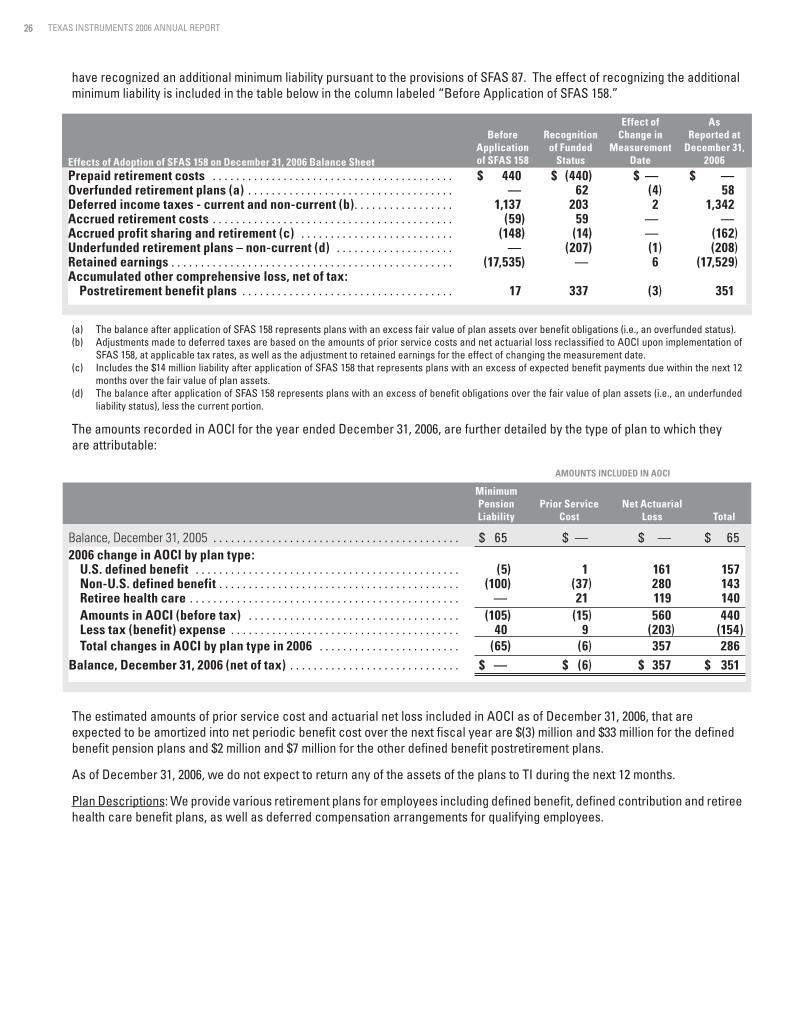
TEXAS INSTRUMENTS 2006 ANNUAL REPORT2626
have recognized an additional minimum liability pursuant to the provisions of SFAS 87. The effect of recognizing the additional minimum liability is included in the table below in the column labeled “Before Application of SFAS 158.”
Effects of Adoption of SFAS 158 on December 31, 2006 Balance Sheet
Before Application of SFAS 158
Recognition of Funded
Status
Effect of Change in
Measurement Date
AsReported at
December 31, 2006
Prepaid retirement costs . . . . . . . . . . . . . . . . . . . . . . . . . . . . . . . . . . . . . . . . . $ 440 $ (440) $ — $ —Overfunded retirement plans (a) . . . . . . . . . . . . . . . . . . . . . . . . . . . . . . . . . . . — 62 (4) 58Deferred income taxes - current and non-current (b). . . . . . . . . . . . . . . . . 1,137 203 2 1,342Accrued retirement costs . . . . . . . . . . . . . . . . . . . . . . . . . . . . . . . . . . . . . . . . . (59) 59 — —Accrued profit sharing and retirement (c) . . . . . . . . . . . . . . . . . . . . . . . . . . (148) (14) — (162)Underfunded retirement plans – non-current (d) . . . . . . . . . . . . . . . . . . . . — (207) (1) (208)Retained earnings . . . . . . . . . . . . . . . . . . . . . . . . . . . . . . . . . . . . . . . . . . . . . . . . (17,535) — 6 (17,529)Accumulated other comprehensive loss, net of tax:
Postretirement benefit plans . . . . . . . . . . . . . . . . . . . . . . . . . . . . . . . . . . . . 17 337 (3) 351
(a) The balance after application of SFAS 158 represents plans with an excess fair value of plan assets over benefit obligations (i.e., an overfunded status).(b) Adjustments made to deferred taxes are based on the amounts of prior service costs and net actuarial loss reclassified to AOCI upon implementation of
SFAS 158, at applicable tax rates, as well as the adjustment to retained earnings for the effect of changing the measurement date.(c) Includes the $14 million liability after application of SFAS 158 that represents plans with an excess of expected benefit payments due within the next 12
months over the fair value of plan assets.(d) The balance after application of SFAS 158 represents plans with an excess of benefit obligations over the fair value of plan assets (i.e., an underfunded
liability status), less the current portion.
The amounts recorded in AOCI for the year ended December 31, 2006, are further detailed by the type of plan to which they are attributable:
AMOUNTS INCLUDED IN AOCI
MinimumPensionLiability
Prior Service Cost
Net Actuarial Loss Total
Balance, December 31, 2005 . . . . . . . . . . . . . . . . . . . . . . . . . . . . . . . . . . . . . . . . . . $ 65 $ — $ — $ 652006 change in AOCI by plan type:
U.S. defined benefit . . . . . . . . . . . . . . . . . . . . . . . . . . . . . . . . . . . . . . . . . . . . . (5) 1 161 157Non-U.S. defined benefit . . . . . . . . . . . . . . . . . . . . . . . . . . . . . . . . . . . . . . . . . (100) (37) 280 143Retiree health care . . . . . . . . . . . . . . . . . . . . . . . . . . . . . . . . . . . . . . . . . . . . . . — 21 119 140Amounts in AOCI (before tax) . . . . . . . . . . . . . . . . . . . . . . . . . . . . . . . . . . . . (105) (15) 560 440Less tax (benefit) expense . . . . . . . . . . . . . . . . . . . . . . . . . . . . . . . . . . . . . . . 40 9 (203) (154)Total changes in AOCI by plan type in 2006 . . . . . . . . . . . . . . . . . . . . . . . . (65) (6) 357 286
Balance, December 31, 2006 (net of tax) . . . . . . . . . . . . . . . . . . . . . . . . . . . . . $ — $ (6) $ 357 $ 351
The estimated amounts of prior service cost and actuarial net loss included in AOCI as of December 31, 2006, that are expected to be amortized into net periodic benefit cost over the next fiscal year are $(3) million and $33 million for the defined benefit pension plans and $2 million and $7 million for the other defined benefit postretirement plans.
As of December 31, 2006, we do not expect to return any of the assets of the plans to TI during the next 12 months.
Plan Descriptions: We provide various retirement plans for employees including defined benefit, defined contribution and retiree health care benefit plans, as well as deferred compensation arrangements for qualifying employees.

TEXAS INSTRUMENTS 2006 ANNUAL REPORT 2727
U.S. Retirement Plans:
The principal retirement plans in the U.S include a qualified defined benefit pension plan (which is closed to new participants hired after November 1997), a defined contribution plan and an enhanced defined contribution plan. Both defined contribution plans offer an employer-matching savings option that allows employees to make pre-tax contributions to various investment choices, including a TI common stock fund. Employees who remain in the qualified defined benefit pension plan may also participate in the defined contribution plan, where employer-matching contributions are provided for up to 2 percent of the employee’s annual eligible earnings. Employees who elected not to remain in the defined benefit pension plan, and new employees hired after November 1997 and through December 31, 2003, may participate in the enhanced defined contribution plan. This plan provides for a fixed employer contribution of 2 percent of the employee’s annual eligible earnings, plus an employer-matching contribution of up to 4 percent of the employee’s annual eligible earnings. Employees hired after December 31, 2003, may participate in the enhanced defined contribution plan, where employer-matching contributions are provided for up to 4 percent of the employee’s annual eligible earnings.
At December 31, 2006 and 2005, in accordance with the election of employees, TI’s U.S. defined contribution plans held shares of TI common stock totaling 43 million shares and 53 million shares valued at $1.23 billion and $1.70 billion. Dividends paid on these shares for 2006 and 2005 totaled $6 million in 2006 and $6 million in 2005.
Our aggregate expense for U.S. employees under the defined contribution plans was $56 million in 2006 and $53 million in both 2005 and 2004.
The benefits under the qualified defined benefit pension plan are determined using a formula based upon years of service and the highest five consecutive years of compensation. We intend to contribute amounts to this plan to meet the minimum funding requirements of federal laws and regulations plus such additional amounts as we deem appropriate. During 2006, we contributed $125 million to our defined benefit pension plans of which $114 million were cash contributions to the qualified pension trust and $11 million were benefit payments related to our nonqualified defined benefit pension plans. The nonqualified plans are unfunded and closed to new participants.
During 2006, the U.S. defined benefit plans made $124 million in total benefits payments, primarily for the qualified pension plan. Of that amount, $119 million was accounted for as settlements and $5 million as benefits paid. For comparison purposes, in 2005 the U.S. defined benefit plans made $62 million in benefit payments of which $12 million was accounted for as settlements and $50 million as benefits paid.
U.S. Retiree Health Care Benefit Plan:
We offer access to group medical coverage during retirement to most of our U.S. employees. We make a contribution toward the cost of those retiree medical benefits for certain retirees and their dependents. The contribution rates are based upon various factors, the most important of which are an employee’s date of hire, date of retirement, years of service and eligibility for Medicare benefits. The balance of the cost is borne by the participants in the plan. Employees hired after January 1, 2001, are responsible for the full cost of their medical benefits during retirement. During 2006, we contributed $91 million to the retiree health care plan.
Non-U.S. Retirement Plans:
Retirement coverage for non-U.S. employees is provided, to the extent deemed appropriate, through separate defined benefit and defined contribution plans. Retirement benefits are generally based on an employee’s years of service and compensation.Funding requirements are determined on an individual country and plan basis and subject to local country practices and market circumstances. During 2006, we contributed $143 million to our non-U.S. retirement plans.
As of December 31, 2006 and 2005, in accordance with the election of employees, TI’s non-U.S. defined contribution plans held shares of TI common stock totaling 0.7 million shares valued at $19 million in 2006 and $22 million in 2005. Dividends paid on these shares for 2006 and 2005 totaled $88 thousand and $70 thousand.

TEXAS INSTRUMENTS 2006 ANNUAL REPORT2828
Effect on the Statements of Income and Balance Sheets
Expense related to defined benefit and retiree health care benefit plans was as follows:
U.S. DEFINED BENEFIT U.S. RETIREE HEALTH CARENON-U.S.
DEFINED BENEFIT
2006 2005 2004 2006 2005 2004 2006 2005 2004
Service cost . . . . . . . . . . . . . . . . . . . . . . . . . . . . . . . $ 26 $ 27 $ 25 $ 4 $ 4 $ 2 $ 44 $ 44 $ 50Interest cost . . . . . . . . . . . . . . . . . . . . . . . . . . . . . . . 45 40 40 25 22 21 46 46 44Expected return on plan assets . . . . . . . . . . . . . . (45) (44) (44) (21) (20) (15) (66) (45) (43)Amortization of prior service cost . . . . . . . . . . . . — — — 2 3 (4) (3) (2) 1Amortization of transition obligation . . . . . . . . . — — — — — — — — 1Recognized net actuarial loss . . . . . . . . . . . . . . . . 21 23 20 6 8 10 13 22 20Net periodic benefit cost . . . . . . . . . . . . . . . . . . . . 47 46 41 16 17 14 34 65 73Settlement, curtailment and special
termination benefit charges . . . . . . . . . . . . . . . 26 1 2 — — — — — —Total including charges . . . . . . . . . . . . . . . . . . . . . $ 73 $ 47 $ 43 $ 16 $ 17 $ 14 $ 34 $ 65 $ 73
The increase in settlement costs in 2006 is primarily due to an increase in lump-sum distributions elected by retirees in 2006 as compared with previous years.
For the U.S. plans, the expected return on plan assets component of net periodic benefit cost is based upon the market-related value of assets. In accordance with U.S. GAAP, the market-related value of assets utilizes a smoothing technique whereby investment gains and losses that differ from plan assumptions are phased into the value over a period of three years.
Changes in the benefit obligations and plan assets for the defined benefit and retiree health care benefit plans were as follows:
U.S. DEFINED BENEFIT U.S. RETIREEHEALTH CARE NON-U.S. DEFINED BENEFIT
2006 2005 2006 2005 2006 2005
Obligation and funded status of plans:Benefit obligation at beginning of year . . . . . . . . . . . $ 798 $ 740 $ 442 $ 420 $ 1,603 $ 1,571Service cost . . . . . . . . . . . . . . . . . . . . . . . . . . . . . . . . . . 26 27 4 4 44 44Interest cost . . . . . . . . . . . . . . . . . . . . . . . . . . . . . . . . . . 45 40 25 22 46 46Change in measurement date . . . . . . . . . . . . . . . . . . . — — — — 22 —Participant contributions . . . . . . . . . . . . . . . . . . . . . . . — — 15 16 4 3Benefits paid . . . . . . . . . . . . . . . . . . . . . . . . . . . . . . . . . (5) (50) (45) (44) (55) (43)Medicare subsidy . . . . . . . . . . . . . . . . . . . . . . . . . . . . . — — 4 — — —Plan amendments . . . . . . . . . . . . . . . . . . . . . . . . . . . . . — — — (4) — (62)Actuarial (gain) loss . . . . . . . . . . . . . . . . . . . . . . . . . . . 44 48 (1) 26 31 44Settlements . . . . . . . . . . . . . . . . . . . . . . . . . . . . . . . . . . (119) (12) — — — —Curtailments . . . . . . . . . . . . . . . . . . . . . . . . . . . . . . . . . . (1) 4 — 2 — —Special termination benefits . . . . . . . . . . . . . . . . . . . . — 1 — — — —Benefit obligation at end of year (BO) . . . . . . . . . . . $ 788 $ 798 $ 444 $ 442 $ 1,695 $ 1,603
Change in plan assets: Fair value of plan assets at beginning of year . . . . . $ 724 $ 736 $ 303 $ 315 $ 1,054 $ 827Actual return on plan assets . . . . . . . . . . . . . . . . . . . . 71 47 37 15 171 177Change in measurement date . . . . . . . . . . . . . . . . . . . — — — — 16 —Employer contributions . . . . . . . . . . . . . . . . . . . . . . . . 125 3 91 1 379(a) 108Participant contributions . . . . . . . . . . . . . . . . . . . . . . . — — 15 16 4 3Benefits paid . . . . . . . . . . . . . . . . . . . . . . . . . . . . . . . . . (5) (50) (45) (44) (55) (43)Settlements . . . . . . . . . . . . . . . . . . . . . . . . . . . . . . . . . . (119) (12) — — — —Actuarial gain . . . . . . . . . . . . . . . . . . . . . . . . . . . . . . . . . — — — — (3) (18)Fair value of plan assets at end of year (FVPA) . . . $ 796 $ 724 $ 401 $ 303 $ 1,566 $ 1,054
Funded status (FVPA–BO) at end of year . . . . . . . . . . $ 8 $ (74) $ (43) $ (139) $ (129) $ (549)
(a) Includes $236 million contributed to non-U.S. plans in 2005 after the September 30 measurement date for those plans.
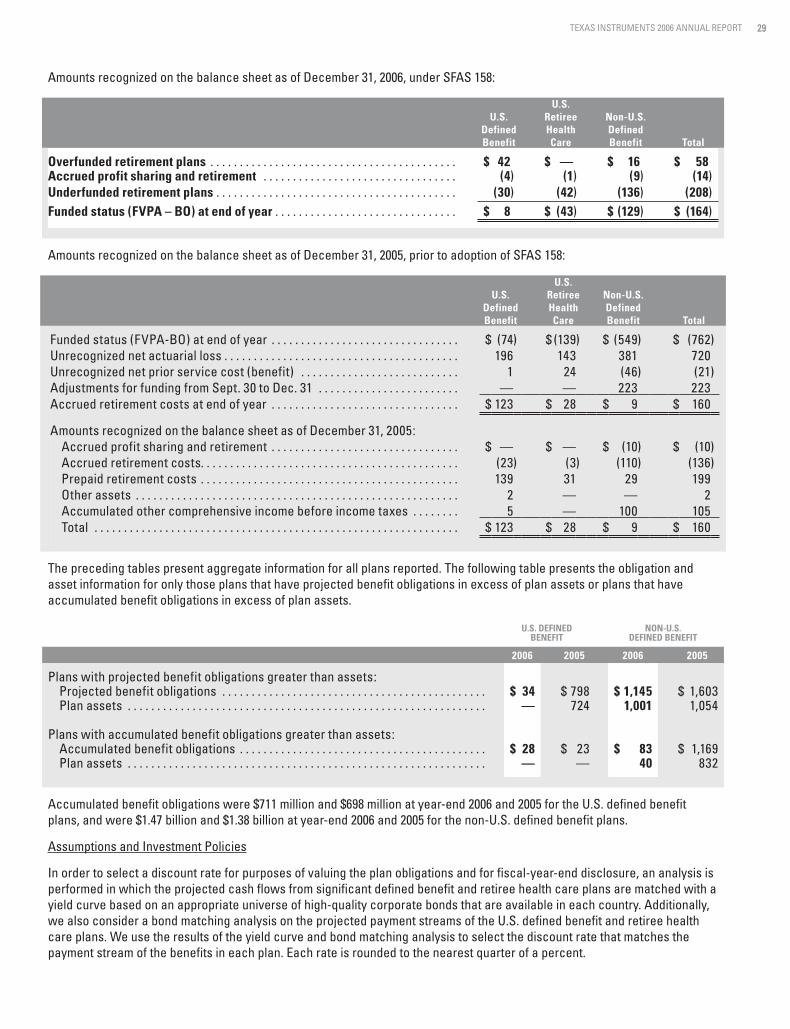
TEXAS INSTRUMENTS 2006 ANNUAL REPORT 2929
Amounts recognized on the balance sheet as of December 31, 2006, under SFAS 158:
U.S.Defined Benefit
U.S.Retiree Health Care
Non-U.S.Defined Benefit Total
Overfunded retirement plans . . . . . . . . . . . . . . . . . . . . . . . . . . . . . . . . . . . . . . . . . . $ 42 $ — $ 16 $ 58Accrued profit sharing and retirement . . . . . . . . . . . . . . . . . . . . . . . . . . . . . . . . . (4) (1) (9) (14)Underfunded retirement plans . . . . . . . . . . . . . . . . . . . . . . . . . . . . . . . . . . . . . . . . . (30) (42) (136) (208)Funded status (FVPA – BO) at end of year . . . . . . . . . . . . . . . . . . . . . . . . . . . . . . . $ 8 $ (43) $ (129) $ (164)
Amounts recognized on the balance sheet as of December 31, 2005, prior to adoption of SFAS 158:
U.S.Defined Benefit
U.S.RetireeHealthCare
Non-U.S.Defined Benefit Total
Funded status (FVPA-BO) at end of year . . . . . . . . . . . . . . . . . . . . . . . . . . . . . . . . $ (74) $ (139) $ (549) $ (762)Unrecognized net actuarial loss . . . . . . . . . . . . . . . . . . . . . . . . . . . . . . . . . . . . . . . . 196 143 381 720Unrecognized net prior service cost (benefit) . . . . . . . . . . . . . . . . . . . . . . . . . . . 1 24 (46) (21)Adjustments for funding from Sept. 30 to Dec. 31 . . . . . . . . . . . . . . . . . . . . . . . . — — 223 223Accrued retirement costs at end of year . . . . . . . . . . . . . . . . . . . . . . . . . . . . . . . . $ 123 $ 28 $ 9 $ 160
Amounts recognized on the balance sheet as of December 31, 2005:Accrued profit sharing and retirement . . . . . . . . . . . . . . . . . . . . . . . . . . . . . . . . $ — $ — $ (10) $ (10)Accrued retirement costs. . . . . . . . . . . . . . . . . . . . . . . . . . . . . . . . . . . . . . . . . . . . (23) (3) (110) (136)Prepaid retirement costs . . . . . . . . . . . . . . . . . . . . . . . . . . . . . . . . . . . . . . . . . . . . 139 31 29 199Other assets . . . . . . . . . . . . . . . . . . . . . . . . . . . . . . . . . . . . . . . . . . . . . . . . . . . . . . . 2 — — 2Accumulated other comprehensive income before income taxes . . . . . . . . 5 — 100 105Total . . . . . . . . . . . . . . . . . . . . . . . . . . . . . . . . . . . . . . . . . . . . . . . . . . . . . . . . . . . . . . $ 123 $ 28 $ 9 $ 160
The preceding tables present aggregate information for all plans reported. The following table presents the obligation and asset information for only those plans that have projected benefit obligations in excess of plan assets or plans that have accumulated benefit obligations in excess of plan assets.
U.S. DEFINEDBENEFIT
NON-U.S.DEFINED BENEFIT
2006 2005 2006 2005
Plans with projected benefit obligations greater than assets:Projected benefit obligations . . . . . . . . . . . . . . . . . . . . . . . . . . . . . . . . . . . . . . . . . . . . . $ 34 $ 798 $ 1,145 $ 1,603Plan assets . . . . . . . . . . . . . . . . . . . . . . . . . . . . . . . . . . . . . . . . . . . . . . . . . . . . . . . . . . . . . — 724 1,001 1,054
Plans with accumulated benefit obligations greater than assets:Accumulated benefit obligations . . . . . . . . . . . . . . . . . . . . . . . . . . . . . . . . . . . . . . . . . . $ 28 $ 23 $ 83 $ 1,169Plan assets . . . . . . . . . . . . . . . . . . . . . . . . . . . . . . . . . . . . . . . . . . . . . . . . . . . . . . . . . . . . . — — 40 832
Accumulated benefit obligations were $711 million and $698 million at year-end 2006 and 2005 for the U.S. defined benefit plans, and were $1.47 billion and $1.38 billion at year-end 2006 and 2005 for the non-U.S. defined benefit plans.
Assumptions and Investment Policies
In order to select a discount rate for purposes of valuing the plan obligations and for fiscal-year-end disclosure, an analysis is performed in which the projected cash flows from significant defined benefit and retiree health care plans are matched with a yield curve based on an appropriate universe of high-quality corporate bonds that are available in each country. Additionally, we also consider a bond matching analysis on the projected payment streams of the U.S. defined benefit and retiree health care plans. We use the results of the yield curve and bond matching analysis to select the discount rate that matches the payment stream of the benefits in each plan. Each rate is rounded to the nearest quarter of a percent.

TEXAS INSTRUMENTS 2006 ANNUAL REPORT3030
The ranges of assumptions used for the non-U.S. defined benefit plans reflect the different economic environments within the various countries.
DEFINED BENEFITRETIREE HEALTH
CARE
2006 2005 2006 2005
Weighted average assumptions used to determine benefit obligations:U.S. assumed discount rate . . . . . . . . . . . . . . . . . . . . . . . . . . . . . . . . . . . . . . . . . . . . 5.75% 5.50% 5.75% 5.50%Non-U.S. assumed discount rate:
High . . . . . . . . . . . . . . . . . . . . . . . . . . . . . . . . . . . . . . . . . . . . . . . . . . . . . . . . . . . . . . . 5.00% 5.00%Low . . . . . . . . . . . . . . . . . . . . . . . . . . . . . . . . . . . . . . . . . . . . . . . . . . . . . . . . . . . . . . . 2.25% 2.25%
U.S. average long-term pay progression . . . . . . . . . . . . . . . . . . . . . . . . . . . . . . . . . 3.50% 4.00%Non-U.S. average long-term pay progression:
High . . . . . . . . . . . . . . . . . . . . . . . . . . . . . . . . . . . . . . . . . . . . . . . . . . . . . . . . . . . . . . . 5.00% 4.00%Low . . . . . . . . . . . . . . . . . . . . . . . . . . . . . . . . . . . . . . . . . . . . . . . . . . . . . . . . . . . . . . . 3.00% 3.00%
Weighted average assumptions used to determine net periodic benefit cost:U.S. assumed discount rate . . . . . . . . . . . . . . . . . . . . . . . . . . . . . . . . . . . . . . . . . . . . 5.94% 5.38% 6.00% 5.25%Non-U.S. assumed discount rate:
High . . . . . . . . . . . . . . . . . . . . . . . . . . . . . . . . . . . . . . . . . . . . . . . . . . . . . . . . . . . . . . . 5.00% 5.50%Low . . . . . . . . . . . . . . . . . . . . . . . . . . . . . . . . . . . . . . . . . . . . . . . . . . . . . . . . . . . . . . . 2.25% 2.25%
U.S. assumed long-term rate of return on plan assets . . . . . . . . . . . . . . . . . . . . . 7.00% 7.00% 7.00% 7.00%Non-U.S. assumed long-term rate of return on plan assets:
High . . . . . . . . . . . . . . . . . . . . . . . . . . . . . . . . . . . . . . . . . . . . . . . . . . . . . . . . . . . . . . . 6.60% 6.00%Low . . . . . . . . . . . . . . . . . . . . . . . . . . . . . . . . . . . . . . . . . . . . . . . . . . . . . . . . . . . . . . . 2.00% 3.00%
U.S. average long-term pay progression . . . . . . . . . . . . . . . . . . . . . . . . . . . . . . . . . 4.00% 4.00%Non-U.S. average long-term pay progression:
High . . . . . . . . . . . . . . . . . . . . . . . . . . . . . . . . . . . . . . . . . . . . . . . . . . . . . . . . . . . . . . . 4.00% 4.50%Low . . . . . . . . . . . . . . . . . . . . . . . . . . . . . . . . . . . . . . . . . . . . . . . . . . . . . . . . . . . . . . . 3.00% 3.00%
Assumptions for expected long-term rate of return on plan assets are based upon actual historical returns, future expectations for returns for each asset class and the effect of periodic target asset allocation rebalancing. The results are adjusted for the payment of reasonable expenses of the plan from plan assets. The historical long-term return on the plans’ assets has exceeded the selected rates and we believe these assumptions are appropriate based upon the mix of the investments and the long-term nature of the plans’ investments.
Our rate of return assumption for the U.S. defined benefit plan reflects a decision to move gradually over several years to an asset allocation policy with less emphasis on equity investments. This allocation move is designed to better match the plan’s assets with the liability structure as the plan matures.
The table below shows target allocation ranges for the plans that hold a substantial majority of the defined benefit assets. The asset allocations for the retiree health care benefit plan are intended to represent the long-term targeted mix rather than a current mix.
Asset CategoryU.S. Defined
Benefit
U.S.RetireeHealth Care
Non-U.S.DefinedBenefit
Equity securities . . . . . . . . . . . . . . . . . . . . . . . . . . . . . . . . . . . . . . . . . . . . . . . . . . . . . 50% - 75% 75% 30% - 60%Fixed income securities and cash . . . . . . . . . . . . . . . . . . . . . . . . . . . . . . . . . . . . . . 25% - 50% 25% 40% - 70%
For the defined benefit plans, it is intended that the investments will be rebalanced when the allocation is not within the target range. Additional contributions are invested consistent with the target ranges and may be used to rebalance the portfolio. The investment allocations and individual investments are chosen with regard to the duration of the obligations of the plan. A small portion of the retiree health care benefit plan assets are invested in an account within the pension trust and are invested in a like manner as the other pension assets. The majority of the assets in the retiree health care benefit plan are invested in a series of Voluntary Employee Benefit Association (VEBA) trusts. For tax efficiency, the investments in the VEBA trusts are not rebalanced but additional contributions to the trusts may be used to reallocate the portfolio.

TEXAS INSTRUMENTS 2006 ANNUAL REPORT 3131
Weighted average asset allocations at December 31, are as follows:
U.S. DefinedBenefit
U.S. RetireeHealth Care
Non-U.S.DefinedBenefit
Asset Category 2006 2005 2006 2005 2006 2005
Equity securities . . . . . . . . . . . . . . . . . . . . . . . . . . . . . . . . . . . . . . . . . . . . . . . . . . 62% 64% 69% 64% 52% 79%Fixed income securities and cash . . . . . . . . . . . . . . . . . . . . . . . . . . . . . . . . . . . 38% 36% 31% 36% 48% 21%
There are no significant restrictions on the amount or nature of the investments that may be acquired or held by the plans.None of the plan assets related to the defined benefit pension plans and retiree health care benefit plan are directly invested in TI common stock.
Contributions to the plans meet or exceed all minimum funding requirements. We expect to contribute approximately $40 million to U.S. retirement plans and approximately $70 million to non-U.S. retirement plans in 2007.
The following table projects the benefits expected to be paid to participants from the plans in each of the following years. The majority of the payments will be paid from plan assets and not company assets.
U.S. DefinedBenefit
U.S.RetireeHealth Care
MedicareSubsidy
Non-U.S.Defined Benefit
2007 . . . . . . . . . . . . . . . . . . . . . . . . . . . . . . . . . . . . . . . . . . . . . . . . . . . . . . . . . . . . . . . $ 119 $ 36 $ (4) $ 402008 . . . . . . . . . . . . . . . . . . . . . . . . . . . . . . . . . . . . . . . . . . . . . . . . . . . . . . . . . . . . . . . 104 39 (5) 442009 . . . . . . . . . . . . . . . . . . . . . . . . . . . . . . . . . . . . . . . . . . . . . . . . . . . . . . . . . . . . . . . 100 41 (5) 472010 . . . . . . . . . . . . . . . . . . . . . . . . . . . . . . . . . . . . . . . . . . . . . . . . . . . . . . . . . . . . . . . 82 43 (5) 522011 . . . . . . . . . . . . . . . . . . . . . . . . . . . . . . . . . . . . . . . . . . . . . . . . . . . . . . . . . . . . . . . 76 44 (6) 562012–2016 . . . . . . . . . . . . . . . . . . . . . . . . . . . . . . . . . . . . . . . . . . . . . . . . . . . . . . . . . . 336 218 (20) 339
Assumed health care cost trend rates for the U.S. retiree health care plan at December 31:U.S. RETIREEHEALTH CARE
2006 2005
Assumed health care trend rate for next year:Attributed to less than age 65 . . . . . . . . . . . . . . . . . . . . . . . . . . . . . . . . . . . . . . . . . . . . . . . . . . . . . . . . . . . . . 9.0% 10.0%Attributed to age 65 or greater . . . . . . . . . . . . . . . . . . . . . . . . . . . . . . . . . . . . . . . . . . . . . . . . . . . . . . . . . . . . 10.0% 11.0%
Ultimate trend rate . . . . . . . . . . . . . . . . . . . . . . . . . . . . . . . . . . . . . . . . . . . . . . . . . . . . . . . . . . . . . . . . . . . . . . . . 5.0% 5.0%Year in which ultimate trend rate is reached:
Attributed to less than age 65 . . . . . . . . . . . . . . . . . . . . . . . . . . . . . . . . . . . . . . . . . . . . . . . . . . . . . . . . . . . . . 2011 2011Attributed to age 65 or greater . . . . . . . . . . . . . . . . . . . . . . . . . . . . . . . . . . . . . . . . . . . . . . . . . . . . . . . . . . . . 2012 2012
Increasing or decreasing health care cost trend rates by one percentage point would have increased or decreased the accumulated postretirement benefit obligation at December 31, 2006, by $18 million and the service cost and interest cost components of 2006 plan expense by $1 million.
Deferred Compensation Arrangements
We have a nonqualified deferred compensation plan, which allows certain highly compensated employees the option to defer the receipt of a portion of their salary, bonus and profit sharing. Employees who participate in the deferred compensation plan can select one of eight distribution options offered by the plan. Payments are made after the employee terminates, based on their distribution election and plan balance. Participants can earn a return on their deferred compensation that is based on hypothetical investments in the same investment funds and TI common stock offered in our defined contribution plans. Changes in the market value of these participant investments are reflected as an adjustment to the liability for deferred compensation with an offset to compensation expense.

TEXAS INSTRUMENTS 2006 ANNUAL REPORT3232
In December 2004, the existing deferred compensation plan was closed to deferral elections for compensation earned after 2004. For compensation earned after 2004, we have allowed deferral elections in accordance with the provisions of the AJCA.
As of December 31, 2006, the liability to the participants of the deferred compensation plan was $194 million and is recorded in noncurrent liabilities. This amount reflects the accumulated participant deferrals and earnings thereon as of that date.We make no contributions to the deferred compensation plan and so remain contingently liable to the participants. However, to serve as an economic hedge of the financial impact of changes in market values of these hypothetical investments, we invest in similar mutual funds and have entered into a forward purchase contract (explained below). Changes in the fair value of these mutual fund investments are recognized as an offset to compensation expense (see Note 4 for a discussion of investments).
As no shares of TI common stock are actually held for the account of participants, as of December 31, 2006, we have a forward purchase contract with a commercial bank to acquire 765,000 shares of TI common stock at a fixed price of $30.29per share at the end of the contract term or, at our option, to settle in cash with the bank. We are also able, at our discretion, to unwind all or part of this contract prior to the end of the contract term. The contract is intended to be an economic hedge to minimize the earnings impact from the effect of fluctuations in stock market prices on the portion of the deferred compensation plan obligations that are denominated in TI stock. The forward contract is marked-to-market with any changes reflected in compensation expense. Since December 31, 2005, participants have been prohibited from directing any further transfers to the TI common stock portion of the hypothetical investments, so this hedge will remain at or below 765,000 shares of TI common stock in the future.
11. Profit Sharing and Savings Plans
We sponsor various profit sharing plans, the largest of which is the TI Employee Profit Sharing Plan (the current plan).Profit sharing benefits are generally formulaic and determined by one or more business or company-wide financial metrics.Beginning in 2005, profit sharing expense is determined based on a different formula than was used in 2004. The current plan provides for profit sharing to be paid based solely upon TI’s operating margin for the full calendar year. Under this plan, a minimum threshold of 10 percent operating margin must be achieved before any profit sharing is paid. Profit sharing at 10 percent operating margin will be 2 percent of eligible payroll. The maximum amount of profit sharing available under the plan is 20 percent of eligible payroll, and would only be paid when TI’s operating margin meets or exceeds 35 percent for a full calendar year.
We recognized $149 million, $115 million and $243 million of profit sharing expense under the TI Employee Profit Sharing Plan in 2006, 2005 and 2004.
12. Segment and Geographic Area Data
As a result of the sale of the former Sensors & Controls segment, excluding the RFID operations, we now have two reportable operating segments: Semiconductor and Education Technology. The Education Technology segment, formerly named Educational & Productivity Solutions, has been renamed to reflect that the nature of this segment’s business has gradually changed to emphasize education. There is no financial statement impact from this name change.
The former Sensors & Controls business has been reflected as discontinued operations (see Notes 1 and 2). Segment results for prior periods reflect the addition of the RFID operations to the Semiconductor segment.
Our Semiconductor segment designs, manufactures and sells integrated circuits. Our core products include analog integrated circuits and digital signal processors, which are used in a broad range of electronic systems. These systems include cellular telephones, personal computers, servers, communications infrastructure equipment, motor controls, automotive equipment and digital imaging systems such as front projectors and high-definition digital televisions. Semiconductor products are sold to original-equipment manufacturers (OEMs), original-design manufacturers (ODMs), contract manufacturers and distributors. An OEM designs and sells products under its own brand that it manufactures in-house or has contracted to other manufacturers. An ODM designs and manufactures products for other companies to sell under their respective brands.Distributors sell TI products directly to a wide range of customers. The semiconductor market is intensely competitive and is subject to rapid technological change, pricing pressures, and the requirement of high rates of investment for R&D and for the manufacturing factories and equipment needed to produce semiconductors. This segment represented 96 percent of revenue in 2006.

TEXAS INSTRUMENTS 2006 ANNUAL REPORT 3333
Our Education Technology segment is a leading supplier of graphing handheld calculators. This segment also provides customers with business and scientific calculators and a wide range of advanced classroom tools and professional development resources to help students and teachers interactively explore math and science. Education Technology relies on third-party manufacturers to build its products. Our principal competitors in this business are U.S.- and Japan-based companies. The principal competitive factors are an understanding of the education market, technology expertise and price.Education Technology sells products primarily through retailers and instructional dealers. This segment represented 4 percent of our 2006 revenue.
Operating profits of these businesses exclude the effects of stock-based compensation expense, special charges and gains, and acquisition-related amortization, which are included in Corporate. The results for Semiconductor include the effects of all royalty revenue from semiconductor-related license agreements. Business assets are the owned or allocated assets used by each business.
Also included in Corporate are general corporate expenses and elimination of intersegment transactions (which are generally intended to approximate market prices). Assets of Corporate include unallocated cash, short-term investments, noncurrent investments and deferred income taxes.
Segment Information
SemiconductorEducation
Technology Corporate Total
Net revenue2006 . . . . . . . . . . . . . . . . . . . . . . . . . . . . . . . . . . . . . . . . . . . . . . . . . . . . . . $ 13,730 $ 525 $ — $ 14,2552005 . . . . . . . . . . . . . . . . . . . . . . . . . . . . . . . . . . . . . . . . . . . . . . . . . . . . . . 11,829 506 — 12,3352004 . . . . . . . . . . . . . . . . . . . . . . . . . . . . . . . . . . . . . . . . . . . . . . . . . . . . . . 11,034 518 — 11,552
Profit (loss) from operations2006 . . . . . . . . . . . . . . . . . . . . . . . . . . . . . . . . . . . . . . . . . . . . . . . . . . . . . . 3,831 200 (664) 3,3672005 . . . . . . . . . . . . . . . . . . . . . . . . . . . . . . . . . . . . . . . . . . . . . . . . . . . . . . 2,808 188 (437) 2,5592004 . . . . . . . . . . . . . . . . . . . . . . . . . . . . . . . . . . . . . . . . . . . . . . . . . . . . . . 2,068 176 (284) 1,960
Assets of continuing operations2006 . . . . . . . . . . . . . . . . . . . . . . . . . . . . . . . . . . . . . . . . . . . . . . . . . . . . . . 7,115 103 6,708 13,9262005 . . . . . . . . . . . . . . . . . . . . . . . . . . . . . . . . . . . . . . . . . . . . . . . . . . . . . . 6,518 90 7,960 14,5682004 . . . . . . . . . . . . . . . . . . . . . . . . . . . . . . . . . . . . . . . . . . . . . . . . . . . . . . 6,481 91 9,297 15,869
Property, plant and equipment additions2006 . . . . . . . . . . . . . . . . . . . . . . . . . . . . . . . . . . . . . . . . . . . . . . . . . . . . . . 1,221 — 51 1,2722005 . . . . . . . . . . . . . . . . . . . . . . . . . . . . . . . . . . . . . . . . . . . . . . . . . . . . . . 1,250 1 37 1,2882004 . . . . . . . . . . . . . . . . . . . . . . . . . . . . . . . . . . . . . . . . . . . . . . . . . . . . . . 1,220 1 39 1,260
Depreciation2006 . . . . . . . . . . . . . . . . . . . . . . . . . . . . . . . . . . . . . . . . . . . . . . . . . . . . . . 1,011 1 40 1,0522005 . . . . . . . . . . . . . . . . . . . . . . . . . . . . . . . . . . . . . . . . . . . . . . . . . . . . . . 1,294 1 51 1,3462004 . . . . . . . . . . . . . . . . . . . . . . . . . . . . . . . . . . . . . . . . . . . . . . . . . . . . . . 1,393 1 55 1,449
There was no significant intersegment revenue.
The following geographic area data includes net revenue, based on product shipment destination and royalty payor location, and property, plant and equipment based on physical location:
Geographic Area Information
U.S. Asia Europe JapanRest ofWorld Total
Net revenue2006 . . . . . . . . . . . . . . . . . . . . . . . . . . . . . . . . . . . . . . . . . . $ 1,868 $ 7,568 $ 2,286 $ 2,008 $ 525 $ 14,2552005 . . . . . . . . . . . . . . . . . . . . . . . . . . . . . . . . . . . . . . . . . . 1,679 6,277 2,060 1,821 498 12,3352004 . . . . . . . . . . . . . . . . . . . . . . . . . . . . . . . . . . . . . . . . . . 1,601 5,584 1,991 1,934 442 11,552
Property, plant and equipment, net2006 . . . . . . . . . . . . . . . . . . . . . . . . . . . . . . . . . . . . . . . . . . $ 2,517 $ 944 $ 205 $ 271 $ 13 $ 3,9502005 . . . . . . . . . . . . . . . . . . . . . . . . . . . . . . . . . . . . . . . . . . 2,544 705 208 259 14 3,7302004 . . . . . . . . . . . . . . . . . . . . . . . . . . . . . . . . . . . . . . . . . . 2,561 656 262 297 18 3,794

TEXAS INSTRUMENTS 2006 ANNUAL REPORT3434
Major Customer
Direct sales to the Nokia group of companies were 11 percent of our revenue in 2006, 2005 and 2004, although if indirect sales such as to contract manufacturers are included, Nokia accounted for 15 percent, 16 percent and 13 percent of our 2006, 2005 and 2004 revenue.
13. Income Taxes
Income from Continuing Operations before Income Taxes
U.S. Non-U.S. Total
2006 . . . . . . . . . . . . . . . . . . . . . . . . . . . . . . . . . . . . . . . . . . . . . . . . . . . . . . . . . . . . . . . . . . . . . . . . . . . . . . . $ 2,582 $ 1,043 $ 3,6252005 . . . . . . . . . . . . . . . . . . . . . . . . . . . . . . . . . . . . . . . . . . . . . . . . . . . . . . . . . . . . . . . . . . . . . . . . . . . . . . . 1,770 985 2,7552004 . . . . . . . . . . . . . . . . . . . . . . . . . . . . . . . . . . . . . . . . . . . . . . . . . . . . . . . . . . . . . . . . . . . . . . . . . . . . . . . 1,373 799 2,172
Provision for Income Taxes
U.S.Federal
Non-U.S.
U.S.State Total
2006Current . . . . . . . . . . . . . . . . . . . . . . . . . . . . . . . . . . . . . . . . . . . . . . . . . . . . . . . . . . . . . . . $ 885 $ 280 $ 22 $ 1,187Deferred . . . . . . . . . . . . . . . . . . . . . . . . . . . . . . . . . . . . . . . . . . . . . . . . . . . . . . . . . . . . . (218) 31 (13) (200)Total . . . . . . . . . . . . . . . . . . . . . . . . . . . . . . . . . . . . . . . . . . . . . . . . . . . . . . . . . . . . . . . . . $ 667 $ 311 $ 9 $ 9872005Current . . . . . . . . . . . . . . . . . . . . . . . . . . . . . . . . . . . . . . . . . . . . . . . . . . . . . . . . . . . . . . . $ 481 $ 293 $ 2 $ 776Deferred . . . . . . . . . . . . . . . . . . . . . . . . . . . . . . . . . . . . . . . . . . . . . . . . . . . . . . . . . . . . . (176) (12) (6) (194)Total . . . . . . . . . . . . . . . . . . . . . . . . . . . . . . . . . . . . . . . . . . . . . . . . . . . . . . . . . . . . . . . . . $ 305 $ 281 $ (4) $ 5822004Current . . . . . . . . . . . . . . . . . . . . . . . . . . . . . . . . . . . . . . . . . . . . . . . . . . . . . . . . . . . . . . . $ 194 $ 211 $ 6 $ 411Deferred . . . . . . . . . . . . . . . . . . . . . . . . . . . . . . . . . . . . . . . . . . . . . . . . . . . . . . . . . . . . . 120 (48) (2) 70Total . . . . . . . . . . . . . . . . . . . . . . . . . . . . . . . . . . . . . . . . . . . . . . . . . . . . . . . . . . . . . . . . . $ 314 $ 163 $ 4 $ 481
Principal reconciling items from income tax computed at the statutory federal rate follow:
2006 2005 2004
Computed tax at statutory rate . . . . . . . . . . . . . . . . . . . . . . . . . . . . . . . . . . . . . . . . . . . . . . . . . . . . . $ 1,269 $ 965 $ 760Effect of non-U.S. rates . . . . . . . . . . . . . . . . . . . . . . . . . . . . . . . . . . . . . . . . . . . . . . . . . . . . . . . . . . . . (80) (144) (138)AJCA repatriation tax . . . . . . . . . . . . . . . . . . . . . . . . . . . . . . . . . . . . . . . . . . . . . . . . . . . . . . . . . . . . . — 55 —Research and experimentation tax credits . . . . . . . . . . . . . . . . . . . . . . . . . . . . . . . . . . . . . . . . . . . (78) (62) (58)Favorable proposed audit adjustments communicated by tax authorities . . . . . . . . . . . . . . . . — (147) —U.S. tax benefits for manufacturing and foreign sales . . . . . . . . . . . . . . . . . . . . . . . . . . . . . . . . . (106) (82) (79)Other . . . . . . . . . . . . . . . . . . . . . . . . . . . . . . . . . . . . . . . . . . . . . . . . . . . . . . . . . . . . . . . . . . . . . . . . . . . . (18) (3) (4)Total provision for income taxes . . . . . . . . . . . . . . . . . . . . . . . . . . . . . . . . . . . . . . . . . . . . . . . . . . . . $ 987 $ 582 $ 481

TEXAS INSTRUMENTS 2006 ANNUAL REPORT 3535
The primary components of deferred income tax assets and liabilities at December 31 were as follows:
DECEMBER 31,
2006 2005
Deferred income tax assets:Accrued retirement costs (defined benefit and retiree health care) . . . . . . . . . . . . . . . . . . . . . . . . . . . . . . $ 194 $ 45Inventories and related reserves . . . . . . . . . . . . . . . . . . . . . . . . . . . . . . . . . . . . . . . . . . . . . . . . . . . . . . . . . . . . . 392 315Stock-based compensation . . . . . . . . . . . . . . . . . . . . . . . . . . . . . . . . . . . . . . . . . . . . . . . . . . . . . . . . . . . . . . . . . 156 61Accrued expenses . . . . . . . . . . . . . . . . . . . . . . . . . . . . . . . . . . . . . . . . . . . . . . . . . . . . . . . . . . . . . . . . . . . . . . . . . 295 260Deferred loss and tax credits . . . . . . . . . . . . . . . . . . . . . . . . . . . . . . . . . . . . . . . . . . . . . . . . . . . . . . . . . . . . . . . . 387 372Investments . . . . . . . . . . . . . . . . . . . . . . . . . . . . . . . . . . . . . . . . . . . . . . . . . . . . . . . . . . . . . . . . . . . . . . . . . . . . . . . 48 56Other . . . . . . . . . . . . . . . . . . . . . . . . . . . . . . . . . . . . . . . . . . . . . . . . . . . . . . . . . . . . . . . . . . . . . . . . . . . . . . . . . . . . . 121 108
1,593 1,217Less valuation allowance . . . . . . . . . . . . . . . . . . . . . . . . . . . . . . . . . . . . . . . . . . . . . . . . . . . . . . . . . . . . . . . . . . . (14) (36)
1,579 1,181Deferred income tax liabilities:
Property, plant and equipment . . . . . . . . . . . . . . . . . . . . . . . . . . . . . . . . . . . . . . . . . . . . . . . . . . . . . . . . . . . . . . . (145) (172)Intangibles . . . . . . . . . . . . . . . . . . . . . . . . . . . . . . . . . . . . . . . . . . . . . . . . . . . . . . . . . . . . . . . . . . . . . . . . . . . . . . . . (29) (11)Non-U.S. earnings . . . . . . . . . . . . . . . . . . . . . . . . . . . . . . . . . . . . . . . . . . . . . . . . . . . . . . . . . . . . . . . . . . . . . . . . . . (26) (6)Other . . . . . . . . . . . . . . . . . . . . . . . . . . . . . . . . . . . . . . . . . . . . . . . . . . . . . . . . . . . . . . . . . . . . . . . . . . . . . . . . . . . . . (60) (3)
(260) (192)Net deferred income tax asset . . . . . . . . . . . . . . . . . . . . . . . . . . . . . . . . . . . . . . . . . . . . . . . . . . . . . . . . . . . . . . . . . $ 1,319 $ 989
As of December 31, 2006 and 2005, the net deferred income tax assets of $1.32 billion and $989 million were presented in the balance sheets, based on tax jurisdiction, as deferred income tax assets of $1.34 billion and $1.01 billion and deferred income tax liabilities of $23 million and $23 million. We make an ongoing assessment regarding the realization of U.S. and non-U.S.deferred tax assets. While these assets are not assured of realization, our assessment is that a valuation allowance is not required for the remaining balance of the deferred tax assets. This assessment is based on our evaluation of relevant criteria including the existence of: (a) deferred tax liabilities that can be used to absorb deferred tax assets, (b) taxable income in prior carryback years, and (c) future taxable income.
We have aggregate U.S. and non-U.S. tax loss carryforwards of approximately $85 million of which $11 million expire through the year 2024.
During 2005, we repatriated approximately $1.29 billion of non-U.S. subsidiary earnings that qualified under the AJCA and recognized a related tax expense of $55 million.
Provision has previously been made for deferred taxes on undistributed earnings of non-U.S. subsidiaries to the extent that dividend payments from such companies are expected to result in additional tax liability. The remaining undistributed earnings (approximately $1.29 billion at December 31, 2006) have been indefinitely reinvested; therefore, no provision has been made for taxes due upon remittance of these earnings. Determination of the amount of unrecognized deferred tax liability on these unremitted earnings is not feasible.
We operate in a number of tax jurisdictions and are subject to examination of our income tax returns by tax authorities in those jurisdictions. Those tax authorities may challenge any item on these tax returns. The tax matters challenged can be complex in nature and uncertain as to their ultimate outcome. We assess the ultimate resolution of these tax matters as they arise and establish reserves for tax contingencies when we believe an unfavorable outcome is likely and the liability can be reasonably estimated. These reserves involve considerable judgment and estimation and are based on the best information available including tax regulations, the outcome of court cases, and other information relevant to the issues raised. Although we believe our reserves for tax contingencies are reasonable, adjustments could be required in the future based on changes in facts and circumstances surrounding these contingencies.
14. Commitments and Contingencies
Italian Grants: Italian government auditors have completed a review, conducted in the ordinary course, of approximately $250 million of grants from the Italian government to TI’s former memory operations in Italy. The Ministry of Industry, which is responsible for reviewing the auditors’ findings, has published final decrees on all projects relating to the grants, resulting in a $28 million favorable settlement in the fourth quarter of 2006. As of December 31, 2006, we have no material obligationsremaining on the grants.

TEXAS INSTRUMENTS 2006 ANNUAL REPORT3636
Venture Capital Commitments: We have investments in certain venture capital funds and have committed to provide additional capital to those funds. As appropriate investments are entered into, the venture capital general partners may draw upon those committed additional funds. As of December 31, 2006, we may be required to provide an additional $32 million when the committed funds are called by the venture capital funds’ general partners.
Leases: We conduct certain operations in leased facilities and also lease a portion of our data processing and other equipment. In addition, certain long-term supply agreements to purchase industrial gases are also accounted for as operating leases. Lease agreements frequently include purchase and renewal provisions and require us to pay taxes, insurance and maintenance costs. Rental and lease expense incurred was $125 million in 2006, $126 million in 2005 and $124 million in 2004.
Software Licenses: We have licenses for certain electronic design automation software that are accounted for in accordance with Statement of Position 98-1. The related liabilities are apportioned between current liabilities (accounts payable) and long-term liabilities (other liabilities) on the balance sheet.
Purchase Commitments: We have certain purchase commitments that are for normal usage, some of which contain provisions for minimum payments.
Summary: At December 31, 2006, we were committed to make the following minimum payments under operating leases, capitalized software licenses and purchase commitments:
OperatingLeases
CapitalizedSoftwareLicenses
PurchaseCommitments
2007 . . . . . . . . . . . . . . . . . . . . . . . . . . . . . . . . . . . . . . . . . . . . . . . . . . . . . . . . . . . . . . . . . . . . . . . . . . . $ 85 $ 33 $ 1172008 . . . . . . . . . . . . . . . . . . . . . . . . . . . . . . . . . . . . . . . . . . . . . . . . . . . . . . . . . . . . . . . . . . . . . . . . . . . 57 21 932009 . . . . . . . . . . . . . . . . . . . . . . . . . . . . . . . . . . . . . . . . . . . . . . . . . . . . . . . . . . . . . . . . . . . . . . . . . . . 44 15 372010 . . . . . . . . . . . . . . . . . . . . . . . . . . . . . . . . . . . . . . . . . . . . . . . . . . . . . . . . . . . . . . . . . . . . . . . . . . . 38 8 52011 . . . . . . . . . . . . . . . . . . . . . . . . . . . . . . . . . . . . . . . . . . . . . . . . . . . . . . . . . . . . . . . . . . . . . . . . . . . 33 — 5Thereafter . . . . . . . . . . . . . . . . . . . . . . . . . . . . . . . . . . . . . . . . . . . . . . . . . . . . . . . . . . . . . . . . . . . . . . 162 — 61
Letters of Credit: At December 31, 2006, we had $63 million of unused documentary letters of credit to enable manufacturers of certain products for the Education Technology segment to receive payment upon shipment to us.
Indemnification Guarantees: We routinely sell products with a limited intellectual property indemnification included in the terms of sale. Historically, we have had only minimal and infrequent losses associated with these indemnities. Consequently, any future liabilities resulting from the intellectual property indemnities cannot reasonably be estimated or accrued.
Warranty Costs/Product Liabilities: We accrue for known product-related claims if a loss is probable and can be reasonably estimated. During the periods presented, there have been no material accruals or payments regarding product warranty or product liability, and historically we have experienced a low rate of payments on product claims. Consistent with general industry practice, we enter formal contracts with certain customers in which the parties define warranty remedies. Typically, our warranty for semiconductor products covers three years, an obligation to repair, replace or refund, and a maximum payment obligation tied to the price paid for our products. In some cases, product claims may be disproportionate to the price of our products.
General: We are subject to various legal and administrative proceedings. Although it is not possible to predict the outcome of these matters, we believe that the results of these proceedings will not have a material adverse effect upon our financial condition, results of operations or liquidity.
Discontinued Operations Indemnity: In connection with the sale of the former Sensors & Controls business, we have agreed to indemnify Sensata for certain specified litigation matters, as well as other liabilities, including environmental liabilities. Our indemnification obligations with respect to breaches of representations and warranties and the specified litigation matters are, generally, subject to a total deductible of $30 million and our maximum potential exposure is limited to $300 million. There were no significant liabilities recorded under these indemnification obligations.

TEXAS INSTRUMENTS 2006 ANNUAL REPORT 3737
15. Supplemental Financial Information
Other Income (Expense) Net:2006 2005 2004
Interest income . . . . . . . . . . . . . . . . . . . . . . . . . . . . . . . . . . . . . . . . . . . . . . . . . . . . . . . . . . . . . . . . . . . . . . . $ 196 $ 165 $ 136Settlement of Italian grants (a) . . . . . . . . . . . . . . . . . . . . . . . . . . . . . . . . . . . . . . . . . . . . . . . . . . . . . . . . . 28 11 54Sales tax refund benefits (b) . . . . . . . . . . . . . . . . . . . . . . . . . . . . . . . . . . . . . . . . . . . . . . . . . . . . . . . . . . . 20 — 19Other (c) . . . . . . . . . . . . . . . . . . . . . . . . . . . . . . . . . . . . . . . . . . . . . . . . . . . . . . . . . . . . . . . . . . . . . . . . . . . . . 21 29 24Total . . . . . . . . . . . . . . . . . . . . . . . . . . . . . . . . . . . . . . . . . . . . . . . . . . . . . . . . . . . . . . . . . . . . . . . . . . . . . . . . . $ 265 $ 205 $ 233
(a) Reflects benefits recognized due to the resolution of matters relating to grants from the government of Italy to our former memory business operations in Italy (see Note 14 for details).
(b) Reflects refunds of overpayments attributable to previously divested businesses and interest on refunds relating to settlements of audits of sales and use taxes paid to the State of Texas.
(c) Includes lease income of approximately $20 million per year, primarily from the purchaser of our former defense electronics business divested in 1997.As of December 31, 2006, the aggregate amount of non-cancellable future lease payments to be received from these leases is $108 million. These leases contain renewal options. Other also includes miscellaneous non-operational items such as gains and losses related to previously divested businesses, interest income and expense related to non-investment items such as taxes, and gains and losses from currency exchange rate changes.
Inventories: DECEMBER 31,
2006 2005
Raw materials and purchased parts . . . . . . . . . . . . . . . . . . . . . . . . . . . . . . . . . . . . . . . . . . . . . . . . . . . . . . . . . . . . . $ 105 $ 83Work in process . . . . . . . . . . . . . . . . . . . . . . . . . . . . . . . . . . . . . . . . . . . . . . . . . . . . . . . . . . . . . . . . . . . . . . . . . . . . . . . 930 813Finished goods . . . . . . . . . . . . . . . . . . . . . . . . . . . . . . . . . . . . . . . . . . . . . . . . . . . . . . . . . . . . . . . . . . . . . . . . . . . . . . . . 402 289Total . . . . . . . . . . . . . . . . . . . . . . . . . . . . . . . . . . . . . . . . . . . . . . . . . . . . . . . . . . . . . . . . . . . . . . . . . . . . . . . . . . . . . . . . . $ 1,437 $ 1,185
Property, Plant and Equipment at Cost: DECEMBER 31,
Depreciable Lives 2006 2005
Land . . . . . . . . . . . . . . . . . . . . . . . . . . . . . . . . . . . . . . . . . . . . . . . . . . . . . . . . . . . . . . . . . . . . . . . . . . . — $ 82 $ 79Buildings and improvements . . . . . . . . . . . . . . . . . . . . . . . . . . . . . . . . . . . . . . . . . . . . . . . . . . . . . . 5-40 years 2,890 2,930Machinery and equipment . . . . . . . . . . . . . . . . . . . . . . . . . . . . . . . . . . . . . . . . . . . . . . . . . . . . . . . . 3-10 years 4,779 5,365Total . . . . . . . . . . . . . . . . . . . . . . . . . . . . . . . . . . . . . . . . . . . . . . . . . . . . . . . . . . . . . . . . . . . . . . . . . . . $ 7,751 $ 8,374
Authorizations for property, plant and equipment expenditures in future years were $341 million at December 31, 2006.

TEXAS INSTRUMENTS 2006 ANNUAL REPORT3838
Accrued Expenses and Other Liabilities: DECEMBER 31,
2006 2005
Accrued salaries, wages and vacation pay . . . . . . . . . . . . . . . . . . . . . . . . . . . . . . . . . . . . . . . . . . . . . . . . . . . . . . $ 368 $ 340Customer incentive programs and allowances . . . . . . . . . . . . . . . . . . . . . . . . . . . . . . . . . . . . . . . . . . . . . . . . . . 188 152Property and other non-income taxes . . . . . . . . . . . . . . . . . . . . . . . . . . . . . . . . . . . . . . . . . . . . . . . . . . . . . . . . . . 126 134Other . . . . . . . . . . . . . . . . . . . . . . . . . . . . . . . . . . . . . . . . . . . . . . . . . . . . . . . . . . . . . . . . . . . . . . . . . . . . . . . . . . . . . . . 347 322Total . . . . . . . . . . . . . . . . . . . . . . . . . . . . . . . . . . . . . . . . . . . . . . . . . . . . . . . . . . . . . . . . . . . . . . . . . . . . . . . . . . . . . . . . $ 1,029 $ 948
Accumulated Other Comprehensive Income: DECEMBER 31,
2006 2005
Unrealized losses on available-for-sale investments . . . . . . . . . . . . . . . . . . . . . . . . . . . . . . . . . . . . . . . . . . . . . . . $ (12) $ (16)Postretirement benefit plans:
Minimum pension liability . . . . . . . . . . . . . . . . . . . . . . . . . . . . . . . . . . . . . . . . . . . . . . . . . . . . . . . . . . . . . . . . . . . . . — (65)Prior service cost . . . . . . . . . . . . . . . . . . . . . . . . . . . . . . . . . . . . . . . . . . . . . . . . . . . . . . . . . . . . . . . . . . . . . . . . . . . . 6 —Net actuarial loss . . . . . . . . . . . . . . . . . . . . . . . . . . . . . . . . . . . . . . . . . . . . . . . . . . . . . . . . . . . . . . . . . . . . . . . . . . . . (357) —
Total . . . . . . . . . . . . . . . . . . . . . . . . . . . . . . . . . . . . . . . . . . . . . . . . . . . . . . . . . . . . . . . . . . . . . . . . . . . . . . . . . . . . . . . . . . $ (363) $ (81)
Cash Payments:2006 2005 2004
Income taxes (net of refunds) . . . . . . . . . . . . . . . . . . . . . . . . . . . . . . . . . . . . . . . . . . . . . . . . . . . . . . . . . . . . . $ 1,830 $ 591 $ 261Interest (net of amounts capitalized) . . . . . . . . . . . . . . . . . . . . . . . . . . . . . . . . . . . . . . . . . . . . . . . . . . . . . . . 7 9 21
16. Subsequent Event
On January 22, 2007, we announced a plan to change the way we develop advanced digital manufacturing processtechnology. Instead of separately creating our own core process technology, we will work collaboratively with our foundry partners to specify and drive the next generations of digital process technology. Additionally, we will stop production at an older digital factory and move its manufacturing equipment into several of our analog factories to support greater analog output. These changes will be made throughout 2007, and when complete are expected to reduce annualized costs by about $200 million. About 500 jobs are expected to be reduced by year end. In total, we will take restructuring charges of approximately $55 million, about evenly distributed across the four quarters of 2007.

TEXAS INSTRUMENTS 2006 ANNUAL REPORT 3939
The Board of DirectorsTexas Instruments Incorporated
We have audited the accompanying consolidated balance sheets of Texas Instruments Incorporated and subsidiaries (the Company) as of December 31, 2006 and 2005, and the related consolidated statements of income, comprehensive income, stockholders’ equity, and cash flows for each of the three years in the period ended December 31, 2006. These financial statements are the responsibility of the Company’s management. Our responsibility is to express an opinion on these financial statements based on our audits.
We conducted our audits in accordance with the standards of the Public Company Accounting Oversight Board (United States). Those standards require that we plan and perform the audit to obtain reasonable assurance about whether the financial statements are free of material misstatement. An audit includes examining, on a test basis, evidence supporting the amounts and disclosures in the financial statements. An audit also includes assessing the accounting principles used and significant estimates made by management, as well as evaluating the overall financial statement presentation. We believe that our audits provide a reasonable basis for our opinion.
In our opinion, the financial statements referred to above present fairly, in all material respects, the consolidated financial position of Texas Instruments Incorporated and subsidiaries at December 31, 2006 and 2005, and the consolidated results of their operations and their cash flows for each of the three years in the period ended December 31, 2006, in conformity with U.S. generally accepted accounting principles.
As discussed in Note 1 to the consolidated financial statements, the Company changed its method of accounting for stock-based compensation, depreciation, and postretirement benefits effective July 1, 2005, January 1, 2006, and December 31, 2006, respectively.
We have also audited, in accordance with the standards of the Public Company Accounting Oversight Board (United States), the effectiveness of the Company’s internal control over financial reporting as of December 31, 2006, based on criteria established in Internal Control – Integrated Framework issued by the Committee of Sponsoring Organizations of the Treadway Commission and our report dated February 23, 2007, expressed an unqualified opinion thereon.
Dallas, TexasFebruary 23, 2007
REPORT OF INDEPENDENT REGISTERED PUBLIC ACCOUNTING FIRM

TEXAS INSTRUMENTS 2006 ANNUAL REPORT4040
The management of TI is responsible for establishing and maintaining adequate internal control over financial reporting. TI’s internal control system was designed to provide reasonable assurance to our management and board of directors regarding the reliability of financial reporting and the preparation and fair presentation of financial statements issued for external purposes in accordance with generally accepted accounting principles.
All internal control systems, no matter how well designed, have inherent limitations and may not prevent or detect misstatements. Therefore, even those systems determined to be effective can only provide reasonable assurance with respect to financial reporting reliability and financial statement preparation and presentation.
TI management assessed the effectiveness of internal control over financial reporting as of December 31, 2006. In making this assessment, we used the criteria set forth by the Committee of Sponsoring Organizations of the Treadway Commission (the COSO criteria) in Internal Control – Integrated Framework. Based on our assessment, we believe that, as of December 31, 2006, our internal control over financial reporting is effective based on the COSO criteria.
TI’s independent registered public accounting firm, Ernst & Young LLP, has issued an audit report on our assessment of internal control over financial reporting, which immediately follows this report.
REPORT BY MANAGEMENT ON INTERNAL CONTROL OVER FINANCIAL REPORTING

TEXAS INSTRUMENTS 2006 ANNUAL REPORT 4141
The Board of DirectorsTexas Instruments Incorporated
We have audited management’s assessment, included in the accompanying Report by Management on Internal Control over Financial Reporting, that Texas Instruments Incorporated and subsidiaries maintained effective internal control over financial reporting as of December 31, 2006, based on criteria established in Internal Control – Integrated Framework issued by the Committee of Sponsoring Organizations of the Treadway Commission (the COSO criteria). Texas Instruments Incorporated’s management is responsible for maintaining effective internal control over financial reporting and for its assessment of the effectiveness of internal control over financial reporting. Our responsibility is to express an opinion on management’s assessment and an opinion on the effectiveness of the company’s internal control over financial reporting based on our audit.
We conducted our audit in accordance with the standards of the Public Company Accounting Oversight Board (United States).Those standards require that we plan and perform the audit to obtain reasonable assurance about whether effective internal control over financial reporting was maintained in all material respects. Our audit included obtaining an understanding of internal control over financial reporting, evaluating management’s assessment, testing and evaluating the design and operating effectiveness of internal control, and performing such other procedures as we considered necessary in the circumstances. We believe that our audit provides a reasonable basis for our opinion.
A company’s internal control over financial reporting is a process designed to provide reasonable assurance regarding the reliability of financial reporting and the preparation of financial statements for external purposes in accordance with generally accepted accounting principles. A company’s internal control over financial reporting includes those policies and procedures that (1) pertain to the maintenance of records that, in reasonable detail, accurately and fairly reflect the transactions and dispositions of the assets of the company; (2) provide reasonable assurance that transactions are recorded as necessary to permit preparation of financial statements in accordance with generally accepted accounting principles, and that receipts and expenditures of the company are being made only in accordance with authorizations of management and directors of the company; and (3) provide reasonable assurance regarding prevention or timely detection of unauthorized acquisition, use, or disposition of the company’s assets that could have a material effect on the financial statements.
Because of its inherent limitations, internal control over financial reporting may not prevent or detect misstatements. Also, projections of any evaluation of effectiveness to future periods are subject to the risk that controls may become inadequate because of changes in conditions, or that the degree of compliance with the policies or procedures may deteriorate.
In our opinion, management’s assessment that Texas Instruments Incorporated maintained effective internal control over financial reporting as of December 31, 2006, is fairly stated, in all material respects, based on the COSO criteria. Also, in our opinion, Texas Instruments Incorporated maintained, in all material respects, effective internal control over financial reporting as of December 31, 2006, based on the COSO criteria.
We also have audited, in accordance with the standards of the Public Company Accounting Oversight Board (United States), the consolidated balance sheets of Texas Instruments Incorporated and subsidiaries as of December 31, 2006 and 2005, and the related consolidated statements of income, comprehensive income, stockholders’ equity, and cash flows for each of the three years in the period ended December 31, 2006, of Texas Instruments Incorporated and our report dated February 23, 2007, expressed an unqualified opinion thereon.
Dallas, TexasFebruary 23, 2007
REPORT OF INDEPENDENT REGISTERED PUBLIC ACCOUNTING FIRM ON INTERNAL CONTROL OVER FINANCIAL REPORTING

SUMMARY OF SELECTED FINANCIAL DATA(Millions of dollars, except share and per-share amounts)
TEXAS INSTRUMENTS 2006 ANNUAL REPORT42
Years Ended December 31, 2006 2005 2004 2003 2002
Net revenue. . . . . . . . . . . . . . . . . . . . . . . . . . . . . . . . . . $ 14,255 $ 12,335 $ 11,552 $ 8,911 $ 7,509Operating costs and expenses . . . . . . . . . . . . . . . . . 10,888 9,776 9,592 8,146 7,409Profit from operations . . . . . . . . . . . . . . . . . . . . . . . . . 3,367 2,559 1,960 765 100Other income (expense) net . . . . . . . . . . . . . . . . . . . 265 205 233 324 (576)Interest expense on loans . . . . . . . . . . . . . . . . . . . . . 7 9 21 39 57Income (loss) from continuing operations
before income taxes . . . . . . . . . . . . . . . . . . . . . . . . 3,625 2,755 2,172 1,050 (533)Provision (benefit) for income taxes . . . . . . . . . . . . 987 582 481 (15) (58)Income (loss) from continuing operations . . . . . . . 2,638 2,173 1,691 1,065 (475)Income from discontinued operations,
net of income taxes . . . . . . . . . . . . . . . . . . . . . . . . . 1,703 151 170 133 131Net income (loss) . . . . . . . . . . . . . . . . . . . . . . . . . . . . $ 4,341 $ 2,324 $ 1,861 $ 1,198 $ (344)Basic income (loss) from continuing operations
per common share . . . . . . . . . . . . . . . . . . . . . . . . . . $ 1.73 $ 1.33 $ 0.98 $ 0.62 $ (0.27)Diluted income (loss) from continuing operations
per common share . . . . . . . . . . . . . . . . . . . . . . . . . . $ 1.69 $ 1.30 $ 0.96 $ 0.60 $ (0.27)Dividends declared per common share . . . . . . . . . . $ 0.130 $ 0.105 $ 0.089 $ 0.085 $ 0.085Average common and dilutive potential common
shares outstanding, in thousands(a) . . . . . . . . . . 1,559,772 1,670,916 1,768,073 1,766,400 1,733,343
(a) For the year ended December 31, 2002, dilutive potential common shares outstanding have been excluded due to the net loss for this period.
December 31, 2006 2005 2004 2003 2002
Working capital . . . . . . . . . . . . . . . . . . . . . . . . . . . . . . . . . . . . . . . $ 5,776 $ 7,035 $ 8,373 $ 5,626 $ 4,344Property, plant and equipment, net . . . . . . . . . . . . . . . . . . . . . . 3,950 3,730 3,794 3,998 4,663Total assets . . . . . . . . . . . . . . . . . . . . . . . . . . . . . . . . . . . . . . . . . . . 13,930 15,063 16,299 15,510 14,679Long-term debt . . . . . . . . . . . . . . . . . . . . . . . . . . . . . . . . . . . . . . . . — 329 368 395 833Stockholders’ equity . . . . . . . . . . . . . . . . . . . . . . . . . . . . . . . . . . . 11,360 11,937 13,063 11,864 10,734Employees . . . . . . . . . . . . . . . . . . . . . . . . . . . . . . . . . . . . . . . . . . . . 30,986 30,068 30,446 29,083 29,243Stockholders of record . . . . . . . . . . . . . . . . . . . . . . . . . . . . . . . . . 27,976 29,848 27,496 28,058 26,884
See Notes to Financial Statements and Management’s Discussion and Analysis of Financial Condition and Results of Operations.

TEXAS INSTRUMENTS 2006 ANNUAL REPORT 4343
MANAGEMENT’S DISCUSSION AND ANALYSIS OF FINANCIAL CONDITION AND RESULTS OF OPERATIONS
The following should be read in conjunction with the Financial Statements and the related Notes that appear elsewhere in this document. All dollar amounts in the tables in this discussion are stated in millions of U.S. dollars, except per-share amounts.
The former Sensors & Controls business has been reflected as discontinued operations (see Note 2 to the Financial Statements for additional information). The radio frequency identification (RFID) systems operations that had been part of the Sensors & Controls segment are included in the Semiconductor segment. All amounts in this discussion reference continuing operations unless otherwise noted.
The Educational & Productivity Solutions segment has been renamed Education Technology to more accurately reflect the strategic focus of this business (see Note 12 to the Financial Statements for additional information).
Overview
Texas Instruments makes, markets and sells high-technology components; more than 50,000 customers all over the world buy our products. We have two separate segments: Semiconductor and Education Technology. Semiconductor is by far the larger of these segments. It accounted for 96 percent of our revenue in 2006, and historically it averages a higher growth rate than Education Technology, although the semiconductor market is characterized by wide swings in growth rates from year to year. We were the world’s third-largest semiconductor company in 2006 as measured by revenue, according to preliminary estimates from iSuppli Corporation, an industry analyst.
In our Semiconductor segment, we focus primarily on technologies that make it possible for a variety of consumer and industrial electronic equipment to process both analog and digital signals in real time. These technologies are known as analog semiconductors and digital signal processors, or DSPs, and together they account for about three-fourths of our Semiconductor revenue. Almost all of today’s digital electronic equipment requires some form of analog or digital signal processing.
Analog semiconductors process “real world” inputs, such as sound, temperature, pressure and visual images, conditioning them, amplifying them and converting them into digital signals. They also assist in the management of power distribution and consumption, aspects critical to today’s portable electronic devices. Generally, analog products require less capital-intensive factories to manufacture than digital products.
Our analog semiconductors consist of custom products and standard products. Custom products are designed for specific applications for specific customers. Standard products include application-specific standard products (designed for a specific application and usable by multiple customers) and high-performance standard catalog products (usable in multiple applications by multiple customers). These standard products are characterized by differentiated features and specifications, as well as relatively high gross margins. Standard analog products tend to have long life spans. Many custom and standard products are proprietary and difficult for competitors to imitate. Analog products also include commodity products, which are sold in high volume and into a broad range of applications, and generally are differentiated by price and availability. We are the world’s largest supplier of analog semiconductors.
DSPs use complex algorithms and compression techniques to alter and improve a data stream. These products are ideal for applications that require precise, real-time processing of real-world signals that have been converted into digital form. Their power efficiency is important for battery-powered devices.
Our DSP portfolio includes custom, application-specific and standard products. Custom products are designed for specific customers with very high volumes in established markets. Application-specific products are implementations crafted for specific applications like wireless infrastructure, VoIP (Voice over Internet Protocol) gateways, digital still cameras and residential gateways, to name a few. Our standard DSP products are sold into a broad range of applications and seed the next generation of signal-processing innovation. We are the world’s largest supplier of DSPs.
We expect that our inventory levels generally will increase from historical levels in order to meet the requirements of our customers. For example, the analog market consists of a very broad base of customers that order relatively small quantities of many different analog products. These customers typically expect very short order lead times, requiring us to maintain more on-hand inventory. Also, analog suppliers typically hold a broader range of inventory in order to serve their customers, while manufacturing in efficient quantities. Analog products will be a growing portion of our inventory as our analog business

TEXAS INSTRUMENTS 2006 ANNUAL REPORT4444
continues to grow and broaden its product portfolio. Additionally, our large customers are moving increasingly toward a business model that requires us to maintain inventory on a consignment basis on their behalf.
We own and operate semiconductor manufacturing sites in the Americas, Japan, Europe and Asia. Our facilities require substantial investment to construct and are largely fixed-cost assets once in operation. Because we own most of our manufacturing capacity, a significant portion of our operating costs is fixed. In general, these costs do not decline with reductions in customer demand or our utilization of our manufacturing capacity, and can adversely affect profit margins as a result. Conversely, as product demand rises and factory utilization increases, the fixed costs are spread over increased output, which should improve profit margins.
As part of our manufacturing strategy, we outsource a portion of our product manufacturing to outside suppliers (foundries and assembly/test subcontractors), which reduces both the amount of capital expenditures and subsequent depreciation required to meet customer demands and fluctuations in profit margins. Outside foundries provided about 25 percent of our total wafers produced in 2006. (A wafer is a thin slice of silicon on which an array of semiconductor devices has been fabricated.)
The semiconductor market is characterized by constant and typically incremental innovation in product design and manufacturing technologies. We make significant investments in research and development (R&D). Typically, products resulting from our R&D investments in the current period do not contribute materially to revenue in that period, but should benefit us in future years. In general, new semiconductor products are shipped in limited quantities initially and will then ramp into high volumes over time. Prices and manufacturing costs tend to decline over time.
We strive to keep improving performance. One way will be by changing how we develop advanced digital manufacturingprocess technology. Instead of separately creating our own process technology, we will work collaboratively with our foundry suppliers to specify and drive the next generations of digital process technology, and we will continue making products on these processes in our world-class factories. We expect that our 32-nanometer manufacturing process will be the first process technology developed entirely through this new collaboration. This is a natural extension of our existing relationships with foundries that will increase our R&D efficiency and our capital efficiency while maintaining our responsiveness to customers. Additionally, we will stop production at an older digital factory and move its manufacturing equipment into several of our analog factories to support greater analog output.
These changes will be made throughout 2007, and when complete are expected to reduce costs by about $200 million annually. As a result of these actions, about 500 jobs are expected to be reduced by year end. In total, we expect to incur restructuring charges of approximately $55 million, about evenly distributed across the four quarters of 2007.
Our Education Technology segment is a leading supplier of graphing handheld calculators. It also provides our customers with business and scientific calculators and a wide range of advanced classroom tools and professional development that enables students and teachers to explore math and science interactively. Our products are marketed primarily through retailers and to schools through instructional dealers. This business segment represented 4 percent of our revenue in 2006.Prices of Education Technology products tend to be stable.
In the third quarter of 2005, we implemented the Financial Accounting Standards Board’s (FASB) Statement of Financial Accounting Standard (SFAS) No. 123(R), “Share-Based Payments.” The financial results of 2006 and 2005 include the effects of adopting this new accounting rule for stock options effective July 1, 2005. Before July 1, 2005, our financial results include the expense of restricted stock units, but not stock options. As a result our 2006 and 2005 financial results are not fully comparable to our prior financial results or to each other. For 2006, the total stock-based compensation expense was $332 million, or 2.3 percent of revenue, compared with $175 million, or 1.4 percent of revenue in 2005. Stock-based compensation expense has been included in the applicable income statement lines but has not been allocated between segments. Rather it is reflected in Corporate (see Note 1 to the Financial Statements for additional discussion of the impact of adopting SFAS 123(R)).
Included in Note 1 to the Financial Statements, under Prior Period Pro Forma Presentations, is a table that reflects what our financial results would have been if our stock-based compensation had been accounted for under the fair value method in periods prior to the adoption of SFAS 123(R).
As a result of a study of the pattern of usage of long-lived depreciable assets, effective January 1, 2006, we adopted the straight-line method of depreciation for all property, plant and equipment on a prospective basis as allowed for under SFAS No. 154, “Accounting Changes and Error Corrections, a replacement of APB Opinion No. 20 and FASB Statement No. 3.” The change in depreciation method for the year ended December 31, 2006, reduced depreciation expense by $156 million (see Financial Condition below and Note 1 to the Financial Statements for additional information).
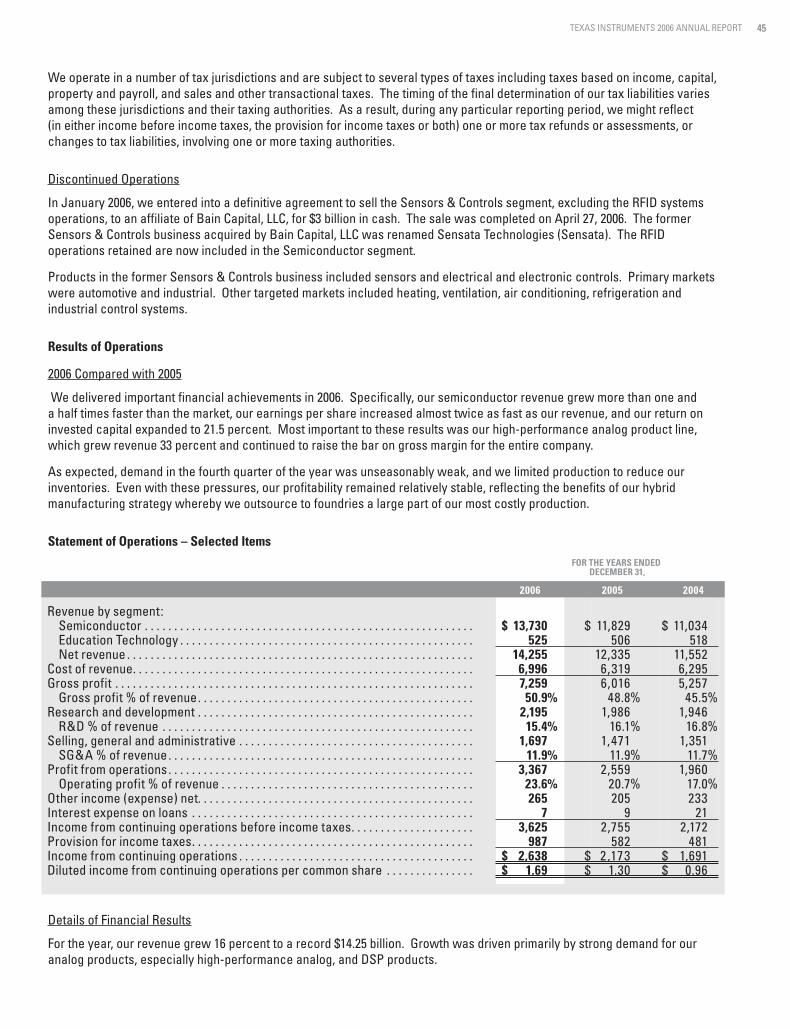
TEXAS INSTRUMENTS 2006 ANNUAL REPORT 4545
We operate in a number of tax jurisdictions and are subject to several types of taxes including taxes based on income, capital, property and payroll, and sales and other transactional taxes. The timing of the final determination of our tax liabilities varies among these jurisdictions and their taxing authorities. As a result, during any particular reporting period, we might reflect (in either income before income taxes, the provision for income taxes or both) one or more tax refunds or assessments, or changes to tax liabilities, involving one or more taxing authorities.
Discontinued Operations
In January 2006, we entered into a definitive agreement to sell the Sensors & Controls segment, excluding the RFID systems operations, to an affiliate of Bain Capital, LLC, for $3 billion in cash. The sale was completed on April 27, 2006. The former Sensors & Controls business acquired by Bain Capital, LLC was renamed Sensata Technologies (Sensata). The RFID operations retained are now included in the Semiconductor segment.
Products in the former Sensors & Controls business included sensors and electrical and electronic controls. Primary markets were automotive and industrial. Other targeted markets included heating, ventilation, air conditioning, refrigeration and industrial control systems.
Results of Operations
2006 Compared with 2005
We delivered important financial achievements in 2006. Specifically, our semiconductor revenue grew more than one and a half times faster than the market, our earnings per share increased almost twice as fast as our revenue, and our return on invested capital expanded to 21.5 percent. Most important to these results was our high-performance analog product line, which grew revenue 33 percent and continued to raise the bar on gross margin for the entire company.
As expected, demand in the fourth quarter of the year was unseasonably weak, and we limited production to reduce our inventories. Even with these pressures, our profitability remained relatively stable, reflecting the benefits of our hybrid manufacturing strategy whereby we outsource to foundries a large part of our most costly production.
Statement of Operations – Selected ItemsFOR THE YEARS ENDED
DECEMBER 31,
2006 2005 2004
Revenue by segment:Semiconductor . . . . . . . . . . . . . . . . . . . . . . . . . . . . . . . . . . . . . . . . . . . . . . . . . . . . . . . . $ 13,730 $ 11,829 $ 11,034Education Technology . . . . . . . . . . . . . . . . . . . . . . . . . . . . . . . . . . . . . . . . . . . . . . . . . . 525 506 518Net revenue . . . . . . . . . . . . . . . . . . . . . . . . . . . . . . . . . . . . . . . . . . . . . . . . . . . . . . . . . . . 14,255 12,335 11,552
Cost of revenue. . . . . . . . . . . . . . . . . . . . . . . . . . . . . . . . . . . . . . . . . . . . . . . . . . . . . . . . . . 6,996 6,319 6,295Gross profit . . . . . . . . . . . . . . . . . . . . . . . . . . . . . . . . . . . . . . . . . . . . . . . . . . . . . . . . . . . . . 7,259 6,016 5,257
Gross profit % of revenue. . . . . . . . . . . . . . . . . . . . . . . . . . . . . . . . . . . . . . . . . . . . . . . 50.9% 48.8% 45.5%Research and development . . . . . . . . . . . . . . . . . . . . . . . . . . . . . . . . . . . . . . . . . . . . . . . 2,195 1,986 1,946
R&D % of revenue . . . . . . . . . . . . . . . . . . . . . . . . . . . . . . . . . . . . . . . . . . . . . . . . . . . . . 15.4% 16.1% 16.8%Selling, general and administrative . . . . . . . . . . . . . . . . . . . . . . . . . . . . . . . . . . . . . . . . 1,697 1,471 1,351
SG&A % of revenue. . . . . . . . . . . . . . . . . . . . . . . . . . . . . . . . . . . . . . . . . . . . . . . . . . . . 11.9% 11.9% 11.7%Profit from operations . . . . . . . . . . . . . . . . . . . . . . . . . . . . . . . . . . . . . . . . . . . . . . . . . . . . 3,367 2,559 1,960
Operating profit % of revenue . . . . . . . . . . . . . . . . . . . . . . . . . . . . . . . . . . . . . . . . . . . 23.6% 20.7% 17.0%Other income (expense) net. . . . . . . . . . . . . . . . . . . . . . . . . . . . . . . . . . . . . . . . . . . . . . . 265 205 233Interest expense on loans . . . . . . . . . . . . . . . . . . . . . . . . . . . . . . . . . . . . . . . . . . . . . . . . 7 9 21Income from continuing operations before income taxes. . . . . . . . . . . . . . . . . . . . . 3,625 2,755 2,172Provision for income taxes. . . . . . . . . . . . . . . . . . . . . . . . . . . . . . . . . . . . . . . . . . . . . . . . 987 582 481Income from continuing operations . . . . . . . . . . . . . . . . . . . . . . . . . . . . . . . . . . . . . . . . $ 2,638 $ 2,173 $ 1,691Diluted income from continuing operations per common share . . . . . . . . . . . . . . . $ 1.69 $ 1.30 $ 0.96
Details of Financial Results
For the year, our revenue grew 16 percent to a record $14.25 billion. Growth was driven primarily by strong demand for our analog products, especially high-performance analog, and DSP products.

TEXAS INSTRUMENTS 2006 ANNUAL REPORT4646
Earnings per share (EPS) from continuing operations of $1.69 increased 30 percent from the prior year. EPS in 2006 included a full year of stock-option expense of $0.14 resulting in $0.07 of additional expense compared with the prior year when stock-option expense was included for only six months.
Gross profit for 2006 was $7.26 billion, or a record 50.9 percent of revenue. This was an increase of $1.24 billion, or 21 percent, from the prior year due primarily to higher revenue and, to a lesser extent, lower depreciation in the Semiconductor segment.Stock-based compensation expense in cost of revenue increased $32 million from the prior year.
R&D expense of $2.20 billion, or 15.4 percent of revenue, increased $209 million from the prior year due to higher investment in new semiconductor technology, particularly for wireless applications, and $48 million of additional stock-based compensation expense.
Selling, general and administrative (SG&A) expense of $1.70 billion, or 11.9 percent of revenue, increased $226 million from the prior year primarily due to the combination of higher marketing expense in the Semiconductor segment, particularly for DLP® product advertising, and $77 million of higher stock-based compensation expense.
Operating profit for the year was $3.37 billion, or a record 23.6 percent of revenue. This was an increase of $808 million, or 32 percent, due to higher gross profit in the Semiconductor segment.
For the year, other income (expense) net (OI&E) of $265 million increased $60 million from 2005 primarily due to higher interest income. Interest income was $196 million in 2006, an increase of $31 million from the prior year, due to higher average interest rates earned on investments. Also contributing to the higher OI&E were $20 million of benefits in 2006 from a refund of state sales tax and $17 million of higher income in 2006 than in 2005 from final settlement of matters related to grants from the Italian government regarding our former memory operations.
The effective tax rate for continuing operations, which by definition does not include the effect of discrete tax items, was 27 percent for 2006 compared with 24 percent for 2005. The increase in the effective tax rate from the year-ago period is due to, in decreasing order, higher income from continuing operations before income taxes and the effect of non-U.S. tax rates (see Note 13 to the Financial Statements for a reconciliation of tax rates to the statutory federal tax rate).
The tax provision for continuing operations for 2006 contained net discrete tax expense items of $14 million. The provision for income taxes for 2005 contained net discrete tax benefit items of $92 million, primarily due to favorable developments on certain outstanding income tax matters. This was partially offset by an accrual for taxes on dividends from earnings that were repatriated from our non-U.S. subsidiaries under the American Jobs Creation Act of 2004 (AJCA).
For the year, income from continuing operations was $2.64 billion, or $1.69 per share, compared with $2.17 billion, or $1.30 per share in 2005. Net income was $4.34 billion, or $2.78 per share. This includes $1.09 per share from discontinued operations, almost all of which was from the gain on the sale of our former Sensors & Controls business. Earnings per share for 2006 were based on 111 million, or 7 percent, fewer average shares outstanding, the result of our stock repurchase program.
For the year, our orders were $14.02 billion. This was an increase of $1.17 billion from 2005 primarily due to higher demand for our analog products.
Semiconductor Segment
Statement of Operations – SemiconductorFOR THE YEARS ENDED
DECEMBER 31,
2006 2005
Net revenue. . . . . . . . . . . . . . . . . . . . . . . . . . . . . . . . . . . . . . . . . . . . . . . . . . . . . . . . . . . . . . . . . . . . . . . . . . . $ 13,730 $ 11,829Cost of revenue. . . . . . . . . . . . . . . . . . . . . . . . . . . . . . . . . . . . . . . . . . . . . . . . . . . . . . . . . . . . . . . . . . . . . . . . 6,681 6,056Gross profit . . . . . . . . . . . . . . . . . . . . . . . . . . . . . . . . . . . . . . . . . . . . . . . . . . . . . . . . . . . . . . . . . . . . . . . . . . . 7,049 5,773
Gross profit % of revenue. . . . . . . . . . . . . . . . . . . . . . . . . . . . . . . . . . . . . . . . . . . . . . . . . . . . . . . . . . . . . 51.3% 48.8%Profit from operations. . . . . . . . . . . . . . . . . . . . . . . . . . . . . . . . . . . . . . . . . . . . . . . . . . . . . . . . . . . . . . . . . . 3,831 2,808
Operating profit % of revenue . . . . . . . . . . . . . . . . . . . . . . . . . . . . . . . . . . . . . . . . . . . . . . . . . . . . . . . . . 27.9% 23.7%
Semiconductor revenue in 2006 of $13.73 billion increased 16 percent from 2005 primarily due to increased product shipments resulting from higher demand for both analog, especially high-performance analog, and, to a lesser extent, DSP.

TEXAS INSTRUMENTS 2006 ANNUAL REPORT 4747
For the year, analog revenue increased 18 percent primarily due to increased shipments resulting from higher demand for high-performance analog products. Revenue from high-performance analog products increased 33 percent primarily due to market-share gains. In 2006, about 40 percent of total Semiconductor revenue came from analog.
In 2006, DSP revenue increased 16 percent due to increased shipments resulting from higher demand for wireless products.About 40 percent of total Semiconductor revenue in 2006 came from DSP.
Our 2006 remaining Semiconductor revenue increased 14 percent as increased shipments resulting from growth in demand for standard logic products, DLP products, reduced instruction set computing (RISC) microprocessors (designed to provide very fast computing, typically for a specialized application such as servers) and microcontrollers (a microprocessor designed to control a very specific task for electronic equipment) more than offset a decline in royalties.
During 2006, we signed new patent license agreements to replace agreements that had previously expired. In total, royalties in 2006 decreased by $87 million from 2005 due to the expiration of older agreements. With the signing of the new agreements, we expect royalties to range from about $80-90 million per quarter in 2007.
On an end-equipment basis, revenue from wireless products in 2006 was up 16 percent from 2005 as 3G handset revenue grew about 50 percent from 2005 and sales to the low-priced handset market increased.
In DLP products, revenue increased 15 percent from 2005 primarily due to higher demand resulting in increased shipments of products for front projectors and, to a lesser extent, products for cinema projectors and HDTVs.
In total, we estimate that our 2006 Semiconductor product revenue came from the following broad markets: communications (including wireless and broadband communications) was about 50 percent; computing (including peripherals and computers) was about 25 percent; consumer electronics was about 10 percent; industrial was less than 10 percent; and automotive was about 5 percent.
Gross profit in 2006 was $7.05 billion, or 51.3 percent of revenue. This was an increase of $1.28 billion, or 22 percent, from 2005 primarily due to higher revenue and, to a lesser extent, lower depreciation.
Operating profit in 2006 was $3.83 billion, or a record 27.9 percent of revenue. This was an increase of $1.02 billion from 2005 due to higher gross profit.
For the year, Semiconductor orders were $13.49 billion. This was an increase of 9 percent due to higher demand for analog products.
Education Technology Segment
Statement of Operations – Education TechnologyFOR THE YEARS ENDED
DECEMBER 31,
2006 2005
Net revenue. . . . . . . . . . . . . . . . . . . . . . . . . . . . . . . . . . . . . . . . . . . . . . . . . . . . . . . . . . . . . . . . . . . . . . . . . . . . . . $ 525 $ 506 Cost of revenue. . . . . . . . . . . . . . . . . . . . . . . . . . . . . . . . . . . . . . . . . . . . . . . . . . . . . . . . . . . . . . . . . . . . . . . . . . . 204 206 Gross profit . . . . . . . . . . . . . . . . . . . . . . . . . . . . . . . . . . . . . . . . . . . . . . . . . . . . . . . . . . . . . . . . . . . . . . . . . . . . . . 321 300
Gross profit % of revenue. . . . . . . . . . . . . . . . . . . . . . . . . . . . . . . . . . . . . . . . . . . . . . . . . . . . . . . . . . . . . . . . 61.1% 59.2%Profit from operations. . . . . . . . . . . . . . . . . . . . . . . . . . . . . . . . . . . . . . . . . . . . . . . . . . . . . . . . . . . . . . . . . . . . . 200 188
Operating profit % of revenue . . . . . . . . . . . . . . . . . . . . . . . . . . . . . . . . . . . . . . . . . . . . . . . . . . . . . . . . . . . . 38.0% 37.2%
For the year, Education Technology revenue was $525 million. This was a 4 percent increase from 2005 due to increased shipments resulting from higher demand for graphing calculators.
Gross profit in 2006 of $321 million, or a record 61.1 percent of revenue, increased $21 million from 2005 due to higher revenue, and, to a lesser extent, product cost reductions.
Operating profit in 2006 was $200 million, or a record 38.0 percent of revenue. This was an increase of $12 million from 2005 due to higher gross profit.

TEXAS INSTRUMENTS 2006 ANNUAL REPORT4848
Discontinued Operations
Revenue from the former Sensors & Controls business was $375 million in 2006 compared with $1.06 billion in 2005. Results for 2006 cover the period up to the date of the sale (April 27, 2006). Income from discontinued operations for 2006, which includes the $1.67 billion gain from the sale of the former Sensors & Controls business, was $1.70 billion, compared with $151 million in 2005 (see Note 2 to the Financial Statements for further discussion).
Prior Results of Operations
2005 Compared with 2004
2005 was our 75th year in operation, and as we crossed that milestone we delivered record annual results for revenue, operating profit, operating margin and operating cash flow. We also gained market share in our core semiconductor technologies of DSP and analog for the fourth consecutive year.
Details of Financial Results
For the year, our revenue reached $12.33 billion, an increase of 7 percent. We also set a new high for operating margin of 20.7 percent.
Diluted income from continuing operations per share was $1.30 for the year and includes stock-based compensation expense of $0.07 for the year.
Gross profit of $6.02 billion, or 48.8 percent of revenue, increased 14 percent from 2004 primarily due to higher gross margin in our Semiconductor business segment. Stock-based compensation expense included in cost of revenue was $32 million in 2005 compared with zero in 2004.
R&D expense of $1.99 billion, or 16.1 percent of revenue, increased $40 million, or 2 percent from 2004, primarily due to stock-based compensation expense, which was $53 million in 2005 compared with zero in 2004.
SG&A expense of $1.47 billion, or 11.9 percent of revenue, increased 9 percent primarily due to higher stock-based compensation and, to a lesser extent, expenses for DLP product advertising. Stock-based compensation expense included in SG&A was $90 million in 2005 compared with $18 million in 2004.
Operating profit for the year was a record $2.56 billion. Operating margin was also a record at 20.7 percent of revenue, increasing 31 percent from 2004 due to higher operating margin in Semiconductor. Total stock-based compensation expense for 2005 was $175 million, or 1.4 percent of revenue, compared with $18 million in 2004.
Profit sharing expense in 2005 was $115 million compared with $243 million in 2004. Beginning in 2005, expenses under the TI employee profit sharing plan were determined using a different formula than was used in 2004 (see Note 11 to the Financial Statements for a description of the new calculation). We accrue profit sharing based on how we expect to perform for the year in total. The accrual in a given quarter is based on our expectations at that time as to annual performance. The profit sharing accrual is included in cost of revenue, R&D expense, and SG&A expense. As a result of the change in our profit sharing formula we expect profit sharing expenses to be more stable over time.
OI&E decreased $28 million in 2005 to $205 million. Interest income was $165 million, an increase of $29 million, due to higher average interest rates earned on short-term investments. This was offset by lower income in 2005 than in 2004 from settlements related to grants from the Italian government regarding our former memory business operations, and the 2004 favorable settlement with the State of Texas over claims for refund of state sales taxes relating to our former defense electronics business.
In 2005, we recognized net discrete tax items of $92 million, consisting of $147 million primarily associated with favorable developments on certain outstanding income tax matters, partially offset by a $55 million accrual for taxes on dividends from earnings repatriated from our non-U.S. subsidiaries under the AJCA. The effective tax rate for 2005, which, by definition, does not include discrete tax items, was 24 percent. This compares with the effective tax rate in 2004 of 22 percent. This difference was primarily due to an increase in income from continuing operations before income taxes in 2005. The effective tax rate for 2005 of 24 percent differs from the 35 percent corporate statutory rate due to the effect of non-U.S. tax rates and, to a lesser extent, various tax benefits such as for export sales and research activities.

TEXAS INSTRUMENTS 2006 ANNUAL REPORT 4949
Including the effect of the discrete tax items recognized during 2005, the overall tax rate was 21 percent compared with 22 percent in 2004. The lower tax rate in 2005 was the result of the discrete tax items recognized during the year, partially offset by the impact of the increase in income before income taxes.
For the year, income from continuing operations was $2.17 billion, or $1.30 per share, an increase of 29 percent compared with 2004 income from continuing operations of $1.69 billion, or $0.96 per share.
For the year, net income, which includes income from continuing operations and discontinued operations, was $2.32 billion, or $1.39 per share, an increase of 25 percent compared with 2004 net income of $1.86 billion, or $1.05 per share. Earnings per share growth of 32 percent in 2005 exceeded net income growth, reflecting a net decline of about 100 million shares in the average diluted shares outstanding primarily resulting from our stock repurchase program.
For the year, our orders of $12.84 billion increased 13 percent as demand grew for our Semiconductor products.Semiconductor orders increased 13 percent to $12.34 billion due to broad-based demand for our DSP and analog products.
Semiconductor Segment
Statement of Operations – SemiconductorFOR THE YEARS ENDED
DECEMBER 31,
2005 2004
Net revenue. . . . . . . . . . . . . . . . . . . . . . . . . . . . . . . . . . . . . . . . . . . . . . . . . . . . . . . . . . . . . . . . . . . . . . . . . . $ 11,829 $ 11,034Cost of revenue. . . . . . . . . . . . . . . . . . . . . . . . . . . . . . . . . . . . . . . . . . . . . . . . . . . . . . . . . . . . . . . . . . . . . . . 6,056 6,026Gross profit . . . . . . . . . . . . . . . . . . . . . . . . . . . . . . . . . . . . . . . . . . . . . . . . . . . . . . . . . . . . . . . . . . . . . . . . . . 5,773 5,008
Gross profit % of revenue. . . . . . . . . . . . . . . . . . . . . . . . . . . . . . . . . . . . . . . . . . . . . . . . . . . . . . . . . . . . 48.8% 45.4%Profit from operations . . . . . . . . . . . . . . . . . . . . . . . . . . . . . . . . . . . . . . . . . . . . . . . . . . . . . . . . . . . . . . . . . 2,808 2,068
Operating profit % of revenue . . . . . . . . . . . . . . . . . . . . . . . . . . . . . . . . . . . . . . . . . . . . . . . . . . . . . . . . 23.7% 18.7%
Semiconductor revenue in 2005 of $11.83 billion increased 7 percent from 2004 primarily due to increased shipments resulting from higher demand for wireless products and, to a lesser extent, increased shipments from higher demand for high-performance analog products.
For the year, wireless revenue grew 14 percent, with success in both the fast-growing 3G WCDMA (Wideband Code-Division Multiple Access) market, and in supplying chips to the rapidly growing emerging market for low-price cell phones.Industry shipments of WCDMA cell phones doubled in 2005. In 2005, about 55 percent of our 3G revenue came from sales of OMAP™ application processors and about 45 percent from sales of digital baseband modems. (OMAP processors are high-performance processors that enable multimedia applications in cell phones and other electronic devices.)
For the year, high-performance analog revenue grew 13 percent, reflecting the combination of four consecutive quarters of solid growth and the inventory correction that was underway at our distributors at the end of 2004. We exited 2005 with distribution inventory levels of our high-performance analog products lower than they were at the end of 2004, despite resales that were significantly higher.
Analog revenue increased 4 percent from 2004 primarily due to increased shipments resulting from growth in demand for high-performance analog products, which more than offset the loss of revenue from our commodity liquid crystal display (LCD) driver product line, which we divested in the first quarter of 2005. In 2005, about 40 percent of total Semiconductor revenue came from analog.
DSP revenue increased 15 percent from 2004 primarily due to increased shipments resulting from growth in demand for wireless products. In 2005, about 40 percent of total Semiconductor revenue came from DSP.
For the year, remaining Semiconductor revenue increased 2 percent from 2004 primarily due to higher shipments resulting from increased demand for RISC microprocessors and microcontrollers that offset a decline in revenue from DLP products.
We began 2005 with excess inventories of DLP products at both our customers and their channels. Overall DLP revenue declined 8 percent in 2005. We left the year in a much better position, with revenue in the fourth quarter up 10 percent from the year-ago quarter. In 2005, DLP was about 5 percent of Semiconductor revenue, while RISC microprocessors, standard logic, microcontrollers and royalties were under 5 percent each.

TEXAS INSTRUMENTS 2006 ANNUAL REPORT5050
In total, we estimate that our 2005 Semiconductor product revenue came from the following broad markets: communications (including wireless and broadband communications) was about 50 percent; computing (including peripherals and computers) was about 30 percent; consumer electronics was about 10 percent; industrial was about 5 percent; and automotive was about 5 percent.
Gross profit of $5.77 billion, or 48.8 percent of revenue, increased $765 million from 2004, primarily due to manufacturing cost reductions and, to a lesser extent, higher revenue.
Operating profit was $2.81 billion, or 23.7 percent of revenue, up $740 million from 2004 due to higher gross profit.
For the year, Semiconductor orders increased 13 percent to $12.34 billion due to broad-based demand for our DSP and analog products.
Education Technology Segment
Statement of Operations – Education TechnologyFOR THE YEARS ENDED
DECEMBER 31,
2005 2004
Net revenue. . . . . . . . . . . . . . . . . . . . . . . . . . . . . . . . . . . . . . . . . . . . . . . . . . . . . . . . . . . . . . . . . . . . . . . . . . . . . . . $ 506 $ 518Cost of revenue. . . . . . . . . . . . . . . . . . . . . . . . . . . . . . . . . . . . . . . . . . . . . . . . . . . . . . . . . . . . . . . . . . . . . . . . . . . . 206 226Gross profit . . . . . . . . . . . . . . . . . . . . . . . . . . . . . . . . . . . . . . . . . . . . . . . . . . . . . . . . . . . . . . . . . . . . . . . . . . . . . . . 300 292
Gross profit % of revenue. . . . . . . . . . . . . . . . . . . . . . . . . . . . . . . . . . . . . . . . . . . . . . . . . . . . . . . . . . . . . . . . . 59.2% 56.4%Profit from operations. . . . . . . . . . . . . . . . . . . . . . . . . . . . . . . . . . . . . . . . . . . . . . . . . . . . . . . . . . . . . . . . . . . . . . 188 176
Operating profit % of revenue . . . . . . . . . . . . . . . . . . . . . . . . . . . . . . . . . . . . . . . . . . . . . . . . . . . . . . . . . . . . . 37.2% 34.0%
Education Technology revenue for 2005 was $506 million, down 2 percent from 2004 primarily due to tighter inventory management at retail customers.
Gross profit of $300 million, or a record 59.2 percent of revenue, increased $8 million from 2004 primarily due to lower manufacturing costs.
Operating profit was a record $188 million, or 37.2 percent of revenue, an increase of $12 million from 2004 due to higher gross profit.
Discontinued Operations
Revenue for 2005 from the former Sensors & Controls business was $1.06 billion, up 3 percent from 2004 due to increased shipments resulting from growth in demand for sensor products.
Income from discontinued operations before income taxes was $232 million, or 21.9 percent of revenue, a decrease of $17 million from the prior year primarily due to costs associated with new products.
Income from discontinued operations net of income taxes was $151 million, or $0.09 per share, a decrease of 11 percent compared with 2004 income from discontinued operations net of tax of $170 million, or $0.10 per share, primarily due to lower operating profit.
Financial Condition
At the end of 2006, total cash (cash and cash equivalents plus short-term investments) was $3.72 billion, down $1.61 billion from the end of 2005.
Accounts receivable were $1.77 billion at the end of 2006, an increase of $126 million from 2005 primarily due to higher revenue. Days sales outstanding were 46 at the end of 2006, compared with 45 at the end of 2005.
Inventory was $1.44 billion at the end of 2006. Compared with a year ago, when inventory was below desired levels, inventory increased $252 million. Days of inventory at the end of 2006 were 75 compared with 64 at the end of 2005.
For the year, depreciation was $1.05 billion. This was a decrease of $294 million compared with 2005, $156 million of which was due to our change at the beginning of 2006 from an accelerated to a straight-line method of depreciation.
TEXAS INSTRUMENTS 2006 ANNUAL REPORT 5151
Liquidity and Capital Resources
Our primary source of liquidity is our cash flow from operations. In addition, we have $1.18 billion of cash and cash equivalents and $2.53 billion of short-term investments, totaling $3.72 billion as of December 31, 2006. Other sources of liquidity include a new five-year $1 billion revolving credit facility and a non-U.S. revolving credit facility of $175 million (see Note 6 to the Financial Statements for additional information). As of December 31, 2006, these facilities were not being utilized.
For the year, cash flow from operations decreased $1.15 billion to $2.45 billion, primarily due to increased working capital requirements that more than offset higher income from continuing operations. The increased working capital requirements reflect the payment of income taxes related to the gain on the sale of our former Sensors & Controls business; the reduction in accounts payable primarily relating to payments for manufacturing equipment and to foundry suppliers; and increased inventory from the less-than-desirable levels at year-end 2005.
In 2006, investing activities provided $3.09 billion in cash, compared with 2005, when investing activities used cash of $1.63billion. We received cash proceeds from the sale of the former Sensors & Controls business of $3.00 billion in 2006. Sales and maturities of cash investments, net of purchases, were $1.60 billion in 2006 compared with a negative $0.42 billion in 2005 as we increased the cash available for repurchasing shares of our common stock as discussed below.
For 2006, capital expenditures were $1.27 billion, about even with 2005. Our capital expenditures in 2006 were primarily for assembly and test equipment and advanced wafer fabrication equipment.
For 2006, net cash used in financing activities was $5.57 billion compared with $3.54 billion in 2005, primarily reflecting increased repurchases of our common stock and the repayment of $586 million of debt. We used $5.30 billion of cash to repurchase 172 million shares of our common stock in 2006 compared with $4.15 billion used to repurchase 153 million shares of our common stock in 2005. Repurchases in 2006 reduced our shares outstanding by 9 percent. Dividends paid in 2006 of $199 million, compared with $173 million in 2005, reflect the effect of increases in the quarterly dividend rate in the fourth quarters of 2005 and 2006. The quarterly cash dividend rate was increased to $0.03 per share beginning with the dividend declared on October 20, 2005. The quarterly cash dividend rate was increased to $0.04 per share beginning with the dividend declared on October 19, 2006. The effect of the dividend rate increases on total dividends paid in 2006 was partially offset by the lower number of shares outstanding.
Cash proceeds received from the exercise of employee stock options in 2006 were $419 million compared with $461 million in 2005.
In 2005, to avail ourselves of tax savings provided for under the AJCA, we repatriated $1.29 billion of previously undistributed earnings of non-U.S. subsidiaries. During the fourth quarter of 2005, our Japan subsidiary borrowed $275 million of variable-rate bank notes in order to facilitate this process. This debt was prepaid in the second quarter of 2006. A portion of this debt had been due in 2008 and the remainder had been due in 2010. During 2006, we also retired $300 million of maturing debt and redeemed $11 million of debt that was to mature in 2020.
In 2006, the board of directors authorized the repurchase of an additional $10 billion of our common stock. Cumulatively, our board of directors has authorized $15 billion in stock repurchases since September 2004. At year end, $5.49 billion of these authorizations remain.

TEXAS INSTRUMENTS 2006 ANNUAL REPORT5252
Long-term Contractual Obligations
PAYMENTS DUE BY PERIOD
Contractual Obligations 2007 2008/2009 2010/2011 Thereafter Total
Long-term debt obligations (a) . . . . . . . . . . . . . . . . . . . . . . . . . . . . . $ 43 $ — $ — $ — $ 43Operating lease obligations (b) . . . . . . . . . . . . . . . . . . . . . . . . . . . . . 85 101 71 162 419Software license obligations (c). . . . . . . . . . . . . . . . . . . . . . . . . . . . 33 36 8 — 77Purchase obligations (d). . . . . . . . . . . . . . . . . . . . . . . . . . . . . . . . . . . 117 130 10 61 318Retirement plans funding (e) . . . . . . . . . . . . . . . . . . . . . . . . . . . . . . . 110 — — — 110Deferred compensation plan (f) . . . . . . . . . . . . . . . . . . . . . . . . . . . . 22 38 30 105 195Venture capital commitments (g) . . . . . . . . . . . . . . . . . . . . . . . . . . . 32 — — — 32Total. . . . . . . . . . . . . . . . . . . . . . . . . . . . . . . . . . . . . . . . . . . . . . . . . . . . . $ 442 $ 305 $ 119 $ 328 $ 1,194
(a) Includes amounts classified as current portion of long-term debt, i.e., obligations that will be retired within 12 months.(b) Includes minimum lease payments for leased facilities and equipment, as well as purchases of industrial gases under contracts accounted for as
operating leases.(c) Includes agreements to license electronic design automation software; these are classified as operating leases or capital leases in accordance with
Statement of Position 98-1.(d) Includes contractual arrangements with suppliers where there is a fixed non-cancellable payment schedule or minimum payments due with a
reduced delivery schedule. Excluded from the table are cancellable arrangements. However, depending on the timing of cancelling certain purchase arrangements, an additional $57 million of cancellation penalties may be required to be paid, which are not reflected in the table.
(e) Includes the expected contribution planned during 2007. Funding projections beyond the current year are not practical to estimate due to the rules affecting tax-deductible contributions and the impact from the plan asset performance, interest rates and potential U.S. and international legislation.
(f) Includes an estimate of payments under this plan for the liability that existed at December 31, 2006. Certain employees are eligible to defer a portion of their salary, bonus and profit sharing into a nonqualified deferred compensation plan. Employees who participate in the plan can select one of eight distribution options offered by the plan. Payments are made after the employee terminates, in accordance with the employee’s distribution election and plan balance.
(g) Includes investments in certain venture capital funds where we have committed to provide additional capital to those funds. As appropriate investments are entered into, the venture capital general partners may draw upon those committed additional funds. Because the timing of these commitments is unknown, the table reflects the commitments assuming that they are immediately called by the venture capital funds’ general partners in the maximum amount committed.
We believe we have the necessary financial resources to fund our working capital needs, capital expenditures, dividend payments and other business requirements for at least the next 12 months.
Critical Accounting Policies
In preparing our consolidated financial statements in conformity with accounting principles generally accepted in the United States, we use statistical analyses, estimates and projections that affect the reported amounts and related disclosures and may vary from actual results. We consider the following accounting policies to be both those that are most important to the portrayal of our financial condition and that require the most subjective judgment. If actual results differ significantly from management’s estimates and projections, there could be a significant effect on our financial statements.
Revenue Recognition
Revenue from sales of our products is recognized upon shipment or delivery, depending upon the terms of the sales order, provided that persuasive evidence of a sales arrangement exists, title and risk of loss have transferred to the customer, the sales amount is fixed or determinable and collection of the revenue is reasonably assured. A portion of our sales is to distributors. We recognize revenue from sales of our products to distributors upon delivery of product to the distributors consistent with the above principles.
We reduce revenue based on estimates of future credits to be granted to customers. Credits are granted for reasons such as prompt payment discounts, volume-based incentives, other special pricing arrangements and product returns due to quality issues. Our estimates of future credits are based on historical experience, analysis of product shipments and contractual arrangements with customers.
Distributor revenue is recognized net of allowances, which are management’s estimates based on analysis of historical data, current economic conditions and contractual terms. These allowances recognize the impact of credits granted to distributors under certain programs common in the semiconductor industry whereby distributors receive certain price adjustments to meet individual competitive opportunities, or are allowed to return or scrap a limited amount of product in accordance with contractual terms agreed upon with the distributor or receive price protection credits when our standard published prices are lowered from the price the distributor paid for product still in their inventory. Historical claims data are maintained for each

TEXAS INSTRUMENTS 2006 ANNUAL REPORT 5353
of the programs, with differences among geographic regions taken into consideration. We continually monitor the actual claimed allowances against our estimates, and we adjust our estimates as appropriate to reflect trends in distributor revenue and inventory levels. Allowances are also adjusted when recent historical data do not represent anticipated future activity.
Our contractual agreements with our intellectual property licensees determine the amount and timing of royalty revenue.Royalty revenue is recognized when earned according to the terms of the agreement and when realization of payment is considered probable by management. Where royalties are based upon licensee sales, we recognize royalty revenue upon the sale by the licensee of royalty-bearing products, as estimated by us, based on historical experience and analysis of annual sales results of licensees. Estimates are periodically adjusted as a result of reviews of reported results of licensees, which may take the form of independent audits. Where warranted, revenue from licensees may be recognized on a cash basis.
In addition, we monitor collectibility of accounts receivable primarily through review of the accounts receivable aging. When facts and circumstances indicate the collection of specific amounts or from specific customers is at risk, we assess the impact on amounts recorded for bad debts and, if necessary, will record a charge in the period such determination is made.
Stock-based Compensation
With the implementation of SFAS 123(R), effective July 1, 2005, stock-based compensation changed our financial statements as detailed in Notes 1 and 9 to the Financial Statements. Determining the amount and distribution of expense for stock-based compensation, as well as the associated impact to the balance sheets and statements of cash flows, requires us to develop estimates of the fair value of stock-based compensation expense. The most significant factors of that expense that require estimates or projections include the expected volatility, expected lives and estimated forfeiture rates of employee stock options.
For grants made prior to July 1, 2005, an analysis of historical volatility was used to develop the estimate of expected volatility. Effective July 1, 2005, we changed our method of determining expected volatility on all options granted after that date to rely solely on available implied volatility rates. We believe that market-based measures of implied volatility are currently the best available indicators of expected volatility. The effect of this change in assumption was not material in 2005 or in 2006.
The expected lives of options are determined based on our historical share option exercise experience, using a rolling 10-year average. We believe the historical experience method is the best estimate of future exercise patterns currently available.
Estimated forfeiture rates are derived from historical forfeiture patterns. We believe the historical experience method is the best estimate of forfeitures currently available.
Inventory Valuation Allowances
Inventory is valued net of allowances for unsalable or obsolete raw materials, work-in-process and finished goods.Allowances are determined quarterly by comparing inventory levels of individual materials and parts to historical usage rates, current backlog and estimated future sales and by analyzing the age of inventory, in order to identify specific components of inventory that are judged unlikely to be sold. Allowances are also calculated quarterly for instances where inventoried costs for individual products are in excess of market prices for those products. In addition to this specific identification process, statistical allowances are calculated for remaining inventory based on historical write-offs of inventory for salability and obsolescence reasons. Inventory is written off in the period in which disposal occurs. Actual future write-offs of inventory for salability and obsolescence reasons may differ from estimates and calculations used to determine valuation allowances due to changes in customer demand, customer negotiations, technology shifts and other factors.
Income Taxes
In determining income for financial statement purposes, we must make certain estimates and judgments in the calculation of tax provisions and the resultant tax liabilities and in the recoverability of deferred tax assets that arise from temporary differences between the tax and financial statement recognition of revenue and expense.
In the ordinary course of global business, there may be many transactions and calculations where the ultimate tax outcome is uncertain. The calculation of tax liabilities involves dealing with uncertainties in the application of complex tax laws. We recognize potential liabilities for anticipated tax audit issues in the U.S. and other tax jurisdictions based on an estimate of the ultimate resolution of whether, and the extent to which, additional taxes will be due. Although we believe the estimates are reasonable, no assurance can be given that the final outcome of these matters will not be different than what is reflected in the historical income tax provisions and accruals.

TEXAS INSTRUMENTS 2006 ANNUAL REPORT5454
As part of our financial process, we must assess the likelihood that our deferred tax assets can be recovered. If recovery is not likely, the provision for taxes must be increased by recording a reserve in the form of a valuation allowance for the deferred tax assets that are estimated not to be ultimately recoverable. In this process, certain relevant criteria are evaluated including the existence of deferred tax liabilities that can be used to absorb deferred tax assets, the taxable income in prior carryback years that can be used to absorb net operating losses and credit carrybacks, and taxable income in future years.Our judgment regarding future taxable income may change due to future market conditions, changes in U.S. or international tax laws and other factors. These changes, if any, may require material adjustments to these deferred tax assets and an accompanying reduction or increase in net income in the period when such determinations are made.
In addition to the factors described above, the effective tax rate reflected in forward-looking statements is based on then current tax law. Significant changes during the year in enacted tax law could affect these estimates.
Impairment of Long-lived Assets
We review long-lived assets for impairment when certain indicators are present that suggest the carrying amount may not be recoverable. This review process primarily focuses on intangible assets from business acquisitions; property, plant and equipment; and software for internal use or embedded in products sold to customers. Factors considered include the under-performance of an asset compared to expectations and shortened useful lives due to planned changes in the use of the assets. Recoverability is determined by comparing the carrying amount of long-lived assets to estimated future undiscounted cash flows. If future undiscounted cash flows are less than the carrying amount of the long-lived assets, an impairment charge would be recognized for the excess of the carrying amount over fair value determined by either a quoted market price, if any, or a value determined by utilizing a discounted cash-flow technique. Additionally, in the case of assets that will continue to be used in future periods, a shortened depreciable life may be utilized if appropriate, resulting in accelerated amortization based upon the expected net realizable value of the asset at the date the asset will no longer be utilized. Actual results may vary from estimates due to, among other things, differences in operating results, shorter asset useful lives and lower market values for excess assets.
Changes in Accounting Standards
See Note 10 for a discussion of the impact of adopting SFAS 158, “Employers’ Accounting for Defined Benefit Pension and Other Postretirement Plans, an amendment of FASB Statements No. 87, 88, 106, and 132(R).” See Changes in Accounting Standards in Note 1 to the Financial Statements for a discussion of other changes in accounting standards.
In July 2006, the FASB issued FASB Interpretation (FIN) No. 48, “Accounting for Uncertainty in Income Taxes—An Interpretation of FASB Statement No. 109.” This Interpretation clarifies the accounting for uncertainty in income taxes recognized in a company’s financial statements. FIN 48 requires companies to determine that it is “more likely than not” that a tax position will be sustained upon examination by the appropriate taxing authorities before any part of the benefit can be recorded in the financial statements. It also provides guidance on the recognition, measurement and classification of income tax uncertainties, along with any related interest and penalties. FIN 48 will also require significant additional disclosures. This Interpretation will be effective for fiscal years beginning after December 15, 2006. We will implement this Interpretation in the first quarter of 2007 on a prospective basis. We are currently evaluating the potential impact this Interpretation will have on our financial position and results of operations.
In September 2006, the FASB issued SFAS No. 157, “Fair Value Measurements,” which provides guidance on how to measure assets and liabilities that use fair value. SFAS 157 will apply whenever another U.S. generally accepted accounting principlesstandard requires or permits assets or liabilities to be measured at fair value. SFAS 157 does not expand the use of fair value to any new circumstances. This standard will also require additional disclosures in both annual and quarterly reports. SFAS 157 will be effective for financial statements issued for fiscal years beginning after November 15, 2007, and will be adopted by us beginning in the first quarter of 2008. We are currently evaluating the potential impact this standard will have on our financial position and results of operations.
In September 2006, the SEC Staff issued Staff Accounting Bulletin (SAB) No. 108, “Considering the Effects of Prior Year Misstatements when Quantifying Misstatements in Current Year Financial Statements.” SAB 108 was issued in order to eliminate the diversity of practice in how public companies quantify misstatements of financial statements, including misstatements that were not material to prior years’ financial statements. We have adopted the provisions of SAB 108 forthe year ending December 31, 2006, and have determined it does not have an impact on our financial position and results of operations for the period then ended.

TEXAS INSTRUMENTS 2006 ANNUAL REPORT 5555
In June 2006, the FASB ratified Emerging Issues Task Force (EITF) Issue No. 06-3, “How Taxes Collected from Customers and Remitted to Governmental Authorities Should Be Presented in the Income Statement (That Is, Gross Versus Net Presentation).” This standard allows companies to present in their statements of income any taxes assessed by a governmental authority that are directly imposed on revenue-producing transactions between a seller and a customer, such as sales, use, value-added and some excise taxes, on either a gross (included in revenue and costs) or a net (excluded from revenue) basis. This standard will be effective for us in interim periods and fiscal years beginning after December 15, 2006.We present these transactions on a net basis and, therefore, the adoption of this standard will have no impact on our financial position and results of operations.
Off-balance Sheet Arrangements
As of December 31, 2006, we had no significant off-balance sheet arrangements, as defined in Item 303(a)(4)(ii) of SEC Regulation S-K.
Commitments and Contingencies
See Note 14 to the Financial Statements for a discussion of our commitments and contingencies.
Quantitative and Qualitative Disclosures about Market Risk
The U.S. dollar is the functional currency for financial reporting. In this regard, we use forward currency exchange contracts to minimize the adverse earnings impact from the effect of exchange rate fluctuations on our non-U.S. dollar net balance sheet exposures. For example, at year-end 2006, we had forward currency exchange contracts outstanding of $268 million to hedge net balance sheet exposures (including $85 million to sell euros, $82 million to sell British pounds and $48 million to sell Japanese yen). Similar hedging activities existed at year-end 2005. Because most of the aggregate non-U.S. dollar balance sheet exposure is hedged by these exchange contracts, based on year-end 2006 balances and rates, a hypothetical 10 percent plus or minus fluctuation in non-U.S. currency exchange rates would result in a pre-tax currency exchange gain or loss of less than $1 million.
Our total long-term debt, at historical cost, was $43 million at year-end 2006 and $630 million at year-end 2005. This long-term debt had a fair value, based on current interest rates, of approximately $44 million at year-end 2006 and $634 million at year-end 2005. Fair value will vary as interest rates change.
In order to achieve a mix of interest rates on our long-term debt, we used interest rate swaps that changed the characteristics of the interest payments on certain underlying debt from fixed-rate payments to short-term LIBOR-based variable rate payments. Although these interest rate swaps had no impact in 2006, the swaps decreased interest expense by $11 million in 2005 and $19 million in 2004. The year-end 2006 effective interest rate for the $43 million of 8.75% notes due 2007, including the effect of the swaps, was approximately 9.10%. Measured from its inception through year-end 2006, the effect of this swap has been to reduce the average annual interest rate on these notes from 8.75% to 6.54%.
Our cash equivalents are debt securities with original maturities equal to or less than three months. Short-term investments are debt securities, including auction-rate securities, with original maturities greater than three months (see Note 3 to the Financial Statements for additional information). Their aggregate fair value and carrying amount were $3.51 billion at year-end 2006 (fair value and carrying amount were $5.10 billion at year-end 2005). Fair value will vary as interest rates change.
Equity and other long-term investments at year-end 2006 consisted of the following:
• Equity investments – include marketable (publicly traded) and non-marketable (private investments, including various venture funds) equity investments.
• Investments in mutual funds – consist of mutual funds that were selected to generate returns that offset changes in certain liabilities related to deferred compensation arrangements. The mutual funds hold a variety of debt and equity investments.
Marketable equity investments are stated at fair value and marked-to-market through stockholders’ equity, net of tax.Impairments deemed to be other than temporary are expensed in the Statement of Income. Changes in prices of the mutual fund investments are expected to offset related changes in deferred compensation liabilities such that a 10 percent increase or decrease in investment prices would not affect operating results.

TEXAS INSTRUMENTS 2006 ANNUAL REPORT5656
QUARTERLY FINANCIAL DATA
QUARTER
2006 1st 2nd 3rd 4th
Net revenue. . . . . . . . . . . . . . . . . . . . . . . . . . . . . . . . . . . . . . . . . . . . . . . . . . . . . . . . . . . . $ 3,334 $ 3,697 $ 3,761 $ 3,463Gross profit . . . . . . . . . . . . . . . . . . . . . . . . . . . . . . . . . . . . . . . . . . . . . . . . . . . . . . . . . . . . 1,672 1,907 1,932 1,748Profit from operations. . . . . . . . . . . . . . . . . . . . . . . . . . . . . . . . . . . . . . . . . . . . . . . . . . . 718 953 930 767Income from continuing operations . . . . . . . . . . . . . . . . . . . . . . . . . . . . . . . . . . . . . . $ 542 $ 739 $ 686 $ 671Net income . . . . . . . . . . . . . . . . . . . . . . . . . . . . . . . . . . . . . . . . . . . . . . . . . . . . . . . . . . . . $ 585 $ 2,387 $ 702 $ 668Diluted earnings per share:
Income from continuing operations . . . . . . . . . . . . . . . . . . . . . . . . . . . . . . . . . . . . $ 0.33 $ 0.47 $ 0.45 $ 0.45Net income . . . . . . . . . . . . . . . . . . . . . . . . . . . . . . . . . . . . . . . . . . . . . . . . . . . . . . . . . . $ 0.36 $ 1.50 $ 0.46 $ 0.45
QUARTER
2005 1st 2nd 3rd 4th
Net revenue. . . . . . . . . . . . . . . . . . . . . . . . . . . . . . . . . . . . . . . . . . . . . . . . . . . . . . . . . . . . . $ 2,702 $ 2,971 $ 3,339 $ 3,324Gross profit . . . . . . . . . . . . . . . . . . . . . . . . . . . . . . . . . . . . . . . . . . . . . . . . . . . . . . . . . . . . . 1,244 1,426 1,690 1,657Profit from operations . . . . . . . . . . . . . . . . . . . . . . . . . . . . . . . . . . . . . . . . . . . . . . . . . . . . 436 602 761 760Income from continuing operations . . . . . . . . . . . . . . . . . . . . . . . . . . . . . . . . . . . . . . . . $ 371 $ 584 $ 596 $ 622Net income. . . . . . . . . . . . . . . . . . . . . . . . . . . . . . . . . . . . . . . . . . . . . . . . . . . . . . . . . . . . . . $ 411 $ 628 $ 631 $ 655Diluted earnings per share:
Income from continuing operations . . . . . . . . . . . . . . . . . . . . . . . . . . . . . . . . . . . . . . $ 0.21 $ 0.35 $ 0.36 $ 0.38Net income. . . . . . . . . . . . . . . . . . . . . . . . . . . . . . . . . . . . . . . . . . . . . . . . . . . . . . . . . . . . $ 0.24 $ 0.38 $ 0.38 $ 0.40
Included in the results above were the following items:
QUARTER
2006 1st 2nd 3rd 4th
Stock-based compensation (a). . . . . . . . . . . . . . . . . . . . . . . . . . . . . . . . . . . . . . . . . . . . . . $ 91 $ 84 $ 79 $ 78Royalty settlement benefit (b) . . . . . . . . . . . . . . . . . . . . . . . . . . . . . . . . . . . . . . . . . . . . . . — (60) — —Sales tax refund benefit (c). . . . . . . . . . . . . . . . . . . . . . . . . . . . . . . . . . . . . . . . . . . . . . . . . — (77) — —Research tax credit (d). . . . . . . . . . . . . . . . . . . . . . . . . . . . . . . . . . . . . . . . . . . . . . . . . . . . . — — — (72)
QUARTER
2005 1st 2nd 3rd 4th
Stock-based compensation (a) . . . . . . . . . . . . . . . . . . . . . . . . . . . . . . . . . . . . . . . . . . . . . . $ 5 $ 5 $ 80 $ 85Favorable tax adjustments and discrete items (e) . . . . . . . . . . . . . . . . . . . . . . . . . . . . . — (78) (5) (9)Gains on sales of assets (f) . . . . . . . . . . . . . . . . . . . . . . . . . . . . . . . . . . . . . . . . . . . . . . . . . (24) (1) — —
(a) Reflects our adoption of SFAS 123(R) as of July 1, 2005 (see Note 1 to the Financial Statements, Effects of Stock-based Compensation, for details).(b) Reflects settlement of patent-related litigation with Conexant Systems, Inc.(c) Reflects settlement of an audit of Texas state sales and use taxes paid on various purchases over a nine-year period.(d) The 2006 U.S. federal research tax credit was reinstated in December 2006.(e) Includes favorable adjustments primarily associated with notification of proposed audit adjustments communicated by tax authorities and partially offset
by tax related to the American Jobs Creation Act of 2004.(f) Includes the disposition of a sales facility and the sale of our liquid crystal display driver product line.

TEXAS INSTRUMENTS 2006 ANNUAL REPORT 5757
COMMON STOCK PRICES AND DIVIDENDS
TI common stock is listed on the New York Stock Exchange and traded principally in that market. The table below shows the high and low closing prices of TI common stock as reported by Bloomberg L.P. and the dividends paid per common share for each quarter during the past two years.
QUARTER
1st 2nd 3rd 4thStock Prices:
2006 High . . . . . . . . . . . . . . . . . . . . . . . . . . . . . . . . . . . . . . . . . . . . . . . . . . . . . . . . . . . . . $ 34.45 $ 35.56 $ 33.89 $ 33.06 Low . . . . . . . . . . . . . . . . . . . . . . . . . . . . . . . . . . . . . . . . . . . . . . . . . . . . . . . . . . . . . 29.23 28.90 27.00 28.552005 High . . . . . . . . . . . . . . . . . . . . . . . . . . . . . . . . . . . . . . . . . . . . . . . . . . . . . . . . . . . . . $ 27.37 $ 28.34 $ 33.96 $ 34.11 Low . . . . . . . . . . . . . . . . . . . . . . . . . . . . . . . . . . . . . . . . . . . . . . . . . . . . . . . . . . . . . 20.77 22.76 28.03 27.47
Dividends paid:2006 . . . . . . . . . . . . . . . . . . . . . . . . . . . . . . . . . . . . . . . . . . . . . . . . . . . . . . . . . . . . . . . . . . $ 0.030 $ 0.030 $ 0.030 $ 0.0402005 . . . . . . . . . . . . . . . . . . . . . . . . . . . . . . . . . . . . . . . . . . . . . . . . . . . . . . . . . . . . . . . . . . $ 0.025 $ 0.025 $ 0.025 $ 0.030
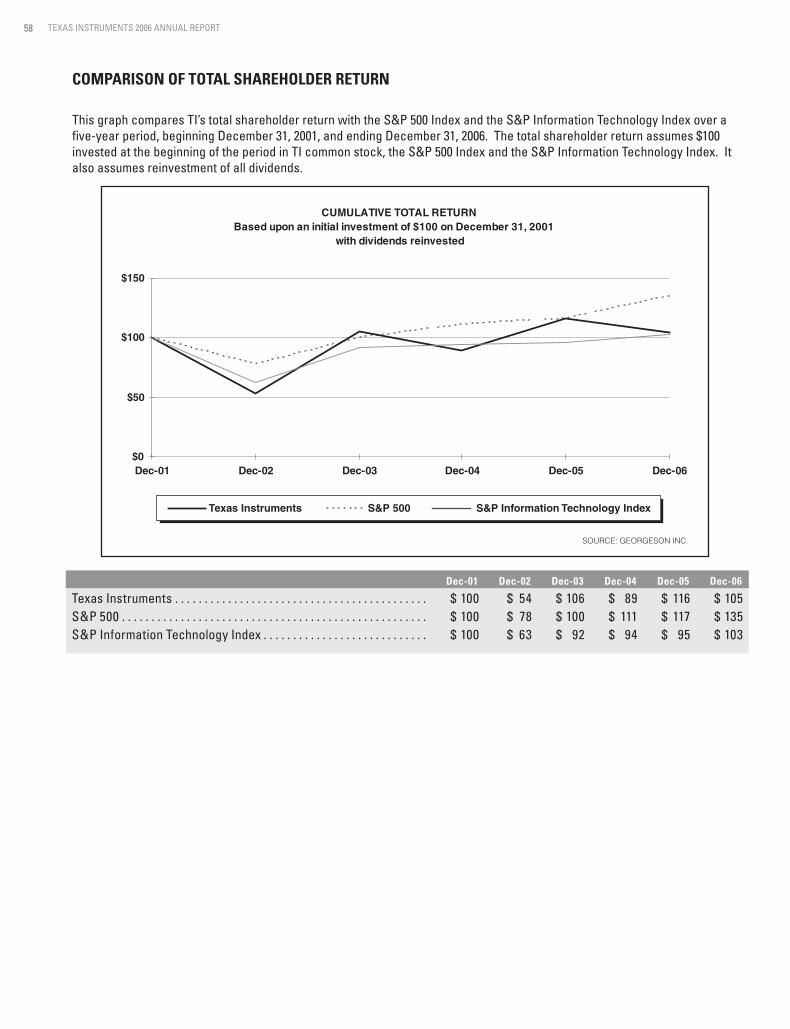
TEXAS INSTRUMENTS 2006 ANNUAL REPORT5858
COMPARISON OF TOTAL SHAREHOLDER RETURN
This graph compares TI’s total shareholder return with the S&P 500 Index and the S&P Information Technology Index over a five-year period, beginning December 31, 2001, and ending December 31, 2006. The total shareholder return assumes $100 invested at the beginning of the period in TI common stock, the S&P 500 Index and the S&P Information Technology Index. It also assumes reinvestment of all dividends.
CUMULATIVE TOTAL RETURNBased upon an initial investment of $100 on December 31, 2001
with dividends reinvested
$0
$50
$100
$150
Dec-01 Dec-02 Dec-03 Dec-04 Dec-05 Dec-06
SOURCE: GEORGESON INC.
Texas Instruments S&P 500 S&P Information Technology Index
Dec-01 Dec-02 Dec-03 Dec-04 Dec-05 Dec-06
Texas Instruments . . . . . . . . . . . . . . . . . . . . . . . . . . . . . . . . . . . . . . . . . . . $ 100 $ 54 $ 106 $ 89 $ 116 $ 105 S&P 500 . . . . . . . . . . . . . . . . . . . . . . . . . . . . . . . . . . . . . . . . . . . . . . . . . . . . $ 100 $ 78 $ 100 $ 111 $ 117 $ 135 S&P Information Technology Index . . . . . . . . . . . . . . . . . . . . . . . . . . . . $ 100 $ 63 $ 92 $ 94 $ 95 $ 103

TEXAS INSTRUMENTS 2006 ANNUAL REPORT 5959
SAFE HARBOR STATEMENT
“Safe Harbor” Statement under the Private Securities Litigation Reform Act of 1995: This report includes forward-looking statements intended to qualify for the safe harbor from liability established by the Private Securities Litigation Reform Act of 1995. These forward-looking statements generally can be identified by phrases such as TI or its management “believes,” “expects,” “anticipates,” “foresees,” “forecasts,” “estimates” or other words or phrases of similar import. Similarly, statements in this report that describe the Company’s business strategy, outlook, objectives, plans, intentions or goals also are forward-looking statements. All such forward-looking statements are subject to certain risks and uncertainties that could cause actual results to differ materially from those in forward-looking statements.
We urge you to carefully consider the following important factors that could cause actual results to differ materially from the expectations of the Company or its management:
• Market demand for semiconductors, particularly for analog chips and digital signal processors in key markets such as communications, entertainment electronics and computing;
• TI’s ability to maintain or improve profit margins, including its ability to utilize its manufacturing facilities at sufficient levels to cover its fixed operating costs, in an intensely competitive and cyclical industry;
• TI’s ability to develop, manufacture and market innovative products in a rapidly changing technological environment; • TI’s ability to compete in products and prices in an intensely competitive industry; • TI’s ability to maintain and enforce a strong intellectual property portfolio and obtain needed licenses from third
parties; • Expiration of license agreements between TI and its patent licensees, and market conditions reducing royalty
payments to TI; • Economic, social and political conditions in the countries in which TI, its customers or its suppliers operate, including
security risks, health conditions, possible disruptions in transportation networks and fluctuations in foreign currency exchange rates;
• Natural events such as severe weather and earthquakes in the locations in which TI, its customers or its suppliers operate;
• Availability and cost of raw materials, utilities, manufacturing equipment, third-party manufacturing services and manufacturing technology;
• Changes in the tax rate applicable to TI as the result of changes in tax law, the jurisdictions in which profits are determined to be earned and taxed, the outcome of tax audits and the ability to realize deferred tax assets;
• Losses or curtailments of purchases from key customers and the timing and amount of distributor and other customer inventory adjustments;
• Customer demand that differs from company forecasts; • The financial impact of inadequate or excess TI inventories to meet demand that differs from projections; • Product liability or warranty claims, or recalls by TI customers for a product containing a TI part; • TI’s ability to recruit and retain skilled personnel; and • Timely implementation of new manufacturing technologies, installation of manufacturing equipment and the ability to
obtain needed third-party foundry and assembly/test subcontract services.
For a more detailed discussion of these factors, see the text under the heading “Risk Factors” in Item 1A of the Company’s most recent Form 10-K. The forward-looking statements included in this report are made only as of the date of publication (February 2007), and the Company undertakes no obligation to update the forward-looking statements to reflect subsequent events or circumstances.

TEXAS INSTRUMENTS 2006 ANNUAL REPORT60
TI FTI Fare perftechsha
DIRE
EXEC
STOCKHOLDER AND OTHER INFORMATION
SEC FORM 10-KStockholders may obtain a copy of the company’s annual report to the Securities and Exchange Commission on Form 10-K (except for exhibits) and its audited financial statements without charge by writing to:Investor RelationsP.O. Box 660199, MS 8657Dallas, TX 75266-0199
CERTIFICATIONSThe certifications of the Chief Executive Officer and the Chief Financial Officer of TI required by Section 302 of the Sarbanes-Oxley Act of 2002 have been filed as exhibits 31(a) and 31(b), respectively, to TI’s Form 10-K for the fiscal yearended December 31, 2006.
As required by the New York Stock Exchange (NYSE) listing standards, an unqualified annual certification indicating compliance with the listing standards was signed by TI’s Chief Executive Officer and submitted to the NYSE on April 26, 2006.
TRANSFER AGENT AND REGISTRARComputershare Investor Services, L.L.C.2 North LaSalle StreetChicago, IL 60602
STOCKHOLDER RECORDS INFORMATIONComputershare Investor Services, L.L.C.P.O. Box 43036Providence, RI 02940-3036250 Royall Street, Mail Stop 1ACanton, MA 02021Toll Free: 800-981-8676Phone: 312-360-5151Email Inquiries: www.computershare.com/contactuswww-us.computershare.com
INDEPENDENT REGISTERED PUBLICACCOUNTING FIRMErnst & Young LLPDallas, Texas
STOCK EXCHANGE LISTINGThe common stock of Texas Instruments Incorporated is listed on the New York Stock Exchange. Ticker symbol: TXN
COMPANY HEADQUARTERSTexas Instruments IncorporatedP.O. Box 660199Dallas, TX 75266-0199Phone: 972-995-2011www.ti.com
INVESTOR INFORMATIONInvestor RelationsP.O. Box 660199, MS 8657Dallas, TX 75266-0199Phone: 972-995-3773
FINANCIAL/PRODUCT LITERATURE ANDGENERAL INFORMATIONToll Free: 800-336-5236Phone: 972-995-6611www.ti.com/irdocreq
MEDIA INFORMATIONMedia RelationsP.O. Box 660199, MS 8726Dallas, TX 75266-0199Phone: 214-480-6893
ENVIRONMENTAL, SAFETY ANDHEALTH INFORMATIONEnvironmental, Safety and HealthP.O. Box 655474, MS 3734Dallas, TX 75265-5474Phone: 972-927-3141
The following are trademarks of Texas Instruments:DaVinci, DRP, OMAP, DLP and DLP Cinema. Other trademarks are the property of their respective owners.
BOA
138397_TI_R8 2/23/07 1:13 PM Page 9

TEXAS INSTRUMENTS 2006 ANNUAL REPORT 61
TI FELLOWSTI Fellows are engineers, scientists or technologists whoare recognized by peers and TI management for outstandingperformance. Fellows are elected based on exceptionaltechnical contributions that significantly contribute to TIshareholder value.
James R. AdamsRetired Chairman of the Board,Texas Instruments;Retired Group President,SBC Communications Inc.
David L. BorenPresident, The Universityof Oklahoma
Daniel A. CarpRetired Chairman of the Board andChief Executive Officer,Eastman Kodak Company
Carrie S. CoxExecutive Vice President,Schering-Plough Corporation;President, GlobalPharmaceuticals business
Thomas J. EngibousChairman of the Board
GeraldW. FronterhousePrivate Investor
David R. GoodeRetired Chairman of the Board,Norfolk Southern Corporation
Pamela H. PatsleySenior Executive Vice President,First Data Corporation;President, First Data International
Wayne R. SandersRetired Chairman of the Board,Kimberly-Clark Corporation
Ruth J. SimmonsPresident, Brown University
Richard K. TempletonPresident and ChiefExecutive Officer
Christine ToddWhitmanPresident, The WhitmanStrategy Group
Thomas J. EngibousChairman of the Board
Richard K. TempletonPresident and ChiefExecutive Officer
R. Gregory DelagiSenior Vice President
Arthur L. George, Jr.Senior Vice President
Kevin P. MarchSenior Vice President andChief Financial Officer
Michael J. HamesSenior Vice President
Joseph F. HubachSenior Vice President,Secretary andGeneral Counsel
Chung-Shing (C.S.) LeeSenior Vice President
Melendy E. LovettSenior Vice President;President, Education Technology
Gregg A. LoweSenior Vice President
Kevin J. RitchieSenior Vice President
John C. Van ScoterSenior Vice President
Teresa L. WestSenior Vice President
Darla H. WhitakerSenior Vice President
DIRECTORS
EXECUTIVE OFFICERS
TI Fellows announced in 2006:• Masazumi Amagai• Amitava Chatterjee• Theodore W. (Ted) Houston
• Sreenivasan Koduri• Kevin Lyne• Jeanne Krayer Pitz
BOARD OF DIRECTORS, EXECUTIVE OFFICERS AND TI FELLOWS
•••
•••
Texas Instruments IncorporatedP.O. Box 660199
Dallas, TX 75266-0199
www.ti.com
An Equal Opportunity Employer© Texas Instruments Incorporated, 2007
8 Printed in the U.S.A. on recyclable paper
TI-30001H