texas learning and computation center high performance systems lab automatic clustering of grid...
TRANSCRIPT
Texas Learning and Computation CenterTexas Learning and Computation Center
High Performance Systems LabHigh Performance Systems Lab
Automatic Clustering of Grid NodesNov 14, 2005
Qiang Xu, Jaspal Subhlok
University of Houston

Texas Learning and Computation CenterTexas Learning and Computation Center
High Performance Systems LabHigh Performance Systems Lab
Grid Scheduler
Computational Computational Resource Resource
||CPU, memoryCPU, memory
Network Network TopologyTopology
Network Link Network Link ||
Latency, Latency, BandwidthBandwidth
I will decide which I will decide which group of nodes are best group of nodes are best
for an application!!!for an application!!!
Texas Learning and Computation CenterTexas Learning and Computation Center
High Performance Systems LabHigh Performance Systems Lab
Network Topology
• Fine-grained physical network topology --- Hard!
heterogeneous, dynamic, and distributed nature of a grid system
• We focus on the “logical” network topology
logical network topology: the connectivity between nodes based on the observed behavior.
1) Easier to compute
2) Sufficient to tackle the resource selection problem

Texas Learning and Computation CenterTexas Learning and Computation Center
High Performance Systems LabHigh Performance Systems Lab
Discover Clusters/Logical Topology
A set of nodes with IP addresses / hostnames
Connectivity?

Texas Learning and Computation CenterTexas Learning and Computation Center
High Performance Systems LabHigh Performance Systems Lab
Discover Clusters/Logical Topology
Cluster ACluster A
Cluster BCluster B Cluster CCluster C
Dist(A—B)Dist(A—B)
Dist(B—C)Dist(B—C)
Dist(A—C)Dist(A—C)
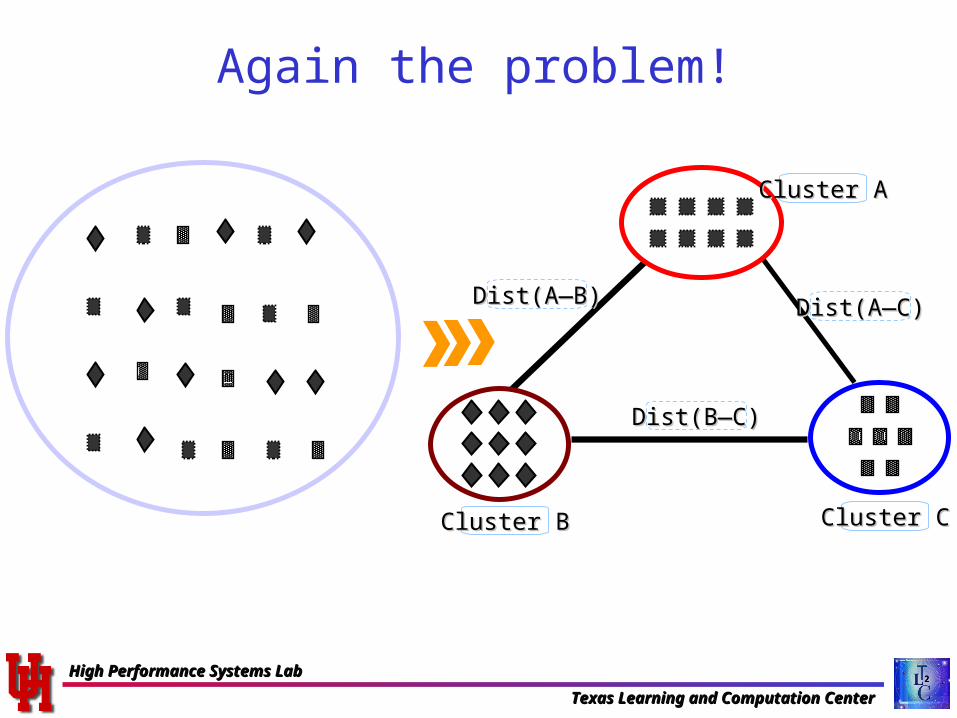
nodes close to each other same cluster

Texas Learning and Computation CenterTexas Learning and Computation Center
High Performance Systems LabHigh Performance Systems Lab
Outline
• Introduction• Internet Geometric Space• Automatic Clustering• Experiments and Result• Conclusion
Texas Learning and Computation CenterTexas Learning and Computation Center
High Performance Systems LabHigh Performance Systems Lab
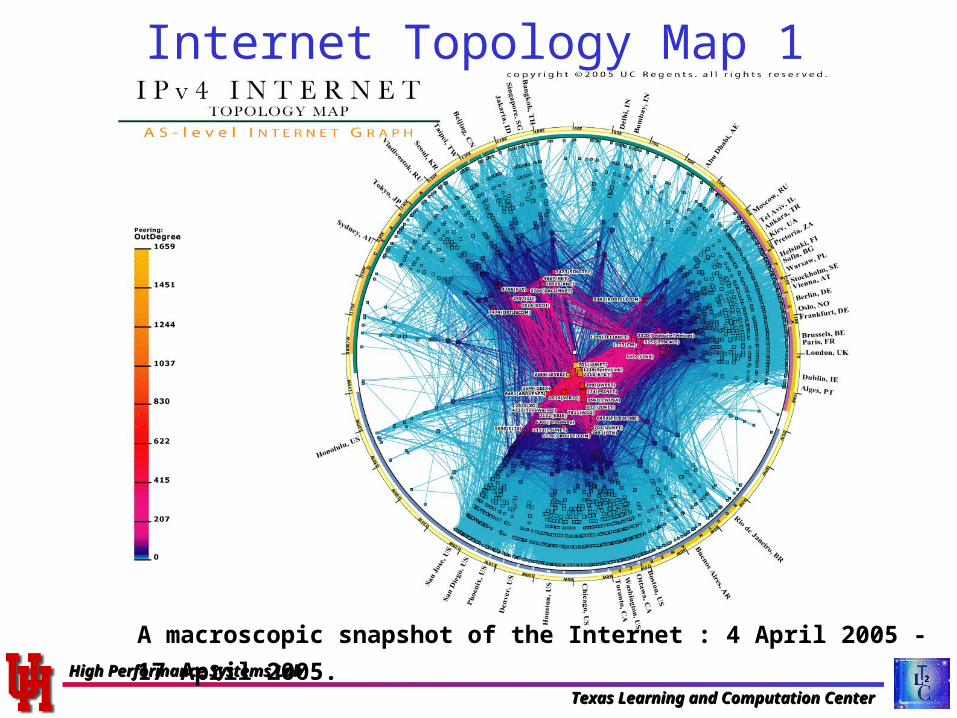
Internet Topology Map 1
A macroscopic snapshot of the Internet : 4 April 2005 - 17 April 2005.
Texas Learning and Computation CenterTexas Learning and Computation Center
High Performance Systems LabHigh Performance Systems Lab
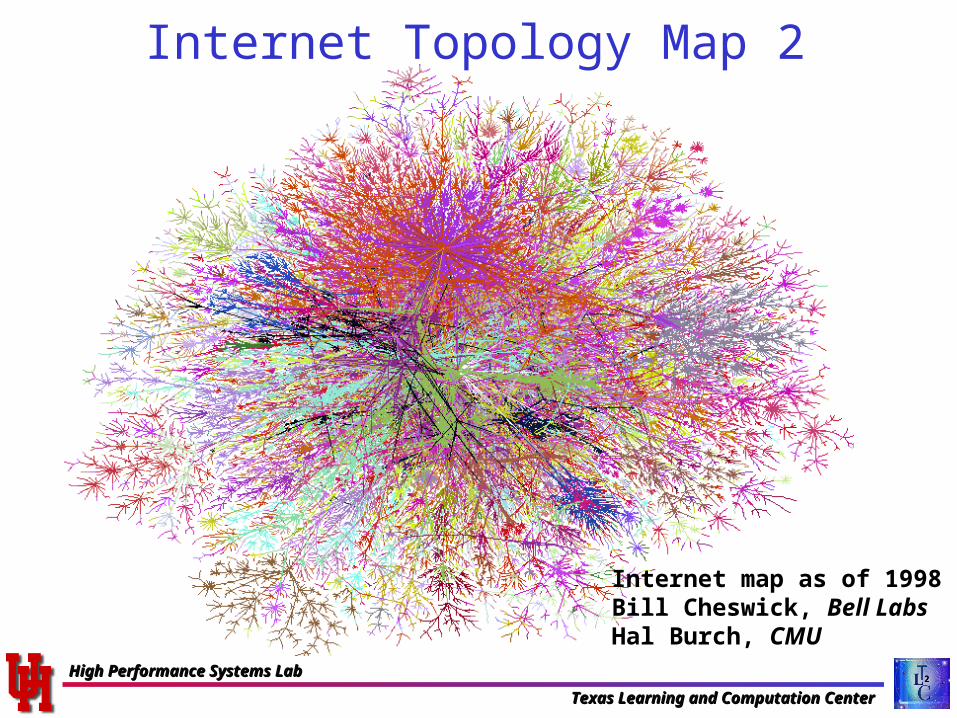
Internet Topology Map 2
Internet map as of 1998 byBill Cheswick, Bell LabsHal Burch, CMU
Texas Learning and Computation CenterTexas Learning and Computation Center
High Performance Systems LabHigh Performance Systems Lab
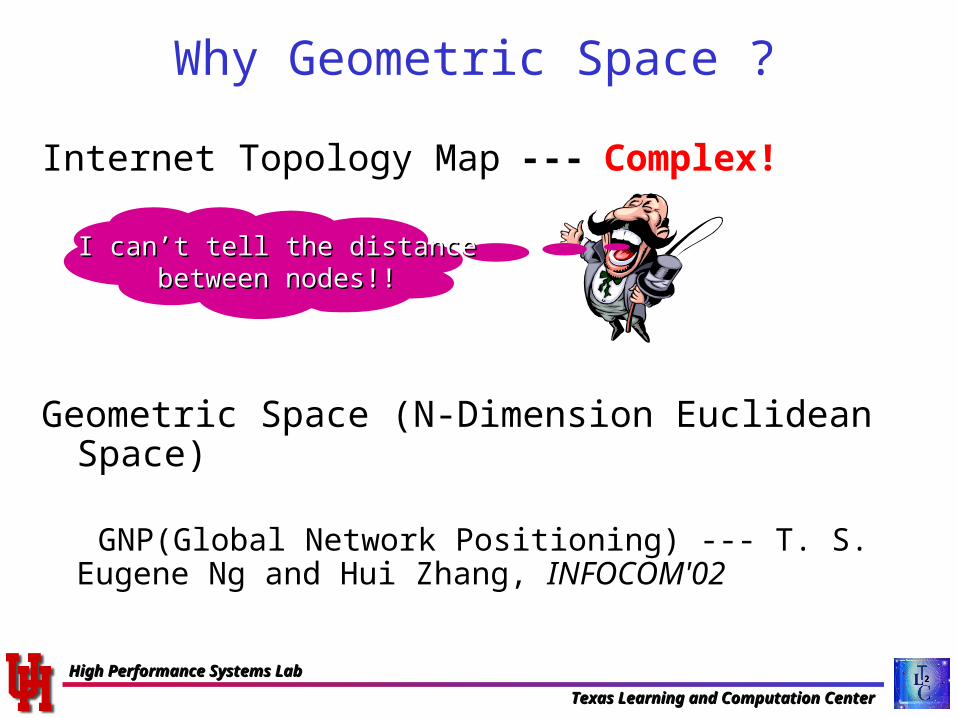
Why Geometric Space ?
Internet Topology Map --- Complex!
Geometric Space (N-Dimension Euclidean Space)
GNP(Global Network Positioning) --- T. S. Eugene Ng and Hui Zhang, INFOCOM'02
I can’t tell the distanceI can’t tell the distancebetween nodes!!between nodes!!

Texas Learning and Computation CenterTexas Learning and Computation Center
High Performance Systems LabHigh Performance Systems Lab
Node1
Node2
Node3
Node4
L-x
L-y
L-z
Magic Landmarks!
Node
Landmark
3
12
8
Landmarks: A set of distributed nodes across the internet
Texas Learning and Computation CenterTexas Learning and Computation Center
High Performance Systems LabHigh Performance Systems Lab
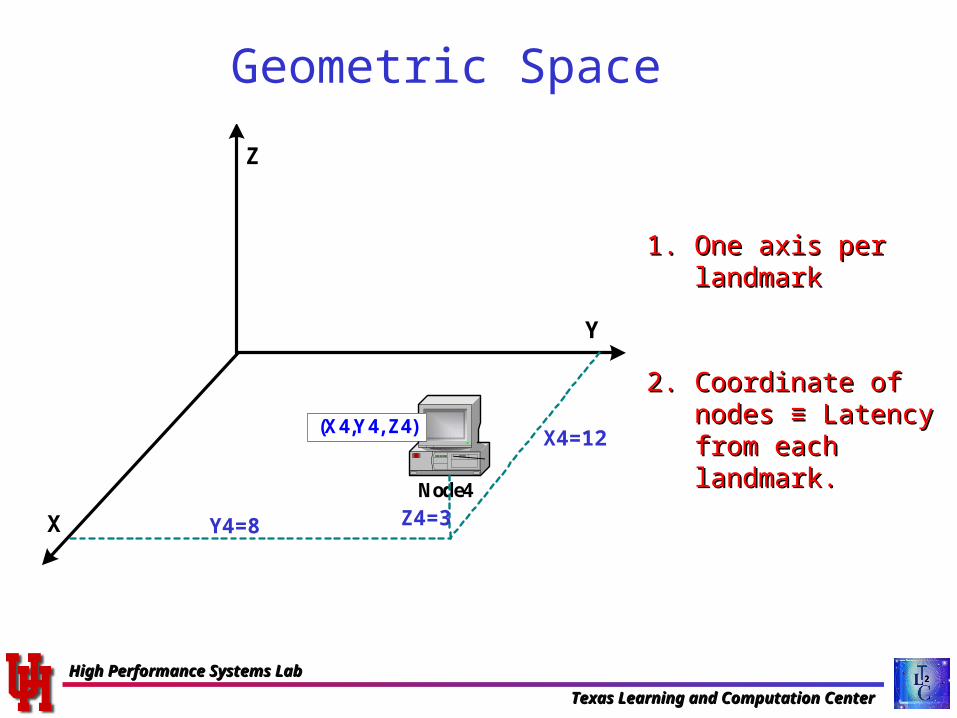
Geometric Space
Node4
X
Y
Z
(X4,Y4, Z4)
1.1. One axis per One axis per landmarklandmark
2.2. Coordinate of Coordinate of nodes nodes ≡≡ Latency Latency from each from each landmark.landmark.
Y4=8
X4=12
Z4=3

Texas Learning and Computation CenterTexas Learning and Computation Center
High Performance Systems LabHigh Performance Systems Lab
Internet Geometric Space
Simple Geometric SpaceSimple Geometric SpaceComplex Internet StructureComplex Internet Structure
Node1
Node2
Node3
Node4
L-x
L-y
L-z Node1
Node2
Node3
Node4
(X1,Y1, Z1)
X
Y
Z (X2,Y2, Z2)
(X3,Y3, Z3)(X4,Y4, Z4)
Texas Learning and Computation CenterTexas Learning and Computation Center
High Performance Systems LabHigh Performance Systems Lab
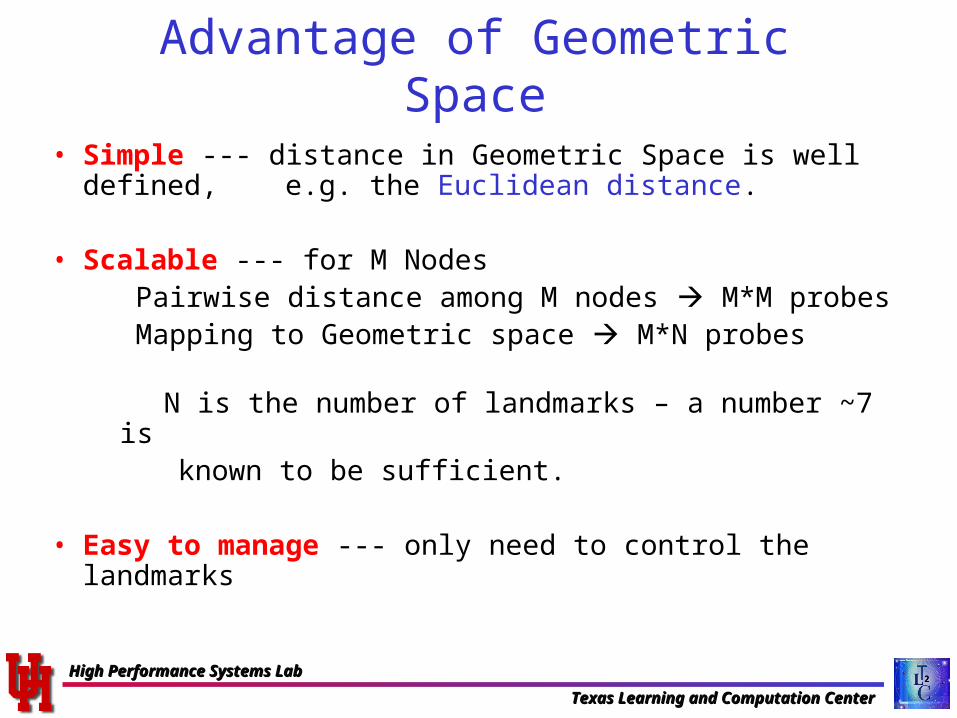
Advantage of Geometric Space
• Simple --- distance in Geometric Space is well defined, e.g. the Euclidean distance.
• Scalable --- for M NodesPairwise distance among M nodes M*M probesMapping to Geometric space M*N probes
N is the number of landmarks – a number ~7 is known to be sufficient.
• Easy to manage --- only need to control the landmarks
Texas Learning and Computation CenterTexas Learning and Computation Center
High Performance Systems LabHigh Performance Systems Lab
Outline
• Introduction• Internet Geometric Space• Automatic Clustering• Experiments and Result• Conclusion
Texas Learning and Computation CenterTexas Learning and Computation Center
High Performance Systems LabHigh Performance Systems Lab
Again the problem!
Cluster ACluster A
Cluster BCluster B Cluster CCluster C
Dist(A—B)Dist(A—B)
Dist(B—C)Dist(B—C)
Dist(A—C)Dist(A—C)

Texas Learning and Computation CenterTexas Learning and Computation Center
High Performance Systems LabHigh Performance Systems Lab
Place Nodes in Geometric Space !
Simple Geometric SpaceSimple Geometric Space
Node1
Node2
Node3
Node4
(X1,Y1, Z1)
X
Y
Z (X2,Y2, Z2)
(X3,Y3, Z3)(X4,Y4, Z4)
How do I cluster?How do I cluster?
Texas Learning and Computation CenterTexas Learning and Computation Center
High Performance Systems LabHigh Performance Systems Lab
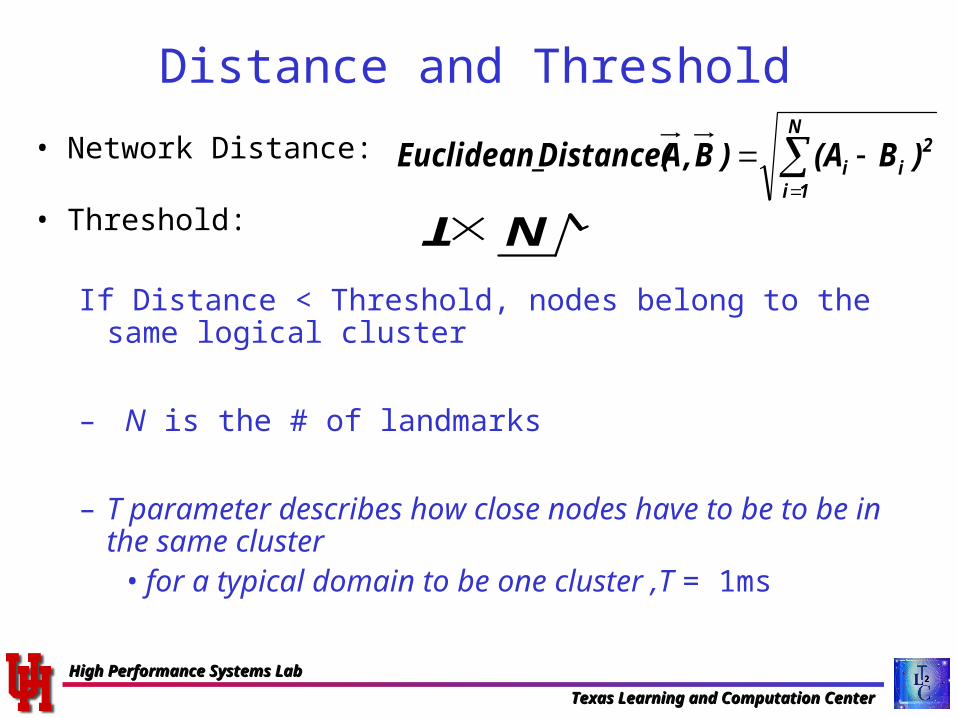
• Network Distance:
• Threshold:
If Distance < Threshold, nodes belong to the same logical cluster
– N is the # of landmarks
– T parameter describes how close nodes have to be to be in the same cluster
• for a typical domain to be one cluster ,T = 1ms
Distance and Threshold
T N
N
1i
2ii )B(A)B,ADistance(Euclidean_

Texas Learning and Computation CenterTexas Learning and Computation Center
High Performance Systems LabHigh Performance Systems Lab
• All grid nodes are graph nodes• Add an edge between nodes if Distance < Threshold
Build Unidirected Graph

Texas Learning and Computation CenterTexas Learning and Computation Center
High Performance Systems LabHigh Performance Systems Lab
• Edge exist if Distance < Threshold
Typical Case
Clusters are Clusters are obvious and obvious and easy to easy to distinguish!distinguish!

Texas Learning and Computation CenterTexas Learning and Computation Center
High Performance Systems LabHigh Performance Systems Lab
Pathological Case• Border Node ?
Where are the clusters?
General Case: Find maximal cliques in the graph – each clique is a cluster

Texas Learning and Computation CenterTexas Learning and Computation Center
High Performance Systems LabHigh Performance Systems Lab
Summary of Inter-domain Clustering
1. Place Nodes in the geometric space.
2. Calculate the Euclidean distance.
3. Build a graph based on distance and Threshold.
4. Find the maximal cliques.
inter-domain clustering --- good!
intra-domain clustering --- not good enough!
Texas Learning and Computation CenterTexas Learning and Computation Center
High Performance Systems LabHigh Performance Systems Lab
Intra-domain clustering
• Nodes in the same domain but in different subnets. • Short latency --- less than 1ms.
• Landmark-based approach --- resolution is not sufficient!
measurement error ~ real latency
We need to change the approach for intra-domain clustering !

Texas Learning and Computation CenterTexas Learning and Computation Center
High Performance Systems LabHigh Performance Systems Lab
Intra-domain Clustering 1. Distance between nodes is directly measured latency
instead of projected geometrical distance. (M × M but M is smaller and measurements are
quick.)
2. Basis for clustering is relative
Distance between any two nodes inside a cluster is within β% of the smallest distance in the cluster.
Texas Learning and Computation CenterTexas Learning and Computation Center
High Performance Systems LabHigh Performance Systems Lab
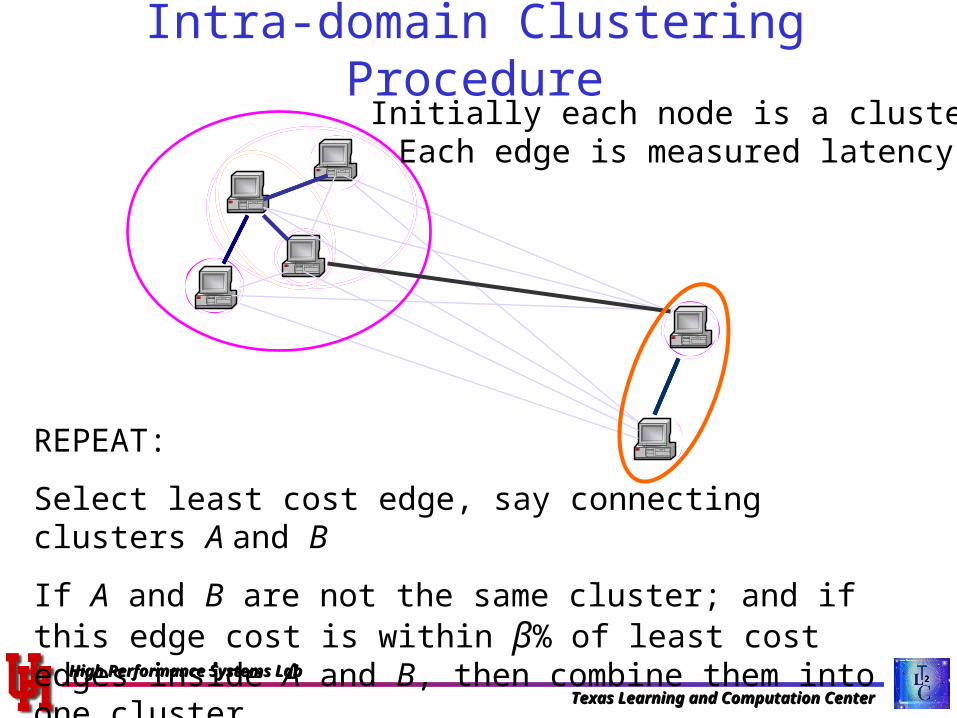
REPEAT:
Select least cost edge, say connecting clusters A and B
If A and B are not the same cluster; and if this edge cost is within β% of least cost edges inside A and B, then combine them into one cluster
Intra-domain Clustering ProcedureInitially each node is a cluster
Each edge is measured latency

Texas Learning and Computation CenterTexas Learning and Computation Center
High Performance Systems LabHigh Performance Systems Lab
Outline
• Introduction• Internet Geometric Space• Automatic Clustering• Experiments and Result• Conclusion
Texas Learning and Computation CenterTexas Learning and Computation Center
High Performance Systems LabHigh Performance Systems Lab
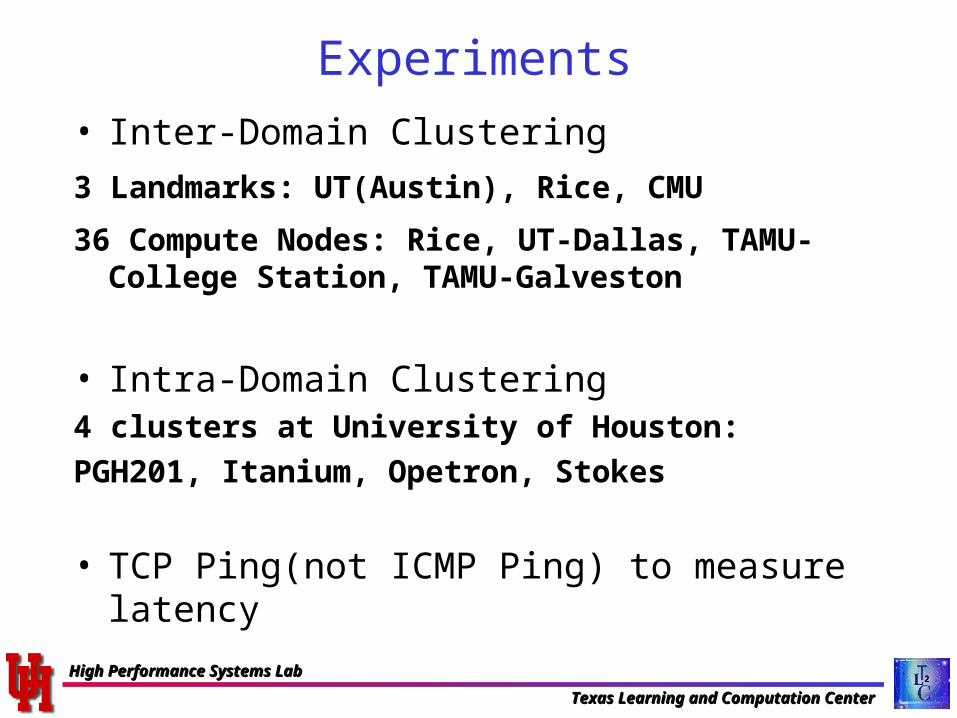
Experiments
• Inter-Domain Clustering
3 Landmarks: UT(Austin), Rice, CMU
36 Compute Nodes: Rice, UT-Dallas, TAMU-College Station, TAMU-Galveston
• Intra-Domain Clustering4 clusters at University of Houston:
PGH201, Itanium, Opetron, Stokes
• TCP Ping(not ICMP Ping) to measure latency

Texas Learning and Computation CenterTexas Learning and Computation Center
High Performance Systems LabHigh Performance Systems Lab
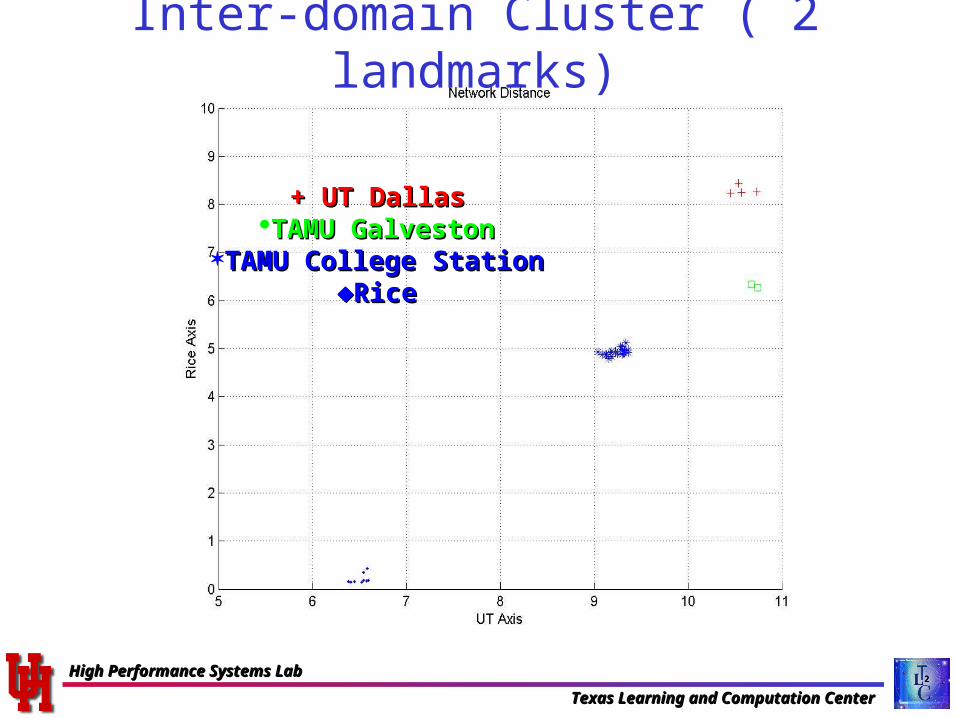
Inter-domain Cluster ( 2 landmarks)
+ UT Dallas + UT Dallas TAMU GalvestonTAMU Galveston
TAMU College StationTAMU College Station RiceRice
CannotCannotdistinguishdistinguishbetween between UT Dallas UT Dallas
&&TAMU TAMU GalvestonGalveston
Texas Learning and Computation CenterTexas Learning and Computation Center
High Performance Systems LabHigh Performance Systems Lab
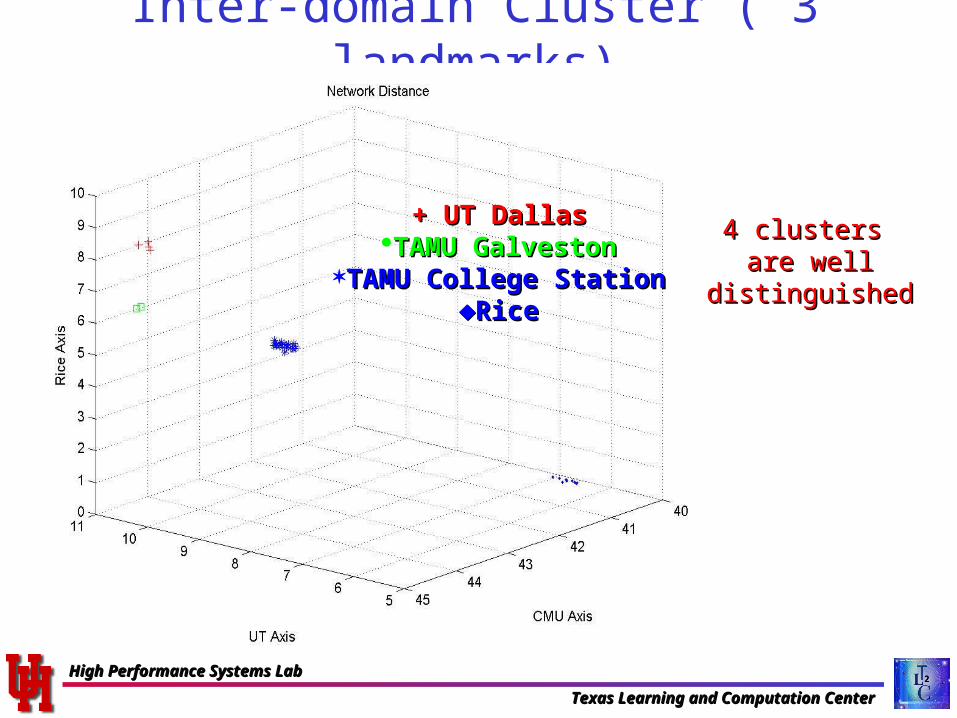
Inter-domain Cluster ( 3 landmarks)
+ UT Dallas + UT Dallas TAMU GalvestonTAMU Galveston
TAMU College StationTAMU College Station RiceRice
4 clusters 4 clusters are wellare well
distinguisheddistinguished
Texas Learning and Computation CenterTexas Learning and Computation Center
High Performance Systems LabHigh Performance Systems Lab
Inter-domain Cluster ( 2 landmarks)
+ UT Dallas + UT Dallas TAMU GalvestonTAMU Galveston
TAMU College StationTAMU College Station RiceRice

Texas Learning and Computation CenterTexas Learning and Computation Center
High Performance Systems LabHigh Performance Systems Lab
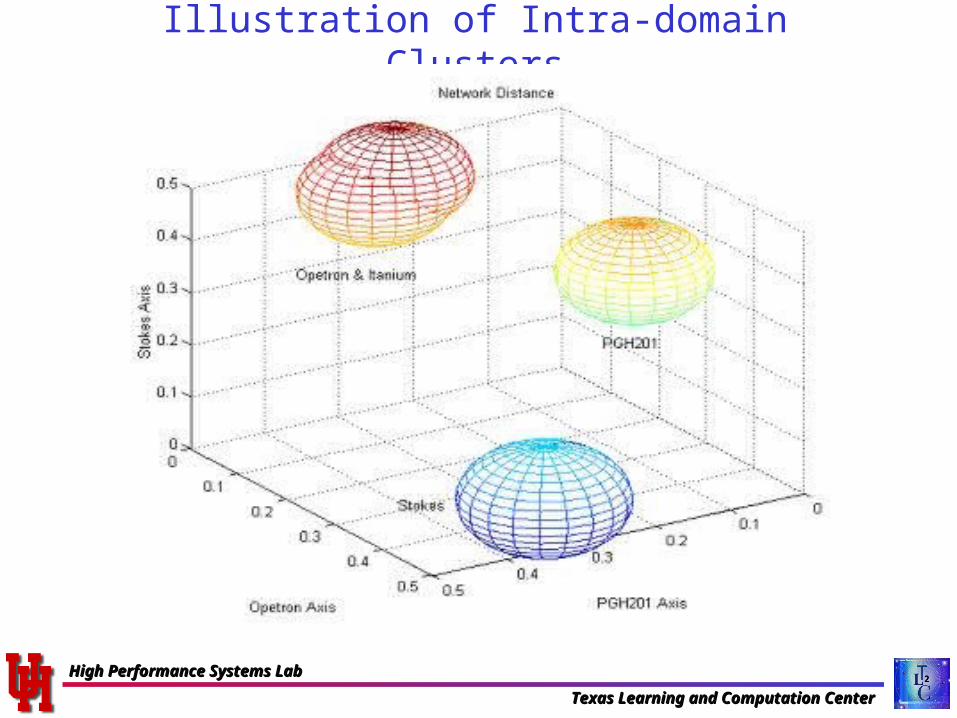
Intra-domain Cluster latency
Clusters PGH201 Opteron Itanium Stokes
PGH201 0.09 0.32 0.32 0.30
Opteron 0.25 0.09 0.09 0.50
Itanium 0.30 0.10 0.10 0.35
Stokes 0.40 0.50 0.60 0.10
Latency between Nodes (ms)
Texas Learning and Computation CenterTexas Learning and Computation Center
High Performance Systems LabHigh Performance Systems Lab
Illustration of Intra-domain Clusters
+ UT Dallas + UT Dallas TAMU GalvestonTAMU Galveston
TAMU College StationTAMU College Station RiceRice
Texas Learning and Computation CenterTexas Learning and Computation Center
High Performance Systems LabHigh Performance Systems Lab
Future Work
• Integrate into a grid scheduling system
• Use Bandwidth as a factor for clustering
• Dynamically update logical clusters
• Nodes behind a NAT (Network address translation) -- nodes with local IP addresses
Texas Learning and Computation CenterTexas Learning and Computation Center
High Performance Systems LabHigh Performance Systems Lab
Conclusions
• Efficient and scalable procedure to hierarchically group distributed nodes into logical clusters
• Validation with experiments on nodes distributed across Texas
• An important step for scheduling in a grid environment.

Texas Learning and Computation CenterTexas Learning and Computation Center
High Performance Systems LabHigh Performance Systems Lab
Questions?
Thank you!Thank you!