texas transportation institute the texas … · nchrp report 350 test 3-11 of the long-span...
TRANSCRIPT

NCHRP REPORT 350 TEST 3-11 OF THE LONG-SPAN GUARDRAIL WITH 5.7 M CLEAR SPAN AND NESTED W-BEAMS OVER 11.4 M by C. Eugene Buth, P.E. Senior Research Fellow D. Lance Bullard, Jr., P.E. Associate Research Engineer and Wanda L. Menges Research Specialist Contract No. T4541-AA Report/Test No. 405160-1-1 Test Date: May 24, 2006 Sponsored by Roadside Safety Research Program Pooled Fund Study No. TPF-5(114) Including the State of Alaska Department of Transportation and Public Facilities, California Department of Transportation, Louisiana Department of Transportation and Development, Minnesota Department of Transportation, Tennessee Department of Transportation, Texas Department of Transportation and Washington State Department of Transportation, and the Federal Highway Administration
July 2006 TEXAS TRANSPORTATION INSTITUTE THE TEXAS A&M UNIVERSITY SYSTEM COLLEGE STATION, TEXAS 77843

DISCLAIMER The contents of this report reflect the views of the authors who are solely responsible for the facts and accuracy of the data, and the opinions, findings and conclusions presented herein. The contents do not necessarily reflect the official views or policies of Alaska Department of Transportation and Public Facilities, California Department of Transportation (Caltrans), Louisiana Department of Transportation and Development, Minnesota Department of Transportation, Tennessee Department of Transportation, Texas Department of Transportation, Washington State Department of Transportation, the Federal Highway Administration, The Texas A&M University System or Texas Transportation Institute. This report does not constitute a standard, specification, or regulation. In addition, the above listed agencies assume no liability for its contents or use thereof. The names of specific products or manufacturers listed herein does not imply endorsement of those products or manufacturers.
KEY WORDS Guardrail, longitudinal barrier, culvert, w-beam, nested, long-span, crash testing, roadside safety.

Technical Report Documentation Page 1. Report No.
2. Government Accession No.
3. Recipient's Catalog No. 5. Report Date July 2006
4. Title and Subtitle
NCHRP REPORT 350 TEST 3-11 OF THE LONG-SPAN GUARDRAIL WITH 5.7 M CLEAR SPAN AND
ESTED W-BEAMS OVER 11.4 M N
6. Performing Organization Code
7. Author(s) C. Eugene Buth, D. Lance Bullard, Jr., and Wanda L. Menges
8. Performing Organization Report No. 405160-1-1 10. Work Unit No. (TRAIS)
9. Performing Organization Name and Address Texas Transportation Institute The Texas A&M University System College Station, Texas 77843-3135
11. Contract or Grant No. T4541-AA 13. Type of Report and Period Covered Test Report: January – June 2006
1 2. Sponsoring Agency Name and Address
Lead Contact Agency: Washington State Department of Transportation Transportation Building, MS: 47372 O lympia, Washington, 98504-7372
14. Sponsoring Agency Code Study No. TPF-5(114)
15. Supplementary Notes Research Study Title: Long Span Guardrail Installation Name of Contacting Representative: Dick Albin 16. Abstract The objective of this project was to develop a long-span guardrail design that meets NCHRP Report 350 evaluation criteria and is less expensive to construct than the existing design. The researchers reviewed design details of the long-span guardrails previously developed, especially the design presented by Mak, to evaluate expected behavior of the guardrail when subjected to NCHRP Report 350 tests. Design features that have been found to be important in terms of capacity of the guardrail to contain and redirect a vehicle are the structural strength and geometrics of the guardrail. Lateral stiffness of the guardrail system is the primary design feature that determines maximum deflection of the guardrail during a collision and changes in lateral stiffness of the guardrail system along its length are the key features influencing pocketing of the vehicle. The BARRIER VII computer program was used to evaluate expected performance of the proposed design in NCHRP Report 350 tests. This program models a collision in two dimensions with a simple characterization of a vehicle and a detailed characterization of the guardrail. It was used to evaluate the expected deflections of the barrier and to predict any potential of the barrier to allow any unacceptable pocketing of the vehicle. Reported herein are the details and results of the full-scale crash test performed on the long-span guardrail. The rail element ruptured and allowed the vehicle to penetrate the rail system. The vehicle subsequently rolled onto its side. Therefore, the rail failed evaluation criteria for NCHRP Report 350 test 3-11. The abrupt change in stiffness of the rail element where it changes from two layer of W-beam (nested) to a single layer may have contributed to rupture of the single layer rail element. 17. Key Words Guardrail, longitudinal barrier, culvert, w-beam,
ested, long-span, crash testing, roadside safety n
18. Distribution Statement Copyrighted. Not to be copied or reprinted without consent from Sponsor.
19. Security Classif.(of this report) Unclassified
20. Security Classif.(of this page) Unclassified
21. No. of Pages
54
22. Price
Form DOT F 1700.7 (8-72) Reproduction of completed page authorized

ACKNOWLEDGMENTS
This research project was performed under a pooled fund program between the State of Alaska Department of Transportation and Public Facilities, California Department of Transportation (Caltrans), Louisiana Department of Transportation and Development, Minnesota Department of Transportation, Tennessee Department of Transportation, Texas Department of Transportation and Washington State Department of Transportation, and the Federal Highway Administration. The authors acknowledge and appreciate their guidance and assistance.
Roadside Safety Research Pooled Fund Committee
CONTACTS Revised August 8, 2005
ALASKA Elmer E. Marx, PE Technical Engineer II State of Alaska Department of Transportation and Public Facilities 3132 Channel Drive Room 100 Juneau AK 99801 (907) 465-6941 [email protected] Clint Adler, P.E. Research Engineer Alaska Department of Transportation and Public Facilities Research and Technology Transfer 2301 Peger Road Fairbanks, AK 99709 (907-451-5321 [email protected] Kurt Smith, P.E. Statewide Traffic & Safety Engineer Alaska Department of Transportation & Public Facilities 3132 Channel Drive, Juneau, AK 99801-7898 (907) 465-6963 [email protected]
CALIFORNIA John Jewell, P.E. Caltrans Office of Materials and Infrastructdure Division of Research and Innovation 5900 Folsom Blvd Sacramento, CA 95819 (916) 227-5824 (916) 227-5856 [email protected] Gary Gauthier, PE Sr. Roadside Safety Engineer Office of Materials and Infrastructure Reesarch Caltrans Division of Research and Innovation 1101 R St. Sacramento, CA 95814 [email protected] LOUISIANA Paul Fossier Bridge and Structural Design Section P.O. Box 94245 Baton Rouge, LA 79084-9245 (225)379-1323 [email protected]
v

Harold “Skip” Paul Associate Director, Research Louisiana Transportation Center 4101 Gourrier Ave. Baton Rouge, LA 70808 225-767-9102 [email protected] MINNESOTA Michael Elle, P.E. Design Standards Engineer 395 John Ireland Blvd, M.S. 696 St. Paul, Mn 55155 (651) 296-4859 [email protected] James Klessig, Pooled Fund Manager Minnesota Department of Transportation Office of Investment Management Research Services Section MS330 395 John Ireland Blvd. St. Paul, MN55155 [email protected] TENNESSEE Jeff Jones, Director, Design Division Tennessee Department of Transportation Suite 1300, James K. Polk Bldg. Nashville, Tennessee 37243-0348 (615) 741-2221 [email protected] Nancy W. Sartor Manager Office of Research Suite 900 James K. Polk State Office Building Nashville, TN 37243-0334 Voice: 615-741-5789 FAX: 615-532-8451 [email protected]
TEXAS Mark A. Marek Design Division Texas DOT 125 East Eleventh Street Austin, Texas 78701-2483 (512) 416-2653 [email protected] Charmaine Richardson [email protected] WASHINGTON Dick Albin, Chair Assistant State Design Engineer-NW Region Washington State Department of Transportation (360) 705-7451 [email protected] Rhonda Brooks, Research Manager Washington State Department of Transportation P.O. Box 47372 Olympia, WA 98504-7372 (360) 705-7945 [email protected] FEDERAL HIGHWAYS ADMINISTRATION Martin Hargrave U.S. Department of Transportation FEDERAL HIGHWAY ADMINISTRATION Turner-Fairbank Highway Research Center Mail Code: HRDS-04 6300 Georgetown Pike McLean, VA 22101 (202) 493-3311 [email protected]
vi

TEXAS TRANSPORTATION INSTITUTE D. Lance Bullard, Jr., P.E. Safety and Structural Systems Division Texas Transportation Institute Texas A&M University System College Station, TX 77843-3135 [email protected] Gene Buth, Senior Research Engineer Safety and Structural Systems Division Texas Transportation Institute Texas A&M University System College Station, TX 77843-3135 [email protected](979) 845-6159 Roger P. Bligh Associate Research Engineer Texas Transportation Institute Texas A&M University System College Station, TX 77843-3135 [email protected](979) 845-4377
vii


TABLE OF CONTENTS Section Page INTRODUCTION .......................................................................................................................... 1
PROBLEM.................................................................................................................................. 1 BACKGROUND ........................................................................................................................ 1 OBJECTIVES/SCOPE OF RESEARCH ................................................................................... 1
TECHNICAL DISCUSSION ......................................................................................................... 3
TEST PARAMETERS................................................................................................................ 3 Test Facility ............................................................................................................................ 3 Test Article – Design and Construction.................................................................................. 3 Test Conditions ....................................................................................................................... 3 Evaluation Criteria ................................................................................................................ 10
CRASH TEST 405160-1-1 (NCHRP REPORT 350 TEST NO. 3-11)..................................... 11 Test Vehicle .......................................................................................................................... 11 Soil and Weather Conditions ................................................................................................ 11 Impact Description................................................................................................................ 11 Damage to Test Article ......................................................................................................... 14 Vehicle Damage.................................................................................................................... 14 Occupant Risk Factors .......................................................................................................... 14
SUMMARY AND CONCLUSIONS ........................................................................................... 21
ASSESSMENT OF TEST RESULTS...................................................................................... 21 CONCLUSIONS....................................................................................................................... 23
REFERENCES ............................................................................................................................. 25 APPENDIX A. CRASH TEST PROCEDURES AND DATA ANALYSIS .............................. 27
ELECTRONIC INSTRUMENTATION AND DATA PROCESSING ................................... 27 ANTHROPOMORPHIC DUMMY INSTRUMENTATION................................................... 28 PHOTOGRAPHIC INSTRUMENTATION AND DATA PROCESSING ............................. 28 TEST VEHICLE PROPULSION AND GUIDANCE.............................................................. 28
APPENDIX B. TEST VEHICLE PROPERTIES AND INFORMATION ................................. 29 APPENDIX C. SEQUENTIAL PHOTOGRAPHS ..................................................................... 33 APPENDIX D. VEHICLE ANGULAR DISPLACEMENTS AND ACCELERATIONS......... 33
ix

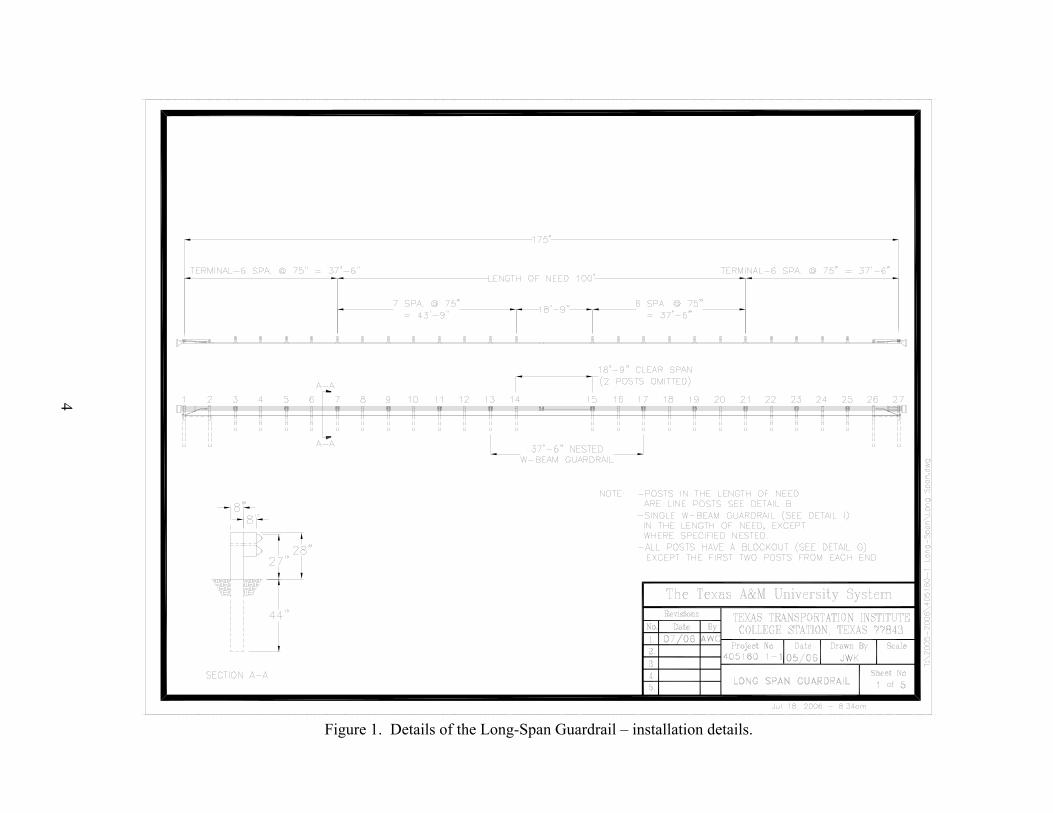
LIST OF FIGURES Page Figure 1. Details of the Long-Span Guardrail – installation details. ............................................. 4 Figure 2. Details of the Long-Span Guardrail – terminal details................................................... 5 Figure 3. Details of the Long-Span Guardrail – post details. ........................................................ 6 Figure 4. Details of the Long-Span Guardrail – strut and blockout details. .................................. 7 Figure 5. Details of the Long-Span Guardrail – W-beam details. ................................................. 8 Figure 6. Long-Span Guardrail prior to testing. ............................................................................ 9 Figure 7. Vehicle/installation geometrics for test 405160-1-1. ................................................... 12 Figure 8. Vehicle before test 405160-1-1. ................................................................................... 13 Figure 9. Vehicle trajectory path after test 405160-1-1. .............................................................. 15 Figure 10. Installation after test 405160-1-1................................................................................ 16 Figure 11. Vehicle after test 405160-1-1. .................................................................................... 17 Figure 12. Interior of vehicle for test 405160-1-1. ...................................................................... 18 Figure 13. Summary of results for NCHRP Report 350 test 3-11
on the Long-Span Guardrail........................................................................................ 19 Figure 14. Vehicle properties for test 405160-1-1....................................................................... 29 Figure 15. Sequential photographs for test 405160-1-1 (overhead and frontal views). .............. 33 Figure 16. Vehicle angular displacements for test 405160-1-1. .................................................. 35 Figure 17. Vehicle longitudinal accelerometer trace for test 405160-1-1
(accelerometer located at center of gravity)................................................................ 36 Figure 18. Vehicle lateral accelerometer trace for test 405160-1-1
(accelerometer located at center of gravity)................................................................ 37 Figure 19. Vehicle vertical accelerometer trace for test 405160-1-1
(accelerometer located at center of gravity)................................................................ 38 Figure 20. Vehicle longitudinal accelerometer trace for test 405160-1-1
(accelerometer located over rear axle). ....................................................................... 39 Figure 21. Vehicle lateral accelerometer trace for test 405160-1-1
(accelerometer located over rear axle). ....................................................................... 40 Figure 22. Vehicle vertical accelerometer trace for test 405160-1-1
(accelerometer located over rear axle). ....................................................................... 41
x

LIST OF TABLES Page Table 1. Performance evaluation summary for NCHRP Report 350 test 3-11
on the Long-Span Guardrail........................................................................................... 24 Table 2. Exterior crush measurements for test 405160-1-1. ........................................................ 30 Table 3. Occupant compartment measurements for test 405160-1-1. ......................................... 31
xi


INTRODUCTION PROBLEM There are many instances where it is difficult to install guardrail posts at the normal 1.905 m (6.25 ft) spacing due to underground obstacles, such as culverts. Previously, designs for omitting 1 or 2 (3.8 to 5.7 m (12.5 to 18.75 ft) span) posts were crash tested in accordance with the National Cooperative Highway Research Report (NCHRP) Report 230 criteria. (1) These designs required 7.6 to 11.4 m (25 ft to 37.5 ft) of nested rail to compensate for the increased post spacing. A design that omitted 3 posts (7.6 m (25 ft) span) was tested in accordance with NCHRP Report 350. (2,3) This design was much more complex, requiring 30.5 m (100 ft) of nested rail, CRT posts at a reduced spacing on each side of the long span, and deeper blockouts. This NCHRP Report 350 design may be over-designed for locations where only one or two posts need to be omitted. BACKGROUND In 1992, Mak, Bligh, Gripne and McDevitt reported on a study of long span guardrails with wood posts and offset blocks. (2) They used a BARRIER VII program in a computer simulation study of several proposed designs of guardrails for spanning culverts. The “best” design identified in the computer study was a nested W-beam with post(s) omitted over the culvert. The nested W-beam guardrail with span lengths of 3.8 m (12.5 ft) and 5.7 m (18.75 ft) were subjected to full-scale tests using 2041 kg (4500 lb) automobiles in accordance with NCHRP Report 230 and met the associated evaluation criteria. A 7.6 m (25 ft) length of nested W-beam was used in the 3.8 m (12.5 ft) long span design, and 11.4 m (37.5 ft) length of nested W-beam was used in the 5.7 m (18.75 ft) long span design. In 1999, Polivka, et.al. reported on design and testing of a 7.6 m (25 ft) long span W-beam guardrail that made use of six CRT posts adjacent to the long span. (4,5) Double depth offset blocks were used on the CRT posts and nested W-beam was used over a 30.5 m (100 ft) length. The design was tested with a 2000 kg (4400 lb) pickup in accordance with NCHRP Report 350 and satisfactorily met the evaluation criteria. OBJECTIVES/SCOPE OF RESEARCH The objective of this project was to develop a long-span guardrail design that meets NCHRP Report 350 evaluation criteria and is less expensive to construct than the existing design. The researchers reviewed design details of the long-span guardrails previously developed, especially the design presented by Mak(2), to evaluate expected behavior of the guardrail when subjected to NCHRP Report 350 tests. Design features that have been found to be important in terms of capacity of the guardrail to contain and redirect a vehicle are the
1

structural strength and geometrics of the guardrail. Lateral stiffness of the guardrail system is the primary design feature that determines maximum deflection of the guardrail during a collision and changes in lateral stiffness of the guardrail system along its length are the key features influencing pocketing of the vehicle. The BARRIER VII computer program was used to evaluate expected performance of the proposed design in NCHRP Report 350 tests. This program models a collision in two dimensions with a simple characterization of a vehicle and a detailed characterization of the guardrail. It was used to evaluate the expected deflections of the barrier and to predict any potential of the barrier to allow any unacceptable pocketing of the vehicle. Reported herein are the details and results of the full-scale crash test performed on the long-span guardrail. Details of the installation and the test parameters are reported in the Technical Discussion, as well as the description of the test and the results. An assessment of the test results is given in the Summary and Conclusions.
2

3
TECHNICAL DISCUSSION TEST PARAMETERS Test Facility The test facilities at the Texas Transportation Institute’s Proving Ground consist of a 809-hectare complex of research and training facilities situated 16 km northwest of the main campus of Texas A&M University. The site, formerly an Air Force Base, has large expanses of concrete runways and parking aprons well suited for experimental research and testing in the areas of vehicle performance and handling, vehicle-roadway interaction, durability and efficacy of highway pavements, and safety evaluation of roadside safety hardware. The site selected for the installation of the long-span guardrail is along a wide out-of-service runway/apron. The runway/apron consists of an unreinforced jointed concrete pavement in 3.8 m by 4.6 m blocks nominally 203-305 mm deep. The aprons and runways are about 50 years old and the joints have some displacement, but are otherwise flat and level. Test Article – Design and Construction The test article consisted of 30.5 m (100 ft) of standard wood post W-beam guardrail (G4-2W)with 11.4 m (37.5 ft) long ET PLUS terminals installed on each end making the total installation length 45.7 m (150 ft). Two posts were omitted near mid length of the installation making a long span of 5.7 m (18 ft -9 inches). Nested W-beam (two layers) was installed over a length of 11.4 m (37 ft – 6 inches). The nested beam included the 5.7 m (18 ft – 9 inch) long span plus a 1.9 m (6 ft – 3 inch) span downstream and two 1.9 m (6 ft – 3 inch) spans upstream. Height to the top of the rail element was 686 mm (27 inches). Test Conditions According to NCHRP Report 350, two tests are recommended to evaluate longitudinal barriers to test level three (TL-3) and are as described below.
NCHRP Report 350 Test Designation 3-10: 820 kg vehicle impacting the length of need section at a speed of 100 km/h and an angle of 20 degrees. NCHRP Report 350 Test Designation 3-11: 2000 kg pickup truck impacting the length of need section at a speed of 100 km/h and an angle of 25 degrees.
The small car test is performed for evaluating the general overall performance characteristics of the length of need section of a longitudinal barrier and occupant risk in particular. The pickup truck test is performed for the purpose of evaluating the ability of the barrier section to contain and redirect the vehicle. Occupant risk and vehicle stability are a
4
Figure 1. Details of the Long-Span Guardrail – installation details.

5
Figure 2. Details of the Long-Span Guardrail – terminal details.

Figure 3. Details of the Long-Span Guardrail – post details.
6

7
Figure 4. Details of the Long-Span Guardrail – strut and blockout details.

8
Figure 5. Details of the Long-Span Guardrail – W-beam details.

Figure 6. Long-Span Guardrail prior to testing.
9
concern in the evaluation of both these tests. Test 3-11 was performed in this study. The target impact location was 953 mm downstream of post 13, which was determined from BARRIER VII simulations to be the critical impact point for the long-space system.. The crash test and data analysis procedures were in accordance with guidelines presented in NCHRP Report 350. Appendix A presents brief descriptions of these procedures. Evaluation Criteria The crash test was evaluated in accordance with the criteria presented in NCHRP Report 350. As stated in NCHRP Report 350, “Safety performance of a highway appurtenance cannot be measured directly but can be judged on the basis of three factors: structural adequacy, occupant risk, and vehicle trajectory after collision.” Safety evaluation criteria from table 5.1 of NCHRP Report 350 were used to evaluate the crash test reported herein.
10

CRASH TEST 405160-1-1 (NCHRP REPORT 350 TEST NO. 3-11) Test Vehicle A 2000 Chevrolet C2500 pickup truck, shown in figures 7 and 8, was used for the crash test. Test inertia weight of the vehicle was 2143 kg, and its gross static weight was 2220 kg. The height to the lower edge of the vehicle front bumper was 415 mm, and the height to the upper edge of the front bumper was 635 mm. Additional dimensions and information on the vehicle are given in appendix B, figure 14. The vehicle was directed into the installation using the cable reverse tow and guidance system, and was released to be free-wheeling and unrestrained just prior to impact. Soil and Weather Conditions The crash test was performed the morning of May 25, 2006. No rainfall was recorded for the ten days prior to the test. Moisture content of the NCHRP Report 350 soil in which the test article was installed was 6.5 percent. Weather conditions at the time of testing were: Wind speed: 20 km/h; wind direction: 335 degrees with respect to the vehicle (vehicle was traveling in a southwesterly direction); temperature: 29 ºC. Impact Description The 2000 Chevrolet C2500 pickup truck, traveling at an impact speed of 100.5 km/h, impacted the long-span guardrail 953 mm downstream of post 13 at an impact angle of 24.8 degrees. At approximately 0.029 s, post 13 began to deflect towards the field side, and at 0.061 s, post 14 began to deflect towards field side. The vehicle began to redirect at 0.069 s. At 0.086 s, post 12 began to deflect towards field side, and at 0.115 s, post 15 began to deflect towards field side. The front of the vehicle reached post 14 at 0.179 s. At 0.193 s, post 16 began to deflect towards field side, and at 0.223 s, post 17 began to deflect towards field side. The front of the vehicle reached post 15 at 0.257 s. At 0.286 s, the vehicle began to travel parallel with the rail and was traveling at a speed of 72.3 km/h. The rail ruptured at post 13, where the section changed from nested to single layer, at 0.291 s. The front of the vehicle reached post 16 and 17 at 0.343 s and 0.443 s, respectively. The vehicle then began to roll clockwise and reached 90 degrees at 1.564 s after impact. After rolling onto its side, the vehicle then righted itself and landed on its wheels at 2.953 s. The vehicle came to rest upright 4.1 m toward the field side of the installation behind post 23. Sequential photographs of the test period are shown in appendix C, figure 15.
11

Figure 7. Vehicle/installation geometrics for test 405160-1-1.
12

Figure 8. Vehicle before test 405160-1-1.
13

Damage to Test Article Damage to the installation is shown in figures 9 and 10. The rail ruptured at post 13, where the section changed from nested to single layer. Posts 1 and 2 were disturbed, post 3 was pulled downstream 10 mm, and posts 4-5 were disturbed. Posts 6 and 7 were pulled upstream 10 mm, and posts 8 through 10 were disturbed and post 10 was partially split longitudinally. Posts 11 and 12 were pulled toward field side 100 mm and 540 mm, respectively. Post 13 through 19 fractured at ground level and posts 14 through 18 were separated from the rail element. Post 14 was resting 3.8 m on the traffic side forward of the traffic face of the rail. The rail element was also separated from posts 20 through 25, but remained attached to post 26. The blockouts were separated from posts 21, 23 and 24. Post 25 was split longitudinally. Prior to exiting the view of the overhead camera, the working width was 4.1 m. Prior to rupture of the rail element, the maximum deflection of the rail was 1.45 m. Vehicle Damage The vehicle sustained damage to the right side of the vehicle as shown in figure 11. The right upper and lower A-arm and right side frame rail were deformed. Also damaged were the front bumper, hood, grill, right front quarter panel, right door, right exterior bed, and right rear bumper. Maximum exterior crush to the vehicle was 540 mm in the frontal plane just to the right of centerline at bumper height. Maximum occupant compartment deformation was 16 mm in the right floor pan to instrument panel area. Photographs of the interior of the vehicle are shown in figure 12. Exterior vehicle crush and occupant compartment measurements are shown in appendix B, tables 2 and 3. Occupant Risk Factors Data from the triaxial accelerometer, located at the vehicle center of gravity, were digitized to compute occupant impact velocity and ridedown accelerations. Only the occupant impact velocity and ridedown accelerations in the longitudinal axis are required from these data for evaluation of criterion L of NCHRP Report 350. In the longitudinal direction, occupant impact velocity was 7.0 m/s at 0.224 s, maximum 0.010-s ridedown acceleration was -10.1 g’s from 0.621 to 0.631 s, and the maximum 0.050-s average was -5.5 g’s between 0.580 and 0.630 s. In the lateral direction, the occupant impact velocity was 3.0 m/s at 0.224 s, the highest 0.010-s occupant ridedown acceleration was -6.3 g’s from 0.272 to 0.282 s, and the maximum 0.050-s average was -3.1 g’s between 0.154 and 0.204 s. These data and other information pertinent to the test are presented in figure 13. Vehicle angular displacements and accelerations versus time traces are shown in appendix D, figures 16 through 22.
14

Figure 9. Vehicle trajectory path after test 405160-1-1.
15

Figure 10. Installation after test 405160-1-1.
16

17
Figure 11. Vehicle after test 405160-1-1.

Before test
Figu -1.
After test
re 12. Interior of vehicle for test 405160-1
18

19
19
0.000 s 0.147 s 0.294 s 0.441 s
Ge l Information gency............................... o. .................................... ......................................... Te icle T ......................................... ......................................... Installation Length (m) ............... Material or Key Elements ..........
e and Condition............. Test Vehicle Type........................................... Designation................................ Model ......................................... Mass (kg) Curb........................................ Test Inertial............................. Dummy ................................... Gross Static............................
Texas Transportation Institute 405160-1-1 05-25-2006 Guardrail Long-Span Guardrail 45.7 Nested W-beam over 18 ft–9 inch long span plus a 6 ft–3 inch span downstream and two 6 ft-3 inch spans upstream Standard Soil, Dry Production 2000P 2000 Chevrolet C2500 Pickup Truck 2153 2143 77 2220
Impact Conditions Speed (km/h) ............................. Angle (deg) ................................ Exit Conditions Speed (km/h) ............................. Angle (deg) ................................ Occupant Risk Values Impact Velocity (m/s) Longitudinal ............................ Lateral .................................... THIV (km/h) ............................... Ridedown Accelerations (g’s) Longitudinal ............................ Lateral .................................... PHD (g’s) ................................... ASI ............................................ Max. 0.050-s Average (g’s) Longitudinal ............................ Lateral .................................... Vertical ...................................
100.5 24.8 N/A N/A 7.0 3.0 24.2 -10.1 -6.3 10.1 0.54 -5.5 -3.1 4.2
Test Article Deflections (m) Dynamic ......................................... Permanent...................................... Working Width ................................Vehicle Damage Exterior VDS............................................. CDC ............................................ Max. Exterior Vehicle Crush (mm) ................. Interior OCDI ........................................... Max. Occupant Compartment Deformation (mm) ....................Post-Impact Behavior (during 1.0 sec after impact) Max. Yaw Angle (deg)................. Max. Pitch Angle (deg)................ Max. Roll Angle (deg) .................
4.1 01RFQ5 01RFEW4 540 RF0002000 16 -250 -9 100
Figure 13. Summary of results for NCHRP Report 350 test 3-11 on the Long-Span Guardrail.
neraTest ATest NDate ..st Artype..
Name
Soil Typ
Rail Ruptured Rail Ruptured


SUMMARY AND CONCLUSIONS ASSESSMENT OF TEST RESULTS An assessment of the test based on the following applicable NCHRP Report 350 safety evaluation criteria.
Structural Adequacy A. Test article should contain and redirect the vehicle; the vehicle should not
penetrate, underride, or override the installation although controlled lateral deflection of the test article is acceptable.
Results: The Long-Span Guardrail did not contain or redirect the vehicle. The
vehicle penetrated the rail element with a maximum dynamic deflection of 1.45 m before the rail ruptured. (FAIL)
Occupant Risk
D. Detached elements, fragments, or other debris from the test article should not penetrate or show potential for penetrating the occupant compartment, or present an undue hazard to other traffic, pedestrians, or personnel in a work zone. Deformation of, or intrusions into, the occupant compartment that could cause serious injuries should not be permitted.
Results: Some of the posts fractured and post 14 was resting 3.8 m on the traffic
side of the rail. These debris did not penetrate nor show potential for penetrating the occupant compartment. Maximum occupant compartment deformation was 16 mm in the right floor pan to instrument panel area. (PASS)
F. The vehicle should remain upright during and after collision although
moderate roll, pitching, and yawing are acceptable. Results: The vehicle rolled 90 degrees and then came to rest upright. (FAIL)
Vehicle Trajectory K. After collision, it is preferable that the vehicle’s trajectory not intrude into
adjacent traffic lanes. Result: The vehicle did not intrude into adjacent traffic lanes as it came to rest on
the field side of the installation. (PASS) L. The occupant impact velocity in the longitudinal direction should not exceed
12 m/s and the occupant ridedown acceleration in the longitudinal direction should not exceed 20 g’s.
21

Result: Longitudinal occupant impact velocity was 7.0 m/s, and the longitudinal ridedown acceleration was -10.1 g. (PASS)
M. The exit angle from the test article preferably should be less than 60 percent
of the test impact angle, measured at time of vehicle loss of contact with the test device.
Result: The vehicle ruptured the rail and exited behind the installation. (N/A)
The following supplemental evaluation factors and terminology, as presented in the FHWA memo entitled “Action: Identifying Acceptable Highway Safety Features,” were used for visual assessment of test results: (6)
Passenger Compartment Intrusion
1. Windshield Intrusion a. No windshield contact e. Complete intrusion into b. Windshield contact, no damage passenger compartment c. Windshield contact, no intrusion f. Partial intrusion into d. Device embedded in windshield, no
significant intrusion passenger compartment
2. Body Panel Intrusion yes or no
Loss of Vehicle Control 1. Physical loss of control 3. Perceived threat to other vehicles 2. Loss of windshield visibility 4. Debris on pavement
Physical Threat to Workers or Other Vehicles
1. Harmful debris that could injure workers or others in the area 2. Harmful debris that could injure occupants in other vehicles
Some of the posts fractured and post 14 was resting 3.8 m forward of the traffic face of the rail.
Vehicle and Device Condition
1. Vehicle Damage a. None d. Major dents to grill and body panels b. Minor scrapes, scratches or dents e. Major structural damagec. Significant cosmetic dents
2. Windshield Damage a. None e. Shattered, remained intact but b. Minor chip or crack partially dislodged c. Broken, no interference with visibility f. Large portion removed d. Broken or shattered, visibility
restricted but remained intact g. Completely removed
22

23
3. Device Damage a. None d. Substantial, replacement partsb. Superficial needed for repairc. Substantial, but can be straightened e. Cannot be repaired
CONCLUSIONS The rail element ruptured and allowed the vehicle to penetrate the rail system. The vehicle subsequently rolled onto its side. Therefore, the rail failed evaluation criteria for NCHRP Report 350 test 3-11, as shown in table 1. The abrupt change in stiffness of the rail element where it changes from two layer of W-beam (nested) to a single layer may have contributed to rupture of the single layer rail element.

Table 1. Performance evaluation summary for NCHRP Report 350 test 3-11 on the Long-Span Guardrail. Test Agency: Texas Transportation Institute Test No.: 405160-1-1 Test Date: 05-25-2006
NCHRP Report 350 Evaluation Criteria Test Results Assessment Structural Adequacy A. Test article should contain and redirect the vehicle; the
vehicle should not penetrate, underride, or override the installation although controlled lateral deflection of the test article is acceptable
The Long-Span Guardrail did not contain or redirect the vehicle. The vehicle penetrated the rail element with a maximum dynamic deflection of 1.45 m before the rail ruptured.
Fail
Occupant Risk
24
D. Detached elements, fragments, or other debris from the test article should not penetrate or show potential for penetrating the occupant compartment, or present an undue hazard to other traffic, pedestrians, or personnel in a work zone. Deformations of, or intrusions into, the occupant compartment that could cause serious injuries should not be permitted.
Some of the posts fractured and post 14 was resting 3.8 m forward of the traffic face of the rail. These debris did not penetrate nor show potential for penetrating the occupant compartment. Maximum occupant compartment deformation was 16 mm in the right floor pan to instrument panel area.
Pass
F. The vehicle should remain upright during and after collision although moderate roll, pitching, and yawing are acceptable.
The vehicle rolled 90 degrees and then came to rest upright. Fail
Vehicle Trajectory K. After collision, it is preferable that the vehicle’s trajectory
not intrude into adjacent traffic lanes. The vehicle did not intrude into adjacent traffic lanes as it came to rest on the field side of the installation. Pass*
L. The occupant impact velocity in the longitudinal direction should not exceed 12 m/s and the occupant ridedown acceleration in the longitudinal direction should not exceed 20 g’s.
Longitudinal occupant impact velocity was 7.0 m/s, and the longitudinal ridedown acceleration was -10.1 g. Pas
M. The exit angle from the test article preferably should be less than 60 percent of test impact angle, measured at time of vehicle loss of contact with test device.
The vehicle ruptured the rail and exited behind the installation. N/A*
*Criterion K and M are preferable, not required.

REFERENCES 1. J.D. Michie, Recommended Procedures for the Safety Performance Evaluation of Highway
Appurtenances, National Cooperative Highway Research Program Report 230, Transportation Research Board, National Research Council, Washington, D.C., 1981.
2. K.K. Mak, R.P. Bligh, D.J. Gripne and C.F. McDevitt, “Long-Span Nested W-Beam
Guardrails over Low-Fill Culverts,” Transportation Research Record No. 1367, Transportation Research Board, National Research Council, Washington, D.C., 1992.
3. H.E. Ross, Jr., D.L. Sicking, R.A. Zimmer and J.D. Michie, Recommended Procedures for
the Safety Performance Evaluation of Highway Features, National Cooperative Highway Research Program Report 350, Transportation Research Board, National Research Council, Washington, D.C., 1993.
4. K.A. Polivka, B.W. Bielenberg, D.L. Sicking, R.K. Faller, and J.R. Rohde, “Development of
a 7.62-m Long Span Guardrail System,” MwRSF Research Report No. TRP-03-72-99, Midwest State’s Regional Pooled Fund Program, Lincoln, NB, April 1999.
5. K.A. Polivka, B.W. Bielenberg, D.L. Sicking, R.K. Faller, and J.R. Rohde, “Development of
a 7.62-m Long Span Guardrail System – Phase II,” MwRSF Research Report No. TRP-03-88-99, Midwest State’s Regional Pooled Fund Program, Lincoln, NB, August 1999.
6. Federal Highway Administration Memorandum, from the Director, Office of Engineering,
entitled: “ACTION: Identifying Acceptable Highway Safety Features,” dated July 25, 1997.
25


APPENDIX A. CRASH TEST PROCEDURES AND DATA ANALYSIS The crash test and data analysis procedures were in accordance with guidelines presented in NCHRP Report 350. Brief descriptions of these procedures are presented as follows. ELECTRONIC INSTRUMENTATION AND DATA PROCESSING The test vehicle was instrumented with three solid-state angular rate transducers to measure roll, pitch, and yaw rates; a triaxial accelerometer near the vehicle center of gravity (c.g.) to measure longitudinal, lateral, and vertical acceleration levels; and a backup biaxial accelerometer in the rear of the vehicle to measure longitudinal and lateral acceleration levels. These accelerometers were ENDEVCO® Model 2262CA, piezoresistive accelerometers with a +100 g range. The accelerometers are strain gage type with a linear millivolt output proportional to acceleration. Angular rate transducers are solid state, gas flow units designed for high-“g” service. Signal conditioners and amplifiers in the test vehicle increase the low-level signals to a +2.5 volt maximum level. The signal conditioners also provide the capability of an R-cal (resistive calibration) or shunt calibration for the accelerometers and a precision voltage calibration for the rate transducers. The electronic signals from the accelerometers and rate transducers are transmitted to a base station by means of a 15-channel, constant-bandwidth, Inter-Range Instrumentation Group (IRIG), FM/FM telemetry link for recording and for display. Calibration signals from the test vehicle are recorded before the test and immediately afterwards. A crystal-controlled time reference signal is simultaneously recorded with the data. Wooden dowels actuate pressure-sensitive switches on the bumper of the impacting vehicle prior to impact by wooden dowels to indicate the elapsed time over a known distance to provide a measurement of impact velocity. The initial contact also produces an “event” mark on the data record to establish the instant of contact with the installation. The multiplex of data channels, transmitted on one radio frequency, is received and demultiplexed onto TEAC® instrumentation data recorder. After the test, the data are played back from the TEAC® recorder and digitized. A proprietary software program (WinDigit) converts the analog data from each transducer into engineering units using the R-cal and pre-zero values at 10,000 samples per second, per channel. WinDigit also provides Society of Automotive Engineers (SAE) J211 class 180 phaseless digital filtering and vehicle impact velocity. All accelerometers are calibrated annually according to the (SAE) J211 4.6.1 by means of an ENDEVCO® 2901, precision primary vibration standard. This device and its support instruments are returned to the factory annually for a National Institute of Standards Technology (NIST) traceable calibration. The subsystems of each data channel are also evaluated annually, using instruments with current NIST traceability, and the results are factored into the accuracy of the total data channel, per SAE J211. Calibrations and evaluations are made any time data are suspect.
27

The Test Risk Assessment Program (TRAP) uses the data from WinDigit to compute occupant/compartment impact velocities, time of occupant/compartment impact after vehicle impact, and the highest 10-milliseconds (ms) average ridedown acceleration. WinDigit calculates change in vehicle velocity at the end of a given impulse period. In addition, maximum average accelerations over 50-ms intervals in each of the three directions are computed. For reporting purposes, the data from the vehicle-mounted accelerometers are filtered with a 60-Hz digital filter, and acceleration versus time curves for the longitudinal, lateral, and vertical directions are plotted using TRAP.
TRAP uses the data from the yaw, pitch, and roll rate transducers to compute angular displacement in degrees at 0.0001-s intervals and then plots yaw, pitch, and roll versus time. These displacements are in reference to the vehicle-fixed coordinate system with the initial position and orientation of the vehicle-fixed coordinate systems being initial impact. ANTHROPOMORPHIC DUMMY INSTRUMENTATION An Alderson Research Laboratories Hybrid II, 50th percentile male anthropomorphic dummy, restrained with lap and shoulder belts, was placed in the driver’s position of the vehicle. The dummy was uninstrumented. PHOTOGRAPHIC INSTRUMENTATION AND DATA PROCESSING Photographic coverage of the test included three high-speed cameras: one overhead with a field of view perpendicular to the ground and directly over the impact point; one placed behind the installation at an angle; and a third placed to have a field of view parallel to and aligned with the installation at the downstream end. A flashbulb activated by pressure-sensitive tape switches was positioned on the impacting vehicle to indicate the instant of contact with the installation and was visible from each camera. The films from these high-speed cameras were analyzed on a computer-linked motion analyzer to observe phenomena occurring during the collision and to obtain time-event, displacement, and angular data. A BetaCam, a VHS-format video camera and recorder, and still cameras recorded and documented conditions of the test vehicle and installation before and after the test. TEST VEHICLE PROPULSION AND GUIDANCE The test vehicle was towed into the test installation using a steel cable guidance and reverse tow system. A steel cable for guiding the test vehicle was tensioned along the path, anchored at each end, and threaded through an attachment to the front wheel of the test vehicle. An additional steel cable was connected to the test vehicle, passed around a pulley near the impact point, through a pulley on the tow vehicle, and then anchored to the ground such that the tow vehicle moved away from the test site. A two-to-one speed ratio between the test and tow vehicle existed with this system. Just prior to impact with the installation, the test vehicle was released to be free-wheeling and unrestrained. The vehicle remained free-wheeling, i.e., no steering or braking inputs, until the vehicle cleared the immediate area of the test site, at which time brakes on the vehicle were activated to bring it to a safe and controlled stop.
28

APPENDIX B. TEST VEHICLE PROPERTIES AND INFORMATION Date: 05-25-2006 Test No.: 405160-1-1 VIN No.: 1GCGC24R2YR192376 Year: 2000 Make: Chevrolet Model: C2500 Tire Inflation Pressure: Odometer: 167313 Tire Size: 245/75/R16 Describe any damage to the vehicle prior to test:
• Denotes accelerometer location. NOTES: Engine Type: V-8 Engine CID: 5.7 liter Transmission Type: Auto x Manual Optional Equipment: Dummy Data: Type: 50th percentile Mass: 77 kg Seat Position: Passenger
Geometry (mm) A 1880 E 1310 J 1038 N 1590 R 750 B 810 F 5470 K 635 O 1610 S 900 C 3350 G 1447.55 L 70 P 725 T 1460 D 1820 H M 415 Q 440 U 3360
Mass (kg) Curb Test Inertial Gross Static M1 1224 1217 1260 M2 929 926 960 MTotal 2153 2143 2220
Mass Distribution (kg): LF: 605 RF: 612 LR: 462 RR: 464
Figure 14. Vehicle properties for test 405160-1-1.
29

Table 2. Exterior crush measurements for test 405160-1-1. Table 2. Exterior crush measurements for test 405160-1-1.
VEHICLE CRUSH MEASUREMENT SHEET1
Complete When Applicable Complete When Applicable VEHICLE CRUSH MEASUREMENT SHEET1
>
End Damage Side Damage Undeformed end width ________
Corner shift: A1 ________
A2 ________
End shift at frame (CDC)
(check one)
< 4 inches ________
4 inches ________
Bowing: B1 _____ X1 _____
B2 _____ X2 _____
Bowing constant
221 XX + = ______
Note: Measure C1 to C6 from Driver to Passenger side in Front or Rear impacts – Rear to Front in Side Impacts.
Direct Damage Specific Impact Number
Plane* of C-Measurements
Width** (CDC)
Max*** Crush
Field L**
C1 C2 C3 C4 C5 C6 ±D
1 Front plane – bumper ht 900 540 1600 -150 -70 200 540 350 450 0
2 Side plane – bumper ht 900 330 1040 0 65 N/A N/A 300 330 1550
1Table taken from National Accident Sampling System (NASS). *Identify the plane at which the C-measurements are taken (e.g., at bumper, above bumper, at sill, above sill, at beltline, etc.) or label adjustments (e.g., free space). Free space value is defined as the distance between the baseline and the original body contour taken at the individual C locations. This may include the following: bumper lead, bumper taper, side protrusion, side taper, etc. Record the value for each C-measurement and maximum crush. **Measure and document on the vehicle diagram the beginning or end of the direct damage width and field L (e.g., side damage with respect to undamaged axle). ***Measure and document on the vehicle diagram the location of the maximum crush. Note: Use as many lines/columns as necessary to describe each damage profile.
30

Table 3. Occupant compartment measurements for test 405160-1-1.
T r u c k
O c c u p a n t C o m p a r t m e n t D e f o r m a t i o n
C1, C2, & C3
B1E1 & E2
B2
D1, D2, & D3
B3
A1, A2, & A3
I
GF
H
BEFORE AFTER(mm) (mm)
A1 868 868
A2 936 936
A3 932 932
B1 1072 1072
B2 947 932
B3 1068 1061
C1 1370 1370
C2 ---- ----
C3 1366 1366
D1 326 326
D2 158 147
D3 307 291
E1 1585 1590
E2 1587 1598
F 1470 1470
G 1470 1470
H 1060 1060
I 1060 1060
J* 1525 1514*Lateral area across the cab from driver’s side kickpanel to passenger’s side kickpanel.
31


APPENDIX C. SEQUENTIAL PHOTOGRAPHS
0.000 s
0.074 s
0.147 s
0.220 s Figure 15. Sequential photographs for test 405160-1-1
(overhead and frontal views).
33

34
0.294 s
0.367 s
0.441 s
0.514 s Figure 15. Sequential photographs for test 405160-1-1
(overhead and frontal views) (continued).

35
APPE
ND
IX D
. VE
HIC
LE
AN
GU
LA
R D
ISPLA
CE
ME
NT
S A
ND
AC
CE
LE
RA
TIO
NS
Roll, Pitch, and Yaw Angles
0 0.1 0.2 0.3 0.4 0.5 0.6 0.7 0.8 0.9 1.0-120
-100
-80
-60
-40
-20
0
20
Time (s)
Ang
les
(deg
rees
)
Test Number: 405160-1-1Test Article: Long-Span GuardrailTest Vehicle: 2000 Chevrolet C2500 Pickup TruckInertial Mass: 2143 kgGross Mass: 2220 kgImpact Speed: 100.5 km/hImpact Angle: 24.8 degrees
Roll Pitch Yaw
Axes are vehicle-fixed.
Sequence for determining orientation:
1. Yaw. 2. Pitch. 3. Roll.
Figure 16. Vehicle angular displacements for test 405160-1-1.

36
X Acceleration at CG
0 0.1 0.2 0.3 0.4 0.5 0.6 0.7 0.8 0.9 1.0-30
-20
-10
0
10
Time (s)
Long
itudi
nal A
ccel
erat
ion
(g's
)
Test Number: 405160-1-1Test Article: Long-Span GuardrailTest Vehicle: 2000 Chevrolet C2500 Pickup TruckInertial Mass: 2143 kgGross Mass: 2220 kgImpact Speed: 100.5 km/hImpact Angle: 24.8 degrees
Time of OIV (0.2241 sec) SAE Class 60 Filter
Figure 17. Vehicle longitudinal accelerometer trace for test 405160-1-1 (accelerometer located at center of gravity).

37
Y Acceleration at CG
0 0.1 0.2 0.3 0.4 0.5 0.6 0.7 0.8 0.9 1.0-15
-10
-5
0
5
10
Time (s)
Late
ral A
ccel
erat
ion
(g's
)
Test Number: 405160-1-1Test Article: Long-Span GuardrailTest Vehicle: 2000 Chevrolet C2500 Pickup TruckInertial Mass: 2143 kgGross Mass: 2220 kgImpact Speed: 100.5 km/hImpact Angle: 24.8 degrees
Time of OIV (0.2241 sec) SAE Class 60 Filter
Figure 18. Vehicle lateral accelerometer trace for test 405160-1-1 (accelerometer located at center of gravity).

38
Z Acceleration at CG
0 0.1 0.2 0.3 0.4 0.5 0.6 0.7 0.8 0.9 1.0-20
-10
0
10
20
30
Time (s)
Ver
tical
Acc
eler
atio
n (g
's)
Test Number: 405160-1-1Test Article: Long-Span GuardrailTest Vehicle: 2000 Chevrolet C2500 Pickup TruckInertial Mass: 2143 kgGross Mass: 2220 kgImpact Speed: 100.5 km/hImpact Angle: 24.8 degrees
SAE Class 60 Filter
Figure 19. Vehicle vertical accelerometer trace for test 405160-1-1 (accelerometer located at center of gravity).

39
X Acceleration over Rear Axle
0 0.1 0.2 0.3 0.4 0.5 0.6 0.7 0.8 0.9 1.0-30
-20
-10
0
10
Time (s)
Long
itudi
nal A
ccel
erat
ion
(g's
)
Test Number: 405160-1-1Test Article: Long-Span GuardrailTest Vehicle: 2000 Chevrolet C2500 Pickup TruckInertial Mass: 2143 kgGross Mass: 2220 kgImpact Speed: 100.5 km/hImpact Angle: 24.8 degrees
SAE Class 60 Filter
Figure 20. Vehicle longitudinal accelerometer trace for test 405160-1-1 (accelerometer located over rear axle).

40
Y Acceleration over Rear Axle
0 0.1 0.2 0.3 0.4 0.5 0.6 0.7 0.8 0.9 1.0-15
-10
-5
0
5
10
Time (s)
Late
ral A
ccel
erat
ion
(g's
)
Test Number: 405160-1-1Test Article: Long-Span GuardrailTest Vehicle: 2000 Chevrolet C2500 Pickup TruckInertial Mass: 2143 kgGross Mass: 2220 kgImpact Speed: 100.5 km/hImpact Angle: 24.8 degrees
SAE Class 60 Filter
Figure 21. Vehicle lateral accelerometer trace for test 405160-1-1 (accelerometer located over rear axle).

41
Z Acceleration over Rear Axle
0 0.1 0.2 0.3 0.4 0.5 0.6 0.7 0.8 0.9 1.0-20
-10
0
10
20
30
Time (s)
Ver
tical
Acc
eler
atio
n (g
's)
Test Number: 405160-1-1Test Article: Long-Span GuardrailTest Vehicle: 2000 Chevrolet C2500 Pickup TruckInertial Mass: 2143 kgGross Mass: 2220 kgImpact Speed: 100.5 km/hImpact Angle: 24.8 degrees
SAE Class 60 Filter
Figure 22. Vehicle vertical accelerometer trace for test 405160-1-1 (accelerometer located over rear axle).