textile & clothing sector in bangladesh: prospects & challenges md. shafiul islam senior...
TRANSCRIPT
Textile & Clothing Sector in Bangladesh:
Prospects & Challenges
Md. Shafiul IslamSenior Vice President, FBCCI &
Managing Director, Onus Group &30 May, 2015

World trade in T&C 766 billion US$ in 2013 (clothing 460 billion US$)
The global T&A trade is expected to grow at a CAGR of 5%
GLOBAL MARKET OF TEXTILE & CLOTHING
2013 2020 20250
200
400
600
800
1000
1200
1400
1600
1800
306475
651
460
715
980
766
1191
1631
Textile Clothing T&C
World Textile & Clothing Trade, Bil US$, WTO

BANGLADESH’S POSITION IN GLOBAL APPAREL MARKET
The above figure shows the share of the competing countries in the world market. Bangladesh had a share of 2.56% in 2000 and now has a share of 5.11%. The graph shows Bangladesh has clearly overtaken Turkey and India in terms of global market share during the last 12 years. However, Vietnam has also significantly risen from a small position.
US$ 460 BillionWorld exports of clothing in 2013
US$ 23.5 BillionBangladesh’s exports of
clothing in 2013
5.11% ShareBangladesh holds this share in global apparel
market
2000 2011 2012 20130.00%
1.00%
2.00%
3.00%
4.00%
5.00%
6.00%
2.56
%
4.60
%
4.68
% 5.11
%
0.92
%
3.15
%
3.42
% 3.74
%
3.02
% 3.52
%
3.27
% 3.66
%
3.31
%
3.34
%
3.38
%
3.35
%
Bangladesh b

STRUCTURE OF TEXTILES & CLOTHING SECTOR
Sub-sector No of Units
Installed Capacity
Production Capacity
Spinning Millsyarn
394 9.6 million spindles
0.26 mln. rotor
2050 ml kg
Weaving Mills 777 21907 SL/SLL16118 SL/SL
2100 mln. mtr
Dyeing, Printing, Finishing
238 ----- 2200 ml meter
Specialized textiles
1065 23000 SL/SLL 400 ml meter
Export Oriented RMG
3500+/- 1.5 billion pieces RMG

EARNINGS FROM EXPORT OF TEXTILES & GARMENTS (IN
MILLION US$)
Item/ Year 2009-10 2010-11 2011-12 2012-13 2013-14Knitwear
6483.289 9482.06 9486.35 10475.88 12049.81Woven
6013.435 8432.89 9603.34 11039.85 12442.07Home Textiles
402.49 788.76 906.07 791.52 792.53Specialized Textiles
185.97 164.55 138.77 124.52 108.76

TEXTILE ITEMS PROCURED BY THE RMG INDUSTRY, VALUES MIL US$
In million US$ 2009-10 2010-11 2011-12 2012-13 2013-14
Back to back Fresh LCs opening 3125.12 5654.90 5211.13 5898.82 6237.72
Cotton yarn 624.99 1116.71 900.63 992.39 1078.58
Synthetic fibre & yarn 702.29 873.11 537.37 540.5 599.37

GARMENTS ACCESSORIES & PACKAGING EXPORTS OF BANGLADESH (MILLION
USD)
2005-06 2006-07 2007-08 2008-09 2009-10 2010-11 2011-12 2012-130
500
1000
1500
2000
2500
3000
3500
4000
4500
1185.121381.68
1604.971852.17 1919.51
2751.133075
4100
The accessories industry caters to 100% need of total garments & other export oriented industries by producing more than thirty items like Carton, Poly bag, Hanger, Elastic, Zipper, Button, Label, Hang tag, Back Board, Neck Board, Sewing Thread etc.

OPPORTUNITIES

HISTORICAL TREND OF THE COUNTRY’S TOTAL EXPORT AND
RMG EXPORT
Bangladesh had a share of 2.56% in 2000 and now has a share of 5.11%. The graph shows Bangladesh has clearly overtaken Turkey and India in 2000. If we can increase the share to
8% by 2020 (of $650 billion), we can reach to
$52 billion.

$50 BN RMG EXPORT BY 2021-OPPORTUNITIES FOR TEXTILE & ACCESSORIES
(APPROX. FIGURES)
$24.5 bn
$50 bn
$15 bn
$30 bn
$4 bn
$7+/- bn
RM
G
EX
PO
RT
FA
BR
ICS
AC
CE
SS
.
• If Bangladesh could reach $50 billion by 2021, this would create a $28 billion market for fabric ($16 Bn woven and $12 Bn knitted fabrics)
• To maintain the current ratio of local fabric supply (which is around 55% on avg. now), our local fabric mills have to be able to supply $15 billion, currently our local mills can supply $7.5bn+. So a huge investment is required locally.
• Besides, we would need $13 billion worth of fabric to be imported, which can be manufactured locally if we can draw investment, especially FDI
• The demand for accessories will be $7+/- billion by 2021.

Projected Demand for Fabric & Yar (Fabric in million meter.& Yarn in
million Kg)
YearTotal
Fabric Yarn
2012-13 9024 12892013-14 10197 14572014-15 11421 16322015-16 12677 18112016-17 13944 19922017-18 15199 21712018-19 16415 23452019-20 17564 2509
Source: Ministry of Textile & Jute Report on Textile Sector Survey-2009.

2009
2010
2011
2012
2013
2014
$0.00 $500.00 $1,000.00 $1,500.00
$359.19
$404.41
$405.98
$408.71
$455.62
$427.40
$524.49
$588.76
$821.52
$929.38
$1,072.56
$1,240.00
Bangladesh’s Denim Export to EU & USAValues in Million US$
EUUSA
DENIM:THE NEXT HORIZON OF OPPORTUNITY
FOR BANGLADESH
• Bangladesh’s Denim apparel export in 2014: $2.5 billion (approx.) and if we include other denim articles then our export is $3.5 billion.
• Bangladesh’s Denim export growth CAGR during 2009-2014: 11.16%
• Investment in Denim textile mill has increased significantly in last decade; more investments are still being made as our local mills can supply only 50% of the required fabrics
• Bangladesh’s Denim apparel export forecasted to reach by 2021: $7+ billion

CHALLENGES

COTTON VOLATILITY
• Bangladesh is the second largest cotton importing country in the world• Out of our $24.5 billion export last year, more than 80% products were made of cotton• This indicates a vulnerability state of our industry, because any fluctuation in global cotton
supply or price may impact our industry. • Bangladesh’s textile industry is totally dependent on imported raw cotton• Bangladesh imports around 50% of her total demand of raw cotton from CIS countries• Any crisis in the global cotton market may pose a serious threat for sourcing our raw cotton
and to our T&C industry

COMPETITIVENESS
Factors BD INDIA VIETNAM PAKISTAN
Min. Wage $69 $71 $78 $79
PRODUCTIVITY
77% 92% 90% 88%
BANK INTT. >16% 8% 13% 7%

GAS & INFRASTRUCTURAL ISSUES
• Embargo on new gas connection & transfer of address of existing gas connection is a barrier to new investment and ongoing factory safety efforts.
• Dhaka – CTG highway, Dhaka – Mymensingh highway and Dhaka – Tangail highway to be completed soon.
• Dhaka-Chittagong dual gauge rail track is urgently needed with enough ICDs.
• Activating New Mooring Container Terminal, Mongla Port and Pangaon port; improving the capacity of Chittagong port and its automation;
• Need Special Economic Zones immediately to rehabilitate vulnerable and shared building factories, and also to facilitate new investment.
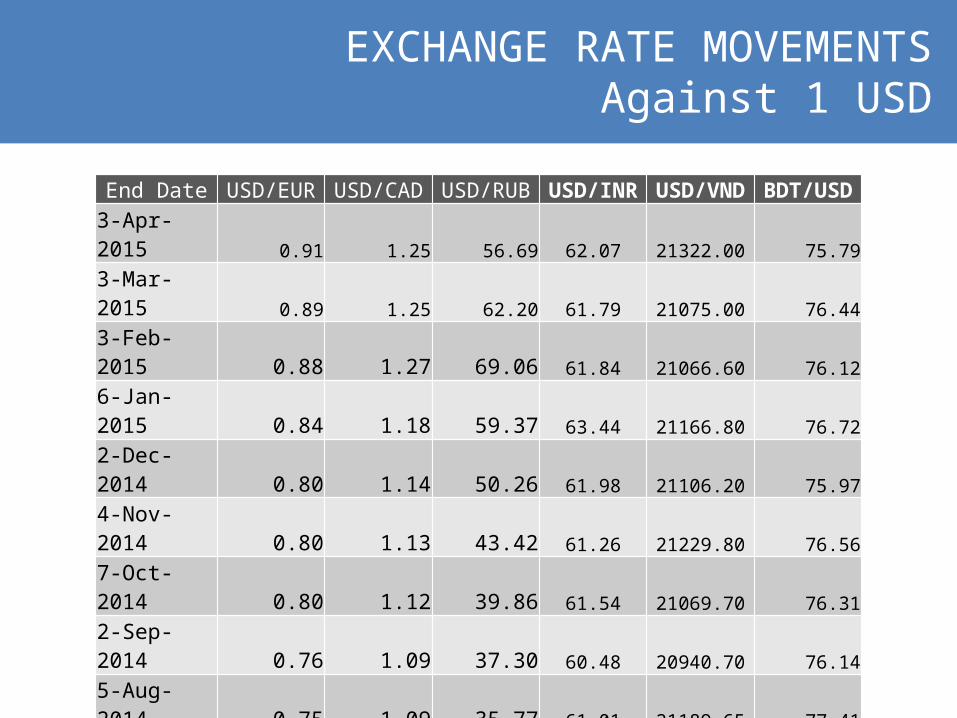
End Date USD/EUR USD/CAD USD/RUB USD/INR USD/VND BDT/USD3-Apr-2015 0.91 1.25 56.69 62.07 21322.00 75.79
3-Mar-2015 0.89 1.25 62.20 61.79 21075.00 76.44
3-Feb-2015 0.88 1.27 69.06 61.84 21066.60 76.12
6-Jan-2015 0.84 1.18 59.37 63.44 21166.80 76.72
2-Dec-2014 0.80 1.14 50.26 61.98 21106.20 75.97
4-Nov-2014 0.80 1.13 43.42 61.26 21229.80 76.56
7-Oct-2014 0.80 1.12 39.86 61.54 21069.70 76.31
2-Sep-2014 0.76 1.09 37.30 60.48 20940.70 76.14
5-Aug-2014 0.75 1.09 35.77 61.01 21189.65 77.41
1-Jul-2014 0.73 1.07 33.90 60.06 21317.40 77.68
3-Jun-2014 0.72 1.07 34.23 57.97 20582.40 74.79
6-May-2014 0.72 1.10 35.77 60.00 21070.00 76.34
1-Apr-2014 0.73 1.10 35.33 59.88 20895.10 76.26
4-Mar-2014 0.73 1.11 36.48 61.87 20969.20 76.38
CHANGE 25.41% 12.70% 55.41% 0.31% 1.68% -0.76% weaker weaker weaker weaker weaker Stronger
EXCHANGE RATE MOVEMENTSAgainst 1 USD

DYNAMICS IN GLOBAL TRADE & TARIFF REGIME
• Pakistan started enjoying GSP Plus in EU from 1 January 2014. The result during Jan-Nov is – – full waver from 9.6% duty– Export growth registered 28.31%
• Philippines was granted EU GSP Plus from 1 January 2015• The Trans Pacific Partnership will enable Vietnam to get DFQF
in USA• India is negotiating FTA with EU• Vietnam is also negotiating FTA with EU

IMPORTANCE OF THE RMG INDUSTRY FROM MACRO-ECNOMIC PERSPECTIVE

Lion Share of Exports: 81.16% of the country’s total export earnings
Employment Generation: Created employment for 4.4 million people, 80% of them are female
Empowering Women: RMG employs 3.5 million women, making them economically empowered, self aware, and independent. In a moderate Muslim country, the industry brought a silent social revolution.
Alleviating Poverty: The poverty rate has dropped from 40% in 2009 to 26.45% at present, & RMG playing a critical role.
Contribution to GDP: The RMG sector contributes more than 14%+ to Bangladesh’s GDP
Less dependant on Aid: Enhanced trade helping the country to reach its economic prosperity
SOME MAJOR CONTRIBUTIONS OF THE RMG INDUSTRY TO BANGLADESH ECONOMY
Others
Tea
Chemicals
Raw Jute
Leather
Agri Products
Frozen Food
Jute Goods
RMG
0.00% 20.00% 40.00% 60.00% 80.00% 100.00%
9.57%
0.01%
0.31%
0.42%
1.67%
2.04%
2.11%
2.73%
81.13%
Bangladesh's Export BasketShare %, USD Value, FY2013-14

30 years of experience & reputation in garment manufacturing
Competitive Price
International standard quality
Vibrant population, 70% below 40 years age, quick learning & dedicated
Irresistible & resilient entrepreneurial spirit
Duty free market access in most of the developed countries & PTA in India, China, Korea, Malaysia
Rapid adoption of environment friendly, energy efficient and green concepts
Rapidly developing backward linkage/Washing/Dying/Finishing/Embroidery, etc
Versatility of factories to produce different type of products
Increasing trend of direct sourcing through local liaison offices at Dhaka
STRENGTHS OF BANGLADESH’S RMG INDUSTRY

Thank You !