textiles and apparel
DESCRIPTION
Textiles and ApparelTRANSCRIPT
1 1 For updated information, please visit www.ibef.org
Textiles and Apparel NOVEMBER
2011
2 2
Contents
Advantage India
Market overview and trends
Growth drivers
Success stories: Raymond, Alok Industries
Opportunities
Useful information
For updated information, please visit www.ibef.org
Textiles and Apparel NOVEMBER
2011
3 3
Textiles and Apparel
For updated information, please visit www.ibef.org ADVANTAGE INDIA
Advantage India
NOVEMBER
2011
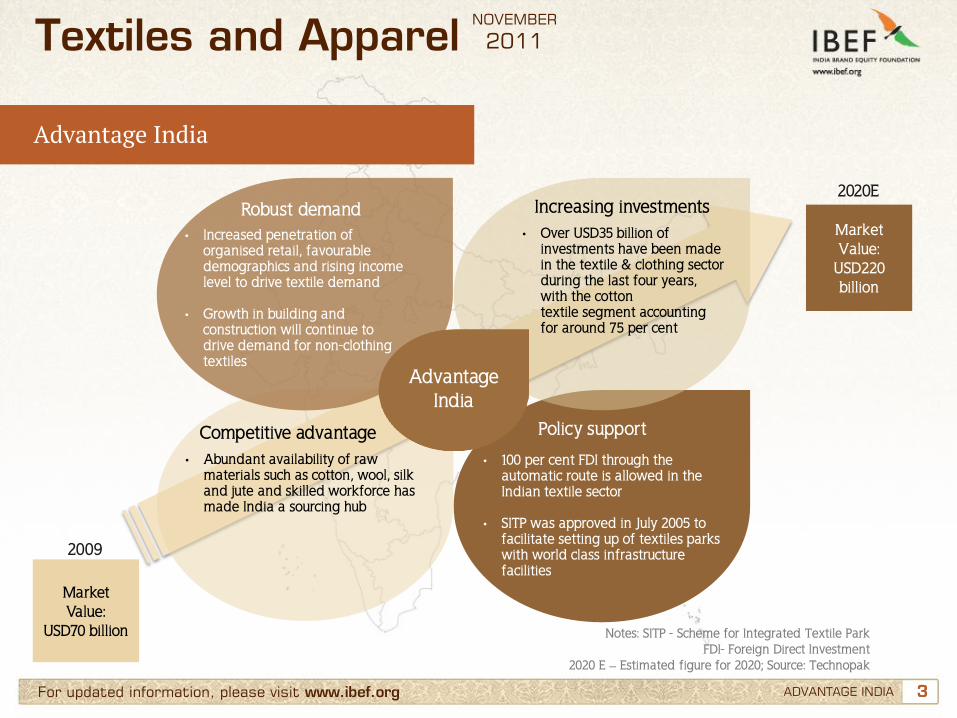
Advantage India
• Increased penetration of organised retail, favourable demographics and rising income level to drive textile demand
• Growth in building and construction will continue to drive demand for non-clothing textiles
• Over USD35 billion of investments have been made in the textile & clothing sector during the last four years, with the cotton textile segment accounting for around 75 per cent
• Abundant availability of raw materials such as cotton, wool, silk and jute and skilled workforce has made India a sourcing hub
• 100 per cent FDI through the automatic route is allowed in the Indian textile sector
• SITP was approved in July 2005 to facilitate setting up of textiles parks with world class infrastructure facilities
Market Value:
USD220 billion
2020E
Market Value:
USD70 billion
2009
Notes: SITP - Scheme for Integrated Textile Park FDI- Foreign Direct Investment
2020 E – Estimated figure for 2020; Source: Technopak
Robust demand Increasing investments
Competitive advantage Policy support

4 4
Contents
Advantage India
Market overview and trends
Growth drivers
Success stories: Raymond, Alok Industries
Opportunities
Useful information
For updated information, please visit www.ibef.org
Textiles and Apparel NOVEMBER
2011

5 5 For updated information, please visit www.ibef.org MARKET OVERVIEW AND TRENDS
Evolution of the Indian textile sector
Textiles and Apparel NOVEMBER
2011
• In 2000, NTP was announced for the overall development of the textile and apparel industry
• NTC started selling few mills to private businesses in 2005
• SITP was implemented to facilitate setting up of textile units with appropriate support infrastructure
• In 1999, TUFS was set up to provide easy access to capital for technological upgradation
• TMC was launched in February 2000 to address issues related to low productivity, obsolete ginning and pressing factories, lack of storage facilities and marketing infrastructure
• Number of mills increased from 178 in 1901 to 417 in 1945
• Out of 423 textile mills of the undivided India, India received 409 after partition and the remaining 14 went to Pakistan
• The first cotton textile mill of Mumbai was established in 1854
• The first cotton mill of Ahmedabad was found in 1861; it emerged as a rival centre to Mumbai
2000–10
1951-2000
1901–50
1854-1900
Notes: NTP – National Textile Policy NTC - National Textiles Corporation
TUFS - Technology Upgradation Fund Scheme TMC - Technology Mission on Cotton
SITP - Scheme for Integrated Textiles Parks
6 6 For updated information, please visit www.ibef.org
Segments in the textile and apparel sector
MARKET OVERVIEW AND TRENDS
Textiles and Apparel NOVEMBER
2011
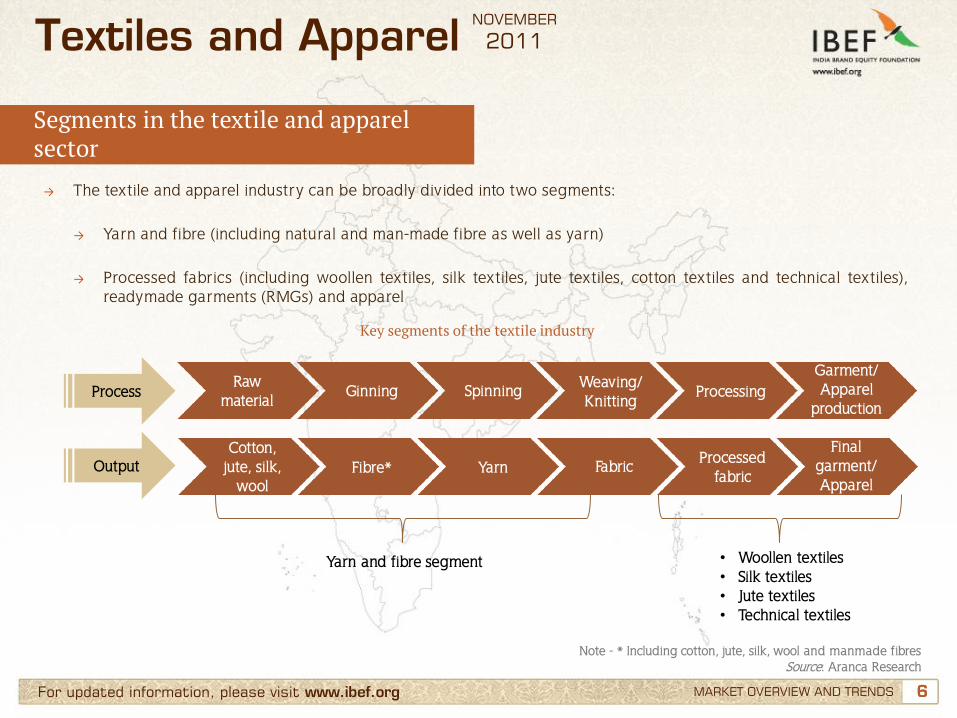
→ The textile and apparel industry can be broadly divided into two segments: → Yarn and fibre (including natural and man-made fibre as well as yarn)
→ Processed fabrics (including woollen textiles, silk textiles, jute textiles, cotton textiles and technical textiles),
readymade garments (RMGs) and apparel
Key segments of the textile industry
Process
Output
Raw material
Ginning Spinning Weaving/ Knitting
Processing Garment/ Apparel
production
Cotton, jute, silk,
wool Fibre* Yarn Fabric Processed
fabric
Final garment/ Apparel
• Woollen textiles • Silk textiles • Jute textiles • Technical textiles
Yarn and fibre segment
Note - * Including cotton, jute, silk, wool and manmade fibres Source: Aranca Research
7 7 For updated information, please visit www.ibef.org MARKET OVERVIEW AND TRENDS
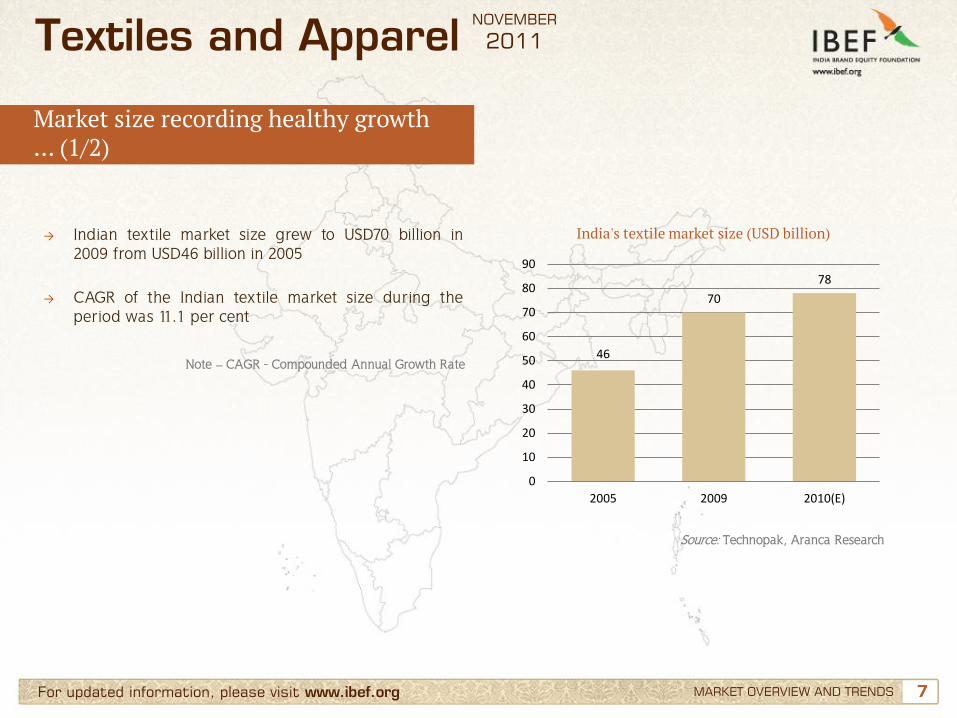
Market size recording healthy growth … (1/2)
→ Indian textile market size grew to USD70 billion in 2009 from USD46 billion in 2005
→ CAGR of the Indian textile market size during the period was 11.1 per cent
India's textile market size (USD billion)
Source: Technopak, Aranca Research
Textiles and Apparel NOVEMBER
2011
Note – CAGR - Compounded Annual Growth Rate 46
70
78
0
10
20
30
40
50
60
70
80
90
2005 2009 2010(E)
8 8 For updated information, please visit www.ibef.org MARKET OVERVIEW AND TRENDS
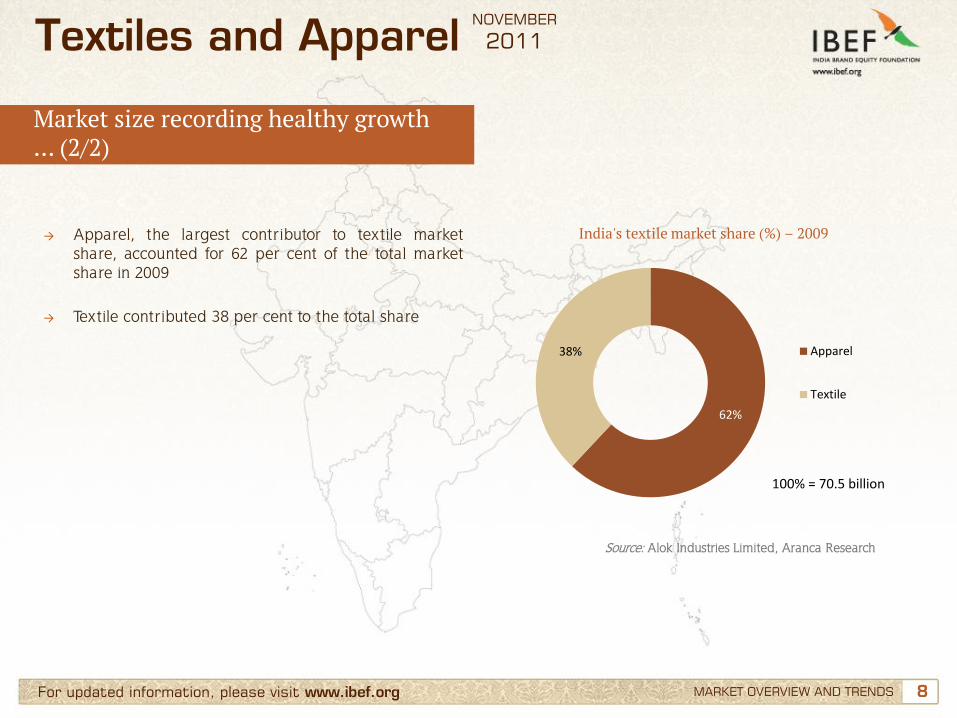
→ Apparel, the largest contributor to textile market share, accounted for 62 per cent of the total market share in 2009
→ Textile contributed 38 per cent to the total share
India's textile market share (%) – 2009
Source: Alok Industries Limited, Aranca Research
Textiles and Apparel NOVEMBER
2011
Market size recording healthy growth … (2/2)
62%
38% Apparel
Textile
100% = 70.5 billion
9 9 For updated information, please visit www.ibef.org MARKET OVERVIEW AND TRENDS
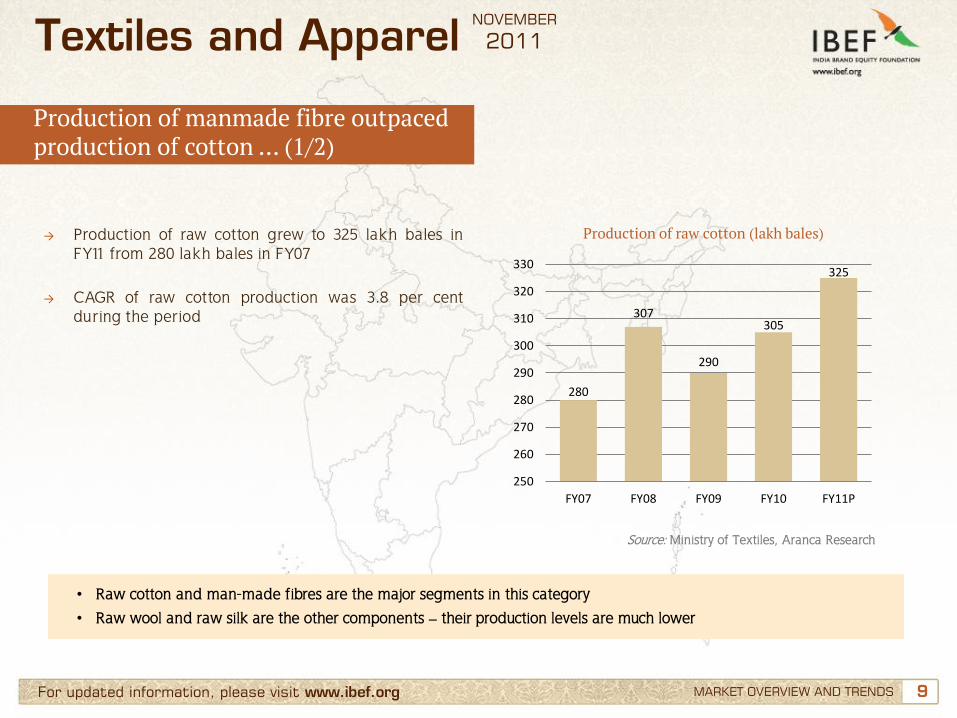
Production of manmade fibre outpaced production of cotton … (1/2)
→ Production of raw cotton grew to 325 lakh bales in FY11 from 280 lakh bales in FY07
→ CAGR of raw cotton production was 3.8 per cent during the period
Production of raw cotton (lakh bales)
Source: Ministry of Textiles, Aranca Research
Textiles and Apparel NOVEMBER
2011
280
307
290
305
325
250
260
270
280
290
300
310
320
330
FY07 FY08 FY09 FY10 FY11P
• Raw cotton and man-made fibres are the major segments in this category
• Raw wool and raw silk are the other components – their production levels are much lower
10 10 For updated information, please visit www.ibef.org MARKET OVERVIEW AND TRENDS
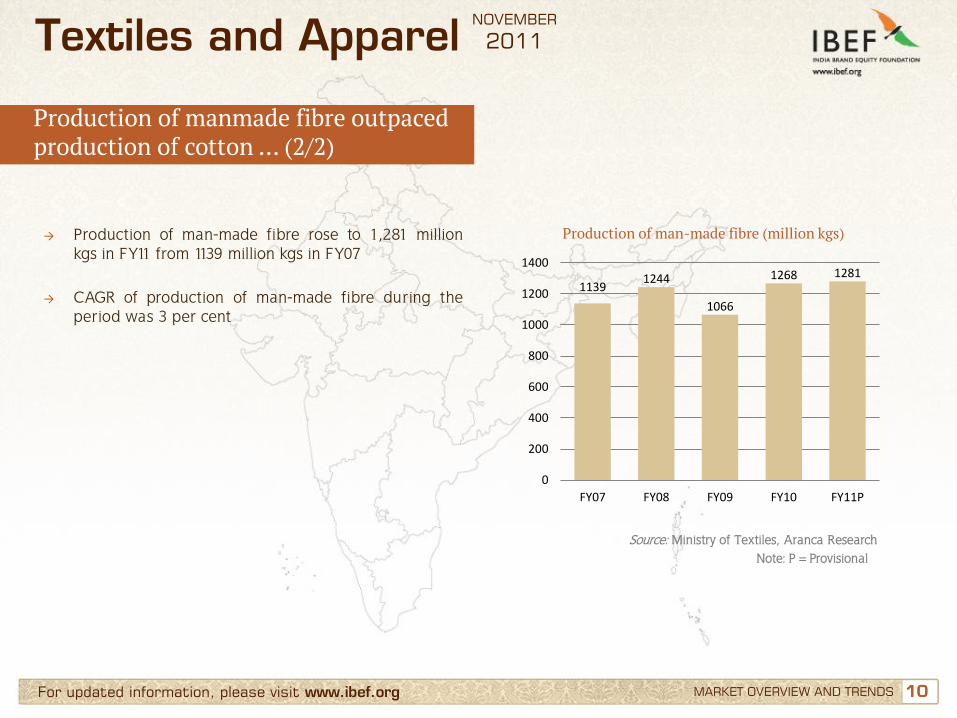
→ Production of man-made fibre rose to 1,281 million kgs in FY11 from 1139 million kgs in FY07
→ CAGR of production of man-made fibre during the period was 3 per cent
Production of man-made fibre (million kgs)
Note: P = Provisional Source: Ministry of Textiles, Aranca Research
Textiles and Apparel NOVEMBER
2011
Production of manmade fibre outpaced production of cotton … (2/2)
1139 1244
1066
1268 1281
0
200
400
600
800
1000
1200
1400
FY07 FY08 FY09 FY10 FY11P
11 11 For updated information, please visit www.ibef.org
Cotton is the major segment in both yarn and fabric … (1/2)
MARKET OVERVIEW AND TRENDS
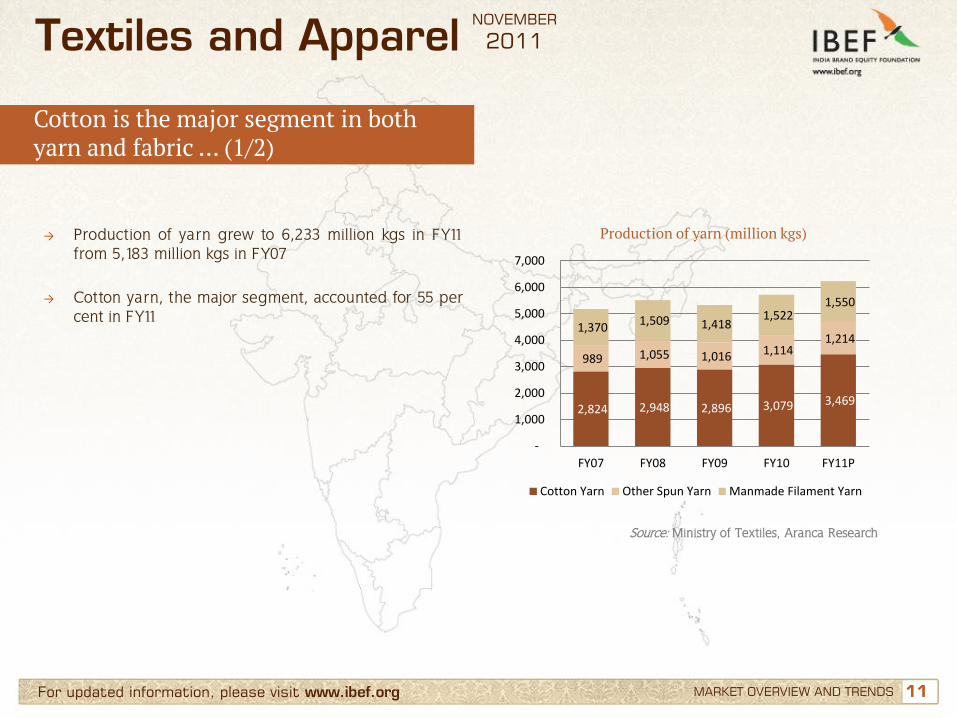
→ Production of yarn grew to 6,233 million kgs in FY11 from 5,183 million kgs in FY07
→ Cotton yarn, the major segment, accounted for 55 per cent in FY11
Production of yarn (million kgs)
Source: Ministry of Textiles, Aranca Research
Textiles and Apparel NOVEMBER
2011
2,824 2,948 2,896 3,079 3,469
989 1,055 1,016 1,114 1,214
1,370 1,509 1,418
1,522 1,550
-
1,000
2,000
3,000
4,000
5,000
6,000
7,000
FY07 FY08 FY09 FY10 FY11P
Cotton Yarn Other Spun Yarn Manmade Filament Yarn
12 12 For updated information, please visit www.ibef.org
Cotton is the major segment in both yarn and fabric … (2/2)
MARKET OVERVIEW AND TRENDS
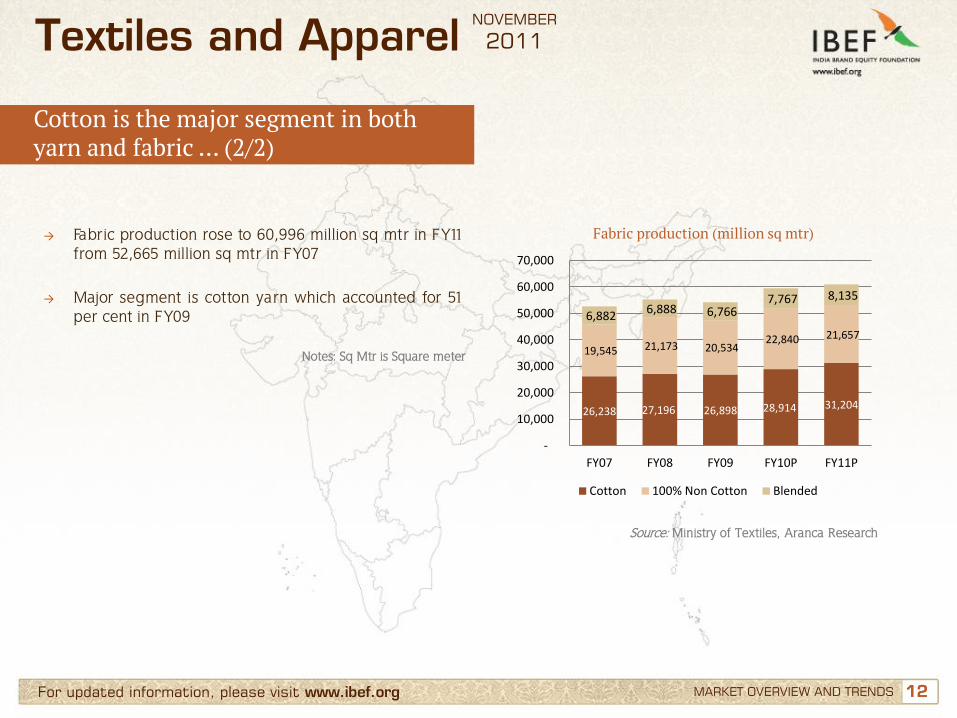
→ Fabric production rose to 60,996 million sq mtr in FY11 from 52,665 million sq mtr in FY07
→ Major segment is cotton yarn which accounted for 51 per cent in FY09
Fabric production (million sq mtr)
Source: Ministry of Textiles, Aranca Research
Textiles and Apparel NOVEMBER
2011
26,238 27,196 26,898 28,914 31,204
19,545 21,173 20,534 22,840 21,657
6,882 6,888 6,766
7,767 8,135
-
10,000
20,000
30,000
40,000
50,000
60,000
70,000
FY07 FY08 FY09 FY10P FY11P
Cotton 100% Non Cotton Blended
Notes: Sq Mtr is Square meter
13 13 For updated information, please visit www.ibef.org MARKET OVERVIEW AND TRENDS
India's textile trade (USD billion)
Source: Ministry of Textiles, Aranca Research
Exports have posted strong growth over the years … (1/2)
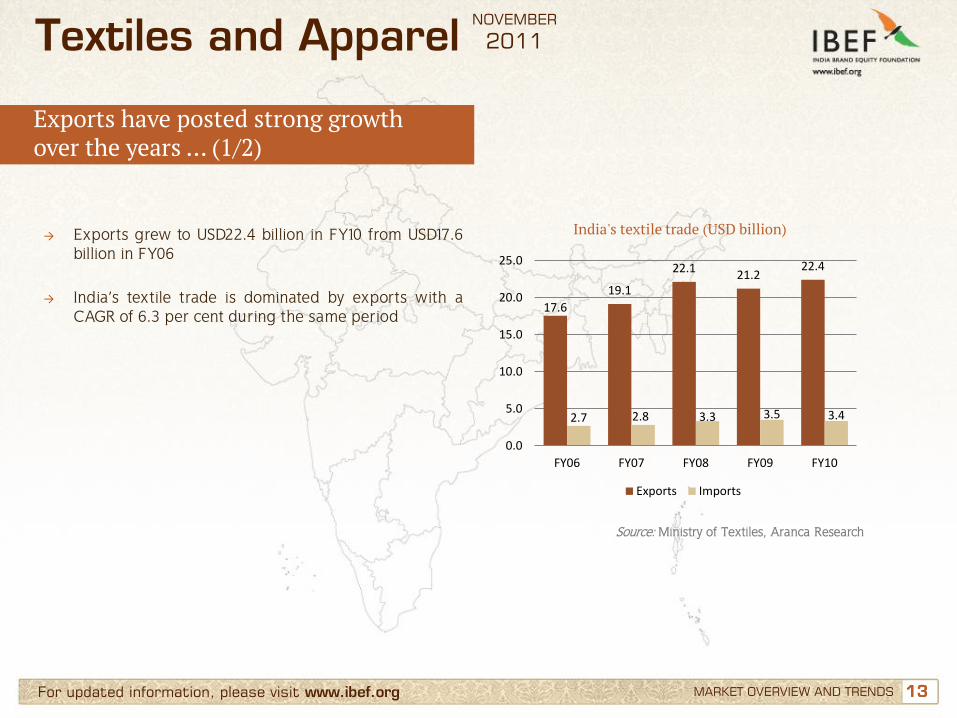
→ Exports grew to USD22.4 billion in FY10 from USD17.6 billion in FY06
→ India’s textile trade is dominated by exports with a CAGR of 6.3 per cent during the same period
Textiles and Apparel NOVEMBER
2011
17.6
19.1
22.1 21.2
22.4
2.7 2.8 3.3 3.5 3.4
0.0
5.0
10.0
15.0
20.0
25.0
FY06 FY07 FY08 FY09 FY10
Exports Imports
14 14 For updated information, please visit www.ibef.org MARKET OVERVIEW AND TRENDS
India's textile exports (%) – FY10
Source: Ministry of Textiles, Aranca Research
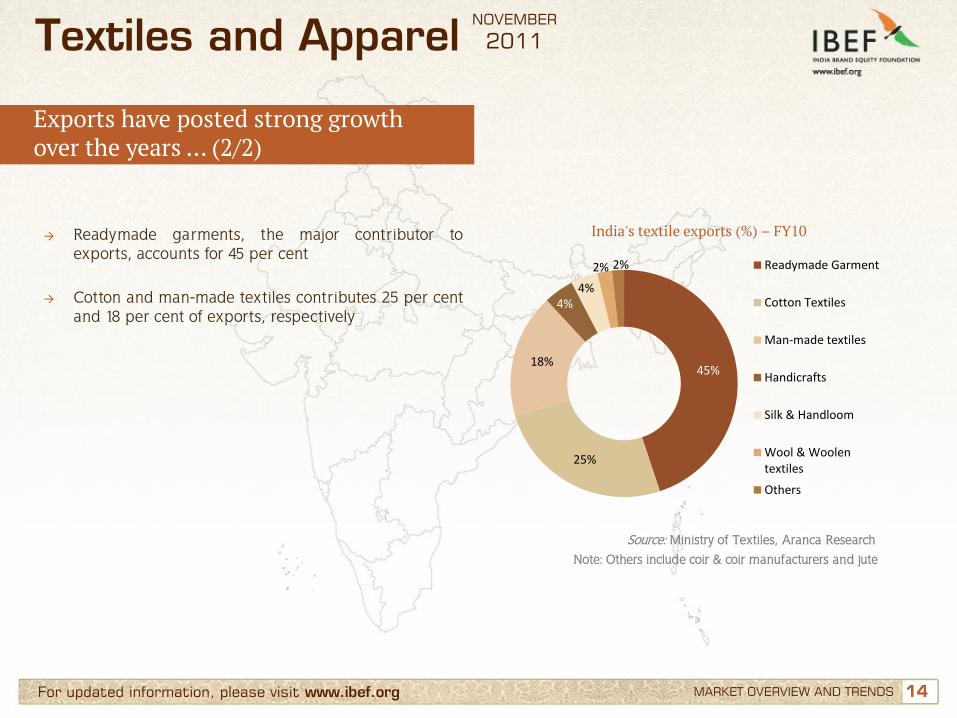
→ Readymade garments, the major contributor to exports, accounts for 45 per cent
→ Cotton and man-made textiles contributes 25 per cent and 18 per cent of exports, respectively
Note: Others include coir & coir manufacturers and jute
Textiles and Apparel NOVEMBER
2011
Exports have posted strong growth over the years … (2/2)
45%
25%
18%
4% 4%
2% 2% Readymade Garment
Cotton Textiles
Man-made textiles
Handicrafts
Silk & Handloom
Wool & Woolentextiles
Others
15 15 For updated information, please visit www.ibef.org MARKET OVERVIEW AND TRENDS
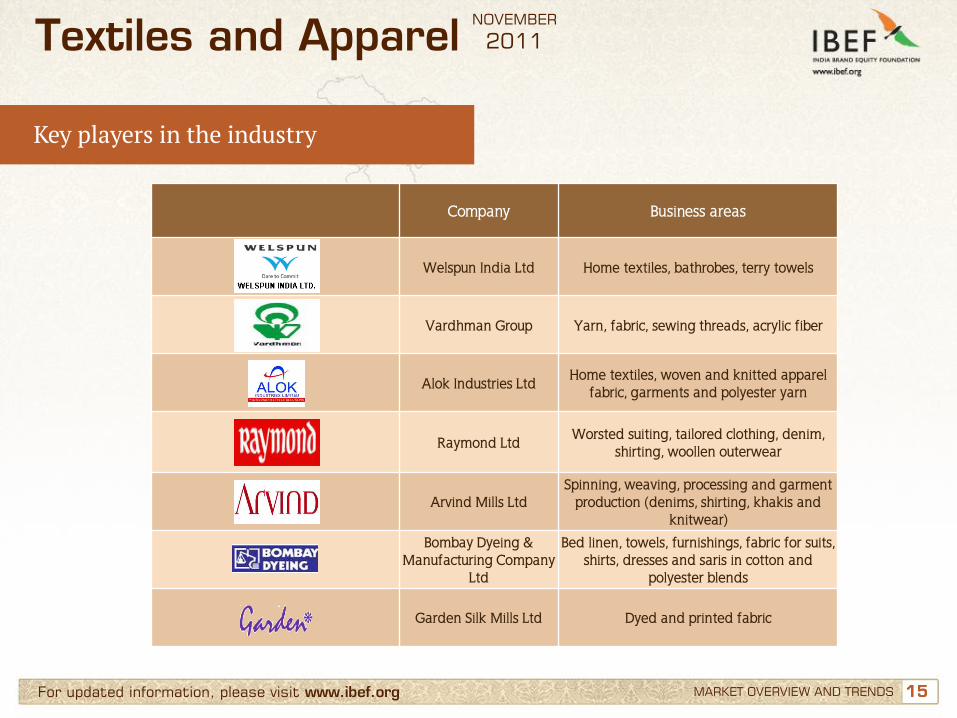
Key players in the industry
Textiles and Apparel NOVEMBER
2011
Company Business areas
Welspun India Ltd Home textiles, bathrobes, terry towels
Vardhman Group Yarn, fabric, sewing threads, acrylic fiber
Alok Industries Ltd Home textiles, woven and knitted apparel
fabric, garments and polyester yarn
Raymond Ltd Worsted suiting, tailored clothing, denim,
shirting, woollen outerwear
Arvind Mills Ltd Spinning, weaving, processing and garment
production (denims, shirting, khakis and knitwear)
Bombay Dyeing & Manufacturing Company
Ltd
Bed linen, towels, furnishings, fabric for suits, shirts, dresses and saris in cotton and
polyester blends
Garden Silk Mills Ltd Dyed and printed fabric
16 16 For updated information, please visit www.ibef.org MARKET OVERVIEW AND TRENDS
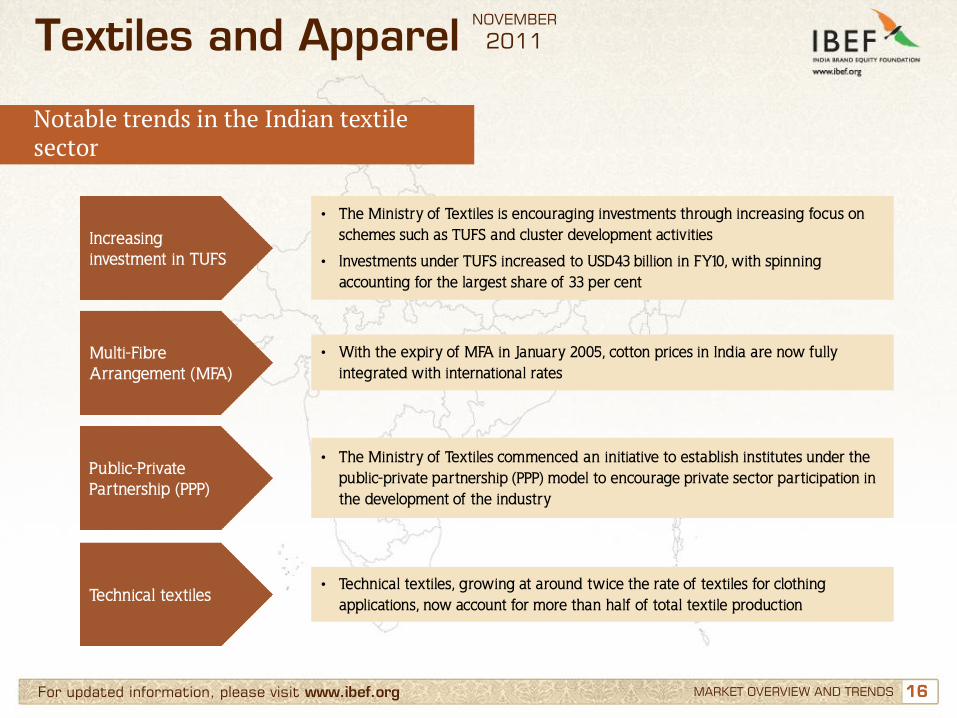
Notable trends in the Indian textile sector
Textiles and Apparel NOVEMBER
2011
Increasing investment in TUFS
• The Ministry of Textiles is encouraging investments through increasing focus on schemes such as TUFS and cluster development activities
• Investments under TUFS increased to USD43 billion in FY10, with spinning accounting for the largest share of 33 per cent
Multi-Fibre Arrangement (MFA)
• With the expiry of MFA in January 2005, cotton prices in India are now fully integrated with international rates
Public-Private Partnership (PPP)
• The Ministry of Textiles commenced an initiative to establish institutes under the public-private partnership (PPP) model to encourage private sector participation in the development of the industry
Technical textiles • Technical textiles, growing at around twice the rate of textiles for clothing
applications, now account for more than half of total textile production
17 17
Contents
Advantage India
Market overview and trends
Growth drivers
Success stories: Raymond, Alok Industries
Opportunities
Useful information
For updated information, please visit www.ibef.org
Textiles and Apparel NOVEMBER
2011
18 18 For updated information, please visit www.ibef.org GROWTH DRIVERS
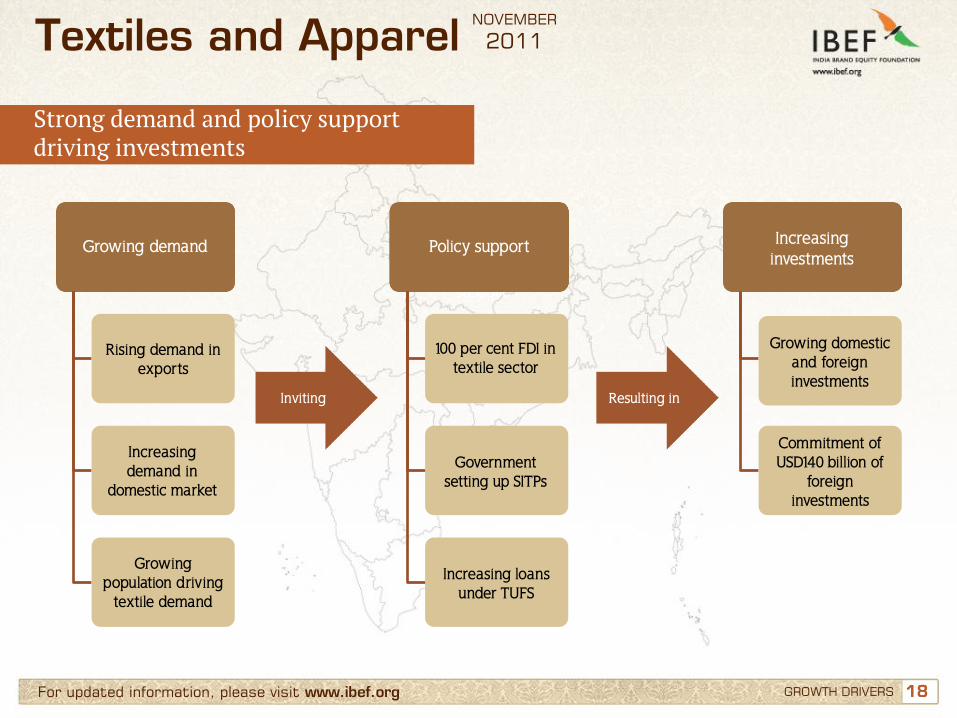
Strong demand and policy support driving investments
Strong
government
support
Inviting Resulting in
Growing demand Policy support Increasing investments
Rising demand in exports
100 per cent FDI in textile sector
Growing domestic and foreign investments
Increasing demand in
domestic market
Government setting up SITPs
Commitment of USD140 billion of
foreign investments
Growing population driving
textile demand
Increasing loans under TUFS
Textiles and Apparel NOVEMBER
2011
19 19 For updated information, please visit www.ibef.org
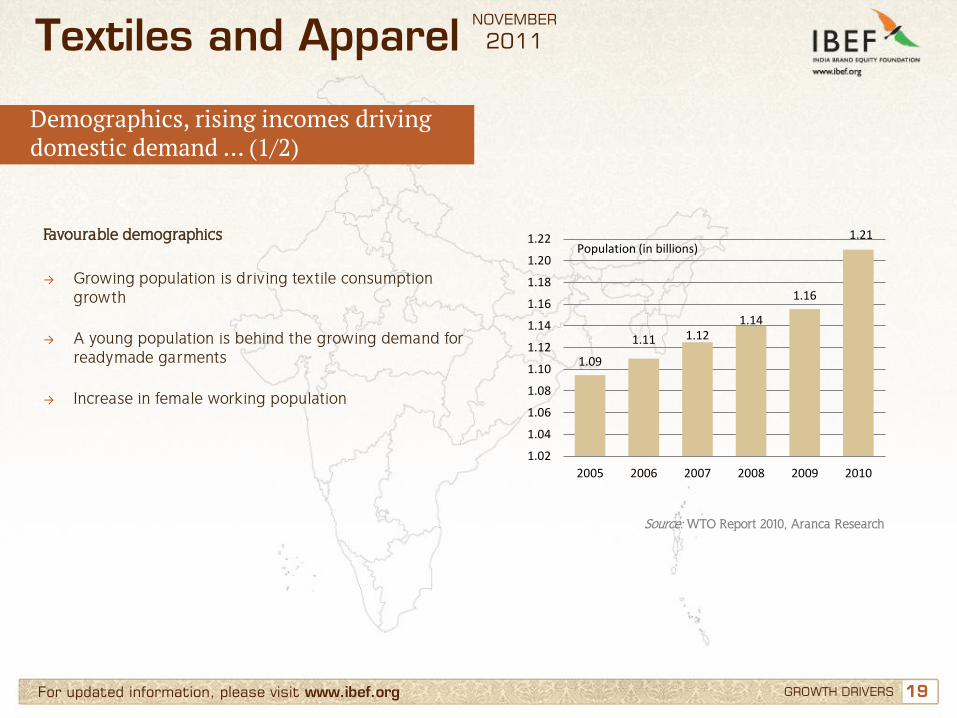
Demographics, rising incomes driving domestic demand … (1/2)
GROWTH DRIVERS
Textiles and Apparel NOVEMBER
2011
Source: WTO Report 2010, Aranca Research
Favourable demographics → Growing population is driving textile consumption
growth
→ A young population is behind the growing demand for readymade garments
→ Increase in female working population
1.09
1.11 1.12 1.14
1.16
1.21
1.02
1.04
1.06
1.08
1.10
1.12
1.14
1.16
1.18
1.20
1.22
2005 2006 2007 2008 2009 2010
Population (in billions)
20 20 For updated information, please visit www.ibef.org GROWTH DRIVERS
Textiles and Apparel NOVEMBER
2011
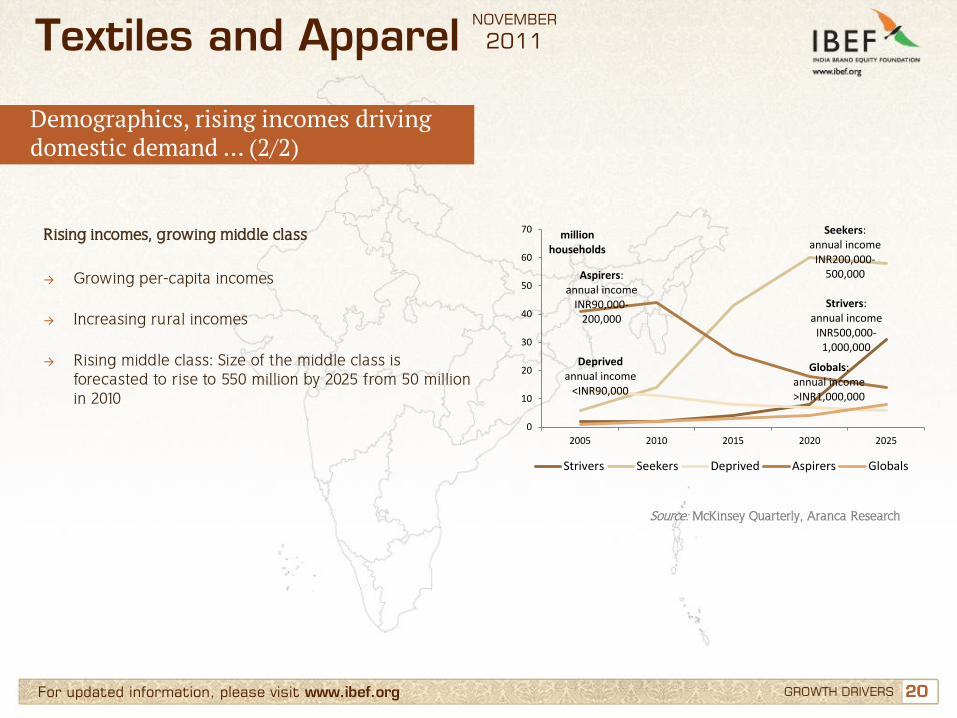
Demographics, rising incomes driving domestic demand … (2/2)
Source: McKinsey Quarterly, Aranca Research
Rising incomes, growing middle class → Growing per-capita incomes
→ Increasing rural incomes
→ Rising middle class: Size of the middle class is
forecasted to rise to 550 million by 2025 from 50 million in 2010
Strivers: annual income
INR500,000-1,000,000
Seekers: annual income
INR200,000-500,000
Deprived annual income
<INR90,000
Aspirers: annual income
INR90,000-200,000
Globals: annual income >INR1,000,000
0
10
20
30
40
50
60
70
2005 2010 2015 2020 2025
million households
Strivers Seekers Deprived Aspirers Globals
21 21 For updated information, please visit www.ibef.org
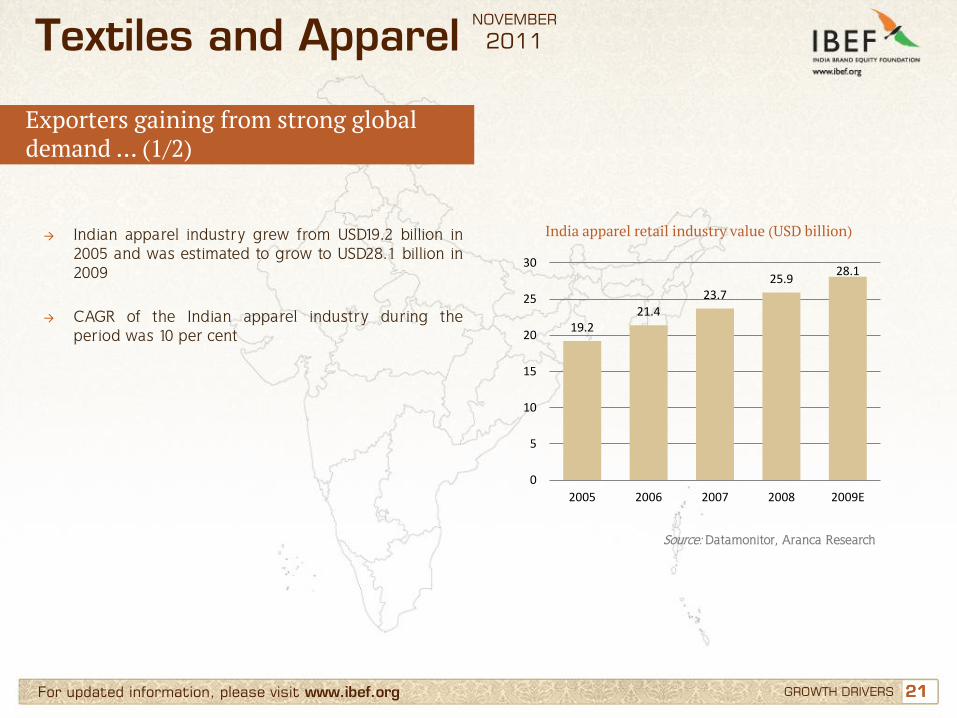
Exporters gaining from strong global demand … (1/2)
GROWTH DRIVERS
Textiles and Apparel NOVEMBER
2011
India apparel retail industry value (USD billion)
Source: Datamonitor, Aranca Research
→ Indian apparel industry grew from USD19.2 billion in 2005 and was estimated to grow to USD28.1 billion in 2009
→ CAGR of the Indian apparel industry during the period was 10 per cent
19.2 21.4
23.7 25.9
28.1
0
5
10
15
20
25
30
2005 2006 2007 2008 2009E

22 22 For updated information, please visit www.ibef.org
Exporters gaining from strong global demand … (2/2)
GROWTH DRIVERS
Textiles and Apparel NOVEMBER
2011
Growing demand in Exports (USD billion)
Source: Ministry of Textiles, Aranca Research
→ Capacity built over years led to low cost per unit that made Indian players more competitive
→ Increasing outsourcing was experienced over years as Indian players moved from converters to vendor partners of global retail giants 19.2
22.2 20.9 22.4
26.8
0
5
10
15
20
25
30
FY07 FY08 FY09 FY10 FY11
23 23 For updated information, please visit www.ibef.org GROWTH DRIVERS
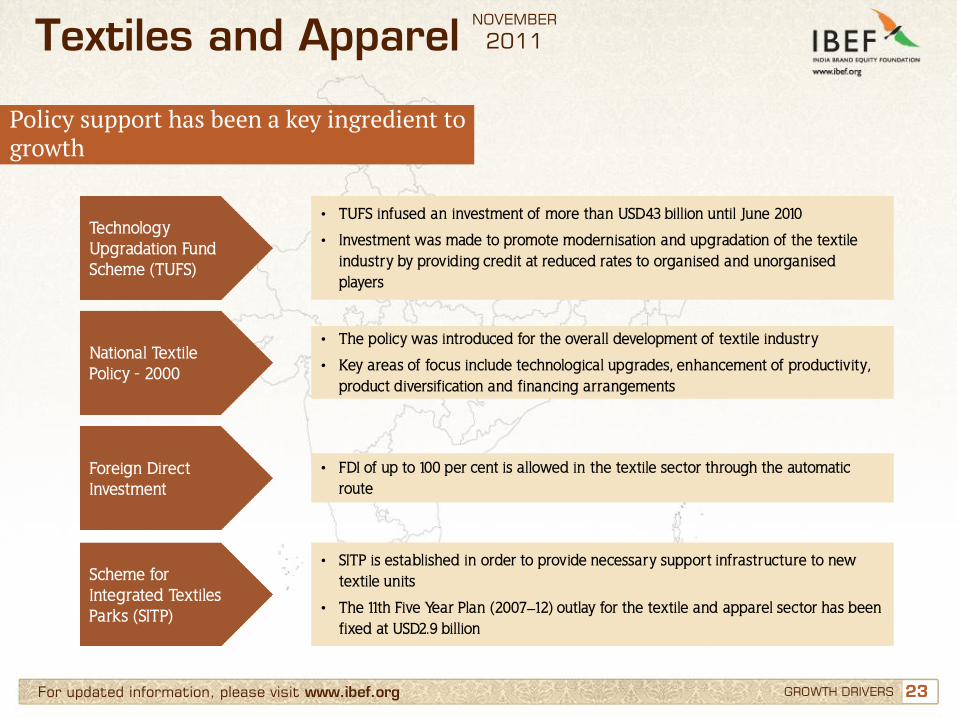
Policy support has been a key ingredient to growth
Textiles and Apparel NOVEMBER
2011
Technology Upgradation Fund Scheme (TUFS)
• TUFS infused an investment of more than USD43 billion until June 2010
• Investment was made to promote modernisation and upgradation of the textile industry by providing credit at reduced rates to organised and unorganised players
National Textile Policy - 2000
• The policy was introduced for the overall development of textile industry
• Key areas of focus include technological upgrades, enhancement of productivity, product diversification and financing arrangements
Foreign Direct Investment
• FDI of up to 100 per cent is allowed in the textile sector through the automatic route
Scheme for Integrated Textiles Parks (SITP)
• SITP is established in order to provide necessary support infrastructure to new textile units
• The 11th Five Year Plan (2007–12) outlay for the textile and apparel sector has been fixed at USD2.9 billion
24 24 For updated information, please visit www.ibef.org
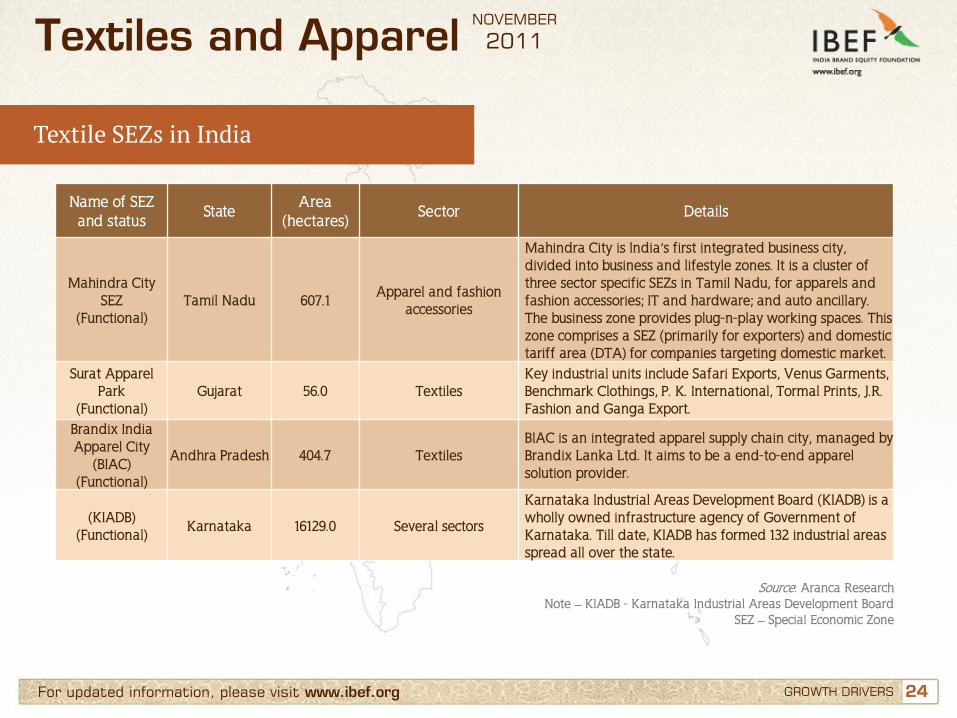
Textile SEZs in India
GROWTH DRIVERS
Textiles and Apparel NOVEMBER
2011
Name of SEZ and status
State Area
(hectares) Sector Details
Mahindra City SEZ
(Functional) Tamil Nadu 607.1
Apparel and fashion accessories
Mahindra City is India’s first integrated business city, divided into business and lifestyle zones. It is a cluster of three sector specific SEZs in Tamil Nadu, for apparels and fashion accessories; IT and hardware; and auto ancillary. The business zone provides plug-n-play working spaces. This zone comprises a SEZ (primarily for exporters) and domestic tariff area (DTA) for companies targeting domestic market.
Surat Apparel Park
(Functional) Gujarat 56.0 Textiles
Key industrial units include Safari Exports, Venus Garments, Benchmark Clothings, P. K. International, Tormal Prints, J.R. Fashion and Ganga Export.
Brandix India Apparel City
(BIAC) (Functional)
Andhra Pradesh 404.7 Textiles BIAC is an integrated apparel supply chain city, managed by Brandix Lanka Ltd. It aims to be a end-to-end apparel solution provider.
(KIADB) (Functional)
Karnataka 16129.0 Several sectors
Karnataka Industrial Areas Development Board (KIADB) is a wholly owned infrastructure agency of Government of Karnataka. Till date, KIADB has formed 132 industrial areas spread all over the state.
Source: Aranca Research Note – KIADB - Karnataka Industrial Areas Development Board
SEZ – Special Economic Zone
25 25 For updated information, please visit www.ibef.org GROWTH DRIVERS
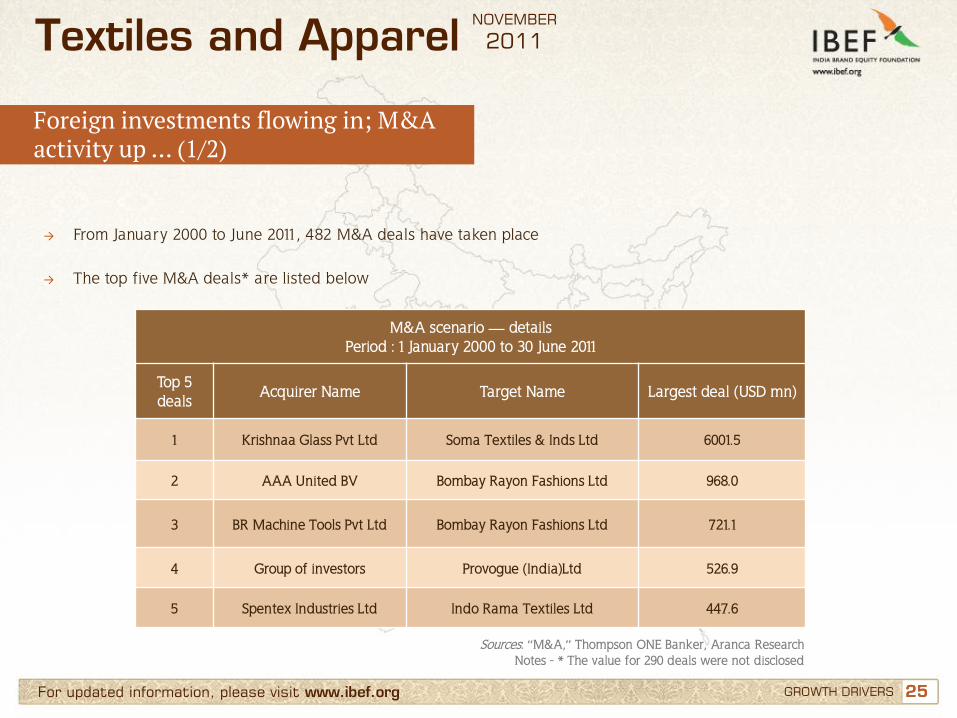
Foreign investments flowing in; M&A activity up … (1/2)
Textiles and Apparel NOVEMBER
2011
→ From January 2000 to June 2011, 482 M&A deals have taken place
→ The top five M&A deals* are listed below
M&A scenario — details Period : 1 January 2000 to 30 June 2011
Top 5 deals
Acquirer Name Target Name Largest deal (USD mn)
1 Krishnaa Glass Pvt Ltd Soma Textiles & Inds Ltd 6001.5
2 AAA United BV Bombay Rayon Fashions Ltd 968.0
3 BR Machine Tools Pvt Ltd Bombay Rayon Fashions Ltd 721.1
4 Group of investors Provogue (India)Ltd 526.9
5 Spentex Industries Ltd Indo Rama Textiles Ltd 447.6
Sources: “M&A,” Thompson ONE Banker, Aranca Research Notes - * The value for 290 deals were not disclosed
26 26 For updated information, please visit www.ibef.org GROWTH DRIVERS
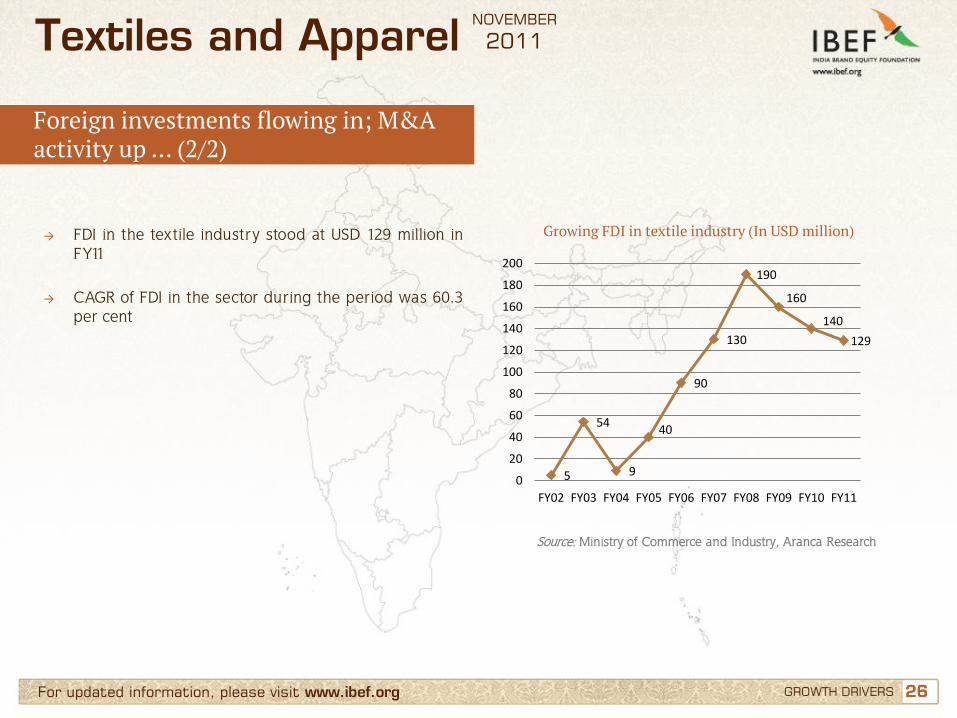
Foreign investments flowing in; M&A activity up … (2/2)
Textiles and Apparel NOVEMBER
2011
→ FDI in the textile industry stood at USD 129 million in FY11
→ CAGR of FDI in the sector during the period was 60.3 per cent
Source: Ministry of Commerce and Industry, Aranca Research
Growing FDI in textile industry (In USD million)
5
54
9
40
90
130
190
160
140
129
0
20
40
60
80
100
120
140
160
180
200
FY02 FY03 FY04 FY05 FY06 FY07 FY08 FY09 FY10 FY11
27 27
Contents
Advantage India
Market overview and trends
Growth drivers
Success stories: Raymond, Alok Industries
Opportunities
Useful information
For updated information, please visit www.ibef.org
Textiles and Apparel NOVEMBER
2011
28 28
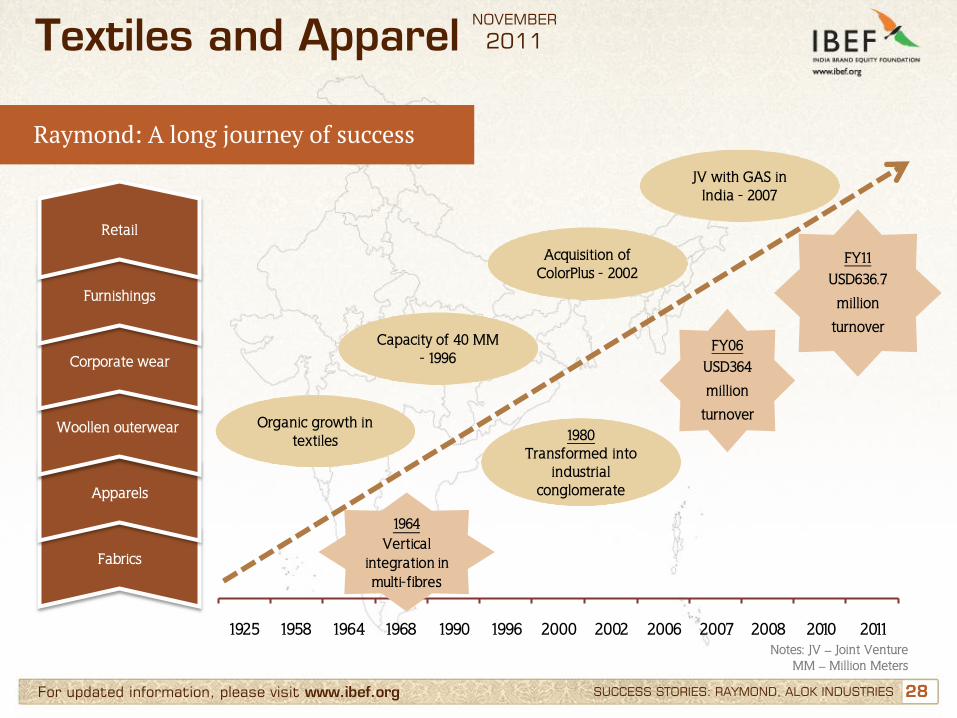
1925 1958 1964 1968 1990 1996 2000 2002 2006 2007 2008 2010 2011
1964Vertical
integration in multi-fibres
For updated information, please visit www.ibef.org SUCCESS STORIES: RAYMOND, ALOK INDUSTRIES
Raymond: A long journey of success
Textiles and Apparel NOVEMBER
2011
Organic growth in textiles
Capacity of 40 MM - 1996
Acquisition of ColorPlus - 2002
1980 Transformed into
industrial conglomerate
FY06 USD364
million
turnover
FY11 USD636.7
million
turnover
Fabrics
Apparels
Woollen outerwear
Corporate wear
Furnishings
Retail
JV with GAS in India - 2007
Notes: JV – Joint Venture MM – Million Meters
29 29
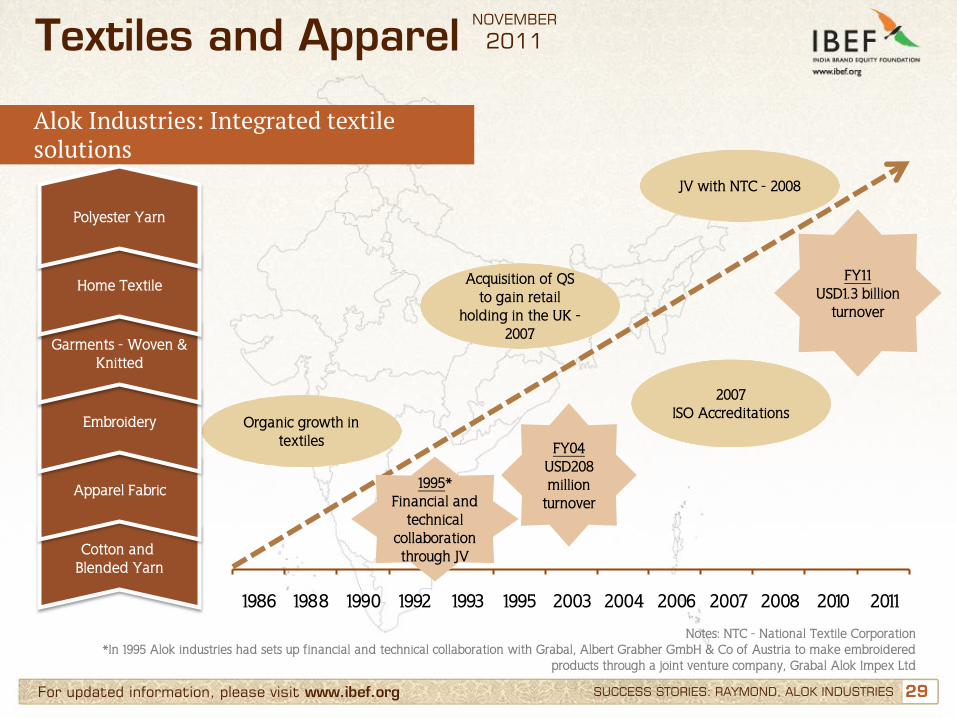
1986 1988 1990 1992 1993 1995 2003 2004 2006 2007 2008 2010 2011
For updated information, please visit www.ibef.org
Alok Industries: Integrated textile solutions
Textiles and Apparel NOVEMBER
2011
Organic growth in textiles
Acquisition of QS to gain retail
holding in the UK -2007
2007 ISO Accreditations
FY04 USD208 million
turnover
FY11 USD1.3 billion
turnover
Cotton and Blended Yarn
Apparel Fabric
Embroidery
Garments - Woven & Knitted
Home Textile
Polyester Yarn
JV with NTC - 2008
Notes: NTC - National Textile Corporation *In 1995 Alok industries had sets up financial and technical collaboration with Grabal, Albert Grabher GmbH & Co of Austria to make embroidered
products through a joint venture company, Grabal Alok Impex Ltd
SUCCESS STORIES: RAYMOND, ALOK INDUSTRIES
1995* Financial and
technical collaboration through JV
30 30
Contents
Advantage India
Market overview and trends
Growth drivers
Success stories: Raymond, Alok Industries
Opportunities
Useful information
For updated information, please visit www.ibef.org
Textiles and Apparel NOVEMBER
2011
31 31 For updated information, please visit www.ibef.org OPPORTUNITIES
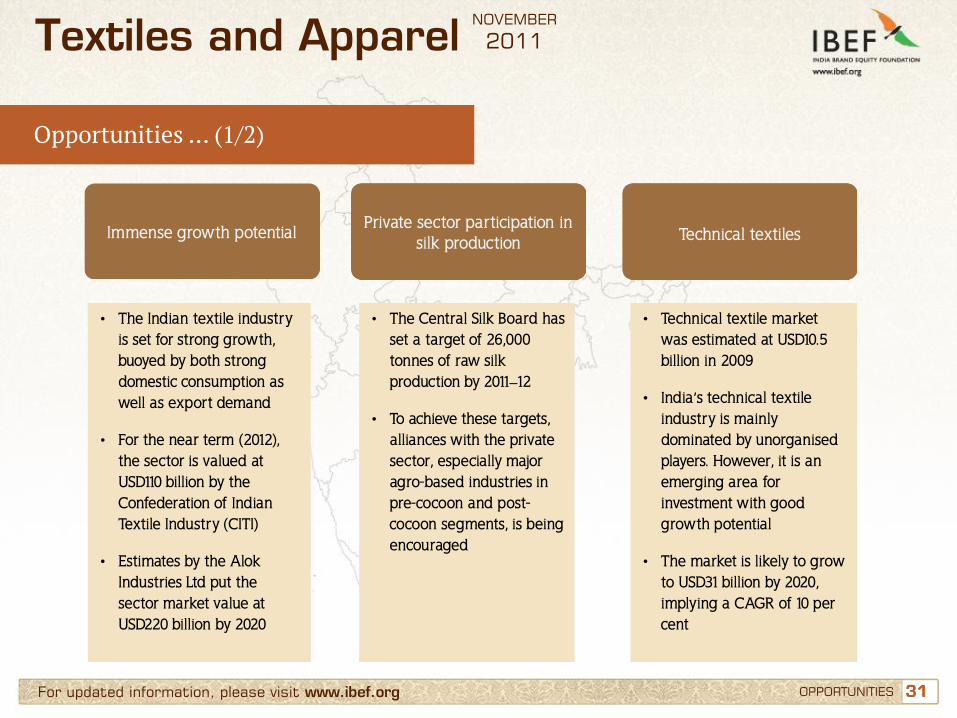
Opportunities … (1/2)
• The Indian textile industry is set for strong growth, buoyed by both strong domestic consumption as well as export demand
• For the near term (2012), the sector is valued at USD110 billion by the Confederation of Indian Textile Industry (CITI)
• Estimates by the Alok Industries Ltd put the sector market value at USD220 billion by 2020
• The Central Silk Board has set a target of 26,000 tonnes of raw silk production by 2011–12
• To achieve these targets, alliances with the private sector, especially major agro-based industries in pre-cocoon and post-cocoon segments, is being encouraged
• Technical textile market was estimated at USD10.5 billion in 2009
• India’s technical textile industry is mainly dominated by unorganised players. However, it is an emerging area for investment with good growth potential
• The market is likely to grow to USD31 billion by 2020, implying a CAGR of 10 per cent
Immense growth potential Private sector participation in
silk production Technical textiles
Textiles and Apparel NOVEMBER
2011
32 32 For updated information, please visit www.ibef.org OPPORTUNITIES
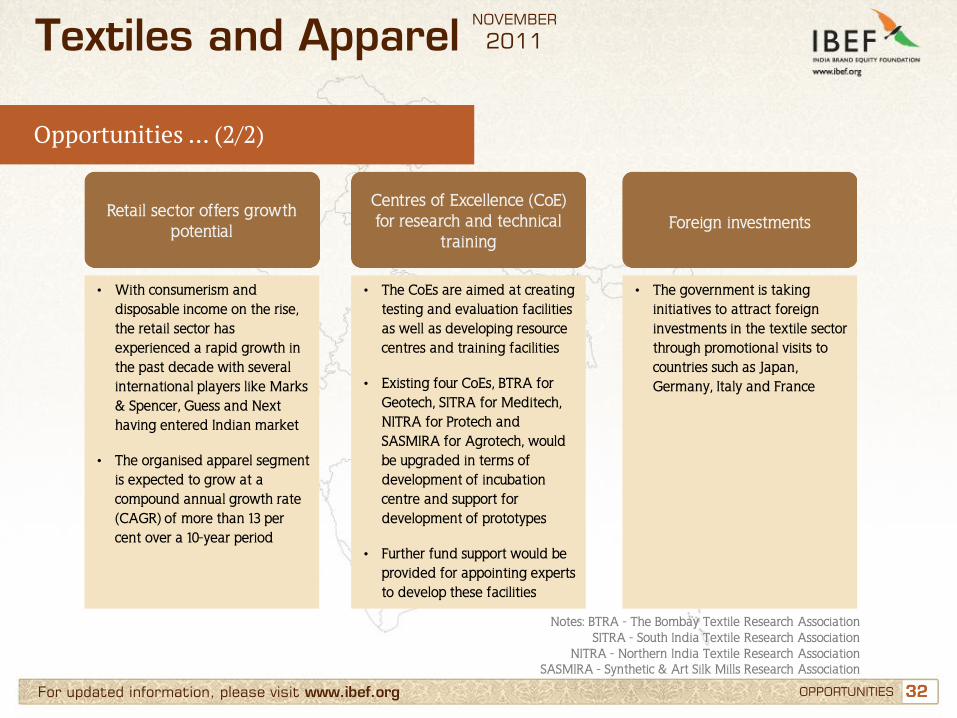
Opportunities … (2/2)
• With consumerism and disposable income on the rise, the retail sector has experienced a rapid growth in the past decade with several international players like Marks & Spencer, Guess and Next having entered Indian market
• The organised apparel segment is expected to grow at a compound annual growth rate (CAGR) of more than 13 per cent over a 10-year period
• The CoEs are aimed at creating testing and evaluation facilities as well as developing resource centres and training facilities
• Existing four CoEs, BTRA for Geotech, SITRA for Meditech, NITRA for Protech and SASMIRA for Agrotech, would be upgraded in terms of development of incubation centre and support for development of prototypes
• Further fund support would be provided for appointing experts to develop these facilities
• The government is taking initiatives to attract foreign investments in the textile sector through promotional visits to countries such as Japan, Germany, Italy and France
Retail sector offers growth potential
Centres of Excellence (CoE) for research and technical
training Foreign investments
Textiles and Apparel NOVEMBER
2011
Notes: BTRA - The Bombay Textile Research Association SITRA - South India Textile Research Association
NITRA - Northern India Textile Research Association SASMIRA - Synthetic & Art Silk Mills Research Association

33 33
Contents
Advantage India
Market overview and trends
Growth drivers
Success stories: Raymond, Alok Industries
Opportunities
Useful information
For updated information, please visit www.ibef.org
Textiles and Apparel NOVEMBER
2011
34 34 For updated information, please visit www.ibef.org USEFUL INFORMATION
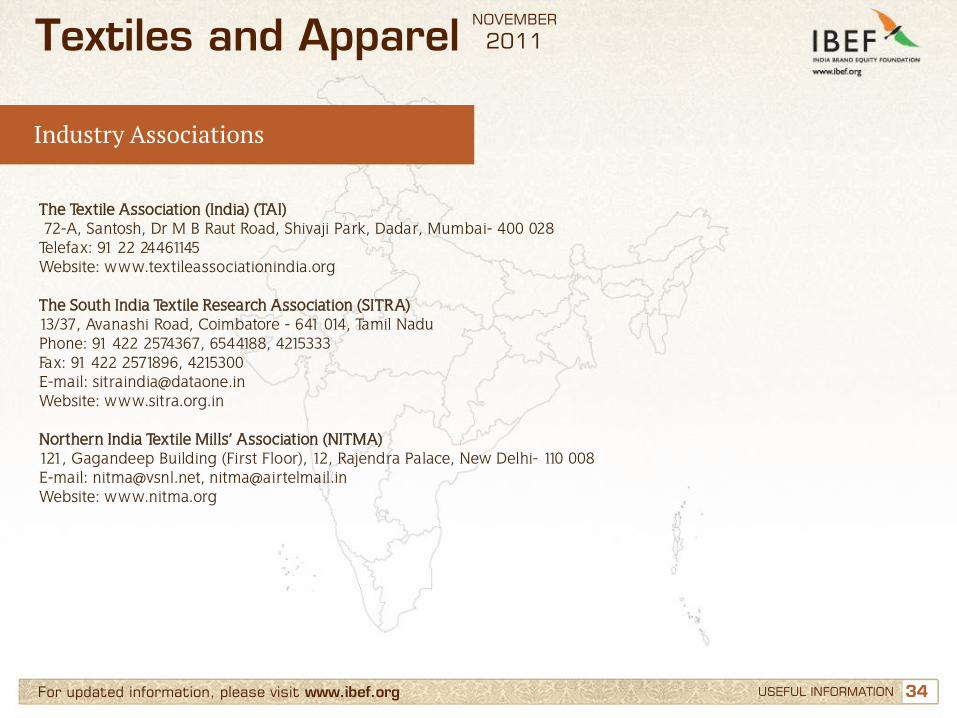
Industry Associations
Textiles and Apparel NOVEMBER
2011
The Textile Association (India) (TAI) 72-A, Santosh, Dr M B Raut Road, Shivaji Park, Dadar, Mumbai- 400 028 Telefax: 91 22 24461145 Website: www.textileassociationindia.org The South India Textile Research Association (SITRA) 13/37, Avanashi Road, Coimbatore - 641 014, Tamil Nadu Phone: 91 422 2574367, 6544188, 4215333 Fax: 91 422 2571896, 4215300 E-mail: [email protected] Website: www.sitra.org.in Northern India Textile Mills’ Association (NITMA) 121, Gagandeep Building (First Floor), 12, Rajendra Palace, New Delhi- 110 008 E-mail: [email protected], [email protected] Website: www.nitma.org
35 35 For updated information, please visit www.ibef.org
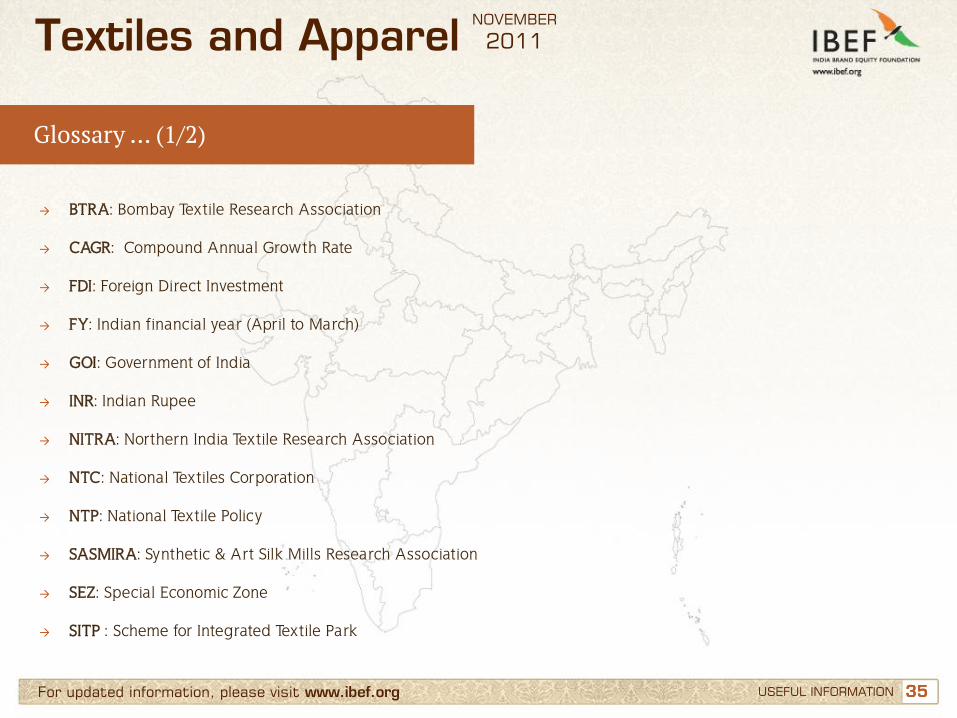
Glossary … (1/2)
→ BTRA: Bombay Textile Research Association
→ CAGR: Compound Annual Growth Rate
→ FDI: Foreign Direct Investment
→ FY: Indian financial year (April to March)
→ GOI: Government of India
→ INR: Indian Rupee
→ NITRA: Northern India Textile Research Association
→ NTC: National Textiles Corporation
→ NTP: National Textile Policy
→ SASMIRA: Synthetic & Art Silk Mills Research Association
→ SEZ: Special Economic Zone
→ SITP : Scheme for Integrated Textile Park
USEFUL INFORMATION
Textiles and Apparel NOVEMBER
2011
36 36 For updated information, please visit www.ibef.org
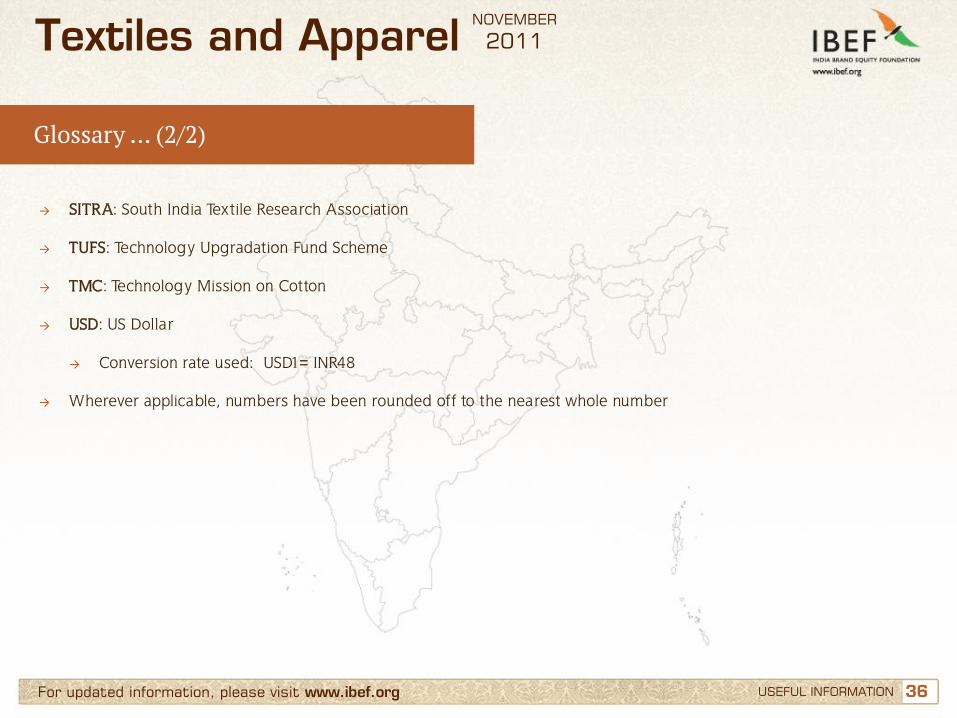
Glossary … (2/2)
→ SITRA: South India Textile Research Association
→ TUFS: Technology Upgradation Fund Scheme
→ TMC: Technology Mission on Cotton
→ USD: US Dollar → Conversion rate used: USD1= INR48
→ Wherever applicable, numbers have been rounded off to the nearest whole number
USEFUL INFORMATION
Textiles and Apparel NOVEMBER
2011
37
India Brand Equity Foundation (IBEF) engaged Aranca to prepare this presentation and the same has been prepared by Aranca in consultation with IBEF. All rights reserved. All copyright in this presentation and related works is solely and exclusively owned by IBEF. The same may not be reproduced, wholly or in part in any material form (including photocopying or storing it in any medium by electronic means and whether or not transiently or incidentally to some other use of this presentation), modified or in any manner communicated to any third party except with the written approval of IBEF. This presentation is for information purposes only. While due care has been taken during the compilation of this
presentation to ensure that the information is accurate to the best of Aranca and IBEF’s knowledge and belief, the content is not to be construed in any manner whatsoever as a substitute for professional advice. Aranca and IBEF neither recommend nor endorse any specific products or services that may have been mentioned in this presentation and nor do they assume any liability or responsibility for the outcome of decisions taken as a result of any reliance placed on this presentation. Neither Aranca nor IBEF shall be liable for any direct or indirect damages that may arise due to any act or omission on the part of the user due to any reliance placed or guidance taken from any portion of this presentation.
Disclaimer
For updated information, please visit www.ibef.org DISCLAIMER
Textiles and Apparel NOVEMBER
2011