texturing of concrete pavementsonlinepubs.trb.org/onlinepubs/nchrp/nchrp_rpt_634appendixes.pdf ·...
TRANSCRIPT

Project No. 10-67
COPY NO.
TEXTURING OF CONCRETE PAVEMENTS
FINAL REPORT APPENDIXES A-F
Prepared for: National Cooperative Highway Research Program
Transportation Research Board National Research Council
Prepared By: J.W. Hall, K.L. Smith, and P. Littleton—Applied Research Associates, Inc.
November 12, 2008

ACKNOWLEDGMENT OF SPONSORSHIP This work was sponsored by the American Association of State Highway and Transportation Officials, in cooperation with the Federal Highway Administration, and was conducted in the National Cooperative Highway Research Program, which is administered by the Transportation Research Board of the National Academies.
DISCLAIMER This is an uncorrected draft as submitted by the research agency. The opinions and conclusions expressed or implied in the report are those of the research agency. They are not necessarily those of the Transportation Research Board, the National Academies, or the program sponsors.
i
TABLE OF CONTENTS LIST OF FIGURES ................................................................................. v
Page
LIST OF TABLES ................................................................................ vii ACKNOWLEDGMENTS ..................................................................... viii ABSTRACT .............................................................................................. x SUMMARY ............................................................................................. xi 1. INTRODUCTION .............................................................................. 1 BACKGROUND ........................................................................................................... 1 DESCRIPTION OF THE PROBLEM ....................................................................... 2 PROJECT OBJECTIVES AND SCOPE ................................................................... 2 WORK APPROACH .................................................................................................... 2 OVERVIEW OF REPORT .......................................................................................... 3 2. STATE OF THE PRACTICE ............................................................ 5 LITERATURE REVIEW ............................................................................................. 5 STATE AND INDUSTRY INTERVIEWS ............................................................ 5 STATE OF THE PRACTICE SUMMARY ................................................................ 6 Pavement Surface Properties ............................................................................ 6 Methods of Measuring Pavement Surface Properties .................................. 6 Texturing Methods for Concrete Pavements ................................................ 10 Highway Agency Texturing Policies and Practices .................................... 15 3. EVALUATION OF EXISTING TEXTURE TEST SECTIONS ... 17 INTRODUCTION ...................................................................................................... 17 TEST SECTION SELECTION ................................................................................. 17 COLLECTION OF PAVEMENT DATA .................................................................. 19 TEST SECTION DESCRIPTIONS .......................................................................... 22 TEXTURE, FRICTION, AND NOISE TESTING OF EXISTING TEXTURE TEST SECTIONS ....................................................................................................... 22 Field Testing Protocol ....................................................................................... 22 Formal Testing .................................................................................................... 25 AGENCY-SUPPLIED FRICTION DATA ............................................................... 29 TEXTURE, FRICTION, AND NOISE TESTING RESULTS................................ 29

ii
TABLE OF CONTENTS (CONTINUED) 4. CONSTRUCTION AND EVALUATION OF NEW
Page
TEST SECTIONS ............................................................................. 35 SURFACE TEXTURES SELECTED FOR DETAILED EVALUATION ............. 35 IDENTIFICATION OF A CANDIDATE PAVING PROJECT ............................. 36 PROJECT OVERVIEW ............................................................................................. 36 CONSTRUCTION OF NEW TEST SECTIONS ..................................................... 37 Diamond Grinding and Grooving .................................................................... 46 Establishing Test Segments .............................................................................. 48 COLLECTION OF CONCRETE DATA .................................................................. 51 TEXTURE, FRICTION, AND NOISE TEST PROCEDURES.............................. 51 Field Testing Protocol ....................................................................................... 51 TEXTURE, FRICTION, AND NOISE TEST RESULTS ....................................... 53 5. DATA ANALYSIS ............................................................................ 55 OVERVIEW OF ANALYSES .................................................................................... 55 SPECTRAL ANALYSES ........................................................................................... 56 Noise Spectrum Analysis ................................................................................... 56 Texture Spectrum Analysis .............................................................................. 63 COMPARATIVE/QUALITATIVE ANALYSES ...................................................... 67 Comparison of Textures by Site/Location ..................................................... 67 Texture Durability Analysis ............................................................................. 87 Noise Comparison ............................................................................................... 91 Relationship of Near-Field Noise with Interior Noise and Pass-By Noise....................................................................................................... 96 STATISTICAL ANALYSES ...................................................................................... 98 Texture Depth Measurement Procedure ....................................................... 98 Test Site/Location Performance Analysis ...................................................... 99 Analysis of Texture, Friction, and Noise......................................................100 Noise–Texture Relationship ...........................................................................104 TEXTURE CONSTRUCTION ANALYSES ..........................................................107 Nominal vs. Actual Texture ............................................................................107 6. TEXTURE SELECTION PROCESS ........................................... 109 INTRODUCTION ....................................................................................................109 TEXTURE SELECTION PROCESS .....................................................................110 Step 1—Project Information Gathering .......................................................110 Step 2—Feasible Textures Based on Friction Requirements ..................110 Step 3—Feasible Textures Based on Noise Requirements & Preferences ....................................................................................................118 Step 4—Selection of the Preferred Texturing Alternative .......................121 EXAMPLE APPLICATION OF TEXTURE SELECTION PROCESS ..............122 TEXTURE CONSTRUCTION SPECIFICATIONS AND PRACTICES ............123

iii
TABLE OF CONTENTS (CONTINUED) 7. CONCLUDING REMARKS AND RECOMMENDATIONS ..... 127
Page
CONCLUDING REMARKS ....................................................................................127 RECOMMENDATIONS FOR FUTURE RESEARCH ........................................128 REFERENCES .................................................................................... 129 ABBREVIATIONS AND ACRONYMS ............................................. 135 APPENDIX A. DETAILED DESCRIPTION OF STATE-OF- THE-PRACTICE IN CONCRETE PAVEMENT TEXTURING..... A-1 APPENDIX B. HIGHWAY AGENCY AND INDUSTRY INTERVIEWS REPORT .................................................................... B-1 APPENDIX C. EXISTING TEXTURE TEST SECTIONS ............ C-1 APPENDIX D. TEXTURE, FRICTION, AND NOISE RESULTS FOR EXISTING TEXTURE TEST SECTIONS ........... D-1 APPENDIX E. TEXTURE, FRICTION, AND NOISE RESULTS FOR NEW I-355 SOUTH EXTENSION TEXTURE TEST SECTIONS ........................................................................................... E-1 APPENDIX F. GUIDE/SAMPLE SPECIFICATIONS FOR TEXTURE ............................................................................................ F-1

iv
This page intentionally left blank.

APPENDIX A. DETAILED DESCRIPTION OF STATE-OF-THE-PRACTICE IN CONCRETE PAVEMENT
TEXTURING

A-1
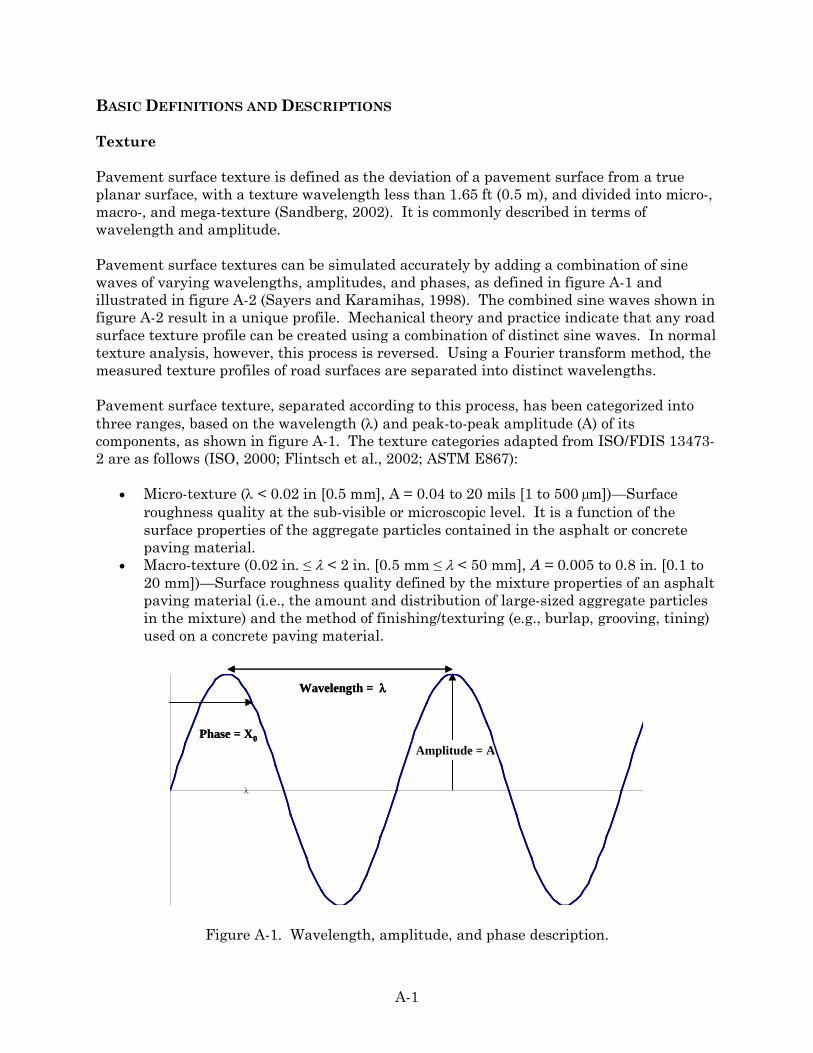
BASIC DEFINITIONS AND DESCRIPTIONS Texture Pavement surface texture is defined as the deviation of a pavement surface from a true planar surface, with a texture wavelength less than 1.65 ft (0.5 m), and divided into micro-, macro-, and mega-texture (Sandberg, 2002). It is commonly described in terms of wavelength and amplitude. Pavement surface textures can be simulated accurately by adding a combination of sine waves of varying wavelengths, amplitudes, and phases, as defined in figure A-1 and illustrated in figure A-2 (Sayers and Karamihas, 1998). The combined sine waves shown in figure A-2 result in a unique profile. Mechanical theory and practice indicate that any road surface texture profile can be created using a combination of distinct sine waves. In normal texture analysis, however, this process is reversed. Using a Fourier transform method, the measured texture profiles of road surfaces are separated into distinct wavelengths. Pavement surface texture, separated according to this process, has been categorized into three ranges, based on the wavelength (λ) and peak-to-peak amplitude (A) of its components, as shown in figure A-1. The texture categories adapted from ISO/FDIS 13473-2 are as follows (ISO, 2000; Flintsch et al., 2002; ASTM E867):
• Micro-texture (λ < 0.02 in [0.5 mm], A = 0.04 to 20 mils [1 to 500 µm])—Surface roughness quality at the sub-visible or microscopic level. It is a function of the surface properties of the aggregate particles contained in the asphalt or concrete paving material.
• Macro-texture (0.02 in. ≤ λ < 2 in. [0.5 mm ≤ λ < 50 mm], A = 0.005 to 0.8 in. [0.1 to 20 mm])—Surface roughness quality defined by the mixture properties of an asphalt paving material (i.e., the amount and distribution of large-sized aggregate particles in the mixture) and the method of finishing/texturing (e.g., burlap, grooving, tining) used on a concrete paving material.
Figure A-1. Wavelength, amplitude, and phase description.
Amplitude = APhase = X0
Wavelength = λ
Amplitude = APhase = X0
Wavelength = λ
λ

A-2
Figure A-2. Combination of waves results in distinct profile (Sayers and Karamihas, 1998).
• Mega-texture (2 in. ≤ λ < 20 in. [50 mm ≤ λ < 500 mm], A = 0.005 to 2 in. [0.1 to 50 mm])—This type of texture has wavelengths in the same order of size as a tire/road interface. It is defined by the distress, defects, or “waviness” on the road surface.
The texture wavelength spectra have been further described and expanded by the 2003 PIARC World Road Congress report group B and others into ranges for micro-texture, macro-texture, mega-texture, unevenness, and cross slope that relate generally with the above listed surface characteristics factors. The range of texture relating to these factors and their interrelations are illustrated in figure A-3. Amplitudes of micro-texture, macro-texture, and mega-texture wavelengths have been found to vary between 1/10 and 1/100 of the wavelength (Ergun et al., 2004). Recommendations of PIARC group B are that generally textures with wavelengths less than 2 in (50 mm) be increased and textures with wavelengths greater than 2 in (50 mm) be minimized (Henry, 2000). One shortcoming of using spectral analysis to analysis texture is that it gives the same value when the texture is positive or negative (bumps verses holes). For influence on friction and noise, this difference is important. As seen in figure A-3, the frictional characteristics of pavement surfaces are primarily influenced by micro-texture and macro-texture. Micro-texture contributes significantly to surface friction on dry roads at all speeds and on wet roads at slower speeds, while macro-texture significantly influences surface friction on wet road surfaces with vehicles moving at higher speeds. Highway noise is affected by the macro-texture and mega-texture of a roadway. Ride quality is influenced by textures in the unevenness range.
-5
-4
-3
-2
-1
0
1
2
3
4
Sine wave 1
Sine wave 3
Sine wave 2
Combined sine waves
-5
-4
-3
-2
-1
0
1
2
3
4
Sine wave 1
Sine wave 3
Sine wave 2
Combined sine waves

A-3
Figure A-3. Relationship of road surface texture and other factors (PIARC, 2003). Friction Pavement–tire friction is the force that resists the relative motion between a vehicle tire and a pavement surface (Hall et al., 2006). This resistive force, illustrated in figure A-4, is generated as the tire rolls or slides over the pavement surface.
Figure A-4. Simplified diagram of forces acting on a rotating wheel (Hall et al., 2006).
Weight, FW
Friction Force, F
Direction of motion
Rotation

A-4
The resistive force, characterized using the non-dimensional friction coefficient, µ , is the ratio of the tangential friction force (F) between the tire tread rubber and the horizontal traveled surface to the perpendicular force or vertical load (FW) and is computed using equation A-1 (Hall et al., 2006).
FwF
=µ Eq. A-1
Pavement friction plays a vital role in keeping vehicles on the road, as it gives drivers the ability to control/maneuver their vehicles in a safe manner, in both the longitudinal and lateral directions. It is a key input for highway geometric design, as it is used in determining the adequacy of the minimum stopping sight distance, minimum horizontal radius, minimum radius of crest vertical curves, and maximum super-elevation in horizontal curves. Generally speaking, the greater the friction available at the pavement–tire interface, the more control the driver has over the vehicle. Pavement–tire friction is the result of a complex interplay between adhesion and hysteresis forces (Glennon, 1996) (see figure A-5). Adhesion is the friction due to the VanderWaals forces that develop between the vehicle tire rubber and the pavement surface. The VanderWaals forces reflect the interlocking of the microstructures as the micro-asperities of the two surfaces come into contact with each other (Personn, 1998; Dewey et al., 2002). The hysteresis component of friction forces occurs as a result of the energy loss due to bulk deformation of the vehicle tire in relative motion against the rough pavement texture (i.e., macro-texture) (Moore, 1972; Dewey et al., 2002).
Figure A-5. Adhesion and hysteresis, the two principle components of pavement–tire friction (Glennon, 1996).

A-5
For tires sliding over the pavement at relatively high speeds, hysteresis is the major contributor of surface friction, while at relatively low speeds of sliding, adhesion is the major contributor (Kummer, 1996; Dewey et al., 2002). The pavement surface frictional properties of interest to pavement engineers are:
• The longitudinal frictional forces that occur at the pavement–tire interface for vehicle traveling in a straight segment along a highway.
• The side force friction that occurs at the pavement–tire interface while a vehicle is traversing a curve.
Longitudinal friction is characterized as the dynamic friction process between a rolling pneumatic tire and the road surface. It entails two modes of operation—free-rolling, whereby there is no braking and the relative speed between the tire circumference and the pavement (i.e., slip speed) is zero, and constant-braked, whereby some level of braking is applied, causing the slip speed to increase from zero to a potential maximum of the speed of the vehicle. The amount of longitudinal friction is a function of tire slip, as illustrated in figure A-6. Lateral friction occurs as a vehicle changes direction or compensates for pavement cross-slope and/or wind effects (Hall et al., 2006). The pavement–tire steering/cornering force diagram in figure A-7 shows how the side-force friction factor acts as a counter balance to the centripetal force developed as a vehicle performs a lateral movement. The basic relationship between the forces acting on the vehicle tire and the pavement surface as the vehicle steers around a curve, changes lanes, or compensates for lateral forces is as follows: Eq. A-2 where: FS = Side friction. V = Vehicle speed, mi/hr. R = Radius of the path of the vehicle’s center of gravity (also, the radius of curvature in a curve), ft. e = Pavement super-elevation, ft/ft.
eR
VFS −=15
2

A-6
Figure A-6. Pavement friction versus tire slip (Hall et al., 2006).
Figure A-7. Dynamics of a vehicle traveling around a constant radius curve at a constant speed, and the forces acting on the rotating wheel (Hall et al., 2006).
Peak friction
Critical slip
Full sliding
100 (fully-locked)
0 (free rolling)
Tire Slip, %
Coefficient of Friction
Increased Braking
Intermittent sliding
W Weight of vehicle P Centripetal force (horizontal) FS Friction force between tires and roadway surface (parallel to roadway surface) α Angle of super-elevation (tan α = e) R Radius of curve
α
α
W
P FS
Direction of Travel
Drag Force
Side Friction Force (Friction Factor)
Friction Measuring Wheel

A-7
Pavement–Tire Noise Noise, in the broadest sense, is defined as sound that a human hearer experiences as unpleasant or disturbing and can simply be described as undesirable or unwanted sound. Problems arising from noise include annoyance, interference with conversation, leisure or sleep, decreased proficiency in physical or mental tasks, and potential or actual hearing loss. With respect to highway traffic, noise is the generation of sounds that affect the quality of life for persons near roadways (Hanson, 2003) and the level of comfort experienced by highway users as they traverse the roadway. Sound is vibration of the air that can be heard by people. It is a form of energy, and the measure of this energy is the sound pressure squared (p2). Because the sound pressure can range by many orders of magnitude, it has become customary to express sound pressure in terms of sound pressure level as defined by the following formula:
Eq. A-3
where: SPL = Sound pressure level in decibels. p = Sound pressure. po = Reference sound pressure (0.00002 N/m2).
The apparent loudness that we attribute to a sound varies not only with sound pressure level, but also with the frequency of sound. For example, we cannot hear sounds with a frequency of less than about 20 Hz (cycles per second), and we are very sensitive to sounds at a frequency of 2000 Hz. This effect is taken into account by “weighting” sounds of different frequencies before combining them into an overall sound pressure level. For environmental assessment it has become common to use “A” weighting and measuring sound levels in terms of A-weighted decibels (expressed as dB(A)). The sound level ranges from 0 dB(A), which is the threshold of human hearing, to 140 dB(A), the point at which serious hearing damage can occur. Table A-1 lists typical noise levels associated with various daily activities (Hanson, 2003). Offset distances were not provided by the author.
Table A-1. Sound levels associated with common activities.
Activity Sound Level, dB(A) Lawnmower 95 Loud shout 90 Motorcycle passing 50 ft (15 m) away 85 Blender at 3 ft (1 m) 85 Car traveling 60 mi/hr (97 km/hr) passing 50 ft (15 m) away 80 Normal conversation 60 Birds singing 50 Quiet living room 40
= 2
2
10log10)(op
pdBSPL

A-8
For a point source in a free field, such as a single vehicle moving along an empty road, sound pressure varies inversely with distance. Thus, a doubling of distance between the point source and the receiver results in a reduction of 6 dB(A), and halving of distance results in a 6 dB(A) increase. For a line source in a free field, such as a very large number of similar vehicles moving continuously along the road, sound pressure varies inversely with the square root of distance. Thus, a doubling of distance between the line source and the receiver results in a reduction of 3 dB(A), and halving of distance results in a 3 dB(A) increase. Because sound is measured on a logarithmic scale, the combined effect of multiple sources of noise cannot be obtained by adding the decibel values directly. The combined sound level is determined by combining the individual sound pressure levels in accordance with the following formula (Hanson, 2003): dB(A)t = 10*log [101{dB(A)/10} + 102{dB(A)/10} + …. + 10n{dB(A)/10}] Eq. A-4 Thus, the resultant sound pressure level obtained by combining two equal 70 dB(A) sound pressure levels is not 140 dB(A), but 73 dB(A). In the case of highway traffic noise, there can be many individual sources of noise, depending on the number of vehicles traversing the roadway. Additionally, for each vehicle there are three separate sources of noise: power unit noise (engine, fan, exhaust, and transmission), aerodynamic noise (i.e., turbulent airflow around the vehicle), and pavement–tire noise. The combined effect of highway noise on a receiver situated near the roadway depends on the sound characteristics of the individual vehicles on the roadway and on the transmission path between the individual vehicles and the receiver. METHODS AND EQUIPMENT FOR MEASURING TEXTURE, FRICTION, AND NOISE Texture Pavement surface texture measurement methods vary depending on the type of texture being evaluated (micro-, macro-texture, mega-texture, unevenness). Table A-2 summarizes the commonly used texture measurement equipment, their reported levels of accuracy, applicability, and cost factors (Henry, 2000; Rado, 1994; Wambold et al., 1995; AASHTO, 1976). Micro-texture has often been estimated using the British Pendulum Tester (BPT). Although this device has primarily been used in the lab, it can be used in the field. The Dynamic Friction Tester (DF Tester) (ASTM E 1911), operated at 12.5 mi/hr (20 km/hr) rotational speed, is increasingly being used in the field and has shown to be very repeatable.

A-9
Table A-2. Pavement surface texture test methods.
Test Method/Equipment
Associated Standard
Description
Measurement Index
Accuracy Applicability
Cost
Sand Patch Method (SPM)
ASTM E 965, ISO 10844
This volumetric-based test method provides the mean depth of road surface macro-texture. The operator spreads a known volume of glass beads (ASTM D 1155) in a circle onto the surface and determines the diameter and subsequently mean texture depth (MTD).
• Mean texture depth (MTD) of macro-texture.
• 2% • Simple and inexpensive
• Localized method
Equipment: Low Test Rate: Slow Other: Traffic control required
Outflow Meter (OF Meter)
ASTM WK 364 Volumetric test method that provides a measure of the escape time for water beneath a moving tire. The operator measures the rate of gravity controlled outflow from a cylinder placed on a road surface.
• Time for outflow of specified volume of water.
• 0.5 sec • Simple methods and relatively inexpensive equipment.
• Localized measurement.
• Equipment: Moderate • Test Rate: Slow • Other: Traffic control
required
Circular Texture Meter (CT Meter)
ASTM E 2157 Provides a mean profile depth of the road surface macro-texture. The equipment measures an 11-in (284-mm) circular profile of the road surface at intervals of 0.03 in (0.87 mm).
• Mean profile depth (MPD).
• Root mean square (RMS) texture depth.
• 0.03 mm • Measures same diameter as DFT.
• Localized measurement
• Texture measured in 2 directions.
• Equipment: Moderate • Test Rate: Slow • Other: Traffic control
required
Texture Depth Gauge (TDG)
ASTM T 261 Provides an average depth of PCC grooves or tines. The gauge is inserted into 10 grooves to measure their depths.
• Average groove/tine depth.
• N/A • Simple methods and inexpensive equipment.
• Not a measure of defined texture
• Equipment: Low • Test Rate: Slow • Other: Labor
intensive, traffic control required
British Pendulum Tester (BPT)
ASTM E 303 Provides an indirect measure of relative micro-texture. The testing device measures drag on a rubber footed pendulum swung across the road surface.
• British Pendulum Number (BPN).
• Measure of micro-texture.
• 1.2 BPN units
• Methodology is critical
• Can be done in laboratory
• Equipment: Moderate • Test Rate: Slow • Other: Traffic control
required Electro-optic (laser,
light sectioning, ultrasonic, stylus)
method (EOM)
ASTM E 1845 ISO 13473-1 ISO 13473-2 ISO 13473-3
Provides a profile of the road surface macro-texture. This equipment uses an optical distance measuring sensor to collect surface elevation data at intervals of 0.25 mm (0.01 in) or less.
• Mean profile depth (MPD).
• Estimated texture depth (ETD).
• Profile amplitude. • Texture spectrum.
• 0.15 mm • Some equipment collects at high speeds.
• Correlates well with MTD.
• Continuous measurement possible.
• One direction only
• Equipment: Moderate to high
• Test Rate: Low to high • Other: Traffic control
not required with vehicle mounted devices.

A-10
Macro-texture can be measured using volumetric methods (i.e., the Sand Patch Method [SPM] and Outflow Meter [OFM]), the Circular Texture Meter (CT Meter), and electro-optic methods. Each of these methods is a stationary test and requires lane closure. When traffic control is not available or desired, high-speed laser electro-optic profilers can be used to measure macro-texture, mega-texture, and unevenness. Indices used for quantifying road surface texture include the Mean Texture Depth (MTD) (ASTM E 965), Mean Profile Depth (MPD) (ASTM E 1845, ASTM E 2157), and Estimated Texture Depth (ETD). MTD can be estimated using MPD from a CT Meter with a correlation coefficient of 0.98 (Henry, 2000). Friction The most common method for measuring highway friction in the U.S. is the ASTM E 274 locked-wheel testing equipment, with some variations in test speed and tire properties. This method simulates braking without using anti-lock brakes (Henry, 2000). Internationally, there is more use of side force, fixed slip, and variable slip measurement devices. Table A-3 provides more details on typical friction measurement methods, their applicability and costs (Henry, 2000). As stated, the E 274 trailer is the standard method in the U.S. The trailer is used to provide a friction number (FN). The method is used for routine network surveys and often at the project level. Recent studies suggest the addition of lasers to measure macro-texture and most new testers are being ordered with texture lasers. This allows for measurements at speeds other than the standard 40 mi/hr (64 km/hr), with a way to adjust the measurement to 40 mi/hr (64 km/hr). Thus, measurements on interstates can be taken at higher speeds, while in towns and at intersections they can be taken at lower speeds. They all can be adjusted to a common speed of 40 mi/hr (64 km/hr). The Dynamic Friction Tester (ASTM E1911) is gaining acceptance and provides more information because it allows measuring friction as a function of speed over the range from 0 to 56 mi/hr (0 to 90 km/hr) (Flintsch et al., 2002). The DFT measured at 12.5 mi/hr (20 km/hr) correlates well with BPN, as shown in figure A-8 (Henry, 2000). Friction measurement using a ribbed test tire does not adequately assess road macro-texture, because their grooves allow for removal of water at the pavement–tire interface, eliminating the need for good road macro-texture (Henry, 2000). Indices used in the U.S. for quantifying friction include FN at 40 mi/hr (64 km/hr) (ASTM E 274) using ribbed (ASTM E 501) or smooth (ASTM E 524) testing tires. These indices are designated as FN40R and FN40S by AASHTO specifications (SN40R and SN40S by ASTM specifications). When the speed number is in metric units (km/hr), the number is placed in brackets (e.g., FN(64)R) (Henry, 2000).

A-11
Table A-3. Pavement friction test methods.
Test Method
Associated Standard Description Equipment Measurement Index Accuracy Application Cost
Stopping Distance
Measurement
ASTM E 445
Method consists of driving a vehicle, locking the wheels when the desired speed is reached, and measuring the distance the vehicle travels until full stop occurs.
Almost any vehicle in good working order can be used to determine stopping distance and, hence, road friction.
Coefficient of friction, µ, is determined using the following equation: where: µ = Coefficient of friction. v = Vehicle brake application speed, ft/sec (m/sec). g = Acceleration due to gravity, 32.2 ft/sec2 (9.81 m/sec2). d = Stopping distance, ft (m).
Typical standard deviation is 5 percent
Field testing (straight segments)
Equipment: $300 to $1.000 Test Rate: Very slow Other: Road must be closed
Deceleration Rate
Measurement
ASTM E2101
In this method, a small mass within the vehicle acting on a strain gage sensor is used to generate a signal proportional to the vehicle’s deceleration force as the vehicle is braking. The recommended braking time with this kind of instrument is approximately 2 sec (Al-Qadi et al., 2002).
No standardized equipment available; however, there is an ASTM Standard just passed which will have a number shortly.
The measured deceleration force is used to calculate the road surface friction coefficient, µ.. The coefficient of friction can also be computed using vehicle speed when the braking starts and ends, and the braking time. In this approach, the mean value of the deceleration is determined by computing the difference between the speed when the braking starts and ends, and dividing it by the braking time. The mean value of the friction is then obtained by dividing the calculated deceleration with the gravitational constant (g = 32.2 ft/sec2 [9.81 m/sec2]).
Typical standard deviation is 5 percent
Field testing (straight segments)
Equipment: $500 to $1,000 Test Rate: Very slow Other: Road must be closed
Locked-Wheel
ASTM E 274
This device is installed on a trailer which is towed behind the measuring vehicle at a speed of 40 mi/hr (64 km/hr). Water may be applied in front of the test tire, a braking system is forced to lock the tire, and the resistive drag force is measured and averaged for 1 sec after the test wheel is fully locked.
Measuring vehicle and locked-wheel skid trailer, equipped with either a ribbed tire (ASTM E 501) or a smooth tire (ASTM E 524). ASTM E 274 recommends the ribbed tire.
The measured resistive drag force and the wheel load applied to the road are used to compute the coefficient of friction, µ. Friction is reported as FN, which is computed as follows: where: FN = Friction number at the measured speed. µ = Coefficient of friction. F = Tractive force applied to the tire. W = Vertical load applied to the tire.
Typical standard deviation is one FN
Field testing (straight segments) and curves up to a side acceleration of 0.3 Gs
Equipment: $100 ,000 to $200,000 Test Rate: Highway speeds Other: Not continuous collection
dgv
**2
2
=µ
WFFN 100100 == µ

A-12
Table A-3. Pavement friction test methods (continued).
Test Method Associated Standard Description Equipment Measurement Index Accuracy Application Cost
Side-Force ASTM E 670 Side-force friction measuring devices estimate the road surface friction at an angle to the direction of motion (usually perpendicular).
-British Mu-Meter (measures the side force developed by two yawed wheels). -British Sideway Force Coefficient Routine Investigation Machine (SCRIM) (has a wheel yaw angle of 20°).
The side force perpendicular to the plane of rotation is measured and used to compute the sideways force coefficient, SFC.
Typical standard deviation is 2 MuN units
Field testing (straight and curved sections)
Equipment: $50,000 and up Test Rate: Highway speeds
Fixed-Slip Under ASTM ballot
Fixed-slip devices perform tests typically between 10 and 20 percent slip speed.
-Roadway and runway friction testers (RFTs) -Airport Surface Friction Tester (ASFT) -Saab Friction Tester (SFT) -Griptester.
The measured resistive drag force and the wheel load applied to the road are used to compute the coefficient of friction, µ. Friction is reported as FN.
A large range depending on the equipment
Field testing (straight segments)
Equipment: $35,000 to $150,000 Test Rate: Highway speeds
Variable-Slip ASTM E 1859 Variable-slip devices measure friction as a function of slip between the wheel and the highway surface. They provide information about the frictional characteristics of the tire and highway surfaces, such as the initial increasing portion of the friction slip curve is dependent upon the tire properties, whereas the portion after the peak is dependent upon the road surface characteristics.
-French IMAG -Norwegian Norsemeter RUNAR, ROAR, and SALTAR systems. -ASTM E 1551 specifies the test tire suitable for use in variable-slip devices (ASTM 1998f)
The measured resistive drag force and the wheel load applied to the road are used to compute the coefficient of friction, µ. Friction is reported as FN.
Typical standard deviation is 0.05
Field testing (straight segments)
Equipment: $40,000 to $500,000 Test Rate: Highway speeds

A-13
Table A-3. Pavement friction test methods (continued).
Test Method Associated Standard Description Equipment Measurement Index Accuracy Application Cost
Traction Control Systems
No test protocol available
Uses the braking intensity level when the traction control engages as a measure of the friction
Under development Under development Unknown Field testing (straight segments)
Equipment: Under development Test Rate: Highway speeds
Anti-lock Brake Systems
No test protocol available
Uses the braking intensity level when the ABS system engages as a measure of the friction.
Under development Under development Unknown Field testing (straight segments)
Equipment: Under development Test Rate: Highway speeds
Portable Testers
ASTM E 303 ASTM E 1911
Portable testers can be used to measure the frictional properties of road surfaces. These testers use pendulum or slider theory to measure friction in a laboratory or in the field. Test devices take spot measurements, and to quantify a given section of road, several measurements must be made over the length of the section. Does not always simulate tire/road characteristics
-British Portable Tester (BPT) (most recognized portable friction measurement device)* -Dynamic Friction Tester (DF Tester) (gaining acceptance and provides more information, because it allows measuring friction as a function of speed over the range from 0 to 56 mi/hr (0 to 90 km/hr).
Several available, based on test equipment type. Most common index is the British Pendulum Number (BPN). DF Tester at 20 km/hr (12.5 mi/hr) relates to the BPN
Generally better than 5 percent. BPN tests are not very reproducible and vary greatly from one operator to another. The DF Tester on the other hand has been very reproducible.
BPT relates well with micro-texture. DF Tester measures friction from 0 to 90 km/hr (55 mi/hr). DFT at 20 km/hr (12.5 mi/hr) with texture measurements
Equipment: $20,000 to $35,000 Test Rate: Low to high

A-14
Figure A-8. BPN versus DFT for sites at the NASA Wallops Flight Facility. The International Friction Index (IFI) was developed following a 1992 World Road Association harmonization study to provide consistency in the results of various friction measurement devices (ASTM E 1960; Henry, 2000). The IFI is based on a friction number, F(60), and a speed gradient, Sp. The speed constant is linearly related to macro-texture measurements (preferably the MPD) and allows for adjustment of friction measurements to different speeds. Currently, this index is under review and in various stages of implementation by several highway agencies. Pavement–Tire Noise As mentioned previously, pavement–tire noise is only a subset of the vehicle noise experienced by residents adjacent to highway roads. The entire set of noise includes sound vibrations from the power unit (engine, fan, exhaust, transmission), wind turbulence, and the tire contacting the pavement surface. Although not completely standardized, several methods and equipment are available for measuring the noise associated with highway vehicles. Primary among these methods has been the accelerated pass-by method (ISO 362, 1964), which largely measures power unit noise. In addition, several methods have been developed for measuring pavement–tire noise. Primary among these methods are the following:
• Controlled pass-by (CPB) method (NF S 31 119-2) [ISO 5725) • Statistical pass-by (SPB) method (ISO 11819-1) • Close-proximity (CPX) method (ISO/DIS 11819-2) • Coast-by (CB) method (ISO/DIS 13325 and Directive 2001/43/EC) • Trailer coast-by (TCB) method (ISO/DIS 13325) • Acceleration pass-by (APB) method (ISO 362) • Caltrans Total Traffic Flow method • Laboratory Drum (DR) method (tire classification only)
A-15
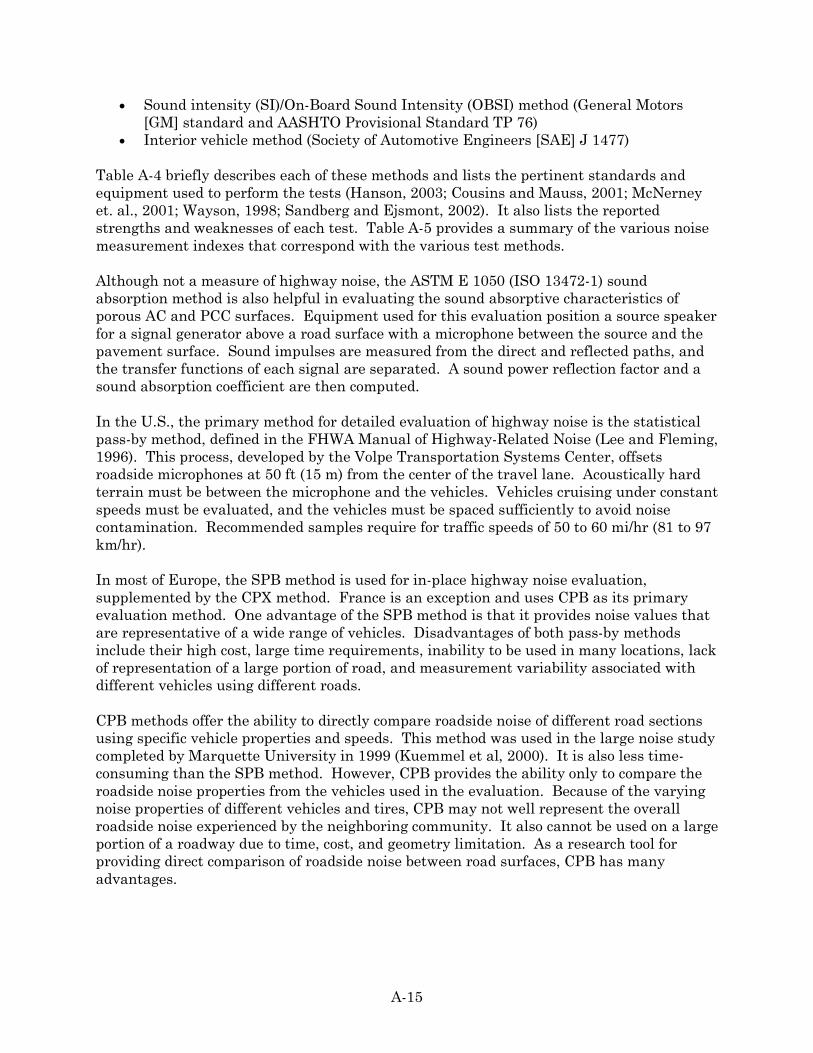
• Sound intensity (SI)/On-Board Sound Intensity (OBSI) method (General Motors [GM] standard and AASHTO Provisional Standard TP 76)
• Interior vehicle method (Society of Automotive Engineers [SAE] J 1477) Table A-4 briefly describes each of these methods and lists the pertinent standards and equipment used to perform the tests (Hanson, 2003; Cousins and Mauss, 2001; McNerney et. al., 2001; Wayson, 1998; Sandberg and Ejsmont, 2002). It also lists the reported strengths and weaknesses of each test. Table A-5 provides a summary of the various noise measurement indexes that correspond with the various test methods. Although not a measure of highway noise, the ASTM E 1050 (ISO 13472-1) sound absorption method is also helpful in evaluating the sound absorptive characteristics of porous AC and PCC surfaces. Equipment used for this evaluation position a source speaker for a signal generator above a road surface with a microphone between the source and the pavement surface. Sound impulses are measured from the direct and reflected paths, and the transfer functions of each signal are separated. A sound power reflection factor and a sound absorption coefficient are then computed. In the U.S., the primary method for detailed evaluation of highway noise is the statistical pass-by method, defined in the FHWA Manual of Highway-Related Noise (Lee and Fleming, 1996). This process, developed by the Volpe Transportation Systems Center, offsets roadside microphones at 50 ft (15 m) from the center of the travel lane. Acoustically hard terrain must be between the microphone and the vehicles. Vehicles cruising under constant speeds must be evaluated, and the vehicles must be spaced sufficiently to avoid noise contamination. Recommended samples require for traffic speeds of 50 to 60 mi/hr (81 to 97 km/hr). In most of Europe, the SPB method is used for in-place highway noise evaluation, supplemented by the CPX method. France is an exception and uses CPB as its primary evaluation method. One advantage of the SPB method is that it provides noise values that are representative of a wide range of vehicles. Disadvantages of both pass-by methods include their high cost, large time requirements, inability to be used in many locations, lack of representation of a large portion of road, and measurement variability associated with different vehicles using different roads. CPB methods offer the ability to directly compare roadside noise of different road sections using specific vehicle properties and speeds. This method was used in the large noise study completed by Marquette University in 1999 (Kuemmel et al, 2000). It is also less time-consuming than the SPB method. However, CPB provides the ability only to compare the roadside noise properties from the vehicles used in the evaluation. Because of the varying noise properties of different vehicles and tires, CPB may not well represent the overall roadside noise experienced by the neighboring community. It also cannot be used on a large portion of a roadway due to time, cost, and geometry limitation. As a research tool for providing direct comparison of roadside noise between road surfaces, CPB has many advantages.

A-16
Table A-4. Pavement–tire noise measurement methods.
Test Method
Associated Standard
Description
Required Equipment Accuracy
Applicability
Relative Cost
Controlled Pass-By (CPB)
ISO 5725 NF S 31 119-
2
Cruise by at constant, controlled speed with engine running. Controlled vehicle types and tires. Average measured maximum noise level at 25 ft (7.5 m) from vehicle center. Uses 2 cars, 4 tire sets, and speeds of 43 to 68 mi/hr (70 to 110 km/hr).
• ANSI type I sound level analyzer.
• Microphones. • Spectrum analyzers. • Wind speed meter. • Air and pavement
thermometers. • Test vehicles, test tires. • Radar vehicle speed
meter.
Instrumentation: 31.5 to 80 Hz ± 1.5 dB 100 to 4000 Hz ± 1.0 dB 5000 Hz ± 1.5 dB 6300 Hz +1.5, -2.0 dB 8000 Hz +1.5, -3.0 dB Data: Not available (N/A)
• Useful for fast comparison of roadside noise at single pavement locations using a few representative vehicles and tires.
• Not representative of traffic mix roadside noise.
Equipment: Moderate Labor: Moderate
Statistical Pass-By (SPB)
AASHTO R-20
ISO 11819-1
Cruise by at constant speed with engine running. Random vehicles and speeds from traffic stream. Average measured maximum sound for mix of vehicles at 25 ft (7.5 m) from vehicle center.
• ANSI type I sound level analyzer.
• Microphones. • Spectrum analyzers. • Wind speed meter. • Air and pavement
thermometers. • Radar vehicle speed
meter.
Instrumentation: 31.5 to 80 Hz ± 1.5 dB 100 to 4000 Hz ± 1.0 dB 5000 Hz ± 1.5 dB 6300 Hz +1.5, -2.0 dB 8000 Hz +1.5, -3.0 dB Data: N/A
• Useful for single location comparison of roadside noise from a large representative mix of vehicles.
Equipment: Low Labor: High
Close-Proximity (CPX)
ISO/DIS 11819-2
Sound pressure microphones measuring reference tire in an enclosed, sound-absorbing trailer at constant speeds (typically). Measure average dB(A) at 0.1 to 0.5 m (0.3 to 1.6 ft) from tire, for usually 4 to 60 sec. Uses 1 vehicle, any tires, and any speed.
• ANSI type I sound level analyzer.
• Microphones. • Spectrum analyzers. • Tow vehicle. • Sound absorption trailer.
Instrumentation: 31.5 to 80 Hz ± 1.5 dB 100 to 4000 Hz ± 1.0 dB 5000 Hz ± 1.5 dB 6300 Hz +1.5, -2.0 dB 8000 Hz +1.5, -3.0 dB Data: N/A
• Useful for comparison of tire/road noise over longer sections of roadway.
• Correlations with CPB and SPB can be used to estimate far-field noise.
Equipment: High Labor: Low
Sound Intensity GM, AASHTO
Provisional Standard
TP76
Sound intensity microphones measuring reference tire on vehicle at constant speed. Sound absorption unnecessary. Measures average dB(A) at 75 mm (3 in.) from road and 100 mm (4 in.) from tire edge. Uses 1 vehicle, a standard reference tire and any speed
• ANSI type I sound level analyzer.
• Microphones. • Spectrum analyzers. • Test vehicles. • Test tires.
Instrumentation: 31.5 to 80 Hz ± 1.5 dB 100 to 4000 Hz ± 1.0 dB 5000 Hz ± 1.5 dB 6300 Hz +1.5, -2.0 dB 8000 Hz +1.5, -3.0 dB Data: N/A
• Useful for comparison of tire/road noise over longer sections of roadway.
• Correlations with CPB and SPB can be used to estimate far-field noise.
Equipment: Moderate Labor: Low
A-17
Table A-4. Pavement–tire noise measurement methods (continued).
Test Method Associated Standard
Description
Required Equipment Accuracy
Applicability
Cost
Coast-By (CB) ISO/DIS 13325
Directive 2001/43/EC
Coast by at semi-constant, controlled speed, with engine off and transmission disengaged. Controlled vehicle types and tires. Measure maximum dB(A) at 25 or 50 ft (7.5 or 15 m) from vehicle center. Uses 1 speed (31 mi/hr [50 km/hr]).
• ANSI type I sound level analyzer.
• Microphones. • Spectrum analyzers. • Wind speed meter. • Air and pavement
thermometers. • Test vehicles, test tires. • Radar vehicle speed meter.
Instrumentation: 31.5 to 80 Hz ± 1.5 dB 100 to 4000 Hz ± 1.0 dB 5000 Hz ± 1.5 dB 6300 Hz +1.5, -2.0 dB 8000 Hz +1.5, -3.0 dB Data: N/A
• Useful for single point comparison of far-field tire/road and aerodynamic noise.
• Avoids effects of engine and transmission noise
Trailer Coast-By (TCB)
ISO/DIS 13325
Tow trailer at constant speed with tow vehicle engine running. Measure maximum dB(A) at 25-ft (7.5-m) centerline offset when trailer passes by.
• ANSI type I sound level analyzer.
• Microphones. • Spectrum analyzers. • Trailer. • Wind speed meter. • Air and pavement
thermometers. • Test vehicles, test tires. • Radar vehicle speed meter.
Instrumentation: 31.5 to 80 Hz ± 1.5 dB 100 to 4000 Hz ± 1.0 dB 5000 Hz ± 1.5 dB 6300 Hz +1.5, -2.0 dB 8000 Hz +1.5, -3.0 dB Data: N/A
• Useful for single point comparison of far-field tire/road noise for car and truck tires.
• Avoids effects of engine and transmission noise
.
Equipment: High Labor: Low
Acceleration Pass-By (APB)
ISO 362 Accelerate vehicle past microphones, controlling vehicle types and tires. Measured maximum noise level at 25 ft (7.5 m) from vehicle center.
• ANSI type I sound level analyzer.
• Microphones. • Spectrum analyzers. • Wind speed meter. • Air and pavement
thermometers. • Test vehicles, test tires. • Radar vehicle speed meter.
Instrumentation: 31.5 to 80 Hz ± 1.5 dB 100 to 4000 Hz ± 1.0 dB 5000 Hz ± 1.5 dB 6300 Hz +1.5, -2.0 dB 8000 Hz +1.5, -3.0 dB Data: N/A
• Suited for evaluating the roadside noise levels when maximum engine and transmissions noise is occurring.
• Not useful for evaluating tire/road noise.
Equipment: Moderate Labor: Low
Laboratory Drum (DR)
Tire classification
only
Tire rolls on rotating drum having textured surface.
• ANSI type I sound level analyzer.
• Microphones. • Spectrum analyzers. • Test tires. • Laboratory drum.
Instrumentation: 31.5 to 80 Hz ± 1.5 dB 100 to 4000 Hz ± 1.0 dB 5000 Hz ± 1.5 dB 6300 Hz +1.5, -2.0 dB 8000 Hz +1.5, -3.0 dB Data: N/A
• Suited for comparison of tire/road noise from experimental and other surfaces.
• Useful for designing road surface textures with optimal tire/road noise properties.
Equipment: High Labor: Low

A-18
Table A-5. Highway noise measurement indices.
Abbrev. Index Description P Sound pressure Sound intensity or the rate of energy flow through a unit area.
SPL (dB) Sound pressure level (decibel)
The unit of sound pressure level (SPL or Lp) as computed by the following formula:
SPL (dB) = 10 log10(p / pref )2 where: p = Sound pressure pref = Reference pressure (2 x 10⁻⁵ Pa) The range of SPL is at the threshold levels of human hearing.
dB(A) A-weighted sound pressure level
A weighted sound pressure level that corresponds well with human perceptions of sound.
dB(C) C-weighted sound pressure level
A weighted sound pressure level that slightly attenuates the low and high frequencies. Not commonly used.
dB(B) B-weighted sound pressure level
A weighted sound pressure level that attenuates at approximately the average of the dB(A) and dB(C) levels. Not commonly used.
LAmax or Lmax Maximum sound level The maximum sound level from a vehicle as it passes a microphone.
LAeq or Leq A-weighted equivalent sound level
The constant sound level that over a given time results in the same total sound energy as the one of actual fluctuating levels.
L10 90th percentile sound level The sound level that is exceeded 10 percent of the time for the period of consideration.
REMEL Reference energy mean emission level
The maximum pass-by noise level of a single vehicle measured at a specified distance and elevation.
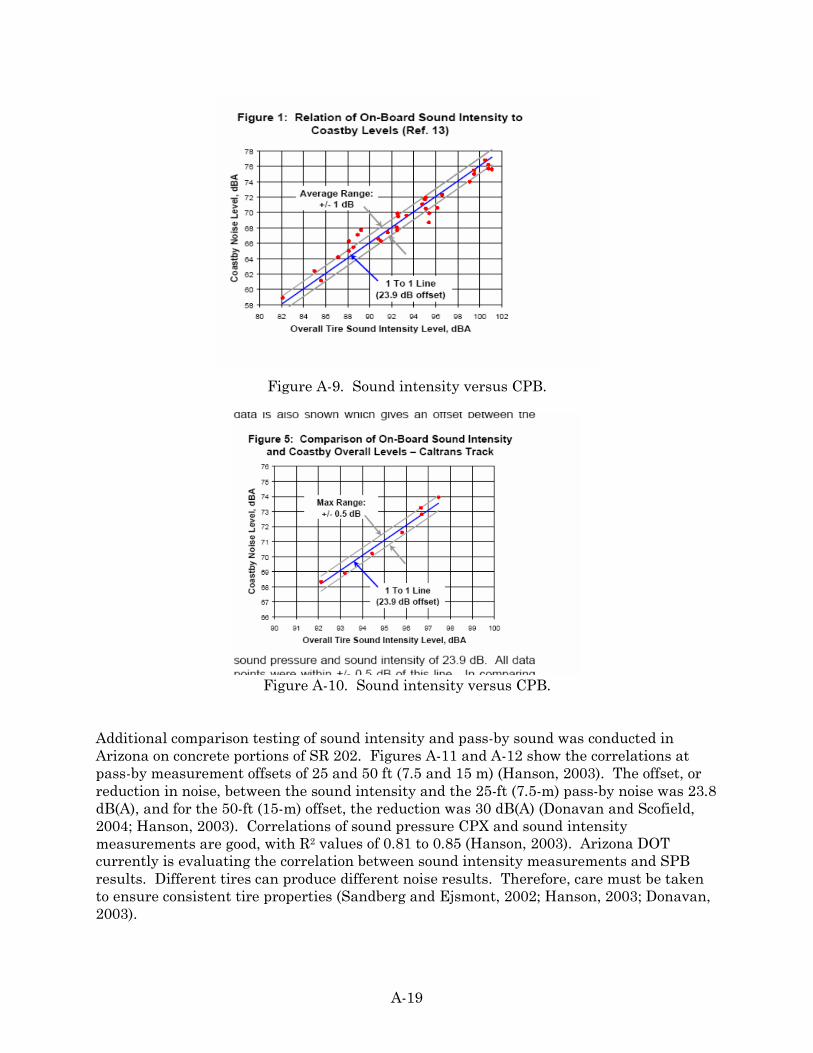
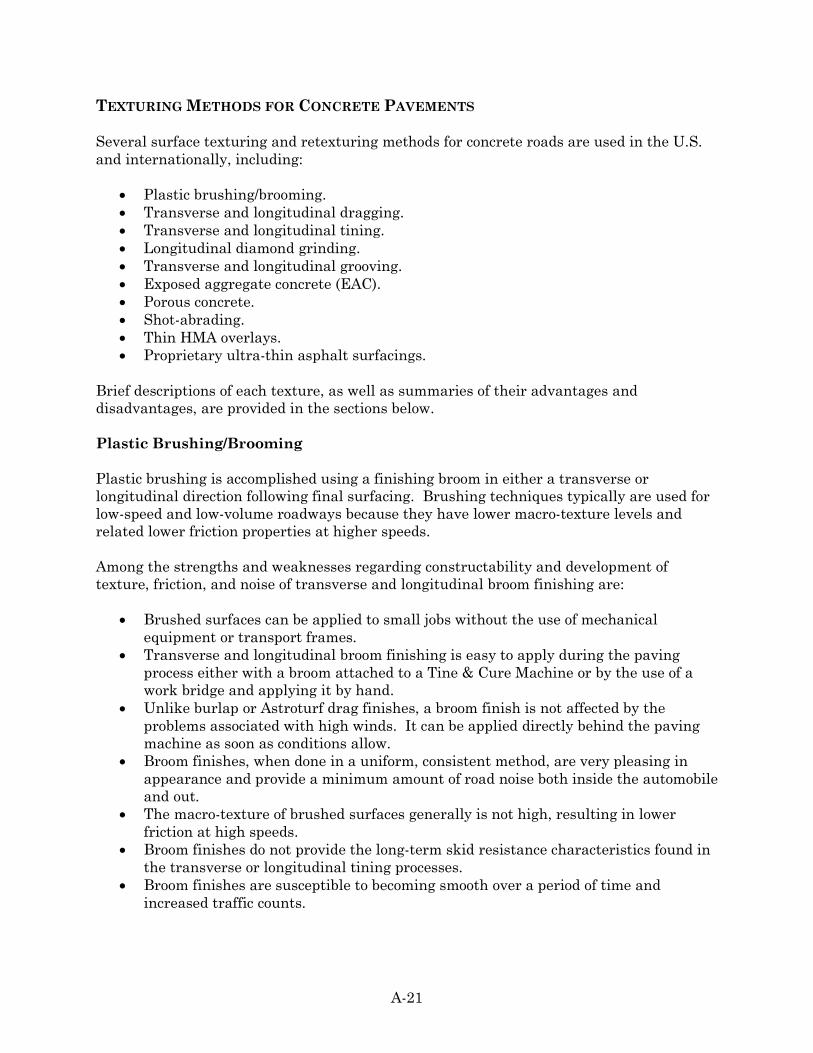
CPX methods are relatively inexpensive, fast, and can be used to continuously document the noise characteristics (including variability) of long portions of highway. As a result, they have been used in Europe for many years using a variety of equipment. Early variations in the noise measured by these types of equipment became evident in field comparisons. The ISO/DIS 11819-2 helped to standardize the equipment and methods. In 2002, the National Center for Asphalt Technology (NCAT) designed and constructed a modified ISO/DIS 11819-2 CPX noise trailer using sound pressure microphones and tires that were considered more representative of those used in the U.S. (Hanson, 2003). This equipment has been used to evaluate selected pavement sections for at least seven highway agencies (Scofield, 2003; Hanson and James, 2004; Hanson, 2002). However, correlations between sound pressure CPX values and roadside CPB levels have been inconsistent (Chalupnik, 1996). Another near-field measurement method for localized noise measurements, developed by General Motors and recently made into an AASHTO Provisional Standard (TP076-08), has been used in the U.S. since the 1990s for pavement–tire noise evaluations. It uses sound intensity (SI) microphones for noise collection. SI is the rate of energy flow through a unit area, which when integrated over the area provides sound pressure. Because these microphone pairs are directional, they are not significantly affected by adjacent tire and wind noise. As a result, a noise-deadening trailer is not required for data collection, and the microphones can be mounted on any vehicle, including trucks. Additionally, a good relationship has been established between the results of this method and roadside noise measured using the CPB method. Figures A-9 and A-10 illustrate this relationship as determined from a 1996 study, and a more recent comparison was made at California SR 138 (Donavan and Rymer, 2003; Chalupnik, 1996).
A-19
Figure A-9. Sound intensity versus CPB.
Figure A-10. Sound intensity versus CPB. Additional comparison testing of sound intensity and pass-by sound was conducted in Arizona on concrete portions of SR 202. Figures A-11 and A-12 show the correlations at pass-by measurement offsets of 25 and 50 ft (7.5 and 15 m) (Hanson, 2003). The offset, or reduction in noise, between the sound intensity and the 25-ft (7.5-m) pass-by noise was 23.8 dB(A), and for the 50-ft (15-m) offset, the reduction was 30 dB(A) (Donavan and Scofield, 2004; Hanson, 2003). Correlations of sound pressure CPX and sound intensity measurements are good, with R2 values of 0.81 to 0.85 (Hanson, 2003). Arizona DOT currently is evaluating the correlation between sound intensity measurements and SPB results. Different tires can produce different noise results. Therefore, care must be taken to ensure consistent tire properties (Sandberg and Ejsmont, 2002; Hanson, 2003; Donavan, 2003).

A-20
Figure A-11. Sound intensity versus CPB at 25 ft (7.5 m).
Figure A-12. Sound intensity versus CPB at 50 ft (15 m). Interior vehicle noise measurement entails the continuous measurement of noise inside the test vehicle as it travels along a road at a specified speed. The measurement location is at a point 2.25 ft (0.7 m) above the front passenger seat. The collected noise data for a given run are used to compute the equivalent sound pressure level (Leq), which is obtained by adding up all the sound energy during the measurement period and then dividing it by the measurement time (Rasmussen et al., 2007a).
A-21
TEXTURING METHODS FOR CONCRETE PAVEMENTS Several surface texturing and retexturing methods for concrete roads are used in the U.S. and internationally, including:
• Plastic brushing/brooming. • Transverse and longitudinal dragging. • Transverse and longitudinal tining. • Longitudinal diamond grinding. • Transverse and longitudinal grooving. • Exposed aggregate concrete (EAC). • Porous concrete. • Shot-abrading. • Thin HMA overlays. • Proprietary ultra-thin asphalt surfacings.
Brief descriptions of each texture, as well as summaries of their advantages and disadvantages, are provided in the sections below. Plastic Brushing/Brooming Plastic brushing is accomplished using a finishing broom in either a transverse or longitudinal direction following final surfacing. Brushing techniques typically are used for low-speed and low-volume roadways because they have lower macro-texture levels and related lower friction properties at higher speeds. Among the strengths and weaknesses regarding constructability and development of texture, friction, and noise of transverse and longitudinal broom finishing are:
• Brushed surfaces can be applied to small jobs without the use of mechanical equipment or transport frames.
• Transverse and longitudinal broom finishing is easy to apply during the paving process either with a broom attached to a Tine & Cure Machine or by the use of a work bridge and applying it by hand.
• Unlike burlap or Astroturf drag finishes, a broom finish is not affected by the problems associated with high winds. It can be applied directly behind the paving machine as soon as conditions allow.
• Broom finishes, when done in a uniform, consistent method, are very pleasing in appearance and provide a minimum amount of road noise both inside the automobile and out.
• The macro-texture of brushed surfaces generally is not high, resulting in lower friction at high speeds.
• Broom finishes do not provide the long-term skid resistance characteristics found in the transverse or longitudinal tining processes.
• Broom finishes are susceptible to becoming smooth over a period of time and increased traffic counts.

A-22
Transverse and Longitudinal Dragging Dragging burlap or Astroturf material behind a paver to induce micro-texture has been used for many years, and is currently used without other texture methods for lower speed roadways and parking lots. Many of the higher speed motorways in Germany currently are surfaced using a jute (burlap) drag finish, with broom or Astroturf drag finishes used on some new roads (Wenzl et al., 2004). The Minnesota DOT has specified Astroturf drag surfaces for their new concrete roads since 1998. Strengths and weaknesses of the Astroturf drag method regarding texture, noise, friction, and constructability include:
• The texture of a properly applied Astroturf or carpet drag finish is very attractive in appearance and provides a consistent finish.
• It is easy to apply for the contractor and costs very little as a finishing method. • The friction capability of an Astroturf finish is greater than the burlap finish
because of the increased surface roughness due to the characteristics of the polyethylene blades and the increased weight of the material.
• Noise levels appear to be very similar to that of a burlap drag finish and much quieter than the transverse tining method.
• Because of the ability to apply curing compounds more quickly for turf and carpet drag finishes, stronger surface mortar and more durable surface textures can result.
• The surface finish of the Astroturf may not provide the friction numbers of the transverse tining method.
• Additionally, over a period of time with high traffic counts, a “smoothing” of the surface finish may be present or more noticeable than that of a tined finish.
• A proper finish is very difficult to achieve in high winds and temperatures. Among the strengths and weaknesses of burlap drag methods in regard to surface properties and constructability are:
• A uniform, consistent burlap drag finish provides a very attractive finish. • The noise levels from a burlap drag finish are very low both inside the automobile
and outside. • A burlap drag finish is easy for the contractor to apply in most any type of weather
conditions. It is not as susceptible to the problems of high winds as the Astroturf because of the ability to keep the burlap wet and increasing the surface contact.
• Burlap drag finish does not provide the macro-texture needed to avoid high-speed hydroplaning or to resist rotational movement during skidding (FHWA, 1996).
• A burlap drag finish wears a smooth surface more rapidly than the Astroturf or a tined finish.
Transverse and Longitudinal Tining Transverse tining was used nearly exclusive for many years on high-speed concrete roads, based on the FHWA recommendations from the late 1960s. Longitudinal tining has been used in for a long time in California and southeastern Virginia, but recent efforts to reduce pavement–tire noise have led other agencies to use longitudinal tining, as well. Following

A-23
initial texturing by dragging artificial carpet or burlap over the surface, transverse and longitudinal tines are dragged across the concrete surface prior to setting. This provides transverse or longitudinal grooves in the road that allow for water to escape from beneath the tires and can reduce hydroplaning. Primarily, tining is used to provide macro-texture for improved friction characteristics of a concrete surface. Strengths of transverse and longitudinal tining with regard to noise, friction, and constructability include:
• Transverse tining provides a durable, high-friction surface when good quality aggregates and mixes are used.
• Channels formed by the transverse tining allow for water to drain to the road edge without flowing onto the tire-contact area. Better wet-road friction may result.
• Vehicles on horizontal curves with longitudinal tining will have greater force acting to prevent them from skidding off the curve (Neal et al., 1978; FHWA, 1996).
• Observations indicate that less splash and spray is developed on transversely tined sections than dense graded asphalt (FHWA, 1996).
• Transverse and longitudinal tining are easy to construct with automated equipment or using hand methods.
• Longitudinal tining can provide good initial skid resistance, but reports of friction degradation indicate that high-quality aggregate (siliceous sand) and polish-resistant coarse aggregate are needed for this surface texture to perform well (FHWA, 1996).
• Longitudinal tining can reduce pass-by noise and interior noise whine when compared with transversely tined surfaces.
Weaknesses or concerns reported for transverse and longitudinal tining include:
• Transverse tining constructed using uniform spacing produces a tonal noise or whine that is objectionable to vehicle drivers (Kuemmel et al., 2000).
• Frictional advantages of transverse tining over longitudinal grooving in tangent sections may be reduced along horizontal curves (Mahone and Runkle, 1972).
• Transverse tining requires an additional operation and equipment compared with longitudinal tining or dragging (FHWA, 1996).
• Longitudinal tining tends to reduce the channels for water to escape to the road edge. This results in a larger percentage of rainfall on the road surface and greater reported splash and spray characteristics than transverse tined roads (Dierstein, 1982; FHWA, 1996).
• In wetter climates subject to freezing, the decreased drainage capability of longitudinal tining may result in less friction than better-draining surfaces (FHWA, 1996).
• If aggregates are not durable on longitudinal or transverse tined surfaces, retexturing may be needed before the end of the road’s structural life (FHWA, 1996).
• Drivers of small vehicles sometimes report a feeling that steering control has been taken by the road. This can be addressed by minimizing the tine width and using a 0.75-in. (19-mm) tine spacing (Ruggenstein, 1977; FHWA, 1996).

A-24
Longitudinal Diamond Grinding Diamond grinding involves the use of closely spaced diamond-impregnated blades to cut patterns in hardened concrete (AASHTO, 1993). The major result of grinding is the removal of a thin (0.15 to 0.25 in. [4 to 6 mm]) layer of concrete surface material, resulting in a smooth surface with high friction properties. Typically used for worn concrete surfaces, this process has been employed to remove joint and crack faulting, remove wheelpath ruts, correct for joint unevenness due to slab warping, restore transverse drainage, improve skid resistance properties, and reduce road tire noise. Primarily due to the use of incentive smoothness specifications, some new concrete roads are also being diamond ground. Among the benefits or strengths associated with using diamond grinding for noise and friction improvement are the following (Correa and Wong, 2001):
• Significantly increases surface macro-texture, reduces tire/road noise, and improves initial friction.
• Provides for better water drainage through increased surface texture and can reduce hydroplaning.
• Provides or restores a smooth riding surface by removing faults, curling, warping, and construction profile irregularities.
• May reduce accident rates in wet weather conditions by providing adequate macro-texture and removing studded tire wheelpath rutting.
• Does not raise the road surface elevation. • Does not affect material durability unless the coarse aggregate is a soft stone subject
to polishing. • Is generally more cost-effective for restoring friction than thin overlay, unless coarse
aggregate is susceptible to polishing (FHWA, 1996). A few areas of weakness that should be addressed in designing texture restoration diamond grinding projects include (Correa and Wong, 2001):
• Will not address structural distresses such as pumping, loss of support, corner breaks, working transverse cracks, and shattered slabs.
• Will not resolve severe levels of concrete deterioration from D-cracking, reactive aggregate, or freeze-thaw damage.
• Cannot reduce tire/road noise related to wide transverse joints. • Increased friction may be temporary if the aggregates are susceptible to polishing
and traffic levels are high. • Harder aggregates, such as quartzite, are more costly to grind. • Grinding slurry must be removed and disposed appropriately
Transverse and Longitudinal Grooving Sawing grooves in concrete road surfaces, as a method for reducing hydroplaning, had its inception in Great Britain in 1956 on airfield roads (Rasmussen, 1974). Both longitudinal and transverse grooving have been used in the U.S., but longitudinal grooving is more common. Transverse and longitudinal grooving of concrete road surfaces is generally completed on a cured surface as a method for enhancing macro-texture.

A-25
In many highway agencies, if the tining operation is not successful or if there is rain damage, grooving or grinding is necessary to establish the specified drainage texture dimensions. Other agencies use grooving to restore macro-texture on worn or accident-prone surfaces. Longitudinal and transverse grooving have several strengths, as listed below:
• Longitudinal grooving can be completed quickly with only a single lane closure and minimal traffic interruption (FHWA, 1980).
• Increases macro-texture and skid resistance of low-texture surfaced. • Grooves can be installed as needed after construction to improve a skid-prone
surface. Weaknesses or disadvantages of these methods are as follows:
• Motorcycle drivers report a sensation of instability when using longitudinally grooved roads (FHWA, 1980).
• Longitudinal grooving does not provide direct water drainage to the road shoulder, resulting in more water on the road surface.
• Transverse grooving is slower and more expensive than longitudinal texture restoration methods.
Exposed Aggregate Concrete Exposed aggregate concrete (EAC) texturing has been used for decorative purposes for many years. Their first reported road use in the U.S. was in 1972, on an experimental section in Virginia (Mahone et al., 1977). In 1980, Robuco NV of Belgium developed a concrete road exposure technique, whereby the mortar surrounding the surface aggregates is removed prior to setting. The process, originally known as “chemical washing,” leaves an aggregate surface that has similarities to stone matrix asphalt (SMA). When properly constructed, EAC reportedly provides low road tire noise, good macro-texture for drainage, and good friction. It has been used in Belgium, Germany, Austria, France, the United Kingdom, the Netherlands, and Australia with good success. Reportedly 30 million tons of concrete and concrete products are used annually in Belgium, where CRC pavement with EAC texture make up about 35 to 40 percent of the highway roads (Rens et al., 2004; Jasienski and Rens, 2004). The PCC Surface Texture Technical Working Group indicated in 1996 that “PCC exposed aggregate may be the best new construction technique for noise reduction and safety (FHWA, 1996).” EAC surface textures have received primarily positive responses in international literature. Reported strengths of the method include:
• Initial and long-term roadside and vehicle interior noise is low, comparable with or better than other concrete surfaces and dense graded asphalt.
• High-pitched whine or low-pitched rumble is not generally associated with this surface texture (FHWA, 1996).

A-26
• Initial and long-term friction properties are reportedly good, depending on the aggregate properties.
• When used in a two-layer system, recycled aggregates and aggregates of lower qualities can be used in the lower layer, reducing cost and reducing environmental waste (Rens et al., 2004).
Weaknesses of the texturing method include:
• A one-layer exposed aggregate concrete road could result in problems with evenness and hence, increased noise emission (Teuns et al., 2004).
• Contractors need time and experience to produce surfaces with good noise properties (Chandler et al., 2003).
• Special pavers, curing delay, and extra curing methods are required. • Waiting for the set retarder to take effect may conflict with saw cutting operations
in jointed concrete roads. • Friction numbers are generally lower during the first year, as the sand and mortar
around the aggregates wear (Sommer, 1994; FHWA, 1996) Porous Concrete Porous concrete surfaces are considered “experimental” in the U.S. However, they have been used in full-scale construction in Belgium and Japan (Debroux and Dumont, 2004). The methods include using a gap-graded aggregate mix and polymer additives to form a mortar film around the aggregates. This film is designed to positively bind the aggregates in a durable structure without filling the open pores between the aggregate (Beeldens et al., 2004). Porosities between 15 and 25 percent are being used with typical design strengths of greater than 650 lb/in2 (4.5 MPa) (Nakahara et al., 2004). Porous concrete has been identified as having the following strengths:
• They provide good splash and spray characteristics, especially early in their life. • As a result of their absorptive properties, they offer good friction and noise
characteristics. • Compared with porous asphalt surfaces, the light color of the porous concrete
surface provides a reflective surface that reduces heat accumulation in warm climates.
Weaknesses of the method include the following:
• In freezing climates, the salt required to remove ice from the surface will be greater than that for standard, dense, PCC roads.
• Traffic and wind can deposit sand and debris in the pores of this road surface, reducing its water drainage and sound absorption capabilities. Removing the debris from the pores using high-pressure washing and vacuuming equipment has not been effective (Henry, 2000; Beeldens, 2004).
• Low-speed roadways will tend to clog more quickly due to a reduced cleaning effect from the tires of fast moving vehicles (Caestecker, 1999).

A-27
• In colder climates, when compared with porous asphalt road, the lower heat absorption properties of porous cement concrete roads will require more salt and earlier ice removal.
Shot-abrading The method for shot-abrading concrete surfaces was developed in 1979-80 as a way to prepare concrete surfaces prior to applying bonded concrete overlays. Since 1984, shot-abrading has also been used for restoring friction on highway and airport roads. One contractor, Humble Equipment Company of Ruston, Louisiana, developed the first machine (called a Skidabrader) that hurls steel abrasive materials at the road surface to increase the texture of concrete surfaces. This method has been used on many high-profile concrete road texture restoration projects in the U.S., including the shuttle runway for NASA, major airport runways, tunnels, interstates, and the Lake Pontchartrain Bridge in Louisiana. Benefits or strengths of the shot-abrading method for restoring surface texture include:
• Increases macro-texture levels significantly. • Macro-texture is maintained over time unless aggregate is soft. • Production rate is fairly fast. • Cost is relatively low.
Reported concerns or weaknesses of the shot-abrading method include:
• Micro-texture can be worn away in a few years, if the coarse aggregate is susceptible to polishing.
• If larger aggregates are exposed, the noise levels tend to increase. • Does not remove transverse tining noise. • Does not restore ride quality.
Ultra-thin Bonded Wearing Courses Recently, ultra-thin (0.375 to 0.75 in. [9.5 to 19.0 mm]) bonded wearing courses (i.e., NovaChip® proprietary treatment) have been applied to concrete road surfaces to restore friction or reduce noise. These treatments consist of a gap-graded, hot-mix asphalt (HMA) mixture applied over a thick polymer-modified asphalt emulsion membrane. The purpose for using a gap grading is to provide improved stone-to-stone contact by reducing the medium sized aggregate and producing a stronger aggregate skeleton (Shatnwi and Toepfer, 2003). The bonded wearing course membrane prevents water leakage and generally provides a good bond to the old concrete surface. Approximately 50.2 million yd2 (42.0 million m2) of NovaChip® material has been installed in the U.S. since 1992. Contractors in the U.S. reportedly own 15 to 20 of the specialized paving machines in U.S. now, indicating its popularity. Texas and Florida have used the process for installing open graded friction courses, as well (Exline, 2004). Strengths of the NovaChip® method include:
A-28
• Disposes of water quickly from the surface, thus reducing roadway spray from
vehicles and providing greater visibility in wet weather. This is accomplished through it coarse aggregate matrix.
• Good skid resistance makes the product desirable at locations where loss of traction due to wet roads is common.
• Fast installation in a single pass, with little rolling results in short lane closures. • Thin lifts can be used for low-clearance areas or city streets where drainage profiles
are critical. • More durable than standard chip seals and no loose chips are generated during
construction. Concerns about weaknesses of the NovaChip® process for improving friction and noise include:
• “Shelling” of the surface was noted after 3 months of service in St Joseph, Missouri. Loose aggregate was noted at the shoulder on the passing lane. This apparently resulted from snowplow damage as the plows cleaned the reverse sloped shoulder. Other shelling was attributed to the effects of freeze-thaw cycling.
• Requires greater initial application of deicing salt than dense surfaces; however, less deicing materials is reportedly needed for subsequent applications.
Ultra-thin Epoxied Laminate Treatments Ultra-thin (0.12 to 0.25 in. [3.0 to 6.0 mm]) epoxied laminates (i.e., Italgrip® System proprietary treatment) have been used for concrete roads for surface texture restoration primarily in Europe, but with some success in the U.S. The Italgrip® method, which uses an epoxy for binding a 0.01-in. (0.25-mm) hard, synthetic stone to the road surface, has been used in Italy for the past 15 years. Several strengths or benefits are reportedly associated with the Italgrip® system:
• Good antiskid micro-texture properties (BPN 75-80). • Angular, open-graded aggregate provides good macro-texture for water removal and
reduced hydroplaning. • Early opening time to traffic under summer conditions (4 hours). • Fast application rate (29,900 yd2/day [25,000 m2/day] maximum). • Thin lift (0.1 in. [2.5 mm]) eliminates bridge clearance and curb and gutter
problems. • Reduced tire/road noise (3 dB versus transversely tined PCC). • Aggregate colors can be lightened to achieve better night visibility.
Reported weaknesses or disadvantages of the Italgrip® system include:
• Durability is sensitive to the combination of low initial temperatures and early traffic application.
• High initial cost.

A-29
APPENDIX A REFERENCES Al-Quadi I.L., D.S. Roosevelt, R. Decker, J.C. Wambold, and W.A. Nixon. 2002. “Feasibility of Using Friction Indicators to Improve Winter Maintenance Operations and Mobility,” NCHRP Web Document 53, National Cooperative Highway Research Program (NCHRP), Washington, D.C. American Association of State Highway and Transportation Officials (AASHTO). 1976. Guidelines for Skid-Resistant Pavement Design, AASHTO, Washington, D.C. American Association of State Highway and Transportation Officials (AASHTO). 1993. Guide for Design of Pavement Structures, AASHTO, Washington, D.C. Beeldens, A., D. Van Gemert, and G. Caestecker. 2004. “Porous Concrete/ Laboratory Versus Field Experience.” Caestecker, C. 1999. “Test Sections of Noiseless Cement Concrete Pavements—Conclusions,” Ministry of the Flemish Community, Flemish Brabant Roads and Traffic Division, Belgium. Chalupnik, J. 1996. “Predicting Roadside Noise Levels from Near Field Trailer Measurements,” NoiseCon 96 Proceedings, Seattle, Washington. Chandler J., S. Phillips, P. Roe, and H. Viner. 2003. “Quieter Concrete Roads: Construction, Texture, Skid Resistance, and Noise,” Transportation Research Laboratory Report TRL 576, Crowthorne, Berkshire, United Kingdom. Correa, A. and B. Wong. 2001. “Concrete Pavement Rehabilitation—Guide for Diamond Grinding,” FHWA Southern Resource Center, Atlanta, Georgia. Cousins, G. and P. Mauss. 2001. “An Overview of Vehicle Pass-by Noise,” Sound and Vibration. Debroux, R., and R. Dumont. 2004. “Twin-Layer Continuously Reinforced Concrete Surfacing at Estaimpius on the N511,” 9th International Symposium on Concrete Roads, Istanbul, Turkey. Dewey, G.R., A.C. Robords, B.T. Armour, and R. Muethel. 2002. “Aggregate Wear and Pavement Friction,” Paper presented at 81st Annual Meeting of the Transportation Research Board, Washington, D.C. Dierstein, P. 1982. “A Study of PCC Pavement Texture Characteristics in Illinois,” Report No. FHWA/IL/PR-095, Illinois Department of Transportation, Springfield, Illinois. Donavan, P.R. 2003. “Evaluation of the Noise Produced by Various Grooved and Ground Textures Applied to Existing Portland Cement Concrete Pavement Surfaces,” Caltrans, Petaluma, California.

A-30
Donavan, P. and B. Rymer. 2003. “Assessment of Highway Pavements for Tire/Road Noise Generation,” Report 03NVC-232, Society of Automotive Engineers. Donavan, P.R. and L. Scofield. 2004. “Near Field Tire Noise Measurements of Similar Pavements of Different Ages” Noise-Con 2004, Baltimore, Maryland. Ergun, M., G. Oztas, S. Iyinam, and A. Iyinam. 2004. “How Does Micro- and Macro-texture of Cement Concrete Pavement Affect the Skid Resistance of Road?” 9th International Symposium on Concrete Roads, Istanbul, Turkey. Federal Highway Administration (FHWA). 1980. “Skid Reduction Accident Program,” Technical Advisory T 5040.17, U.S. Department of Transportation, FHWA, Washington, D.C. Federal Highway Administration (FHWA). 1996. “PCC Surface Texture Technical Working Group Findings,” Technical Working Group Meeting, Washington, D.C. Flintsch, G.W., I.L. Al-Qadi, R. Davis, and K.K. McGhee. 2002. “Effect of HMA Properties on Pavement Surface Characteristics,” Transportation Research Board (TRB), Washington, D.C. Glennon, J.C. 1996. “Roadway Defects and Tort Liability,” Lawyers and Judges Publishing Company, Inc., Tucson, Arizona. Hall, J.W., K.L. Smith, L. Titus-Glover, J.C. Wambold, T.J. Yager, and Z. Rado. 2006. “Guide for Pavement Friction Final Report,” National Cooperative Highway Research Program (NCHRP), Washington, D.C. Hanson, D. 2002. “Tire/Pavement Noise Study for Michigan Department of Transportation,” National Center for Asphalt Technology (NCAT), Auburn, Alabama. Hanson, D. 2003. “Tire/Pavement Noise – Draft 1,” NCAT Report No. 03-04, National Center for Asphalt Technology (NCAT), Auburn, Alabama. Hanson, D. and R. James. 2004. “Colorado DOT Tire/Pavement Noise Study,” Report Number CDOT-DTD-R-2004-5, Colorado Department of Transportation, Denver, Colorado. Henry, J.J. 2000. “Evaluation of Pavement Friction Characteristics,” NCHRP Synthesis 291, National Cooperative Highway Research Program, Washington, D.C. Jasienski, A. and L Rens. 2004. “Overview and Comparison of the New Belgian Standard Specifications for Concrete Roads,” 9th International Symposium on Concrete Roads, Istanbul, Turkey. Kuemmel, D.A., R.C. Sonntag, J. Crovetti, and Y. Becker. 2000. “Noise and Texture on PCC Pavements: Results of a Multi-State Study,” Final Report No. WI/SPR-08-99, Wisconsin Department of Transportation, Madison, Wisconsin.

A-31
Kummer, H.W. 1996. Unified Theory of Rubber and Tire Friction, Pennsylvania State University College of Engineering, University Park, Pennsylvania. Lee, C., and G. Fleming. 1996. “Measurement of Highway-Related Noise,” FHWA-PD-96-046, Federal Highway Administration,http://www.fhwa.dot.gov/environment/noise/measure, Washington, D.C. Mahone, D. and S. Runkle. 1972. “Pavement Friction Needs,” Transportation Research Record 396, National Academy Press, Washington, D.C. Mahone, D., K. McGhee, J. McGee, and J. Galloway. 1977. “Texturing New Concrete Pavement,” Transportation Research Record 652, National Academy Press, Washington, D.C. McNerney, M.T., B. J. Landsberger, S. Burcsak, J. DeMoss, and W.H. Yeo. 2001. “Feasibility of Using Quiet Pavement Technology To Attenuate Traffic Noise In Texas,” 7-2957-3, Texas Department of Transportation, Austin, Texas. Moore, D.F. 1972. The Friction and Lubrication of Elastomers, Pergamon Press Ltd. Nakahara, D., E. Nota, and K. Endo. 2004. “Utilization of Pavement Quality Porous Concrete and Its Performance,” 9th International Symposium on Concrete Roads, Istanbul, Turkey. Neal, B., D. Peck, J. Woodstrom, and D. Spellman. 1978. “Surface Textures for PCC Pavements,” Report No. FHWA-CA-TL-78-14, California Department of Transportation, Sacramento, California. Permanent International Association of Road Congresses (PIARC). 2003. “Report from World Road Association Committee 1,” PIARC, Durban, South Africa. Personn, B.N.J. 1998. Sliding Friction: Physical Principles and Applications, Springer. Rasmussen, R. 1974. “Pavement Surface Texturing and Restoration for Highway Safety,” Presented at the Skid Resistance Symposium of the 53rd Annual Meeting of the Highway Research Board, Washington, D.C. Rens, L., C. Caestecker, and H. Decramer. 2004. “Sustainable Road Building with Low-Noise CRCP on Belgian Motorways. Ruggenstein, E. 1977. “Summary and Evaluation of Concrete Pavement Texturing Practices.” Sandberg, U. and J.A. Ejsmont. 2002. Tyre/Road Noise Reference Book, ISBN 91-631-2610-9, Informex, Kisa, Sweden. Sayers, M.W. and S.M. Karamihas. 1998. The Little Book of Profiling, University of Michigan Transportation Research Institute (UMTRI), Lansing, Michigan.

A-32
Scofield, L. 2003. “SR 202 PCCP Whisper Grinding Test Sections—Construction Report,” Arizona Transportation Research Center, Phoenix, Arizona. Shatnawi, S., and B. Toepfer. 2003. “Technical Advisory Guide for Bonded Wearing Course Pilot Projects,” California Department of Transportation, Sacramento, California. Tuens, K., M. Stet, and W. Van Keulen. 2004. “Full Scale Pavement Tests of Exposed Concrete Aggregates: Acoustical Aspects and Friction Characteristics,” 9th International Symposium on Concrete Roads, Istanbul, Turkey. Wambold, J.C., C.E. Antle, J.J. Henry, and Z. Rado. 1994. “International PIARC Experiment to Compare and Harmonize Texture and Skid Resistance Measurements,” Permanent International Association of Road Congresses (PIARC). Wayson, R.L. 1998. “Relationship Between Pavement Surface Texture and Highway Traffic Noise,” NCHRP Synthesis 268, Transportation Research Board, Washington, D.C. Wenzl, P., K. Beckhaus, and P. Schiebl. 2004. “Surface Durability of Concrete Pavements,” 9th International Symposium on Concrete Roads, Istanbul, Turkey. Rado, Z. 1994. “Analysis of Texture Models,” PTI Report No. 9510, Pennsylvania Transportation Institute (PTI), Penn State University, State College, Pennsylvania.

APPENDIX B. HIGHWAY AGENCY AND INDUSTRY INTERVIEWS REPORT


B-1
INTRODUCTION Under NCHRP 10-67 subtask 1b, the project team conducted interviews with state highway agency and industry representatives. The purpose of the interviews was to obtain information regarding highway agency policies, practices, experiences (including past studies), and perspectives on pavement frictional properties, texture, and noise. A second intent was to seek insights and information from other institutions (public or private) engaged in these issues. Additionally, the interviewers sought information about pavements that are suitable for use in the Task 7a field evaluations. SUMMARY OF CONTACT INTERVIEW INFORMATION The NCHRP 10-67 project team contacted a total of 42 persons from 18 state highway agencies (SHAs), 12 industry groups, 5 international sources, and 6 related sources. These are presented below.
• SHAs—Alabama, Arizona, California, Colorado, Florida, Illinois, Indiana, Iowa, Kansas, Michigan, Minnesota, Missouri, New Jersey, North Carolina, North Dakota, Pennsylvania, Texas, and Wisconsin.
• Industry Groups—ACPA (national and local chapters), Associated General Contractors (AGC), Bruel & Kjaer, Boart Longyear, Demix Construction, Dynatest, Inc., Gomaco Corporation, International Cybernetics Corporation (ICC), International Grinding and Grooving Association (IGGA), Italgrip Inc., Koch Industries, Inc., MGPS, Inc., National Center for Asphalt Technology (NCAT) (Auburn University), Skidabrader, and Texas Cement Council.
• International and Related Sources—Germany Federal Highway Research Institute (BASt), Central and Western Field Test Center, Eastern Field Test Center, Forschungsinstitut, Illingsworth and Rodkin, Institute for Safe Quiet and Durable Highways (ISQDH) (Purdue University), National Aeronautics and Space Administration (NASA)-Langley, Robuco (Belgium), Stork Materials Tech., Transport Research Laboratory (United Kingdom), University of Texas–El Paso, Swedish National Road and Transportation Research Institute (VTI), and FHWA Volpe National Transportation Systems Center.
Specific information that is related to agency practices, experience, and research was gleaned from the interviews and from the documents provided by the contacts. Descriptions are provided in the sections below. POLICIES AND PRACTICES Agency contacts reported a variety of policies and practices regarding texturing PCC pavements. Information from their responses and available specifications is provided in Chapter 2 of this final report. EXPERIENCES AND RESEARCH Several agencies have constructed texture, friction, and noise test sections. They provided reports from these experimental sections to the NCHRP 10-67 team for review. As

B-2
summarized in Table B-1 and discussed below, they also described the status and results of their projects (Scofield, 2003; Donavan, 2003; Ardani and Outcalt, 2000; Parcells, 1989; Weinfurter et al., 1994; Burge et al., 2002; Marquart, 1997; Marquart, 2003; Kuemmel et al., 2000).
Table B-1. Agency PCC texturing test sites.
Agency Year (site) Methods used Eval. methods
Arizona 2003 (SR 202) Grinding (2.8 mm and 3.0 mm spacing), jacks CPX-SP, CPX-SI, IRI
California 2002 (SR 58) Broom and burlap drag with grooving and grinding CPX-SI, CPB, FN40R
Colorado
1994 (I-70) Burlap drag and LTD, TTD, TT (13 mm), TT (25 mm), LT (19 mm), GVL (19 mm), GVT (variable)
CPB, FN40S, FN40R, OFM, LTP, SPM, PI
2001-2 (US 285) LT (19 mm), GR
2003 (US 287) BD/LT (19 mm), LTD/LT (19 mm), LTD/GV (19 mm), LTD/GV (variable), GD
Subjective vehicle handling evaluation, LTP
Illinois 2004 (I-70) TT (Marquette) skewed PI, subjective review
2004 (I-80) TT (Marquette-modified) skewed, TT (19 mm) PI, subjective review
Indiana (I-70) GV and others 1990-2002 (I-465) TT (Uniform and variable) Subjective review
Iowa 1993 (SH 163) LTD/TT (13 mm), LTD/TT (19 mm), LTD/LT (19 mm), LTD/TT (variable), LTD/GVT (13 mm)
Kansas
1989 (US 54) LTD, BD, BRT, TT (13 mm), TT (19 mm), different aggregate types
FN40R, FN55R over 11 years, FN40S, FN55S
2004 (US 69) GR (2.8, 3.0, 3.3 mm) w/ and w/o jacks w/ and w/o joints
FN40R, SPM
Michigan 1992 (I-75) EACS (8 mm), TT (25 mm) SPM, FN40R, RQI 2000 (US 24) LTD, TT (13 mm) skewed, GR FN40R
Minnesota Several sites LTD, BRL, TT FN40S, SPM
New York 1998-9 ((I-190) TT (variable), DG (2.67 mm spacing) SPB, Drop off noise, FN40R, FN40S, FN50R, FN50S, FN60R, FN60S, SPM
North Dakota 1994 (I-80) TT 13, 19, 25, 51, 76, and 102 mm) LT (19 mm). TT (25-102 mm variable) CPB, INT, TD, FN40R
1999-2001 (I-80) LTD (MTD > 0.8 mm) SPM, FN40R, CPB
Wisconsin 1994 (SH 29) TT (19mm variable), TT (25 mm variable)
skewed 1:4 and 1:6, LT (25 mm) INT, CPB, FN40S, FN50S, LTP, IRI
1996 (US 51, US 151, SH 26) TT (25 mm variable) INT, CPB, FN40S,
FN50S, LTP, IRI 1 in. = 25.4 mm Note: CPX-SI = sound intensity controlled pass-by, CPB = controlled pass-by, SPB = statistical pass-by, INT = interior noise, FN40S = ASTM E 274 friction (40 mph, smooth tire), FN40R = ASTM E 274 friction (40 mph, smooth tire), SPM = sand patch method, OFM = outflow meter, CTM = circular texture meter, BPT = British pendulum tester, LTP = laser texture profiler, TD = tine depth, PI = Profile Index, IRI = International Roughness Index, RQI = Ride Quality Index

B-3
Agency Experiences Alabama reported good performance after 6 to 8 years from a Type B, 0.75-in. (19-mm) NovaChip® bridge overlay project on I-59. They also indicated that spray is less on NovaChip® surfaces than on open-graded friction courses (OGFCs). Arizona has been using an asphalt rubber friction course material for many years. Because of its desirable noise properties, pressure from the public in the Phoenix area has resulted in redirecting funds to overlay the primary interstate roads, even though these concrete pavements are in good condition. Arizona used 1-in. (25-mm) transverse tining on many of these pavements, with a resulting loud whine. They experimented with variable transverse tining, measuring higher noise levels. They also evaluated longitudinally tined pavements and measured about 7 dB(A) reduction at 50 ft (15 m), although this was still not at the level of the asphalt rubber friction course. Their conclusion was to overlay their concrete pavements with the asphalt rubber friction course. The American Concrete Pavement Association (ACPA) asked ADOT to allow for installation and monitoring of a “whisper grinding” section on westbound SR 202 in Phoenix in 2003. Initial comparisons placed the average initial CPX noise level for asphalt rubber friction course surfaces at 91.8 dB(A) and the best whisper grind section at 95.5 dB(A). Testing in 2004 indicated that the levels of both surfaces had increased with time; however, the rate of increase on the friction course was greater than that of the ground section. Testing is scheduled to continue (Scofield, 2003). They have also been measuring friction on these sections using a K.J. Law Airport Friction Tester (Scofield, 2004/05). California has used longitudinal tining following burlap drag since the 1970’s. They use burlap drag only in the Sierra Mountains on I-80 because of the low traffic volume and damaging effect of studded tires and tire chains. Caltrans constructed a test site on SR 58 in Mojave in June 2003 using combinations of texture grinding and grooving on longitudinally tined, burlap drug, or broomed PCC surfaces. One section was constructed using a broom that was not considered sufficiently stiff. However, it developed adequate friction levels. For optimizing noise and friction, Caltrans is considering using burlap drag for low demand surfaces and grooving the surfaces when traffic levels are high. They have noted that even when longitudinal tining is used and the paste is dry, noisy pavement can result (Pyle, 2004/05). The Colorado DOT has been evaluating texture, friction, and noise properties of PCC pavements since 1994. They installed and evaluated test sections on I-70 in 1994 and completed a thorough evaluation of the sections. They concluded that longitudinal texturing provided the quietest interior and exterior noise levels. Their current texturing method (burlap drag with 1-in. [25-mm] transverse tining) produced the highest noise levels. As a result, Colorado DOT changed their texturing specification in 1997 to require turf drag and longitudinal tining with 0.75-in. (19-mm) spacing. Longitudinal Astroturf drag provided the lowest friction numbers in this experiment. Beginning in 2002, some drivers of small vehicles report a feeling of loss of control on the longitudinally tines pavements. Initial investigation indicates that the problem is common to new winter tires with no studs. After the tires are worn about 3 to 4 months, the problems are not reported. In response to this concern, Colorado DOT constructed a longitudinal texturing test site in 2004 to evaluate the effect of longitudinal texturing methods on vehicle handling. The site

B-4
included a harsh turf drag, turf drag with longitudinal tining, burlap drag with longitudinal tining, sinusoidal longitudinal brooming, variable longitudinal tining, sawed longitudinal grooves, grinding, and dense grade asphalt concrete. Evaluation will be completed in 2005 and will include a subjective evaluation of handling comfort and friction measurements (Ardani, 2004; Outcalt, 2004). Illinois’s DOT has used turf drag and 0.75-in. (19-mm) transverse tining for several years. Recently they have experimented with skewed variable tining and have been pleased with the results. An informal noise evaluation of transverse variably tined PCC on US 67 was made around 2001. Illinois constructed test sites with this type of tining on the shoulder of I-55 in Springfield. They constructed a similar test site on about 9 mi (15.5 km) of continuously reinforced concrete (CRC) pavement of I-70 near the Indiana border, and a modified skewed Marquette pavement on I-80 near Ottawa and on I-290. On these sites, the contractor removed the narrow spacing tines to avoid spalling. Illinois DOT is pleased with this texture and plans to use it on future construction on the Dan Ryan Expressway and I-74 near Peoria. The modified specification uses the spacings in Table B-2 and a 1:6 skew. The table should be read from left to right, one row at a time (Mueller, 2004).
Table B-2. Illinois DOT draft variable tining specification, mm (read left to right, one row at a time).
34 36 47 54 48 43 32 31 27 36 29 46 21 43 23 42 52 24 18 28 40 34 27 26 25 27 20 37 38 52 51 45 37 43 53 27 37 42 41 29 43 45 44 30 37 33 40 28 31 50 34 45 20 45 50 53 51 29 25 18 53 18 38 51 40 17 49 50 39 51 36 36 38 46 29 38 50 24 33
1 in. = 25.4 mm

B-5
Indiana’s DOT has experimented with uniform and variable transverse tining patterns for several years and has had a variable transverse tining specification since before January 1999. Their current specification, implemented in September 2000, calls for texturing with a double thickness burlap drag or a minimum 4-ft (1.2-m) wide turf drag. Tining dimensions are to be between 0.09 and 0.13 in. (2.3 and 3.3 mm) wide and from 0.12 to 0.19 in. (3 to 4.8 mm) deep according to the following repeated spacing pattern: 0.625, 1, 0.875, 0.625, 1.22, 0.75, 1, 1, 1, 1, 0.75, 0.875, 1.75, 0.875, 0.35, 1, 1, 1.22, 1.5, 0.875, 0.75, 0.875, 1, 0.875, and 1 in. (16, 25, 22, 16, 31, 19, 25, 25, 25, 25, 19, 22, 44, 22, 9, 25, 25, 31, 38, 22, 19, 22, 25, 22, and 25 mm). Correction or retexturing is to be done using transverse or longitudinal grooves spaced at 1 in. (19 mm) (Andruski, 2004). The Iowa DOT used transverse tining (0.75-in. [19-mm] spacing) following turf or burlap drag on concrete pavement from 1976 to 1998. They experimented with 1.5-in. (38-mm) transverse tining and turf drag, but have discontinued both on high-speed roadways, although the turf drag is still in place with good friction on many sites. This is reportedly because the fine aggregates in Iowa are high in silica content and maintain friction well. In 1999, they began allowing two options: 0.75-in. (19-mm) longitudinal tining, which is commonly used, and variable (not Marquette) transverse tining (0.375 to 1.625 in. [9.5 to 41 mm]), which is seldom used. Iowa DOT likes the 0.75-in. (19-mm) longitudinal tine option with turf drag because of the reduced noise and sufficient texture; however, contractors tend to prefer using burlap drag because it improves smoothness values. They have noticed that deep longitudinal tining results in noise complaints from the public. They also noted that placing weights on the turf during dragging results in aggregate being pulled from the mix. Friction numbers (FN40R) are typically greater than 50 for new longitudinally tined pavements with turf drag, and they commonly remain greater than 40 (Hanson, 2004; Jones, 2004). Kansas DOT specifies longitudinal tining (0.75-in. [19-mm] spacing) following turf or burlap drag for new concrete pavements. They constructed a grinding test site in November 2004 to investigate methods for improving pavement–tire noise and maintaining friction. They are concerned about wearing of the ground surfaces because of the limestone used as coarse aggregate in their pavements. Multi-year friction study data indicate that diamond ground sections have FN40R friction levels above burlap drag but lower than the transverse and longitudinally tined sections. The grinding test site, constructed on US 69, includes sections with blade spacings of 0.11, 0.12, and 0.13 in. (2.8, 3.0, and 3.3 mm), with and without jacks, and with and without narrow transverse joints (Gisi, 2004). Michigan DOT specifies 0.5-in. (13-mm) transverse tining, 0.12 in. (3 mm) wide and 0.12 to 0.25 in. (3 to 6 mm) deep, with some variation of the spacing. However, Michigan DOT does not enforce the depth. They have measured tine depths and mean texture depths on cores removed from construction projects in 2003-04 and found that the design depths are not being met. They constructed a texturing test site in 2000 on US 24 in Detroit that includes diamond ground surface, variable diagonal tining, and turf drag surfaces. In 2001, the tined surfaces in the truck lanes had FN40R values of 55, while the turf drag and diamond ground sections were 46. All of these values are considered adequate. Michigan DOT plans to construct a demonstration project in 2005 to evaluate turf drag surfaces (Hynes, 2004/05). Recently I-275 in Detroit was constructed using variable transverse tining. The contractor reportedly pulled out every other tine from the rake during construction. Public

B-6
complaints about the noise from the pavement have led the DOT to grind the entire surface (DeGraff, 2004). Minnesota DOT used turf drag and 1-in. (25-mm) maximum variable spacing transverse tining for high speed concrete pavements from 1976 to 1983. They modified their variable spacing in 1983 to a maximum of 1.5 in. (38 mm) and reduced the range to 0.625 to 1.0 in. (16 to 25 mm) in 1995. In 1998, they took the lead in evaluating and implementing longitudinal turf drag surfaces for high speed pavements. Since 1998, they have specified turf drag on high speed pavements. In 1998, they required a mean texture depth (MTD) of 0.03 in. (0.8 mm). Diamond grinding was required on several projects because contractors were not meeting the texture requirements. To increase friction levels, they increased the MTD requirement to at least 0.04 in. (1 mm) for new construction. This helps offset the average texture depth reduction of 0.015 in. (0.4 mm) caused by snow plow activity. Minnesota DOT investigated the effect of texture on zero blanking band profile index (PI0.0) in 2002. They concluded that texture increases the profile index by 8.8 in/mi (140 mm/km) when using a lightweight profiler and by 5.7 in/mi (90 mm/km) when using a California profilograph. Minnesota has selected 16 turf and broom sites for texture and friction studies. This work will continue for several years. In the fall of 2004, the National Center for Asphalt Technology (NCAT) sent their noise trailer to Minnesota to evaluate several test sites; the results are not yet available. Minnesota is also conducting research into the effect of turf drag on accident rates (Schwartz 2004; Izevbekhai, 2004). Missouri DOT specified burlap drag and 0.5-in. (13-mm) transverse tining until January 2004, when they significantly modified their requirements. Currently, they allow any type of concrete surface texture (including burlap drag) for high speed pavements, as long as it achieves a Lot MTD of 0.03 in. (0.7 mm) following construction. Lots consist of a day’s paving and are sampled at least four times. If the contractor chooses to construct a surface texture using transverse or longitudinal tining (0.5 in. [13 mm] spacing) or using diamond grinding, the texture depth requirement will be waived. Currently, contractors are typically using longitudinal tining, because of its ease of installation. Reportedly, Missouri is concerned about the long-term friction stability of diamond ground surfaces, because of the predominance of limestone in their paving projects. To reduce this concern, they have cut back on their incentive for diamond grinding (Donahue, 2004/05). North Dakota DOT has experimented with turf drag and variable transverse tining for several years. Their current specification calls for variable transverse tining spaced as shown in Table B-3 and skewed 1:6 left-hand forward. The table should be read from left to right and then from top to bottom. In 1997, they completed an evaluation of tining widths to reduce noise on concrete highways. A test project was completed 2.5 mi (4 km) west of Eagles Nest on I-80 in 1994. It included uniform transverse tining (0.5, 0.75, 1, 2, 3, and 4 in. [13, 19, 25, 51, 76, and 102 mm] spacings) and longitudinal tining (0.75-in. [19 mm] spacing). One section included a uniform combination of 1-, 3-, 2-, and 4-in. (25-, 76-, 51-, and 102-mm) transverse tine spacings. They noted a whine within the vehicles with tine spacing of 2 in. (51 mm) or greater and found reduced interior noise with reduced transverse tine spacing. Exterior noise measurements were not noticeably different with the different tine spacings. Under the same study, they constructed a test site on I-94 using variable transverse tine spacings between 0.375 and 1.5 in. (9.5 and 38 mm). This section produced lower noise, and adopted the variable spacing as their construction

B-7
standard in 1997. Since that time, the specified spacing has been modified. North Dakota DOT also evaluated the effectiveness of tining versus carpet dragging for texturing concrete pavements.
Table B-3. North Dakota DOT variable tining specification spacing, mm (read left to right, one row at a time).
57 71 29 59 51 29 27 24 30 25 56 60 70 67 25 67 51 46 18 19 64 75 75 21 13 70 22 67 19 44 71 25 48 52 48 13 56 44 60 32 52 32 21 19 40 11 41 70 73 38 38 19 13 13 68 38 59 19 29 14 67 56 25
1 in. = 25.4 mm Five projects were constructed in 1999-2001 on North Dakota I-94 under this study with longitudinal turf drag and variable transverse tined surfaces. Although the average texture depth of the turf drag sections (0.03 in. [0.8 mm]) was less than that of the tined sections (0.04 in. [1.0 mm]), the ASTM E 274 ribbed tire friction levels after 1 to 3 years were the same for the turf drag (53.8) as the tined surfaces (52.5). With light and heavy vehicles, the roadside noise of the turf drag sections averaged about 3 dB and 2.4 dB lower than the tined sections (Schumacher, 2004). Pennsylvania DOT specifies a variable transverse tine according to that developed for Wisconsin DOT, as shown in Table B-4. They have had problems with constructing skewed transverse tining, and have not included skew in their specification. They have constructed longitudinal tining test sections, but have had trouble measuring surface profiles and are concerned about its safety. Grinding is only used for improving smoothness. In their quality control operations, they use a tire gauge to confirm tine depth (Gardiner, 2004). They have polish-susceptible limestone in the western part of the state and are looking into polish value, LA Abrasion, and Micro Duval methods for controlling aggregate resistance to wear (Becker, 2004). Texas DOT specifies longitudinal turf drag followed by transverse tining with 1-in. (25-mm) spacing for new PCC pavements. However, they are closely monitoring research in other surface texture types, including turf drag. They sponsored research by the University of Texas at Austin into the roadside and tire noise properties of transversely tined (25-mm) PCC surfaces, transversely and diagonally grooved PCC, ungrooved PCC, and other asphalt surfaces. Ungrooved and untined PCC pavements had the lowest roadside noise levels,

B-8
followed by tined continuously reinforced PCC and grooved jointed reinforced PCC. Ultra-thin bonded asphalt wearing coarse material had the lowest noise levels. Only very small differences in ranking were noted from the microphones mounted near the tire versus the roadside measurements. TXDOT, for several years, has collected large amounts of pavement surface texture data using a 128 kHz laser system. They expect to correlate this with friction data and use the texture data as an initial 100 percent review of their pavement system’s frictional properties (Bertrand, 2004; Seiders, 2004).
Table B-4. Pennsylvania and Wisconsin DOT’s variable tining specification spacing, mm (read left to right, one row at a time).
34 36 47 54 48 43 32 31 27 36 29 46 21 43 23 42 52 24 18 28 40 34 27 26 25 27 20 37 38 52 51 45 37 43 53 14 27 37 42 41 29 43 14 45 44 30 37 33 40 28 31 50 34 45 15 20 45 50 16 63 51 29 25 18 16 53 18 38 51 40 17 15 49 50 39 51 36 36 38 46 29 38 50 24 33
1 in. = 25.4 mm Wisconsin DOT specified turf drag followed by a 0.12-in. (3.02-mm) rake to apply variable transverse tining according to the pattern established by the Marquette University for Wisconsin DOT. The tining center-to-center pattern dimensions are the same as Pennsylvania’s, as shown in Table B-4. Contractors are encouraged to skew the tining but are not required to do so. Wisconsin has constructed and evaluated concrete pavement texture and noise test sites since 1997. This has included 22 test sections constructed using various combinations of tining (longitudinal, transverse, variable, uniform, skewed 1:4, and skewed 1:6). In addition, they have evaluated concrete pavement surface texture rehabilitation methods, such as shot blasting and diamond grinding. It was their research that identified a method to detect, quantify, and eliminate the whine associated with uniform transverse tining. Conclusions from their research indicate that both the longitudinally tined and skewed variably tined concrete surfaces provide quiet interior and exterior noise levels. They reported exterior noise reductions (Leq) of 1 to 4 dB(A) for variable tining and 4 to 7 dB(A) for longitudinal tining. Interior noise levels (Lmax) were about 2 dB(A) for both textures.

B-9
In Austria, public complaints of high traffic noise in the populated valleys prompted a management decision to allow only noise reducing asphalt pavements. The concrete industry worked with Robuco of Belgium to develop exposed aggregate concrete surface mix designs and construction methods. Since 1997, they have constructed two-layer, wet-on-wet EACS using a 1.57-in. (40-mm) top layer of hard, low polishing cubic aggregate over a limestone or recycled concrete lower layer. Noise measured on this pavement surface reportedly is only 0.7 dB higher than porous asphalt after 2 years. Gomaco has developed a slip form paver for this dual application (Buys, 2004). In Belgium and the Netherlands, due to the restricted size of jobs, two-layer paving is not cost effective. Instead, they use a single-layer EACS with maximum aggregate size of 1 in. (25 mm) and an increased quantity of smaller aggregate. This pavement reportedly is within 0.4 dB of the levels achieved using a two-layer system. Germany continues to use burlap drag surfaces on their concrete roadway. However, they are investigating two-layer exposed aggregate concrete surfaces and porous concrete surfaces for texture properties, construction methods, friction durability, noise levels, and tire interaction (Huschiek, 2004). The United Kingdom has recently required that 60 percent of trunk roads, including all PCC roads, be surfaced using low-noise asphalt surfacing by March 2011. This has hampered construction and research in PCC surface textures. However, the Transportation Research Lab has completed a large body of work in evaluating the effects of PCC surface texture on safety and noise. They have developed detailed specifications for designing and constructing EACS. They also developed and calibrated a method of using maturity meter technology to determine the best time for surface mortar removal. Contractors in the UK have had good success using a combination of sprayed set retarder and rain resistant moisture barrier instead of using plastic sheeting. They report having problems using porous concrete pavements and discontinuing its use (Chandler, 2004). SMOOTH VERSUS RIBBED TIRE USE Agencies such as Alabama, Colorado, Florida, Georgia, Illinois, Indiana, Kansas, Michigan, Minnesota, Missouri, Oklahoma, Texas, and Virginia are using smooth tires for their ASTM E 274 locked-wheel friction testing exclusively or in combination with ribbed tires. The advantages of smooth tire measurements (macro-texture measurement) are becoming more apparent, as evidenced by the number of agencies using the method. ESTIMATED MEAN TEXTURE DEPTH AND FRICTION CORRELATION No information was found in the U.S. relating estimated mean texture depth (EMTD) and friction levels, except in work completed for the Wisconsin DOT. That research found very poor correlation between EMTD and FN40S (R2 = 0.13) for all pavements analyzed. Similarly, the correlation between speed gradient and FN40S was non-existent (R2 = 0.04) (Kuemmel et al, 2000).
B-10
TEXTURING METHOD STRENGTHS AND WEAKNESSES Discussions with agency and industry personnel and review of the documents they provided helped to develop the lists of practical difficulties and benefits associated with each texturing method. Table B-5 summarizes these strengths and weaknesses and provides reference information for the comments. COSTS ASSOCIATED WITH EACH METHOD Contractors, suppliers, and researchers provided ranges of additional costs associated with each of the texturing methods reviewed under this project. Their responses are summarized in Chapter 2 of this final report. Essentially, the costs associated with tining and dragging do not vary significantly, because the primary cost is the labor. Costs for grinding, grooving, exposed aggregate, and ultra-thin bonded wearing courses are in the same cost range, and porous concrete and ultra-thin epoxied laminates are in the highest cost range. REDUCING TIRE-ROAD NOISE AND MAINTAINING SAFETY Several PCC surface texturing methods have been shown to reduce pavement–tire whine and noise levels. These include longitudinal tining, turf drag, grinding, and exposed aggregate surfaces. Several agencies, including the FHWA, have concerns about the long-term frictional and safety properties of these textures (Schumacher 2004; Seiders, 2004; Becker, 2004; Forget, 2004; Lopez, 2004). Maintaining good fine aggregate properties for sections with longitudinal tining and turf drag is suggested as a key to maintaining long-term friction levels. For diamond ground and exposed aggregate surfaces, the coarse aggregate properties must be adequate. Texas DOT recommends a minimum acid solubility of 60 percent for fine aggregate (Seiders, 2004). Pennsylvania is considering Polish Value, LA Abrasion, and Micro Duval testing to ensure sufficient coarse aggregate hardness (Becker, 2004). Iowa DOT reports having very few friction problems with their turf drag and longitudinal tined sections because of their use of fine aggregate with a high silica content (Hanson, 2004). Illinois DOT indicates their concern with fine aggregate hardness by evaluating the replacement of silica-based fine aggregates with crushed up to 50 percent limestone and dolomite aggregate (Mueller, 2004) Maintaining a low water cement ratio and applying the curing compound as early as possible to ensure mortar durability are other methods that have been suggested for maintaining long-term frictional stability (DeGraff, 2004).

B-11
Table B-5. Practical weaknesses and strengths of texture methods.
Method Strengths Weaknesses References
Transverse tine (0.75 in [19 mm])
• Durable high friction (with good aggregates)
• Water drains in channels (less splash/spray)
• Automated or manual construction
• Very high noise and tonal whine • Variable depending on weather
and operator • Possible less friction on
horizontal curves than longitudinal textures
Neal et al., 1978 FHWA, 1996 Kuemmel et al., 2000
Transverse tine (0.5 in [12.5 mm])
• Durable high friction (with good aggregates)
• Water drains in channels (less splash/spray)
• Automated or manual construction
• High noise and some tonal whine
• Variable depending on weather and operator
• Possible less friction on horizontal curves than longitudinal textures
Neal et al., 1978 FHWA, 1996 Kuemmel et al., 2000
Transverse tine (variably spaced)
• Durable high friction (with good aggregates)
• Water drains in channels (less splash/spray)
• Durable high friction, automated or manual
• No tonal whine if properly designed/constructed
• High noise • Variable depending on weather
and operator • Possible less friction on
horizontal curves than longitudinal textures
Neal et al., 1978 FHWA, 1996 Kuemmel et al., 2000
Transverse tine (skewed, variably spaced)
• Durable high friction, automated or manual
• Water drains in channels (less splash/spray)
• No tonal whine if properly designed/constructed
• High noise • Additional effort required to
construct
Kuemmel et al., 2000
Transverse groove
• Provides retrofit macro-texture to old roads
• Water drains in channels • Minimal traffic interruption or
worker exposure
• Slow and expensive operation • Requires equipment entry into
adjacent lanes • Possible less friction on
horizontal curves than longitudinal textures
Transverse drag
• Small positive subsurface water drainage flow
• Slow and expensive operation Wittwer, 2004
Longitudinal tine
• High friction, lower noise and no tonal whine
• Possible greater stability on curves
• Automated construction required
• Reported small vehicle handling problems
• No positive surface drainage channels (greater splash/spray)
Neal et al., 1978 FHWA, 1996 Dierstein, 1982 Ruggenstein, 1977 Ardani, 2004
Longitudinal plastic brush
• Automated or manual application
• Not as affected by high wind or extreme temperature
• Attractive, consistent appearance
• Good noise properties
• Generally low macro-texture • May not maintain texture,
friction, and safety properties under heavy traffic
Wittwer, 2004
Longitudinal burlap drag
• Attractive, consistent appearance
• Automated, simple construction
• Good noise properties
• Only applies moderate macro-texture
• Moderate initial friction • Surface wears quickly under
heavy traffic
Wittwer, 2004

B-12
Table B-5. Practical weaknesses and strengths of texture methods (continued).
Method Strengths Weaknesses References Longitudinal turf drag
• Lower noise, higher friction • Simple construction • Early cure application for
greater strength • Attractive, consistent
appearance
• Long-term friction not well defined
• Aggregate and mortar strength are critical
• Difficult to achieve with high winds and extreme temperatures
Hanson, 2004 Wittwer, 2004
Longitudinal groove
• Provides retrofit macro-texture to old roads
• Minimal traffic interruption or worker exposure
• No positive surface drainage channels (greater splash/spray)
• Does not increase micro-texture
• Reported small vehicle handling problems
Longitudinal grind
• Provides retrofit micro-texture and macro-texture
• Improves friction and noise • Low worker exposure • Increased smoothness • No elevation changes required
• Friction decreases rapidly on polish susceptible coarse aggregate with heavy traffic.
• No positive surface drainage channels (greater splash/spray)
• Slurry must be removed
Correa and Wong, 2001; Scofield, 2003 Rao et al., 1999
Exposed aggregate
• Some with good noise and friction properties
• Long-term noise relatively stable
• Allows use of recycled aggregates and two-layer systems
• Special equipment and methods are required
• High variability in noise properties reported
• Contractor experience is critical to performance
• Additional time is required for setting and brushing
• Air void loss could lead to durability problems
DeGraff, 2004
Shotblasted PCC
• Provides retrofit micro-texture • Can increase macro-texture • Minimal traffic interruption or
worker exposure
• Limited improvement in noise properties
• Long-term performance depends on aggregate properties
• Noise levels increase in aggregate is large
• Does not remove whine from transverse tining
Billiard, 2004/05
Porous PCC • Very good noise properties • High friction • Low splash/spray
• Mostly experimental designs • Noise reduction reduces with
void filling • Additional salt required in cold
climates • Vacuuming debris required
Caestecker, 1999; Henry, 2000; Beldeens, 2004
Ultra-thin epoxied laminates
• Little noise improvement over ground PCC
• Good friction • No clearance issues
• Extremely expensive Kuemmel et al., 2000
Ultra-thin bonded wearing coarse
• Good noise, high friction, low splash/spray
• Fast application, improved smoothness
• Clearance slightly decreased Exline, 2004

B-13
APPENDIX B REFERENCES Andruski, D. 2004. Telephone interaction with Dave Andruski of Indiana DOT. Ardani, A. 2004. Email and telephone interaction with Ahmad Ardani of Colorado DOT. Ardani, A. and W. Outcalt. 2000. PCCP Texturing Methods, Final Report, Report No. CDOT-DTD-R-00-1, Colorado Department of Transportation, Denver, Colorado. Becker, J. 2004. Telephone interaction with John Becker of Pennsylvania CPA. Billiard, G. 2004/05. Email and telephone interaction with Gary Billiard of Skidabrader. Burge, P., K. Travis, and Z. Rado. 2002. “A Comparison of Transverse Tined and Longitudinal Diamond Ground Pavement Texturing for Newly Constructed Concrete Pavement,” Presented at the Annual Meeting of the Transportation Research Board, Washington, D.C. Buys, R. 2004. Email interaction with Romain Buys of Robuco NV in Belgium. Chandler, J. 2004. Email interaction with John Chandler of Transportation Research Laboratory (TRL). Correa, A. and B. Wong. 2001. “Concrete Pavement Rehabilitation—Guide for Diamond Grinding,” FHWA Southern Resource Center, Atlanta, Georgia. DeGraff, D. 2004. Telephone interaction with Dan DeGraff of Michigan CPA. Dierstein, P. 1982. “A Study of PCC Pavement Texture Characteristics in Illinois,” Report No. FHWA/IL/PR-095, Illinois Department of Transportation, Springfield, Illinois. Donahue, J. 2004/05. Telephone interaction with John Donahue of Missouri DOT. Donavan, P.R. 2003. “Evaluation of the Noise Produced by Various Grooved and Ground Textures Applied to Existing Portland Cement Concrete Pavement Surfaces,” Caltrans, Petaluma, California. Exline, M. 2004. Email and telephone interaction with Marvin Exline of Koch Materials. Federal Highway Administration (FHWA). 1996. “PCC Surface Texture Technical Working Group Findings,” Technical Working Group Meeting, Washington, D.C. Forget, J-M. 2004. Telephone interaction with Jean Maurice Forget of Demix Construction. Gardiner, P. 2004. Email and telephone interaction with Pat Gardiner of Pennsylvania DOT.
B-14
Gisi, A. 2004. Email interaction with Andy Gisi of Kansas DOT. Hanson, T. 2004. Telephone interaction with Todd Hanson of Iowa DOT. Henry, J.J. 2000. “Evaluation of Pavement Friction Characteristics,” NCHRP Synthesis 291, National Cooperative Highway Research Program, Washington, D.C. Huschek, S. 2004. Email interaction with Siegfried Huschek of BAST. Hynes, T. 2004/05. Telephone interaction with Tom Hynes of Michigan DOT. Izevbekhai, B. 2004. Telephone interaction with Bernard Izevbekhai of Minnesota DOT. Jones, K. 2004. Telephone interaction with Kevin Jones of Iowa DOT. Kuemmel, D.A., R.C. Sonntag, J. Crovetti, and Y. Becker. 2000. “Noise and Texture on PCC Pavements: Results of a Multi-State Study,” Final Report No. WI/SPR-08-99, Wisconsin Department of Transportation, Madison, Wisconsin. Lopez, B. 2004. Telephone interaction with Bob Lopez of Texas Cement Council. Marquart, M.J. 1997. “Evaluation of Tining Depths to Reduce Noise of Concrete Roadways - Final Report,” Experimental Study ND 94-09, North Dakota DOT, Bismark, North Dakota. Marquart, M. 2003. “Tining Versus Carpet Dragging for Texturing PCC Pavements: Third Evaluation,” Experimental Study ND 99-02, North Dakota Department of Transportation, Bismark, North Dakota. Mueller, M. 2004. Telephone interaction with Matt Mueller of Illinois DOT. Neal, B., D. Peck, J. Woodstrom, and D. Spellman. 1978. “Surface Textures for PCC Pavements,” Report No. FHWA-CA-TL-78-14, California Department of Transportation, Sacramento, California. Outcalt, S. 2004. Email and telephone interaction with Skip Outcalt of Colorado DOT. Parcells, W. 1989. “Surface Friction Results on Textured PCC Pavements – Final Report,” Kansas Department of Transportation, Topeka, Kansas. Pyle, T. 2004/05. Telephone and email interaction with Tom Pyle of Caltrans. Rao, S., H.T. Yu, and M.I. Darter. 1999. “The Longevity and Performance of Diamond-Ground Pavements," R&D Bulletin RD118, Portland Cement Association, Skokie, Illinois. Ruggenstein, E. 1977. “Summary and Evaluation of Concrete Pavement Texturing Practices.”

B-15
Schumacher, C. 2004. Telephone interaction with Clayton Schumacher of North Dakota DOT. Schwartz, D. 2004. Telephone interaction with Doug Schwartz of Minnesota DOT. Scofield, L. 2003. “SR 202 PCCP Whisper Grinding Test Sections—Construction Report,” Arizona Transportation Research Center, Phoenix, Arizona. Scofield, L. 2004/05. Verbal and telephone interaction with Larry Scofield of Arizona DOT. Seiders, J. 2004. Telephone interaction with Jeff Seiders of Texas DOT. Weinfurter, J., D. Smiley, and R. Till. 1994. “Construction of European Concrete Pavement on Northbound I-75—Detroit, Michigan,” Research Report R-1333, Michigan Department of Transportation, Lansing, Michigan. Wittwer, D. 2004. Telephone and email interaction with David Wittwer of United Paving Contractors.

This page intentionally left blank.

APPENDIX C. EXISTING TEXTURE TEST SECTIONS


C-1
Table C-1. Summary of existing pavement test sections.
State (SHRP ID #)
Highway (County)
Dir
Location
Orig.
ID
New ID
Primary Texture
Pre-Texture
Climate
Const Date (Retexture
Date)
Date Open to Traffic
AZ (4) SR 202L (Maricopa)
WB Phoenix Urban 6-lane
Santan Freeway, from Kyrene Rd to 56th St (MP 52 to 53) (Sta 2050+60 to 2030+60) 2005 2-way
AADT=77,400 2005 %Trk=?? 13” JPC-D, 4”
Agg ~12.5’ Jt
Spacing (variable??) 12’ Lanes
AZ 1 1001 Long DG–0.235” Space, 0.125-0.25” Deep, 0.125” Wide (0.11” Blade Spacer, 0.125” Blade Width), No Jacks
Long Tine–0.75” Space, 0.125” Wide, 0.156” Deep Long. Burlap Drag
DNF Spring ‘03 (6/4/03)
9/8/03
AZ 2 1002 Long DG–0.235” Space, 0.125-0.25” Deep, 0.125” Wide (0.11” Blade Spacer, 0.125” Blade Width), Jacks & Floating Head
Long Tine–0.75” Space, 0.125” Wide, 0.156” Deep Long. Burlap Drag
DNF Spring ‘03 (6/5/03)
9/8/03
AZ 3 1003 Long DG–0.245” Space, 0.125-0.25” Deep, 0.125” Wide (0.12” Blade Spacer, 0.125” Blade Width), No Jacks, Fin Removal (via Grader)
Long Tine–0.75” Space, 0.125” Wide, 0.156” Deep Long. Burlap Drag
DNF Spring ‘03 (6/5/03)
9/8/03
AZ 4 1004 Long DG–0.245” Space, 0.125-0.25” Deep, 0.125” Wide (0.12” Blade Spacer, 0.125” Blade Width), Jacks & Floating Head
Long Tine–0.75” Space, 0.125” Wide, 0.156” Deep Long. Burlap Drag
DNF Spring ‘03 (6/6/03)
9/8/03
CA (6) SR 58 (Kern)
EB Mojave Rural 4-lane
Mojave Bypass, from Bus 58 (Exit 165) to east of SR 14 (Exit 167) (MP 167 to 169) (Metric Sta 208+00 to 237+18) 2005 2-way
AADT=12,700 to 19,000 2003 %Trk=35
(est) ??” JPC-D 11.5 to 15’
Variable Jt Spacing 12’ Lanes
CA 0 — — Long Tine–0.75” Space, 0.09-0.125” Wide (rand), 0.2” Deep
DNF 11/4 to 11/16/02
9/9/03
CA 1 — Long DG–??” Space, ??” Deep, ??” Wide (0.12” Blade Spacer, ??” Blade Width), ?? Jacks
Long Tine–0.75” Space, 0.09-0.125” Wide (rand), 0.2” Deep
DNF 11/4 to 11/16/02
(Apr-Jun ’03)
9/9/03
CA 2 1002 Long DG–0.245” Space, 0.0625-0.125” Deep, 0.125” Wide (0.12” Blade Spacer, 0.125” Blade Width) No Jacks
Long Burlap DNF 11/4 to 11/16/02
(Apr-Jun ’03)
9/9/03
CA 3 1003 Long Groove–0.75” Space, 0.125” Deep, 0.09” Wide
Long Burlap DNF 11/4 to 11/16/02
(Apr-Jun ’03)
9/9/03
CA 4 1004 Long Groove–0.75” Space, 0.25” Deep, 0.09” Wide
Long Burlap DNF 11/4 to 11/16/02
(Apr-Jun ’03)
9/9/03
CA 4.5 1045 — Long Burlap DNF 11/4 to 11/16/02
9/9/03 CA 5 1005 Long DG–0.23” Space, 0.0625-
0.125” Deep, 0.125” Wide (0.105” Blade Spacer, 0.125” Blade Width) No Jacks
Long Burlap DNF 11/4 to 11/16/02
(Apr-Jun ’03)
9/9/03
CA 5.5 — Long DG––??” Space, ??” Deep, ??” Wide (0.12” Blade Spacer, ??” Blade Width) ?? Jacks
Long Burlap DNF 11/4 to 11/16/02
(Apr-Jun ’03)
9/9/03
CA 6 — Long DG––??” Space, ??” Deep, ??” Wide (0.12” Blade Spacer, ??” Blade Width) ?? Jacks
Long Groove–0.75” Space, 0.375” Deep, 0.09” Wide Long. Broom
DNF 11/4 to 11/16/02
(Apr-Jun ’03)
9/9/03
CA 7 1007 Long Groove–0.75” Space, 0.25” Deep, 0.09” Wide
Long Broom DNF 11/4 to 11/16/02
(Apr-Jun ’03)
9/9/03
CA 7.5 1075 — Long Broom DNF 11/4 to 11/16/02
9/9/03 CA 8 — Long DG––??” Space, ??” Deep, ??”
Wide (0.12” Blade Spacer, ??” Blade Width) ?? Jacks
Long Broom DNF 11/4 to 11/16/02
(Apr-Jun ’03)
9/9/03
Note: Sections shown in shading were not evaluated/tested under 10-67, yet are/were part of a formal study conducted by the respective state.

C-2
Table C-1. Summary of existing pavement test sections (continued).
State
(SHRP ID #)
Highway (County)
Dir
Location
Orig.
ID
New ID
Primary Texture
Pre-Texture
Climate
Const Date (Retexture
Date)
Date Open to Traffic
CO (8) I-70 (Elbert)
EB Deer Trail/Agate Rural 4-lane
Interstate from SR 178 (Exit 336) to SR 153 (MP 336 to 339) 2005 2-way
AADT=11,400 2005
%Trk=32.1 11” PCC
Overlay 15’ Jt Spacing 12’ Lanes
CO 1-1 — Tran Tine–1” Space, 0.125” Deep, 0.125” Wide (CDOT Spec)
Burlap Drag DF Summer/Fall ‘94
??
CO 1-2 — — Tran Astro-Turf DF Summer/Fall ‘94
??
CO 1-3 — Tran Tine–Variable Space (0.63-0.87”), 0.125” Deep, 0.125” Wide
Long Astro-Turf DF Summer/Fall ‘94
??
CO 1-4 — Tran Tine–0.5” Space, 0.125” Deep, 0.125” Wide
Long Astro-Turf DF Summer/Fall ‘94
??
CO 1-5 — Tran Groove–Variable Space (0.63-0.87”), 0.125” Deep, 0.125” Wide
Long Astro-Turf DF Summer/Fall ‘94
??
CO 1-6 — Tran Tine–1” Space, 0.125” Deep, 0.125” Wide
Long Astro-Turf DF Summer/Fall ‘94
??
CO 1-7 1007 Long Groove–0.75” Space, 0.125” Deep, 0.125” Wide (included in Marquette study)
Long Astro-Turf DF Jul-Aug ‘94 Oct ‘94
CO 1-8 1008 — Long Astro-Turf DF Jul-Aug ‘94 Oct ‘94 CO 1-9 1009 Long Tine–0.75” Space, 0.125”
Deep, 0.125” Wide (included in Marquette study)
Long Astro-Turf DF Jul-Aug ‘94 Oct ‘94
US 287 (Larimer)
SB Berthoud Rural 4-lane
Berthoud Bypass, from SR 56 to Bus 287 (MP 325.5 to 329) (Sta 1679+40 to 1864+98) 2006 2-way
AADT=9,700 2006 %Trk=5.1 10” JPC-D 15’ Jt Spacing 12’ Lanes
CO 3-1 3001 — Long Astro-Turf (Deep) DF 8/6 & 8/9/04 6/28/06 SB CO 3-2 3002 Long Tine–0.75” Space, 0.1875”
Deep, 0.09-0.125” Wide (Caltrans Spec)
— DF 8/9/04 6/28/06
SB CO 3-3 3003 Long Tine (Meander)–0.75” Space, 0.125” Deep, 0.125” Wide
Long Astro-Turf DF 8/9/04 6/28/06
SB CO 3-4 — Long Tine–Variable Space (0.625-1.5”), 0.125” Deep, 0.125” Wide
Long Astro Turf DF 8/31/04 6/28/06
NB CO 3-5 3004 Long Groove–0.75” Space, 0.125” Deep, 0.125” Wide
Long Astro-Turf DF 7/22/04 6/28/06
NB CO 3-6 3005 Long DG–0.22” Space, 0.0625” Deep, 0.125” Wide (0.095” Blade Spacer, 0.125” Blade Width), No Jacks
Long Astro-Turf DF 7/22/04 6/28/06
SB CO 3-7 3006 Long Tine–0.75” Space, 0.125” Deep, 0.125” Wide (CDOT Spec)
Long Astro-Turf DF Oct ‘04 6/28/06
Note: Sections shown in shading were not evaluated/tested under 10-67, yet are part of a formal study conducted by the respective state.

C-3
Table C-1. Summary of existing pavement test sections (continued).
State (SHRP ID #)
Highway (County)
Dir
Location
Orig.
ID
New ID
Primary Texture
Pre-Texture
Climate
Const Date (Retexture
Date)
Date Open to Traffic
IL (17) I-55/74 (McLean)
SB/EB Bloomington Urban 6-lane
interstate between US 150/SR 9 (Exit 160) and West Oakland Ave (MP 159 to 158) (Sta 509+34 to 563+72) 2004 2-way
AADT=37,500 2004 %Trk=40 12.5” CRC 12’ Lanes
IL 5-1 1001 Trans Tine–0.75” Space, 0.125-0.19” Deep, 0.09-0.125” Wide
Long Astro-Turf WF 1/1/04 est. 6/1/04
I-57 (Champaign)
SB Champaign Rural 4-lane
interstate between I-74 (Exit 237) and I-72 (Exit 235) (MP 236.2 to 236.0) (Sta ?? to ??) 2004 2-way
AADT=20,900 2003 %Trk=28 2” AC Resurfacing 12’ Lanes
IL 4-1 4001 Dense-Graded AC (SuperPave) — WF Fall ‘03 1/1/04
I-70 (Clark)
WB Marshall Rural 4-lane
interstate between US 40 (Exit 154) and CR 20 (MP 153.36 to 153.16) (Sta 422+50 to 411+94) 2004 2-way
AADT=21,500 2004 %Trk=55 12” Unbonded CRC
Overlay 12’ Lanes
IL 1-1 5001 Trans Tine–Variable Space (0.67-2.125”, Avg=1.46”), 0.125-0.19” Deep, 0.125” Wide (Mod. Marquette Design)
Long Astro-turf WF Spring/Summer ‘02
10/1/02
I-74 (Champaign)
WB Champaign/Mahomet Rural 4-lane
interstate between Lindsay Rd and Prairieview Rd (Exit 174) (MP 176.4 to 176.2) (Sta ?? to ??) 2004 2-way
AADT=31,700 2004 %Trk=26.5 3.5” AC Resurfacing 12’ Lanes
IL 8-1 8001 Dense-Graded AC — WF Spring/Summer ‘98
10/1/98
Note: Sections shown in shading were not evaluated/tested under 10-67, yet are part of a formal study conducted by the respective state.

C-4
Table C-1. Summary of existing pavement test sections (continued).
State
(SHRP ID #)
Highway (County)
Dir
Location
Orig.
ID
New ID
Primary Texture
Pre-Texture
Climate
Const Date (Retexture
Date)
Date Open to Traffic
IA (19) US 163 (Polk)
WB DesMoines/PrairieCity Rural 4-lane highway
between West 140th St South and IA 316/NE 112th St (MP 13.72 to 12.36) (Sta 1035+00 to 963+10) 2005 2-way
AADT=10,900 2005 %Trk=18.8 10” JPC-D or JPC-
ND?? ~20’ Jt Spacing 14’ Lanes
IA 1-1 1001 Trans Tine–0.5” Space, 0.156” Deep, 0.125” Wide (included in Marquette study)
Long Astro-Turf WF 10/17 to 10/23/93
1/1/94
IA 1-2 1002 Trans Tine–0.5” Space, <0.125” Deep, 0.125” Wide
Long Astro-Turf WF 10/17 to 10/23/93
1/1/94
IA 1-2C
1002C Tran Tine–0.75” Space, 0.156” Deep, 0.125” Wide (included in Marquette study)
Long Astro-Turf WF 10/17 to 10/23/93
1/1/94
IA 1-3 1003 Long Tine–0.75” Space, <0.125” Deep, 0.125” Wide (included in Marquette study)
Long Astro-Turf WF 10/17 to 10/23/93
1/1/94
IA 1-4 1004 Long Tine–0.75” Space, 0.125-0.20” Deep, 0.125” Wide (included in Marquette study)
Long Astro-Turf WF 10/17 to 10/23/93
1/1/94
IA 1-5 1005 Tran Tine–Variable Space (0.75” Avg), 0.156” Deep, 0.125” Wide (included in Marquette study)
Long Astro-Turf WF 10/17 to 10/23/93
1/1/94
IA 1-6 1006 Tran Tine–Variable Space (0.75” Avg), <0.125” Deep, 0.125” Wide
Long Astro-Turf WF 10/17 to 10/23/93
1/1/94
IA1-6.1
1061 Tran Groove–1.0” Space, 0.1875-0.25” Deep, 0.125” Wide
— WF 10/17 to 10/23/93
1/1/94
IA 1-7 1007 — Long Astro-Turf WF 10/17 to 10/23/93
1/1/94
US 34 (Henry)
WB Mt. Pleasant Rural 4-lane Mt.
Pleasant Bypass between Bus 218/Grand Ave (Exit 234) and CR W55 (Exit 231) (MP 233.20 to 232.71) (Sta 213+00 to 198+44) 2005 2-way
AADT=10,500 2005 %Trk=9 10” JPC-D ~12.5 Jt Spacing 14’ Lanes
IA 2-1 2001 Long Tine–0.75” Space, 0.125” Deep, 0.125” Wide
Long Astro-Turf WF 9/7/04 8/15/05??
WB IA 2-2 2002 Long Tine–0.75” Space, 0.125” Deep, 0.125” Wide
Long Burlap WF 9/8/04 8/15/05??
EB IA 2-3 2003 Long Tine–0.75” Space, 0.125” Deep, 0.125” Wide
Long Astro-Turf WF 9/22/04 8/15/05
US 218 (Washington)
NB Washington/Ainsworth Rural 4-lane highway
between 305th St and 295th St (MP 61.94 to 62.51) (Sta 733+00 to 762+56) 2005 2-way
AADT=7,700 2005 %Trk=21.3 10” JPC-D ~20’ Jt Spacing 14’ Lanes
IA 5-1 8001 Trans Tine–0.75” Space, 0.125-0.19” Deep, 0.125” Wide
Long Astro-Turf WF 8/4/97 7/1/98
NB IA 5-2 8002 Trans Tine–0.75” Space, 0.125-0.19” Deep, 0.125” Wide
Long Astro-Turf WF 8/5/97 7/1/98
US 30 (Story)
EB Ames/Nevada Rural 4-lane highway
between CR R70/580th Ave and 590th Ave (MP 153.10 to 153.30) (Sta 1455+00 to 1465+00) 2005 2-way
AADT=14,300 2005 %Trk=8 2” AC Resurfacing
IA 8-1 9002 Dense-Graded AC (SuperPave)
— WF Spring/Summer ‘04
10/1/04
Note: Sections shown in shading were not evaluated/tested under 10-67, yet are part of a formal study conducted by the respective state.

C-5
Table C-1. Summary of existing pavement test sections (continued).
State
(SHRP ID #)
Highway (County)
Dir
Location
Orig. ID
New ID
Primary Texture
Pre-Texture
Climate
Const Date (Retexture
Date)
Date Open to Traffic
KS (20) US 69 (Miami)
NB Louisburg Rural 4-lane
highway between 311th St and SR 68 (MP 10.592 to 15.086) (Metric Sta 19+365 to 26+600) 2005 2-way
AADT=8,610 2005 %Trk=17.6 10” JPC-D 15’ Jt Spacing 12’ Lanes
— (KDOT1)
— — Long Astro-Turf, Single-Saw Joints (0.19” wide)
DF 7/12 to 11/26/04 12/21/04
— (KDOT2)
— Long DG–0.235” Space, 0.0625” Deep, 0.125” Wide (0.11” Blade Spacer, 0.125” Blade Width), No Jacks
Long Tine, Standard-Saw Joints (0.38” wide)
DF 7/12 to 11/26/04 12/21/04
KS 2 (KDOT3)
1002 Long DG–0.235” Space, 0.0625” Deep, 0.125” Wide (0.11” Blade Spacer, 0.125” Blade Width), No Jacks
Long Tine, Standard-Saw Joints (0.38” wide) (were supposed to be single-saw joints)
DF 7/12 to 11/26/04 12/21/04
— (KDOT4)
— Long DG–0.245” Space, 0.0625” Deep, 0.125” Wide (0.12” Blade Spacer, 0.125” Blade Width), No Jacks
Long Tine, Single-Saw Joints (0.19” wide) (were supposed to be standard-saw joints)
DF 7/12 to 11/26/04 12/21/04
KS 4 (KDOT5)
1004 Long DG–0.245” Space, 0.0625” Deep, 0.125” Wide (0.12” Blade Spacer, 0.125” Blade Width), No Jacks
Long Tine, Single-Saw Joints (0.19” wide)
DF 7/12 to 11/26/04 12/21/04
KS 5 (KDOT6)
1005 Long DG–0.255” Space, 0.0625” Deep, 0.125” Wide (0.13” Blade Spacer, 0.125” Blade Width), Jacks
Long Tine, Standard-Saw Joints (0.38” wide)
DF 7/12 to 11/26/04 12/21/04
KS 6 (KDOT7)
1006 Long DG–0.255” Space, 0.0625” Deep, 0.125” Wide (0.13” Blade Spacer, 0.125” Blade Width), Jacks
Long Tine, Single-Saw Joints (0.19” wide)
DF 7/12 to 11/26/04 12/21/04
KS 7 (KDOT8)
1007 Long DG–0.255” Space, 0.0625” Deep, 0.125” Wide (0.13” Blade Spacer, 0.125” Blade Width), No Jacks
Long Tine, Standard-Saw Joints (0.38” wide)
DF 7/12 to 11/26/04 12/21/04
KS 8 (KDOT9)
1008 Long DG–0.255” Space, 0.0625” Deep, 0.125” Wide (0.13” Blade Spacer, 0.125” Blade Width), No Jacks
Long Tine, Single-Saw Joints (0.19” wide)
DF 7/12 to 11/26/04 12/21/04
— (KDOT10)
— Long Tine–0.75” Space, 0.125-0.25” Deep, 0.1875” Wide
Long Astro-Turf, Standard-Saw Joints (0.38” wide)
DF 7/12 to 11/26/04 12/21/04
KS 10 (KDOT11)
1010 Long Tine–0.75” Space, 0.125-0.25” Deep, 0.1875” Wide
Long Astro-Turf, Single-Saw Joints (0.19” wide)
DF 7/12 to 11/26/04 12/21/04
KS 11 (KDOT12)
— — Long Carpet, Standard-Saw Joints (0.38” wide)
DF 7/12 to 11/26/04 12/21/04
KS 12 (KDOT13)
— — Long Carpet, Single-Saw Joints (0.19” wide)
DF 7/12 to 11/26/04 12/21/04
US 54 (Woodson)
WB Batesville Rural 2-lane
highway between Union Pacific RR Overpass an SR 105 (MP ?? to ??) (Sta ?? to ??) 2005 2-way
AADT=1,620 2005 %Trk=31.5 ≥0.625” AC
Resurfacing (NovaChip® 4.75)
KS 2-1 2001 NovaChip® — DF Fall ’04 & Spring/Summer
‘05
7/1/05
I-70 (Lincoln)
WB Salina/Juniata Rural 4-lane
interstate between Lincoln-Saline County Line and North 290th Rd (Exit 233) (MP 235.26 to 235.06) (Sta ?? to ??) 2005 2-way
AADT=13,200 2005 %Trk=33.1 ≥0.625” AC
Resurfacing (NovaChip® 9.5)
KS 4-1 4001 NovaChip® — DF Summer/Fall ‘04
10/15/04
Note: Sections shown in shading were not evaluated/tested under 10-67, yet are part of a formal study conducted by the respective state.

C-6
Table C-1. Summary of existing pavement test sections (continued).
State (SHRP ID #)
Highway (County)
Dir
Location
Orig.
ID
New ID
Primary Texture
Pre-Texture
Climate
Const Date (Retexture
Date)
Date Open to Traffic
MI (26) I-75 (Wayne)
NB Detroit Urban 6- to 8-lane
Chrysler Freeway between Warren Ave East and Piquette Ave (just north of I-94) (milepoint 1.60 to 2.11) (Sta 125+25 to 171+35) 2004 2-way
AADT=124,484 2004 %Trk=11.4 10” JPC-D (2.5”/7.5”
wet-on-wet) 15’ Jt Spacing 12’ & 13.5’ Lanes
MI 1 1001 Exposed Aggregate Concrete (incl in Marquette study)
— WF Summer/Fall ‘93
11/23/93
MN (27) US 169 (Scott)
NB Eden Prairie/Shakopee Suburban 4-lane
highway between Canterbury Rd (CR 83) and SR 18 (MP 113.85 to 114.05) (Sta 494+00 to 504+56) 2004 2-way
AADT=58,000 2004 %Trk=5.8 10.5” JPC-D Variable (14’-17’) Jt
Spacing (skew) 14’ Lanes
MN 1 1001 Long Tine–0.75” Space, 0.125” Deep, 0.125” Wide (incl in Marquette study)
Long Astro-Turf WF Summer/Fall ‘96
11/1/06
MN 2 1002 Long Tine–Variable Space, (0.75” Avg), 0.125” Deep, 0.125” Wide (incl in Marquette study)
Long Astro-Turf WF Summer/Fall ‘96
11/1/06
MN (27) US 169 (Hennepin)
NB Brooklyn Park/Champlin Suburban 4-lane
highway between 101st Ave and 109th Ave. (MP 142.10 to 142.40) (Sta 163+50 to 179+06 2004 2-way
AADT=53,000 2004 %Trk=4.7 9” JPC-D Variable (14’-17’) Jt
Spacing (skew) 14’ Lanes
MN 7 7001 — (incl in Marquette study)
Long Astro-Turf WF Spring/Summer ‘95
7/1/95
MN 8 8001 Long Tine–0.75” Space, 0.125” Deep, 0.125 Wide (incl in Marquette study)
Long Astro-Turf WF Spring/Summer ‘95
7/1/95
Note: Sections shown in shading were not evaluated/tested under 10-67, yet are part of a formal study conducted by the respective state.
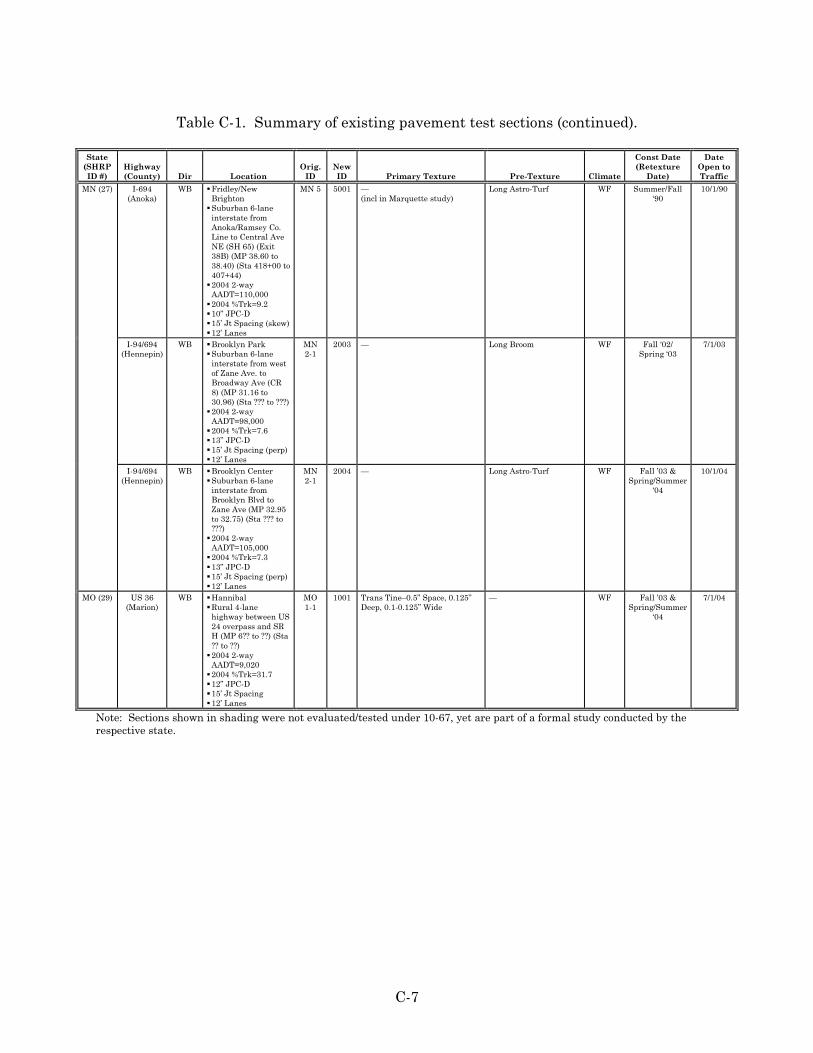
C-7
Table C-1. Summary of existing pavement test sections (continued).
State
(SHRP ID #)
Highway (County)
Dir
Location
Orig.
ID
New ID
Primary Texture
Pre-Texture
Climate
Const Date (Retexture
Date)
Date Open to Traffic
MN (27) I-694 (Anoka)
WB Fridley/New Brighton Suburban 6-lane
interstate from Anoka/Ramsey Co. Line to Central Ave NE (SH 65) (Exit 38B) (MP 38.60 to 38.40) (Sta 418+00 to 407+44) 2004 2-way
AADT=110,000 2004 %Trk=9.2 10” JPC-D 15’ Jt Spacing (skew) 12’ Lanes
MN 5 5001 — (incl in Marquette study)
Long Astro-Turf WF Summer/Fall ‘90
10/1/90
I-94/694 (Hennepin)
WB Brooklyn Park Suburban 6-lane
interstate from west of Zane Ave. to Broadway Ave (CR 8) (MP 31.16 to 30.96) (Sta ??? to ???) 2004 2-way
AADT=98,000 2004 %Trk=7.6 13” JPC-D 15’ Jt Spacing (perp) 12’ Lanes
MN 2-1
2003 — Long Broom WF Fall ‘02/ Spring ‘03
7/1/03
I-94/694 (Hennepin)
WB Brooklyn Center Suburban 6-lane
interstate from Brooklyn Blvd to Zane Ave (MP 32.95 to 32.75) (Sta ??? to ???) 2004 2-way
AADT=105,000 2004 %Trk=7.3 13” JPC-D 15’ Jt Spacing (perp) 12’ Lanes
MN 2-1
2004 — Long Astro-Turf WF Fall ’03 & Spring/Summer
‘04
10/1/04
MO (29) US 36 (Marion)
WB Hannibal Rural 4-lane
highway between US 24 overpass and SR H (MP 6?? to ??) (Sta ?? to ??) 2004 2-way
AADT=9,020 2004 %Trk=31.7 12” JPC-D 15’ Jt Spacing 12’ Lanes
MO 1-1
1001 Trans Tine–0.5” Space, 0.125” Deep, 0.1-0.125” Wide
— WF Fall ’03 & Spring/Summer
‘04
7/1/04
Note: Sections shown in shading were not evaluated/tested under 10-67, yet are part of a formal study conducted by the respective state.

C-8
Table C-1. Summary of existing pavement test sections (continued).
State (SHRP ID #)
Highway (County)
Dir
Location
Orig.
ID
New ID
Primary Texture
Pre-Texture
Climate
Const Date (Retexture
Date)
Date Open to Traffic
NC (37) I-40 (Davie)
EB Hillsdale/Clemmons Rural 4-lane
interstate between SR 801 and Harper Rd/SR 1101 (MP 180 to 182) (Sta ?? to ??) 2004 2-way
AADT=46,000 2004 %Trk=14.0 AC Mill & Fill with
NovaChip® 9.0 surfacing 12’ Lanes
NC 1 1001 NovaChip® — WNF Fall ’03 & Spring/Summer
‘04
7/30/04
ND (38) I-94 (Morton)
EB Glen Ullin Rural 4-lane
interstate between CR 88 (Exit 108) and SR 49 (Exit 110) (MP 108.89 to 109.31) (Sta 5749+44 to 5771+62) 2005 2-way
AADT=4,900 2005 %Trk=26.5 9” JPC-D, 4”
Salvaged Base, 4” Drainable Base 15’ Jt Spacing 12’ Lanes
ND 2-1
2001 — Long Astro-Turf DF Summer/Fall ‘99
1/1/00 (estimated)
ND 2-2
2002 Tran Tine–Variable Space (0.375-1.5”, Med=1.0”), 0.06-0.125” Deep, 0.125” Wide
Long Astro-Turf DF Summer/Fall ‘99
1/1/00 (estimated)
I-94 (Barnes)
WB Valley City Rural 4-lane
interstate between Main St/BR 52/BR94 (Exit 290) and CR 22/SR 1 (Exit 288) (MP 289.41 to 289.21) (Sta 5281+82 to 5271+26) 2005 2-way
AADT=10,200 2005 %Trk=20.6 10” JPC-D, 8”
Salvaged Base, 4” Permeable Base 15’ Jt Spacing 12’ Lanes
ND 6-1
6001 Tran Skewed Tine–Variable Space (0.5-2.94”, Avg=1.625”), 0.125-0.188” Deep, 0.125” Wide (Marquette Design)
Long Astro-Turf DF 9/12/00 to 10/5/00
1/1/01 (estimated)
TX (48) I-20 (Dallas)
WB Duncanville/Dallas Suburban 6-lane
interstate, between SR 408 Spur/Patriot Parkway interchange (Exit 460) and Mountain Creek Parkway (Exit 458) (MP 460.28 to 460.08) (Sta ??? to ???) 2005 2-way
AADT=123,500 2005 %Trk=9.0 ??” CRC, ??” ????, ??”
???? 12’ Lanes
TX 1-1 1001 Shotblast (Skidabrader) — WNF 6/30//04 6/30/04
WI (55) US 151 (Iowa Co)
SB Mineral Point Rural 4-lane divided
highway between CTH O/BR 151/Ridge St (Exit 37) and Oak Park Rd (RP 49M+0.0 to 47M+0.0) 2004 2-way
AADT=7,490 2004 %Trk=8.0 9.5” JPC-D, ??”
OGBC 15’ Jt Spacing 14’ Lanes
WI 5-1 5001 Tran Tine–Variable Spacing (0.563-2.125”, Avg=1.4”), 0.125-0.1875” Deep, 0.125” Wide (Marquette Design)
Long Astro-Turf WF Spring/Summer ‘03
(NB lanes completed in
‘02)
Fall ‘03
Note: Sections shown in shading were not evaluated/tested under 10-67, yet are part of a formal study conducted by the respective state.
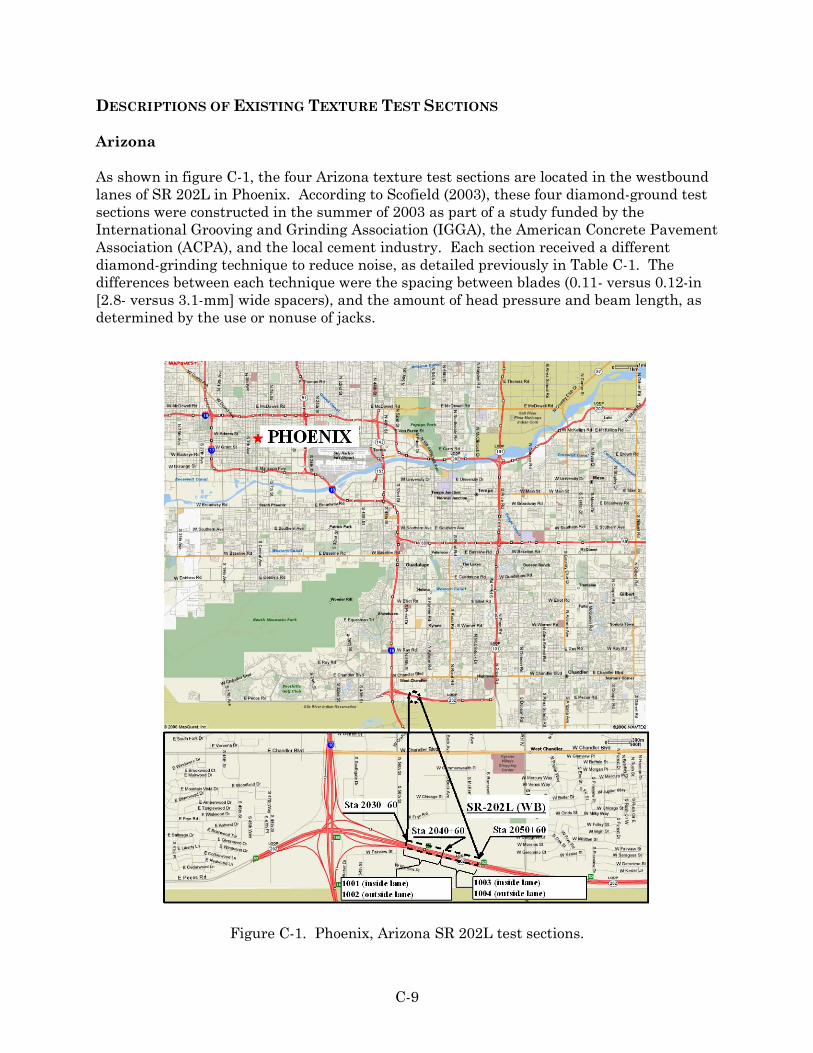
C-9
DESCRIPTIONS OF EXISTING TEXTURE TEST SECTIONS Arizona As shown in figure C-1, the four Arizona texture test sections are located in the westbound lanes of SR 202L in Phoenix. According to Scofield (2003), these four diamond-ground test sections were constructed in the summer of 2003 as part of a study funded by the International Grooving and Grinding Association (IGGA), the American Concrete Pavement Association (ACPA), and the local cement industry. Each section received a different diamond-grinding technique to reduce noise, as detailed previously in Table C-1. The differences between each technique were the spacing between blades (0.11- versus 0.12-in [2.8- versus 3.1-mm] wide spacers), and the amount of head pressure and beam length, as determined by the use or nonuse of jacks.
Figure C-1. Phoenix, Arizona SR 202L test sections.

C-10
California A total of seven texture test sections were included from the newly constructed (2002/03) SR 58 Bypass near the city of Mojave. As seen in figure C-2, the sections are located in the eastbound lanes, with five of the seven sections located west of SR 14 and the other two east of SR 14. The Division of Materials Engineering and Testing Service (METS) of Caltrans developed this test site, which was used in a pavement–tire noise study by Rochat (2003) and Donavan (2003, 2004). Textures of interest included longitudinal tining (one being a meander type), heavy turf drag, longitudinal grooving, and longitudinal diamond grinding.
Figure C-2. Mojave, California SR 58 test sections. Colorado A total of nine texture test sections were included from Colorado. As seen in figures C-3 and C-4, three of these sections are located on I-70 between Deer Trail and Agate, and the other six are located on the newly constructed US 287 Bypass near Berthoud. The three sections on I-70 were part of a multi-year study conducted by the Colorado DOT (CDOT), beginning in 1994 when the Deer Trail to Agate stretch of I-70 was reconstructed (Ardani and Outcalt, 1995, 2000, and 2005). Textures of interest at this site included standard turf drag, longitudinal tining, and longitudinal grooving. The I-70 textures were also evaluated in the Marquette Noise and Texture study (Kuemmel et al., 2000).
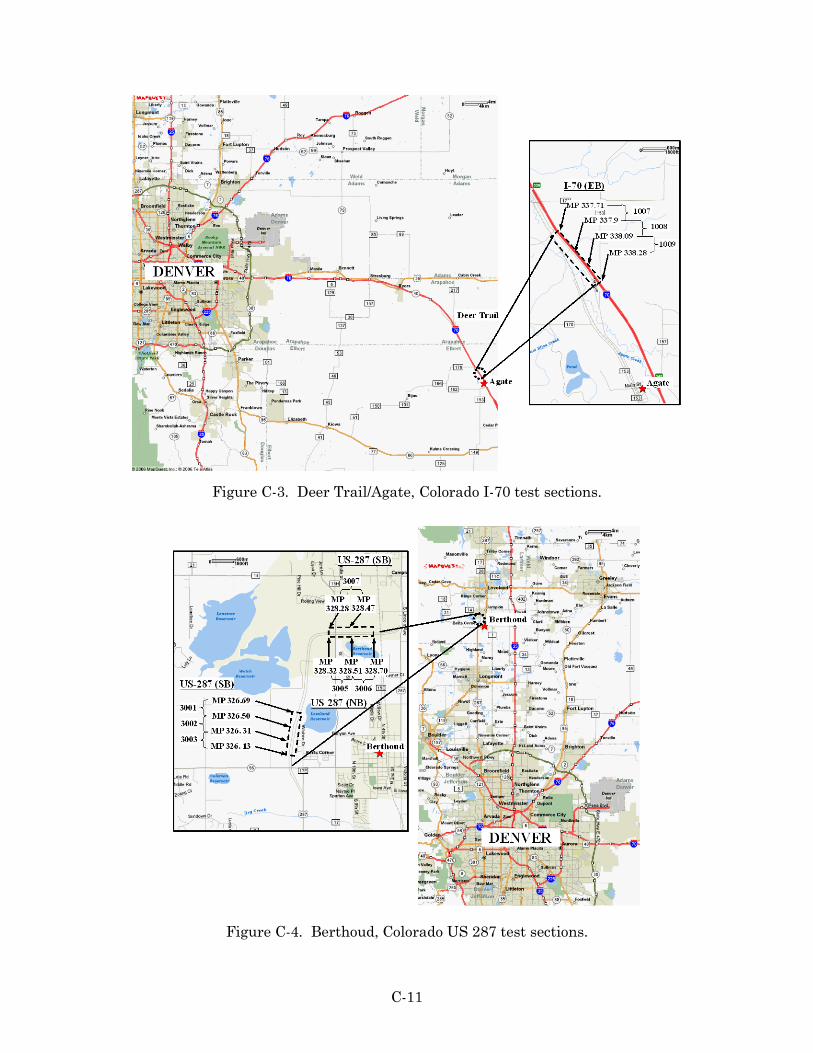
C-11
Figure C-3. Deer Trail/Agate, Colorado I-70 test sections.
Figure C-4. Berthoud, Colorado US 287 test sections.
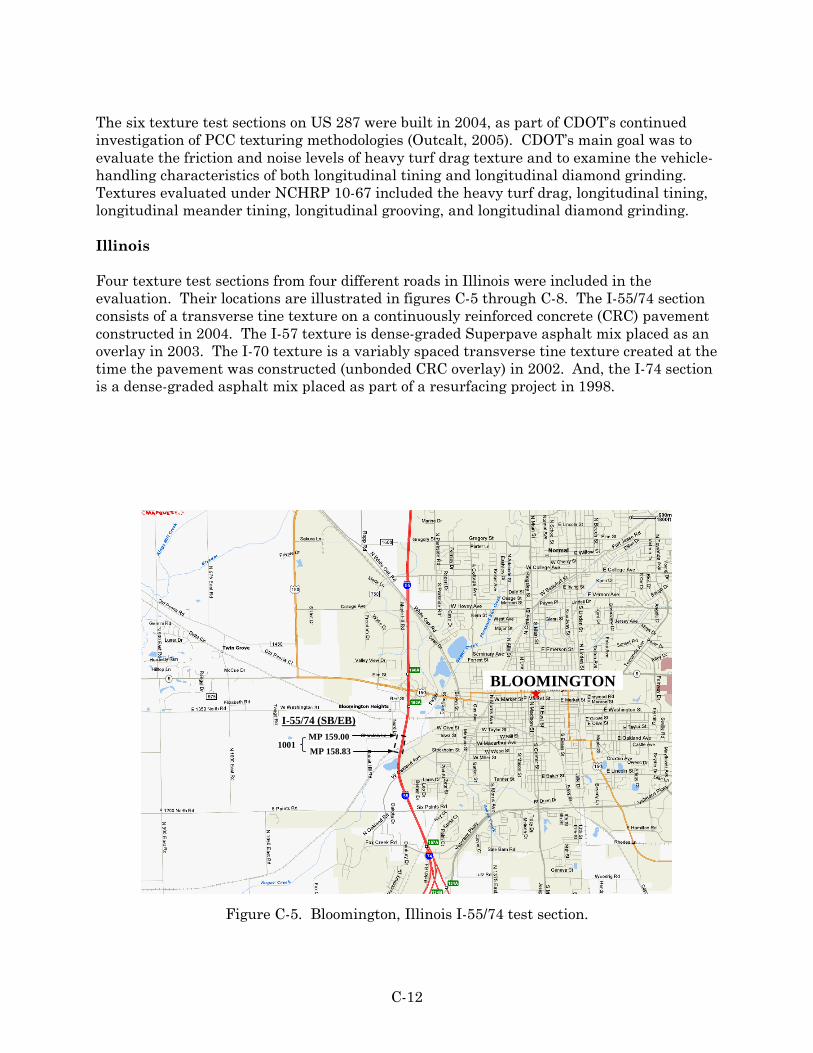
C-12
The six texture test sections on US 287 were built in 2004, as part of CDOT’s continued investigation of PCC texturing methodologies (Outcalt, 2005). CDOT’s main goal was to evaluate the friction and noise levels of heavy turf drag texture and to examine the vehicle-handling characteristics of both longitudinal tining and longitudinal diamond grinding. Textures evaluated under NCHRP 10-67 included the heavy turf drag, longitudinal tining, longitudinal meander tining, longitudinal grooving, and longitudinal diamond grinding. Illinois Four texture test sections from four different roads in Illinois were included in the evaluation. Their locations are illustrated in figures C-5 through C-8. The I-55/74 section consists of a transverse tine texture on a continuously reinforced concrete (CRC) pavement constructed in 2004. The I-57 texture is dense-graded Superpave asphalt mix placed as an overlay in 2003. The I-70 texture is a variably spaced transverse tine texture created at the time the pavement was constructed (unbonded CRC overlay) in 2002. And, the I-74 section is a dense-graded asphalt mix placed as part of a resurfacing project in 1998.
Figure C-5. Bloomington, Illinois I-55/74 test section.
MP 159.001001
MP 158.83
I-55/74 (SB/EB)
BLOOMINGTON
MP 159.001001
MP 158.83
I-55/74 (SB/EB)
BLOOMINGTON

C-13
Figure C-6. Champaign, Illinois I-57 test section.
Figure C-7. Marshall, Illinois I-70 test section.
MP 236.24001
MP 236.0
I-57 (SB)
CHAMPAIGN
MP 236.24001
MP 236.0
I-57 (SB)
CHAMPAIGN
MP 153.16
5001
MP 153.36
I-70 (WB)
Marshall
MP 153.16
5001
MP 153.36
I-70 (WB)
Marshall
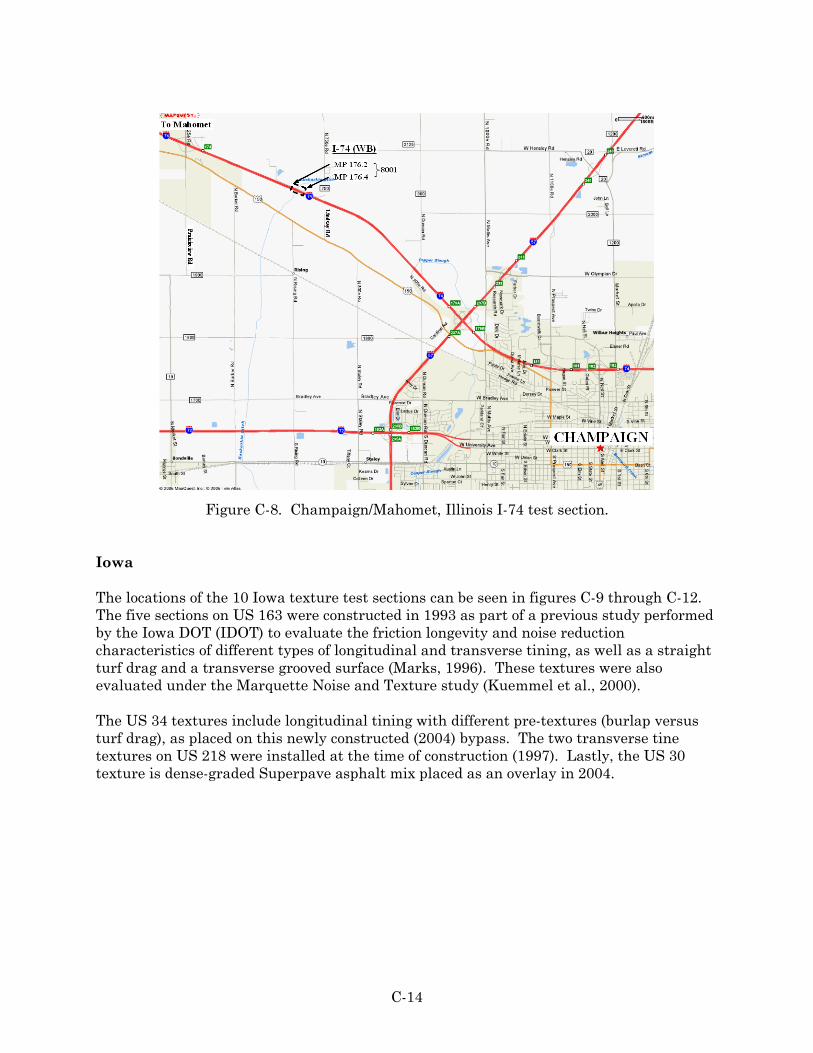
C-14
Figure C-8. Champaign/Mahomet, Illinois I-74 test section. Iowa The locations of the 10 Iowa texture test sections can be seen in figures C-9 through C-12. The five sections on US 163 were constructed in 1993 as part of a previous study performed by the Iowa DOT (IDOT) to evaluate the friction longevity and noise reduction characteristics of different types of longitudinal and transverse tining, as well as a straight turf drag and a transverse grooved surface (Marks, 1996). These textures were also evaluated under the Marquette Noise and Texture study (Kuemmel et al., 2000). The US 34 textures include longitudinal tining with different pre-textures (burlap versus turf drag), as placed on this newly constructed (2004) bypass. The two transverse tine textures on US 218 were installed at the time of construction (1997). Lastly, the US 30 texture is dense-graded Superpave asphalt mix placed as an overlay in 2004.

C-15
Figure C-9. Des Moines/Prairie City, Iowa US 163 test sections.
Figure C-10. Mt. Pleasant, Iowa US 34 test sections.

C-16
Figure C-11. Washington/Ainsworth, Iowa test sections.
Figure C-12. Ames/Nevada, Iowa US 218 test section.
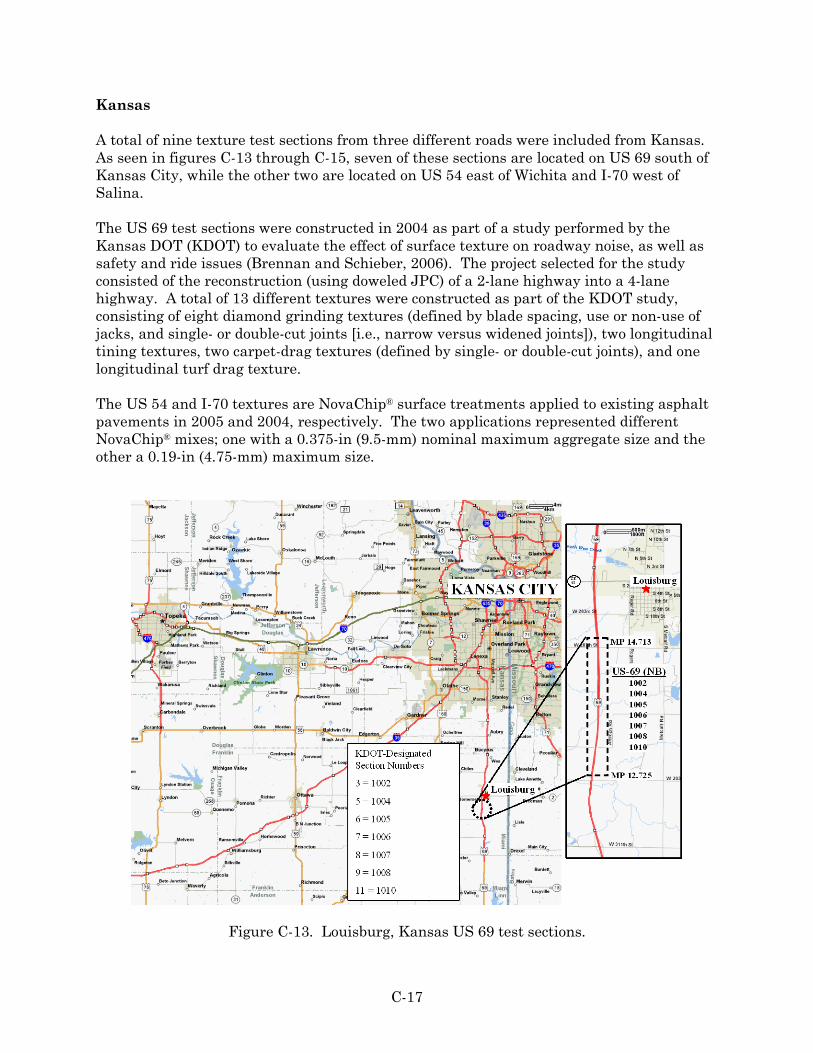
C-17
Kansas A total of nine texture test sections from three different roads were included from Kansas. As seen in figures C-13 through C-15, seven of these sections are located on US 69 south of Kansas City, while the other two are located on US 54 east of Wichita and I-70 west of Salina. The US 69 test sections were constructed in 2004 as part of a study performed by the Kansas DOT (KDOT) to evaluate the effect of surface texture on roadway noise, as well as safety and ride issues (Brennan and Schieber, 2006). The project selected for the study consisted of the reconstruction (using doweled JPC) of a 2-lane highway into a 4-lane highway. A total of 13 different textures were constructed as part of the KDOT study, consisting of eight diamond grinding textures (defined by blade spacing, use or non-use of jacks, and single- or double-cut joints [i.e., narrow versus widened joints]), two longitudinal tining textures, two carpet-drag textures (defined by single- or double-cut joints), and one longitudinal turf drag texture. The US 54 and I-70 textures are NovaChip® surface treatments applied to existing asphalt pavements in 2005 and 2004, respectively. The two applications represented different NovaChip® mixes; one with a 0.375-in (9.5-mm) nominal maximum aggregate size and the other a 0.19-in (4.75-mm) maximum size.
Figure C-13. Louisburg, Kansas US 69 test sections.

C-18
Figure C-14. Batesville, Kansas US 54 test section.
Figure C-15. Salina/Juniata, Kansas I-70 test section.
SalinaExit249
Exit244Exit
238Exit233
Juniata
4001I-70 (WB)
MP 235.06 MP 235.26
233 238
Bro
okvi
lle R
d
SalinaExit249
Exit244Exit
238Exit233
Juniata
4001I-70 (WB)
MP 235.06 MP 235.26
233 238
Bro
okvi
lle R
d

C-19
Michigan The one texture from Michigan selected for evaluation was the exposed aggregate concrete texture located on I-75 (Chrysler Freeway) in downtown Detroit (see figure C-16). This texture was constructed in 1993 as part of the European Concrete Pavement Demonstration study conducted by the Michigan DOT (MDOT) (Smiley, 1995; Smiley, 1996; Buch et al., 2000). It was also evaluated in the Marquette Noise and Texture study (Kuemmel et al., 2000). The reconstructed pavement on which this texture was installed consisted of 2-layer (2.5 in on 7.5 in [64 mm on190 mm], wet on wet) doweled JPC.
Figure C-16. Detroit, Michigan I-75 test section.
1001I-75 (NB)
DETROIT
Sta 125+25 to 171+351001
I-75 (NB)
DETROIT
Sta 125+25 to 171+35

C-20
Minnesota Six texture test sections from Minnesota were selected for evaluation, all in the Minneapolis–St. Paul metropolitan area. They included a longitudinal tine located on US 169 near Shakopee/Eden Prairie (figure C-17), a standard turf drag and a longitudinal tine located on US 169 near Brooklyn Park/Champlin (figure C-18), a standard turf drag located on I-694 near Fridley/New Brighton (figure C-19), and a broom and a standard turf drag located on I-94/694 near Brooklyn Park/Brooklyn Center (figure C-20). The textures represent both new and old construction (doweled JPC), and those on US 169 and I-94/694 were evaluated previously as part of the Marquette Noise and Texture study (Kuemmel et al., 2000).
Figure C-17. Shakopee/Eden Prairie, Minnesota US 169 test section.
1001US-169 (NB)
MP 114.05
MP 113.85
Shakopee
CR
83
MINNEAPOLISST. PAUL
Shakopee
Eden Prairie
1001US-169 (NB)
MP 114.05
MP 113.85
Shakopee
CR
83
MINNEAPOLISST. PAUL
Shakopee
Eden Prairie

C-21
Figure C-18. Brooklyn Park/Champlin, Minnesota US 169 test sections.
Figure C-19. Fridley/New Brighton, Minnesota I-694 test sections.
US-169 (NB)
8001
7001
Brooklyn Park
Champlin
MP 141.10
MINNEAPOLISST. PAUL
MP 142.20
MP 142.40
Champlin
Brooklyn Park
US-169 (NB)
8001
7001
Brooklyn Park
Champlin
MP 141.10
MINNEAPOLISST. PAUL
MP 142.20
MP 142.40
Champlin
Brooklyn Park
MINNEAPOLISST. PAUL
New Brighton
Fridley
Fridley
New Brighton
I-694 (WB)5001
MP 38.60
MP 38.40
MINNEAPOLISST. PAUL
New Brighton
Fridley
Fridley
New Brighton
I-694 (WB)5001
MP 38.60
MP 38.40

C-22
Figure C-20. Brooklyn Park/Brooklyn Center, Minnesota I-94/694 test sections. Missouri Only one texture test section from Missouri was selected for evaluation. As shown in figure C-21, this section is located on US 36, west of Hannibal. The transverse tine represented by this section was installed on doweled JPC pavement, placed in 2003/04 as part of a major reconstruction and widening (2 lanes to 4 lanes) project.
Figure C-21. Hannibal, Missouri US 36 test section.
MINNEAPOLISST. PAUL
Brooklyn Center
Brooklyn Center
MP 31.16
MP 30.962003
I-94/694 (WB)
2004MP 32.95
MP 32.75
Broadw
ay Ave
Brooklyn Blvd
Zane Ave
BrooklynPark
Brooklyn Park
MINNEAPOLISST. PAUL
Brooklyn Center
Brooklyn Center
MP 31.16
MP 30.962003
I-94/694 (WB)
2004MP 32.95
MP 32.75
Broadw
ay Ave
Brooklyn Blvd
Zane Ave
BrooklynPark
BrooklynPark
Brooklyn Park
1001US-36 (WB)
MP 6
Hannibal1001
US-36 (WB)
MP 6
Hannibal

C-23
North Carolina The location of the one North Carolina texture test section is provided in figure C-22. The Novachip® surface in this section was placed as the wearing course in a mill-and-overlay rehabilitation performed in 2003/04.
Figure 3-23. Hillsdale/Clemmons, North Carolina I-40 test section. North Dakota Three texture test sections were selected from I-94 in North Dakota. They included a standard turf drag and a variably spaced, transverse tine located east of Glen Ullin (figure C-23) and a variably spaced, skewed transverse tine located west of Valley City (figure C-24). The doweled JPC pavements on which these textures were installed were built in 1999 and 2000, respectively. The textures are part of a statewide experiment being conducted by the North Dakota DOT, examining the texture, friction, and noise characteristics of tine versus carpet-drag textures (Marquart, 2003).
WINSTON-SALEM
Clemmons
MP 180
1001I-40 (EB)
Exit180
Hillsdale
WINSTON-SALEM
Clemmons
MP 180
1001I-40 (EB)
Exit180
Hillsdale

C-24
Figure C-23. Glen Ullin, North Dakota I-94 test section.
Figure C-24. Valley City, North Dakota I-94 test section.
8849
BismarkGlen Ullin
MP 109.31MP 109.11MP 109.09
MP 108.89 2001
I-94 (EB)
2002Exit108
Exit110
8849
BismarkGlen Ullin
MP 109.31MP 109.11MP 109.09
MP 108.89 2001
I-94 (EB)
2002Exit108
Exit110
Bismark
Exit290
Valley City
Valley City
Fargo
6001I-94 (WB)
MP 289.21 MP 289.41
Bismark
Exit290
Valley City
Valley City
Fargo
6001I-94 (WB)
MP 289.21 MP 289.41

C-25
Texas A shotblasted PCC texture on I-20 near Dallas was also included in the evaluation. Figure C-25 shows the specific location of this texture test section. The texture was produced on an in-place CRC pavement in 2004 using a Skidabrader surface abrading machine.
Figure C-25. Duncanville/Dallas, Texas I-20 test section. Wisconsin Only one texture test section from Wisconsin was selected for evaluation. This section is located on US 151 near Mineral Point, as shown in figure C-26. The variably spaced, transverse tine represented by this section was installed on a doweled JPC pavement built in 2003, as part of a reconstruction and widening (2 lanes to 4 lanes) project.
Duncanville
1001I-20 (WB)
MP 460.08
DALLAS
MP 460.28
Exit460
Duncanville
1001I-20 (WB)
MP 460.08
DALLAS
MP 460.28
Exit460

C-26
Figure C-26. Mineral Point, Wisconsin US 151 test section.
Mineral Point
5001US 151 (SB)
MP 36
MADISON
Mineral Point
Mineral Point
5001US 151 (SB)
MP 36
MADISON
Mineral Point

C-27
APPENDIX C REFERENCES Ardani, A. and W. Outcalt. 1995. PCCP Texturing Methods, Interim Report, Report No. CDOT-DTD-R-95-2, Colorado Department of Transportation, Denver, Colorado. Ardani, A. and W. Outcalt. 2000. PCCP Texturing Methods, Final Report, Report No. CDOT-DTD-R-00-1, Colorado Department of Transportation, Denver, Colorado. Ardani, A. and W. Outcalt. 2005. PCCP Texturing Methods, Report No. CDOT-DTD-R-2005-21, Colorado Department of Transportation, Denver, Colorado. Brennan, J.J. and G.M. Schieber. 2006. US-69 Surface Texture and Noise Study, Report No. KS-05-3, Kansas Department of Transportation, Topeka, Kansas. Buch, N.B., R. Lyles and L. Becker. 2000. “Cost Effectiveness of European Demonstration Project: I-75 Detroit,” RC-1381, Michigan Department of Transportation, Detroit, Michigan. Donavan, P.R. 2003. “Evaluation of the Noise Produced by Various Grooved and Ground Textures Applied to Existing Portland Cement Concrete Pavement Pavement Surfaces: Measurements on the State Route 58 Mojave Bypass, June 23.” Donavan, P.R. 2004. “Influence of PCC Surface Texture and Joint Slap on Tire/Pavement Noise Generation,” Paper presented at Noise-Con 2004, Baltimore, Maryland. Kuemmel, D.A., R.C. Sonntag, J. Crovetti, and Y. Becker. 2000. “Noise and Texture on PCC Pavements: Results of a Multi-State Study,” Final Report No. WI/SPR-08-99, Wisconsin Department of Transportation, Madison, Wisconsin. Marks, V.J. 1996. “Variations of Tine Texturing of PCC Pavement,” Final Report prepared for Research Project MLR-93-4, Iowa Department of Transportation, Ames, Iowa. Marquart, M. 2003. “Tining Versus Carpet Dragging for Texturing PCC Pavements: Third Evaluation,” Experimental Study ND 99-02, North Dakota Department of Transportation, Bismark, North Dakota. Outcalt, W. 2005. Summary of information on US 287 texture test sections provided through personal correspondence, Denver, Colorado. Rochat, J.L. 2003. “Acoustical Characterization of Three PCC Surface Treatments Using Wayside Tire/Road Noise Measurements,” Memorandum to Bruce Rymer at Caltrans Environmental Program, U.S. Department of Transportation Volpe Center Acoustics Facility, Cambridge, Massachusetts. Scofield, L. 2003. “SR 202 PCCP Whisper Grinding Test Sections,” Construction Report, Arizona Department of Transportation, Phoenix, Arizona.

C-28
Smiley, D.L. 1995. “First Year Performance of the European Concrete Pavement on Northbound I-75-Detroit, Michigan,” Research Project 92 B-105, Research Report No. R-1338, Michigan Department of Transportation, Detroit, Michigan. Smiley, D.L. 1996. “Second Year Performance of the European Concrete Pavement on Northbound I-75- Detroit, Michigan,” Research Project 92 B-105, Research Report No. R-1343, Michigan Department of Transportation, Detroit, Michigan.

APPENDIX D. TEXTURE, FRICTION, AND NOISE RESULTS FOR EXISTING TEXTURE TEST SECTIONS


D-1
Figure D-1. High-speed texture depth results (MPD right wheelpath) for existing texture test sections.
Figure D-1. High-speed texture depth results (MPD right wheelpath) for existing texture test sections (continued).
0.00
0.20
0.40
0.60
0.80
1.00
1.20
1.40
1.60
1.80
2.00
AZ 1001
--Long D
G (no ja
cks),
0.23
5-in sp
acing (0
.11-in
spac
ers)
AZ 1002
--Long D
G (jack
s), 0.
235-i
n spac
ing (0.11
-in sp
acers
)
AZ 1003
--Long D
G (no ja
cks),
0.24
5-in sp
acing (0
.12-in
spac
ers)
AZ 1004
--Long D
G (jack
s), 0.
245-i
n spac
ing (0.12
-in sp
acers
)
CA 1002
--Long D
G, 0.24
5-in sp
acing (0
.12-in
spac
ers)
CA 1003
--Long G
roove
(0.75
-in sp
acing, 0
.125-i
n depth), b
urlap drag
CA 1004
--Long G
roove
(0.75
-in sp
acing, 0
.25-in
depth), b
urlap drag
CA 1045
--Long B
urlap D
rag
CA 1005
--Long D
G, 0.23
-in sp
acing (0
.105-i
n spac
ers)
CA 1007
--Long G
roove
(0.37
5-in sp
acing, 0
.25-in
depth), b
room drag
CA 1075
--Long B
room D
rag
CO 1007
--Long G
roove
(0.75
-in sp
acing, 0
.125-i
n depth), t
urf drag
CO 1008
--Long Turf
Drag
CO 1009
--Long Tine (
0.75-i
n spac
ing, 0.12
5-in dep
th), turf
drag
CO 3001
--Long H
eavy
Turf Drag
CO 3002
--Long Tine (
0.75-i
n spac
ing, 0.18
75-in
depth), n
o pretex
ture
CO 3003
--Long M
eander
Tine (0.7
5-in sp
acing, 0
.125-i
n depth), n
o ...
CO 3004
--Long G
roove
(0.75
-in sp
acing, 0
.125-i
n depth), t
urf drag
CO 3005
--Long D
G, 0.22
-in sp
acing (0
.095-i
n spac
ers)
CO 3006
--Long Tine (
0.75-i
n spac
ing, 0.12
5-in dep
th), turf
drag
IL 1001
--Tran
Tine (0.7
5-in sp
acing, 0
.15-in
depth), t
urf drag
IL 4001
--Den
se-G
raded
AC (S
uperpav
e)
IL 5001
--Tran
Skewed
Tine (ran
dom spac
ing, 0.15
-in dep
th), turf
drag
IL 8001
--Den
se-G
raded
AC
Hig
h-Sp
eed
Prof
iler M
PD, m
m (R
WP)
Bars represent Mean ± 1 Std Dev
0.00
0.20
0.40
0.60
0.80
1.00
1.20
1.40
1.60
IA 10
02--T
ran Tine (
0.5-in
spac
ing, 0.07
5-in dep
th), turf
drag
IA 10
03--L
ong Tine (0.7
5-in sp
acing, 0
.075-i
n depth), t
urf drag
IA 10
04--L
ong Tine (0.7
5-in sp
acing, 0
.15-in
depth), t
urf drag
IA 10
61--T
ran G
roove
(1-in
spac
ing, 0.12
5 to 0.
19- to
0.25
-in dep
th)
IA 10
07--L
ong Turf Drag
IA 20
01--L
ong Tine (0.7
5-in sp
acing, 0
.125-i
n depth), t
urf drag
IA 20
02--L
ong Tine (0.7
5-in sp
acing, 0
.125-i
n depth), b
urlap drag
IA 80
01--T
ran Tine (
0.75-i
n spac
ing, 0.15
-in dep
th), turf
drag
IA 80
02--T
ran Tine (
0.75-i
n spac
ing, 0.15
-in dep
th), turf
drag
IA 90
02--D
ense
-Grad
ed A
C (Superp
ave)
KS 1002
--Long D
G (no ja
cks),
0.23
5-in sp
acing (0
.11-in
spac
ers) &
s...
KS 1004
--Long D
G (no ja
cks),
0.24
5-in sp
acing (0
.12-in
spac
ers) &
...
KS 1005
--Long D
G (jack
s), 0.
255-i
n spac
ing (0.13
-in sp
acers
) & st
d...
KS 1006
--Long D
G (jack
s), 0.
255-i
n spac
ing (0.13
-in sp
acers
) & si
ng...
KS 1007
--Long D
G (no ja
cks),
0.25
5-in sp
acing (0
.13-in
spac
ers) &
s...
KS 1008
--Long D
G (no ja
cks),
0.25
5-in sp
acing (0
.13-in
spac
ers) &
...
KS 1010
--Long Tine (
0.75-i
n spac
ing, 0.15
-in dep
th), turf
drag
KS 2001
--Nova
Chip (0.18
75-in
NMAS)
KS 4001
--Nova
Chip (0.37
5-in N
MAS)
MI 100
1--Exp
osed A
ggregate
Concre
te
MN 1001
--Long Tine (
0.75-i
n spac
ing, 0.12
5-in dep
th), turf
drag
MN 2003
--Long B
room D
rag
MN 2004
--Long Turf
Drag
MN 5001
--Long Turf
Drag
MN 7001
--Long Turf
Drag
MN 8001
--Long Tine (
0.75-i
n spac
ing, 0.12
5-in dep
th), turf
drag
MO 1001
--Tran
Tine (0.5
-in sp
acing, 0
.125-i
n depth), n
o pretex
ture
NC 1001
--Nova
Chip (0.37
5-in N
MAS)
ND 2001
--Long Turf
Drag
ND 2002
--Tran
Tine (ran
dom spac
ing, 0.1-
in depth), t
urf drag
ND 6001
--Tran
s Ske
w Tine (ran
dom spac
ing, 0.15
-in dep
th), turf
drag
TX 1001
--Shotblas
ted C
oncrete
WI 100
1--Tran
Tine (ran
dom spac
ing, 0.15
-in dep
th), turf
drag
Hig
h-Sp
eed
Prof
iler M
PD, m
m (R
WP)
Bars represent Mean ± 1 Std Dev
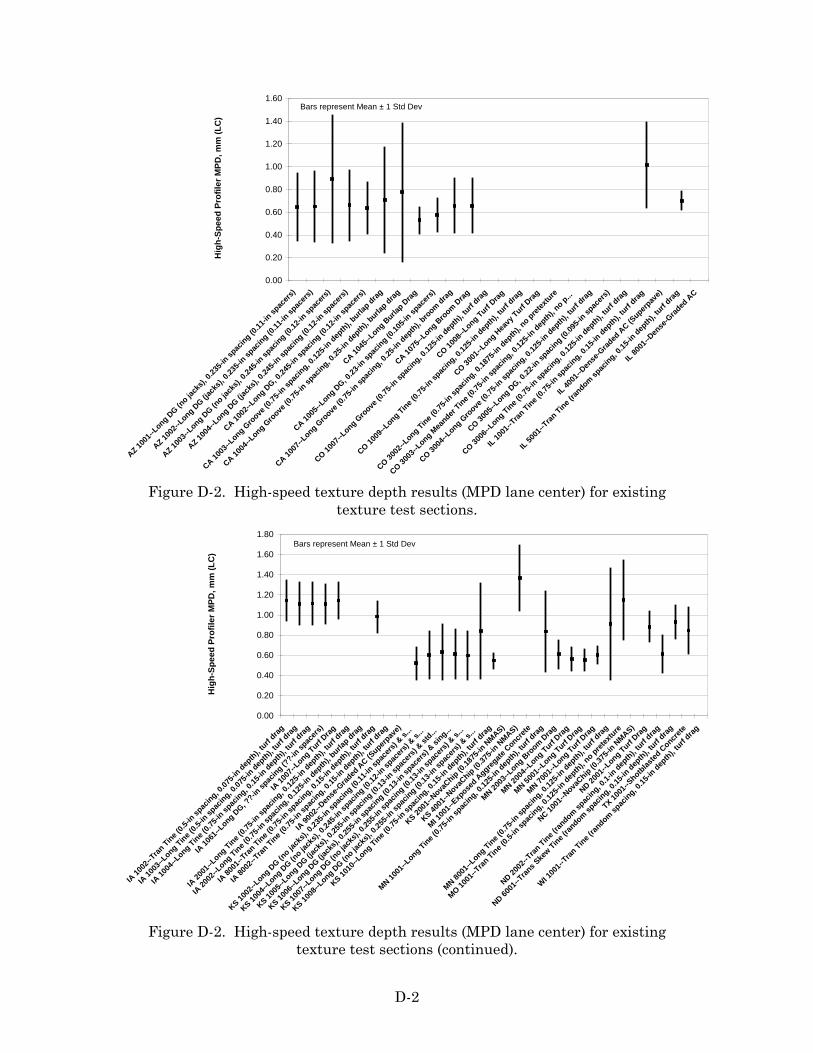
D-2
Figure D-2. High-speed texture depth results (MPD lane center) for existing texture test sections.
Figure D-2. High-speed texture depth results (MPD lane center) for existing texture test sections (continued).
0.00
0.20
0.40
0.60
0.80
1.00
1.20
1.40
1.60
AZ 1001
--Long D
G (no ja
cks),
0.23
5-in sp
acing (0
.11-in
spac
ers)
AZ 1002
--Long D
G (jack
s), 0.
235-i
n spac
ing (0.11
-in sp
acers
)
AZ 1003
--Long D
G (no ja
cks),
0.24
5-in sp
acing (0
.12-in
spac
ers)
AZ 1004
--Long D
G (jack
s), 0.
245-i
n spac
ing (0.12
-in sp
acers
)
CA 1002
--Long D
G, 0.24
5-in sp
acing (0
.12-in
spac
ers)
CA 1003
--Long G
roove
(0.75
-in sp
acing, 0
.125-i
n depth), b
urlap drag
CA 1004
--Long G
roove
(0.75
-in sp
acing, 0
.25-in
depth), b
urlap drag
CA 1045
--Long B
urlap D
rag
CA 1005
--Long D
G, 0.23
-in sp
acing (0
.105-i
n spac
ers)
CA 1007
--Long G
roove
(0.75
-in sp
acing, 0
.25-in
depth), b
room drag
CA 1075
--Long B
room D
rag
CO 1007
--Long G
roove
(0.75
-in sp
acing, 0
.125-i
n depth), t
urf drag
CO 1008
--Long Turf
Drag
CO 1009
--Long Tine (
0.75-i
n spac
ing, 0.12
5-in dep
th), turf
drag
CO 3001
--Long H
eavy
Turf Drag
CO 3002
--Long Tine (
0.75-i
n spac
ing, 0.18
75-in
depth), n
o pretex
ture
CO 3003
--Long M
eander
Tine (0.7
5-in sp
acing, 0
.125-i
n depth), n
o p...
CO 3004
--Long G
roove
(0.75
-in sp
acing, 0
.125-i
n depth), t
urf drag
CO 3005
--Long D
G, 0.22
-in sp
acing (0
.095-i
n spac
ers)
CO 3006
--Long Tine (
0.75-i
n spac
ing, 0.12
5-in dep
th), turf
drag
IL 1001
--Tran
Tine (0.7
5-in sp
acing, 0
.15-in
depth), t
urf drag
IL 4001
--Den
se-G
raded
AC (S
uperpav
e)
IL 5001
--Tran
Tine (ran
dom spac
ing, 0.15
-in dep
th), turf
drag
IL 8001
--Den
se-G
raded
AC
Hig
h-Sp
eed
Prof
iler M
PD, m
m (L
C)
Bars represent Mean ± 1 Std Dev
0.00
0.20
0.40
0.60
0.80
1.00
1.20
1.40
1.60
1.80
IA 10
02--T
ran Tine (
0.5-in
spac
ing, 0.07
5-in dep
th), turf
drag
IA 10
03--L
ong Tine (0.5
-in sp
acing, 0
.075-i
n depth), t
urf drag
IA 10
04--L
ong Tine (0.7
5-in sp
acing, 0
.15-in
depth), t
urf drag
IA 10
61--L
ong DG, ?
?-in sp
acing (?
?-in sp
acers
)
IA 10
07--L
ong Turf Drag
IA 20
01--L
ong Tine (0.7
5-in sp
acing, 0
.125-i
n depth), t
urf drag
IA 20
02--L
ong Tine (0.7
5-in sp
acing, 0
.125-i
n depth), b
urlap drag
IA 80
01--T
ran Tine (
0.75-i
n spac
ing, 0.15
-in dep
th), turf
drag
IA 80
02--T
ran Tine (
0.75-i
n spac
ing, 0.15
-in dep
th), turf
drag
IA 90
02--D
ense
-Grad
ed A
C (Superp
ave)
KS 1002
--Long D
G (no ja
cks),
0.23
5-in sp
acing (0
.11-in
spac
ers) &
s...
KS 1004
--Long D
G (no ja
cks),
0.24
5-in sp
acing (0
.12-in
spac
ers) &
s...
KS 1005
--Long D
G (jack
s), 0.
255-i
n spac
ing (0.13
-in sp
acers
) & st
d...
KS 1006
--Long D
G (jack
s), 0.
255-i
n spac
ing (0.13
-in sp
acers
) & si
ng...
KS 1007
--Long D
G (no ja
cks),
0.25
5-in sp
acing (0
.13-in
spac
ers) &
s...
KS 1008
--Long D
G (no ja
cks),
0.25
5-in sp
acing (0
.13-in
spac
ers) &
s...
KS 1010
--Long Tine (
0.75-i
n spac
ing, 0.15
-in dep
th), turf
drag
KS 2001
--Nova
Chip (0.18
75-in
NMAS)
KS 4001
--Nova
Chip (0.37
5-in N
MAS)
MI 100
1--Exp
osed A
ggregate
Concre
te
MN 1001
--Long Tine (
0.75-i
n spac
ing, 0.12
5-in dep
th), turf
drag
MN 2003
--Long B
room D
rag
MN 2004
--Long Turf
Drag
MN 5001
--Long Turf
Drag
MN 7001
--Long Turf
Drag
MN 8001
--Long Tine (
0.75-i
n spac
ing, 0.12
5-in dep
th), turf
drag
MO 1001
--Tran
Tine (0.5
-in sp
acing, 0
.125-i
n depth), n
o pretex
ture
NC 1001
--Nova
Chip (0.37
5-in N
MAS)
ND 2001
--Long Turf
Drag
ND 2002
--Tran
Tine (ran
dom spac
ing, 0.1-
in depth), t
urf drag
ND 6001
--Tran
s Ske
w Tine (ran
dom spac
ing, 0.15
-in dep
th), turf
drag
TX 1001
--Shotblas
ted C
oncrete
WI 100
1--Tran
Tine (ran
dom spac
ing, 0.15
-in dep
th), turf
drag
Hig
h-Sp
eed
Prof
iler M
PD, m
m (L
C)
Bars represent Mean ± 1 Std Dev

D-3
Figure D-3. CT Meter texture depth results (MPD right wheelpath) for existing texture test sections.
Figure D-3. CT Meter texture depth results (MPD right wheelpath) for existing texture test sections (continued).
0.00
0.20
0.40
0.60
0.80
1.00
1.20
1.40
1.60
1.80
2.00
AZ 1001
--Long D
G (no ja
cks),
0.23
5-in sp
acing (0
.11-in
spac
ers)
AZ 1002
--Long D
G (jack
s), 0.
235-i
n spac
ing (0.11
-in sp
acers
)
AZ 1003
--Long D
G (no ja
cks),
0.24
5-in sp
acing (0
.12-in
spac
ers)
AZ 1004
--Long D
G (jack
s), 0.
245-i
n spac
ing (0.12
-in sp
acers
)
CA 1002
--Long D
G, 0.24
5-in sp
acing (0
.12-in
spac
ers)
CA 1003
--Long G
roove
(0.75
-in sp
acing, 0
.125-i
n depth), b
urlap drag
CA 1004
--Long G
roove
(0.75
-in sp
acing, 0
.25-in
depth), b
urlap drag
CA 1045
--Long B
urlap D
rag
CA 1005
--Long D
G, 0.23
-in sp
acing (0
.105-i
n spac
ers)
CA 1007
--Long G
roove
(0.75
-in sp
acing, 0
.25-in
depth), b
room drag
CA 1075
--Long B
room D
rag
CO 1007
--Long G
roove
(0.75
-in sp
acing, 0
.125-i
n depth), t
urf drag
CO 1008
--Long Turf
Drag
CO 1009
--Long Tine (
0.75-i
n spac
ing, 0.12
5-in dep
th), turf
drag
CO 3001
--Long H
eavy
Turf Drag
CO 3002
--Long Tine (
0.75-i
n spac
ing, 0.18
75-in
depth), n
o pretex
ture
CO 3003
--Long M
eander
Tine (0.7
5-in sp
acing, 0
.125-i
n depth), n
o ...
CO 3004
--Long G
roove
(0.75
-in sp
acing, 0
.125-i
n depth), t
urf drag
CO 3005
--Long D
G, 0.22
-in sp
acing (0
.095-i
n spac
ers)
CO 3006
--Long Tine (
0.75-i
n spac
ing, 0.12
5-in dep
th), turf
drag
IL 1001
--Tran
Tine (0.7
5-in sp
acing, 0
.15-in
depth), t
urf drag
IL 4001
--Den
se-G
raded
AC (S
uperpav
e)
IL 5001
--Tran
Tine (ran
dom spac
ing, 0.15
-in dep
th), turf
drag
IL 8001
--Den
se-G
raded
AC
CT
Met
er M
PD, m
m (R
WP)
Bars represent Mean ± 1 Std Dev
0.00
0.20
0.40
0.60
0.80
1.00
1.20
IA 10
02--T
ran Tine (
0.5-in
spac
ing, 0.07
5-in dep
th), turf
drag
IA 10
03--L
ong Tine (0.7
5-in sp
acing, 0
.075-i
n depth), t
urf drag
IA 10
04--L
ong Tine (0.7
5-in sp
acing, 0
.15-in
depth), t
urf drag
IA 10
61--T
ran G
roove
(1-in
spac
ing, 0.12
5 to 0.
19- to
0.25
-in dep
th)
IA 10
07--L
ong Turf Drag
IA 20
01--L
ong Tine (0.7
5-in sp
acing, 0
.125-i
n depth), t
urf drag
IA 20
02--L
ong Tine (0.7
5-in sp
acing, 0
.125-i
n depth), b
urlap drag
IA 80
01--T
ran Tine (
0.75-i
n spac
ing, 0.15
-in dep
th), turf
drag
IA 80
02--T
ran Tine (
0.75-i
n spac
ing, 0.15
-in dep
th), turf
drag
IA 90
02--D
ense
-Grad
ed A
C (Superp
ave)
KS 1002
--Long D
G (no ja
cks),
0.23
5-in sp
acing (0
.11-in
spac
ers) &
s...
KS 1004
--Long D
G (no ja
cks),
0.24
5-in sp
acing (0
.12-in
spac
ers) &
...
KS 1005
--Long D
G (jack
s), 0.
255-i
n spac
ing (0.13
-in sp
acers
) & st
d...
KS 1006
--Long D
G (jack
s), 0.
255-i
n spac
ing (0.13
-in sp
acers
) & si
ng...
KS 1007
--Long D
G (no ja
cks),
0.25
5-in sp
acing (0
.13-in
spac
ers) &
s...
KS 1008
--Long D
G (no ja
cks),
0.25
5-in sp
acing (0
.13-in
spac
ers) &
...
KS 1010
--Long Tine (
0.75-i
n spac
ing, 0.15
-in dep
th), turf
drag
KS 2001
--Nova
Chip (0.18
75-in
NMAS)
KS 4001
--Nova
Chip (0.37
5-in N
MAS)
MI 100
1--Exp
osed A
ggregate
Concre
te
MN 1001
--Long Tine (
0.75-i
n spac
ing, 0.12
5-in dep
th), turf
drag
MN 2003
--Long B
room D
rag
MN 2004
--Long Turf
Drag
MN 5001
--Long Turf
Drag
MN 7001
--Long Turf
Drag
MN 8001
--Long Tine (
0.75-i
n spac
ing, 0.12
5-in dep
th), turf
drag
MO 1001
--Tran
Tine (0.5
-in sp
acing, 0
.125-i
n depth), n
o pretex
ture
NC 1001
--Nova
Chip (0.37
5-in N
MAS)
ND 2001
--Long Turf
Drag
ND 2002
--Tran
Tine (ran
dom spac
ing, 0.1-
in depth), t
urf drag
ND 6001
--Tran
s Ske
w Tine (ran
dom spac
ing, 0.15
-in dep
th), turf
drag
TX 1001
--Shotblas
ted C
oncrete
WI 100
1--Tran
Tine (ran
dom spac
ing, 0.15
-in dep
th), turf
drag
CT
Met
er M
PD, m
m (R
WP)
Bars represent Mean ± 1 Std Dev
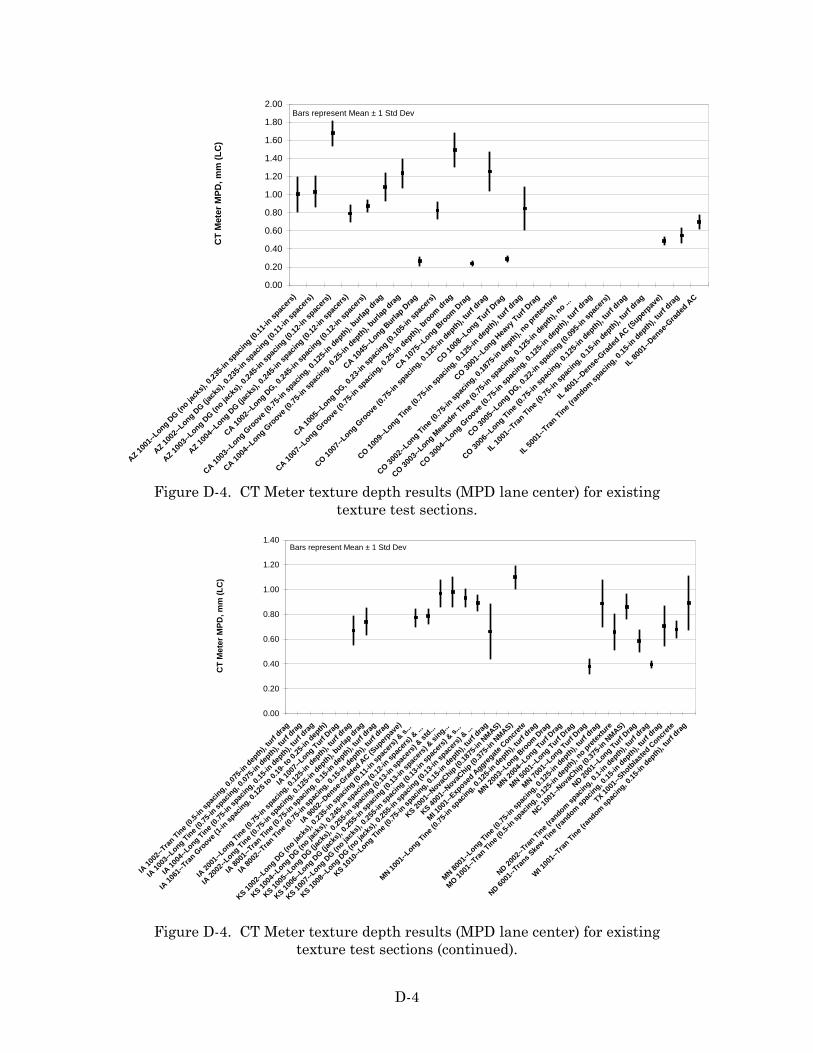
D-4
Figure D-4. CT Meter texture depth results (MPD lane center) for existing texture test sections.
Figure D-4. CT Meter texture depth results (MPD lane center) for existing texture test sections (continued).
0.00
0.20
0.40
0.60
0.80
1.00
1.20
1.40
1.60
1.80
2.00
AZ 1001
--Long D
G (no ja
cks),
0.23
5-in sp
acing (0
.11-in
spac
ers)
AZ 1002
--Long D
G (jack
s), 0.
235-i
n spac
ing (0.11
-in sp
acers
)
AZ 1003
--Long D
G (no ja
cks),
0.24
5-in sp
acing (0
.12-in
spac
ers)
AZ 1004
--Long D
G (jack
s), 0.
245-i
n spac
ing (0.12
-in sp
acers
)
CA 1002
--Long D
G, 0.24
5-in sp
acing (0
.12-in
spac
ers)
CA 1003
--Long G
roove
(0.75
-in sp
acing, 0
.125-i
n depth), b
urlap drag
CA 1004
--Long G
roove
(0.75
-in sp
acing, 0
.25-in
depth), b
urlap drag
CA 1045
--Long B
urlap D
rag
CA 1005
--Long D
G, 0.23
-in sp
acing (0
.105-i
n spac
ers)
CA 1007
--Long G
roove
(0.75
-in sp
acing, 0
.25-in
depth), b
room drag
CA 1075
--Long B
room D
rag
CO 1007
--Long G
roove
(0.75
-in sp
acing, 0
.125-i
n depth), t
urf drag
CO 1008
--Long Turf
Drag
CO 1009
--Long Tine (
0.75-i
n spac
ing, 0.12
5-in dep
th), turf
drag
CO 3001
--Long H
eavy
Turf Drag
CO 3002
--Long Tine (
0.75-i
n spac
ing, 0.18
75-in
depth), n
o pretex
ture
CO 3003
--Long M
eander
Tine (0.7
5-in sp
acing, 0
.125-i
n depth), n
o ...
CO 3004
--Long G
roove
(0.75
-in sp
acing, 0
.125-i
n depth), t
urf drag
CO 3005
--Long D
G, 0.22
-in sp
acing (0
.095-i
n spac
ers)
CO 3006
--Long Tine (
0.75-i
n spac
ing, 0.12
5-in dep
th), turf
drag
IL 1001
--Tran
Tine (0.7
5-in sp
acing, 0
.15-in
depth), t
urf drag
IL 4001
--Den
se-G
raded
AC (S
uperpav
e)
IL 5001
--Tran
Tine (ran
dom spac
ing, 0.15
-in dep
th), turf
drag
IL 8001
--Den
se-G
raded
AC
CT
Met
er M
PD, m
m (L
C)
Bars represent Mean ± 1 Std Dev
0.00
0.20
0.40
0.60
0.80
1.00
1.20
1.40
IA 10
02--T
ran Tine (
0.5-in
spac
ing, 0.07
5-in dep
th), turf
drag
IA 10
03--L
ong Tine (0.7
5-in sp
acing, 0
.075-i
n depth), t
urf drag
IA 10
04--L
ong Tine (0.7
5-in sp
acing, 0
.15-in
depth), t
urf drag
IA 10
61--T
ran G
roove
(1-in
spac
ing, 0.12
5 to 0.
19- to
0.25
-in dep
th)
IA 10
07--L
ong Turf Drag
IA 20
01--L
ong Tine (0.7
5-in sp
acing, 0
.125-i
n depth), t
urf drag
IA 20
02--L
ong Tine (0.7
5-in sp
acing, 0
.125-i
n depth), b
urlap drag
IA 80
01--T
ran Tine (
0.75-i
n spac
ing, 0.15
-in dep
th), turf
drag
IA 80
02--T
ran Tine (
0.75-i
n spac
ing, 0.15
-in dep
th), turf
drag
IA 90
02--D
ense
-Grad
ed A
C (Superp
ave)
KS 1002
--Long D
G (no ja
cks),
0.23
5-in sp
acing (0
.11-in
spac
ers) &
s...
KS 1004
--Long D
G (no ja
cks),
0.24
5-in sp
acing (0
.12-in
spac
ers) &
...
KS 1005
--Long D
G (jack
s), 0.
255-i
n spac
ing (0.13
-in sp
acers
) & st
d...
KS 1006
--Long D
G (jack
s), 0.
255-i
n spac
ing (0.13
-in sp
acers
) & si
ng...
KS 1007
--Long D
G (no ja
cks),
0.25
5-in sp
acing (0
.13-in
spac
ers) &
s...
KS 1008
--Long D
G (no ja
cks),
0.25
5-in sp
acing (0
.13-in
spac
ers) &
...
KS 1010
--Long Tine (
0.75-i
n spac
ing, 0.15
-in dep
th), turf
drag
KS 2001
--Nova
Chip (0.18
75-in
NMAS)
KS 4001
--Nova
Chip (0.37
5-in N
MAS)
MI 100
1--Exp
osed A
ggregate
Concre
te
MN 1001
--Long Tine (
0.75-i
n spac
ing, 0.12
5-in dep
th), turf
drag
MN 2003
--Long B
room D
rag
MN 2004
--Long Turf
Drag
MN 5001
--Long Turf
Drag
MN 7001
--Long Turf
Drag
MN 8001
--Long Tine (
0.75-i
n spac
ing, 0.12
5-in dep
th), turf
drag
MO 1001
--Tran
Tine (0.5
-in sp
acing, 0
.125-i
n depth), n
o pretex
ture
NC 1001
--Nova
Chip (0.37
5-in N
MAS)
ND 2001
--Long Turf
Drag
ND 2002
--Tran
Tine (ran
dom spac
ing, 0.1-
in depth), t
urf drag
ND 6001
--Tran
s Ske
w Tine (ran
dom spac
ing, 0.15
-in dep
th), turf
drag
TX 1001
--Shotblas
ted C
oncrete
WI 100
1--Tran
Tine (ran
dom spac
ing, 0.15
-in dep
th), turf
drag
CT
Met
er M
PD, m
m (L
C)
Bars represent Mean ± 1 Std Dev

D-5
Figure D-5. CT Meter RMS results (right wheelpath and lane center) for existing texture test sections.
Figure D-5. CT Meter RMS results (right wheelpath and lane center) for existing texture test sections (continued).
0.00
0.50
1.00
1.50
2.00
2.50
AZ 1001
--Long D
G (no ja
cks),
0.23
5-in sp
acing (0
.11-in
spac
ers)
AZ 1002
--Long D
G (jack
s), 0.
235-i
n spac
ing (0.11
-in sp
acers
)
AZ 1003
--Long D
G (no ja
cks),
0.24
5-in sp
acing (0
.12-in
spac
ers)
AZ 1004
--Long D
G (jack
s), 0.
245-i
n spac
ing (0.12
-in sp
acers
)
CA 1002
--Long D
G, 0.24
5-in sp
acing (0
.12-in
spac
ers)
CA 1003
--Long G
roove
(0.75
-in sp
acing, 0
.125-i
n depth), b
urlap drag
CA 1004
--Long G
roove
(0.75
-in sp
acing, 0
.25-in
depth), b
urlap drag
CA 1045
--Long B
urlap D
rag
CA 1005
--Long D
G, 0.23
-in sp
acing (0
.105-i
n spac
ers)
CA 1007
--Long G
roove
(0.75
-in sp
acing, 0
.25-in
depth), b
room drag
CA 1075
--Long B
room D
rag
CO 1007
--Long G
roove
(0.75
-in sp
acing, 0
.125-i
n depth), t
urf drag
CO 1008
--Long Turf
Drag
CO 1009
--Long Tine (
0.75-i
n spac
ing, 0.12
5-in dep
th), turf
drag
CO 3001
--Long H
eavy
Turf Drag
CO 3002
--Long Tine (
0.75-i
n spac
ing, 0.18
75-in
depth), n
o pretex
ture
CO 3003
--Long M
eander
Tine (0.7
5-in sp
acing, 0
.125-i
n depth), n
o p...
CO 3004
--Long G
roove
(0.75
-in sp
acing, 0
.125-i
n depth), t
urf drag
CO 3005
--Long D
G, 0.22
-in sp
acing (0
.095-i
n spac
ers)
CO 3006
--Long Tine (
0.75-i
n spac
ing, 0.12
5-in dep
th), turf
drag
IL 1001
--Tran
Tine (0.7
5-in sp
acing, 0
.15-in
depth), t
urf drag
IL 4001
--Den
se-G
raded
AC (S
uperpav
e)
IL 5001
--Tran
Tine (ran
dom spac
ing, 0.15
-in dep
th), turf
drag
IL 8001
--Den
se-G
raded
AC
CT
Met
er R
MS
0.00
0.10
0.20
0.30
0.40
0.50
0.60
0.70
0.80
0.90
IA 10
02--T
ran Tine (
0.5-in
spac
ing, 0.07
5-in dep
th), turf
drag
IA 10
03--L
ong Tine (0.7
5-in sp
acing, 0
.075-i
n depth), t
urf drag
IA 10
04--L
ong Tine (0.7
5-in sp
acing, 0
.15-in
depth), t
urf drag
IA 10
61--T
ran G
roove
(1-in
spac
ing, 0.12
5 to 0.
19- to
0.25
-in dep
th)
IA 10
07--L
ong Turf Drag
IA 20
01--L
ong Tine (0.7
5-in sp
acing, 0
.125-i
n depth), t
urf drag
IA 20
02--L
ong Tine (0.7
5-in sp
acing, 0
.125-i
n depth), b
urlap drag
IA 80
01--T
ran Tine (
0.75-i
n spac
ing, 0.15
-in dep
th), turf
drag
IA 80
02--T
ran Tine (
0.75-i
n spac
ing, 0.15
-in dep
th), turf
drag
IA 90
02--D
ense
-Grad
ed A
C (Superp
ave)
KS 1002
--Long D
G (no ja
cks),
0.23
5-in sp
acing (0
.11-in
spac
ers) &
s...
KS 1004
--Long D
G (no ja
cks),
0.24
5-in sp
acing (0
.12-in
spac
ers) &
...
KS 1005
--Long D
G (jack
s), 0.
255-i
n spac
ing (0.13
-in sp
acers
) & st
d...
KS 1006
--Long D
G (jack
s), 0.
255-i
n spac
ing (0.13
-in sp
acers
) & si
ng...
KS 1007
--Long D
G (no ja
cks),
0.25
5-in sp
acing (0
.13-in
spac
ers) &
s...
KS 1008
--Long D
G (no ja
cks),
0.25
5-in sp
acing (0
.13-in
spac
ers) &
...
KS 1010
--Long Tine (
0.75-i
n spac
ing, 0.15
-in dep
th), turf
drag
KS 2001
--Nova
Chip (0.18
75-in
NMAS)
KS 4001
--Nova
Chip (0.37
5-in N
MAS)
MI 100
1--Exp
osed A
ggregate
Concre
te
MN 1001
--Long Tine (
0.75-i
n spac
ing, 0.12
5-in dep
th), turf
drag
MN 2003
--Long B
room D
rag
MN 2004
--Long Turf
Drag
MN 5001
--Long Turf
Drag
MN 7001
--Long Turf
Drag
MN 8001
--Long Tine (
0.75-i
n spac
ing, 0.12
5-in dep
th), turf
drag
MO 1001
--Tran
Tine (0.5
-in sp
acing, 0
.125-i
n depth), n
o pretex
ture
NC 1001
--Nova
Chip (0.37
5-in N
MAS)
ND 2001
--Long Turf
Drag
ND 2002
--Tran
Tine (ran
dom spac
ing, 0.1-
in depth), t
urf drag
ND 6001
--Tran
s Ske
w Tine (ran
dom spac
ing, 0.15
-in dep
th), turf
drag
TX 1001
--Shotblas
ted C
oncrete
WI 100
1--Tran
Tine (ran
dom spac
ing, 0.15
-in dep
th), turf
drag
CT
Met
er R
MS

D-6
Figure D-6. CT Meter TR results (right wheelpath and lane center) for existing texture test sections.
Figure D-6. CT Meter TR results (right wheelpath and lane center) for existing texture test sections (continued).
0.00
0.50
1.00
1.50
2.00
2.50
AZ 1001
--Long D
G (no ja
cks),
0.23
5-in sp
acing (0
.11-in
spac
ers)
AZ 1002
--Long D
G (jack
s), 0.
235-i
n spac
ing (0.11
-in sp
acers
)
AZ 1003
--Long D
G (no ja
cks),
0.24
5-in sp
acing (0
.12-in
spac
ers)
AZ 1004
--Long D
G (jack
s), 0.
245-i
n spac
ing (0.12
-in sp
acers
)
CA 1002
--Long D
G, 0.24
5-in sp
acing (0
.12-in
spac
ers)
CA 1003
--Long G
roove
(0.75
-in sp
acing, 0
.125-i
n depth), b
urlap drag
CA 1004
--Long G
roove
(0.75
-in sp
acing, 0
.25-in
depth), b
urlap drag
CA 1045
--Long B
urlap D
rag
CA 1005
--Long D
G, 0.23
-in sp
acing (0
.105-i
n spac
ers)
CA 1007
--Long G
roove
(0.37
5-in sp
acing, 0
.25-in
depth), b
room drag
CA 1075
--Long B
room D
rag
CO 1007
--Long G
roove
(0.75
-in sp
acing, 0
.125-i
n depth), t
urf drag
CO 1008
--Long Turf
Drag
CO 1009
--Long Tine (
0.75-i
n spac
ing, 0.12
5-in dep
th), turf
drag
CO 3001
--Long H
eavy
Turf Drag
CO 3002
--Long Tine (
0.75-i
n spac
ing, 0.18
75-in
depth), n
o pretex
ture
CO 3003
--Long M
eander
Tine (0.7
5-in sp
acing, 0
.125-i
n depth), n
o p...
CO 3004
--Long G
roove
(0.75
-in sp
acing, 0
.125-i
n depth), t
urf drag
CO 3005
--Long D
G, 0.22
-in sp
acing (0
.095-i
n spac
ers)
CO 3006
--Long Tine (
0.75-i
n spac
ing, 0.12
5-in dep
th), turf
drag
IL 1001
--Tran
Tine (0.7
5-in sp
acing, 0
.15-in
depth), t
urf drag
IL 4001
--Den
se-G
raded
AC (S
uperpav
e)
IL 5001
--Tran
Skewed
Tine (ran
dom spac
ing, 0.15
-in dep
th), turf
drag
IL 8001
--Den
se-G
raded
AC
CT
Met
er T
extu
re R
atio
(MPD
/RM
S)
0.00
0.50
1.00
1.50
2.00
2.50
IA 10
02--T
ran Tine (
0.5-in
spac
ing, 0.07
5-in dep
th), turf
drag
IA 10
03--L
ong Tine (0.7
5-in sp
acing, 0
.075-i
n depth), t
urf drag
IA 10
04--L
ong Tine (0.7
5-in sp
acing, 0
.15-in
depth), t
urf drag
IA 10
61--T
ran G
roove
(1-in
spac
ing, 0.12
5 to 0.
19- to
0.25
-in dep
th)
IA 10
07--L
ong Turf Drag
IA 20
01--L
ong Tine (0.7
5-in sp
acing, 0
.125-i
n depth), t
urf drag
IA 20
02--L
ong Tine (0.7
5-in sp
acing, 0
.125-i
n depth), b
urlap drag
IA 80
01--T
ran Tine (
0.75-i
n spac
ing, 0.15
-in dep
th), turf
drag
IA 80
02--T
ran Tine (
0.75-i
n spac
ing, 0.15
-in dep
th), turf
drag
IA 90
02--D
ense
-Grad
ed A
C (Superp
ave)
KS 1002
--Long D
G (no ja
cks),
0.23
5-in sp
acing (0
.11-in
spac
ers) &
s...
KS 1004
--Long D
G (no ja
cks),
0.24
5-in sp
acing (0
.12-in
spac
ers) &
...
KS 1005
--Long D
G (jack
s), 0.
255-i
n spac
ing (0.13
-in sp
acers
) & st
d...
KS 1006
--Long D
G (jack
s), 0.
255-i
n spac
ing (0.13
-in sp
acers
) & si
ng...
KS 1007
--Long D
G (no ja
cks),
0.25
5-in sp
acing (0
.13-in
spac
ers) &
s...
KS 1008
--Long D
G (no ja
cks),
0.25
5-in sp
acing (0
.13-in
spac
ers) &
...
KS 1010
--Long Tine (
0.75-i
n spac
ing, 0.15
-in dep
th), turf
drag
KS 2001
--Nova
Chip (0.18
75-in
NMAS)
KS 4001
--Nova
Chip (0.37
5-in N
MAS)
MI 100
1--Exp
osed A
ggregate
Concre
te
MN 1001
--Long Tine (
0.75-i
n spac
ing, 0.12
5-in dep
th), turf
drag
MN 2003
--Long B
room D
rag
MN 2004
--Long Turf
Drag
MN 5001
--Long Turf
Drag
MN 7001
--Long Turf
Drag
MN 8001
--Long Tine (
0.75-i
n spac
ing, 0.12
5-in dep
th), turf
drag
MO 1001
--Tran
Tine (0.5
-in sp
acing, 0
.125-i
n depth), n
o pretex
ture
NC 1001
--Nova
Chip (0.37
5-in N
MAS)
ND 2001
--Long Turf
Drag
ND 2002
--Tran
Tine (ran
dom spac
ing, 0.1-
in depth), t
urf drag
ND 6001
--Tran
s Ske
w Tine (ran
dom spac
ing, 0.15
-in dep
th), turf
drag
TX 1001
--Shotblas
ted C
oncrete
WI 100
1--Tran
Tine (ran
dom spac
ing, 0.15
-in dep
th), turf
drag
CT
Met
er T
extu
re R
atio
(MPD
/RM
S)

D-7
Figure D-7. Comparison of high-speed profiler EMTD and CT Meter MTD results (right wheelpath and lane center) for existing texture test sections.
Figure D-7. Comparison of high-speed EMTD and CT Meter MTD results (right wheelpath and lane center) for existing texture test sections (continued).
0.00
0.20
0.40
0.60
0.80
1.00
1.20
1.40
1.60
1.80
AZ 1001
--Long D
G (no ja
cks),
0.23
5-in sp
acing (0
.11-in
spac
ers)
AZ 1002
--Long D
G (jack
s), 0.
235-i
n spac
ing (0.11
-in sp
acers
)
AZ 1003
--Long D
G (no ja
cks),
0.24
5-in sp
acing (0
.12-in
spac
ers)
AZ 1004
--Long D
G (jack
s), 0.
245-i
n spac
ing (0.12
-in sp
acers
)
CA 1002
--Long D
G, 0.24
5-in sp
acing (0
.12-in
spac
ers)
CA 1003
--Long G
roove
(0.75
-in sp
acing, 0
.125-i
n depth), b
urlap...
CA 1004
--Long G
roove
(0.75
-in sp
acing, 0
.25-in
depth), b
urlap ...
CA 1045
--Long B
urlap D
rag
CA 1005
--Long D
G, 0.23
-in sp
acing (0
.105-i
n spac
ers)
CA 1007
--Long G
roove
(0.75
-in sp
acing, 0
.25-in
depth), b
room ...
CA 1075
--Long B
room D
rag
CO 1007
--Long G
roove
(0.75
-in sp
acing, 0
.125-i
n depth), t
urf drag
CO 1008
--Long Turf
Drag
CO 1009
--Long Tine (
0.75-i
n spac
ing, 0.12
5-in dep
th), turf
drag
CO 3001
--Long H
eavy
Turf Drag
CO 3002
--Long Tine (
0.75-i
n spac
ing, 0.18
75-in
depth), n
o prete..
.
CO 3003
--Long M
eander
Tine (0.7
5-in sp
acing, 0
.125-i
n depth), .
.
CO 3004
--Long G
roove
(0.75
-in sp
acing, 0
.125-i
n depth), t
urf drag
CO 3005
--Long D
G, 0.22
-in sp
acing (0
.095-i
n spac
ers)
CO 3006
--Long Tine (
0.75-i
n spac
ing, 0.12
5-in dep
th), turf
drag
IL 1001
--Tran
Tine (0.7
5-in sp
acing, 0
.15-in
depth), t
urf drag
IL 4001
--Den
se-G
raded
AC (S
uperpav
e)
IL 5001
--Tran
Tine (ran
dom spac
ing, 0.15
-in dep
th), turf
drag
IL 8001
--Den
se-G
raded
AC
Mea
n Te
xtur
e D
epth
(MTD
), m
m
High-Speed Profiler EMTD CT Meter MTD
0.00
0.20
0.40
0.60
0.80
1.00
1.20
1.40
IA 10
02--T
ran Tine (
0.5-in
spac
ing, 0.07
5-in dep
th), turf
drag
IA 10
03--L
ong Tine (0.7
5-in sp
acing, 0
.075-i
n depth), t
urf drag
IA 10
04--L
ong Tine (0.7
5-in sp
acing, 0
.15-in
depth), t
urf drag
IA 10
61--T
ran G
roove
(1-in
spac
ing, 0.12
5 to 0.
19- to
0.25
-in dep
th)
IA 10
07--L
ong Turf Drag
IA 20
01--L
ong Tine (0.7
5-in sp
acing, 0
.125-i
n depth), t
urf drag
IA 20
02--L
ong Tine (0.7
5-in sp
acing, 0
.125-i
n depth), b
urlap drag
IA 80
01--T
ran Tine (
0.75-i
n spac
ing, 0.15
-in dep
th), turf
drag
IA 80
02--T
ran Tine (
0.75-i
n spac
ing, 0.15
-in dep
th), turf
drag
IA 90
02--D
ense
-Grad
ed A
C (Superp
ave)
KS 1002
--Long D
G (no ja
cks),
0.23
5-in sp
acing (0
.11-in
spac
ers)..
KS 1004
--Long D
G (no ja
cks),
0.24
5-in sp
acing (0
.12-in
spac
ers)..
KS 1005
--Long D
G (jack
s), 0.
255-i
n spac
ing (0.13
-in sp
acers
) & ...
KS 1006
--Long D
G (jack
s), 0.
255-i
n spac
ing (0.13
-in sp
acers
) & ...
KS 1007
--Long D
G (no ja
cks),
0.25
5-in sp
acing (0
.13-in
spac
ers)..
KS 1008
--Long D
G (no ja
cks),
0.25
5-in sp
acing (0
.13-in
spac
ers)..
KS 1010
--Long Tine (
0.75-i
n spac
ing, 0.15
-in dep
th), turf
drag
KS 2001
--Nova
Chip (0.18
75-in
NMAS)
KS 4001
--Nova
Chip (0.37
5-in N
MAS)
MI 100
1--Exp
osed A
ggregate
Concre
te
MN 1001
--Long Tine (
0.75-i
n spac
ing, 0.12
5-in dep
th), turf
drag
MN 2003
--Long B
room D
rag
MN 2004
--Long Turf
Drag
MN 5001
--Long Turf
Drag
MN 7001
--Long Turf
Drag
MN 8001
--Long Tine (
0.75-i
n spac
ing, 0.12
5-in dep
th), turf
drag
MO 1001
--Tran
Tine (0.5
-in sp
acing, 0
.125-i
n depth), n
o pretex
ture
NC 1001
--Nova
Chip (0.37
5-in N
MAS)
ND 2001
--Long Turf
Drag
ND 2002
--Tran
Tine (ran
dom spac
ing, 0.1-
in depth), t
urf drag
ND 6001
--Tran
s Ske
w Tine (ran
dom spac
ing, 0.15
-in dep
th), tur...
TX 1001
--Shotblas
ted C
oncrete
WI 100
1--Tran
Tine (ran
dom spac
ing, 0.15
-in dep
th), turf
drag
Mea
n Te
xtur
e D
epth
(MTD
), m
m
High-Speed Profiler EMTD CT Meter MTD

D-8
0.00
20.00
40.00
60.00
80.00
100.00
120.00
AZ 1001
--Long D
G (no ja
cks),
0.23
5-in sp
acing (0
.11-in
spac
ers)
AZ 1002
--Long D
G (jack
s), 0.
235-i
n spac
ing (0.11
-in sp
acers
)
AZ 1003
--Long D
G (no ja
cks),
0.24
5-in sp
acing (0
.12-in
spac
ers)
AZ 1004
--Long D
G (jack
s), 0.
245-i
n spac
ing (0.12
-in sp
acers
)
CA 1002
--Long D
G, 0.24
5-in sp
acing (0
.12-in
spac
ers)
CA 1003
--Long G
roove
(0.75
-in sp
acing, 0
.125-i
n depth), b
urlap drag
CA 1004
--Long G
roove
(0.75
-in sp
acing, 0
.25-in
depth), b
urlap drag
CA 1045
--Long B
urlap D
rag
CA 1005
--Long D
G, 0.23
-in sp
acing (0
.105-i
n spac
ers)
CA 1007
--Long G
roove
(0.75
-in sp
acing, 0
.25-in
depth), b
room drag
CA 1075
--Long B
room D
rag
CO 1007
--Long G
roove
(0.75
-in sp
acing, 0
.125-i
n depth), t
urf drag
CO 1008
--Long Turf
Drag
CO 1009
--Long Tine (
0.75-i
n spac
ing, 0.12
5-in dep
th), turf
drag
CO 3001
--Long H
eavy
Turf Drag
CO 3002
--Long Tine (
0.75-i
n spac
ing, 0.18
75-in
depth), n
o pretex
ture
CO 3003
--Long M
eander
Tine (0.7
5-in sp
acing, 0
.125-i
n depth), n
o ...
CO 3004
--Long G
roove
(0.75
-in sp
acing, 0
.125-i
n depth), t
urf drag
CO 3005
--Long D
G, 0.22
-in sp
acing (0
.095-i
n spac
ers)
CO 3006
--Long Tine (
0.75-i
n spac
ing, 0.12
5-in dep
th), turf
drag
IL 1001
--Tran
Tine (0.7
5-in sp
acing, 0
.15-in
depth), t
urf drag
IL 4001
--Den
se-G
raded
AC (S
uperpav
e)
IL 5001
--Tran
Tine (ran
dom spac
ing, 0.15
-in dep
th), turf
drag
IL 8001
--Den
se-G
raded
AC
DF
Test
er D
FT(2
0)
Bars represent Mean ± 1 Std Dev Figure D-8. DF Tester friction/micro-texture results (DFT(20) right wheelpath) for existing
texture test sections. Figure D-8. DF Tester friction/micro-texture results (DFT(20) right wheelpath) for existing
texture test sections (continued).
0.00
20.00
40.00
60.00
80.00
100.00
120.00
IA 10
02--T
ran Tine (
0.5-in
spac
ing, 0.07
5-in dep
th), turf
drag
IA 10
03--L
ong Tine (0.7
5-in sp
acing, 0
.075-i
n depth), t
urf drag
IA 10
04--L
ong Tine (0.7
5-in sp
acing, 0
.15-in
depth), t
urf drag
IA 10
61--T
ran G
roove
(1-in
spac
ing, 0.12
5 to 0.
19- to
0.25
-in dep
th)
IA 10
07--L
ong Turf Drag
IA 20
01--L
ong Tine (0.7
5-in sp
acing, 0
.125-i
n depth), t
urf drag
IA 20
02--L
ong Tine (0.7
5-in sp
acing, 0
.125-i
n depth), b
urlap drag
IA 80
01--T
ran Tine (
0.75-i
n spac
ing, 0.15
-in dep
th), turf
drag
IA 80
02--T
ran Tine (
0.75-i
n spac
ing, 0.15
-in dep
th), turf
drag
IA 90
02--D
ense
-Grad
ed A
C (Superp
ave)
KS 1002
--Long D
G (no ja
cks),
0.23
5-in sp
acing (0
.11-in
spac
ers) &
s...
KS 1004
--Long D
G (no ja
cks),
0.24
5-in sp
acing (0
.12-in
spac
ers) &
...
KS 1005
--Long D
G (jack
s), 0.
255-i
n spac
ing (0.13
-in sp
acers
) & st
d...
KS 1006
--Long D
G (jack
s), 0.
255-i
n spac
ing (0.13
-in sp
acers
) & si
ng...
KS 1007
--Long D
G (no ja
cks),
0.25
5-in sp
acing (0
.13-in
spac
ers) &
s...
KS 1008
--Long D
G (no ja
cks),
0.25
5-in sp
acing (0
.13-in
spac
ers) &
...
KS 1010
--Long Tine (
0.75-i
n spac
ing, 0.15
-in dep
th), turf
drag
KS 2001
--Nova
Chip (0.18
75-in
NMAS)
KS 4001
--Nova
Chip (0.37
5-in N
MAS)
MI 100
1--Exp
osed A
ggregate
Concre
te
MN 1001
--Long Tine (
0.75-i
n spac
ing, 0.12
5-in dep
th), turf
drag
MN 2003
--Long B
room D
rag
MN 2004
--Long Turf
Drag
MN 5001
--Long Turf
Drag
MN 7001
--Long Turf
Drag
MN 8001
--Long Tine (
0.75-i
n spac
ing, 0.12
5-in dep
th), turf
drag
MO 1001
--Tran
Tine (0.5
-in sp
acing, 0
.125-i
n depth), n
o pretex
ture
NC 1001
--Nova
Chip (0.37
5-in N
MAS)
ND 2001
--Long Turf
Drag
ND 2002
--Tran
Tine (ran
dom spac
ing, 0.1-
in depth), t
urf drag
ND 6001
--Tran
s Ske
w Tine (ran
dom spac
ing, 0.15
-in dep
th), turf
drag
TX 1001
--Shotblas
ted C
oncrete
WI 100
1--Tran
Tine (ran
dom spac
ing, 0.15
-in dep
th), turf
drag
DF
Test
er D
FT(2
0)
Bars represent Mean ± 1 Std Dev

D-9
Figure D-9. DF Tester friction/micro-texture results (DFT(20) lane center) for existing texture test sections.
Figure D-9. DF Tester friction/micro-texture results (DFT(20) lane center) for existing texture test sections (continued).
0.00
20.00
40.00
60.00
80.00
100.00
120.00
AZ 1001
--Long D
G (no ja
cks),
0.23
5-in sp
acing (0
.11-in
spac
ers)
AZ 1002
--Long D
G (jack
s), 0.
235-i
n spac
ing (0.11
-in sp
acers
)
AZ 1003
--Long D
G (no ja
cks),
0.24
5-in sp
acing (0
.12-in
spac
ers)
AZ 1004
--Long D
G (jack
s), 0.
245-i
n spac
ing (0.12
-in sp
acers
)
CA 1002
--Long D
G, 0.24
5-in sp
acing (0
.12-in
spac
ers)
CA 1003
--Long G
roove
(0.75
-in sp
acing, 0
.125-i
n depth), b
urlap drag
CA 1004
--Long G
roove
(0.75
-in sp
acing, 0
.25-in
depth), b
urlap drag
CA 1045
--Long B
urlap D
rag
CA 1005
--Long D
G, 0.23
-in sp
acing (0
.105-i
n spac
ers)
CA 1007
--Long G
roove
(0.75
-in sp
acing, 0
.25-in
depth), b
room drag
CA 1075
--Long B
room D
rag
CO 1007
--Long G
roove
(0.75
-in sp
acing, 0
.125-i
n depth), t
urf drag
CO 1008
--Long Turf
Drag
CO 1009
--Long Tine (
0.75-i
n spac
ing, 0.12
5-in dep
th), turf
drag
CO 3001
--Long H
eavy
Turf Drag
CO 3002
--Long Tine (
0.75-i
n spac
ing, 0.18
75-in
depth), n
o pretex
ture
CO 3003
--Long M
eander
Tine (0.7
5-in sp
acing, 0
.125-i
n depth), n
o ...
CO 3004
--Long G
roove
(0.75
-in sp
acing, 0
.125-i
n depth), t
urf drag
CO 3005
--Long D
G, 0.22
-in sp
acing (0
.095-i
n spac
ers)
CO 3006
--Long Tine (
0.75-i
n spac
ing, 0.12
5-in dep
th), turf
drag
IL 1001
--Tran
Tine (0.7
5-in sp
acing, 0
.15-in
depth), t
urf drag
IL 4001
--Den
se-G
raded
AC (S
uperpav
e)
IL 5001
--Tran
Tine (ran
dom spac
ing, 0.15
-in dep
th), turf
drag
IL 8001
--Den
se-G
raded
AC
DF
Test
er D
FT(2
0)
Bars represent Mean ± 1 Std Dev
0.00
20.00
40.00
60.00
80.00
100.00
120.00
IA 10
02--T
ran Tine (
0.5-in
spac
ing, 0.07
5-in dep
th), turf
drag
IA 10
03--L
ong Tine (0.7
5-in sp
acing, 0
.075-i
n depth), t
urf drag
IA 10
04--L
ong Tine (0.7
5-in sp
acing, 0
.15-in
depth), t
urf drag
IA 10
61--T
ran G
roove
(1-in
spac
ing, 0.12
5 to 0.
19- to
0.25
-in dep
th)
IA 10
07--L
ong Turf Drag
IA 20
01--L
ong Tine (0.7
5-in sp
acing, 0
.125-i
n depth), t
urf drag
IA 20
02--L
ong Tine (0.7
5-in sp
acing, 0
.125-i
n depth), b
urlap drag
IA 80
01--T
ran Tine (
0.75-i
n spac
ing, 0.15
-in dep
th), turf
drag
IA 80
02--T
ran Tine (
0.75-i
n spac
ing, 0.15
-in dep
th), turf
drag
IA 90
02--D
ense
-Grad
ed A
C (Superp
ave)
KS 1002
--Long D
G (no ja
cks),
0.23
5-in sp
acing (0
.11-in
spac
ers) &
s...
KS 1004
--Long D
G (no ja
cks),
0.24
5-in sp
acing (0
.12-in
spac
ers) &
...
KS 1005
--Long D
G (jack
s), 0.
255-i
n spac
ing (0.13
-in sp
acers
) & st
d...
KS 1006
--Long D
G (jack
s), 0.
255-i
n spac
ing (0.13
-in sp
acers
) & si
ng...
KS 1007
--Long D
G (no ja
cks),
0.25
5-in sp
acing (0
.13-in
spac
ers) &
s...
KS 1008
--Long D
G (no ja
cks),
0.25
5-in sp
acing (0
.13-in
spac
ers) &
...
KS 1010
--Long Tine (
0.75-i
n spac
ing, 0.15
-in dep
th), turf
drag
KS 2001
--Nova
Chip (0.18
75-in
NMAS)
KS 4001
--Nova
Chip (0.37
5-in N
MAS)
MI 100
1--Exp
osed A
ggregate
Concre
te
MN 1001
--Long Tine (
0.75-i
n spac
ing, 0.12
5-in dep
th), turf
drag
MN 2003
--Long B
room D
rag
MN 2004
--Long Turf
Drag
MN 5001
--Long Turf
Drag
MN 7001
--Long Turf
Drag
MN 8001
--Long Tine (
0.75-i
n spac
ing, 0.12
5-in dep
th), turf
drag
MO 1001
--Tran
Tine (0.5
-in sp
acing, 0
.125-i
n depth), n
o pretex
ture
NC 1001
--Nova
Chip (0.37
5-in N
MAS)
ND 2001
--Long Turf
Drag
ND 2002
--Tran
Tine (ran
dom spac
ing, 0.1-
in depth), t
urf drag
ND 6001
--Tran
s Ske
w Tine (ran
dom spac
ing, 0.15
-in dep
th), turf
drag
TX 1001
--Shotblas
ted C
oncrete
WI 100
1--Tran
Tine (ran
dom spac
ing, 0.15
-in dep
th), turf
drag
DF
Test
er D
FT(2
0)
Bars represent Mean ± 1 Std Dev

D-10
Figure D-10. IFI Friction Number F(60) values for existing texture test sections.
Figure D-10. IFI Friction Number F(60) values for existing texture test sections (continued).
0.00
10.00
20.00
30.00
40.00
50.00
60.00
AZ 1001
--Long D
G (no ja
cks),
0.23
5-in sp
acing (0
.11-in
spac
ers)
AZ 1002
--Long D
G (jack
s), 0.
235-i
n spac
ing (0.11
-in sp
acers
)
AZ 1003
--Long D
G (no ja
cks),
0.24
5-in sp
acing (0
.12-in
spac
ers)
AZ 1004
--Long D
G (jack
s), 0.
245-i
n spac
ing (0.12
-in sp
acers
)
CA 1002
--Long D
G, 0.24
5-in sp
acing (0
.12-in
spac
ers)
CA 1003
--Long G
roove
(0.75
-in sp
acing, 0
.125-i
n depth), b
urlap...
CA 1004
--Long G
roove
(0.75
-in sp
acing, 0
.25-in
depth), b
urlap ...
CA 1045
--Long B
urlap D
rag
CA 1005
--Long D
G, 0.23
-in sp
acing (0
.105-i
n spac
ers)
CA 1007
--Long G
roove
(0.37
5-in sp
acing, 0
.25-in
depth), b
room...
CA 1075
--Long B
room D
rag
CO 1007
--Long G
roove
(0.75
-in sp
acing, 0
.125-i
n depth), t
urf drag
CO 1008
--Long Turf
Drag
CO 1009
--Long Tine (
0.75-i
n spac
ing, 0.12
5-in dep
th), turf
drag
CO 3001
--Long H
eavy
Turf Drag
CO 3002
--Long Tine (
0.75-i
n spac
ing, 0.18
75-in
depth), n
o prete..
.
CO 3003
--Long M
eander
Tine (0.7
5-in sp
acing, 0
.125-i
n depth), .
.
CO 3004
--Long G
roove
(0.75
-in sp
acing, 0
.125-i
n depth), t
urf drag
CO 3005
--Long D
G, 0.22
-in sp
acing (0
.095-i
n spac
ers)
CO 3006
--Long Tine (
0.75-i
n spac
ing, 0.12
5-in dep
th), turf
drag
IL 1001
--Tran
Tine (0.7
5-in sp
acing, 0
.15-in
depth), t
urf drag
IL 4001
--Den
se-G
raded
AC (S
uperpav
e)
IL 5001
--Tran
Skewed
Tine (ran
dom spac
ing, 0.15
-in dep
th), tur...
IL 8001
--Den
se-G
raded
AC
IFI F
rictio
n N
umbe
r F(6
0)
Based on DF Tester DFT(20) and High-Speed Profiler MPD
Based on locked-wheel tester FN40 and high-speed profiler MPD
0.00
10.00
20.00
30.00
40.00
50.00
60.00
IA 10
02--T
ran Tine (
0.5-in
spac
ing, 0.07
5-in dep
th), turf
drag
IA 10
03--L
ong Tine (0.7
5-in sp
acing, 0
.075-i
n depth), t
urf drag
IA 10
04--L
ong Tine (0.7
5-in sp
acing, 0
.15-in
depth), t
urf drag
IA 10
61--T
ran G
roove
(1-in
spac
ing, 0.12
5 to 0.
19- to
0.25
-in dep
th)
IA 10
07--L
ong Turf Drag
IA 20
01--L
ong Tine (0.7
5-in sp
acing, 0
.125-i
n depth), t
urf drag
IA 20
02--L
ong Tine (0.7
5-in sp
acing, 0
.125-i
n depth), b
urlap drag
IA 80
01--T
ran Tine (
0.75-i
n spac
ing, 0.15
-in dep
th), turf
drag
IA 80
02--T
ran Tine (
0.75-i
n spac
ing, 0.15
-in dep
th), turf
drag
IA 90
02--D
ense
-Grad
ed A
C (Superp
ave)
KS 1002
--Long D
G (no ja
cks),
0.23
5-in sp
acing (0
.11-in
spac
ers)..
KS 1004
--Long D
G (no ja
cks),
0.24
5-in sp
acing (0
.12-in
spac
ers)..
KS 1005
--Long D
G (jack
s), 0.
255-i
n spac
ing (0.13
-in sp
acers
) & ...
KS 1006
--Long D
G (jack
s), 0.
255-i
n spac
ing (0.13
-in sp
acers
) & ...
KS 1007
--Long D
G (no ja
cks),
0.25
5-in sp
acing (0
.13-in
spac
ers)..
KS 1008
--Long D
G (no ja
cks),
0.25
5-in sp
acing (0
.13-in
spac
ers)..
KS 1010
--Long Tine (
0.75-i
n spac
ing, 0.15
-in dep
th), turf
drag
KS 2001
--Nova
Chip (0.18
75-in
NMAS)
KS 4001
--Nova
Chip (0.37
5-in N
MAS)
MI 100
1--Exp
osed A
ggregate
Concre
te
MN 1001
--Long Tine (
0.75-i
n spac
ing, 0.12
5-in dep
th), turf
drag
MN 2003
--Long B
room D
rag
MN 2004
--Long Turf
Drag
MN 5001
--Long Turf
Drag
MN 7001
--Long Turf
Drag
MN 8001
--Long Tine (
0.75-i
n spac
ing, 0.12
5-in dep
th), turf
drag
MO 1001
--Tran
Tine (0.5
-in sp
acing, 0
.125-i
n depth), n
o pretex
ture
NC 1001
--Nova
Chip (0.37
5-in N
MAS)
ND 2001
--Long Turf
Drag
ND 2002
--Tran
Tine (ran
dom spac
ing, 0.1-
in depth), t
urf drag
ND 6001
--Tran
s Ske
w Tine (ran
dom spac
ing, 0.15
-in dep
th), tur...
TX 1001
--Shotblas
ted C
oncrete
WI 100
1--Tran
Tine (ran
dom spac
ing, 0.15
-in dep
th), turf
drag
IFI F
rictio
n N
umbe
r F(6
0)
Based on DF Tester DFT(20) and High-Speed Profiler MPD
Based on locked-wheel tester FN40 and high-speed profiler MPD

D-11
Figure D-11. Near-field noise results (SI right wheelpath) for existing texture test sections.
Figure D-11. Near-field noise results (SI right wheelpath) for existing texture test sections (continued).
100.0101.0
102.0103.0104.0
105.0106.0107.0
108.0109.0110.0
111.0112.0
AZ 1001
--Long D
G (no ja
cks),
0.23
5-in sp
acing (0
.11-in
spac
ers)
AZ 1002
--Long D
G (jack
s), 0.
235-i
n spac
ing (0.11
-in sp
acers
)
AZ 1003
--Long D
G (no ja
cks),
0.24
5-in sp
acing (0
.12-in
spac
ers)
AZ 1004
--Long D
G (jack
s), 0.
245-i
n spac
ing (0.12
-in sp
acers
)
CA 1002
--Long D
G, 0.24
5-in sp
acing (0
.12-in
spac
ers)
CA 1003
--Long G
roove
(0.75
-in sp
acing, 0
.125-i
n depth), b
urlap drag
CA 1004
--Long G
roove
(0.75
-in sp
acing, 0
.25-in
depth), b
urlap drag
CA 1045
--Long B
urlap D
rag
CA 1005
--Long D
G, 0.23
-in sp
acing (0
.105-i
n spac
ers)
CA 1007
--Long G
roove
(0.37
5-in sp
acing, 0
.25-in
depth), b
room drag
CA 1075
--Long B
room D
rag
CO 1007
--Long G
roove
(0.75
-in sp
acing, 0
.125-i
n depth), t
urf drag
CO 1008
--Long Turf
Drag
CO 1009
--Long Tine (
0.75-i
n spac
ing, 0.12
5-in dep
th), turf
drag
CO 3001
--Long H
eavy
Turf Drag
CO 3002
--Long Tine (
0.75-i
n spac
ing, 0.18
75-in
depth), n
o pretex
ture
CO 3003
--Long M
eander
Tine (0.7
5-in sp
acing, 0
.125-i
n depth), n
o ...
CO 3004
--Long G
roove
(0.75
-in sp
acing, 0
.125-i
n depth), t
urf drag
CO 3005
--Long D
G, 0.22
-in sp
acing (0
.095-i
n spac
ers)
CO 3006
--Long Tine (
0.75-i
n spac
ing, 0.12
5-in dep
th), turf
drag
IL 1001
--Tran
Tine (0.7
5-in sp
acing, 0
.15-in
depth), t
urf drag
IL 4001
--Den
se-G
raded
AC (S
uperpav
e)
IL 5001
--Tran
Skewed
Tine (ran
dom spac
ing, 0.15
-in dep
th), turf
drag
IL 8001
--Den
se-G
raded
AC
Nea
r-Fi
eld
SI, d
BA
(WP)
Bars represent Mean ± 1 Std Dev
100.0
101.0
102.0
103.0
104.0
105.0
106.0
107.0
108.0
109.0
110.0
111.0
112.0
IA 10
02--T
ran Tine (
0.5-in
spac
ing, 0.07
5-in dep
th), turf
drag
IA 10
03--L
ong Tine (0.7
5-in sp
acing, 0
.075-i
n depth), t
urf drag
IA 10
04--L
ong Tine (0.7
5-in sp
acing, 0
.15-in
depth), t
urf drag
IA 10
61--T
ran G
roove
(1-in
spac
ing, 0.12
5 to 0.
19- to
0.25
-in dep
th)
IA 10
07--L
ong Turf Drag
IA 20
01--L
ong Tine (0.7
5-in sp
acing, 0
.125-i
n depth), t
urf drag
IA 20
02--L
ong Tine (0.7
5-in sp
acing, 0
.125-i
n depth), b
urlap drag
IA 80
01--T
ran Tine (
0.75-i
n spac
ing, 0.15
-in dep
th), turf
drag
IA 80
02--T
ran Tine (
0.75-i
n spac
ing, 0.15
-in dep
th), turf
drag
IA 90
02--D
ense
-Grad
ed A
C (Superp
ave)
KS 1002
--Long D
G (no ja
cks),
0.23
5-in sp
acing (0
.11-in
spac
ers) &
s...
KS 1004
--Long D
G (no ja
cks),
0.24
5-in sp
acing (0
.12-in
spac
ers) &
...
KS 1005
--Long D
G (jack
s), 0.
255-i
n spac
ing (0.13
-in sp
acers
) & st
d...
KS 1006
--Long D
G (jack
s), 0.
255-i
n spac
ing (0.13
-in sp
acers
) & si
ng...
KS 1007
--Long D
G (no ja
cks),
0.25
5-in sp
acing (0
.13-in
spac
ers) &
s...
KS 1008
--Long D
G (no ja
cks),
0.25
5-in sp
acing (0
.13-in
spac
ers) &
...
KS 1010
--Long Tine (
0.75-i
n spac
ing, 0.15
-in dep
th), turf
drag
KS 2001
--Nova
Chip (0.18
75-in
NMAS)
KS 4001
--Nova
Chip (0.37
5-in N
MAS)
MI 100
1--Exp
osed A
ggregate
Concre
te
MN 1001
--Long Tine (
0.75-i
n spac
ing, 0.12
5-in dep
th), turf
drag
MN 2003
--Long B
room D
rag
MN 2004
--Long Turf
Drag
MN 5001
--Long Turf
Drag
MN 7001
--Long Turf
Drag
MN 8001
--Long Tine (
0.75-i
n spac
ing, 0.12
5-in dep
th), turf
drag
MO 1001
--Tran
Tine (0.5
-in sp
acing, 0
.125-i
n depth), n
o pretex
ture
NC 1001
--Nova
Chip (0.37
5-in N
MAS)
ND 2001
--Long Turf
Drag
ND 2002
--Tran
Tine (ran
dom spac
ing, 0.1-
in depth), t
urf drag
ND 6001
--Tran
s Ske
w Tine (ran
dom spac
ing, 0.15
-in dep
th), turf
drag
TX 1001
--Shotblas
ted C
oncrete
WI 100
1--Tran
Tine (ran
dom spac
ing, 0.15
-in dep
th), turf
drag
Nea
r-Fi
eld
SI, d
BA
(WP)
Bars represent Mean ± 1 Std Dev

D-12
Figure D-12. Near-field noise results (SI lane center) for existing texture test sections.
Figure D-12. Near-field noise results (SI lane center) for existing texture test sections (continued).
100.0101.0
102.0103.0104.0
105.0106.0107.0
108.0109.0110.0
111.0112.0
AZ 1001
--Long D
G (no ja
cks),
0.23
5-in sp
acing (0
.11-in
spac
ers)
AZ 1002
--Long D
G (jack
s), 0.
235-i
n spac
ing (0.11
-in sp
acers
)
AZ 1003
--Long D
G (no ja
cks),
0.24
5-in sp
acing (0
.12-in
spac
ers)
AZ 1004
--Long D
G (jack
s), 0.
245-i
n spac
ing (0.12
-in sp
acers
)
CA 1002
--Long D
G, 0.24
5-in sp
acing (0
.12-in
spac
ers)
CA 1003
--Long G
roove
(0.75
-in sp
acing, 0
.125-i
n depth), b
urlap drag
CA 1004
--Long G
roove
(0.75
-in sp
acing, 0
.25-in
depth), b
urlap drag
CA 1045
--Long B
urlap D
rag
CA 1005
--Long D
G, 0.23
-in sp
acing (0
.105-i
n spac
ers)
CA 1007
--Long G
roove
(0.37
5-in sp
acing, 0
.25-in
depth), b
room drag
CA 1075
--Long B
room D
rag
CO 1007
--Long G
roove
(0.75
-in sp
acing, 0
.125-i
n depth), t
urf drag
CO 1008
--Long Turf
Drag
CO 1009
--Long Tine (
0.75-i
n spac
ing, 0.12
5-in dep
th), turf
drag
CO 3001
--Long H
eavy
Turf Drag
CO 3002
--Long Tine (
0.75-i
n spac
ing, 0.18
75-in
depth), n
o pretex
ture
CO 3003
--Long M
eander
Tine (0.7
5-in sp
acing, 0
.125-i
n depth), n
o ...
CO 3004
--Long G
roove
(0.75
-in sp
acing, 0
.125-i
n depth), t
urf drag
CO 3005
--Long D
G, 0.22
-in sp
acing (0
.095-i
n spac
ers)
CO 3006
--Long Tine (
0.75-i
n spac
ing, 0.12
5-in dep
th), turf
drag
IL 1001
--Tran
Tine (0.7
5-in sp
acing, 0
.15-in
depth), t
urf drag
IL 4001
--Den
se-G
raded
AC (S
uperpav
e)
IL 5001
--Tran
Skewed
Tine (ran
dom spac
ing, 0.15
-in dep
th), turf
drag
IL 8001
--Den
se-G
raded
AC
Nea
r-Fi
eld
SI, d
BA
(LC
)
Bars represent Mean ± 1 Std Dev
100.0
101.0
102.0
103.0
104.0
105.0
106.0
107.0
108.0
109.0
110.0
111.0
112.0
IA 10
02--T
ran Tine (
0.5-in
spac
ing, 0.07
5-in dep
th), turf
drag
IA 10
03--L
ong Tine (0.7
5-in sp
acing, 0
.075-i
n depth), t
urf drag
IA 10
04--L
ong Tine (0.7
5-in sp
acing, 0
.15-in
depth), t
urf drag
IA 10
61--T
ran G
roove
(1-in
spac
ing, 0.12
5 to 0.
19- to
0.25
-in dep
th)
IA 10
07--L
ong Turf Drag
IA 20
01--L
ong Tine (0.7
5-in sp
acing, 0
.125-i
n depth), t
urf drag
IA 20
02--L
ong Tine (0.7
5-in sp
acing, 0
.125-i
n depth), b
urlap drag
IA 80
01--T
ran Tine (
0.75-i
n spac
ing, 0.15
-in dep
th), turf
drag
IA 80
02--T
ran Tine (
0.75-i
n spac
ing, 0.15
-in dep
th), turf
drag
IA 90
02--D
ense
-Grad
ed A
C (Superp
ave)
KS 1002
--Long D
G (no ja
cks),
0.23
5-in sp
acing (0
.11-in
spac
ers) &
s...
KS 1004
--Long D
G (no ja
cks),
0.24
5-in sp
acing (0
.12-in
spac
ers) &
...
KS 1005
--Long D
G (jack
s), 0.
255-i
n spac
ing (0.13
-in sp
acers
) & st
d...
KS 1006
--Long D
G (jack
s), 0.
255-i
n spac
ing (0.13
-in sp
acers
) & si
ng...
KS 1007
--Long D
G (no ja
cks),
0.25
5-in sp
acing (0
.13-in
spac
ers) &
s...
KS 1008
--Long D
G (no ja
cks),
0.25
5-in sp
acing (0
.13-in
spac
ers) &
...
KS 1010
--Long Tine (
0.75-i
n spac
ing, 0.15
-in dep
th), turf
drag
KS 2001
--Nova
Chip (0.18
75-in
NMAS)
KS 4001
--Nova
Chip (0.37
5-in N
MAS)
MI 100
1--Exp
osed A
ggregate
Concre
te
MN 1001
--Long Tine (
0.75-i
n spac
ing, 0.12
5-in dep
th), turf
drag
MN 2003
--Long B
room D
rag
MN 2004
--Long Turf
Drag
MN 5001
--Long Turf
Drag
MN 7001
--Long Turf
Drag
MN 8001
--Long Tine (
0.75-i
n spac
ing, 0.12
5-in dep
th), turf
drag
MO 1001
--Tran
Tine (0.5
-in sp
acing, 0
.125-i
n depth), n
o pretex
ture
NC 1001
--Nova
Chip (0.37
5-in N
MAS)
ND 2001
--Long Turf
Drag
ND 2002
--Tran
Tine (ran
dom spac
ing, 0.1-
in depth), t
urf drag
ND 6001
--Tran
s Ske
w Tine (ran
dom spac
ing, 0.15
-in dep
th), turf
drag
TX 1001
--Shotblas
ted C
oncrete
WI 100
1--Tran
Tine (ran
dom spac
ing, 0.15
-in dep
th), turf
drag
Nea
r-Fi
eld
SI, d
BA
(LC
)
Bars represent Mean ± 1 Std Dev

D-13
Figure D-13. Interior noise results (Leq right wheelpath) for existing texture test sections.
Figure D-13. Interior noise results (Leq right wheelpath) for existing texture test sections (continued).
65.0
66.0
67.0
68.0
69.0
70.0
71.0
72.0
73.0
74.0
75.0
AZ 1001
--Long D
G (no ja
cks),
0.23
5-in sp
acing (0
.11-in
spac
ers)
AZ 1002
--Long D
G (jack
s), 0.
235-i
n spac
ing (0.11
-in sp
acers
)
AZ 1003
--Long D
G (no ja
cks),
0.24
5-in sp
acing (0
.12-in
spac
ers)
AZ 1004
--Long D
G (jack
s), 0.
245-i
n spac
ing (0.12
-in sp
acers
)
CA 1002
--Long D
G, 0.24
5-in sp
acing (0
.12-in
spac
ers)
CA 1003
--Long G
roove
(0.75
-in sp
acing, 0
.125-i
n depth), b
urlap drag
CA 1004
--Long G
roove
(0.75
-in sp
acing, 0
.25-in
depth), b
urlap drag
CA 1045
--Long B
urlap D
rag
CA 1005
--Long D
G, 0.23
-in sp
acing (0
.105-i
n spac
ers)
CA 1007
--Long G
roove
(0.37
5-in sp
acing, 0
.25-in
depth), b
room drag
CA 1075
--Long B
room D
rag
CO 1007
--Long G
roove
(0.75
-in sp
acing, 0
.125-i
n depth), t
urf drag
CO 1008
--Long Turf
Drag
CO 1009
--Long Tine (
0.75-i
n spac
ing, 0.12
5-in dep
th), turf
drag
CO 3001
--Long H
eavy
Turf Drag
CO 3002
--Long Tine (
0.75-i
n spac
ing, 0.18
75-in
depth), n
o pretex
ture
CO 3003
--Long M
eander
Tine (0.7
5-in sp
acing, 0
.125-i
n depth), n
o ...
CO 3004
--Long G
roove
(0.75
-in sp
acing, 0
.125-i
n depth), t
urf drag
CO 3005
--Long D
G, 0.22
-in sp
acing (0
.095-i
n spac
ers)
CO 3006
--Long Tine (
0.75-i
n spac
ing, 0.12
5-in dep
th), turf
drag
IL 1001
--Tran
Tine (0.7
5-in sp
acing, 0
.15-in
depth), t
urf drag
IL 4001
--Den
se-G
raded
AC (S
uperpav
e)
IL 5001
--Tran
Skewed
Tine (ran
dom spac
ing, 0.15
-in dep
th), turf
drag
IL 8001
--Den
se-G
raded
AC
Inte
rior N
oise
, dB
A (W
P)
Bars represent Mean ± 1 Std Dev
65.0
66.0
67.0
68.0
69.0
70.0
71.0
72.0
73.0
74.0
75.0
IA 10
02--T
ran Tine (
0.5-in
spac
ing, 0.07
5-in dep
th), turf
drag
IA 10
03--L
ong Tine (0.7
5-in sp
acing, 0
.075-i
n depth), t
urf drag
IA 10
04--L
ong Tine (0.7
5-in sp
acing, 0
.15-in
depth), t
urf drag
IA 10
61--T
ran G
roove
(1-in
spac
ing, 0.12
5 to 0.
19- to
0.25
-in dep
th)
IA 10
07--L
ong Turf Drag
IA 20
01--L
ong Tine (0.7
5-in sp
acing, 0
.125-i
n depth), t
urf drag
IA 20
02--L
ong Tine (0.7
5-in sp
acing, 0
.125-i
n depth), b
urlap drag
IA 80
01--T
ran Tine (
0.75-i
n spac
ing, 0.15
-in dep
th), turf
drag
IA 80
02--T
ran Tine (
0.75-i
n spac
ing, 0.15
-in dep
th), turf
drag
IA 90
02--D
ense
-Grad
ed A
C (Superp
ave)
KS 1002
--Long D
G (no ja
cks),
0.23
5-in sp
acing (0
.11-in
spac
ers) &
s...
KS 1004
--Long D
G (no ja
cks),
0.24
5-in sp
acing (0
.12-in
spac
ers) &
...
KS 1005
--Long D
G (jack
s), 0.
255-i
n spac
ing (0.13
-in sp
acers
) & st
d...
KS 1006
--Long D
G (jack
s), 0.
255-i
n spac
ing (0.13
-in sp
acers
) & si
ng...
KS 1007
--Long D
G (no ja
cks),
0.25
5-in sp
acing (0
.13-in
spac
ers) &
s...
KS 1008
--Long D
G (no ja
cks),
0.25
5-in sp
acing (0
.13-in
spac
ers) &
...
KS 1010
--Long Tine (
0.75-i
n spac
ing, 0.15
-in dep
th), turf
drag
KS 2001
--Nova
Chip (0.18
75-in
NMAS)
KS 4001
--Nova
Chip (0.37
5-in N
MAS)
MI 100
1--Exp
osed A
ggregate
Concre
te
MN 1001
--Long Tine (
0.75-i
n spac
ing, 0.12
5-in dep
th), turf
drag
MN 2003
--Long B
room D
rag
MN 2004
--Long Turf
Drag
MN 5001
--Long Turf
Drag
MN 7001
--Long Turf
Drag
MN 8001
--Long Tine (
0.75-i
n spac
ing, 0.12
5-in dep
th), turf
drag
MO 1001
--Tran
Tine (0.5
-in sp
acing, 0
.125-i
n depth), n
o pretex
ture
NC 1001
--Nova
Chip (0.37
5-in N
MAS)
ND 2001
--Long Turf
Drag
ND 2002
--Tran
Tine (ran
dom spac
ing, 0.1-
in depth), t
urf drag
ND 6001
--Tran
s Ske
w Tine (ran
dom spac
ing, 0.15
-in dep
th), turf
drag
TX 1001
--Shotblas
ted C
oncrete
WI 100
1--Tran
Tine (ran
dom spac
ing, 0.15
-in dep
th), turf
drag
Inte
rior N
oise
, dB
A (W
P)
Bars represent Mean ± 1 Std Dev

D-14
Figure D-14. Interior noise results (Leq lane center) for existing texture test sections.
Figure D-14. Interior noise results (Leq lane center) for existing texture test sections (continued).
65.0
66.0
67.0
68.0
69.0
70.0
71.0
72.0
73.0
74.0
75.0
AZ 1001
--Long D
G (no ja
cks),
0.23
5-in sp
acing (0
.11-in
spac
ers)
AZ 1002
--Long D
G (jack
s), 0.
235-i
n spac
ing (0.11
-in sp
acers
)
AZ 1003
--Long D
G (no ja
cks),
0.24
5-in sp
acing (0
.12-in
spac
ers)
AZ 1004
--Long D
G (jack
s), 0.
245-i
n spac
ing (0.12
-in sp
acers
)
CA 1002
--Long D
G, 0.24
5-in sp
acing (0
.12-in
spac
ers)
CA 1003
--Long G
roove
(0.75
-in sp
acing, 0
.125-i
n depth), b
urlap drag
CA 1004
--Long G
roove
(0.75
-in sp
acing, 0
.25-in
depth), b
urlap drag
CA 1045
--Long B
urlap D
rag
CA 1005
--Long D
G, 0.23
-in sp
acing (0
.105-i
n spac
ers)
CA 1007
--Long G
roove
(0.37
5-in sp
acing, 0
.25-in
depth), b
room drag
CA 1075
--Long B
room D
rag
CO 1007
--Long G
roove
(0.75
-in sp
acing, 0
.125-i
n depth), t
urf drag
CO 1008
--Long Turf
Drag
CO 1009
--Long Tine (
0.75-i
n spac
ing, 0.12
5-in dep
th), turf
drag
CO 3001
--Long H
eavy
Turf Drag
CO 3002
--Long Tine (
0.75-i
n spac
ing, 0.18
75-in
depth), n
o pretex
ture
CO 3003
--Long M
eander
Tine (0.7
5-in sp
acing, 0
.125-i
n depth), n
o ...
CO 3004
--Long G
roove
(0.75
-in sp
acing, 0
.125-i
n depth), t
urf drag
CO 3005
--Long D
G, 0.22
-in sp
acing (0
.095-i
n spac
ers)
CO 3006
--Long Tine (
0.75-i
n spac
ing, 0.12
5-in dep
th), turf
drag
IL 1001
--Tran
Tine (0.7
5-in sp
acing, 0
.15-in
depth), t
urf drag
IL 4001
--Den
se-G
raded
AC (S
uperpav
e)
IL 5001
--Tran
Skewed
Tine (ran
dom spac
ing, 0.15
-in dep
th), turf
drag
IL 8001
--Den
se-G
raded
AC
Inte
rior N
oise
, dB
A (L
C)
Bars represent Mean ± 1 Std Dev
65.0
66.0
67.0
68.0
69.0
70.0
71.0
72.0
73.0
74.0
75.0
IA 10
02--T
ran Tine (
0.5-in
spac
ing, 0.07
5-in dep
th), turf
drag
IA 10
03--L
ong Tine (0.7
5-in sp
acing, 0
.075-i
n depth), t
urf drag
IA 10
04--L
ong Tine (0.7
5-in sp
acing, 0
.15-in
depth), t
urf drag
IA 10
61--T
ran G
roove
(1-in
spac
ing, 0.12
5 to 0.
19- to
0.25
-in dep
th)
IA 10
07--L
ong Turf Drag
IA 20
01--L
ong Tine (0.7
5-in sp
acing, 0
.125-i
n depth), t
urf drag
IA 20
02--L
ong Tine (0.7
5-in sp
acing, 0
.125-i
n depth), b
urlap drag
IA 80
01--T
ran Tine (
0.75-i
n spac
ing, 0.15
-in dep
th), turf
drag
IA 80
02--T
ran Tine (
0.75-i
n spac
ing, 0.15
-in dep
th), turf
drag
IA 90
02--D
ense
-Grad
ed A
C (Superp
ave)
KS 1002
--Long D
G (no ja
cks),
0.23
5-in sp
acing (0
.11-in
spac
ers) &
s...
KS 1004
--Long D
G (no ja
cks),
0.24
5-in sp
acing (0
.12-in
spac
ers) &
...
KS 1005
--Long D
G (jack
s), 0.
255-i
n spac
ing (0.13
-in sp
acers
) & st
d...
KS 1006
--Long D
G (jack
s), 0.
255-i
n spac
ing (0.13
-in sp
acers
) & si
ng...
KS 1007
--Long D
G (no ja
cks),
0.25
5-in sp
acing (0
.13-in
spac
ers) &
s...
KS 1008
--Long D
G (no ja
cks),
0.25
5-in sp
acing (0
.13-in
spac
ers) &
...
KS 1010
--Long Tine (
0.75-i
n spac
ing, 0.15
-in dep
th), turf
drag
KS 2001
--Nova
Chip (0.18
75-in
NMAS)
KS 4001
--Nova
Chip (0.37
5-in N
MAS)
MI 100
1--Exp
osed A
ggregate
Concre
te
MN 1001
--Long Tine (
0.75-i
n spac
ing, 0.12
5-in dep
th), turf
drag
MN 2003
--Long B
room D
rag
MN 2004
--Long Turf
Drag
MN 5001
--Long Turf
Drag
MN 7001
--Long Turf
Drag
MN 8001
--Long Tine (
0.75-i
n spac
ing, 0.12
5-in dep
th), turf
drag
MO 1001
--Tran
Tine (0.5
-in sp
acing, 0
.125-i
n depth), n
o pretex
ture
NC 1001
--Nova
Chip (0.37
5-in N
MAS)
ND 2001
--Long Turf
Drag
ND 2002
--Tran
Tine (ran
dom spac
ing, 0.1-
in depth), t
urf drag
ND 6001
--Tran
s Ske
w Tine (ran
dom spac
ing, 0.15
-in dep
th), turf
drag
TX 1001
--Shotblas
ted C
oncrete
WI 100
1--Tran
Tine (ran
dom spac
ing, 0.15
-in dep
th), turf
drag
Inte
rior N
oise
, dB
A (L
C)
Bars represent Mean ± 1 Std Dev

APPENDIX E. TEXTURE, FRICTION, AND NOISE RESULTS FOR NEW I-355 SOUTH EXTENSION
TEXTURE TEST SECTIONS


E-1
Figure E-1. High-speed texture depth results (MPD right wheelpath) for new texture test sections.
Figure E-2. High-speed texture depth results (MPD lane center) for new texture test sections.
0.00
0.20
0.40
0.60
0.80
1.00
1.20
1.40
IT 1A--L
ong Hea
vy Turf
Drag
IT 1B--L
ong Hea
vy Turf
Drag (m
od)
IT 2--Long Tine (
0.75-i
n spac
ing, 0.12
5-in dep
th), no pret
exture
IT 3--Long D
G (no ja
cks),
0.23
5-in sp
acing (0
.11-in
spac
ers)
IT 5A--L
ong Tine (0.7
5-in sp
acing, 0
.125-i
n depth), t
urf drag
IT 5A--L
ong Tine (0.7
5-in sp
acing, 0
.125-i
n depth), h
eavy
turf
drag
IT 6--Long Tine (
0.75-i
n spac
ing, 0.07
5-in dep
th), turf
drag
IT 7--Long G
roove
(0.75
-in sp
acing, 0
.25-in
depth), b
urlap drag
IT 8--Long G
roove
(0.75
-in sp
acing, 0
.25-in
depth), t
urf drag
IT 9--Tran
Tine (0.5
-in sp
acing, 0
.125-i
n depth), b
urlap drag
(GA des
ign)
IT 10--T
ran Tine (
random sp
acing, 0
.125-i
n depth), b
urlap drag
IT 11--T
ran Tine (
1.0-in
spac
ing, 0.12
5-in dep
th), burla
p drag (o
ld ISTHA...
IT 12--T
ran Ske
w Tine (ran
dom spac
ing, 0.12
5-in dep
th), turf
drag (n
e...
Hig
h-Sp
eed
Prof
iler M
PD, m
m (R
WP)
Bars represent Mean ± 1 Std Dev
0.00
0.20
0.40
0.60
0.80
1.00
1.20
1.40
1.60
IT 1A--L
ong Hea
vy Turf
Drag
IT 1B--L
ong Hea
vy Turf
Drag (m
od)
IT 2--Long Tine (
0.75-i
n spac
ing, 0.12
5-in dep
th), no pret
exture
IT 3--Long D
G (no ja
cks),
0.23
5-in sp
acing (0
.11-in
spac
ers)
IT 5A--L
ong Tine (0.7
5-in sp
acing, 0
.125-i
n depth), t
urf drag
IT 5A--L
ong Tine (0.7
5-in sp
acing, 0
.125-i
n depth), h
eavy
turf
drag
IT 6--Long Tine (
0.75-i
n spac
ing, 0.07
5-in dep
th), turf
drag
IT 7--Long G
roove
(0.75
-in sp
acing, 0
.25-in
depth), b
urlap drag
IT 8--Long G
roove
(0.75
-in sp
acing, 0
.25-in
depth), t
urf drag
IT 9--Tran
Tine (0.5
-in sp
acing, 0
.125-i
n depth), b
urlap drag
(GA des
ign)
IT 10--T
ran Tine (
random sp
acing, 0
.125-i
n depth), b
urlap drag
IT 11--T
ran Tine (
1.0-in
spac
ing, 0.12
5-in dep
th), burla
p drag (o
ld IS...
IT 12--T
ran Ske
w Tine (ran
dom spac
ing, 0.12
5-in dep
th), turf
drag (n
e...
Hig
h-Sp
eed
Prof
iler M
PD, m
m (L
C)
Bars represent Mean ± 1 Std Dev

E-2
Figure E-3. CT Meter texture depth results (MPD right wheelpath) for new texture test sections.
Figure E-4. CT Meter texture depth results (MPD lane center) for new texture test sections.
0.00
0.20
0.40
0.60
0.80
1.00
1.20
1.40
1.60
1.80
IT 1A--L
ong Hea
vy Turf
Drag
IT 1B--L
ong Hea
vy Turf
Drag (m
od)
IT 2--Long Tine (
0.75-i
n spac
ing, 0.12
5-in dep
th), no pret
exture
IT 3--Long D
G (no ja
cks),
0.23
5-in sp
acing (0
.11-in
spac
ers)
IT 5A--L
ong Tine (0.7
5-in sp
acing, 0
.125-i
n depth), t
urf drag
IT 5A--L
ong Tine (0.7
5-in sp
acing, 0
.125-i
n depth), h
eavy
turf
drag
IT 6--Long Tine (
0.75-i
n spac
ing, 0.07
5-in dep
th), turf
drag
IT 7--Long G
roove
(0.75
-in sp
acing, 0
.25-in
depth), b
urlap drag
IT 8--Long G
roove
(0.75
-in sp
acing, 0
.25-in
depth), t
urf drag
IT 9--Tran
Tine (0.5
-in sp
acing, 0
.125-i
n depth), b
urlap drag
(GA des
ign)
IT 10--T
ran Tine (
random sp
acing, 0
.125-i
n depth), b
urlap drag
IT 11--T
ran Tine (
1.0-in
spac
ing, 0.12
5-in dep
th), burla
p drag (o
ld ISTHA...
IT 12--T
ran Ske
w Tine (ran
dom spac
ing, 0.12
5-in dep
th), turf
drag (n
e...
CT
Met
er M
PD, m
m (R
WP)
Bars represent Mean ± 1 Std Dev
0.00
0.20
0.40
0.60
0.80
1.00
1.20
1.40
1.60
IT 1A--L
ong Hea
vy Turf
Drag
IT 1B--L
ong Hea
vy Turf
Drag (m
od)
IT 2--Long Tine (
0.75-i
n spac
ing, 0.12
5-in dep
th), no pret
exture
IT 3--Long D
G (no ja
cks),
0.23
5-in sp
acing (0
.11-in
spac
ers)
IT 5A--L
ong Tine (0.7
5-in sp
acing, 0
.125-i
n depth), t
urf drag
IT 5A--L
ong Tine (0.7
5-in sp
acing, 0
.125-i
n depth), h
eavy
turf
drag
IT 6--Long Tine (
0.75-i
n spac
ing, 0.07
5-in dep
th), turf
drag
IT 7--Long G
roove
(0.75
-in sp
acing, 0
.25-in
depth), b
urlap drag
IT 8--Long G
roove
(0.75
-in sp
acing, 0
.25-in
depth), t
urf drag
IT 9--Tran
Tine (0.5
-in sp
acing, 0
.125-i
n depth), b
urlap drag
(GA des
ign)
IT 10--T
ran Tine (
random sp
acing, 0
.125-i
n depth), b
urlap drag
IT 11--T
ran Tine (
1.0-in
spac
ing, 0.12
5-in dep
th), burla
p drag (o
ld ISTHA...
IT 12--T
ran Ske
w Tine (ran
dom spac
ing, 0.12
5-in dep
th), turf
drag (n
e...
CT
Met
er M
PD, m
m (L
C)
Bars represent Mean ± 1 Std Dev

E-3
Figure E-5. CT Meter RMS results (right wheelpath and lane center) for new texture test sections.
Figure E-6. CT Meter TR results (right wheelpath and lane center) for new texture test sections.
0.00
0.20
0.40
0.60
0.80
1.00
1.20
1.40
1.60
1.80
IT 1A--L
ong Hea
vy Turf
Drag
IT 1B--L
ong Hea
vy Turf
Drag (m
od)
IT 2--Long Tine (
0.75-i
n spac
ing, 0.12
5-in dep
th), no pret
exture
IT 3--Long D
G (no ja
cks),
0.23
5-in sp
acing (0
.11-in
spac
ers)
IT 5A--L
ong Tine (0.7
5-in sp
acing, 0
.125-i
n depth), t
urf drag
IT 5A--L
ong Tine (0.7
5-in sp
acing, 0
.125-i
n depth), h
eavy
turf
drag
IT 6--Long Tine (
0.75-i
n spac
ing, 0.07
5-in dep
th), turf
drag
IT 7--Long G
roove
(0.75
-in sp
acing, 0
.25-in
depth), b
urlap drag
IT 8--Long G
roove
(0.75
-in sp
acing, 0
.25-in
depth), t
urf drag
IT 9--Tran
Tine (0.5
-in sp
acing, 0
.125-i
n depth), b
urlap drag
(GA des
ign)
IT 10--T
ran Tine (
random sp
acing, 0
.125-i
n depth), b
urlap drag
IT 11--T
ran Tine (
1.0-in
spac
ing, 0.12
5-in dep
th), burla
p drag (o
ld IS...
IT 12--T
ran Ske
w Tine (ran
dom spac
ing, 0.12
5-in dep
th), turf
drag (n
e...
CT
Met
er R
MS
0.00
0.50
1.00
1.50
2.00
2.50
IT 1A--L
ong Hea
vy Turf
Drag
IT 1B--L
ong Hea
vy Turf
Drag (m
od)
IT 2--Long Tine (
0.75-i
n spac
ing, 0.12
5-in dep
th), no pret
exture
IT 3--Long D
G (no ja
cks),
0.23
5-in sp
acing (0
.11-in
spac
ers)
IT 5A--L
ong Tine (0.7
5-in sp
acing, 0
.125-i
n depth), t
urf drag
IT 5B--L
ong Tine (0.7
5-in sp
acing, 0
.125-i
n depth), h
eavy
turf
drag
IT 6--Long Tine (
0.75-i
n spac
ing, 0.07
5-in dep
th), turf
drag
IT 7--Long G
roove
(0.75
-in sp
acing, 0
.25-in
depth), b
urlap drag
IT 8--Long G
roove
(0.75
-in sp
acing, 0
.25-in
depth), t
urf drag
IT 9--Tran
Tine (0.5
-in sp
acing, 0
.125-i
n depth), b
urlap drag
(GA des
ign)
IT 10--T
ran Tine (
random sp
acing, 0
.125-i
n depth), b
urlap drag
IT 11--T
ran Tine (
1.0-in
spac
ing, 0.12
5-in dep
th), burla
p drag (o
ld IS...
IT 12--T
ran Ske
w Tine (ran
dom spac
ing, 0.12
5-in dep
th), turf
drag (n
e...
CT
Met
er T
extu
re R
atio
(MPD
/RM
S)

E-4
Figure E-7. Comparison of high-speed profiler EMTD and CT Meter MTD results (right wheelpath and lane center) for new texture test sections.
Figure E-8. DF Tester friction/micro-texture results (DFT(20) right wheelpath) for new texture test sections.
0.00
0.20
0.40
0.60
0.80
1.00
1.20
1.40
IT 1A--L
ong Hea
vy Turf
Drag
IT 1B--L
ong Hea
vy Turf
Drag (m
od)
IT 2--Long Tine (
0.75-i
n spac
ing, 0.12
5-in dep
th), no pret
exture
IT 3--Long D
G (no ja
cks),
0.23
5-in sp
acing (0
.11-in
spac
ers)
IT 5A--L
ong Tine (0.7
5-in sp
acing, 0
.125-i
n depth), t
urf drag
IT 5A--L
ong Tine (0.7
5-in sp
acing, 0
.125-i
n depth), h
eavy
turf
drag
IT 6--Long Tine (
0.75-i
n spac
ing, 0.07
5-in dep
th), turf
drag
IT 7--Long G
roove
(0.75
-in sp
acing, 0
.25-in
depth), b
urlap drag
IT 8--Long G
roove
(0.75
-in sp
acing, 0
.25-in
depth), t
urf drag
IT 9--Tran
Tine (0.5
-in sp
acing, 0
.125-i
n depth), b
urlap drag
(GA ...
IT 10--T
ran Tine (
random sp
acing, 0
.125-i
n depth), b
urlap drag
IT 11--T
ran Tine (
1.0-in
spac
ing, 0.12
5-in dep
th), burla
p drag (o
l...
IT 12--T
ran Ske
w Tine (ran
dom spac
ing, 0.12
5-in dep
th), turf
dra...
Mea
n Te
xtur
e D
epth
, mm
High-Speed Profiler EMTD CT Meter MTD
0.00
10.00
20.00
30.00
40.00
50.00
60.00
70.00
IT 1A--L
ong Hea
vy Turf
Drag
IT 1B--L
ong Hea
vy Turf
Drag (m
od)
IT 2--Long Tine (
0.75-i
n spac
ing, 0.12
5-in dep
th), no pret
exture
IT 3--Long D
G (no ja
cks),
0.23
5-in sp
acing (0
.11-in
spac
ers)
IT 5A--L
ong Tine (0.7
5-in sp
acing, 0
.125-i
n depth), t
urf drag
IT 5B--L
ong Tine (0.7
5-in sp
acing, 0
.125-i
n depth), h
eavy
turf
drag
IT 6--Long Tine (
0.75-i
n spac
ing, 0.07
5-in dep
th), turf
drag
IT 7--Long G
roove
(0.75
-in sp
acing, 0
.25-in
depth), b
urlap drag
IT 8--Long G
roove
(0.75
-in sp
acing, 0
.25-in
depth), t
urf drag
IT 9--Tran
Tine (0.5
-in sp
acing, 0
.125-i
n depth), b
urlap drag
(GA des
ign)
IT 10--T
ran Tine (
random sp
acing, 0
.125-i
n depth), b
urlap drag
IT 11--T
ran Tine (
1.0-in
spac
ing, 0.12
5-in dep
th), burla
p drag (o
ld ISTHA...
IT 12--T
ran Ske
w Tine (ran
dom spac
ing, 0.12
5-in dep
th), turf
drag (n
e...
DF
Test
er D
FT(2
0) (R
WP)
Bars represent Mean ± 1 Std Dev

E-5
Figure E-9. DF Tester friction/micro-texture results (DFT(20) lane center) for new texture
test sections (continued).
Figure E-10. IFI Friction Number F(60) values for new texture test sections.
0.00
5.00
10.00
15.00
20.00
25.00
30.00
35.00
40.00
45.00
IT 1A--L
ong Hea
vy Turf
Drag
IT 1B--L
ong Hea
vy Turf
Drag (m
od)
IT 2--Long Tine (
0.75-i
n spac
ing, 0.12
5-in dep
th), no pret
exture
IT 3--Long D
G (no ja
cks),
0.23
5-in sp
acing (0
.11-in
spac
ers)
IT 5A--L
ong Tine (0.7
5-in sp
acing, 0
.125-i
n depth), t
urf drag
IT 5A--L
ong Tine (0.7
5-in sp
acing, 0
.125-i
n depth), h
eavy
turf
drag
IT 6--Long Tine (
0.75-i
n spac
ing, 0.07
5-in dep
th), turf
drag
IT 7--Long G
roove
(0.75
-in sp
acing, 0
.25-in
depth), b
urlap drag
IT 8--Long G
roove
(0.75
-in sp
acing, 0
.25-in
depth), t
urf drag
IT 9--Tran
Tine (0.5
-in sp
acing, 0
.125-i
n depth), b
urlap drag
(GA...
IT 10--T
ran Tine (
random sp
acing, 0
.125-i
n depth), b
urlap drag
IT 11--T
ran Tine (
1.0-in
spac
ing, 0.12
5-in dep
th), burla
p drag (o
l...
IT 12--T
ran Ske
w Tine (ran
dom spac
ing, 0.12
5-in dep
th), turf
dr..
IFI F
rictio
n N
umbe
r F(6
0)
Based on DF Tester DFT(20) and High-Speed Profiler MPDBased on locked-wheel tester FN40S and high-speed profiler MPDBased on locked-wheel tester FN40R and high-speed profiler MPD
0.00
10.00
20.00
30.00
40.00
50.00
60.00
IT 1A--L
ong Hea
vy Turf
Drag
IT 1B--L
ong Hea
vy Turf
Drag (m
od)
IT 2--Long Tine (
0.75-i
n spac
ing, 0.12
5-in dep
th), no pret
exture
IT 3--Long D
G (no ja
cks),
0.23
5-in sp
acing (0
.11-in
spac
ers)
IT 5A--L
ong Tine (0.7
5-in sp
acing, 0
.125-i
n depth), t
urf drag
IT 5B--L
ong Tine (0.7
5-in sp
acing, 0
.125-i
n depth), h
eavy
turf
drag
IT 6--Long Tine (
0.75-i
n spac
ing, 0.07
5-in dep
th), turf
drag
IT 7--Long G
roove
(0.75
-in sp
acing, 0
.25-in
depth), b
urlap drag
IT 8--Long G
roove
(0.75
-in sp
acing, 0
.25-in
depth), t
urf drag
IT 9--Tran
Tine (0.5
-in sp
acing, 0
.125-i
n depth), b
urlap drag
(GA des
ign)
IT 10--T
ran Tine (
random sp
acing, 0
.125-i
n depth), b
urlap drag
IT 11--T
ran Tine (
1.0-in
spac
ing, 0.12
5-in dep
th), burla
p drag (o
ld ISTHA...
IT 12--T
ran Ske
w Tine (ran
dom spac
ing, 0.12
5-in dep
th), turf
drag (n
e...
DF
Test
er D
FT(2
0) (L
C)
Bars represent Mean ± 1 Std Dev

E-6
Figure E-11. Near-field noise results (SI right wheelpath) for new texture test sections.
Figure E-12. Near-field noise results (SI lane center) for new texture test sections.
98.00
99.00
100.00
101.00
102.00
103.00
104.00
105.00
106.00
107.00
IT 1A--L
ong Hea
vy Turf
Drag
IT 1B--L
ong Hea
vy Turf
Drag (m
od)
IT 2--Long Tine (
0.75-i
n spac
ing, 0.12
5-in dep
th), no pret
exture
IT 3--Long D
G (no ja
cks),
0.23
5-in sp
acing (0
.11-in
spac
ers)
IT 5A--L
ong Tine (0.7
5-in sp
acing, 0
.125-i
n depth), t
urf drag
IT 5A--L
ong Tine (0.7
5-in sp
acing, 0
.125-i
n depth), h
eavy
turf
drag
IT 6--Long Tine (
0.75-i
n spac
ing, 0.07
5-in dep
th), turf
drag
IT 7--Long G
roove
(0.75
-in sp
acing, 0
.25-in
depth), b
urlap drag
IT 8--Long G
roove
(0.75
-in sp
acing, 0
.25-in
depth), t
urf drag
IT 9--Tran
Tine (0.5
-in sp
acing, 0
.125-i
n depth), b
urlap drag
(GA des
ign)
IT 10--T
ran Tine (
random sp
acing, 0
.125-i
n depth), b
urlap drag
IT 11--T
ran Tine (
1.0-in
spac
ing, 0.12
5-in dep
th), burla
p drag (o
ld ISTHA...
IT 12--T
ran Ske
w Tine (ran
dom spac
ing, 0.12
5-in dep
th), turf
drag (n
e...
Nea
r-Fi
eld
SI, d
BA
(RW
P)
Bars represent Mean ± 1 Std Dev
97.00
98.00
99.00
100.00
101.00
102.00
103.00
104.00
105.00
106.00
IT 1A--L
ong Hea
vy Turf
Drag
IT 1B--L
ong Hea
vy Turf
Drag (m
od)
IT 2--Long Tine (
0.75-i
n spac
ing, 0.12
5-in dep
th), no pret
exture
IT 3--Long D
G (no ja
cks),
0.23
5-in sp
acing (0
.11-in
spac
ers)
IT 5A--L
ong Tine (0.7
5-in sp
acing, 0
.125-i
n depth), t
urf drag
IT 5A--L
ong Tine (0.7
5-in sp
acing, 0
.125-i
n depth), h
eavy
turf
drag
IT 6--Long Tine (
0.75-i
n spac
ing, 0.07
5-in dep
th), turf
drag
IT 7--Long G
roove
(0.75
-in sp
acing, 0
.25-in
depth), b
urlap drag
IT 8--Long G
roove
(0.75
-in sp
acing, 0
.25-in
depth), t
urf drag
IT 9--Tran
Tine (0.5
-in sp
acing, 0
.125-i
n depth), b
urlap drag
(GA des
ign)
IT 10--T
ran Tine (
random sp
acing, 0
.125-i
n depth), b
urlap drag
IT 11--T
ran Tine (
1.0-in
spac
ing, 0.12
5-in dep
th), burla
p drag (o
ld ISTHA...
IT 12--T
ran Ske
w Tine (ran
dom spac
ing, 0.12
5-in dep
th), turf
drag (n
e...
Nea
r-Fi
eld
SI, d
BA
(LC
)
Bars represent Mean ± 1 Std Dev
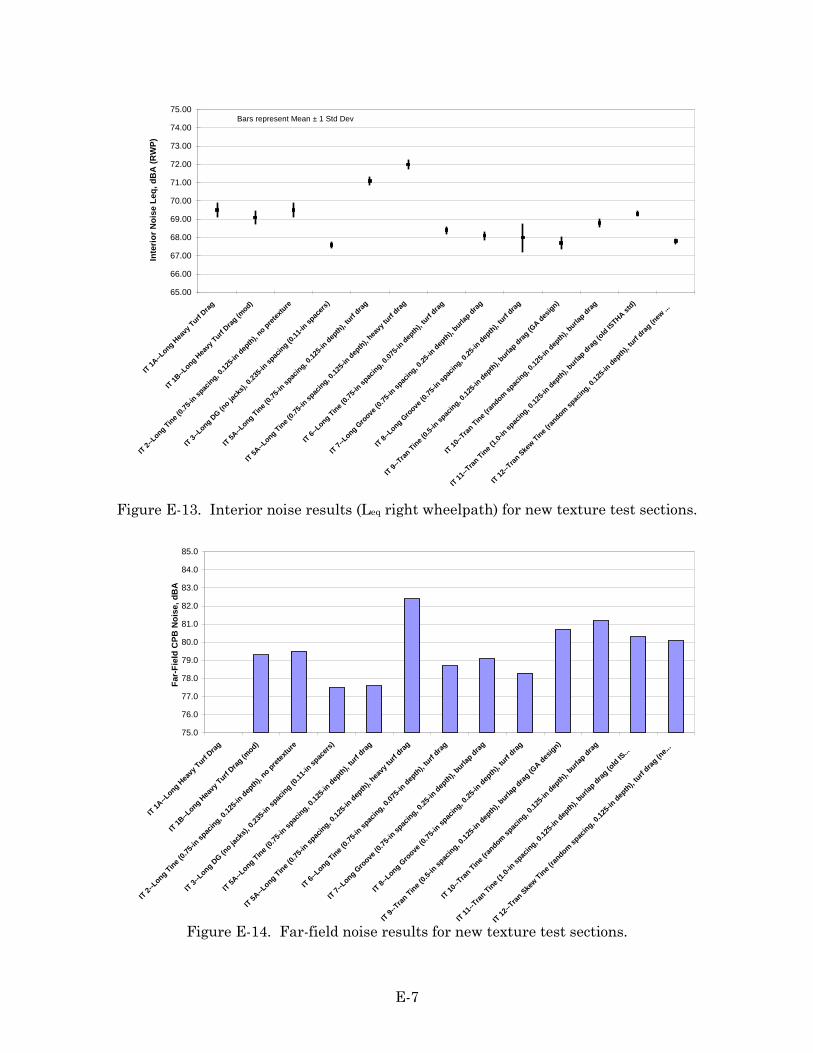
E-7
Figure E-13. Interior noise results (Leq right wheelpath) for new texture test sections.
Figure E-14. Far-field noise results for new texture test sections.
65.00
66.00
67.00
68.00
69.00
70.00
71.00
72.00
73.00
74.00
75.00
IT 1A--L
ong Hea
vy Turf
Drag
IT 1B--L
ong Hea
vy Turf
Drag (m
od)
IT 2--Long Tine (
0.75-i
n spac
ing, 0.12
5-in dep
th), no pret
exture
IT 3--Long D
G (no ja
cks),
0.23
5-in sp
acing (0
.11-in
spac
ers)
IT 5A--L
ong Tine (0.7
5-in sp
acing, 0
.125-i
n depth), t
urf drag
IT 5A--L
ong Tine (0.7
5-in sp
acing, 0
.125-i
n depth), h
eavy
turf
drag
IT 6--Long Tine (
0.75-i
n spac
ing, 0.07
5-in dep
th), turf
drag
IT 7--Long G
roove
(0.75
-in sp
acing, 0
.25-in
depth), b
urlap drag
IT 8--Long G
roove
(0.75
-in sp
acing, 0
.25-in
depth), t
urf drag
IT 9--Tran
Tine (0.5
-in sp
acing, 0
.125-i
n depth), b
urlap drag
(GA des
ign)
IT 10--T
ran Tine (
random sp
acing, 0
.125-i
n depth), b
urlap drag
IT 11--T
ran Tine (
1.0-in
spac
ing, 0.12
5-in dep
th), burla
p drag (o
ld ISTHA st
d)
IT 12--T
ran Ske
w Tine (ran
dom spac
ing, 0.12
5-in dep
th), turf
drag (n
ew ...
Inte
rior N
oise
Leq
, dB
A (R
WP)
Bars represent Mean ± 1 Std Dev
75.0
76.0
77.0
78.0
79.0
80.0
81.0
82.0
83.0
84.0
85.0
IT 1A--L
ong Hea
vy Turf
Drag
IT 1B--L
ong Hea
vy Turf
Drag (m
od)
IT 2--Long Tine (
0.75-i
n spac
ing, 0.12
5-in dep
th), no pret
exture
IT 3--Long D
G (no ja
cks),
0.23
5-in sp
acing (0
.11-in
spac
ers)
IT 5A--L
ong Tine (0.7
5-in sp
acing, 0
.125-i
n depth), t
urf drag
IT 5A--L
ong Tine (0.7
5-in sp
acing, 0
.125-i
n depth), h
eavy
turf
drag
IT 6--Long Tine (
0.75-i
n spac
ing, 0.07
5-in dep
th), turf
drag
IT 7--Long G
roove
(0.75
-in sp
acing, 0
.25-in
depth), b
urlap drag
IT 8--Long G
roove
(0.75
-in sp
acing, 0
.25-in
depth), t
urf drag
IT 9--Tran
Tine (0.5
-in sp
acing, 0
.125-i
n depth), b
urlap drag
(GA des
ign)
IT 10--T
ran Tine (
random sp
acing, 0
.125-i
n depth), b
urlap drag
IT 11--T
ran Tine (
1.0-in
spac
ing, 0.12
5-in dep
th), burla
p drag (o
ld IS...
IT 12--T
ran Ske
w Tine (ran
dom spac
ing, 0.12
5-in dep
th), turf
drag (n
e...
Far-
Fiel
d C
PB N
oise
, dB
A
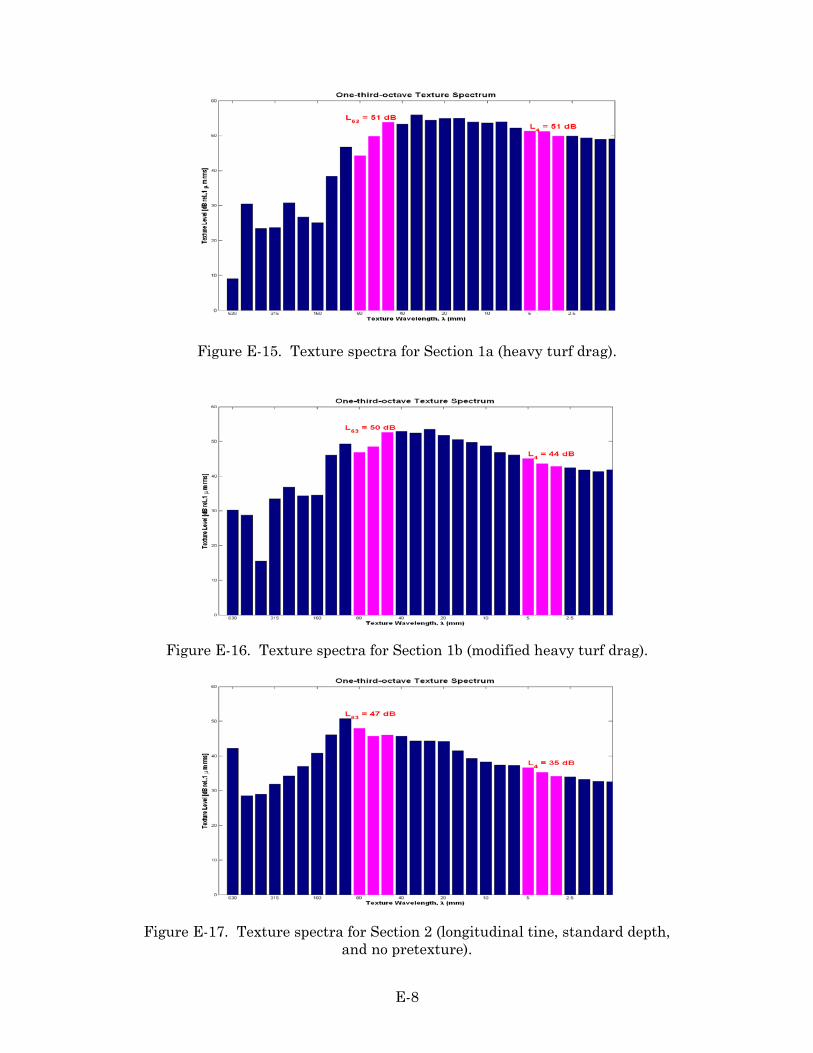
E-8
Figure E-15. Texture spectra for Section 1a (heavy turf drag).
Figure E-16. Texture spectra for Section 1b (modified heavy turf drag).
Figure E-17. Texture spectra for Section 2 (longitudinal tine, standard depth, and no pretexture).

E-9
Figure E-18. Texture spectra for Tollway Section 3 (longitudinal diamond grind).
Figure E-19. Texture spectra for Section 5a (longitudinal tine, standard depth, and heavy turf drag pretexture).
Figure E-20. Texture spectra for Section 5b (longitudinal tine, standard depth, and heavy
turf drag pretexture).

E-10
Figure E-21. Texture spectra for Section 6 (longitudinal tine, shallow depth, and standard turf drag pretexture).
Figure E-22. Texture spectra for Section 7 (longitudinal groove and burlap drag).
Figure E-23. Texture spectra for Section 8 (longitudinal groove and standard turf drag).

E-11
Figure E-24. Texture spectra for Section 9 (uniformly spaced transverse tine, burlap drag).
Figure E-25. Texture spectra for Section 10 (variably spaced transverse tine, burlap drag).
Figure E-26. Texture spectra for Section 11 (uniformly spaced transverse tine, burlap drag).

E-12
Figure E-27. Texture spectra for Section 12 (variably spaced transverse skewed tine, burlap drag).

APPENDIX F. SAMPLE/GUIDE SPECIFICATIONS FOR
TEXTURE


F-1
F1. TEXTURING PCC PAVEMENT WITH HEAVY TURF DRAG F1.01 Description. Texturing shall be obtained solely by the use of a heavy artificial turf drag applied to the concrete in a plastic state. The mean texture depth (MTD) shall be greater than or equal to 0.04 in (1 mm) (Minnesota Astroturf Texture). F1.02 Materials. The turf used shall be made of molded polyethylene with a blade length of 0.625 to 1.000 in (16 to 25 mm) and a minimum weight of 70 oz/yd2 (2.373 kg/m2). The backing shall be a strong, durable material not subject to rot, and shall be adequately bonded to the facing to withstand use as specified. The turf drag shall be a single seamless piece of turf of sufficient length to span the full width of the pavement being placed and adjustable so as to have up to a 4-ft (1.2-m) longitudinal length of turf (parallel to the pavement centerline) in contact with the concrete being placed. F1.03 Equipment. The drag shall be suitably attached to an approved device that will permit control of the time and rate of texturing. F1.04 Construction. The drag shall be operated in a longitudinal direction so as to produce a uniform appearing finish, meeting the approval of the Engineer. Where construction operations necessitate and with the approval of the Engineer, the length and width of the turf may be varied. If necessary, for maintaining intimate contact with the pavement surface and obtaining adequate texture, the drag may be weighted using lumber, rebar, or other suitable ballast material. The weight shall be evenly distributed throughout the width of the drag to provide a uniform texture. If the texturing operation generates significant snagging and dragging of aggregate that results in a harsh, non-uniform surface, the operation shall be suspended and appropriate adjustments made. F1.05 Quality. The completed texture shall have an appearance similar to those shown in figure F-1. The texture depth shall be measured on the completed surface shortly after the textured surface has hardened. The texture shall be tested in accordance with ASTM E 965 (“Test Method for Measuring Surface Macro-texture Depth Using a Sand Volumetric Technique”) or ASTM E 2157 (“Test Method for Measuring Pavement Macro-texture Properties Using the Circular Track Meter”). The average MTD of all tests performed shall be equal to or greater than 0.04 in (1 mm). If the average MTD is less than 0.04 in (1 mm), but equal to or greater than 0.03 in (0.8 mm), the texture will be accepted as substantial compliance but the Contractor shall amend the texturing operation to achieve the required 0.04-in (1-mm) texture depth. If the texture does need meet specifications, the contractor is directed to diamond grind the affected area and immediately adjust the on-going Astro-turf drag operation. F1.06 Measurement. The completed texture will be measured and accepted for payment in accordance with the quantity of PCC pavement constructed and measured by the Engineer. F1.07 Payment. Payment shall be made in accordance with the contract unit price for PCC pavement.

F-2
Figure F-1. Texture developed by heavy turf drag.

F-3
F2. TEXTURING PCC PAVEMENT WITH TRANSVERSE SKEWED VARIABLE TINING F2.01 Description. Texturing of the plastic concrete shall be obtained by the use of an artificial turf drag followed immediately by a mechanically operated metal comb transverse tining device. The finished surface shall have transverse skewed tining with variable spacing and a depth of _____ in (____mm) (typically 0.125 in [3.2-mm]). (Optional) In addition, the completed texture shall have a mean texture depth (MTD) of between _____ and _____in (_____ and _____ mm). F2.02 Materials. The artificial turf shall be made of molded polyethylene with synthetic turf blades approximately 0.85 in (21.6 mm) long and contain approximately 64,800 blades/yd2 (77,500 blades/m2). The artificial turf carpet shall be full pavement width and of sufficient size that during the finishing operations, approximately 2 ft (0.6 m) of the carpet parallel to the pavement centerline will be in contact with the pavement surface. The burlap drag shall be at least 4 ft (1.2 m) wide and 2 ft (0.6 m) longer than the width of the pavement under construction with approximately 2 ft (0.6 m) of its width in contact with the pavement surface. The turf drag shall be operated in a longitudinal direction so as to produce a uniform appearing finish meeting the approval of the Engineer. If necessary for maintaining intimate contact with the pavement surface, the drag may be weighted using lumber, rebar, or other suitable material. F2.03 Equipment. The turf drag shall be suitably attached to an approved device that will permit control of the time and rate of texturing. The metal tining comb shall consist of a single line of tempered spring steel tines spaced variably between _____ and _____in (_____ and _____mm) as shown in Table F-2, securely mounted in a suitable head. The tines shall be flat and of a size and stiffness sufficient to produce a groove of the specified dimensions in the plastic concrete without tearing of the pavement edge or surface. The Contractor shall modify the equipment or operations if an acceptable pavement edge or surface is not produced. The mechanically operated metal comb shall be attached to an exclusive piece of equipment which is mechanically self-propelled and capable of traversing the entire pavement width being placed in a single pass. The drag may be attached to this piece of equipment provided a surface texture is produced satisfactory to the Engineer.
Table F-2. Metal comb tine spacing (inches, center to center) (read from left to right). 1 in = 25.4 mm

F-4
F2.04 Construction. The tining device shall be operated so as to produce a variably spaced pattern of grooves _____ in (_____mm) deep and 0.125 in (3.2 mm) wide across the pavement. The tining device shall be operated at a _____ skew (typically 1:6) across the pavement. The tining finish shall not be performed too early whereby the grooves may close up, nor too late such that proper depth cannot be achieved. The tining grooves shall be neat in appearance, parallel with each other, uniform in depth, and in accordance with what is shown in the plans and these specifications. No other operation will be permitted with this equipment. Separate passes will be required for the dragging operation and the tining operation. F2.05 Quality. The completed texture shall have an appearance similar to those shown in figure F-2. Random quality control (QC) checks of tine groove depths shall be made throughout the paving process using a standard commercial tire tread depth gauge. The measurements shall be taken at random locations in the fresh concrete behind the tining operation. In taking the measurements, the base of the depth gauge must be pressed down to the true level of the PCC surface, and the plunger must then be depressed until contact is made with the groove bottom. Depth readings shall be made to the nearest 0.04 in (1 mm). If two consecutive depth readings fall outside the specified limits, adjustments shall be made by the contractor to bring the tining operation back into compliance.
Figure F-2. Transverse skewed variable tine.

F-5
Quality Assurance (QA) tests of the tining texture produced in each paving run shall be conducted on hardened concrete at a minimum of five randomly selected locations. These tests shall consist of any of the three methods described below:
• Groove depth measurements—At each selected location, a minimum of five measurements shall be taken diagonally across the pavement surface using a standard commercial tire tread depth gauge (surface mortar deposits shall be removed, as necessary, prior to each measurement). The average depth of the five or more measurements shall be computed. If the average depth at any one location is outside the specified tining depth limits, two additional sets of measurements shall be made in the vicinity to ascertain non-compliance and the type of non-compliance (i.e., consistently too shallow or too deep). Any area that does not meet the specified minimum tine depth shall be subject to corrective action. Any area that exceeds the specified maximum tine depth shall be subject to a price adjustment or corrective action.
• Sand patch texture depth measurements (ASTM E 965)—At each selected location, a minimum of two sand patch tests shall be performed at diagonal points across the pavement. The MTD from each test shall be determined and then averaged. If the average MTD at any one location is outside the specified texture depth limits, two additional tests shall be conducted in the vicinity to ascertain non-compliance and the type of non-compliance (i.e., consistently too shallow or too deep). Any area that does not meet the specified minimum MTD shall be subject to corrective action. Any area that exceeds the specified maximum MTD shall be subject to a price adjustment or corrective action.
• CT Meter texture depth measurements (ASTM E 2157)—At each selected location, a minimum of three CT Meter tests shall be performed at diagonal points across the pavement. The mean texture depth (MTD) from each test shall be determined and then averaged. If the average MTD at any one location is outside the specified texture depth limits, two additional tests shall be conducted in the vicinity to ascertain non-compliance and the type of non-compliance (i.e., consistently too shallow or too deep). Any area that does not meet the specified minimum MTD shall be subject to corrective action. Any area that exceeds the specified maximum MTD shall be subject to a price adjustment or corrective action.
F2.06 Measurement. The completed texture will be measured and accepted for payment in accordance with the quantity of PCC pavement constructed and measured by the Engineer. F2.07 Payment. Payment shall be made in accordance with the contract unit price for PCC pavement, with the exception of possible price adjustments made for areas exceeding the specified maximum tine groove depth or MTD.

F-6
F3. TEXTURING PCC PAVEMENT WITH LONGITUDINAL TINING F3.01 Description. Texturing of the plastic concrete shall be obtained by the use of an artificial turf drag followed immediately by a mechanically operated metal comb longitudinal tining device. The finished surface shall have longitudinal tining of _____-in (_____-mm) (typically 0.75-in [19-mm]) uniform spacing and a depth of _____ in (____mm) (typically 0.125 in [3.2-mm]). (Optional) In addition, the completed texture shall have a mean texture depth (MTD) of between _____ and _____in (_____ and _____ mm). F3.02 Materials. The artificial turf shall be made of molded polyethylene with synthetic turf blades approximately 0.85 in (21.6-mm) long and contain approximately 64,800 blades/yd2 (77,500 blades/m2). The drag shall be suitably attached to an approved device that will permit control of the time and rate of texturing. The artificial turf shall be full pavement width and of sufficient size that during the finishing operations, approximately 2 ft (0.6 m) of the turf parallel to the pavement centerline will be in contact with the pavement surface. The drag shall be operated in a longitudinal direction so as to produce a uniform appearing finish meeting the approval of the Engineer. If necessary for maintaining intimate contact with the pavement surface, the drag may be weighted using lumber, rebar, or other suitable material. F3.03 Equipment. The turf drag shall be suitably attached to an approved device that will permit control of the time and rate of texturing. The metal tining comb shall consist of a single line of tempered spring steel tines spaced at _____ in (_____mm) centers (typically 0.75 in [19-mm]) and securely mounted in a suitable head. The tines shall be flat and of a size and stiffness sufficient to produce a groove of the specified dimensions in the plastic concrete without tearing of the pavement edge or surface. The Contractor shall modify the equipment or operations if an acceptable pavement edge or surface is not produced. The mechanically operated metal comb shall be attached to an exclusive piece of equipment which is mechanically self-propelled. F3.04 Construction. The tining device shall be operated to as to produce a relatively uniform pattern of grooves parallel to the pavement centerline spaced at _____-in (_____-mm) centers (typically 0.75 in [19 mm]), _____ in (____mm) deep (typically 0.125 in [3.2-mm]), and 0.125 in (3.2 mm) wide. Longitudinal tining shall stop at the edge of travel lanes. Tining devices shall be maintained clean and free from encrusted mortar and debris to ensure uniform groove dimensions. The tining finish shall not be performed too early whereby the grooves may close up, nor too late such that proper depth cannot be achieved. The tining grooves shall be neat in appearance, parallel with the longitudinal joint, uniform in depth and in accordance with what is shown in the plans and these specifications. F3.05 Quality. The completed texture shall have an appearance similar to those shown in figure F-3.

F-7
Figure F-3. Longitudinal tining with uniform spacing. Random quality control (QC) checks of tine groove depths shall be made throughout the paving process using a standard commercial tire tread depth gauge. The measurements shall be taken at random locations in the fresh concrete behind the tining operation. In taking the measurements, the base of the depth gauge must be pressed down to the true level of the PCC surface, and the plunger must then be depressed until contact is made with the groove bottom. Depth readings shall be made to the nearest 0.04 in (1 mm). If two consecutive depth readings fall outside the specified limits, adjustments shall be made by the contractor to bring the tining operation back into compliance. Quality Assurance (QA) tests of the tining texture produced in each paving run shall be conducted on hardened concrete at a minimum of five randomly selected locations. These tests shall consist of any of the three methods described below:
• Groove depth measurements—At each selected location, a minimum of five measurements shall be taken diagonally across the pavement surface using a standard commercial tire tread depth gauge (surface mortar deposits shall be removed, as necessary, prior to each measurement). The average depth of the five or more measurements shall be computed. If the average depth at any one location is outside the specified tining depth limits, two additional sets of measurements shall be made in the vicinity to ascertain non-compliance and the type of non-compliance (i.e., consistently too shallow or too deep). Any area that does not meet the specified minimum tine depth shall be subject to corrective action. Any area that exceeds the specified maximum tine depth shall be subject to a price adjustment or corrective action.

F-8
• Sand patch texture depth measurements (ASTM E 965)—At each selected location, a minimum of two sand patch tests shall be performed at diagonal points across the pavement. The MTD from each test shall be determined and then averaged. If the average MTD at any one location is outside the specified texture depth limits, two additional tests shall be conducted in the vicinity to ascertain non-compliance and the type of non-compliance (i.e., consistently too shallow or too deep). Any area that does not meet the specified minimum MTD shall be subject to corrective action. Any area that exceeds the specified maximum MTD shall be subject to a price adjustment or corrective action.
• CT Meter texture depth measurements (ASTM E 2157)—At each selected location, a minimum of three CT Meter tests shall be performed at diagonal points across the pavement. The mean texture depth (MTD) from each test shall be determined and then averaged. If the average MTD at any one location is outside the specified texture depth limits, two additional tests shall be conducted in the vicinity to ascertain non-compliance and the type of non-compliance (i.e., consistently too shallow or too deep). Any area that does not meet the specified minimum MTD shall be subject to corrective action. Any area that exceeds the specified maximum MTD shall be subject to a price adjustment or corrective action.
F3.06 Measurement. The completed texture will be measured and accepted for payment in accordance with the quantity of PCC pavement constructed and measured by the Engineer. F3.07 Payment. Payment shall be made in accordance with the contract unit price for PCC pavement, with the exception of possible price adjustments made for areas exceeding the specified maximum tine groove depth or MTD.

F-9
F4. TEXTURING PCC PAVEMENT WITH LONGITUDINAL DIAMOND GRINDING F4.01 Description. Texturing shall be obtained by diamond grinding the hardened concrete with a mechanical cutting device. The finished surface shall have longitudinal grooves with a center-to-center spacing of ______in (_____mm) (typically between 0.230 and 0.250 in [5.8 and 6.4 mm]) and corresponding land-width spacing of _____in (_____mm) (typically between 0.105 and 0.125 in [2.7 and 3.2 mm]). (Optional) In addition, the completed texture shall have a mean texture depth (MTD) of between _____ and _____in (_____ and _____ mm). If the diamond ground texture is to be applied to new concrete pavement, no pre-texturing of the plastic concrete need be performed. F4.02 Materials. F4.03 Equipment. The equipment shall be power-driven, self-propelled machines equipped with diamond blades specifically designed to grind and texture hardened concrete. The grinder shall have a depth control device that will detect variations in the concrete surface and adjust the cutting head height to maintain the depth of grind specified. The grinding machine shall be equipped with devices to control alignment. The equipment must be able to grind the surface of the pavement to the textures specified herein, without causing excessive raveling of the joints, and without cracking or fracturing the aggregates. F4.04 Construction. Grinding shall be performed in a longitudinal direction and shall begin and end at lines normal to the pavement centerline in any section, unless otherwise specified in the contract. The profile grinding operation shall proceed in a manner that produces a uniform finished surface. The slurry resulting from the work shall be removed in a continuous operation. The slurry shall not be permitted to flow into gutters or other drainage facilities. Pavement must be immediately left in a washed clean condition, free of all slipperiness from the slurry, etc. All debris and surplus material removed from the grinding operations shall be deposited in a truck or other conveyance and removed from the project. The slurry shall not be disposed of in the existing drains or on the slopes of the roadway, but must be removed from the project and disposed of by the Contractor. The grinding machine shall be operated so as to produce a relatively uniform pattern of grooves parallel to the pavement centerline spaced on centers at ______in (_____mm) (typically between 0.230 and 0.250 in [5.8 and 6.4 mm]). The Contractor shall be responsible for determining the appropriate number of grooves per unit width to be used to produce the specified surface requirements. The texture shall contain parallel longitudinal corrugations that present a narrow ridge corduroy type appearance. The peaks of the ridges shall be approximately 0.06 in (1.6 mm) higher than the bottom of the grooves. The grooves shall be 0.125 in (3.2 mm) wide. The land width between the grooves shall be ______in (_____mm) (typically between 0.105 and 0.125 in [2.7 and 3.2 mm]). The selected area of pavement specified to be ground, shall have not less than 95 percent of its area actually ground. Any portion of the selected area not ground, shall be due only to irregularities in the pavement surface and for no other reason.

F-10
F4.05 Quality. The completed texture shall have an appearance similar to those shown in figure F-4. Joints and random cracks shall be visually inspected to ensure that spalling does not occur as a result of the grinding operation. If spalling is observed, actions shall be taken immediately to prevent further spalling.
Figure F-4. Longitudinal diamond ground surface texture. Random quality control (QC) checks of the cut grooves shall be made throughout the grinding process using a standard commercial tire tread depth gauge. The measurements shall be taken at random locations behind the grinding operation. Depth readings shall be made to the nearest 0.04 in (1 mm). If two consecutive depth readings fall outside the specified limits, adjustments shall be made by the contractor to bring the grinding operation back into compliance. Quality Assurance (QA) tests of the diamond ground texture shall be conducted at a minimum of five randomly selected locations. These tests shall consist of any of the three methods described below:
• Groove depth measurements—At each selected location, a minimum of five measurements shall be taken diagonally across the pavement surface using a standard commercial tire tread depth gauge. The average depth of the five or more measurements shall be computed. If the average depth at any one location is outside the specified groove depth limits, two additional sets of measurements shall be made in the vicinity to ascertain non-compliance and the type of non-compliance (i.e., consistently too shallow or too deep). Any area that does not meet the specified

F-11
minimum groove depth shall be subject to corrective action. Any area that exceeds the specified maximum groove depth shall be subject to a price adjustment or corrective action.
• Sand patch texture depth measurements (ASTM E 965)—At each selected location, a minimum of three sand patch tests shall be performed at diagonal points across the pavement. The MTD from each test shall be determined and then averaged. If the average MTD at any one location is outside the specified texture depth limits, two additional tests shall be conducted in the vicinity to ascertain non-compliance and the type of non-compliance (i.e., consistently too shallow or too deep). Any area that does not meet the specified minimum MTD shall be subject to corrective action. Any area that exceeds the specified maximum MTD shall be subject to a price adjustment or corrective action.
• CT Meter texture depth measurements (ASTM E 2157)—At each selected location, a minimum of three CT Meter tests shall be performed at diagonal points across the pavement. The mean texture depth (MTD) from each test shall be determined and then averaged. If the average MTD at any one location is outside the specified texture depth limits, two additional tests shall be conducted in the vicinity to ascertain non-compliance and the type of non-compliance (i.e., consistently too shallow or too deep). Any area that does not meet the specified minimum MTD shall be subject to corrective action. Any area that exceeds the specified maximum MTD shall be subject to a price adjustment or corrective action.
F4.06 Measurement. Diamond grinding of concrete pavement will be measured by the square yard (square meter). F4.07 Payment. Diamond grinding of concrete pavement will be paid for at the contract unit price per square yard (square meter), with the exception of possible price adjustments made for areas exceeding the specified maximum groove depth or MTD.

F-12
F5. TEXTURING PCC PAVEMENT WITH LONGITUDINAL GROOVING F5.01 Description. Texturing shall be obtained by longitudinal grooving of the hardened concrete using a mechanical cutting device. The finished surface shall have longitudinal grooves at ______-in (_____-mm) (typically 0.75 in [19 mm]) spacing and a depth of ______in (_____mm) (typically 0.25 in [6.4 mm]). (Optional) In addition, the completed texture shall have a mean texture depth (MTD) of between _____ and _____in (_____ and _____ mm). If the longitudinal groove texture is to be applied to new concrete pavement, burlap or turf drag pre-texturing of the plastic concrete shall be performed. F5.02 Materials. F5.03 Equipment. The grooving equipment shall be power-driven, self-propelled machines equipped with diamond blades specifically designed to groove and texture hardened concrete. The machine shall have a depth control device that will detect variations in the concrete surface and adjust the cutting head height to maintain the depth of groove specified. The equipment must be able to groove the surface of the pavement to the textures specified herein, without causing excessive raveling of the joints, and without cracking or fracturing the aggregates. F5.04 Construction. Grooving shall be performed in a longitudinal direction and shall begin and end at lines normal to the pavement centerline, unless otherwise specified in the contract. The slurry resulting from the work shall be removed in a continuous operation. The slurry shall not be permitted to flow into gutters or other drainage facilities. Pavement must be immediately left in a washed clean condition, free of all slipperiness from the slurry, etc. All debris and surplus material removed from the grooving operations shall be deposited in a truck or other conveyance and removed from the project. The slurry shall not be disposed of in the existing drains or on the slopes of the roadway, but must be removed from the project and disposed of by the Contractor. The grooving machine shall be operated so as to produce a relatively uniform pattern of grooves parallel to the pavement centerline spaced at approximately _____in (_____mm) centers (typically 0.75-in [19-mm]), _____in (_____mm) deep (typically 0.25 in [6.4 mm]), and _____in (_____mm) wide (typically 0.125 in [3.2 mm]). The selected area of pavement specified to be grooved, shall have not less than 95 percent of its area actually grooved. Any portion of the selected area not grooved, shall be due only to irregularities in the pavement surface and for no other reason. F5.05 Quality. The completed texture shall have an appearance similar to those shown in figure F-5. Joints and random cracks shall be visually inspected to ensure that spalling does not occur as a result of the grooving operation. If spalling is observed, actions shall be taken immediately to prevent further spalling.

F-13
Figure F-5. Longitudinally grooved surface texture with uniform spacing. Random quality control (QC) checks of the cut grooves shall be made throughout the paving process using a standard commercial tire tread depth gauge. The measurements shall be taken at random locations behind the grooving operation. Depth readings shall be made to the nearest 0.04 in (1 mm). If two consecutive depth readings fall outside the specified limits, adjustments shall be made by the contractor to bring the grooving operation back into compliance. Quality Assurance (QA) tests of the grooved texture shall be conducted at a minimum of five randomly selected locations. These tests shall consist of any of the three methods described below:
• Groove depth measurements—At each selected location, a minimum of five measurements shall be taken diagonally across the pavement surface using a standard commercial tire tread depth gauge. The average depth of the five or more measurements shall be computed. If the average depth at any one location is outside the specified groove depth limits, two additional sets of measurements shall be made in the vicinity to ascertain non-compliance and the type of non-compliance (i.e., consistently too shallow or too deep). Any area that does not meet the specified minimum groove depth shall be subject to corrective action. Any area that exceeds the specified maximum groove depth shall be subject to a price adjustment or corrective action.
• Sand patch texture depth measurements (ASTM E 965)—At each selected location, a minimum of three sand patch tests shall be performed at diagonal points across the

F-14
pavement. The MTD from each test shall be determined and then averaged. If the average MTD at any one location is outside the specified texture depth limits, two additional tests shall be conducted in the vicinity to ascertain non-compliance and the type of non-compliance (i.e., consistently too shallow or too deep). Any area that does not meet the specified minimum MTD shall be subject to corrective action. Any area that exceeds the specified maximum MTD shall be subject to a price adjustment or corrective action.
• CT Meter texture depth measurements (ASTM E 2157)—At each selected location, a minimum of three CT Meter tests shall be performed at diagonal points across the pavement. The mean texture depth (MTD) from each test shall be determined and then averaged. If the average MTD at any one location is outside the specified texture depth limits, two additional tests shall be conducted in the vicinity to ascertain non-compliance and the type of non-compliance (i.e., consistently too shallow or too deep). Any area that does not meet the specified minimum MTD shall be subject to corrective action. Any area that exceeds the specified maximum MTD shall be subject to a price adjustment or corrective action.
F5.06 Measurement. Diamond grooving of concrete pavement will be measured by the square yard (square meter). F5.07 Payment. Diamond grooving of concrete pavement will be paid for at the contract unit price per square yard (square meter), with the exception of possible price adjustments made for areas exceeding the specified maximum groove depth or MTD.