tfl - phv congestion charge study · slide 3. confidentiality • our analysis is informed by...
TRANSCRIPT

TfL – PHV congestion charge study
Cambridge Economic Policy Associates
27th March 2018
FINAL REPORT

Slide 2
Contents
DISCLAIMER
• Introduction
• Context
• Approach
• Key messages from stakeholder engagement
• Analytical framework and assumptions
• Quantitative analysis
• Conclusions and potential next steps
1
2
3
4
5
6
7
Slide 3
Confidentiality• Our analysis is informed by confidential and/or commercially sensitive information received from various stakeholders in the PHV
sector. To preserve confidentiality within this public report, we have not attributed views to specific stakeholders. In a few cases whereit would not be possible to anonymise information, such stakeholder views have been omitted entirely.
Uncertainty• Outputs are based on forecasting behavioural impacts and are therefore, subject to uncertainty.• This uncertainty is magnified by (1) the need to convert stakeholder feedback into quantitative assumptions for the purpose of our
analysis and (2) the fact that operators have shown some reluctance to discuss assumptions around behaviour because that could beconstrued as them accepting the policy.
• As such, quantitative outputs should be considered as ‘broad estimates’, rather than ‘firm results’.
Scope of analysis• This report does not constitute an economic impact assessment.• Our analysis has focused on the impacts of removing the current CCZ exemption on PHV traffic, revenue, and distributional effects
between operators. A next step could be to forecast the likely impact on operator cashflows, to better understand the risks faced.• Our analysis has focused on operators, so further discussions would be required with drivers and customers, including public sector
bodies that use PHV services such as schools, the NHS, etc.• Our analysis is focused on the impact of removing the CC exemption for PHVs specifically, rather than assessing the impact of any other
changes (e.g. increases in operator licence fees). However, we do take these such issues into account qualitatively, as context.
Disclaimer

Slide 4
Expanding on the previous slide, there are a number of additional caveats to note upfront:
• Stakeholder engagement. PHV operators and trade representatives were very helpful and accommodating in discussing with us a rangeof issues during this project. We spoke with 13 PHV operators and 3 trade representatives. However, judgement was required ininterpreting / weighing up their views. In addition, a number of relevant issues have not yet been fully considered, e.g. whether anyarrangements would be in place for operators to physically pay the charge on behalf of the driver. As such, whilst the assumptions usedin this analysis were informed by stakeholder discussions, they are CEPA’s assumptions.
• Data limitations. There are several limitations in relation to the underlying data that we have used. For the underlying traffic data, wecross-checked different sources and made adjustments to ensure that the data is as accurate as possible. In some cases it has not beenpossible to source information broken down between types of operators, and we have had to make assumptions at a PHV sector-widelevel. However in the majority of cases, we have been able to make more granular assumptions.
• Timing of estimate. Our estimate of the potential impacts is based on recent traffic camera data from TfL. Changes to traffic flows in thefuture are uncertain so we have not included them in our quantitative analysis, but discuss them in a qualitative sense.
• Uncertainty. As noted on the previous slide, it must be emphasised that forecasting in general is subject to uncertainty, that developingquantitative assumptions is necessarily subject to judgement, and that it was not possible to fully engage with stakeholders on all pointsdue to opposition to the policy,
Other important caveats
As noted on the previous slide, and in light of the various factors discussed above (i.e. data limitations, uncertainty, the need to interpret stakeholder feedback and apply judgment, etc.), our quantitative results should be treated as ‘broad estimates’ rather than as firm results.

Slide 5
1 INTRODUCTION TO CEPA AND THIS STUDY

Slide 6
CEPA is a London-based economic and financial policy advisory firm. We advise both public and private sector clients on issueswhere economics, finance and public policy overlap. CEPA’s clients include government departments, sector regulators, non-governmental organisations, private sector companies and consumer groups in countries around the world.We have a well-developed regulation and competition practice, with extensive experience providing advice on a wide range ofissues in the transport sector. We specialise in:
Our transport practice is comprised of a core group of staff with many years of experience in the transport sector.
Introduction to CEPA
Network Regulation Access Pricing Infrastructure Funding Benchmarking Incentive Design
In transport, we advise UK and international economic regulators, private companies and other stakeholders. In the past, we haveadvised TfL on ULEZ impacts, taxi compensation, and diesel car scrappage. We are advising DfT and ORR in relation to HighwaysEngland’s performance. Our clients include:
Slide 7
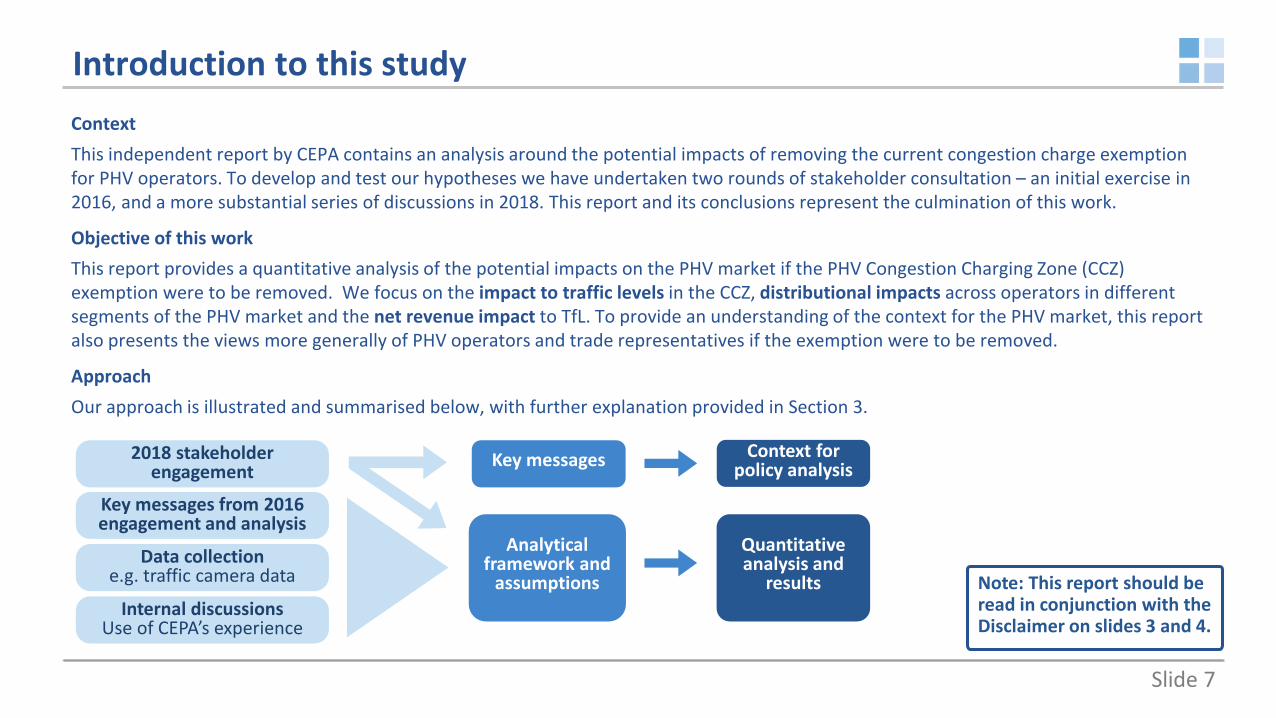
ContextThis independent report by CEPA contains an analysis around the potential impacts of removing the current congestion charge exemption for PHV operators. To develop and test our hypotheses we have undertaken two rounds of stakeholder consultation – an initial exercise in 2016, and a more substantial series of discussions in 2018. This report and its conclusions represent the culmination of this work.
Objective of this workThis report provides a quantitative analysis of the potential impacts on the PHV market if the PHV Congestion Charging Zone (CCZ) exemption were to be removed. We focus on the impact to traffic levels in the CCZ, distributional impacts across operators in different segments of the PHV market and the net revenue impact to TfL. To provide an understanding of the context for the PHV market, this report also presents the views more generally of PHV operators and trade representatives if the exemption were to be removed.
ApproachOur approach is illustrated and summarised below, with further explanation provided in Section 3.
Introduction to this study
Analytical framework and
assumptions
Key messages from 2016 engagement and analysis
2018 stakeholder engagement
Internal discussions Use of CEPA’s experience
Data collection e.g. traffic camera data
Key messages
Quantitative analysis and
results
Context for policy analysis
Note: This report should be read in conjunction with the Disclaimer on slides 3 and 4.

Slide 8
2 CONTEXT

Slide 9
Growth of PHV vehicles and drivers
ContextAn increasingly challenging environment for operators and drivers• Regulatory requirements on PHV operators and drivers have been growing recently, and operators’ costs are rising as a result, e.g.
operator licence fees, the English language test for drivers, etc. Some operators indicate that they are relocating outside of London as a consequence.
• The PHV marketplace is increasingly competitive and dynamic relative to 5 years ago, particularly with the growth of app-based services.• TfL’s statistics show that the number of licensed PH operators has fallen in recent years. One hypothesis is that smaller operators are
being driven out of business.* • We have heard anecdotal reports that driver incomes are being squeezed, and this is necessitating their working longer hours.
• There has been a marked increase in the number of licensed private hire vehicles and drivers, to almost 120,000 as of 2017. This is shown left.
• However, not all of the drivers will necessarily be working every week. • TfL has recently instated a requirement for all licensed private hire
operators to upload lists of the licensed drivers and vehicles available to them each week, which helps to illustrate the difference.
• The grey column (shown left) shows approximately the number of licensed drivers uploaded by all operators based on data from 2017, i.e. 70,000. This data is only available for recent months, so a trend cannot be shown.
• There are various potential reasons for this difference, e.g. some drivers only working certain weeks, leaving the trade but not notifying TfL, etc.
* TfL website, Licensing information

Slide 10
3 APPROACH
Slide 11
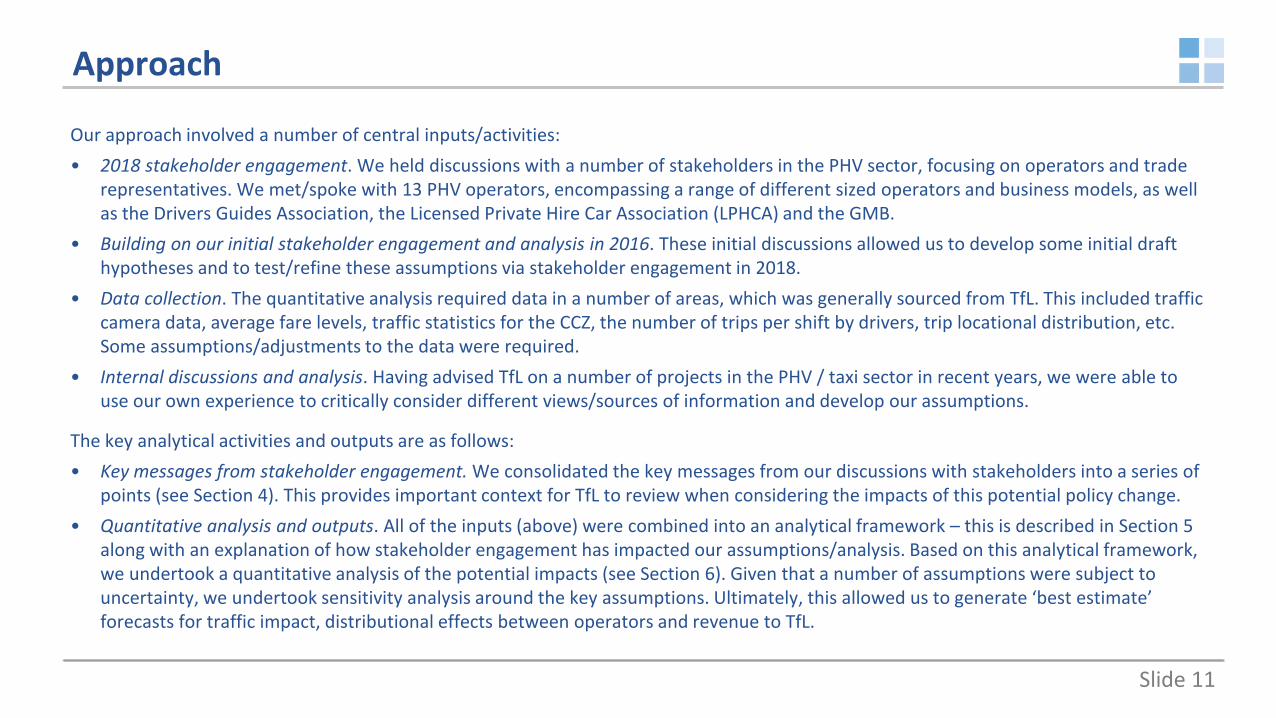
Our approach involved a number of central inputs/activities:• 2018 stakeholder engagement. We held discussions with a number of stakeholders in the PHV sector, focusing on operators and trade
representatives. We met/spoke with 13 PHV operators, encompassing a range of different sized operators and business models, as well as the Drivers Guides Association, the Licensed Private Hire Car Association (LPHCA) and the GMB.
• Building on our initial stakeholder engagement and analysis in 2016. These initial discussions allowed us to develop some initial draft hypotheses and to test/refine these assumptions via stakeholder engagement in 2018.
• Data collection. The quantitative analysis required data in a number of areas, which was generally sourced from TfL. This included traffic camera data, average fare levels, traffic statistics for the CCZ, the number of trips per shift by drivers, trip locational distribution, etc. Some assumptions/adjustments to the data were required.
• Internal discussions and analysis. Having advised TfL on a number of projects in the PHV / taxi sector in recent years, we were able to use our own experience to critically consider different views/sources of information and develop our assumptions.
The key analytical activities and outputs are as follows:• Key messages from stakeholder engagement. We consolidated the key messages from our discussions with stakeholders into a series of
points (see Section 4). This provides important context for TfL to review when considering the impacts of this potential policy change.• Quantitative analysis and outputs. All of the inputs (above) were combined into an analytical framework – this is described in Section 5
along with an explanation of how stakeholder engagement has impacted our assumptions/analysis. Based on this analytical framework, we undertook a quantitative analysis of the potential impacts (see Section 6). Given that a number of assumptions were subject to uncertainty, we undertook sensitivity analysis around the key assumptions. Ultimately, this allowed us to generate ‘best estimate’ forecasts for traffic impact, distributional effects between operators and revenue to TfL.
Approach

Slide 12
4 2018 STAKEHOLDER ENGAGEMENT: KEY MESSAGES

Slide 13
This slide provides a summary of the views that we received from stakeholders during the course of this project:
• Overall. There is strong opposition from all parts of the trade which has been expressed publicly*, and relations with TfL are being strained. This policy would be regarded by the trade as discriminatory if the taxi exemption were to remain in place, particularly as the PHV trade considers itself a public transport service. Stakeholders state that this policy feels like a tax, which would be difficult to bear given that the PHV trade is facing other large cost increases, e.g. increased licence fees. Stakeholders are also suspicious of TfL’s rationale, as this comes amidst TfL facing financial pressures itself.
• Congestion. Stakeholders suggested that removing the PHV exemption wouldn’t significantly reduce congestion, and there could be an unintended consequence of increased congestion – once a driver has paid the charge there might be an incentive to stay in the CCZ, so congestion in the CCZ could increase in the short term. Stakeholders noted potential better alternatives to reduce congestion, such as more sophisticated road user charging and/or better enforcement of existing pre-booking rules to prevent ‘loitering’. It was suggested that congestion more substantially driven by roadworks and space given to cyclists – PHVs are not the main cause.
• Distributional impacts. Most operators have significant concerns about rising costs. Stakeholders suggested that removing the exemption would hurt smaller operators the most, and would likely play into the hands of the largest operators. Drivers could also be affected –incomes would likely be squeezed further and there is a concern that this could exacerbate the trend of longer working hours. Where the cost of the charge would be passed through to the customers (passengers), some vulnerable passenger groups might ultimately bear the charge if they have no other option but to use PHV transport, e.g. the elderly. In the case of PHV operators providing contract work for public sectors**, if the charge were passed through, the revenue raised for TfL would essentially be a transfer between public sector entities.
• Environmental. It was felt that the various environmentally-related policies / vehicle standards are creating a confusing ‘patch work quilt’,e.g. the Ultra Low Emission Discount (ULED), the Ultra Low Emission Zone (ULEZ), variations in parking fees between local councils, etc.
• Engagement. Stakeholders consider that any future consultation on this policy would need to be done in good faith, i.e. not just be a ‘rubber stamp’ and TfL should not ‘cherry pick’ certain pieces of data or analysis. In general, there is concern over TfL’s approach to assessing congestion issues, e.g. quoting ‘total licensed drivers’ instead of ‘driver uploads’. We also note that operators are reluctant to discuss assumptions around behaviour / impacts because it makes them feel like they would be accepting a policy that they strongly oppose.
Summary of PHV views
* (1) City A.M., Union slams TfL plan to levy congestion charge on private hire taxis, 23rd Jan 2018; (2) Addison Lee, Open letter to the Mayor of London on retaining the Congestion Charge exemption, 26th Feb 2018; (3) Financial Times, Private hire cars face paying London congestion charge, 26th Feb 2018. ** For example, councils providing school runs for children with special education needs, the NHS transporting individuals with mental illnesses and/or physical disabilities, etc.

Slide 14
5 ANALYTICAL FRAMEWORK AND ASSUMPTIONS

Slide 15
The framework for our analysis is illustrated below, and explained on the following slide.
Analytical framework: Overview
Outputs
Accounting for changes in behaviour
Based on existing behaviour
Traffic baseline (chargeable entries)
Impacts without any changes in behaviour
Changes in behaviour by operators
Define operator market segments
Potential adjustment
factors
Specialisation
Cost spreading
Cost absorption
Response by passengers
Direct demand response
Subsequent market dynamics
Impact on traffic levels
Distributional impacts
Revenue estimate to TfL

Slide 16
Analytical framework: ExplanationHypothetical scenario based on existing behaviour• If the exemption were removed and operators/drivers/customers did not change their behaviour, all vehicles that currently enter the CCZ during
charging hours would pay the charge, e.g. revenue to TfL would be the existing daily unique* vehicle entries (the ‘traffic baseline’) multiplied by the charge. However, there would inevitably be some changes in behaviour if TfL removed the exemption (the market would adapt), so any analysis based on existing behaviour is hypothetical and simply used as a starting point for further analysis. In order to provide a more sophisticated estimate of the potential impacts, our analysis considers the changes in behaviour that would inevitably occur.
Accounting for changes in behaviour• Identifying and defining market segments. To make the quantitative analysis manageable across the PHV sector, we grouped operators with
similar characteristics into ‘market segments’.• Considering changes in behaviour by operators and passengers. We identified the key factors that would affect the outputs of our analysis (i.e.
impact on traffic, distributional effects and revenue). We developed quantitative assumptions for these factors, based on a combination of stakeholder engagement, research and discussions, which involved applying judgement. As such, our quantitative analysis gives ‘broad estimates’ rather than ‘firm results’. To mitigate the uncertainty, we tested our assumptions with stakeholders / TfL staff and undertook sensitivity analysis.
1) Assumed changes in behaviour by operators (further explained on slide 20):• Specialisation: The scope for operators and/or groups of drivers to focus on undertaking work inside the CCZ.• Cost spreading: Whether operators would spread the cost of the charge across CCZ trips only, or across all of their trips.• Cost absorption: The extent to which operators may absorb the charge – either through their own profit margins or by not reimbursing in full
the driver for having physically paid the charge on their vehicle – rather than passing it on to passengers.2) Response by passengers (further explained on slide 20):
• Direct demand response by customers to a change in price by an individual operator. Sensitivity of demand to price is the ‘demand elasticity’.• Subsequent market dynamics: If prices differ between different operators, customers may switch from one operator to another. We assume
that there is some customer switching, i.e. some of the ‘lost demand’ (from the ‘demand response’) will be redistributed to other operators.• Outputs, including potential adjustments. We generated quantified estimates of the outputs, taking into account the need for any adjustments.* Unique entries remove multiple entries by the same vehicle within a day; it is the same as the number of times the congestion charge would have been incurred if the vehicles were not exempt.

Slide 17
Traffic baseline• The charts below show PHV vehicle entries into the CCZ for different days of the week in November 2016, under current CC hours (weekdays
7am-6pm) and over the full 24-hour period. Figures have been adjusted to November 2017 levels, and to account for data limitations.*• The left hand chart counts separately each time a vehicle enters the CCZ, whereas the right hand chart only counts ‘unique’ entries each day,
e.g. if a vehicle entered the CCZ four times in a single day, this would only count as one single unique entry. As such, the number of uniqueentries shown in the right hand chart is less than the number of total entries shown in the left hand chart.
• The difference between the light blue and dark blue columns show the number od PHVs that only enter the CCZ outside of current charginghours. Therefore, if the CC exemption were to be removed for PHV, only a portion of PHV entries would be impacted.
• The chargeable entries for the purposes of our analysis are the number of unique entries during current CC hours only (see right hand chart).
PHV unique (chargeable) entries
Note: Based on average daily chargeable entries during the month of November, e.g. Data for “Mon” is the average across four Mondays.
* Traffic camera data from November 2016 was sourced from TfL’s Real Time Origin Destination Tool (RODAT). Cross-checking with other TfL CCZ entry data, RODAT appears to understate unique entries by circa 7.5%. TfL’s Management Information Systems show that PHV unique entries increased by roughly 2.5% from November 2016 to November 2017. We have uplifted entry data to account for these factors. RODAT has since recorded a further 1.3% increase, which is not in included in our analysis.
PHV total entries(Note – different scale)
Driver diary data: Trip patterns in charging hours
• 23% of PHV trips involve travelto, from or within the CCZ.
• 6% of PHV journeys were madeentirely within the CCZ.
• 33% of PHV drivers wererecorded making a journey intothe CCZ
• 4% of drivers make over 50% oftheir journeys to/from/withinthe CCZ in charging hours.

Slide 18
We have sought to identify ‘market segments’ (i.e. operators, or groups of operators) that have distinguishable characteristics. Keyconsiderations have been the availability of data and the ability to distinguish characteristics between different groups, e.g. ifsegments are very small, it becomes more difficult to say how their behaviour will differ from another segment.The table below illustrates how we have mapped TfL’s operator size bandings (for operating licence fees) to the market segments.The central table provides a description of the operators in each segment. The pie chart (right) shows the average proportion ofchargeable entries (i.e. unique entries during current charging hours) undertaken by operators in each segment.
Operator market segments: Definition and description
PHV: Split of unique entries during CC hours** by operator segment***
* Numbers of operators in ‘Medium’ and ‘Small’ includes those operators in the ‘umbrella group’, but those operators’ unique entries have been included under Large in the pie chart.** Data for unique entries for all operators was originally taken from November 2016, but was subsequently cross-checked / uplifted to November 2017 figures.*** Entries by PHVs registered to more than one operator are split equally between the PHV’s registered operators. Entries by the ‘umbrella group’ are counted within ‘Large’.
Operator segment
Number of vehicles
Number of operators*
Extra-large 10,001+ 1
Large 1,001-10,000
1 (plus ‘umbrella’)
Medium501-1,000 3
101-500 43
Small
51-100 91
21-50 281
11-20 284
0-10 1,328
Chauffeur Various 300
Extra-Large: Contains a single operator – Uber. Characterised by very large scale operation and sophisticated technology to send trip requests to different drivers. Typically offers low prices.
Large: Contains Addison Lee. We have also included an ‘umbrella group’ of roughly 20 operators who use the same software platform to share trip requests with each other. These operators would be Small or Medium sized on their own, but the platform allows them to behave more like a large operator.
Medium: A range of companies, including some with reasonably large market presence, e.g. Green Tomato. Operates at a limited scale but growing use of technology.
Small: Tend to be traditional minicab companies, throughout Greater London. A low volume of trips into the CCZ. Potentially more established relationships with drivers and passengers.
Chauffeur: Business clients, special events, airport transfers, etc.

Slide 19
**
Split of CCZ unique entries by operator (Nov 2016, CC hours)
*
We have sought to investigate whether the smallest operators could be affected disproportionately by the exemption removal. As shownbelow left, what we have defined as ‘Small’ operators (those with up to 100 vehicles) collectively account for 21% of unique entries (basedon November 16 data). Below right, for the number of unique entries by the ‘Small’ operator segment, we have split this into four sub-setsto correspond with TfL’s size bandings for operator licence fees: 1-10 vehicles, 11-20 vehicles, 21-50 vehicles, and 51-100 vehicles.
Subsets of operators within the ‘Small’ operator segment
Key observations:• ‘Small’ operators undertook almost one quarter of
the unique entries into the CCZ in November 2016.• By looking at the sub-sets within the 'Small operator
category, we see that entries are distributed across operators of different sizes. For example the smallest PHV operators (with 1-10 vehicles) accounted for 3% of unique entries in Nov 2016.
* Notes: The “none” category represents PHVs with no operator specified in the data. The “unknown” category includes all those for which we do not have current operator data, as explained on the previous slide. ** Chauffeurs tend to be ‘small’ operators in terms of the number vehicles. However, due to their relatively unique business characteristics, we consider them separately from ‘small’ operators.
Impact on quantitative analysis:Whilst the analysis in this report distinguishes between different types of operators, the evidence we have to date is not sufficiently granular to allow us to make different assumptions for these different sub-sets, so we model all ‘Small’ operators as a single group. However, where we consider there may be differences, we discuss these issues qualitatively.

Slide 20
Assumptions around changes in behaviour*Potential changes in operators behaviour
* This slide presents the views of stakeholder and our ‘base case’ view. However, due to uncertainty, we undertook sensitivity analysis around these assumptions.** Larger operators were unsure to what extent it could be cost effective to ‘specialise’, and noted that drivers have autonomy. Our base case assumptions are our view. *** Quote from Eddie Townson, Carlton Cars, in a Financial Times article, Private hire cars face paying London congestion charge, 27th Feb 2018
‘Direct demand response’• By this we mean, the response of customers to an operator raising its prices.• Some operators view customers as being highly price sensitive, whilst other (often
smaller) operators thought the opposite. Publicly available analysis on Uber surgepricing showed customers to not be overly price sensitive, although this cannotnecessarily be applied to the whole sector. Chauffeur contract work was noted asbeing fairly price competitive, but individual chauffeur clients slightly less so.
• In our view, customers are likely to be fairly price sensitive, although perhaps lessso for small operators who have localised markets and/or more loyal customers.
‘Subsequent market dynamics’• This follows the notion that some customers will switch away from one operator
(see ‘Direct demand response’) to an alternative (e.g. to find a lower price), ratherthan switching away from the PHV sector (e.g. ‘mode shift’ to bus or tube).
• The general stakeholder view was that ‘mode shift’ would be low and operatorswith smaller price increases would gain more of the ‘switching’ customers.
• Taxis could gain customers, although scope is limited by their price premium.• We assume most customers would remain in the PHV/taxi sector, with ‘switching’
customers allocated to operators with low fares and a large existing CCZ presence.
Potential changes in passenger behaviour
‘Specialisation’• An operator’s trips are undertaken with fewer
unique vehicle entries, e.g. operators designatingcertain vehicles to work inside the CCZ, or biasingtheir ‘trip allocation algorithm’ for CCZ trips towardsvehicles that have already been in the CCZ on a day.Drivers could also ‘self specialise’ by spending moretime in the CCZ having paid the charge.
• Stakeholders noted that operators would require afleet of 500 vehicles plus to specialise at all,because below this threshold the trade off withincreased dead miles is too large.
• We agree, specialisation requires scale and use ofsophisticated software. We expect only the largestoperators to specialise.**
‘Cost spreading’• Whether the charge would be spread across CCZ
trips only; all London trips, or some middle option.• Larger operators were reviewing different options.
There was some uncertainty, and some views wereprovided in confidence. Some smaller operatorsnoted publicly that they might pass the chargeonto CCZ trips only, particularly if they were basedfar from the CCZ.***
• Chauffeur companies suggested passing the chargeonto individual customers (with the exception ofcontract work), given that the majority of trips arein the CCZ and the number of trips per day is low.
• Overall, our analysis was undertaken on the basisof the stakeholder views received.
‘Cost absorption’• The proportion of costs that would be absorbed by
the operator and/or driver, as opposed to beingpassed through to customers via higher prices.
• Operators noted they are facing rising costs andthe predominant view was that the customerwould ultimately bear the cost (i.e. low costabsorption). Anything not passed on would remainwith the drivers, as they physically pay the charge,although smaller operators in particular wereconcerned with drivers’ incomes being squeezed.
• Our view is broadly consistent with this – weconsider that larger operators might be more likelyto require drivers to bear some of the cost, inorder to maintain and/or gain market share.

Slide 21
6 QUANTITATIVE ANALYSIS

Slide 22
Forecasting operator behaviour
* These decisions may be operator-led, or driver-led. ‘Operator-led’: operator influences which trips are allocated to which vehicles, e.g. via an allocation algorithm. Driver-led’: certain drivers choose to focus their trips in the CCZ.** The more an operator can specialise, the lower proportion of their PHVs need to enter the CCZ to serve the same number of fares – we assume larger operators are more able.*** Chauffeur fares increase by a lower proportion compared to Small operators, because chauffeur fares are higher to start with.
Number of chargeable entries before & after specialisation** Change in price per trip for different groups of operators***
--- Estimates are based on forecasts of behavioural impacts so are subject to uncertainty. CEPA’s view of assumptions may not always reflect stakeholder views. ---
Specialisation: CEPA’s base case assumes that the largest two operator categories specialise, enabled by their scale and use of technology.*
• To avoid incurring the CC more times than is necessary, operators may attempt to concentrate their CCZ trips into as few vehicles as possible – the PHVs therefore “specialise” as either a CCZ or non-CCZ PHV (this can change each day, since the CC is daily). The number of PHVs entering the CCZ at least once in any day therefore falls by about 45% – this is shown split across the Extra-Large and Large operators in the left-hand chart below.
• However, the CCZ-entering PHVs drive more to serve the fares that cannot now be served by the PHVs that avoid the CCZ – so the traffic impact is more closely tied to the demand response. Taking into account that we expect the CC to be at least partly passed on to passengers through increased fares, we expect the demand response to these fare increases to lead to about a 6% reduction in PHV traffic overall (approx. 1% of overall motorised traffic).
Larger operators we spoke to were not sure whether/to what extent they could specialise (given the desire to minimise time spent waiting for or travelling to a fare), so we consider sensitivities around our base case assumptions but emphasise CEPA’s view that markets adapt to change and the specialisation assumption is a reflection of that.
Cost spreading and cost absorption. In addition to specialisation, the base case reflects CEPA’s view that: (1) the largest operators would be able to spread the charge across all London trips (i.e. including both CCZ and non-CCZ trips), i.e. over a wider base; and (2) the largest operators may not pass on all of the charge to customers, i.e. by absorbing some cost either from profit margins or by requiring drivers to bear a portion. The right hand chart below shows the combined result – in our view the price per trip would potentially rise less for larger operators than for smaller operators.

Slide 23
--- Estimates are based on forecasts of behavioural impacts so subject to uncertainty. CEPA’s view of assumptions does not always reflect stakeholder views. --Direct demand response. The previous slide showed our base case hypothesis that prices would rise by a greater amount for Smalloperators, as they would be unable to spread the charge across many trips and/or absorb the cost. The (direct) demand response reflectsthis, as shown in the chart below, where the light blue bars indicate that demand would fall by most for the Small operators. (We do notexpect demand to fall by as much for chauffeur journeys because, as noted on the previous slide, chauffeur fares increase by a lowerproportion.) On the other hand, the immediate (direct) demand reduction is less for the largest operators because we expect that their fareswill not rise by as much.
Forecasting passenger response
* Under our base case, we assume that 75% of “lost journeys” are re-distributed, i.e. the other 25% of journeys are cancelled or diverted.** In the base case, the shares of ‘redistributed demand’ are as follows: Extra-Large 65%; Large 13%; Medium 5%; Small 3%; Chauffeur 0%, Taxi 13%. As a simplistic estimate, we assume that taxis gain the same proportion of the ‘redistributed demand’ as the Large operator segment.
CEPA projection of percentage change in demand: Before and after market dynamics (‘direct demand response’)
Summary of distributional impacts. We forecast: (1) Extra-Large would be the only PHV operator segment to benefit from the policy; (2) all other PHV operators would lose demand; (3) a modest proportion of customers would switch to taxis as the price differential to PHV narrows.
Subsequent market dynamics. We assume that a significant proportionof the customers lost by operators under the ‘direct demand response’would switch to a different operator, i.e. some ‘lost demand’ would be‘redistributed’ to other operators.* We assume customers would beredistributed in proportion to (1) each segment’s existing CCZ presence(share of current chargeable entries), and (2) the extent to which eachsegment can limit the increase in price.** The chart shows our viewthat Extra-Large could gain the majority of ‘redistributed’ customerspost-market dynamics, as it has a large CCZ presence and we expect itmight not raise fares much. Large operators and taxis could also gainsome ‘redistributed’ customers, but Small and Medium operatorsbarely gain as we expect their prices to rise more.**Overall (the dark blue bars): Demand is forecast to increase for Extra-Large (by 4%) and to fall for other operators, e.g. by -1% for Large.
Note: The dark blue bars (‘post-market dynamics’) represent CEPA's final forecast, including the assumption that large operators with higher specialisation would be able to implement smaller price increases and could gain market share vs smaller operators.

Slide 24
We have considered a number of additional factors that could impact the number of chargeable entries and revenue to TfL.
Potential adjustment factors
Revenue Explanation Discussion
Payment other than Autopay
Revenue to TfL will increase if some payments are not made via Auto Pay
We consider that close to 100% of payments would be made via Auto Pay for PHVs.
Administration costs TfL will incur costs in administering the charge Cost data is not available, so not possible to make an adjustment.
Scope for avoiding the charge
If vehicles enter the CCZ but can avoid paying, this reduces revenue to TfL
TfL is content that there are no real opportunities for avoiding the charge, so no adjustment required.
Chargeable entries Explanation Discussion
Growth in PHV traffic in future years
PHV market has grown in recent years, and if this continues it would increase unique entries.
Forecasts of growth are high level at this stage and there is uncertainty in the sector. We discuss the directional impact in our conclusions.
Second exemptions Vehicles or drivers may be eligible for another exemption, e.g. ULED or residents discount, so would not have to pay if the PHV exemption is removed.
ULEV growth is hard to predict as there are uncertainties from an operator perspective. We discuss directional impacts. Some operators have indicated their intention to transition to hybrid/electric vehicles.*
Vehicles licensed outside of London
TfL’s traffic data does not include these, so maybe understate unique entries.
Non-London licensed PHVs are already paying the CC, so removing the exemption for London-licensed PHVs would have no affect on traffic levels in the CCZ or revenue to TfL.
* e.g. Uber’s Clean Air Plan.

Slide 25
Traffic impact: If the CC exemption were removed for PHV, in our basecase we estimate that PHV traffic could fall by up to approximately 6%.*If considered alongside other motorised transport in the CCZ, totaltraffic in the CCZ (including all motorised transport) is estimated to fallby approximately 1%. This includes a minor increase in taxi traffic due to‘market dynamics’.Based on sensitivity analysis around our assumptions, the traffic impactcould be greater, but with a relatively low probability. A moresophisticated statistical analysis of the possible outcomes on trafficmight be possible, but is beyond the scope of this study. We note thattraffic impacts may be gradual (rather than immediate) as operators anddrivers will likely take time to change their behaviour.
Forecast impacts: Traffic and distributional effects--- Estimates are based on forecasts of behavioural impacts so are subject to uncertainty. CEPA’s view of assumptions may not always reflect stakeholder views. ---
Overall change in total motorisedtraffic in the CCZ (in CC hours)
Change in PHV trafficin the CCZ (in CC hours)
Distribution impacts:• Impact on small operators. Our work suggests that the policy would have the greatest impact on small operators, as they would likely
be less able to accommodate the increased charge.** Higher costs would put further financial pressure on operators – further analysis of the impact on small operator cashflows could help to clarify whether some small businesses might subsequently be forced out of business. There is some evidence of operators consolidating (e.g. to improve competitiveness) and this trend could continue.
• Impact on driver earnings. There is a risk that individual drivers could bear at least some of the charge and this would adversely impact already relatively low earnings. In our view, drivers with the largest operators (e.g. Extra-Large and Large) could be at the greatest risk of bearing some or all of the charge, given that operators could utilise their market power and/or might seek to keep prices low.
• Sensitivities. NOTE The impact on each operator segment is sensitive to the assumptions, e.g. relative changes in the price per trip.
* This reflects CEPA’s views on specialisation - i.e. that those vehicles that do enter the CCZ circulate more within it reducing the number of unique entries. With less specialisation,the reduction in entries would be smaller as more vehicles would be required in the CCZ.
** Based on our analysis to date, it is not possible to tell whether/how different sub-sets of operators within the ‘small’ operator segment might be affected in materially different ways.

Slide 26
--- Estimates are based on forecasts of behavioural impacts so are subject to uncertainty. CEPA’s view of assumptions may not always reflect stakeholder views. ---
Chargeable entries* and revenue. Under our base case, if the existing PHV exemption were removed, we estimate that PHV unique (chargeable) entries in the CCZ could fall from 410,000/month (‘current levels’) to circa 230,000/month (‘base case post-assumptions’) due to changes in behaviour by operators, as shown below left. Gross additional revenue to TfL based on this number of chargeable entries would be roundly £30m, based on our forecasts for operator/passenger behaviour (slide 20) and other assumptions (slide 24), e.g. all vehicles pay via Autopay, etc. However, our assumptions are subject to uncertainty, particularly the degree of ‘specialisation’, and so revenue could be higher or lower. Flexing our assumption for specialisation is the key driver of the range shown below (roundly £20m to £40m). We note that the ‘low’ estimate could be even lower in certain cases, e.g. if operators transition their fleet to be eligible for the ULED.
Forecast impacts: Unique (chargeable) entries
Notes: Quoted numbers have been rounded to the nearest 10,000. Monthly figures are based on 22 chargeable days per month.* Chargeable entry figures are underpinned by the ‘traffic baseline’ data (see Section 5), which is subject to a cross-check versus RODAT November 2017 data.
Base case Ranges based on sensitivities

Slide 27
Given the uncertainty in our work, we considered how variations in our main assumptions would impact on the key outputs, i.e. traffic, revenue and distributional effects.
Sensitivity analysis
• For traffic (congestion), none of the main assumptions on their own have a significant impact. Only if all variables are at a particular extreme, would the collective impact on total motorised traffic in London be more significant than our base case.
• For revenue, the degree of ‘specialisation’ by operators/drivers has a significant impact, e.g. circa ±£10m based on our assumption range.• Distributional effects are impacted by a number of variables. For example, if one operator passes the charge through to customers but
another holds their prices firm, we consider that the latter would gain demand relative to the former. This increases the uncertainty in relation to how different operators might be affected if the exemption were to be removed.
Other sensitivities• Some operators have indicated their intention to transition their fleets to hybrid/electric vehicles. As a high level example, if one third of
unique PHV entries were undertaken by ULED-eligible vehicles, the number of chargeable entries would fall by one third, revenue to TfL would fall by one third (e.g. from £30m in our base case to £20m), and the traffic impact would fall.
• One limitation of the underlying data is that we only have a proxy for the current number of trips per day undertaken in the CCZ for each unique vehicle entry, and it is sector-wide, i.e. not specific to each operator segment. If the data could be improved, any change would be equivalent to varying the specialisation assumption, and so the revenue impact would vary.
--- Estimates are based on forecasts of behavioural impacts so are subject to uncertainty. CEPA’s view of assumptions may not always reflect stakeholder views. ---
Key outputs Main assumptionsSpecialisation Cost spreading Cost absorption Demand elasticity Demand redistributed
Traffic * Small Small Small Small SmallRevenue ** Large Negligible Negligible Negligible NegligibleDistribution *** Medium Large Large Large Medium
* For traffic, a ‘small’ impact is considered to be less than ± 0.5 percentage points.** For revenue, a negligible impact is considered to be less than ± £1m.*** For distributional effects, a ‘large’ impact is a significant change in the demand share for an operator segment relative to other segments.

Slide 28
7 Conclusions and potential next steps

Slide 29
Views from stakeholders. To provide context to this potential policy, the key messages from our stakeholder discussions are:• Summary of feedback: There is strong opposition to this policy from the PHV trade. Relations with TfL are becoming strained, particularly given
recent increases in licence fees and other regulatory changes. Stakeholders felt that it would be discriminatory if taxi’s exemption remains, and have expressed their concerns publicly. Operators are suspicious of TfL’s rationale – this policy feels like a tax to raise revenue – and operators have been reluctant to discuss how they might respond as they feel like they would be accepting the policy.
• Traffic levels: Stakeholders feel that this policy would not materially reduce congestion - it might even increase via drivers wanting to stay in the CCZ, having paid. There are better alternatives (e.g. enforcement of pre-booking), and congestion is due to non-PHV factors (e.g. cycle lanes).
• Distributional impacts: The largest operators would gain market share at the expense of the smallest, driver incomes would be further squeezed, some public sector bodies would end up bearing the charge (e.g. local councils), and vulnerable users might incur higher costs, e.g. the elderly.
CEPA’s quantitative analysis and conclusions. If the exemption were to be removed, in our ‘base case’ we forecast the following impacts:• Traffic would fall slightly. We estimate PHV traffic would fall by around 6%, or 600 unique entries per day. Alongside other motorised transport in
the CCZ, this equates to a roughly 1% fall in total traffic in the CCZ. This includes a minor increase in taxi traffic due to some customers switching and we have not allowed for any increase in ‘loitering’.
• Distributional impacts: It is likely to have a disproportionately large impact on trips provided by small operators, as they would be less able to accommodate the increased charge, and some small operators could subsequently be forced out of business. Drivers are also likely to bear at least some of the charge, particularly for the largest operators, and this would adversely impact on already low earnings.
• Chargeable entries and revenue: We estimate that unique PHV entries into the CCZ in charging hours would almost halve if the exemption were removed, primarily due to changes in operator behaviour. The policy could raise around £30m per annum for TfL, but is subject to uncertainty.
Sensitivity analysis indicates that traffic impacts are not significantly affected by changes in individual parameters. Revenue is highly sensitive to the degree of specialisation achieved by operators, as well as some other factors, e.g. whether operators' fleets become increasingly exempt via the ULED, and whether our underlying traffic data provides an accurate proxy of existing trip patterns. Distributional impacts (i.e. how different operator segments are impacted relatively) are affected by a number of our assumptions, e.g. differences in cost absorption between operators. Caveats. Our quantitative analysis should be treated as providing ‘broad estimates’, not ‘firm results’, as it is subject to uncertainty in various areas.
Conclusions

Slide 30
Potential further work in relation to this policy: • This report does not constitute a full/formal economic impact assessment. Our analysis has focused on the impacts on traffic in the CCZ,
revenue, and distributional effects between operators. There are a number of areas, not within scope, which could be considered:o Cashflow / ‘profit and loss’ analysis for operators to understand whether any might be in danger of going out of business, taking into
account the impact of other regulations and policies, e.g. increases in operator licence fees. o Discussions with passengers and customers, including public sector bodies that use PHV services such as schools, the NHS, etc.o Potential impacts on fares / journeys outside of the CCZ. As noted earlier, if the exemption were to be removed, some operators
could seek to mitigate the impact of the charge by the spreading the cost over journeys both in the CCZ and outside the CCZ.o Considering in more detail the impact on the taxi sector, and to what extent customers might switch between PHV and taxi.
Potential next steps

Slide 31
CAMBRIDGE ECONOMIC POLICY ASSOCIATESQueens House, 55-56 Lincoln’s Inn FieldsLondon WC2A 3LJ
Tel: 020 7269 0210Fax: 020 7405 [email protected]
Contact us