tfp notes
DESCRIPTION
MacroeconomicsTRANSCRIPT

CHAPTER FIVE
SOURCES OF TFPG
IN FIVE SECTORS

CHAPTER FIVE
SOURCES OF TFPG IN FIVE SECTORS
5.1 Introduction
Economic growth has been the “engine” for many open, capitalist economies in
maintaining the economic health of a nation. From the work of Solow (1956), the result
of basic neoclassical models predicts that the long-term rate of growth in per capita
income is determined solely by the rate of technological progress. This concept originates
from the assumption of diminishing returns to capital. The only way an economy can
achieve positive long run growth rate of per capita income is to assume an exogenous rate
of technological progress or total factor productivity growth (TFPG).
Since an economy is made up of firms, it is important to study the factors that can
affect the TFPG of countries not only at a national level but also at the sectoral and firm
levels. Brown and Chekitan (2000) recently investigated various factors for improving
productivity in the hotel industry (a service business) in U.S.A. Their studies provided a
good example of determining factors affecting productivity at the firm level.
So what factors can affect TFPG at all the different levels? Questions on the
assumption of technological progress propelled research on models aimed at
endogenising the rate of TFPG. Hence these models became known as “endogenous
growth theories” or the “new growth theories”. The major difference between the
neoclassical and endogenous growth model is explained in Rogers (2003): “Endogenous
growth model - is unlike the neo-classical model where there is no prediction of a long
run steady state and hence there is no immediate suggestion that countries with lower
output per capita should grow faster”.
151

A milestone paper on endogenous growth theory was written by Arrow (1962),
modeling technical change. He considered technical change as the result of learning-by-
doing, where “doing” refers to the process of investment rather than the process of
producing output. He used the link between growth of knowledge and cumulative level of
investment to model the rate of technical change that could affect the economic growth of
a country. He viewed investment as causing changes in the environment which would
stimulate learning. Given the nature of all profit-seeking business, this description is
realistic enough for the current economic environment.
Other “knowledge-based” endogenous growth models, for example the imitation
model is derived from the work by Barro and Sala-i-Martin (1995). The imitation model
is used to explain positive long run growth and allows for costs in transferring
knowledge. One of the attractive features of the imitation model is that imitation is
defined not simply as replication of products or processes but rather an adaptive
component is being modeled that describes vividly the business microeconomic
behaviour of all firms.
Romer (1990) also wrote another influential “knowledge-based” endogenous
growth theory and described that the growth of technological progress of a firm can be
thought of as depending on the level of resources devoted to research as well as the
existing level of knowledge the firm has access to.
All these “knowledge-based models” explicitly try to write down an equation for
the factors determining the accumulation of knowledge that can cause the rate of
technical change to improve over time. The implicit assumption behind these models is
that there is “knowledge spillover or diffusion” from one sector to another or from one
152

firm to another. Therefore, the growth of knowledge for a firm is a function of the
resources devoted to its accumulation of knowledge and the level of knowledge the firm
has access to.
Adapting from the “knowledge-based model” in endogenous growth theory, this
chapter seeks to identify and test five sets of explanatory variables that may influence the
rate of “accumulation or diffusion of knowledge” of five sectors in Singapore. An
increased rate of diffusion will lead to upward trend of TFPG in a particular sector and
hence will contribute to the economic growth of Singapore as a whole.
TFPG is estimated in Chapter 4 using the Malmquist Productivity Index (MPI)
and the non-parametric methodology, Data Envelopment analysis (DEA). MPI allows
TFPG to be decomposed into two components: technical change (TECH) which is the
shifting of the technical frontier and efficiency change (EFFCH) which is the catching up
effect in efficiency gains.
Testing the significance of the sources of TFPG will help policy makers devise
appropriate measures in increasing the rate of diffusion of knowledge in the five sectors.
Section 2 reviews the literature on empirical studies done on the determinants of TFPG.
Section 3 briefly reports results of Malmquist Productivity Indices from Chapter 4.
Section 4 specifies the econometric model used to test the effects of the independent
variables on TFPG. Section 5 summarizes and discusses the empirical results of the five
sectors. Section 6 gives the conclusion, policy implications, limitations of this study and
future research agenda.
153

5.2 Literature Review
5.2.1 Government’s Role
The government’s ability to influence economic growth had its beginnings in
Keynes’ “The General Theory of Employment, Interest, and Money”. It is not surprising
that the role of government in TFPG has been studied extensively. Whether government’s
intervention has positive or negative impact has long been an issue since The East Asian
Miracle (World Bank, 1993) was published. An article by Lee (2004) described how the
Korean government was actively involved in the Heavy and Chemical Industrialization
(HCI) policy during 1970s. He reported that government industrial policies, such as loans
policy and tax incentives showed weak correlation with the growth rate in the Korean
manufacturing sector. As the World Bank (1993) stressed, Korean economic success
occurred in spite of rather than because of government intervention.
The conclusion is that if Korea does not undertake efforts to improve capital
productivity significantly through the adoption of advanced management techniques, it
would remain vulnerable to a repetition of the financial crisis in future. Hence efforts
must be targeted at increasing TFPG by providing firms with incentives to innovate and
adapt to changing economic opportunities – whether through adoption of the best
technology or managerial and organizational practices. Specifically, promoting greater
competition in markets and building a robust and efficient financial system are the most
critical measures in enhancing TFPG in the Korean economy. Using the governing
party’s knowledge in policy making does not seem sufficient, but rather it is the use of
knowledge in building a more efficient, competitive financial market, creating innovation
in managerial and production practices that is more important for economic growth.
154

The following section reviews the literature on some determinants of TFPG:
research and development (R&D), improving quality of human capital through training
and education, outward orientation through foreign direct investment and openness of
trade, macroeconomic stability and fixed investments.
5.2.2 Research and Development
Theoretical models of endogenous growth emphasize that innovative activities of
individual firms can contribute to sustained long-run growth of an economy through their
industry-wide spillover effect (Romer, 1986; Grossmann and Helpman, 1991). Sena
(1998) summarized with the following:
“…a firm with low Research & Development (R&D) expenditure can draw from
the high-tech technology firm a zero cost and therefore the high-tech firms’ innovative
efforts may explain other firm’s productivity growth.” Cohen and Levinthal (1989)
suggested (against the view of zero cost of spillover effects) that the effect of R&D
capital on productivity would be permeated mainly through the effect of own R&D
capital.
Nadiri (1993) found a positive and strong relationship between R&D and the
growth of output or total factor productivity. The relation is pervasive, though the
magnitudes of the contribution of R&D vary among firms, industries and countries. He
suggested that the spillover effects of R&D are often much larger than the effects of own
R&D at the industry level. The channels of diffusion of spillovers vary considerably.
They may take the form of intra-and inter-industry relationships, interdependence
between public and private sector investment, supplier and purchaser connections, and
155

geographical location, as well as domestic firms and firms in other countries through
international technology market trade and multinational enterprises (MNEs).
Through the study of OECD countries, Nadiri noted that the diffusion of new
technology is very rapid and transmitted not only through exports but also through FDI
and MNEs research operations. He concluded that more than half of TFPG can be
explained by R&D spillover effects and that having more R&D investments will lead to
further increases in R&D spillovers. Jaffe (2001) confirmed that R&D productivity is
increased by the R&D of “technological neighbors”. Griliches (1981) found a significant
relationship between the market value of the firm and its “intangible” capital, proxied by
past R&D expenditures.
All the above studies show that R&D activity is a channel for the diffusion of
knowledge through innovative ideas from one firm to another and the increase in
productivity growth can be translated to the market value of the firm.
5.2.3 Quality of Human Capital
Barro (1991) and Mankiw et al. (1992) have emphasized the role of quality of
human capital through education and training and is one of the key factors in TFPG. A
recent study by Rogers (2003) confirmed the test of the knowledge-growth hypothesis.
He described how the use of study abroad data could be linked to absorptive capability –
the ability to search for, learn and implement new knowledge. He showed some evidence
that the absolute numbers of students studying overseas were associated with subsequent
economic growth. The coefficient on secondary schooling was also positive and
significant.
156

Recent studies by members of Asian Productivity Organization (APO, 2004)
reported positive effects of quality change in labour on TFPG due to higher educational
level for most countries. Aiyar and Feyrer (2002) studied the causal link between human
capital accumulation and TFPG by using a variety of GMM estimators in a dynamic
panel framework with fixed effects for 86 countries over the period of 1960-1990.
Human capital was found to have a positive and significant effect on the long run path of
TFP.
Another study by Benhabib and Spiegel (2000) generalized the Nelson-Phelps
catch-up model of technology diffusion facilitated by levels of human capital. In a
logistic diffusion specification, the study implied that a country with a sufficiently small
human capital stock (i.e. educational level below a certain number of years) would
exhibit slower TFPG than the leader nation. Their results supported the notion that
quality of human capital does play a positive role in the determination of TFPG through
its influence on the rate of catch-up. Thus, improvement in quality of human capital as a
source of TFPG has proven to be critical in sustaining long-term economic growth
5.2.4 Outward Orientation: Openness and Foreign Direct Investment
Alcala and Ciccone (2004), using real openness measure found that the causal
effect of international trade on productivity across countries had positive, robust and
significant effects on TFPG. Miller and Upadhyay (2000) studied effects of openness,
trade orientation and human capital on TFPG. They concluded that higher openness
benefits TFPG. Outward-oriented countries experienced TFPG over and above the
positive effect of openness. Human capital generally contributed positively to TFPG. In
157

poor countries, however human capital interacted with openness to achieve a positive
effect.
A study by Nishimizu and Robinson (1984) concluded that export expansion led
to higher TFPG through economies of scale and/or through competitive incentives. The
results also showed that increased import substitution (import liberalization) induced
lower (higher) TFP growth perhaps through reducing (increasing) competitive cost-
reduction incentives.
Dollar (1992) showed that high price levels indicated strong protection and
incentives geared to production for the domestic market, whereas low price levels
reflected relatively modest protection and incentives oriented to external markets. The
Asian economies showed less variability of real exchange rate distortion measures,
whereas Latin American economies, in particular were plagued by a high degree of
volatility. His study showed that outward orientation through trade liberalization,
devaluation of real exchange rate, and maintenance of a stable real exchange rate could
dramatically improve growth performance in many poor countries.
Trade openness is only one aspect of the general definition of international
openness. Openness of capital flows is also an important proxy for diffusion of
knowledge. Studying the effect of foreign direct investments (FDI) on host country
growth is important since knowledge transfer may occur from the technologically more
advanced countries to the not so advanced countries through capital movements.
Rogers (2003) described that the general expectation is that the investing firm has
some advantages (e.g. technology) over the domestic firms, and that this should raise
GDP per capita directly and also, perhaps, indirectly (e.g. through supplier linkages and
158
spillovers of knowledge). Cross sectional evidence by Borenstein et al (1998) showed
that FDI is associated with growth and more productive than domestic investment.
Another finding is that FDI only has this impact when educational attainment is above a
certain threshold level. A recent study by Shandre (2004) showed that lagged FDI is
statistically significant and positively correlated with the TFPG in Singapore.
There are other concerns whether capital market liberalization may increase
instability (and thereby reducing investment) as well as leading to capital outflows rather
than inflows. The recent financial crises in East Asia, Russia and Latin America brought
about issues on intervention in capital markets. The study of outward orientation using
trade openness and FDI as a proxy for capital openness can help shed light on its effect
on productivity.
5.2.5 Macroeconomic Stability
Fischer (1993) supported the conventional view that a stable macroeconomic
environment (i.e. a reasonably low rate of inflation, an undistorted foreign market and a
small budget deficit) was conducive for economic growth. Inflation reduced growth by
reducing investment and the rate of productivity growth. However, countries that were
able to reduce the inflation rate in a sustainable way can on average expect higher growth
to follow. The causality and negative association between inflation and growth were not
very robust. Dominance of demand or supply shocks might affect the negative or positive
coefficients though inflation rates were statistically significant in the model.
Larger budget surpluses were also strongly associated with more rapid growth,
through greater capital accumulation and greater productivity growth. The black market
159

exchange rate premium was significant and negatively correlated with the rate of
productivity growth. Although the black market premium was not a good indicator for
macroeconomic stability, the results showed that the exchange rate was associated with
productivity growth.
A study by Ghosh et al. (1996) showed that pegging the exchange rate could
lower inflation by inducing greater policy discipline and instilling greater confidence in
the currency. The exchange rate regime could influence economic growth through
investment or increased productivity. Their results concluded that pegged regimes had
higher investment whereas floating regimes had faster productivity growth. On net, per
capita GDP growth was slightly faster under floating regimes.
5.2.6 Fixed Investments
A large body of empirical literature has found a positive relationship between
rates of fixed capital formation as measured by investment shares of GDP and long run
growth rates of per capita GDP (see Levine and Renelt, 1992; Mankiw et al., 1992). A
research by De Long and Summers (1991,1992,1993) proved that there is a causal link
running from investment rates to growth rates. Their studies showed that faster growth
was triggered by higher investment rates or higher capital formation in the form of
equipment investment.
However Summers and Heston (1991) contrasted the view that the long run
relationship runs in the opposite direction with rapid growth determining higher rates of
capital formation. Recently, Blomstrom et al. (1996) and Carroll and Weil (1994) found
that growth rates Granger-cause investment, but investment rates did not Granger-cause
160

growth rates. Podrecca and Carmeci (2001) reexamined the relationship and discovered
that investment and growth rates ran in both directions. Granger causality from
investment to growth was found to be negative. This result is in contrast with a “capital
fundamentalist” view that sees fixed investment as the key to long run growth, but is fully
consistent with the predictions of Solow-type growth models of exogenous savings.
In the Solow model, long run productivity growth rates are driven by the rate of
technical progress, but changes in investment shares, besides permanently affecting the
long run productivity levels, lead to temporary changes of the growth rates. A rise in
investment rate in t, is associated with a rise in growth rate in t, but precedes falling
growth rates from t+1. Hence current growth rate is expected to be negative during the
transitional dynamics and is reflected in the slow-down of TFPG due to the gestation
period of learning-by-doing in using new capital.
5.3 Methodology and Source of Data
5.3.1 Methodology
Total Factor Productivity Growth (TFPG) was estimated using the Malmquist
Productivity Index and Data Envelopment Analysis in Chapter 4. Table 5.1 shows a
summary of TFPG results for the five sectors. The sources of TFP growth are determined
by running a linear regression model using various independent variables and one
dependent variable, the log of TFPC (see Table 5.2).
5.3.2 Sources of Data
Proxies for the independent variables are obtained from various issues of
Yearbook of Statistics by Department of Statistics, Singapore and its website. In the spirit
161
of the “new growth theory” hypothesis, there are five important exogenous channels
whereby “knowledge diffusion” can occur in the five sectors in Singapore. These sectors
are chosen due to availability of comparable data for the period between 1990 and 2000.
Table 5.1: Malmquist TFPG Index for Five Sectors Sector Manufacturing Financial Transport Real Estate Hotel Year TFPG TFPG TFPG TFPG TFPG 1986 1.257 0.652 1.046 1.050 0.962 1987 1.099 1.222 1.071 0.933 1.014 1988 1.091 0.842 1.077 0.955 1.072 1989 0.995 1.196 1.024 1.046 1.120 1990 0.824 1.009 0.983 0.993 1.209 Total 5.266 4.921 5.201 4.977 5.377
Average 1.053 0.984 1.040 0.995 1.075
1991 1.223 0.849 1.031 0.986 0.974 1992 1.003 1.084 1.046 1.038 1.021 1993 1.068 1.077 0.984 1.035 0.915 1994 1.041 1.185 1.029 1.018 1.050 1995 0.852 1.017 1.021 0.999 0.986 Total 5.187 5.212 5.111 5.076 4.946
Average 1.037 1.042 1.022 1.015 0.989
1996 1.018 1.125 0.994 1.010 0.994 1997 1.013 1.071 0.981 0.987 0.939 1998 1.023 0.878 0.991 0.994 0.921 1999 1.041 1.138 1.033 0.995 0.967 2000 1.061 1.176 1.021 1.002 1.061 Total 5.156 5.388 5.020 4.988 4.882
Average 1.031 1.078 1.004 0.998 0.976
Total 3.122 3.104 3.066 3.008 3.041 Average 1.041 1.035 1.022 1.003 1.014
Malmquist 1.040 1.021 1.022 1.002 1.011
This period represents an important time for study as Singapore has undergone
large increases in property prices amidst an economic boom during 1994-1995 and a
recession during the Asian Currency Crisis during 1997-1998. For this study, the factors
to be investigated are the effect of government’s expenditure on R&D and manpower,
162

outward orientation (through openness of trade and FDI), stable macroeconomic
environment (through inflation and exchange rates) and capital investment as an indicator
of new technology adoption.
As discussed in Chapter 3, the impact of Information, Communications and
Technology (ICT) on the TFPG growth of any economy and especially on the
productivity of the hotel sector is critical. However, at the point of writing, the data on
ICT in the different sectors of Singapore are not comparable and not well documented.
Hence the effect of ICT is left to future research.
5.4 Model Specification and Variables
For a start, the following baseline model is considered but modified later to test
the robustness and significance of various combinations of variables.
lnTFPC = a + b(lnRDEXP) + c(lnMANEXP) + d(lnOPEN) + e(lnFDI))
+ f(EXRATE) + g(RCPI) (Eq 5.1)
where a is the constant, the second and third variables show the effect of government’s
development expenditure on Research & Development activities (lnRDEXP) and
manpower improvement (lnMANEXP). lnOPEN and lnFDI are indicators for outward
orientation and EXRATE and RCPI are indicators for stable macroeconomic environment.
Trend will be added in to capture any time effects. lnCAPX will also be included
at later stage to confirm if the firm’s own technology adoption is significant and
important for TFP growth.
This exercise takes its precedence from Shandre (2004) whereby sources of TFPG
were determined for Singapore by applying a baseline model and estimating a log-linear
163

model. Subsequently the baseline model was modified with the addition of some other
factors. Using the same approach, equation (5.1) is specified as the baseline model and a
log-linear functional form is used.
According to Woodridge (2000), a variable that is a proportion of a percent – such
as unemployment rate, the participation rate in a pension plan, the percentage of students
passing a standardized exam, the arrest rate on reported crimes - can appear in either
original or logarithmic form, although there is a tendency to use them in level forms.
Any regression coefficients involving the original variable such as exchange rates
or inflation rates used in this thesis will have a percentage point change interpretation.
Using logs as in proportion of imports and exports over GDP will mean a percentage
change. The limitation of the log is that it cannot be used if a variable takes on zero or
negative values. However, for log-linear models, since the coefficients are elasticities
which are units invariant, they are easy to interpret. Coefficients of linear models are
derivatives and are not units invariant, making it difficult to understand.
There are many studies that have used log-linear and log-log models to test the
determinants of TFPG. For example, Fu (2005) used both types of models and studied in
details whether exports affected TFPG in China. Muhamad (2004) applied a log-linear
model to examine sources of TFPG in Malaysia by using growth in proportions such as
share of exports in GDP. The following variables were also examined in the “Total
Factor Productivity Growth – Survey Report” by Asian Productivity Organization, 2004:
degree of openness of the economy; foreign direct investment (FDI); R&D activities;
change in economic structure; economic and political stability; economy of scale; and
education and job training.
164
A simple regression is then computed to establish whether there is any statistically
significant association between TFPG and the possible determinants. The expected signs
on the coefficients of the explanatory variables are shown below in brackets.
lnTFPG = f (Government’s expenditure on R&D [+],
Government’s expenditure on manpower [+],
Outward orientation in the form of Openness [+] and FDI [+]
Stable Macroeconomic environment in Exchange Rates [-] and
Inflation Rates [+]
Firm’s own fixed investment in capital expenditure [+]
Time Trend [-] or [+])
The hypothesis is that most of the above determinants will be positively
associated with TFPG except for exchange rates. This is because an increase in exchange
rates will mean a lower value of the Singapore dollar which will affect the output value
negatively. Hence it is important to maintain stable exchange rate policies that will not
affect TFPG in an adverse manner. The rest of the factors have been tested to exhibit
statistically positive associations with TFPG in the literature.
There could be some unobserved, trending factors that may affect TFPG which
might be correlated with the explanatory variables. If this is ignored, there may be a
spurious relationship between TFPG and one or more explanatory variables. The
inclusion of Time Trend will help to eliminate such spurious regression. If the time trend
is significant, then it implies that there are other factors, captured in the time trend, that
affect may TFPG negatively or positively.
165

Table 5.2 shows an example of the various determinants used in the regression for
the hotel sector. Since the hotel sector is the most important sector in this thesis, detailed
description of model specification will be done at the hotel sector section.
Table 5.2: Description of Dependent and Independent Variables Name of Variable Description of Variable LNTFPC log of Total Factor Productivity Change (Dependent Variable) C constant LNOPEN log of (Import plus Export)/GDP LNMANEXP log of government development expenditure on manpower/GDP EXRATE exchange rate between SGD/USD average for year RCPI Inflation rate (Consumer price index Nov.1997-Oct 1998 = 100) LNFDI log of foreign direct equity investment on hotels/GDP - current LNFDI1 log of foreign direct equity investment on hotels/GDP - lag one period TREND time trend LNRDEXP log of government development expenditure on R&D/GDP - current
LNRDEXP1 log of government development expenditure on R&D/GDP - lag one period
LNRDEXP2 log of government development expenditure on R&D/GDP - lag two periods
LNCAPX log of capital expenditure spent by hotel sector/GDP – current LNCAPX1 log of capital expenditure spent by hotel sector/GDP – lag one period
166

5.5 Results and Discussion
Manufacturing Sector
Table 5.3: Regression Analysis for Manufacturing Sector VARIABLES 1st Reg 2nd Reg 3rd Reg C -7.6535 -7.0978 0.7312 (-1.1126) (-1.6794) (0.7919) LNOPEN 2.2392 na -0.6509 (-1.014) (-0.9918) LNMANEXP -0.4759 -0.4937 na (-1.0693) (-1.2944) EXRATE 2.0396 1.3137 na (1.5452) -1.7899 RCPI 0.0265 0.0420 na (0.2851) (0.8009) LNFDI -0.1103 -0.4539 na (-0.2494) (-1.1428) LNFDI1 na na 0.4792^ (2.0307) TREND na 0.0979^ na (2.2133) LNRDEXP 0.274782^ na -0.1463^ (2.3628) (-2.1568) LNRDEXP1 na na na LNRDEXP2 na na na LNCAPX na na na LNCAPX1 na na na R² 0.6305 0.5269 0.5394 Ř² 0.0763 0.0538 0.1710 F-statistic 0.4715 0.4544 0.3381
* significant at 5% ^ significant at 10% # significant at 15%
Table 5.3 shows three out of twelve regression analyses done for the
manufacturing sector. The rest are not reported due to insignificant results. The third
167
regression shows that foreign investments from abroad are significant for TFPG at ten
percent in the manufacturing sector. The government’s own expenditure on R&D is
significant at ten percent but may have a negative effect at the initial stage due to
gestation period.
Financial Sector Table 5.4 shows five out of seventeen regression analyses and highlights the
important determinants of TFPG in the financial sector. The fourth regression shows that
government’s expenditure on manpower training and R&D, and stable macro-economic
environment (in terms of control of inflation and exchange rate policies) are significant at
five percent. This means that the spillover effects from technological progress from R&D
are very important for productivity in the financial sector, through upgrading of
technology and management systems. Spillovers from training of manpower through
highly qualified workers required for risk and bank management are significant.
The stability of macroeconomic environment is highly important is evident
through the Asian Financial Crisis during 1997-1998. Foreign direct investments from
abroad are significant at ten percent. As foreign technology and expertise are imported
into the financial system, they provide a vehicle for improving productivity.
As Singapore develops into a financial hub, such TFPG is important for the
economy in the long run. If such technological progress is spilled over to other sectors, it
will reverse Weil’s observation: that the flow of spillover is possible from a highly
productive service sector to the manufacturing sector. Further research is needed to
confirm such a possibility.
168

Table 5.4: Regression Analysis for Financial Sector VARIABLES 1st Reg 2nd Reg 3rd Reg 4th Reg 5th Reg C 10.8756 10.9567* 8.9251* 10.5649* 11.6808* (1.8192) (2.8570) (3.3887) (3.4177) (3.8708) LNOPEN -2.1721 na na na na (-1.0446) LNMANEXP 0.7867 0.5552^ 0.2603 1.3221* 0.6005 (1.7425) (2.0828) (0.9713) (3.1029) (2.1825) EXRATE -1.9703 -1.7575* -0.9595 -1.4567* -1.7343* (-1.6090) (-2.9341) (-2.3302) (-3.1964) (-3.6981) RCPI 0.1679^ 0.0971* 0.1063^ 0.1742* 0.1054* (2.2156) (2.5797) (2.7541) (4.0161) (3.5397) LNFDI 0.0518 2.5276^ na na 2.2722 (0.0467) (2.0793) (1.7180) LNFDI1 -0.0463 na 2.4667^ -2.7002^ na (-0.2356) (2.5736) (-2.6756) TREND na -0.1711^ -0.1687^ na -0.1854^ (-2.1923) (-3.0456) (-2.8518) LNRDEXP na na 0.2496^ na na (3.1755) LNRDEXP1 na na na 0.2651* 0.1037 (3.1359) -1.7041 LNRDEXP2 na na na na na LNCAPX na na na na na LNCAPX1 na na na na na R² 0.6730 0.7509 0.9105 0.8575 0.9083 Ř² 0.1826 0.5017 0.7314 0.6794 0.7249 F-statistic 0.3961 0.1256 0.1050 0.0765 0.1085
* significant at 5% ^ significant at 10% # significant at 15%
Transport Sector
Table 5.5 shows five out of fourteen regression analyses for the transport sector.
The common results show that expenditure on manpower training and stability of
exchange rate policies are important determinants of TFPG in this sector. The trend is
169

also significant which implies that technical change through time is important for long
run economic growth.
Table 5.5: Regression Analysis for Transport Sector
VARIABLES 1st Reg 2nd Reg 3rd Reg 4th Reg 5th Reg C 2.5067* 1.4809 1.9866* 2.0837* 2.0987* (4.1379) (2.0844) (3.2254) (3.1680) (3.3424) LNOPEN na na na na na LNMANEXP 0.1965* 0.1962* 0.1971* 0.1875* 0.1981* (3.5956) (4.2723) (3.6467) (2.9422) (3.4928) EXRATE -0.2287 -0.2727* -0.2595* -0.2408^ -0.2520^ (-2.3881) (-3.3278) (-2.8226) (-2.1462) (-2.4826) RCPI 0.0171 0.0050 0.0082 na na (1.9310) (0.7499) (1.2669) LNFDI na na na na na LNFDI1 0.0976 -0.1305 na 0.0245 na (1.0236) (-0.8962) (0.2385) TREND -0.0289* -0.0123 -0.0184^ -0.2444* -0.0235* (-3.7262) (-1.2226) (-2.4739) (-2.9750) (-3.6893) LNRDEXP 0.0173 na na na na (1.0129) LNRDEXP1 na na -0.0091 na na (-0.8067) LNRDEXP2 na na na na na LNCAPX na -0.0742 na na na (-1.6427) LNCAPX1 na na na na 0.0184 (0.6040) R² 0.8913 0.9232 0.8554 0.7513 0.7656 Ř² 0.6740 0.7697 0.6747 0.5524 0.5781 F-statistic 0.1371 0.0847 0.0786 0.0887 0.0775
* significant at 5% ^ significant at 10% # significant at 15%
170

Real Estate Sector
Table 5.6: Regression Analysis for Real Estate Sector VARIABLES 1st Reg 2nd Reg 3rd Reg C 2.5096^ 2.3737* 2.2612^ (2.3963) (5.2621) (3.5684) LNOPEN na na 0.0963 -0.6531 LNMANEXP 0.1652 0.1582* 0.1509^ (2.3307) (5.1861) (3.5655) EXRATE -0.3242 -0.3269* -0.3061^ (-1.9823) (-4.6563) (-3.2840) RCPI 0.0096 0.0052 na (1.2109) (1.4549) LNFDI na na na LNFDI1 0.1028 0.0993^ 0.1118 (1.3752) (3.0923) (1.6338) TREND -0.0331^ -0.0310* -0.336^ (-3.0677) (-6.6358) (-3.2373) LNRDEXP na na na LNRDEXP1 0.0374^ 0.0313* 0.0328^ (3.1738) (5.8936) -3.3751 LNRDEXP2 na na na LNCAPX na na na LNCAPX1 na (-0.0319^) -0.0301 (-3.7781) (-2.2074) R² 0.8314 0.9793 0.9649 Ř² 0.4943 0.9068 0.8418 F-statistic 0.2452 0.0706 0.1177
* significant at 5% ^ significant at 10% # significant at 15%
Table 5.6 shows three out of twelve regression analyses for the real estate and
business service sector. The results from the second regression imply that government’s
expenditure on manpower and R&D are significant at five percent. Stable
171

macroeconomic environment, in terms of exchange rate policies is also significant at five
percent. Foreign direct investments and the firm’s own capital investments are significant
at ten percent. This means that imported technology and knowledge from overseas and
local investments in capital are critical for the technological progress of this sector.
Hotel Sector
Table 5.7 shows the correlation matrix of the relevant variables for the hotel
sector. Table 5.8 gives a summary of results after seven regression analyses with the
relative t-statistics in parentheses. Looking at the F-statistics and critical values, all seven
regressions are jointly significant.
Table 5.7: Correlation Matrix for Hotel Sector TFPC RDEXP FDI MANEX TREND RCPI CAPX EXRATE
TFPC 1.00000 0.074432 0.480693 0.140731 0.007183 0.381718 0.140759 0.015183
RDEXP 0.074432 1.000000 -0.188259 0.715017 0.886919 -0.540805 -0.569944 0.194597
FDI1 0.480693 -0.188259 1.000000 -0.008598 -0.015855 0.219408 -0.142337 0.074373
MANEX 0.140731 0.715017 -0.008598 1.000000 0.866276 -0.732388 -0.399946 0.740170
TREND 0.007183 0.886919 -0.015855 0.866276 1.000000 -0.722745 -0.603482 0.374798
RCPI 0.381718 -0.540805 0.219408 -0.732388 -0.722745 1.000000 0.203934 -0.428129
CAPX1 0.140759 -0.569944 -0.142337 -0.399946 -0.603482 0.203934 1.000000 -0.189641
EXRATE 0.015183 0.194597 0.074373 0.740170 0.374798 -0.428129 -0.189641 1.000000
Regression 1
Using the baseline model (Equation 1), the coefficients of constant, openness and
R&D spending were insignificant. Inflation rate and manpower spending are positively
significant at 5% whereas exchange rate and FDI are significant at 10% but both signs are
negative.
172

Table 5.8: Regression Analysis for Hotel Sector VARIABLES 1st Reg 2nd Reg 3rd Reg 4th Reg 5th Reg 6th Reg 7th Reg C 4.4497 4.3847^ 4.6272* 4.2131* 5.3228* 5.2199* 4.9498* (2.0045) (2.7648) (5.5743) (9.2213) (12.4386) (155.7106) (38.6289) LNOPEN -0.8611 0.0999 na na na na na (-1.3674) (0.1594) LNMANEXP 0.4559* 0.5126* 0.5267* 0.3842* 0.4398* 0.4249* 0.4029* (3.0527) (4.6704) (7.4507) (9.7155) (11.9492) (143.7192) (34.9923) EXRATE -0.9330^ -0.7317 -0.7755* -0.5766* -0.6835* -0.665* -0.6174*
(-2.2060) (-2.3177) (-5.7263) (-8.5335) (-9.6442) (-
119.4688) (-
28.5068) RCPI 0.0865* 0.0666^ 0.0707* 0.0451* 0.0423* 0.0392* 0.0445* (3.0351) (2.9893) (7.0626) (9.7122) (7.8337) (87.1613) (31.1823) LNFDI -0.1624^ -0.1572* -0.1591* na na na na (-2.4648) (-3.3358) (-4.5702) LNFDI1 na na na 0.0982* 0.141* 0.1512* 0.1437* (6.4890) (5.7999) (77.2032) (23.2148)
TREND na -0.0360 -0.0352* -0.2355* -0.0378* -0.0387* -
0.03212*
(-2.1997) (-4.3949) (-
4.5767) (-7.4724) (-98.2669) (-
19.5203) LNRDEXP -0.0801 0.0022 na na na na (-1.8868) (0.4494)
LNRDEXP1 na na na -
0.02491^ na na na (-3.0598) LNRDEXP2 na na na na 0.0087 0.0107* 0.0105# (0.9291) (14.5734) (4.3576) LNCAPX na na na -0.0058 na -0.0124* na (-0.7362) (-18.2848) LNCAPX1 na na na na na na 0.0143# (5.4829) R² 0.915962 0.967800 0.967300 0.993086 0.992600 0.999978 0.999763 Ř² 0.789900 0.892800 0.934500 0.968886 0.970500 0.999824 0.998103 F-statistic 7.266206 12.89668 29.54614 41.03641 44.93298 6505.308 602.4548
* significant at 5%
^ significant at 10%
# significant at 15%
173
Regression 2
Trend is added to disentangle the effects of time from other variables. The
regression results improve slightly with the constant and inflation significant at 10%.
Manpower spending and FDI are significant at 5% but FDI coefficient is still negative.
This shows that manpower spending is quite robust and is an important determinant of
TFP growth as predicted. Trend, openness, exchange rates and R&D spending still
remain insignificant.
lnTFPC = a + b(lnRDEXP) + c(lnMANEXP) + d(lnOPEN) + e(lnFDI))
+ f(EXRATE) + g(RCPI) +h(Trend) (Eq 5.2)
Regression 3
As openness could be highly correlated with FDI, openness and R&D spending
are dropped from the equation. Using Equation 3, the results show that all the variables
are now significant at 5% including the trend.
lnTFPC = a + b(lnMANEXP) + c(lnFDI)) + d(EXRATE) + e(RCPI) + f(Trend)
(Eq 5.3)
The coefficient for FDI is still negative. From the empirical literature, FDI is
important for TFP growth in terms of technology transfer. The negative sign may be
interpreted as an “absorption period” when there is some gestation before workers learn
the new technologies. To capture the “learning-by- doing” effect, regression 4 uses FDI
in one period lag.
174

The macroeconomic indicators are quite robust and significant at 5%. There is
positive correlation between inflation and TFP growth. The causality direction requires
further econometric studies which is outside the scope of this study. As Fischer (1993)
suggests, the dominance of demand or supply external shocks will influence the positive
or negative effects of inflation. The more important issue is to maintain a low inflation
rate and undistorted exchange rate system in the economy.
The exchange rate coefficient is negative which implies that TFP growth is
negatively associated with the exchange rates in the hotel sector. This is quite expected as
the hotel sector is highly dependent on tourists from abroad. Any fluctuation or distortion
in the exchange rate will affect its growth. An upward movement in the exchange rate
means that the Singapore currency is weaker and the hotel revenue will be less.
Conversely, hotel operating costs will increase due to the large amount of
imported raw materials used in the hotel sector like wine, cheese, seafood, beef, etc.
Overall, the importance of stable macroeconomic environment in terms of inflation and
exchange rate is significant for the hotel sector in Singapore. This is especially evident
during Asian Currency/Financial Crisis in 1997 to 1998 when the tourism sector was hit
by the unstable macroeconomic environment.
Regression 4
Regressing R&D spending with a time lag of one period is done to check its
significance. Firm’s own capital expenditure is also included to see if there are any
interaction effects. Equation 5.4 shows the modified regression model.
175

lnTFPC = a + b(lnMANEXP) + c(lnFDI1)) + d(EXRATE) + e(RCPI) + f(Trend)
+ g(lnRDEXP1) + h(lnCAPX) (Eq 5.4)
Results show that all the existing variables are significant at 5%. FDI with lag of
one period is now positively significant at 5%. Thus the hypothesis that there is a period
of “learning-by-doing” is confirmed. An increase in FDI suggests that the economy is
more outward oriented and this is critical for TFP growth. Openness of trade does not
seem to be a good indicator of the outward orientation and is insignificant for the
Singapore hotel sector. R&D spending is now negatively significant at 10% but firm’s
own capital expenditure is not significant.
Regression 5
Since R&D may take a longer gestation period, in Equation 5 R&D is lagged two
periods to see if the positive effects will occur. Firm’s capital expenditure is removed for
the time being to separate the interaction effects.
lnTFPC = a + b(lnMANEXP) + c(lnFDI1)) + d(EXRATE) + e(RCPI) + f(Trend)
+ g(lnRDEXP2) (Eq 5.5)
The improved results showed that all variables are significant at 5% except R&D lagged
two periods. This could mean that government’s expenditure on R&D may not be
significant for the hotel sector unless hotels participate in new capital investment.
Innovation can be diffused in the economy if the hotel sector collaborates and takes up
the new ideas through capital investments.
176

Regression 6
In equation 6, we add the firm’s capital expenditure and the results show all
variables are significant at 5%. The coefficient of R&D spending is now positive which is
what is expected. This suggests that government’s policy in encouraging R&D does
interact with firm’s own capital investment to make significant contribution to TFP
growth. The “spillover of knowledge” effect from the economy to the hotel sector is
confirmed as discussed. The co-efficient for capital investment is negative, as predicted
in Solow’s theory in Section 3. The firm’s own fixed investment will contribute
negatively to TFP growth due to gestation period of “learning-by-doing” in learning new
technologies.
lnTFPC = a + b(lnMANEXP) + c(lnFDI1)) + d(EXRATE) + e(RCPI) + f(Trend)
+ g(lnRDEXP2) + h(lnCAPX) (Eq 5.6)
Regression 7
Finally, the last regression is to trace whether firm’s capital investment is
positively significant after the gestation period. Equation 7 includes firm’s capital
expenditure with a lag of one period.
lnTFPC = a + b(lnMANEXP) + c(lnFDI1)) + d(EXRATE) + e(RCPI) + f(Trend)
+ g(lnRDEXP2) + h(lnCAPX1) (Eq 5.7)
Both firm’s capital expenditure and R&D expenditure are now positively
significant at 15%. This suggests that the workers tend to “learn-by-doing” and take time
to unbundle new technology embodied in the form of new technology adoption.
Foreign Direct Investments are significant at 5% after one lag period which
177
suggests that technology transfer from these foreign investment companies could be
slower than expected due the absorption period required by the hotel workforce. This
may have affected the efficiency and productivity growth of the hotel industry generally.
Table 5.9 shows the estimated percentage of independent and chain gazetted
hotels in Singapore as at December 2003. As described by American Hotel and Motel
Association, chain hotels may be managed by international hotel chains under parent
company, management contract, franchise and referral group hotels and mostly
commonly known as MNCs (multi-national corporations).
About 40% of the gazetted hotels managed under international chains comes from
the highest percentage (78%) of very large hotels. 60% of the gazetted hotels are
managed by independent hotels with the highest percentage (95%) coming from small
hotels with less than 201 rooms. Three questions are raised when analyzing the
underlying implications of the results of the regressions on the productivity of the hotel
sector.
• Is the slowdown in technical diffusion affected by the size and type of hotel
management, such as big foreign MNCs or small independent hotels?
• As the government policy has been pro-MNC, have productivity gains in
international hotel chains been crowded out by small, independent hotels in
Singapore or vice versa?
• The results showed that foreign investments are positively related to TFPG,
but productivity growth in the hotel sector has been very low and slow. Does
it mean that there has been limited or no technology transfer from these
foreign MNC firms?
178

A study by Nankervis and Debrah (1995) reported that Singaporean hotels have
experienced difficulties in attracting employees to “low status” hotel occupations. Hence
they tend to recruit both workers with prior hotel experience and increasingly those with
broad skills. Due to the shortage of labor, training and development, career planning and
enhanced remuneration programmes would be essential to retain highly motivated,
mature employees with generic and translatable job competencies.
The authors also showed Singapore has a substantial proportion of hotels owned
by MNCs whilst smaller or lower graded properties will remain largely in the hands of
local entrepreneurs or owner-operators. A potential consequence of the former
phenomenon is the standardization of service along with increased emphasis on
efficiency, productivity and hence profitability. This may result in positive Human
Resource Management (HRM) outcomes such as targeted recruitment, international
training and development programmes closely linked with career paths and improved
remuneration compared to Australian counterparts.
However, with 60% of independent hotels, the efficiency and productivity created
by the MNCs could have been crowded out by the “not-so-efficient” local practices found
in the independent hotels. Relatively low wages of Singaporean hotel workers and the
unattractiveness of the status of hotel workers can lead to high turnover rates. All these
factors could have slowed down the productivity of the hotel sector.
Thus, the three questions can only be answered with more research done in the
hotel sector and the government can divert more resources to help strengthen this sector
by encouraging more tourism/hospitality institutes to invest in research activities.
179
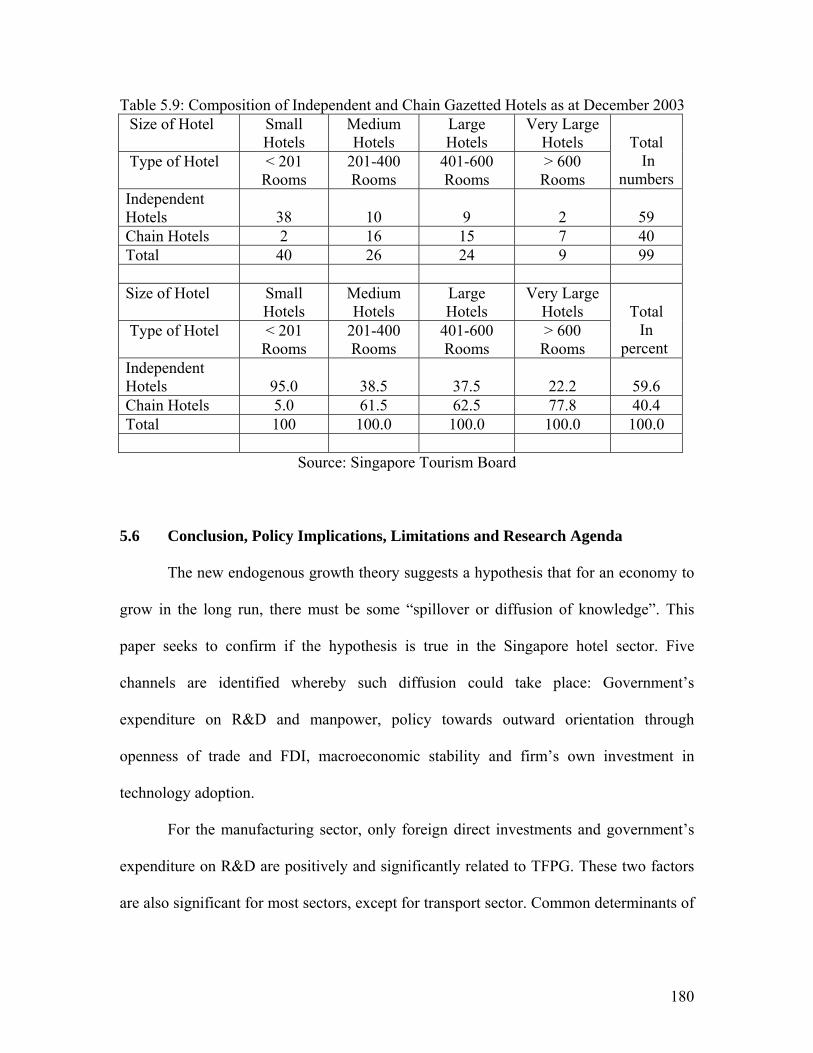
Table 5.9: Composition of Independent and Chain Gazetted Hotels as at December 2003 Size of Hotel
Small Hotels
Medium Hotels
Large Hotels
Very Large Hotels
Type of Hotel
< 201 Rooms
201-400 Rooms
401-600 Rooms
> 600 Rooms
Total In
numbers Independent Hotels 38 10 9 2 59 Chain Hotels 2 16 15 7 40 Total 40 26 24 9 99 Size of Hotel
Small Hotels
Medium Hotels
Large Hotels
Very Large Hotels
Type of Hotel
< 201 Rooms
201-400 Rooms
401-600 Rooms
> 600 Rooms
Total In
percent Independent Hotels 95.0 38.5 37.5 22.2 59.6 Chain Hotels 5.0 61.5 62.5 77.8 40.4 Total 100 100.0 100.0 100.0 100.0
Source: Singapore Tourism Board
5.6 Conclusion, Policy Implications, Limitations and Research Agenda
The new endogenous growth theory suggests a hypothesis that for an economy to
grow in the long run, there must be some “spillover or diffusion of knowledge”. This
paper seeks to confirm if the hypothesis is true in the Singapore hotel sector. Five
channels are identified whereby such diffusion could take place: Government’s
expenditure on R&D and manpower, policy towards outward orientation through
openness of trade and FDI, macroeconomic stability and firm’s own investment in
technology adoption.
For the manufacturing sector, only foreign direct investments and government’s
expenditure on R&D are positively and significantly related to TFPG. These two factors
are also significant for most sectors, except for transport sector. Common determinants of
180
TFPG on the other four sectors are government’s expenditure on manpower and stable
exchange policies except for manufacturing sector.
Outward orientation in terms of openness of trade does not seem to be related to
TFPG in all the sectors. Control of inflation as part of the macroeconomic stability was
significant for the financial and hotel sectors. Firm’s own capital investment was
significant for the real estate and hotel sectors as these two sectors invest heavily in fixed
assets in Singapore. So investing in the right technology and properties will enhance
TFPG of these sectors.
For the hotel sector, government’s expenditure on manpower is very significant.
Upgrading of skills, knowledge and quality of manpower or human capital can contribute
to TFP growth has been confirmed by extensive literature. Policy towards outward
orientation in the form of FDI is significant, albeit the spillover can only be seen at a later
stage due to the gestation period of “learning-by-doing” required by the workers to catch
up with the technology.
Outward orientation through openness of trade does not seem to have a significant
effect on the hotel sector. The Singapore government should specifically encourage
foreign multi national companies to invest their capital in the hotel sector so that the
technology transfer can take place. However, careful consideration must be given to the
crowding out effect on the local hotels if technology transfer is limited.
A stable macroeconomic environment (where inflation is low and exchange rates
are not too volatile) can provide a conducive business environment for gains in economic
growth and productivity. This is because the hotel sector depends heavily on the global
181
customers and less on domestic customers. This makes the management of exchange rate
critical as hotel goods and services are very often paid using foreign currencies.
An undistorted exchange rate will induce favourable consumption from foreign
customers. Similarly, a low inflation rate means attractive and stable prices when
consuming hotel goods and services produced in Singapore. The increased in sales will
lead to more profits in the hotel sector which can then be used for productivity growth.
Finally, government’s spending in R&D will only be effective if the hotels
collaborate to take up new capital investment such as new technology reservation systems,
computer, etc. Most R&D in Singapore is concentrated on sciences, engineering and
information technology, thus the diffusion of knowledge to the hotel sector will be slower
and not so strong.
Effects of firm’s own capital investment on TFP growth may be negative in the
current period due to the gestation period of “learning by doing” of new technology. But
at a later stage, the effect becomes positive, especially when interacting with
government’s policy to encourage R&D and entrepreneurial activities.
In conclusion, this study shows that the hypothesis of “diffusion of knowledge” is
confirmed in the five sectors, albeit through different channels for each sector.
Government can divert resources towards upgrading the quality of manpower through
more training, education and skills development. Liberalizing policies on foreign direct
investments can create a more outward orientated environment for other countries to
invest in Singapore. In this way, imported knowledge, technology and expertise can be
diffused through time among the firms in a particular industry.
182

Government can continue to create incentives for innovation through R&D
activities and investing in new technology. Companies who are willing to upgrade and
adopt new technology in terms of capital expenditure should be given tax rebates and
incentives so that their burden of capital costs will be lessened. It is also important that a
stable macroeconomic environment be maintained through proper controls of inflation
and exchange rates.
The results are limited as sample years are small, thus long run effects are not
clearly investigated. Longer time series would produce more reliable and robust results.
Using a linear regression model may not reveal the causality direction of the relationship
between the various variables and TFP growth. Granger causality tests could be utilized
to confirm the causality direction and deepen the understanding of the sources of TFP
growth. The possibility of correlation between government’s expenditure on R&D and
manpower (although they are theoretically different channels) may have resulted in some
unreliable findings. More advanced econometric techniques are needed to disentangle
their effects in future studies.
The research agenda may include other channels whereby diffusion can take place,
for example through information and communication technologies (ICT), financial
development and better infrastructure. These determinants may be just as significant for
the TFP growth of all sectors in Singapore. Investigation on whether such
“knowledge/technology diffusion” can take place from one sector to another sector is also
highly recommended.
183