tfspc fs0312 toyota financial services philippines corporation€¦ · toyota financial services...
TRANSCRIPT
Toyota Financial Services Philippines Corporation
Financial Statements March 31, 2012 and 2011 and Independent Auditors’ Report SyCip Gorres Velayo & Co.
*SGVMC118066*
INDEPENDENT AUDITORS’ REPORT The Stockholders and the Board of Directors Toyota Financial Services Philippines Corporation Report on the Financial Statements We have audited the accompanying financial statements of Toyota Financial Services Philippines Corporation, which comprise the statements of financial position as at March 31, 2012 and 2011, and the statements of comprehensive income, statements of changes in equity and statements of cash flows for the years then ended, and a summary of significant accounting policies and other explanatory information. Management’s Responsibility for the Financial Statements Management is responsible for the preparation and fair presentation of these financial statements in accordance with Philippine Financial Reporting Standards, and for such internal control as management determines is necessary to enable the preparation of financial statements that are free from material misstatement, whether due to fraud or error. Auditors’ Responsibility Our responsibility is to express an opinion on these financial statements based on our audits. We conducted our audits in accordance with Philippine Standards on Auditing. Those standards require that we comply with ethical requirements and plan and perform the audit to obtain reasonable assurance about whether the financial statements are free from material misstatements. An audit involves performing procedures to obtain audit evidence about the amounts and disclosures in the financial statements. The procedures selected depend on the auditor’s judgment, including the assessment of the risks of material misstatement of the financial statements, whether due to fraud or error. In making those risk assessments, the auditor considers internal control relevant to the entity’s preparation and fair presentation of the financial statements in order to design audit procedures that are appropriate in the circumstances, but not for the purpose of expressing an opinion on the effectiveness of the entity’s internal control. An audit also includes evaluating the appropriateness of accounting policies used and the reasonableness of accounting estimates made by management, as well as evaluating the overall presentation of the financial statements. We believe that the audit evidence we have obtained is sufficient and appropriate to provide a basis for our audit opinion.
SyCip Gorres Velayo & Co. 6760 Ayala Avenue 1226 Makati City Philippines
Phone: (632) 891 0307 Fax: (632) 819 0872 www.sgv.com.ph BOA/PRC Reg. No. 0001, January 25, 2010, valid until December 31, 2012 SEC Accreditation No. 0012-FR-2 (Group A), February 4, 2010, valid until February 3, 2013
A member firm of Ernst & Young Global Limited

*SGVMC118066*
- 2 - Opinion In our opinion, the financial statements present fairly, in all material respects, the financial position of Toyota Financial Services Philippines Corporation as at March 31, 2012 and 2011, and its financial performance and its cash flows for the years then ended in accordance with Philippine Financial Reporting Standards. Report on the Supplementary Information Required Under Revenue Regulations 19-2011 and 15-2010 Our audits were conducted for the purpose of forming an opinion on the basic financial statements taken as a whole. The supplementary information required under Revenue Regulations 19-2011 and 15-2010 in Note 28 to the financial statements is presented for purposes of filing with the Bureau of Internal Revenue and is not a required part of the basic financial statements. Such information is the responsibility of the management of the Company. The information has been subjected to the auditing procedures applied in our audit of the basic financial statements. In our opinion, the information is fairly stated in all material respects in relation to the basic financial statements taken as whole. SYCIP GORRES VELAYO & CO. Janet A. Paraiso Partner CPA Certificate No. 92305 SEC Accreditation No. 0778-AR-1 (Group A), February 2, 2012, valid until February 1, 2015 Tax Identification No. 193-975-241 BIR Accreditation No. 08-001998-62-2012, April 11, 2012, valid until April 10, 2015 PTR No. 3174578, January 2, 2012, Makati City July 4, 2012

*SGVMC118066*
TOYOTA FINANCIAL SERVICES PHILIPPINES CORPORATION STATEMENTS OF FINANCIAL POSITION March 31 2012 2011
ASSETS
Cash (Notes 4, 22, 23 and 25) P=1,216,209,838 P=1,221,471,063
Due from Bangko Sentral ng Pilipinas (Notes 4, 23 and 25) 1,595,003,345 1,690,041,380
Securities Purchased Under Resale Agreement (Note 5) 540,000,000 208,000,000
Available-for-Sale Investments (Notes 6, 23 and 25) 930,000 955,000
Loans and Receivables (Notes 7, 11, 23 and 25) 17,542,603,072 16,641,743,028
Assets Held for Sale (Note 8) 74,860,784 63,358,174
Property and Equipment (Note 9) 17,337,934 16,380,855
Software Costs (Note 10) 22,647,467 21,670,634
Deferred Tax Assets (Note 20) 113,392,599 88,857,053
Other Assets (Note 10) 21,700,434 11,298,236 P=21,144,685,473 P=19,963,775,423
LIABILITIES AND EQUITY
LIABILITIES
Loans Payable (Notes 12, 22, 23 and 25) P=14,408,406,141 P=15,549,334,873
Derivative Liability (Notes 15 and 23) 34,246,258 70,548,282
Accounts Payable and Other Liabilities (Notes 14, 22, 23, and 25) 550,013,206 411,907,333
Deposits on Lease Contracts (Note 16) 2,921,006,789 1,993,934,583
Subordinated Debt (Note 13) 996,239,534 –
Income Tax Payable 39,940,720 23,512,716 18,949,852,648 18,049,237,787
EQUITY
Capital Stock - P=100 par value Authorized, issued and outstanding - 10,000,000 shares
(Note 24) 1,000,000,000 1,000,000,000
Retained Earnings (Note 24) 1,137,136,606 892,526,833
Net Unrealized Gain on Available-for-Sale
Investments (Note 6) 120,000 45,000
Cash Flow Hedge Reserve (Note 15) 57,576,219 21,965,803 2,194,832,825 1,914,537,636 P=21,144,685,473 P=19,963,775,423 See accompanying Notes to Financial Statements.

*SGVMC118066*
TOYOTA FINANCIAL SERVICES PHILIPPINES CORPORATION STATEMENTS OF COMPREHENSIVE INCOME Years Ended March 31 2012 2011
INTEREST INCOME Loans and receivables (Note 7) P=1,681,753,792 P=1,594,479,822 Cash and cash equivalents (Notes 4 and 22) 69,777,148 96,970,933 1,751,530,940 1,691,450,755
INTEREST EXPENSE (Notes 12, 13 and 22) 871,324,497 926,500,660
NET INTEREST INCOME 880,206,443 764,950,095
SERVICE FEES AND OTHER INCOME (Note 18) 94,012,903 104,229,186
OPERATING EXPENSES Provision for credit and impairment losses (Notes 7, 8 and 11) 269,173,350 147,352,989 Taxes and licenses 108,935,058 110,631,053 Compensation and fringe benefits (Notes 19 and 22) 71,990,427 92,717,359 Occupancy (Note 21) 43,403,873 44,662,006 Sales and marketing 30,988,799 45,431,524 Litigation 28,693,957 23,261,859 Management and professional fees 16,987,702 16,496,025 Depreciation and amortization (Notes 9 and 10) 10,756,533 20,472,814 Entertainment, amusement and recreation (Note 20) 9,161,400 8,356,705 Credit investigation 8,350,866 10,798,807 Transportation and travel 6,087,398 5,370,346 Others 15,266,754 12,559,687 619,796,117 538,111,174
INCOME BEFORE INCOME TAX 354,423,229 331,068,107
PROVISION FOR INCOME TAX (Note 20) 109,813,456 103,433,869
NET INCOME 244,609,773 227,634,238
OTHER COMPREHENSIVE INCOME Net unrealized gain on available-for-sale investments 75,000 45,000 Net movement on cash flow hedges (Note 15) 50,872,023 11,956,004 Income tax effect (Note 20) (15,261,607) (3,586,801) 35,610,416 8,369,203 35,685,416 8,414,203
TOTAL COMPREHENSIVE INCOME P=280,295,189 P=236,048,441 See accompanying Notes to Financial Statements.

*SGVMC118066*
TOYOTA FINANCIAL SERVICES PHILIPPINES CORPORATION STATEMENTS OF CHANGES IN EQUITY
For the Years Ended March 31, 2012 and 2011
Capital Stock
(Note 24)
Retained Earnings (Note 24)
Net Unrealized Gain on
Available-for-Sale
Investments (Note 6)
Cash Flow Hedge Reserve
(Note 15) Total
Balances at April 1, 2011 P=1,000,000,000 P=892,526,833 P=45,000 P=21,965,803 P=1,914,537,636 Net income – 244,609,773 – – 244,609,773 Other comprehensive income – – 75,000 35,610,416 35,685,416 Total comprehensive income – 244,609,773 75,000 35,610,416 280,295,189 Balances at March 31, 2012 P=1,000,000,000 P=1,137,136,606 P=120,000 P=57,576,219 P=2,194,832,825
Balances at April 1, 2010 P=1,000,000,000 P=664,892,595 P=– P=13,596,600 P=1,678,489,195 Net income – 227,634,238 – – 227,634,238 Other comprehensive income – – 45,000 8,369,203 8,414,203 Total comprehensive income – 227,634,238 45,000 8,369,203 236,048,441 Balances at March 31, 2011 P=1,000,000,000 P=892,526,833 P=45,000 P=21,965,803 P=1,914,537,636 See accompanying Notes to Financial Statements.

*SGVMC118066*
TOYOTA FINANCIAL SERVICES PHILIPPINES CORPORATION STATEMENTS OF CASH FLOWS Years Ended March 31 2012 2011
CASH FLOWS FROM OPERATING ACTIVITIES Income before income tax P=354,423,229 P=331,068,107 Adjustments for: Provision for credit and impairment losses (Notes 7, 8 and 11) 269,173,350 147,352,989 Depreciation and amortization (Notes 9 and 10) 10,756,533 20,472,814
Loss (gain) on sale of assets held for sale (Notes 18 and 26) 9,349,983 (9,444,894) Gain on sale of property and equipment (1,005,875) (984,444) Changes in operating assets and liabilities: Decrease (increase) in: Loans and receivables (1,538,076,995) (4,482,338,606) Other assets (10,302,198) 6,884,146 Increase in: Deposits on lease contracts 927,072,206 1,192,524,712 Accounts payable and other liabilities 136,683,642 87,612,922 Net cash generated from (used for) operations 158,073,875 (2,706,852,254) Income taxes paid (131,760,374) (116,527,495) Net cash provided by (used in) operating activities 26,313,501 (2,823,379,749)
CASH FLOWS FROM INVESTING ACTIVITIES Acquisitions of: Property and equipment (Notes 9 and 26) (11,411,842) (2,243,852) Software (Note 10) (7,687,352) (7,572,403) Proceeds from sale of:
Assets held for sale 335,955,565 191,821,279 Property and equipment 18,650,067 5,890,225
Net cash provided by investing activities 335,506,438 187,895,249
CASH FLOWS FROM FINANCING ACTIVITIES Proceeds from availment of loans payable 9,690,385,114 10,502,838,642 Proceeds from issuance of subordinated debt 990,560,879 – Payments of loans payable (10,811,065,192) (7,337,320,093) Net cash provided by (used in) financing activities (130,119,199) 3,165,518,549
NET INCREASE IN CASH AND CASH EQUIVALENTS 231,700,740 530,034,049
CASH AND CASH EQUIVALENTS AT BEGINNING OF YEAR Cash 1,221,471,063 1,231,774,289 Due from Bangko Sentral ng Pilipinas 1,690,041,380 1,357,704,105 Securities Purchased Under Resale Agreement 208,000,000 – 3,119,512,443 2,589,478,394
(Forward)

*SGVMC118066*
- 2 - Years Ended March 31 2012 2011
CASH AND CASH EQUIVALENTS AT END OF YEAR Cash 1,216,209,838 1,221,471,063 Due from Bangko Sentral ng Pilipinas 1,595,003,345 1,690,041,380 Securities Purchased Under Resale Agreement 540,000,000 208,000,000 P=3,351,213,183 P=3,119,512,443 Years Ended March 31 2012 2011 OPERATIONAL CASH FLOWS FROM INTEREST Interest received P=1,560,144,656 P=2,341,358,034 Interest paid 870,976,113 856,109,875 See accompanying Notes to Financial Statements.
*SGVMC118066*
TOYOTA FINANCIAL SERVICES PHILIPPINES CORPORATION NOTES TO FINANCIAL STATEMENTS 1. Corporate Information
Toyota Financial Services Philippines Corporation (the Company) is a domestic corporation registered with the Securities and Exchange Commission (SEC) on August 16, 2002. The Company’s registered address is 32nd Floor, GT Tower International, Ayala Avenue corner H.V. Dela Costa St., Salcedo Village, Makati City.
The Company serves customers of Toyota vehicles through financing and leasing services, as well as Toyota dealers, through inventory stock financing. On May 8, 2008, the Monetary Board of the Bangko Sentral ng Pilipinas (BSP) granted the Company its quasi-banking license, which enables the Company to diversify its sources of funds, as well as offer a wider range of financing products to its growing customers and perform other quasi-banking functions effective April 1, 2009.
The following table sets forth the ownership structure of the Company:
Percentage of ownership Toyota Financial Services Corporation (TFSC) 60% Philippine Savings Bank (PSBank) 25% Metropolitan Bank and Trust Company (MBTC) 15%
The Company’s ultimate parent company is TFSC, a leading financial services company based in Japan.
The accompanying financial statements were approved and authorized for issue by the Board of Directors (BOD) on July 4, 2012.
2. Summary of Significant Accounting Policies
Basis of Preparation The accompanying financial statements of the Company have been prepared using the historical cost basis except for available-for-sale (AFS) investments and derivative financial instruments, which have been measured at fair value.
The accompanying financial statements are presented in Philippine peso (P=), which is also the Company’s functional currency.
All values are rounded to the nearest peso unless otherwise stated.
Statement of Compliance The financial statements of the Company have been prepared in compliance with Philippine Financial Reporting Standards (PFRS).
Presentation of Financial Statements The Company presents its statement of financial position broadly in order of liquidity. An analysis regarding recovery or settlement within 12 months after the statement of financial position date (current) and more than 12 months after the statement of financial position date (non-current) is presented in Note 17.

- 2 -
*SGVMC118066*
Changes in Accounting Policies and Disclosures The accounting policies adopted are consistent with those of the previous year except for the following new and amended standards, interpretations and improvements to PFRS adopted as of April 1, 2011. These new and amended standards and improvements to PFRS did not have any impact on the accounting policies, financial position or performance of the Company.
New and Amended Standards and Interpretations • Philippine Accounting Standard (PAS) 24, Related Party Disclosures (Amendment) • PAS 32, Financial Instruments: Presentation (Amendment) • Philippine Interpretation of International Financial Reporting Interpretation Committee
(IFRIC) 14, Prepayments of a Minimum Funding Requirement (Amendment) • Philippines Interpretation IFRIC 19, Extinguishing Financial Liabilities with Equity
Instruments • Philippine Interpretation IFRIC 13, Customer Loyalty Programmes (determining the fair value
of award credits)
Improvements to PFRS in 2010 • PFRS 3, Business Combinations • PFRS 7, Financial Instruments: Disclosures • PAS 1, Presentation of Financial Statements • PAS 27, Consolidated and Separate Financial Statements • PAS 34, Interim Financial Reporting
New standards and interpretations that have been issued but are not yet effective Standards or interpretations issued but are not effective as of March 31, 2012 are listed below. The Company intends to adopt these standards and interpretations when they become effective. Except as otherwise stated, the Company does not expect the adoption of these new standards and interpretations to have a significant impact on its financial statements.
• PAS 1, Financial Statement Presentation - Presentation of Items of Other Comprehensive
Income (Amendment), effective for annual periods beginning on or after July 1, 2012. The amendments to PAS 1 change the grouping of items presented in other comprehensive income (OCI). Items that could be reclassified (or “recycled”) to profit or loss at a future point in time (for example, upon derecognition or settlement) would be presented separately from items that will never be reclassified.
• PAS 12, Income Taxes - Recovery of Underlying Assets (Amendment), effective for annual
periods beginning on or after January 1, 2012. It clarified the determination of deferred tax on investment property measured at fair value. The amendment introduces a rebuttable presumption that deferred tax on investment property measured using the fair value model in PAS 40, Investment Property, should be determined on the basis that its carrying amount will be recovered through sale. Furthermore, it introduces the requirement that deferred tax on non-depreciable assets that are measured using the revaluation model in PAS 16, Property, Plant and Equipment, always be measured on a sale basis of the asset.
• PAS 19, Employee Benefits (Amendment), effective for annual periods beginning on or after
January 1, 2013. Amendments to PAS 19 range from fundamental changes such as removing the corridor mechanism and the concept of expected returns on plan assets to simple clarifications and rewording. The Company is currently assessing the impact of the amendment to PAS 19.
- 3 -
*SGVMC118066*
• PAS 27, Separate Financial Statements (as revised in 2011), effective for annual periods
beginning on or after January 1, 2013. As a consequence of the new PFRS 10, Consolidated Financial Statements, and PFRS 12, Disclosure of Interests in Other Entities, what remains of PAS 27 is limited to accounting for subsidiaries, jointly controlled entities, and associates in separate financial statements.
• PAS 28, Investments in Associates and Joint Ventures (as revised in 2011), effective for
annual periods beginning on or after January 1, 2012. As a consequence of the new PFRS 11, Joint Arrangements, and PFRS 12, PAS 28 has been renamed PAS 28, Investments in Associates and Joint Ventures, and describes the application of the equity method to investments in joint ventures in addition to associates.
• PFRS 7, Financial Instruments: Disclosures - Enhanced Derecognition Disclosure
Requirements, effective for annual periods beginning on or after January 1, 2012. The amendment requires additional disclosure about financial assets that have been transferred but not derecognized to enable the user of the Company’s financial statements to understand the relationship with those assets that have not been derecognized and their associated liabilities. In addition, the amendment requires disclosures about continuing involvement in derecognized assets to enable the user to evaluate the nature of, and risks associated with, the entity’s continuing involvement in those derecognized assets.
• PFRS 7, Financial Instruments: Disclosures - Offsetting Financial Assets and Financial
Liabilities. These amendments require an entity to disclose information about rights of set-off and related arrangements (such as collateral agreements). The new disclosures are required for all recognized financial instruments that are set off in accordance with PAS 32. These disclosures also apply to recognized financial instruments that are subject to an enforceable master netting arrangement or ‘similar agreement’, irrespective of whether they are set-off in accordance with PAS 32. The amendments require entities to disclose, in a tabular format unless another format is more appropriate, the following minimum quantitative information. This is presented separately for financial assets and financial liabilities recognized at the end of the reporting period:
a. The gross amounts of those recognized financial assets and recognized financial
liabilities; b. The amounts that are set off in accordance with the criteria in PAS 32 when determining
the net amounts presented in the statement of financial position; c. The net amounts presented in the statement of financial position; d. The amounts subject to an enforceable master netting arrangement or similar agreement
that are not otherwise included in (b) above, including: i. Amounts related to recognized financial instruments that do not meet some or all of
the offsetting criteria in PAS 32; and ii. Amounts related to financial collateral (including cash collateral); and
e. The net amount after deducting the amounts in (d) from the amounts in (c) above.
The amendments to PFRS 7 are to be retrospectively applied for annual periods beginning on or after January 1, 2013.
- 4 -
*SGVMC118066*
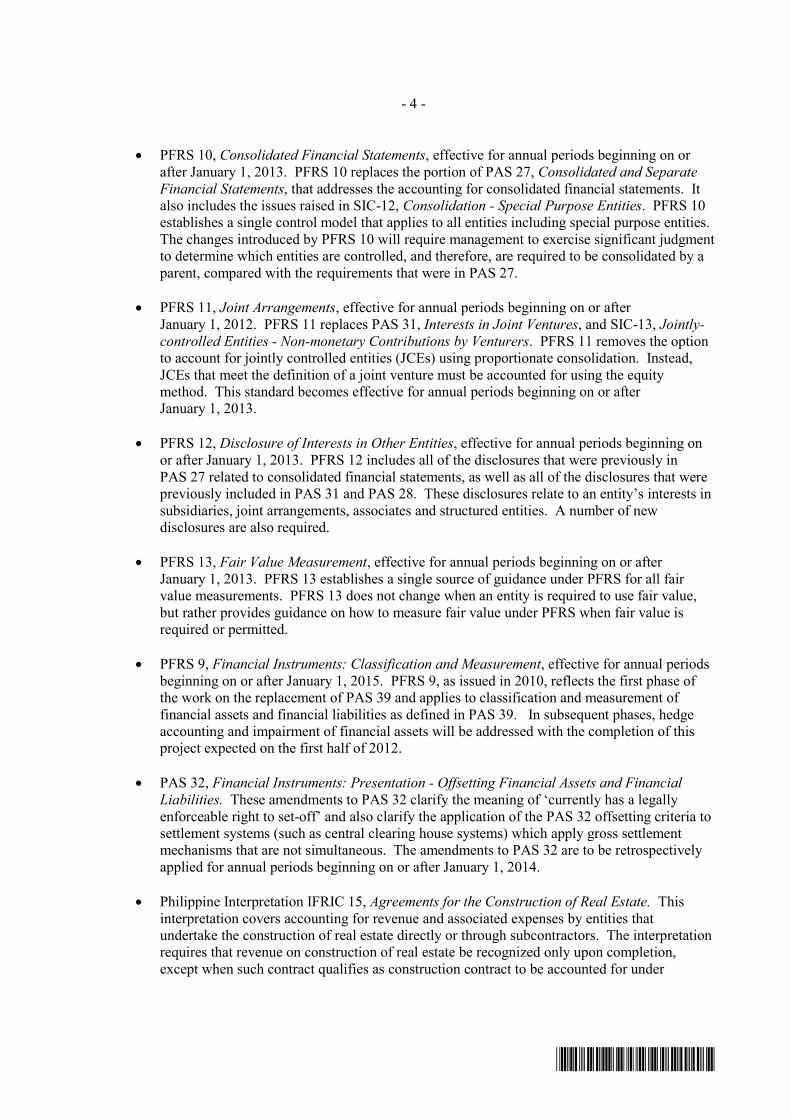
• PFRS 10, Consolidated Financial Statements, effective for annual periods beginning on or
after January 1, 2013. PFRS 10 replaces the portion of PAS 27, Consolidated and Separate Financial Statements, that addresses the accounting for consolidated financial statements. It also includes the issues raised in SIC-12, Consolidation - Special Purpose Entities. PFRS 10 establishes a single control model that applies to all entities including special purpose entities. The changes introduced by PFRS 10 will require management to exercise significant judgment to determine which entities are controlled, and therefore, are required to be consolidated by a parent, compared with the requirements that were in PAS 27.
• PFRS 11, Joint Arrangements, effective for annual periods beginning on or after
January 1, 2012. PFRS 11 replaces PAS 31, Interests in Joint Ventures, and SIC-13, Jointly-controlled Entities - Non-monetary Contributions by Venturers. PFRS 11 removes the option to account for jointly controlled entities (JCEs) using proportionate consolidation. Instead, JCEs that meet the definition of a joint venture must be accounted for using the equity method. This standard becomes effective for annual periods beginning on or after January 1, 2013.
• PFRS 12, Disclosure of Interests in Other Entities, effective for annual periods beginning on
or after January 1, 2013. PFRS 12 includes all of the disclosures that were previously in PAS 27 related to consolidated financial statements, as well as all of the disclosures that were previously included in PAS 31 and PAS 28. These disclosures relate to an entity’s interests in subsidiaries, joint arrangements, associates and structured entities. A number of new disclosures are also required.
• PFRS 13, Fair Value Measurement, effective for annual periods beginning on or after
January 1, 2013. PFRS 13 establishes a single source of guidance under PFRS for all fair value measurements. PFRS 13 does not change when an entity is required to use fair value, but rather provides guidance on how to measure fair value under PFRS when fair value is required or permitted.
• PFRS 9, Financial Instruments: Classification and Measurement, effective for annual periods
beginning on or after January 1, 2015. PFRS 9, as issued in 2010, reflects the first phase of the work on the replacement of PAS 39 and applies to classification and measurement of financial assets and financial liabilities as defined in PAS 39. In subsequent phases, hedge accounting and impairment of financial assets will be addressed with the completion of this project expected on the first half of 2012.
• PAS 32, Financial Instruments: Presentation - Offsetting Financial Assets and Financial
Liabilities. These amendments to PAS 32 clarify the meaning of ‘currently has a legally enforceable right to set-off’ and also clarify the application of the PAS 32 offsetting criteria to settlement systems (such as central clearing house systems) which apply gross settlement mechanisms that are not simultaneous. The amendments to PAS 32 are to be retrospectively applied for annual periods beginning on or after January 1, 2014.
• Philippine Interpretation IFRIC 15, Agreements for the Construction of Real Estate. This
interpretation covers accounting for revenue and associated expenses by entities that undertake the construction of real estate directly or through subcontractors. The interpretation requires that revenue on construction of real estate be recognized only upon completion, except when such contract qualifies as construction contract to be accounted for under

- 5 -
*SGVMC118066*
PAS 11, Construction Contracts, or involves rendering of services in which case revenue is recognized based on stage of completion. Contracts involving provision of services with the construction materials and where the risks and reward of ownership are transferred to the buyer on a continuous basis will also be accounted for based on stage of completion. SEC and the Financial Reporting Standards Council have deferred the effectivity of this interpretation until the final Revenue standard is issued by International Accounting and Standards Board and an evaluation of the requirements of the final revenue standard against the practices of the Philippine real estate industry is completed.
• Philippine Interpretation IFRIC 20, Stripping Costs in the Production Phase of a Surface
Mine, effective for annual periods beginning on or after January 1, 2013. This interpretation applies to waste removal costs that are incurred in surface mining activity during the production phase of the mine (‘production stripping costs’) and provides guidance on the recognition of production stripping costs as an asset and measurement of the stripping activity asset.
Significant Accounting Policies
Foreign Currency Translations Transactions denominated in foreign currencies are recorded using the applicable exchange rate at the date of the transaction. Foreign currency-denominated assets and liabilities are translated to Philippine peso using the Philippine Dealing System (PDS) closing rate prevailing at the reporting date. Foreign exchange gains or losses arising from foreign currency transactions and revaluation of foreign currency-denominated assets and liabilities are credited to or charged to profit or loss in the year in which the rates change.
Financial Instruments - Initial Recognition and Measurement Date of recognition Purchases or sales of financial assets that require delivery of assets within the time frame established by regulation or convention in the marketplace are recognized on the settlement date, the date that an asset is delivered to or by the Company. Deposits on finance lease, amounts due to banks and loans are recognized when cash is received by the Company or advanced to the borrowers.
Initial recognition of financial instruments All financial instruments are initially recognized at fair value. Except for financial assets and financial liabilities at fair value through profit or loss (FVPL), the initial measurement of financial assets includes transaction costs. The Company classifies its financial assets in the following categories: financial assets at FVPL, AFS investments, held-to-maturity (HTM) investments and loans and receivables. Financial liabilities are classified as financial liabilities at FVPL and other financial liabilities carried at amortized cost. Financial assets or financial liabilities at FVPL include financial assets or liabilities held for trading purposes and financial assets or liabilities designated upon initial recognition as at FVPL. The classification depends on the purpose for which the investments were acquired and whether they are quoted in an active market. Management determines the classification of its investments at initial recognition and, where allowed and appropriate, reevaluates such designation at every reporting date.
As of March 31, 2012 and 2011, the Company has no financial assets at FVPL and HTM investments.

- 6 -
*SGVMC118066*
Determination of fair value The fair value for financial instruments traded in active markets at the reporting date is based on their quoted market prices or dealer price quotations (bid price for long positions and ask price for short positions), without any deduction for transaction costs. When current bid and asking prices are not available, the price of the most recent transaction is used since it provides evidence of the current fair value as long as there has not been a significant change in economic circumstances since the time of the transaction.
For all other financial instruments not listed in an active market, the fair value is determined by using appropriate valuation techniques. Valuation techniques include net present value techniques, comparison to similar instruments for which market observable prices exist, and other relevant valuation models.
‘Day 1’ difference Where the transaction price in a non-active market is different from the fair value of other observable current market transactions in the same instrument or based on a valuation technique whose variables include only data from observable market, the Company recognizes the difference between the transaction price and fair value (a ‘Day 1’ difference) in profit or loss unless it qualifies for recognition as some other type of asset. In cases where use is made of data which is not observable, the difference between the transaction price and model value is only recognized in profit or loss when the inputs become observable or when the instrument is derecognized. For each transaction, the Company determines the appropriate method of recognizing the ‘Day 1’ difference amount.
AFS investments AFS investments are those which are designated as such or do not qualify to be classified as financial assets held for trading, designated at FVPL, HTM investments or loans and receivables. These are purchased and held indefinitely, and may be sold in response to liquidity requirements or changes in market conditions.
After initial measurement, AFS investments are subsequently measured at fair value. The unrealized gains and losses arising from the fair valuation of AFS investments are excluded, net of tax, from reported earnings and are reported as other comprehensive income in the statement of comprehensive income as ‘Net unrealized gain (loss) on available-for-sale investments,’ until the investment is derecognized or determined to be impaired at which time the cumulative gains or losses previously reported as other comprehensive income is included in profit or loss.
The Company’s AFS investments consist of golf club shares.
Loans and receivables Loans and receivables are non-derivative financial assets with fixed or determinable payments and fixed maturities that are not quoted in an active market. These are not entered into with the intention of immediate or short-term resale and as such are not classified as financial assets at FVPL and AFS investments. They also do not include those for which the company may not recover substantially as its initial investments, other than because of credit deterioration.
After initial measurement, loans and receivables are subsequently measured at amortized cost using the effective interest method less allowance for credit losses. Amortized cost is calculated by taking into account any discount or premium on acquisition cost and fees that are an integral

- 7 -
*SGVMC118066*
part of the effective interest rate (EIR). The amortization is included in profit or loss under “Interest income.” The losses arising from impairment are recognized in profit or loss under “Provision for credit and impairment losses.”
The Company’s loans and receivables consist of cash, due from BSP, SPURA, receivables from customers and other receivables.
Other financial liabilities Issued financial instruments or their components, which are not designated at FVPL, are classified as loans payable, accounts payable and other liabilities, deposits on lease contracts and subordinated debt where the substance of the contractual arrangement results in the Company having an obligation either to deliver cash or another financial assets to the holder, or to satisfy the obligation other than by the exchange of a fixed amount of cash or another financial asset for a fixed number of own equity shares.
After initial measurement, these financial liabilities not qualified as and not designated at FVPL are subsequently measured at amortized cost using the effective interest method.
Derivative Financial Instrument and Hedge Accounting The Company uses derivative financial instruments such as cross currency interest rate swap to hedge its foreign currency and interest rate risks. Such derivative financial instruments are initially recognized at fair value on the date in which a derivative transaction is entered into and are subsequently re-measured at fair value. Derivatives are carried as assets when the fair value is positive and as liabilities when the fair value is negative.
Any gains or losses arising from the changes in fair value of derivatives are taken directly to profit or loss, except for the effective portion of cash flow hedges, which is recognized as OCI.
For the purpose of hedge accounting, hedges are classified as:
• Fair value hedges when hedging the exposure to changes in the fair value of a recognized asset
or liability or an unrecognized firm commitment (except for foreign currency risk); • Cash flow hedges when hedging exposure to variability in cash flows that is either attributable
to a particular risk associated with a recognized asset or liability or a highly probable forecast transaction or the foreign currency risk in an unrecognized firm commitment; or
• Hedges of a net investment in a foreign operation.
At the inception of a hedge relationship, the Company formally designates and documents the hedge relationship to which the Company wishes to apply hedge accounting and the risk management objective and strategy for undertaking the hedge. The documentation includes identification of the hedging instrument, the hedged item or transaction, the nature of the risk being hedged and how the entity will assess the hedging instrument’s effectiveness in offsetting the exposure to changes in the hedge item’s fair value or cash flows attributable to the hedged risk. Such hedges are expected to be highly effective in achieving offsetting changes in fair value or cash flows and are assessed on an on-going basis to determine that they actually have been highly effective throughout the financial reporting periods for which they were designated.
Cash flow hedges The effective portion of the gain or loss on the hedging instrument is recognized directly as other comprehensive income in the cash flow hedge reserve, while the ineffective portion is recognized directly in profit or loss.

- 8 -
*SGVMC118066*
Amounts recognized as other comprehensive income are transferred to profit or loss, such as when the hedged financial income or financial expense is recognized or when a forecast sale occurs. Where the hedged item is the cost of a non-financial asset or non-financial liability, the amounts recognized as other comprehensive income are transferred to the initial carrying amount of the non-financial asset or liability.
If the forecast transaction or firm commitment is no longer expected to occur, the cumulative gain or loss previously recognized in other comprehensive income are transferred to profit or loss. If the hedging instrument expires or is sold, terminated or exercised without replacement or rollover or if its designation as a hedge is revoked, any cumulative gain or loss previously recognized in other comprehensive income remains in OCI until the forecast transaction or firm commitment affects profit or loss. If the related transaction is not expected to occur, the amount is taken to profit or loss.
The Company designates its cross currency interest rate swaps as cash flow hedges of the foreign currency and interest rate risks arising from floating interest rate foreign currency-denominated liabilities.
Derecognition of Financial Assets and Liabilities Financial asset A financial asset (or, where applicable a part of a financial asset or part of a group of similar financial assets) is derecognized when:
• the rights to receive cash flows from the asset have expired; • the Company retains the right to receive cash flows from the asset, but has assumed an
obligation to pay them in full without material delay to a third party under a ‘pass-through’ arrangement, or;
• the Company has transferred its rights to receive cash flows from the asset and either (a) has transferred substantially all the risks and rewards of the asset, or (b) has neither transferred nor retained substantially all the risks and rewards of the asset, but has transferred control of the asset.
Where the Company has transferred its rights to receive cash flows from an asset or has entered into a ‘pass-through’ arrangement, and has neither transferred nor retained substantially all the risks and rewards of the asset nor transferred control over the asset, the asset is recognized to the extent of the Company’s continuing involvement in the asset. Continuing involvement that takes the form of a guarantee over the transferred asset is measured at the lower of original carrying amount of the asset and the maximum amount of consideration that the Company could be required to repay.
Financial liability A financial liability is derecognized when the obligation under the liability, is discharged, cancelled or has expired. Where an existing financial liability is replaced by another from the same lender on substantially different terms, or the terms of an existing liability are substantially modified, such an exchange or modification is treated as a derecognition of the original liability and the recognition of a new liability, and the difference in the respective carrying amounts is recognized in profit or loss.

- 9 -
*SGVMC118066*
Securities Purchased Under Resale Agreement Conversely, securities purchased under resale agreements (SPURA) to resell at a specified future date (‘reverse repos’) are not recognized on the statement of financial position. The corresponding cash paid, including accrued interest, is recognized in the statement of financial position as SPURA, and is considered a loan to the counterparty. The difference between the purchase price and resale price is treated as interest income and is accrued over the life of the agreement using the effective interest method.
Cash and Cash Equivalents For purposes of reporting cash flows, cash and cash equivalents include cash on hand, cash in banks, due from BSP and SPURA with original maturities of three months or less from dates of placements and that are subject to insignificant risks of changes in value.
Offsetting Financial Instruments Financial assets and financial liabilities are offset and the net amount is reported in the statement of financial position if, and only if, there is a currently enforceable legal right to offset the recognized amounts and there is an intention to settle on a net basis, or to realize the asset and settle the liability simultaneously. This is not generally the case with master netting agreements, and the related assets and liabilities are presented gross in the statement of financial position.
Impairment of Financial Assets The Company assesses at each reporting date whether there is objective evidence that a financial asset or a group of financial assets is impaired. A financial asset or a group of financial assets is deemed to be impaired if, and only if, there is objective evidence of impairment as a result of one or more events that has occurred after the initial recognition of the asset (an incurred ‘loss event’) and that loss event (or events) has an impact on the estimated future cash flows of the financial asset or the group of financial assets that can be reliably estimated. Evidence of impairment may include indications that the borrower or a group of borrowers is experiencing significant financial difficulty, default or delinquency in interest or principal payments, the probability that they will enter bankruptcy or other financial reorganization and where observable data indicate that there is measurable decrease in the estimated future cash flows, such as changes in arrears or economic conditions that correlate with defaults.
Loans and receivables For loans and receivables, carried at amortized cost, the Company first assesses whether objective evidence of impairment exists individually for financial assets that are individually significant, or collectively, for financial assets that are not individually significant. If the Company determines that no objective evidence of impairment exists for individually assessed financial asset, whether significant or not, it includes the asset in a group of financial assets with similar credit risk characteristics and collectively assesses for impairment. Those characteristics are relevant to the estimation of future cash flows for groups of such assets by being indicative of the debtors’ ability to pay all amounts due according to the contractual terms of the assets being evaluated. Assets that are individually assessed for impairment and for which an impairment loss is, or continues to be, recognized are not included in a collective assessment for impairment.
If there is objective evidence that an impairment loss has been incurred, the amount of the loss is measured as the difference between the asset’s carrying amount and the present value of the estimated future cash flows (excluding future credit losses that have not been incurred). The carrying amount of the asset is reduced through use of an allowance account and the amount of loss is charged to profit or loss. Interest income continues to be recognized based on the original

- 10 -
*SGVMC118066*
EIR of the asset. The financial assets, together with the associated allowance accounts, are written off when there is no realistic prospect of future recovery and all collateral has been realized. If, in a subsequent year, the amount of the estimated impairment loss decreases because of an event occurring after the impairment was recognized, the previously recognized impairment loss is reduced by adjusting the allowance account. If a future write-off is later recovered, any amounts formerly charged are credited to “Other income” in profit or loss.
AFS investments For equity investments classified as AFS investments, impairment indicators would include a significant or prolonged decline in the fair value of the investments below its cost. Where there is evidence of impairment, the cumulative loss measured as the difference between the acquisition cost and the current fair value, less any impairment loss on that financial asset previously recognized as OCI is removed and recognized in profit or loss. Impairment losses on equity instruments are not reversed through profit or loss. Increases in fair value after impairment are recognized directly in other comprehensive income.
Finance Lease Receivables When assets are held subject to finance leases, the present value of the lease payments is
recognized as finance lease receivables. Finance lease receivables are stated at the outstanding balance, reduced by unearned lease income and allowance for credit losses.
Residual Value of Leased Assets and Deposits on Lease Contracts The residual value of leased assets is the estimated proceeds from the disposal of the leased asset at the end of the lease term which approximates the amount of guaranty deposit paid by the lessee at the inception of the lease. At the end of the lease term, the residual value is generally applied against the guaranty deposit of the lessee.
Property and Equipment Property and equipment are carried at cost less accumulated depreciation and amortization and impairment loss, if any.
The initial cost of property and equipment consists of its purchase price, any directly attributable costs of bringing the asset to its working condition and location for its intended use and the initial estimate of the costs of dismantling and removing the item and restoring the site on which it is located to the extent it had recognized an obligation for that cost.
Expenditures incurred after an item of property and equipment has been put into operation, such as repairs and maintenance, are normally charged to operations in the year in which the costs are incurred. In situations where it can be clearly demonstrated that the expenditures have resulted in an increase in the future economic benefits expected to be obtained from the use of an item of property and equipment beyond its originally assessed standard of performance, the expenditures are capitalized as an additional cost of property and equipment. When the property and equipment are retired or otherwise disposed of, the cost and the related accumulated depreciation and amortization are removed from the accounts and any resulting gain or loss is reflected in profit or loss.

- 11 -
*SGVMC118066*
Depreciation and amortization is computed using the straight-line method over the estimated useful lives of the property and equipment as follows:
Leasehold improvements 5 years or the lease term,
whichever is shorter Furniture, fixtures and equipment 3-5 years Transportation equipment 3-5 years
The useful life and the depreciation and amortization method are reviewed periodically to ensure that the period and method of depreciation and amortization are consistent with the expected pattern of economic benefits from items of property and equipment.
An item of property and equipment is derecognized upon disposal or when no future economic benefits are expected from its use or disposal. Any gain or loss arising on derecognition of the assets, which is calculated as the difference between the net disposal proceeds and the carrying amount of the asset, is included in profit or loss in the year the asset is derecognized.
Assets Held for Sale An asset is classified as held for sale if its carrying amount will be recovered principally through a sale transaction rather than through continuing use, available for immediate sale and its sale is highly probable. An asset classified as held for sale is measured at the lower of fair value less costs to sell and its carrying amount.
Any impairment loss on write-down of the asset to fair value less costs to sell is recognized in profit or loss. Any gain on subsequent increase in fair value less costs to sell is also recognized in profit or loss, but not in excess of the cumulative impairment loss already recognized on the asset.
Assets held for sale of the Company consists mainly of motor vehicles foreclosed from borrowers or lessees who have defaulted on their installment or lease payments.
Intangible Assets This consists of software costs, stated at acquisition cost and is amortized on a straight-line basis over estimated useful life of five (5) years.
An intangible asset is recognised only when its cost can be measured reliably and it is probable that the expected future economic benefits that are attributable to it will flow to the Company.
Impairment of Nonfinancial Assets The carrying values of non-financial assets (i.e. property and equipment, assets held for sale, software cost) are reviewed for impairment when events or changes in circumstances indicate that the carrying values may not be recoverable. If any such indication exists and where the carrying values exceed the estimated recoverable amounts, the assets or cash-generating units are written down to their recoverable amounts. The recoverable amount of an asset is the greater of its net selling price and value in use. In assessing value in use, the estimated future cash flows are discounted to their present value using a pre-tax discount rate that reflects current market assessment of the time value of money and the risks specific to the asset. For an asset that does not generate largely independent cash inflows, the recoverable amount is determined for the cash-generating unit to which the asset belongs. Impairment loss is recognized under ‘Provision for credit and impairment losses’ in profit or loss.
- 12 -
*SGVMC118066*
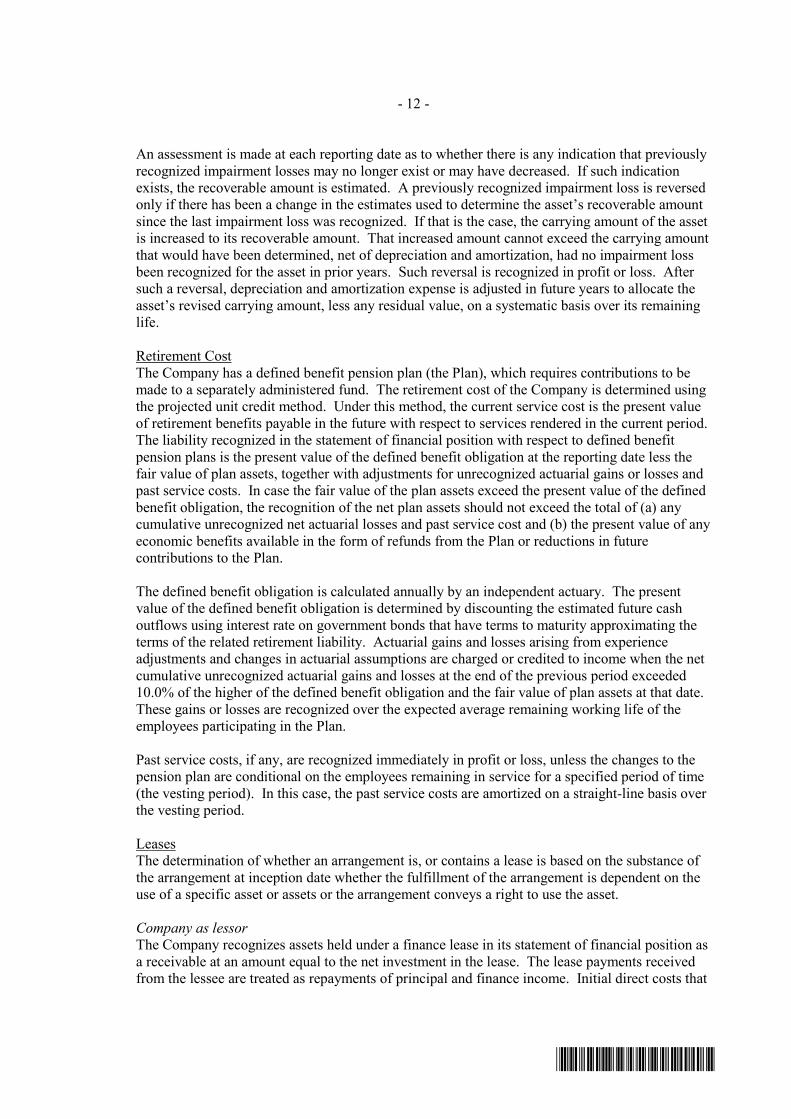
An assessment is made at each reporting date as to whether there is any indication that previously recognized impairment losses may no longer exist or may have decreased. If such indication exists, the recoverable amount is estimated. A previously recognized impairment loss is reversed only if there has been a change in the estimates used to determine the asset’s recoverable amount since the last impairment loss was recognized. If that is the case, the carrying amount of the asset is increased to its recoverable amount. That increased amount cannot exceed the carrying amount that would have been determined, net of depreciation and amortization, had no impairment loss been recognized for the asset in prior years. Such reversal is recognized in profit or loss. After such a reversal, depreciation and amortization expense is adjusted in future years to allocate the asset’s revised carrying amount, less any residual value, on a systematic basis over its remaining life.
Retirement Cost The Company has a defined benefit pension plan (the Plan), which requires contributions to be made to a separately administered fund. The retirement cost of the Company is determined using the projected unit credit method. Under this method, the current service cost is the present value of retirement benefits payable in the future with respect to services rendered in the current period. The liability recognized in the statement of financial position with respect to defined benefit pension plans is the present value of the defined benefit obligation at the reporting date less the fair value of plan assets, together with adjustments for unrecognized actuarial gains or losses and past service costs. In case the fair value of the plan assets exceed the present value of the defined benefit obligation, the recognition of the net plan assets should not exceed the total of (a) any cumulative unrecognized net actuarial losses and past service cost and (b) the present value of any economic benefits available in the form of refunds from the Plan or reductions in future contributions to the Plan.
The defined benefit obligation is calculated annually by an independent actuary. The present value of the defined benefit obligation is determined by discounting the estimated future cash outflows using interest rate on government bonds that have terms to maturity approximating the terms of the related retirement liability. Actuarial gains and losses arising from experience adjustments and changes in actuarial assumptions are charged or credited to income when the net cumulative unrecognized actuarial gains and losses at the end of the previous period exceeded 10.0% of the higher of the defined benefit obligation and the fair value of plan assets at that date. These gains or losses are recognized over the expected average remaining working life of the employees participating in the Plan.
Past service costs, if any, are recognized immediately in profit or loss, unless the changes to the pension plan are conditional on the employees remaining in service for a specified period of time (the vesting period). In this case, the past service costs are amortized on a straight-line basis over the vesting period.
Leases The determination of whether an arrangement is, or contains a lease is based on the substance of the arrangement at inception date whether the fulfillment of the arrangement is dependent on the use of a specific asset or assets or the arrangement conveys a right to use the asset.
Company as lessor The Company recognizes assets held under a finance lease in its statement of financial position as a receivable at an amount equal to the net investment in the lease. The lease payments received from the lessee are treated as repayments of principal and finance income. Initial direct costs that

- 13 -
*SGVMC118066*
are incremental and directly attributable to negotiating and arranging the lease, are included in the measurement of the net investment in the lease at inception and reflected in the calculation of the implicit interest rate.
Company as lessee Lease of assets under which the lessor effectively retains all the risks and rewards of ownership is classified as operating lease. Lease payments under an operating lease are recognized as an expense on a straight-line basis over the lease term.
Revenue Recognition Revenue is recognized to the extent that it is probable that the economic benefits will flow to the Company and the income can be reliably measured. The following specific recognition criteria must also be met before revenue is recognized:
Interest income Interest and financing fees on finance leases and loans and receivables (including dealers’ and manufacturers’ subsidy) are initially credited to unearned interest income and amortized over the term using effective interest method. Any direct costs to acquire finance leases and loans and receivables are capitalized and amortized using the effective interest method.
Interest income on impaired receivables is recognized based on the rate used to discount future cash flows to their net present value. Interest income from cash in bank is accrued as earned.
Service fees Service fees earned for the provision of transaction services such as processing fees are recognized upon completion of the underlying transaction.
Recoveries of accounts written off Recoveries of accounts written off are recognized as income upon actual collection.
Borrowing Costs Borrowing costs directly attributable to the acquisition, construction or production of an asset that necessarily takes a substantial period of time to get ready for its intended use are capitalized. All other borrowing costs are recognized as expense in the year which they are incurred.
Income Taxes Current taxes Current tax assets and liabilities are measured at the amount expected to be recovered from or paid to the taxation authorities. The tax rates and tax laws used to compute the amount are those that are enacted or substantively enacted at the reporting date.
Deferred taxes Deferred tax is provided on all temporary differences at the reporting date between the tax bases of assets and liabilities and their carrying amounts for financial reporting purposes.
Deferred tax liabilities are recognized for all taxable temporary differences. Deferred tax assets are recognized for all deductible temporary differences, carryforward benefit of the excess of minimum corporate income tax (MCIT) over regular corporate income tax (RCIT) and unused net operating loss carryover (NOLCO), to the extent that it is probable that taxable profit will be available against which the deductible temporary differences and carryforward of MCIT and unused NOLCO can be utilized.

- 14 -
*SGVMC118066*
The carrying amount of deferred tax assets is reviewed at each reporting date and reduced to the extent that it is no longer probable that sufficient taxable profit will be available to allow all or part of the deferred tax assets to be utilized. Unrecognized deferred tax assets are reassessed at each reporting date and are recognized to the extent that it has become probable that future taxable profit will allow all or part of the deferred tax assets to be recovered. Deferred tax, however, is not recognized on temporary differences that arise from the initial recognition of an asset or liability in a transaction that is not a business combination and, at the time of the transaction, affects neither the accounting income nor taxable income or loss.
Deferred tax assets and liabilities are measured at the tax rate that is expected to apply to the year when the asset is realized or the liability is settled, based on tax rates (and tax laws) that have been enacted or substantively enacted at the reporting date.
Current tax and deferred tax relating to items recognized directly in equity is also recognized in equity and not in profit or loss.
Deferred tax assets and tax liabilities are offset, if a legally enforceable right exists to set off current tax assets against current tax liabilities and the deferred taxes relate to the same taxable entity and the same taxation authority.
Provisions Provisions are recognized when the Company has a present obligation (legal or constructive) where, as a result of a past event, it is probable that an outflow of resources embodying economic benefits will be required to settle the obligation and a reliable estimate can be made of the amount of the obligation.
Contingencies Contingent liabilities are not recognized but are disclosed in the notes to the financial statements unless the possibility of an outflow of resources embodying economic benefits is remote. Contingent assets are not recognized but are disclosed in the notes to the financial statements when the inflow of economic benefits is probable.
Equity Capital stock is measured at par value for all shares issued. When the Company issues more than one class of stock, a separate account is maintained for each class of stock and the number of shares issued.
When the shares are sold at premium, the difference between the proceeds and the par value is credited to “Additional paid-in capital” account. When shares are issued for a consideration other than cash, the proceeds are measured by the fair value of the consideration received. In case the shares are issued to extinguish or settle the liability of the Company, the shares shall be measured either at the fair value of the shares issued or fair value of the liability settled, whichever is more reliably determinable.
Direct cost incurred related to the equity issuance, such as underwriting, accounting and legal fees, printing costs and taxes are chargeable to “Additional paid-in capital” account. If additional paid-in capital is not sufficient, the excess is charged against retained earnings.
Retained earnings represent accumulated net income of the Company, net of dividends paid.

- 15 -
*SGVMC118066*
Dividends Dividends are recognized as a liability and deducted from equity when declared and approved by the Board of Directors of the Company and of the BSP. Dividends for the year that are declared and approved after the reporting date, if any, are dealt with as an event after the reporting date and disclosed accordingly.
Related Party Transactions Parties are considered to be related if one party has the ability, directly or indirectly, to control the other party or exercise significant influence over the other party in making financial and operating decisions or if they are subjected to common control or common significant influence. Related parties may be individuals or corporate entities. Transactions between related parties are based on terms similar to those offered to non-related parties.
Expense Recognition Expenses are recognized in profit or loss when decrease in future economic benefit related to a decrease in an asset or an increase in a liability has arisen that can be measured reliably. Expenses are recognized in profit or loss: on the basis of a direct association between the costs incurred and the earning of specific items of income; on the basis of systematic and rational allocation procedures when economic benefits are expected to arise over several accounting periods and the association with income can only be broadly or indirectly determined; or immediately when an expenditure produces no future economic benefits or when, and to the extent that, future economic benefits do not qualify or cease to qualify, for recognition in the statements of financial position as an asset.
Events after the Reporting Period Post year-end events that provide additional information about the Company’s financial position at the reporting date (adjusting events) are reflected in the financial statements. Post year-end events that are not adjusting events are disclosed in the notes to the financial statements when material.
3. Significant Accounting Judgments and Estimates
The preparation of the accompanying financial statements in conformity with PFRS requires management to make judgments, estimates and assumptions that affect the reported amounts in the financial statements and accompanying notes. The judgments, estimates and assumptions used in the accompanying financial statements are based upon management’s evaluation of relevant facts and circumstances as of the date of the financial statements. Actual results could differ from such estimates.
Judgments and estimates are continually evaluated and are based on historical experience and other factors, including expectations of future events that are believed to be reasonable under the circumstances.
Judgments In the process of applying the Company’s accounting policies, management has made the following judgments, apart from those involving estimates and assumptions, which have the most significant effect on the amounts recognized in the financial statements.

- 16 -
*SGVMC118066*
Finance leases The Company, as a lessor, has entered into finance leases of vehicles with its customers. The Company has determined that it transfers all the significant risks and rewards of ownership as the lease terms are for the major part of the economic life of these properties which are leased out on finance leases.
Operating leases The Company has entered into a lease commitment for its occupied office premises. The Company has determined based on its evaluation of the terms and conditions of the lease arrangements (i.e., the lease does not transfer ownership of the asset to the lessee by the end of the lease term, the lessee has no option to purchase the asset at a price that is expected to be sufficiently lower than the fair value at the date the option is exercisable and the lease term is not for the major part of the asset’s economic life) that all significant risks and rewards of ownership are retained by the respective lessors. Operating lease payments are recognized as an expense in the statement of income on a straight-line basis over the lease term.
Estimates The key assumptions concerning the future and other key sources of estimation uncertainty at the reporting date, that have a significant risk of causing a material adjustment to the carrying amounts of assets and liabilities within the next financial year are discussed in the following paragraphs.
a. Estimation of allowance for credit losses
The Company reviews impairment of receivables on a monthly basis. Impairment loss on receivables is determined on a collective basis using the net flow rate methodology.
In determining whether an impairment loss should be recorded in profit or loss, the Company makes judgments as to whether there is any observable data indicating that there is a measurable decrease in the estimated future cash flows from a portfolio of receivables financed and lease contract receivables before the decrease can be identified with an individual account in that portfolio. This observable data may include adverse changes in the payment status of borrowers in a group, or national or local economic conditions that correlate with defaults on assets in the portfolio.
The amount and timing of recorded expenses for any period would differ if the Company made different estimates. An increase in allowance for credit losses would increase the recorded expenses and decrease the related asset account.
As of March 31, 2012 and 2011, the carrying value of loans and receivables amounted to P=17.5 billion and P=16.6 billion, respectively (see Note 7).
As of March 31, 2012 and 2011, allowance for credit losses on loans and receivables amounted to P=469.2 million and P=326.0 million, respectively (see Note 7).
b. Fair value of derivatives
The fair values of derivatives that are not quoted in active markets are determined using valuation techniques. Where valuation techniques are used to determine fair values, they are validated and periodically reviewed by qualified personnel independent of the area that created them. All models are reviewed before they are used, and models are calibrated to ensure that outputs reflect actual data and comparative market prices. To the extent practical, models use
- 17 -
*SGVMC118066*
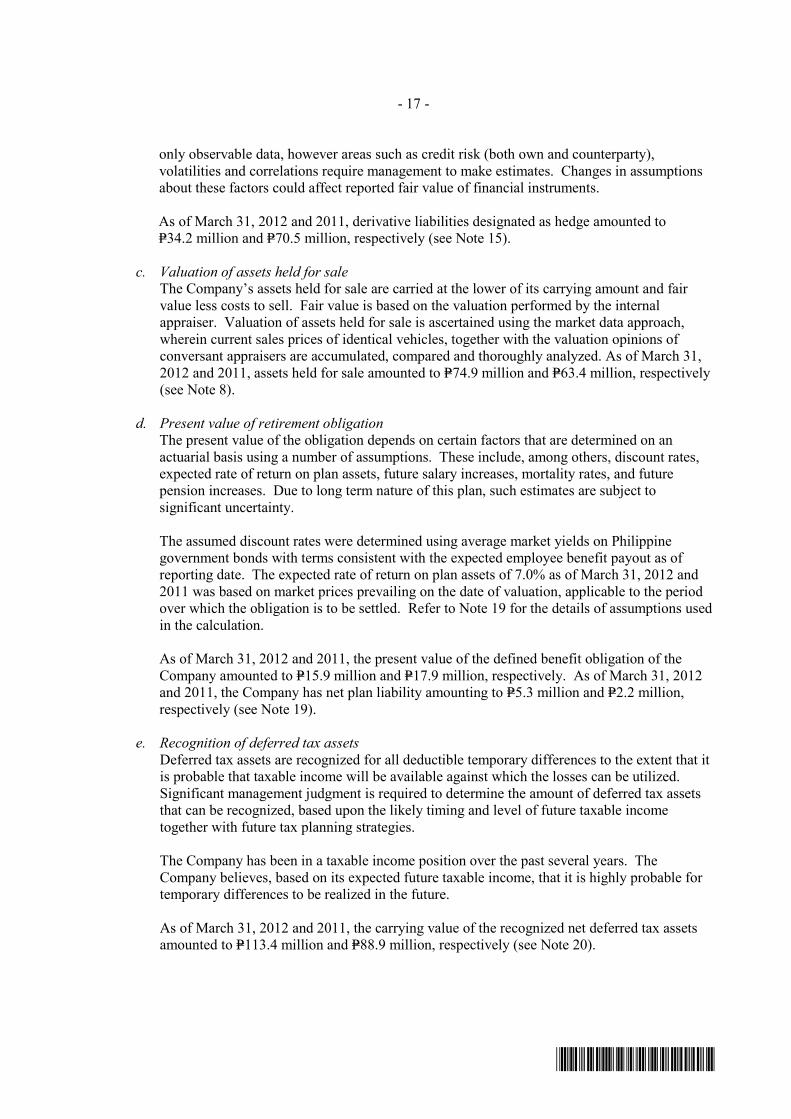
only observable data, however areas such as credit risk (both own and counterparty), volatilities and correlations require management to make estimates. Changes in assumptions about these factors could affect reported fair value of financial instruments.
As of March 31, 2012 and 2011, derivative liabilities designated as hedge amounted to P=34.2 million and P=70.5 million, respectively (see Note 15).
c. Valuation of assets held for sale
The Company’s assets held for sale are carried at the lower of its carrying amount and fair value less costs to sell. Fair value is based on the valuation performed by the internal appraiser. Valuation of assets held for sale is ascertained using the market data approach, wherein current sales prices of identical vehicles, together with the valuation opinions of conversant appraisers are accumulated, compared and thoroughly analyzed. As of March 31, 2012 and 2011, assets held for sale amounted to P=74.9 million and P=63.4 million, respectively (see Note 8).
d. Present value of retirement obligation
The present value of the obligation depends on certain factors that are determined on an actuarial basis using a number of assumptions. These include, among others, discount rates, expected rate of return on plan assets, future salary increases, mortality rates, and future pension increases. Due to long term nature of this plan, such estimates are subject to significant uncertainty.
The assumed discount rates were determined using average market yields on Philippine government bonds with terms consistent with the expected employee benefit payout as of reporting date. The expected rate of return on plan assets of 7.0% as of March 31, 2012 and 2011 was based on market prices prevailing on the date of valuation, applicable to the period over which the obligation is to be settled. Refer to Note 19 for the details of assumptions used in the calculation.
As of March 31, 2012 and 2011, the present value of the defined benefit obligation of the Company amounted to P=15.9 million and P=17.9 million, respectively. As of March 31, 2012 and 2011, the Company has net plan liability amounting to P=5.3 million and P=2.2 million, respectively (see Note 19).
e. Recognition of deferred tax assets
Deferred tax assets are recognized for all deductible temporary differences to the extent that it is probable that taxable income will be available against which the losses can be utilized. Significant management judgment is required to determine the amount of deferred tax assets that can be recognized, based upon the likely timing and level of future taxable income together with future tax planning strategies.
The Company has been in a taxable income position over the past several years. The Company believes, based on its expected future taxable income, that it is highly probable for temporary differences to be realized in the future.
As of March 31, 2012 and 2011, the carrying value of the recognized net deferred tax assets amounted to P=113.4 million and P=88.9 million, respectively (see Note 20).

- 18 -
*SGVMC118066*
4. Cash and Due from Bangko Sentral ng Pilipinas
Cash This account consists of:
2012 2011 Cash on hand P=435,487 P=474,548 Cash in banks 1,215,774,351 1,220,996,515 P=1,216,209,838 P=1,221,471,063
Cash in bank earns annual interest ranging from 2.9% to 3.0% in 2012 and 2011.
Due from BSP As of March 31, 2012 and 2011, due from BSP consists of demand deposits and savings and reserve deposits accounts with placement term not exceeding three months and interest rates ranging from 0.4% to 4.0% and 0.3% to 4.3%, respectively.
5. Securities Purchased Under Resale Agreement (SPURA)
This account consists of government securities purchased under reverse repurchase agreement with the BSP as counterparty. As of March 31, 2012 and 2011, these government securities with face value amounting to P=540.0 million and P=208.0 million respectively, and fair value of P=582.0 million and P=212.0 million, respectively, were pledged in favor of the Company as collateral for SPURA equivalent to the face value of the government securities.
6. Available-for-Sale Investments
AFS investments include quoted equity shares. The carrying value of the AFS investments amounted to P=0.93 million and P=0.96 million as of March 31, 2012 and 2011. The changes in fair value recognized in other comprehensive income amounted to P=0.08 million in 2012 and P=0.05 million in 2011. In 2012, the Company recognized impairment loss on AFS investments amounting to P=0.10 million directly to profit or loss.
The movements in unrealized gain on AFS investments follow:
2012 2011 Balance at beginning of year P=955,000 P=910,000 Impairment loss (100,000) – Changes in fair value 75,000 45,000 Balance at end of year P=930,000 P=955,000

- 19 -
*SGVMC118066*
7. Loans and Receivables
This account consists of:
2012 2011 Receivables from customers Receivables financed P=7,369,528,572 P=9,724,745,596 Unearned finance income (947,083,051) (1,353,937,971) 6,422,445,521 8,370,807,625 Finance lease receivables Finance lease receivables 10,276,562,416 8,040,180,950 Residual value of leased assets 2,934,445,588 2,012,440,981 13,211,008,004 10,052,621,931 Unearned lease income (1,684,843,018) (1,469,403,318) 11,526,164,986 8,583,218,613 17,948,610,507 16,954,026,238 Other receivables Receivables from clients 55,231,257 6,278,031 Receivables from employees 5,236,314 4,360,374 Accrued interest receivable 1,920,118 2,107,726 Others 781,992 975,286 63,169,681 13,721,417 Allowance for credit losses (Note 11) (469,177,116) (326,004,627) P=17,542,603,072 P=16,641,743,028
Receivables financed earn fixed interest ranging from 6.6% to 38.0% in 2012 and from 7.8% to 24.3% in 2011 while finance lease receivables earn fixed interest ranging from 7.5% to 19.2% in 2012 and from 8.8% to 20.6% in 2011. An account shall be considered past due when after the arrival of a payment due date, the client failed to settle the amount within a reasonable period of time. If the account remains unpaid for 30 days from the last due date, the account shall be considered past due.
Receivables from customers are due in monthly installments with terms ranging from one (1) to six (6) years. The receivables financed, net of unearned finance income, by contractual maturity dates is analyzed as follows:
2012 2011 Due within 1 year P=814,961,988 P=949,719,533 Due beyond 1 year but not beyond 5 years 5,607,483,533 7,415,413,214 Due beyond 5 years – 5,674,878 P=6,422,445,521 P=8,370,807,625
- 20 -
*SGVMC118066*
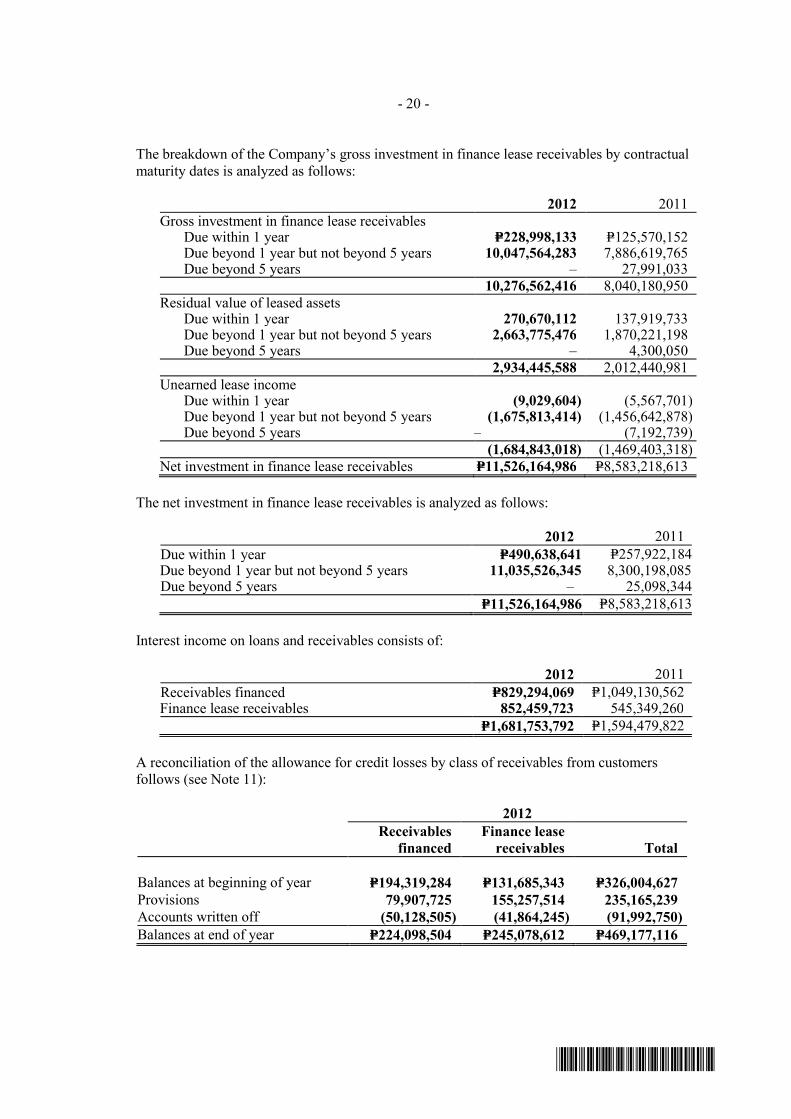
The breakdown of the Company’s gross investment in finance lease receivables by contractual maturity dates is analyzed as follows:
2012 2011 Gross investment in finance lease receivables Due within 1 year P=228,998,133 P=125,570,152 Due beyond 1 year but not beyond 5 years 10,047,564,283 7,886,619,765 Due beyond 5 years – 27,991,033 10,276,562,416 8,040,180,950 Residual value of leased assets Due within 1 year 270,670,112 137,919,733 Due beyond 1 year but not beyond 5 years 2,663,775,476 1,870,221,198 Due beyond 5 years – 4,300,050 2,934,445,588 2,012,440,981 Unearned lease income Due within 1 year (9,029,604) (5,567,701) Due beyond 1 year but not beyond 5 years (1,675,813,414) (1,456,642,878) Due beyond 5 years – (7,192,739) (1,684,843,018) (1,469,403,318) Net investment in finance lease receivables P=11,526,164,986 P=8,583,218,613
The net investment in finance lease receivables is analyzed as follows:
2012 2011 Due within 1 year P=490,638,641 P=257,922,184Due beyond 1 year but not beyond 5 years 11,035,526,345 8,300,198,085Due beyond 5 years – 25,098,344 P=11,526,164,986 P=8,583,218,613
Interest income on loans and receivables consists of:
2012 2011 Receivables financed P=829,294,069 P=1,049,130,562 Finance lease receivables 852,459,723 545,349,260 P=1,681,753,792 P=1,594,479,822
A reconciliation of the allowance for credit losses by class of receivables from customers follows (see Note 11):
2012
Receivables
financed Finance lease
receivables Total
Balances at beginning of year P=194,319,284
P=131,685,343 P=326,004,627 Provisions 79,907,725 155,257,514 235,165,239 Accounts written off (50,128,505) (41,864,245) (91,992,750) Balances at end of year P=224,098,504 P=245,078,612 P=469,177,116
- 21 -
*SGVMC118066*
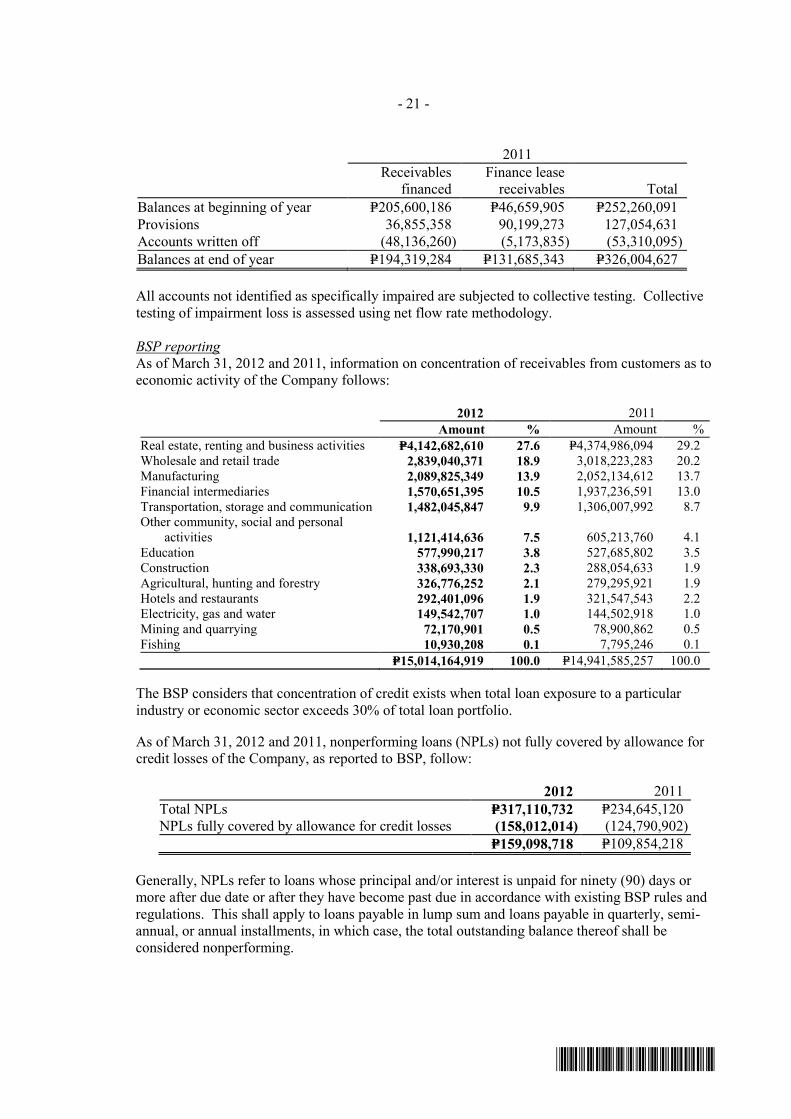
2011
Receivables
financed Finance lease
receivables Total Balances at beginning of year P=205,600,186 P=46,659,905 P=252,260,091 Provisions 36,855,358 90,199,273 127,054,631 Accounts written off (48,136,260) (5,173,835) (53,310,095) Balances at end of year P=194,319,284 P=131,685,343 P=326,004,627
All accounts not identified as specifically impaired are subjected to collective testing. Collective testing of impairment loss is assessed using net flow rate methodology.
BSP reporting As of March 31, 2012 and 2011, information on concentration of receivables from customers as to economic activity of the Company follows:
2012 2011 Amount % Amount % Real estate, renting and business activities P=4,142,682,610 27.6 P=4,374,986,094 29.2 Wholesale and retail trade 2,839,040,371 18.9 3,018,223,283 20.2 Manufacturing 2,089,825,349 13.9 2,052,134,612 13.7 Financial intermediaries 1,570,651,395 10.5 1,937,236,591 13.0 Transportation, storage and communication 1,482,045,847 9.9 1,306,007,992 8.7 Other community, social and personal activities 1,121,414,636 7.5 605,213,760 4.1 Education 577,990,217 3.8 527,685,802 3.5 Construction 338,693,330 2.3 288,054,633 1.9 Agricultural, hunting and forestry 326,776,252 2.1 279,295,921 1.9 Hotels and restaurants 292,401,096 1.9 321,547,543 2.2 Electricity, gas and water 149,542,707 1.0 144,502,918 1.0 Mining and quarrying 72,170,901 0.5 78,900,862 0.5 Fishing 10,930,208 0.1 7,795,246 0.1 P=15,014,164,919 100.0 P=14,941,585,257 100.0
The BSP considers that concentration of credit exists when total loan exposure to a particular industry or economic sector exceeds 30% of total loan portfolio.
As of March 31, 2012 and 2011, nonperforming loans (NPLs) not fully covered by allowance for credit losses of the Company, as reported to BSP, follow:
2012 2011 Total NPLs P=317,110,732 P=234,645,120 NPLs fully covered by allowance for credit losses (158,012,014) (124,790,902) P=159,098,718 P=109,854,218
Generally, NPLs refer to loans whose principal and/or interest is unpaid for ninety (90) days or more after due date or after they have become past due in accordance with existing BSP rules and regulations. This shall apply to loans payable in lump sum and loans payable in quarterly, semi-annual, or annual installments, in which case, the total outstanding balance thereof shall be considered nonperforming.

- 22 -
*SGVMC118066*
In the case of receivables that are payable in monthly installments, the total outstanding balance thereof shall be considered nonperforming when three (3) or more installments are in arrears. In the case of receivables that are payable in weekly, or semi-monthly installments, the total outstanding balance thereof shall be considered nonperforming at the same time that they become past due in accordance with existing BSP regulations, i.e., the entire outstanding balance of the receivable shall be considered as past due when the total amount of arrearages reaches more than 10.0% of the total receivable balance.
8. Assets Held for Sale
The rollforward analysis of this account follows:
2012 2011 Cost Balance at beginning of year P=69,505,643 P=46,043,345 Additions 402,051,712 237,030,282 Disposals (389,751,778) (213,567,984) Balance at end of year 81,805,577 69,505,643 Allowance for impairment losses (Note 11) Balance at beginning of year 6,147,469 4,143,239 Additions 34,008,111 20,298,358 Disposals (33,210,787) (18,294,128) Balance at end of year 6,944,793 6,147,469 Net book value P=74,860,784 P=63,358,174
The Company’s assets held for sale consist of repossessed collaterals from customers who have defaulted in their respective loan accounts. These are actively marketed for sale and are expected to be sold within one year from the date of its classification as assets held for sale.
Gain (loss) on assets held for sale included under “Service fees and other income” in the statements of comprehensive income amounted to (P=9.3) million and P=9.4 million in 2012 and 2011, respectively (see Note 18).
9. Property and Equipment
The composition and movements in this account follow:
2012
Leasehold
Improvements
Furniture, Fixtures and
Equipment Transportation
Equipment Total Cost Balances at beginning of year P=17,659,660 P=38,264,633 P=29,603,457 P=85,527,750 Additions (Note 26) 5,017,196 3,081,360 14,548,729 22,647,285 Disposals - - (20,749,222) (20,749,222) Balances at end of year 22,676,856 41,345,993 23,402,964 87,425,813 Accumulated depreciation and amortization Balances at beginning of year 16,936,717 35,209,308 17,000,870 69,146,895 Depreciation and amortization 675,659 3,354,808 15,547 4,046,014 Disposals (12,766) - (3,092,264) (3,105,030) Balances at end of year 17,599,610 38,564,116 13,924,153 70,087,879 Net book value P=5,077,246 P=2,781,877 P=9,478,811 P=17,337,934
- 23 -
*SGVMC118066*
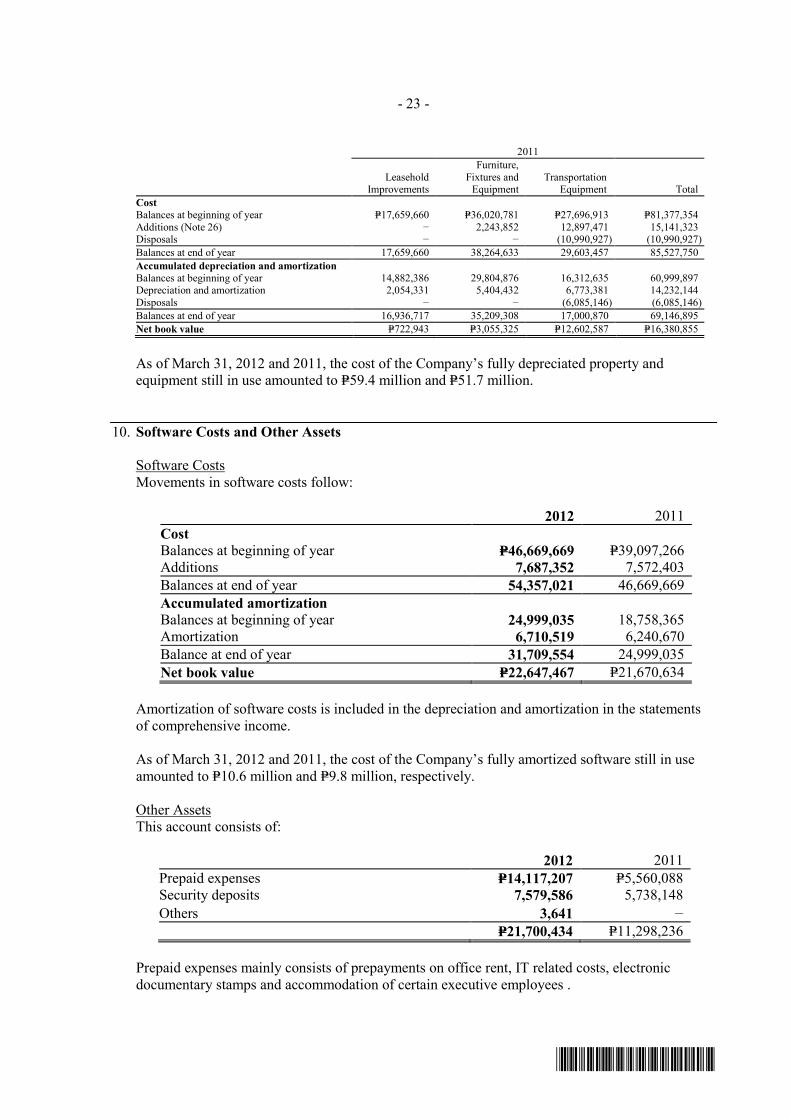
2011
Leasehold
Improvements
Furniture, Fixtures and
Equipment Transportation
Equipment Total Cost Balances at beginning of year P=17,659,660 P=36,020,781 P=27,696,913 P=81,377,354 Additions (Note 26) − 2,243,852 12,897,471 15,141,323 Disposals − − (10,990,927) (10,990,927) Balances at end of year 17,659,660 38,264,633 29,603,457 85,527,750 Accumulated depreciation and amortization Balances at beginning of year 14,882,386 29,804,876 16,312,635 60,999,897 Depreciation and amortization 2,054,331 5,404,432 6,773,381 14,232,144 Disposals − − (6,085,146) (6,085,146) Balances at end of year 16,936,717 35,209,308 17,000,870 69,146,895 Net book value P=722,943 P=3,055,325 P=12,602,587 P=16,380,855
As of March 31, 2012 and 2011, the cost of the Company’s fully depreciated property and equipment still in use amounted to P=59.4 million and P=51.7 million.
10. Software Costs and Other Assets
Software Costs Movements in software costs follow:
2012 2011 Cost Balances at beginning of year P=46,669,669 P=39,097,266 Additions 7,687,352 7,572,403 Balances at end of year 54,357,021 46,669,669 Accumulated amortization Balances at beginning of year 24,999,035 18,758,365 Amortization 6,710,519 6,240,670 Balance at end of year 31,709,554 24,999,035 Net book value P=22,647,467 P=21,670,634
Amortization of software costs is included in the depreciation and amortization in the statements of comprehensive income.
As of March 31, 2012 and 2011, the cost of the Company’s fully amortized software still in use amounted to P=10.6 million and P=9.8 million, respectively.
Other Assets This account consists of:
2012 2011 Prepaid expenses P=14,117,207 P=5,560,088 Security deposits 7,579,586 5,738,148 Others 3,641 – P=21,700,434 P=11,298,236
Prepaid expenses mainly consists of prepayments on office rent, IT related costs, electronic documentary stamps and accommodation of certain executive employees .
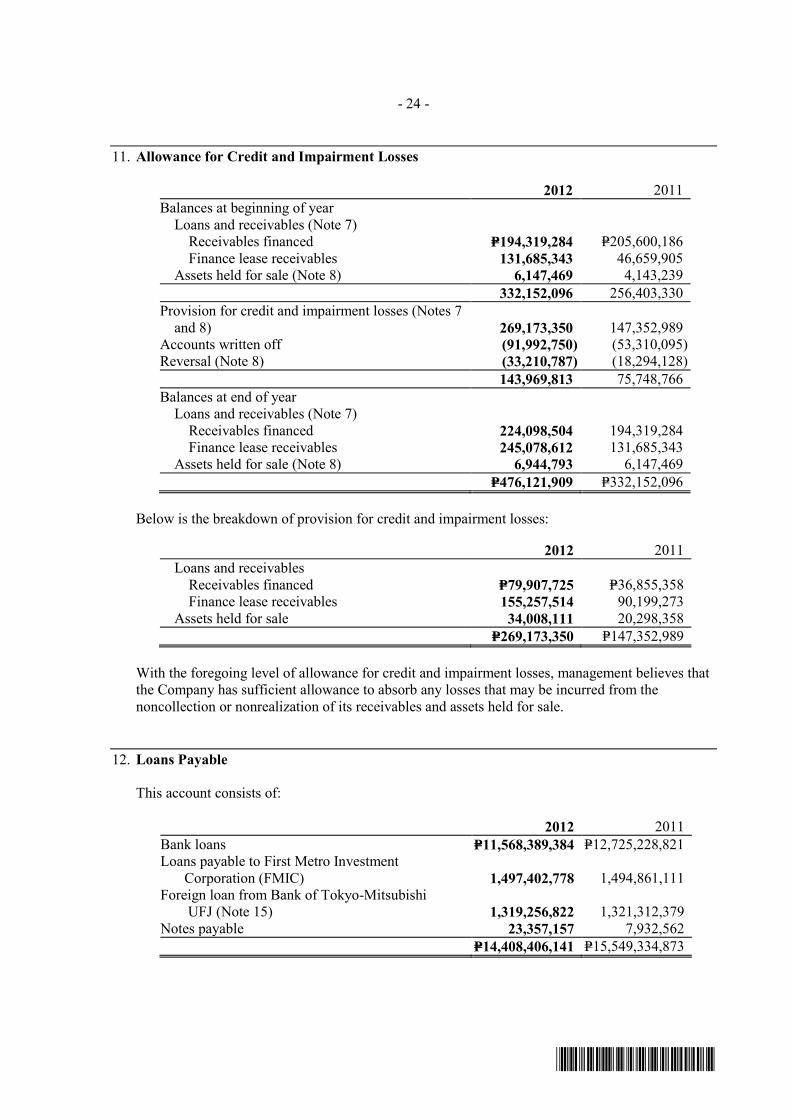
- 24 -
*SGVMC118066*
11. Allowance for Credit and Impairment Losses
2012 2011 Balances at beginning of year Loans and receivables (Note 7) Receivables financed P=194,319,284 P=205,600,186 Finance lease receivables 131,685,343 46,659,905 Assets held for sale (Note 8) 6,147,469 4,143,239 332,152,096 256,403,330 Provision for credit and impairment losses (Notes 7
and 8) 269,173,350 147,352,989 Accounts written off (91,992,750) (53,310,095) Reversal (Note 8) (33,210,787) (18,294,128) 143,969,813 75,748,766 Balances at end of year Loans and receivables (Note 7) Receivables financed 224,098,504 194,319,284 Finance lease receivables 245,078,612 131,685,343 Assets held for sale (Note 8) 6,944,793 6,147,469 P=476,121,909 P=332,152,096
Below is the breakdown of provision for credit and impairment losses:
2012 2011 Loans and receivables Receivables financed P=79,907,725 P=36,855,358 Finance lease receivables 155,257,514 90,199,273 Assets held for sale 34,008,111 20,298,358 P=269,173,350 P=147,352,989
With the foregoing level of allowance for credit and impairment losses, management believes that the Company has sufficient allowance to absorb any losses that may be incurred from the noncollection or nonrealization of its receivables and assets held for sale.
12. Loans Payable
This account consists of:
2012 2011 Bank loans P=11,568,389,384 P=12,725,228,821 Loans payable to First Metro Investment Corporation (FMIC) 1,497,402,778 1,494,861,111 Foreign loan from Bank of Tokyo-Mitsubishi
UFJ (Note 15) 1,319,256,822 1,321,312,379 Notes payable 23,357,157 7,932,562 P=14,408,406,141 P=15,549,334,873

- 25 -
*SGVMC118066*
Bank loans bear interest rates ranging from 2.9% to 6.9% in 2012 and from 1.9% to 8.2% in 2011. As of March 31, 2012 and 2011, the Company’s bank loans have maturity period of 4 months to 5 years.
Notes payable pertains to retail notes issued by the Company that bear interest rates ranging from 3.3% to 4.0% and with maturity period of 1 month to 12 months.
Foreign loan from BTMU-Japan
On December 18, 2009, the BSP approved the Company’s application to enter into a USD term loan agreement with Bank of Tokyo-Mitsubishi UFJ (BTMU-Japan). The Company was also allowed to execute a cross-currency swap agreement on the approved USD term loan.
On February 4, 2010, the Company entered into a US$31.0 million loan with BTMU-Japan which will mature on February 4, 2013. Interest is payable quarterly based on British Banker’s Association London Interbank Offered Rate (BBA LIBOR) plus 0.4 %. On the same date, the Company entered into a cross-currency interest rate swap agreement with BTMU-Manila Branch and which was designated by the Company as cash flow hedge (see Note 15).
On April 23, 2010, the Company entered into a loan agreement with FMIC to obtain a loan amounting to P=1.5 billion. The loan bears an interest of 6.6% and will mature on April 10, 2013. Interest on the loan will be payable every six months from the date of borrowing.
Interest expense on loans payable consists of:
2012 2011 Bank loans P=600,732,769 P=604,087,582 Foreign loan from BTMU-Japan 106,672,414 99,039,988 Loans payable to FMIC 100,297,725 103,038,100 Notes payable 736,684 120,334,990 P=808,439,592 P=926,500,660
13. Subordinated Debt
On April 28, 2011 (the Issue Date), the Company issued unsecured subordinated notes (the Notes) amounting to P=1.0 billion. The Notes bear an interest of 6.7% and will mature on April 28, 2016 (the Maturity Date).
Among the significant terms and conditions of the Notes are:
a. The Notes will be in minimum denominations of P=50.0 million and in integral multiples of
P=10.0 million thereafter, each sold at 100% of the face value of the Notes for a total issue size of P=1.0 billion.
b. The fixed rate of 6.7% per annum, payable to the noteholders for the period from and including
the Issue Date up to but excluding the Maturity Date. The interest rate or the formulation for calculating interest payments shall be fixed at the time of the issuance of the Notes and may not be linked to the credit standing of the Company.
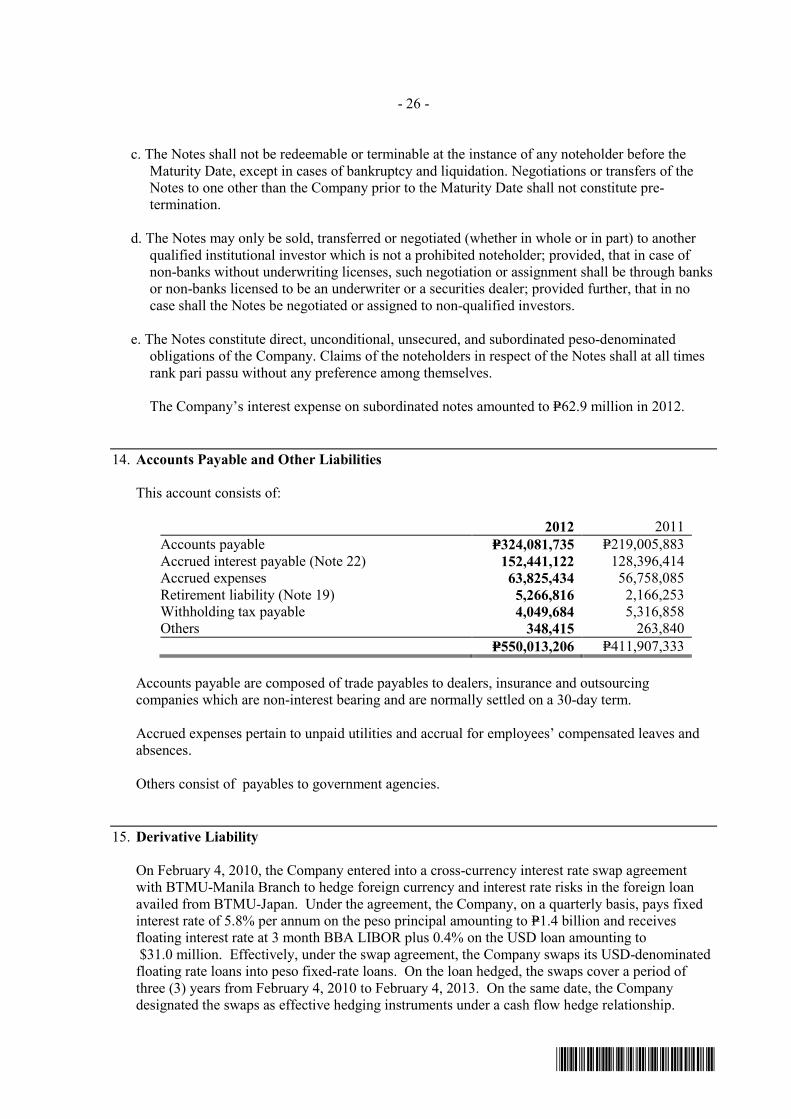
- 26 -
*SGVMC118066*
c. The Notes shall not be redeemable or terminable at the instance of any noteholder before the
Maturity Date, except in cases of bankruptcy and liquidation. Negotiations or transfers of the Notes to one other than the Company prior to the Maturity Date shall not constitute pre-termination.
d. The Notes may only be sold, transferred or negotiated (whether in whole or in part) to another
qualified institutional investor which is not a prohibited noteholder; provided, that in case of non-banks without underwriting licenses, such negotiation or assignment shall be through banks or non-banks licensed to be an underwriter or a securities dealer; provided further, that in no case shall the Notes be negotiated or assigned to non-qualified investors.
e. The Notes constitute direct, unconditional, unsecured, and subordinated peso-denominated
obligations of the Company. Claims of the noteholders in respect of the Notes shall at all times rank pari passu without any preference among themselves.
The Company’s interest expense on subordinated notes amounted to P=62.9 million in 2012.
14. Accounts Payable and Other Liabilities
This account consists of:
2012 2011 Accounts payable P=324,081,735 P=219,005,883 Accrued interest payable (Note 22) 152,441,122 128,396,414 Accrued expenses 63,825,434 56,758,085 Retirement liability (Note 19) 5,266,816 2,166,253 Withholding tax payable 4,049,684 5,316,858 Others 348,415 263,840 P=550,013,206 P=411,907,333
Accounts payable are composed of trade payables to dealers, insurance and outsourcing companies which are non-interest bearing and are normally settled on a 30-day term.
Accrued expenses pertain to unpaid utilities and accrual for employees’ compensated leaves and absences.
Others consist of payables to government agencies.
15. Derivative Liability
On February 4, 2010, the Company entered into a cross-currency interest rate swap agreement with BTMU-Manila Branch to hedge foreign currency and interest rate risks in the foreign loan availed from BTMU-Japan. Under the agreement, the Company, on a quarterly basis, pays fixed interest rate of 5.8% per annum on the peso principal amounting to P=1.4 billion and receives floating interest rate at 3 month BBA LIBOR plus 0.4% on the USD loan amounting to $31.0 million. Effectively, under the swap agreement, the Company swaps its USD-denominated floating rate loans into peso fixed-rate loans. On the loan hedged, the swaps cover a period of three (3) years from February 4, 2010 to February 4, 2013. On the same date, the Company designated the swaps as effective hedging instruments under a cash flow hedge relationship.
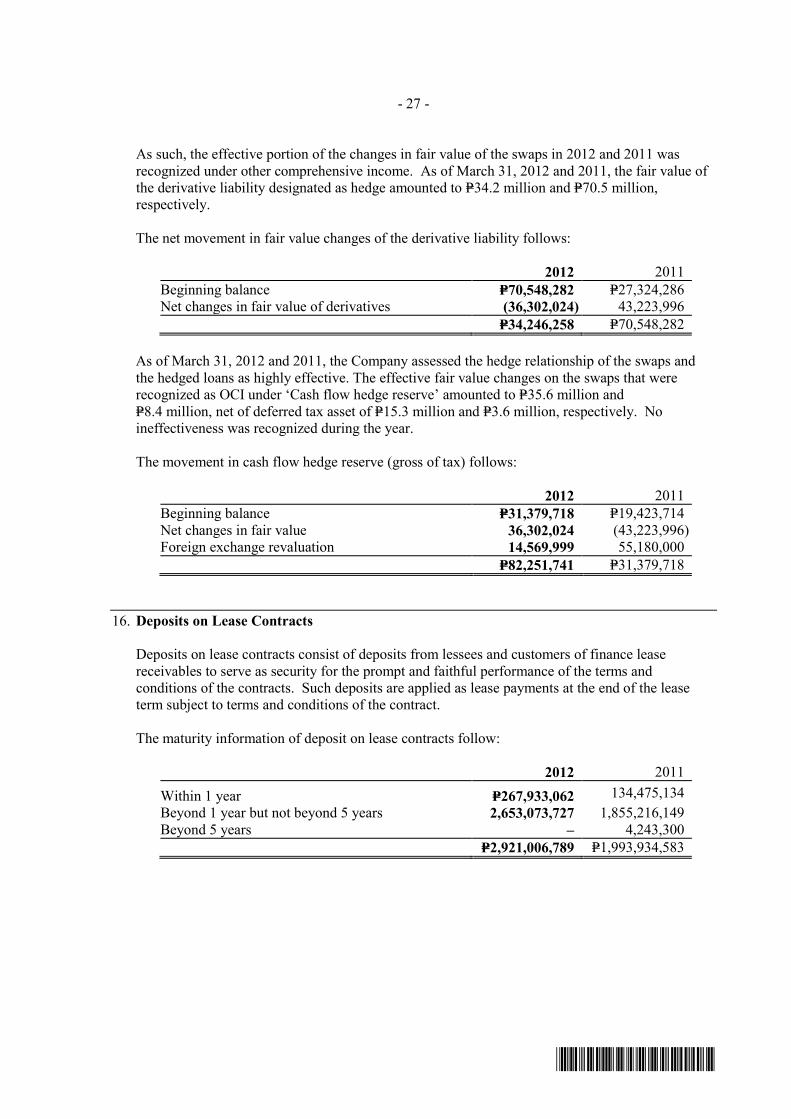
- 27 -
*SGVMC118066*
As such, the effective portion of the changes in fair value of the swaps in 2012 and 2011 was recognized under other comprehensive income. As of March 31, 2012 and 2011, the fair value of the derivative liability designated as hedge amounted to P=34.2 million and P=70.5 million, respectively.
The net movement in fair value changes of the derivative liability follows:
2012 2011 Beginning balance P=70,548,282 P=27,324,286 Net changes in fair value of derivatives (36,302,024) 43,223,996 P=34,246,258 P=70,548,282
As of March 31, 2012 and 2011, the Company assessed the hedge relationship of the swaps and the hedged loans as highly effective. The effective fair value changes on the swaps that were recognized as OCI under ‘Cash flow hedge reserve’ amounted to P=35.6 million and P=8.4 million, net of deferred tax asset of P=15.3 million and P=3.6 million, respectively. No ineffectiveness was recognized during the year.
The movement in cash flow hedge reserve (gross of tax) follows:
2012 2011 Beginning balance P=31,379,718 P=19,423,714 Net changes in fair value 36,302,024 (43,223,996) Foreign exchange revaluation 14,569,999 55,180,000 P=82,251,741 P=31,379,718
16. Deposits on Lease Contracts
Deposits on lease contracts consist of deposits from lessees and customers of finance lease receivables to serve as security for the prompt and faithful performance of the terms and conditions of the contracts. Such deposits are applied as lease payments at the end of the lease term subject to terms and conditions of the contract.
The maturity information of deposit on lease contracts follow:
2012 2011 Within 1 year P=267,933,062 134,475,134 Beyond 1 year but not beyond 5 years 2,653,073,727 1,855,216,149 Beyond 5 years – 4,243,300 P=2,921,006,789 P=1,993,934,583
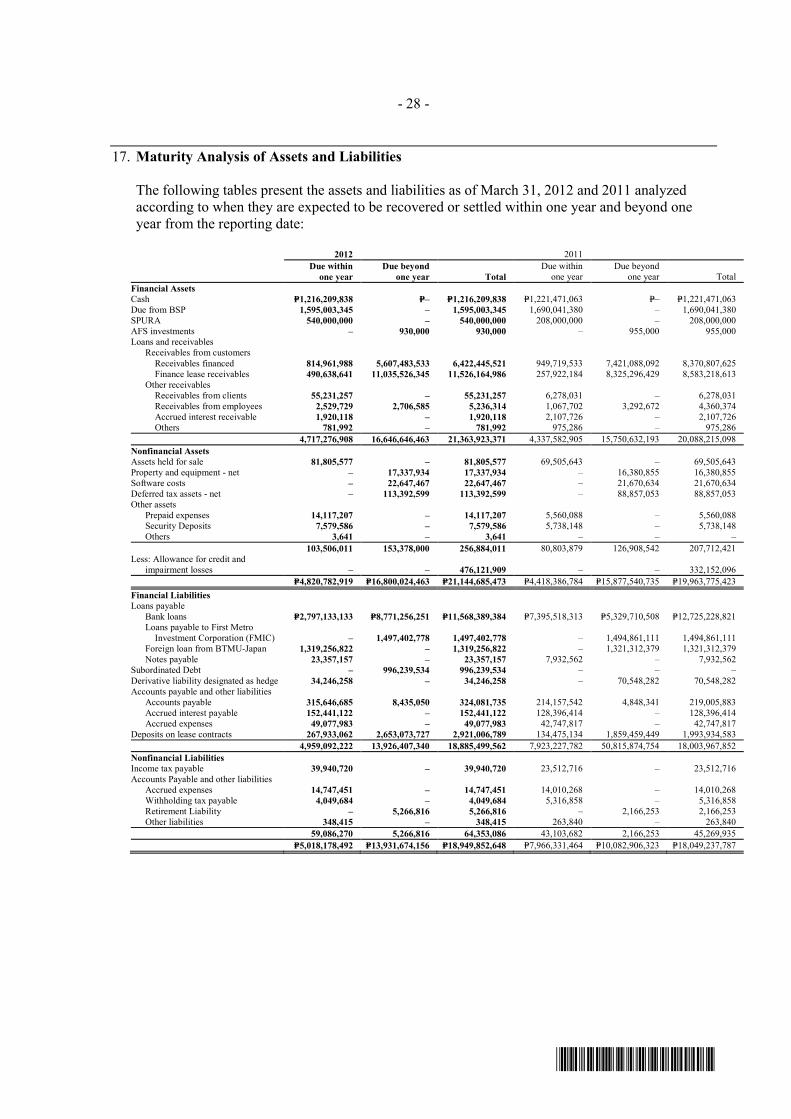
- 28 -
*SGVMC118066*
17. Maturity Analysis of Assets and Liabilities
The following tables present the assets and liabilities as of March 31, 2012 and 2011 analyzed according to when they are expected to be recovered or settled within one year and beyond one year from the reporting date:
2012 2011
Due within
one year Due beyond
one year Total Due within
one year Due beyond
one year Total Financial Assets Cash P=1,216,209,838 P=– P=1,216,209,838 P=1,221,471,063 P=– P=1,221,471,063 Due from BSP 1,595,003,345 – 1,595,003,345 1,690,041,380 – 1,690,041,380 SPURA 540,000,000 – 540,000,000 208,000,000 – 208,000,000 AFS investments – 930,000 930,000 – 955,000 955,000 Loans and receivables Receivables from customers Receivables financed 814,961,988 5,607,483,533 6,422,445,521 949,719,533 7,421,088,092 8,370,807,625 Finance lease receivables 490,638,641 11,035,526,345 11,526,164,986 257,922,184 8,325,296,429 8,583,218,613 Other receivables Receivables from clients 55,231,257 – 55,231,257 6,278,031 – 6,278,031 Receivables from employees 2,529,729 2,706,585 5,236,314 1,067,702 3,292,672 4,360,374 Accrued interest receivable 1,920,118 – 1,920,118 2,107,726 – 2,107,726 Others 781,992 – 781,992 975,286 – 975,286 4,717,276,908 16,646,646,463 21,363,923,371 4,337,582,905 15,750,632,193 20,088,215,098 Nonfinancial Assets Assets held for sale 81,805,577 – 81,805,577 69,505,643 – 69,505,643 Property and equipment - net – 17,337,934 17,337,934 – 16,380,855 16,380,855 Software costs – 22,647,467 22,647,467 – 21,670,634 21,670,634 Deferred tax assets - net – 113,392,599 113,392,599 – 88,857,053 88,857,053 Other assets Prepaid expenses 14,117,207 – 14,117,207 5,560,088 – 5,560,088 Security Deposits 7,579,586 – 7,579,586 5,738,148 – 5,738,148
Others 3,641 – 3,641 – – – 103,506,011 153,378,000 256,884,011 80,803,879 126,908,542 207,712,421 Less: Allowance for credit and
impairment losses – – 476,121,909 – – 332,152,096 P=4,820,782,919 P=16,800,024,463 P=21,144,685,473 P=4,418,386,784 P=15,877,540,735 P=19,963,775,423 Financial Liabilities Loans payable Bank loans P=2,797,133,133 P=8,771,256,251 P=11,568,389,384 P=7,395,518,313 P=5,329,710,508 P=12,725,228,821 Loans payable to First Metro Investment Corporation (FMIC) – 1,497,402,778 1,497,402,778 – 1,494,861,111 1,494,861,111 Foreign loan from BTMU-Japan 1,319,256,822 – 1,319,256,822 – 1,321,312,379 1,321,312,379 Notes payable 23,357,157 – 23,357,157 7,932,562 – 7,932,562 Subordinated Debt – 996,239,534 996,239,534 – – – Derivative liability designated as hedge 34,246,258 – 34,246,258 – 70,548,282 70,548,282 Accounts payable and other liabilities Accounts payable 315,646,685 8,435,050 324,081,735 214,157,542 4,848,341 219,005,883 Accrued interest payable 152,441,122 – 152,441,122 128,396,414 – 128,396,414 Accrued expenses 49,077,983 – 49,077,983 42,747,817 – 42,747,817 Deposits on lease contracts 267,933,062 2,653,073,727 2,921,006,789 134,475,134 1,859,459,449 1,993,934,583 4,959,092,222 13,926,407,340 18,885,499,562 7,923,227,782 50,815,874,754 18,003,967,852 Nonfinancial Liabilities Income tax payable 39,940,720 – 39,940,720 23,512,716 – 23,512,716 Accounts Payable and other liabilities
Accrued expenses 14,747,451 – 14,747,451 14,010,268 – 14,010,268 Withholding tax payable 4,049,684 – 4,049,684 5,316,858 – 5,316,858 Retirement Liability – 5,266,816 5,266,816 – 2,166,253 2,166,253 Other liabilities 348,415 – 348,415 263,840 – 263,840
59,086,270 5,266,816 64,353,086 43,103,682 2,166,253 45,269,935 P=5,018,178,492 P=13,931,674,156 P=18,949,852,648 P=7,966,331,464 P=10,082,906,323 P=18,049,237,787

- 29 -
*SGVMC118066*
18. Service Fees and Other Income
This account consists of:
2012 2011Service fees P=90,842,856 P=87,951,972Recoveries from accounts written off 11,512,729 5,316,964Gain (loss) on assets held for sale (9,349,983) 9,444,894Others 1,007,301 1,515,356 P=94,012,903 P=104,229,186
Service fees include income from late payments and penalty charges.
Others includes gain on sale of property and equipment, foreign exchange gains, impairment loss on AFS investments and other miscellaneous income.
19. Retirement Plan
The Company has a funded, noncontributory benefit retirement plan covering all its employees with regular employment status.
The following tables summarize the components of the retirement expense recognized in profit or loss and the funded status and amounts recognized in the statement of financial position for the retirement plan.
The net retirement liabilities included in Accounts payable and accrued expenses in the statements of financial position as of March 31, 2012 and 2011 follows:
2012 2011 Fair value of plan assets P=38,576,400 P=37,716,891 Present value of the obligation 15,890,224 17,872,335 22,686,176 19,844,556 Unrecognized actuarial gain (27,952,992) (22,010,809) (P=5,266,816) (P=2,166,253)
The retirement expense, which is included in compensation and fringe benefits in profit or loss, follows:
2012 2011 Current service cost P=4,836,900 P=4,431,820 Interest cost 1,603,148 2,347,988 Expected return on plan asset (2,546,480) (2,450,572) Net recognized actuarial gain (793,005) (177,526) P=3,100,563 P=4,151,710

- 30 -
*SGVMC118066*
The movements in the fair value of plan assets follow:
2012 2011 Balance at beginning of year P=37,716,891 P=36,586,406 Expected return on plan asset 2,546,480 2,450,572 Benefits paid (2,677,204) (3,156,462) Net actuarial gain 990,233 1,836,375 Contributions – – Balance at end of year P=38,576,400 P=37,716,891
The actual return on plan asset amounted to P=3.5 million and P=4.3 million in 2012 and 2011, respectively.
The movements in the present value of retirement benefit obligation follow:
2012 2011 Balance at beginning of year P=17,872,335 P=26,681,681 Current service cost 4,836,900 4,431,820 Interest cost 1,603,148 2,347,988 Net actuarial (gain) (5,744,955) (12,432,692) Benefits paid (2,677,204) (3,156,462) Balance at end of year P=15,890,224 P=17,872,335
The distributions of the plan assets follow:
2012 2011 Investment in government securities P=37,852,730 P=30,872,174 Bank deposits 499,107 2,367,465 Commercial loans and discounts – 3,960,000 Accrued interest receivable 547,942 564,289 38,899,779 37,763,928 Less accrued trust payable 323,379 47,037 P=38,576,400 P=37,716,891
The principal actuarial assumptions used in determining retirement benefit obligation of the Company follow:
2012 2011 Discount rate
At beginning of year 8.97% 8.80%At end of year 6.57% 8.97%
Expected rate of return on plan assets At beginning and end of year 7.00% 7.00%
Future salary increases At beginning of year 7.50% 8.50%At end of year 7.00% 7.50%

- 31 -
*SGVMC118066*
The amounts of present value of defined benefit obligation, fair value of plan assets, deficit (surplus) in the plan and experience adjustments arising on plan assets or liabilities recognized for the current and previous four periods are as follows:
2012 2011 2010 2009 2008
Present value of obligation P=15,890,224 P=17,872,335 P=26,681,681 P=16,251,531 P=22,285,473 Fair value of plan assets 38,576,400 37,716,891 36,586,406 20,510,898 20,060,186 Deficit (surplus) (P=22,686,176) (P=19,844,556) (P=9,904,725) (P=4,259,367) P=2,225,287 Experience adjustments on plan liabilities (P=5,744,955) (P=12,432,692) (P=5,406,804) P=10,446,844 P=– Experience adjustments on plan assets P=990,233 P=1,836,375 P=824,494 (P=57,782) P=–
The Company expects to contribute P=6.0 million on its retirement plan in 2013. 20. Income Taxes
Provision for income tax consists of:
2012 2011 Current
Regular P=135,114,950 P=101,522,036 Final 14,495,659 23,604,595
149,610,609 125,126,631 Deferred (39,797,153) (21,692,762) P=109,813,456 P=103,433,869
The components of net deferred tax assets follow:
2012 2011 Deferred tax assets:
Allowance for credit and impairment losses P=142,836,573 P=99,645,629 Pension cost 3,498,654 2,985,992 Deferred note issue cost – 1,081,582 Excess of rent expense over payment 719,428 1,027,363 Accrued expenses and others 205,890 206,232
147,260,545 104,946,798 Deferred tax liabilities:
Cash flow hedge reserve 24,675,523 9,413,916 Documentary stamp tax 8,018,936 6,655,632 Unrealized foreign exchange loss 45,347 20,197
Subordinated debt issue cost 1,128,140 – 33,867,946 16,089,745 P=113,392,599 P=88,857,053
Under current tax regulations, the maximum amount of entertainment, amusement and recreation (EAR) expenses allowable as deduction from gross income for purposes of income tax computation shall not exceed 1% of the gross revenue of the Company. EAR expenses incurred in 2012 and 2011 amounted to P=9.2 million and P=8.4 million, respectively.

- 32 -
*SGVMC118066*
The reconciliation of provision for income tax computed at the statutory corporate income tax rate to provision for income tax shown in the statements of comprehensive income follows:
2012 2011 At statutory income tax rate P=106,326,969 P=99,320,432 Adjustments for:
Nondeductible expenses 3,016,034 – Nondeductible interest expense 6,907,938 9,600,122 Interest income subjected to final tax (6,437,485) (5,486,685)
P=109,813,456 P=103,433,869 21. Lease Commitments
The Company currently leases the office premises it occupies. The lease contract is for a period of 5 years and is renewable upon mutual agreement between the Company and the lessor. In 2012 and 2011, rent expense, which is included under ‘occupancy expenses’ amounted to P=12.7 million and P=12.8 million, respectively.
The leasehold rental commitments of the Company follow:
2012 2011 Within 1 year P=6,087,907 P=12,853,415 Beyond 1 year 2,363,200 3,252,067 P=8,451,107 P=16,105,482
22. Related Party Transactions
Parties are considered to be related if one party has the ability, directly or indirectly, to control the other party, or exercise significant influence over the other party in making financial and operating decisions. Parties are also considered to be related if they are subject to common control or common significant influence (referred to as affiliates).
In the normal course of business, the Company enters into transactions with its related parties principally consisting of advances and other borrowings. Under RA No. 8556, Financing Company Act, the Company’s amount of credit accommodation to its directors, officers, stockholders and other related parties should not exceed 15% of its net worth. In 2012 and 2011, the Company has complied with this regulatory requirement.
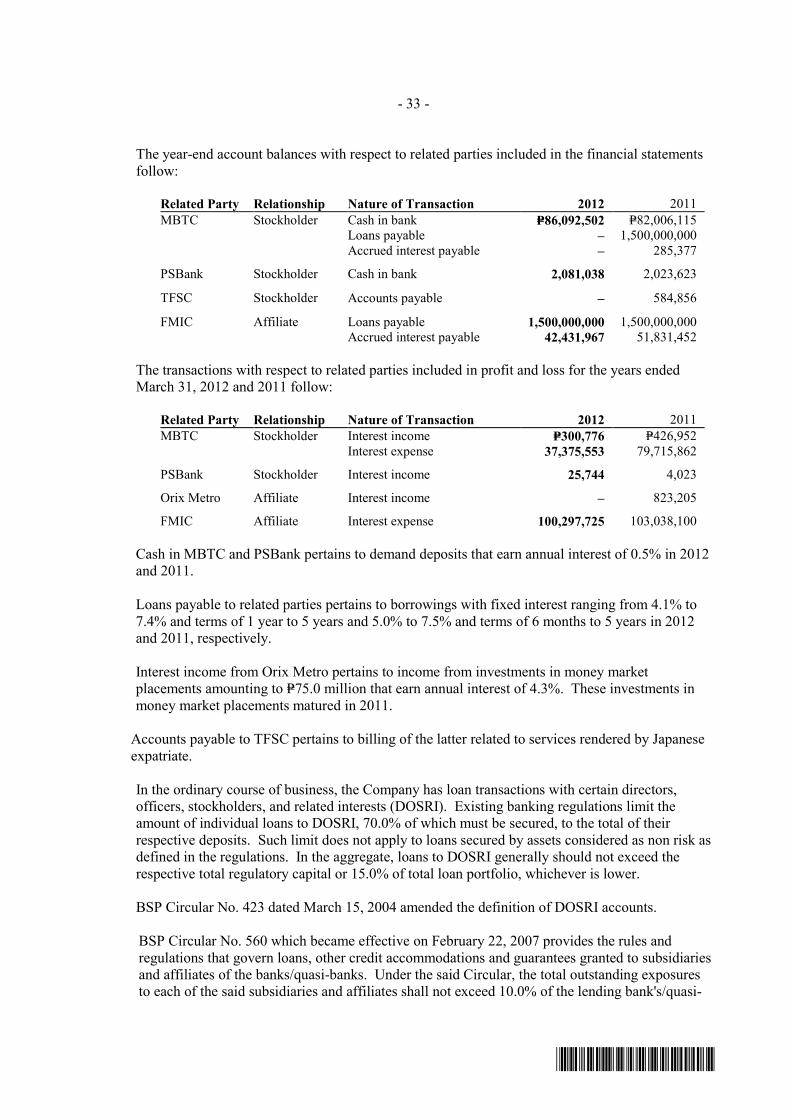
- 33 -
*SGVMC118066*
The year-end account balances with respect to related parties included in the financial statements follow:
Related Party Relationship Nature of Transaction 2012 2011 MBTC Stockholder Cash in bank P=86,092,502 P=82,006,115 Loans payable – 1,500,000,000 Accrued interest payable – 285,377
PSBank Stockholder Cash in bank 2,081,038 2,023,623
TFSC Stockholder Accounts payable – 584,856
FMIC Affiliate Loans payable 1,500,000,000 1,500,000,000 Accrued interest payable 42,431,967 51,831,452
The transactions with respect to related parties included in profit and loss for the years ended March 31, 2012 and 2011 follow:
Related Party Relationship Nature of Transaction 2012 2011 MBTC Stockholder Interest income P=300,776 P=426,952 Interest expense 37,375,553 79,715,862
PSBank Stockholder Interest income 25,744 4,023
Orix Metro Affiliate Interest income – 823,205
FMIC Affiliate Interest expense 100,297,725 103,038,100
Cash in MBTC and PSBank pertains to demand deposits that earn annual interest of 0.5% in 2012 and 2011.
Loans payable to related parties pertains to borrowings with fixed interest ranging from 4.1% to 7.4% and terms of 1 year to 5 years and 5.0% to 7.5% and terms of 6 months to 5 years in 2012 and 2011, respectively.
Interest income from Orix Metro pertains to income from investments in money market
placements amounting to P=75.0 million that earn annual interest of 4.3%. These investments in money market placements matured in 2011.
Accounts payable to TFSC pertains to billing of the latter related to services rendered by Japanese expatriate.
In the ordinary course of business, the Company has loan transactions with certain directors, officers, stockholders, and related interests (DOSRI). Existing banking regulations limit the amount of individual loans to DOSRI, 70.0% of which must be secured, to the total of their respective deposits. Such limit does not apply to loans secured by assets considered as non risk as defined in the regulations. In the aggregate, loans to DOSRI generally should not exceed the respective total regulatory capital or 15.0% of total loan portfolio, whichever is lower.
BSP Circular No. 423 dated March 15, 2004 amended the definition of DOSRI accounts.
BSP Circular No. 560 which became effective on February 22, 2007 provides the rules and regulations that govern loans, other credit accommodations and guarantees granted to subsidiaries and affiliates of the banks/quasi-banks. Under the said Circular, the total outstanding exposures to each of the said subsidiaries and affiliates shall not exceed 10.0% of the lending bank's/quasi-

- 34 -
*SGVMC118066*
bank’s net worth, the unsecured portion of which shall not exceed 5.0% of such net worth. Further, the total outstanding exposures to subsidiaries and affiliates shall not exceed 20.0% of the net worth of the lending bank/quasi-bank; and the subsidiaries and affiliates of the lending bank/quasi-bank are not related interest of any director, officer and/or stockholder of the lending institution, except where such director, officer or stockholder sits in the BOD or is appointed officer of such corporation as representative of the bank/quasi-bank.
As of March 31, 2012 and 2011, the Company has no DOSRI accounts.
The remuneration of the Company’s key management personnel as to benefit type follows:
2012 2011 Salaries and other short-term benefits P=9,191,557 P=10,641,675 Post employment benefits 940,745 12,855,058 P=10,132,302 P=23,496,733
23. Fair Value Measurement
The table below presents a comparison by category of carrying values and fair values of all of the Company’s financial instruments as of March 31, 2012 and 2011.
2012 2011 Carrying values Fair values Carrying values Fair values Financial assets Loans and receivables
Cash P=1,216,209,838 P=1,216,209,838 P=1,221,471,063 P=1,221,471,063 Due from BSP 1,595,003,345 1,595,003,345 1,690,041,380 1,690,041,380 SPURA 540,000,000 540,000,000 208,000,000 208,000,000 AFS investments 930,000 930,000 955,000 955,000 Receivables from customers
Receivables financed - net 6,198,347,017 6,860,100,488 8,176,488,341 8,586,694,696 Finance lease receivable - net 11,281,086,374 12,180,446,363 8,451,533,270 8,753,991,470 Other receivables
Receivable from clients 55,231,257 55,231,257 6,278,031 6,278,031 Receivables from employees 5,236,314 5,236,314 4,360,374 4,360,374 Accrued interest receivable 1,920,118 1,920,118 2,107,726 2,107,726 Others 781,992 781,992 975,286 975,286 P=20,894,746,255 P=22,455,859,715 P=19,762,210,471 P=20,474,875,026 Financial liabilities Loans payable
Bank loans P=11,568,389,384 P=10,756,512,885 P=12,725,228,821 P=11,932,736,242 Loans payable to First Metro Investment Corporation (FMIC) 1,497,402,778 1,420,790,130 1,494,861,111 1,297,642,774 Foreign loan from BTMU-Japan 1,319,256,822 1,330,520,000 1,321,312,379 1,345,090,000
Notes payable 23,357,157 23,357,157 7,932,562 7,932,561 Subordinated Debt 996,239,534 1,031,703,551 – – Derivative liability designated as hedge 34,246,258 34,246,258 70,548,282 70,548,282 Accounts payable and other
liabilities Accounts payable 324,081,735 324,081,735 219,005,883 219,005,883 Accrued interest payable 152,441,122 152,441,122 128,396,414 128,396,414 Accrued expense payable 49,077,983 49,077,983 42,747,817 42,747,817
Deposit on lease contracts 2,921,006,789 2,448,554,982 1,993,934,583 1,574,101,922 P=18,885,499,562 P=17,571,285,803 P=18,003,967,852 P=16,618,201,895
The methods and assumptions used by the Company in estimating the fair value of the financial instruments are:

- 35 -
*SGVMC118066*
Cash and Due from BSP - Due to the short-term nature of the instruments, the fair values approximate the carrying amounts as of the reporting date.
AFS investments - Fair values are generally based on quoted market prices.
Loans and receivables - Fair value was computed using the discounted cash flow method. The discount rate used was the PDST-F rate plus 350 basis points (bps).
Loans payable and subordinated debt - Fair value was computed using the discounted cash flow method. The discount rate used was the zero curve for PDST-F rate plus 200 bps.
Derivative financial instruments - The fair values of cross currency interest rate swap transactions are derived using acceptable valuation methods. The valuation assumptions are based on market conditions existing at the reporting dates.
Accounts payable and other liabilities - Due to the short-term nature of the transactions, the fair value approximates the carrying amount as of the reporting date.
Fair Value Hierarchy The Company uses the following hierarchy for determining and disclosing the fair value of financial instruments by valuation technique:
Level 1: quoted (unadjusted) prices in active markets for identical assets or liabilities
Level 2: other techniques for which all inputs which have significant effect on the recorded fair value are observable, either directly or indirectly
Level 3: techniques which use inputs which have significant effect on the recorded fair value that are not based on observable market data
There were no transfers between Level 1 and Level 2 fair value measurements, and no transfers
into and out of Level 3 fair value measurements during the year. As of March 31, 2012 and 2011, the fair value hierarchy of the Company’s financial instruments
measured at fair values is presented below:
2012 2011 Level 1 Level 2 Level 3 Level 1 Level 2 Level 3
AFS investments P=930,000 P=− P=− P=955,000 P=− P=– Derivative liabilities − 34,246,258 − − 70,548,282 –
24. Capital Management and Financial Performance Ratios
Capital Management The primary objective of the Company’s capital management is to ensure that it maintains a strong credit rating and healthy capital ratios in order to support its business and maximize shareholder value.
The Company manages its capital structure and makes adjustments to it, in light of changes in economic conditions. To maintain or adjust the capital structure, the Company may adjust the
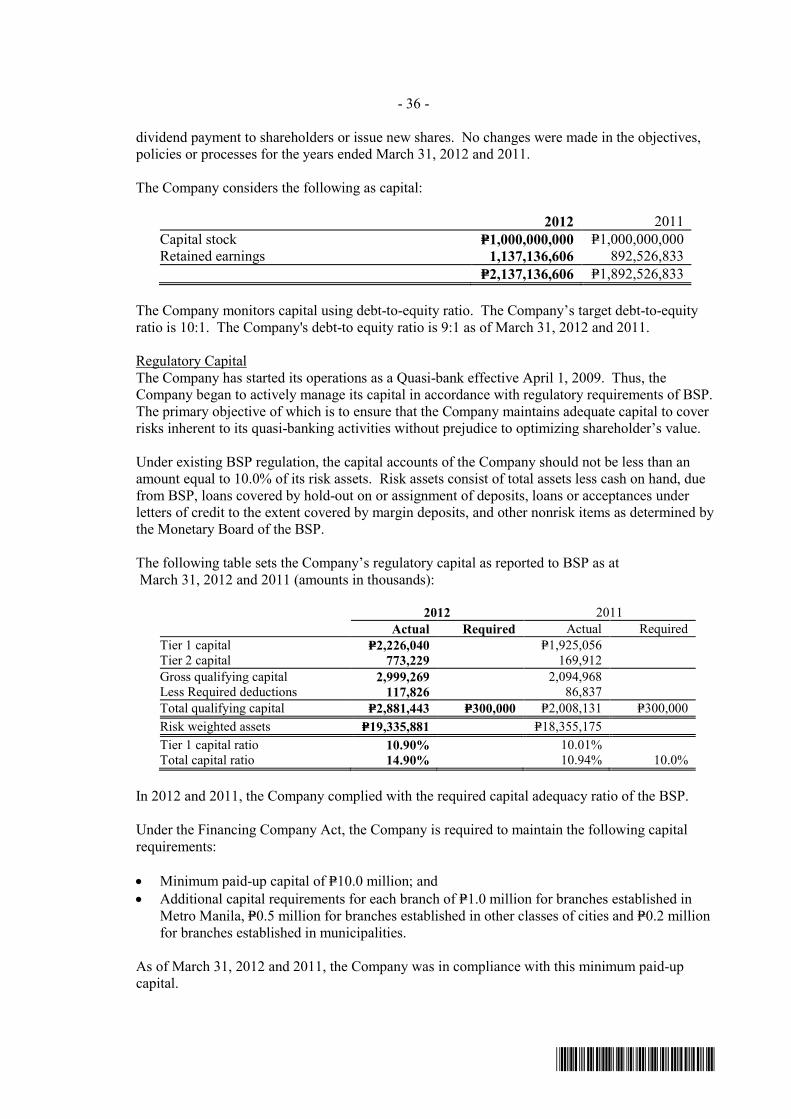
- 36 -
*SGVMC118066*
dividend payment to shareholders or issue new shares. No changes were made in the objectives, policies or processes for the years ended March 31, 2012 and 2011.
The Company considers the following as capital:
2012 2011 Capital stock P=1,000,000,000 P=1,000,000,000 Retained earnings 1,137,136,606 892,526,833 P=2,137,136,606 P=1,892,526,833
The Company monitors capital using debt-to-equity ratio. The Company’s target debt-to-equity ratio is 10:1. The Company's debt-to equity ratio is 9:1 as of March 31, 2012 and 2011.
Regulatory Capital The Company has started its operations as a Quasi-bank effective April 1, 2009. Thus, the Company began to actively manage its capital in accordance with regulatory requirements of BSP. The primary objective of which is to ensure that the Company maintains adequate capital to cover risks inherent to its quasi-banking activities without prejudice to optimizing shareholder’s value.
Under existing BSP regulation, the capital accounts of the Company should not be less than an amount equal to 10.0% of its risk assets. Risk assets consist of total assets less cash on hand, due from BSP, loans covered by hold-out on or assignment of deposits, loans or acceptances under letters of credit to the extent covered by margin deposits, and other nonrisk items as determined by the Monetary Board of the BSP.
The following table sets the Company’s regulatory capital as reported to BSP as at March 31, 2012 and 2011 (amounts in thousands):
2012 2011 Actual Required Actual Required Tier 1 capital P=2,226,040 P=1,925,056 Tier 2 capital 773,229 169,912 Gross qualifying capital 2,999,269 2,094,968 Less Required deductions 117,826 86,837 Total qualifying capital P=2,881,443 P=300,000 P=2,008,131 P=300,000 Risk weighted assets P=19,335,881 P=18,355,175 Tier 1 capital ratio 10.90% 10.01% Total capital ratio 14.90% 10.94% 10.0%
In 2012 and 2011, the Company complied with the required capital adequacy ratio of the BSP.
Under the Financing Company Act, the Company is required to maintain the following capital requirements:
• Minimum paid-up capital of P=10.0 million; and • Additional capital requirements for each branch of P=1.0 million for branches established in
Metro Manila, P=0.5 million for branches established in other classes of cities and P=0.2 million for branches established in municipalities.
As of March 31, 2012 and 2011, the Company was in compliance with this minimum paid-up capital.

- 37 -
*SGVMC118066*
Financial Performance Ratios The following basic ratios measure the financial performance of the Company:
2012 2011 Return on average equity 11.78% 12.64% Return on average assets 1.18% 1.27% Net interest margin on average earning assets 5.81% 5.61%
25. Financial Risk Management Objectives and Policies
The Company’s principal financial instruments are composed of cash in banks, due from BSP, SPURA, loans and receivables, loans payable, derivative liability, accounts payable and accrued expenses and subordinated debt. These financial instruments are used in operations. Financial instruments used in financing are bank loans, subordinated debt and notes payable. The main risks arising from the use of financial instruments are credit risk, liquidity risk and market risk.
Risk Management Framework The Company serves customers of Toyota vehicles through financing and leasing services as well as Toyota dealers through inventory stock financing which subjects the Company to a broad range of risks. Enterprise Risk Management (ERM) enables the Company to achieve corporate objectives while operating within the boundary of its risk appetite through a well-defined risk management framework.
The BOD oversees the Company's overall risk management strategy through the various Committees created as follows:
a. Executive Committee
The Executive Committee approves the limits operated by business units; except for credit exposures to DOSRI which are approved by the BOD regardless of amount.
b. Risk Committee
The Risk Committee provides independent views from the business units and ensures effective implementation of risk management framework through regular reviews of the Company's performance against approved tolerance for each risk indicator. The Committee also monitors key and emerging risks as well as reviews and assesses the impact of business strategies, opportunities and initiatives on overall risk position.
c. Audit Committee
The Audit Committee through Internal Audit provides independent assurance of robustness of processes and methodologies against practice.
d. Toyota Financial Services Corporation Enterprise Risk Functional Committee (TFSC-ERFC).
The TFSC-ERFC helps ensure that all business risks are periodically assessed, monitored and evaluated and assessed internal and external forces that affect the Company’s risk position.
Risk Management Structure The Company's organizational structure includes the Risk Management Unit (RMU), responsible for developing, recommending and implementing policies and strategies of ERM. It is also in charge of periodically monitoring and reporting to management, regional ERFC and to the BOD risk committees, the state of company-wide risk position and effectiveness of the ERM

- 38 -
*SGVMC118066*
framework. In addition, the Company adopts the basic risk tenet that risks are owned by the process owners and have the primary responsibility for identifying, managing and reporting risks.
Risk Management Strategy The Executive Committee establishes and oversees execution of business strategies and has the accountability to identify and manage the embedded risks. Business strategies and business plans are thus aligned with the risk appetite of the TFSC-ERFC and BOD, defined in the form of risk tolerances for a set of selected key risk indicators. These plans are executed by management and are reviewed by the President. Quarterly performances and risks are reviewed together with the appropriate Board Committees.
Risk Monitoring and Reporting All material events that may negatively impact the Company’s earnings, corporate value and reputation are identified, assessed for frequency, severity and causation. Both top down and bottom up risk assessment methodologies are done through the deployed processes and practical standards.
RMU oversees a formal process to monitor and report enterprise-wide risk exposures. These are discussed with business units and management. On a quarterly basis, RMU, TFSC-ERFC and each BOD risk committees review risk reports for significant trends. Based on discussions with business units and senior management, RMU submits requests for approval for any policy exceptions or remedial action plans to the TFSC-Risk Management Group and BOD risk committees.
Risk Control and Mitigation As part of its market risk mitigation activities, the Company uses derivatives to manage exposures resulting from changes in foreign currencies and appropriate hedging activities to manage its interest rate exposures. Credit risks are reduced through the use of chattel mortgages and insurance protection. Concentration risks are managed by setting exposure limits. Concentration reports are provided to management on a monthly basis and to various related committees on a quarterly basis. Limits set undergo at least an annual review or as needed.
Operational risks are controlled and mitigated through the set-up of an appropriate organizational structure, supported by human resource allocation, staff training and education, combination of policies, procedures and standards, information technology and performance measurement.
The Company’s risk management policies are summarized below:
Credit Risk Credit risk is the possibility that the Company suffers losses when a counterparty to a credit transaction fails to meet its financial obligation.
The Credit Committee establishes and oversees the execution of the Company’s credit risk management program. The Committee sets out objectives related to overall quality and diversification of investments. It establishes policies for the selection of counterparties, outsources providers as well as accreditation of insurance companies.
Credit officers conduct credit risk review on the prospective borrower based on verified information. Team heads evaluate the prospective borrower based on the recommendation of the credit officers.

- 39 -
*SGVMC118066*
Loan amounts that exceed the approval limit of the loan division head are brought up to the Credit Committee. Loan amounts that exceed the limit of Credit Committee are elevated to the Executive Committee and recommended to the BOD for approval.
The Company will, from time to time and in the ordinary course of business, enter into loans with DOSRI. All DOSRI loans are subject to approval of the BOD. All such loans are on commercial arm’s-length basis. BSP Circular No. 560 states that “the total outstanding loans, other credit accommodations and guarantees to each of the company’s subsidiaries and affiliates shall not exceed 10.0% of the net worth.” As of March 31, 2012 and 2011, the Company has no loans with DOSRI.
The credit policy manual defines the evaluation process in order to provide an objective assessment of credit worthiness of counterparties. The credit policy manual undergoes a minimum of annual review.
The credit rating system, as defined in the credit policy, uses a combination of quantitative and qualitative factors to assess the general financial position of the borrower. Investment grade pertains to cash in banks, deposited or invested in BSP and other banks based on a mark-to-market value exposure to each counterparty. For receivables financed and finance lease receivables, investment grade pertains to receivables with no history of default in payment; non-investment grade pertains to receivables with history of defaults in payment.
The Company has neither credit rating system nor grading for other types of receivables.
Maximum exposure to credit risk The gross maximum exposure, net of allowance for credit and impairment losses, to the credit risk of the Company and the related fair value of collateral and other credit enhancements and its financial effect are shown below:
2012
Gross Maximum Exposure
Fair Value of Collateral
Maximum Exposure
to Credit Risk
Financial Effect of
Collateral or Credit
Enhancement Receivables from customers Receivables financed P=6,198,347,017 P=11,127,040,000 P=– P=6,198,347,017 Finance lease receivables 11,281,086,374 10,150,551,000 2,365,332,347 8,915,754,027 P=17,479,433,391 P=21,277,591,000 P=2,365,332,347 P=15,114,101,044
2012
Gross Maximum Exposure
Fair Value of Collateral
Maximum Exposure
to Credit Risk
Financial Effect of
Collateral or Credit
Enhancement Receivables from customers Receivables financed P=8,176,488,341 P=14,543,373,875 P=– P=8,176,488,341 Finance lease receivables 8,451,533,270 7,951,714,054 1,920,290,651 6,531,242,619 P=16,628,021,611 P=22,495,087,929 P=1,920,290,651 P=14,707,730,960
The carrying values of ‘Cash in Banks’, ‘Due from BSP’, ‘SPURA’, ‘AFS Investments’ and ‘Other Receivables’ represent the maximum exposure to credit risk as of March 31, 2012 and 2011. Concentration of risks of financial assets with credit risk exposure

- 40 -
*SGVMC118066*
Concentrations arise when a number of counterparties are engaged in similar business activities, or activities in the same geographic region, or have similar economic features that would cause their ability to meet contractual obligations to be similarly affected by changes in economic, political or other conditions. Concentrations indicate the relative sensitivity of the Company’s performance to developments affecting a particular industry or geographic location. In order to avoid excessive concentrations of risk, the Company’s policies and procedures include specific guidelines to focus on maintaining a diversified portfolio. Identified concentrations of credit risks are controlled and managed accordingly.
Concentration by industry An analysis of concentrations of credit risk at the reporting date based on carrying amount is shown below:
2012
Loans and
Receivables
Loans and Advances to
Banks* AFS
Investments** TOTAL Concentration by Industry Real estate, renting and business activities P=4,980,314,655 P=– P=– P=4,980,314,655 Wholesale and retail trade 3,429,464,633 – – 3,429,464,633 Manufacturing (various industries) 2,503,119,989 – – 2,503,119,989 Financial intermediaries 1,881,400,114 3,350,777,696 – 5,232,177,810 Transportation, storage and communication 1,727,841,504 – – 1,727,841,504 Other community, social and personal activities 788,891,404 – 930,000 789,821,404 Education 684,769,114 – – 684,769,114 Construction 405,654,762 – – 405,654,762 Hotels and restaurants 348,531,073 – – 348,531,073 Agricultural, hunting and forestry 383,647,125 – – 383,647,125 Electricity, gas and water 106,707,046 – – 106,707,046 Mining and quarrying 83,528,451 – – 83,528,451 Fishing 13,091,608 – – 13,091,608 Others 674,818,710 – – 674,818,710 18,011,780,188 3,350,777,696 930,000 21,363,487,884 Less allowance for credit and impairment losses 469,177,116 469,177,116 P=17,542,603,072 P=3,350,777,696 P=930,000 P=20,894,310,768
* Comprised of Cash in banks, Due from BSP, and SPURA ** Comprised of golf shares
2011
Loans and
Receivables
Loans and Advances to
Banks* AFS
Investments** TOTAL Concentration by Industry Real estate, renting and business activities P=4,977,676,609 P=– P=– P=4,977,676,609 Wholesale and retail trade 3,449,104,622 – – 3,449,104,622 Financial intermediaries 2,186,723,261 3,119,037,895 – 5,305,761,156 Manufacturing (various industries) 2,340,786,544 – – 2,340,786,544 Transportation, storage and communication 1,465,666,430 – – 1,465,666,430 Other community, social and personal activities 407,740,441 – 955,000 408,695,441 Education 591,640,249 – – 591,640,249 Hotels and restaurants 363,597,350 – – 363,597,350 Agricultural, hunting and forestry 312,030,841 – – 312,030,841 Construction 324,626,125 – – 324,626,125 Electricity, gas and water 167,703,859 – – 167,703,859 Mining and quarrying 85,458,162 – – 85,458,162 Fishing 8,792,947 – – 8,792,947 Others 286,200,215 – – 286,200,215 16,967,747,655 3,119,037,895 955,000 20,087,740,550 Less allowance for credit and impairment losses 326,004,627 – – 326,004,627 P=16,641,743,028 P=3,119,037,895 P=955,000 P=19,761,735,923
* Comprised of Cash in banks, Due from BSP, and SPURA ** Comprised of golf shares
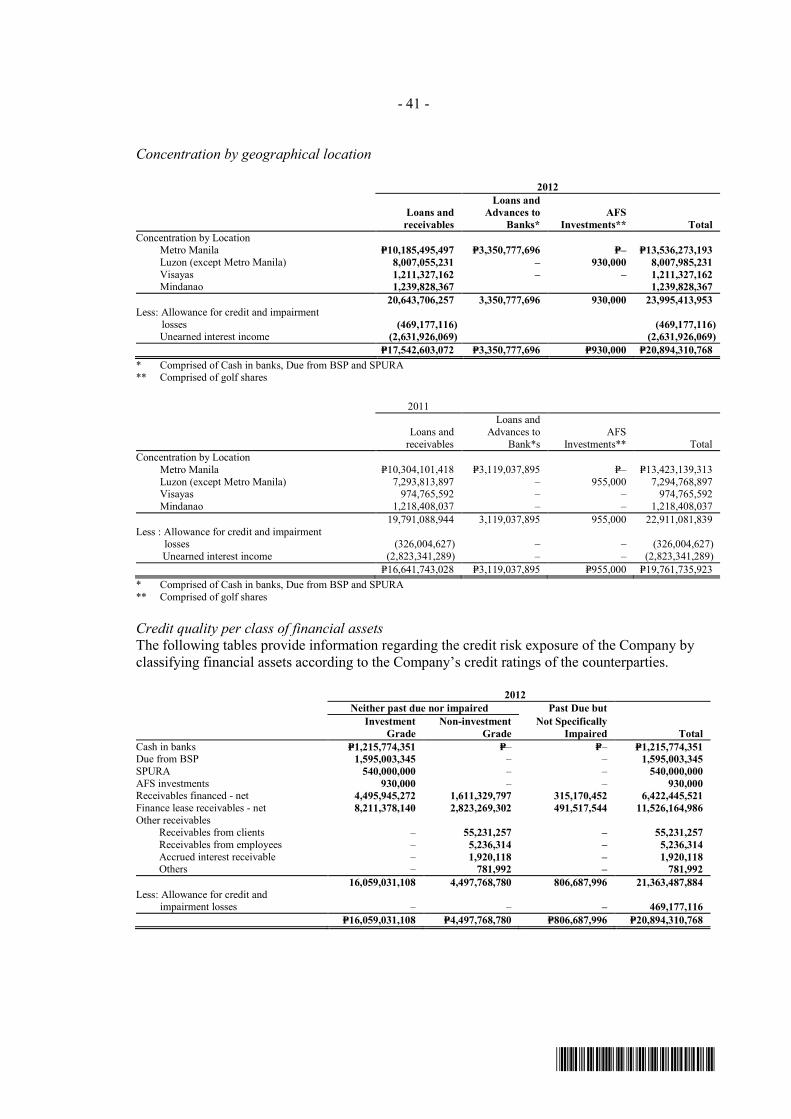
- 41 -
*SGVMC118066*
Concentration by geographical location
2012
Loans and
receivables
Loans and Advances to
Banks* AFS
Investments** Total Concentration by Location Metro Manila P=10,185,495,497 P=3,350,777,696 P=– P=13,536,273,193 Luzon (except Metro Manila) 8,007,055,231 – 930,000 8,007,985,231 Visayas 1,211,327,162 – – 1,211,327,162 Mindanao 1,239,828,367 1,239,828,367 20,643,706,257 3,350,777,696 930,000 23,995,413,953 Less: Allowance for credit and impairment losses (469,177,116) (469,177,116) Unearned interest income (2,631,926,069) (2,631,926,069) P=17,542,603,072 P=3,350,777,696 P=930,000 P=20,894,310,768
* Comprised of Cash in banks, Due from BSP and SPURA ** Comprised of golf shares
2011
Loans and
receivables
Loans and Advances to
Bank*s AFS
Investments** Total Concentration by Location Metro Manila P=10,304,101,418 P=3,119,037,895 P=– P=13,423,139,313 Luzon (except Metro Manila) 7,293,813,897 – 955,000 7,294,768,897 Visayas 974,765,592 – – 974,765,592 Mindanao 1,218,408,037 – – 1,218,408,037 19,791,088,944 3,119,037,895 955,000 22,911,081,839 Less : Allowance for credit and impairment losses (326,004,627) – – (326,004,627) Unearned interest income (2,823,341,289) – – (2,823,341,289) P=16,641,743,028 P=3,119,037,895 P=955,000 P=19,761,735,923
* Comprised of Cash in banks, Due from BSP and SPURA ** Comprised of golf shares Credit quality per class of financial assets The following tables provide information regarding the credit risk exposure of the Company by
classifying financial assets according to the Company’s credit ratings of the counterparties.
2012 Neither past due nor impaired Past Due but
Investment
Grade Non-investment
Grade Not Specifically
Impaired Total Cash in banks P=1,215,774,351 P=– P=– P=1,215,774,351 Due from BSP 1,595,003,345 – – 1,595,003,345 SPURA 540,000,000 – – 540,000,000 AFS investments 930,000 – – 930,000 Receivables financed - net 4,495,945,272 1,611,329,797 315,170,452 6,422,445,521 Finance lease receivables - net 8,211,378,140 2,823,269,302 491,517,544 11,526,164,986 Other receivables
Receivables from clients – 55,231,257 – 55,231,257 Receivables from employees – 5,236,314 – 5,236,314 Accrued interest receivable – 1,920,118 – 1,920,118 Others – 781,992 – 781,992
16,059,031,108 4,497,768,780 806,687,996 21,363,487,884 Less: Allowance for credit and impairment losses – – – 469,177,116
P=16,059,031,108 P=4,497,768,780 P=806,687,996 P=20,894,310,768
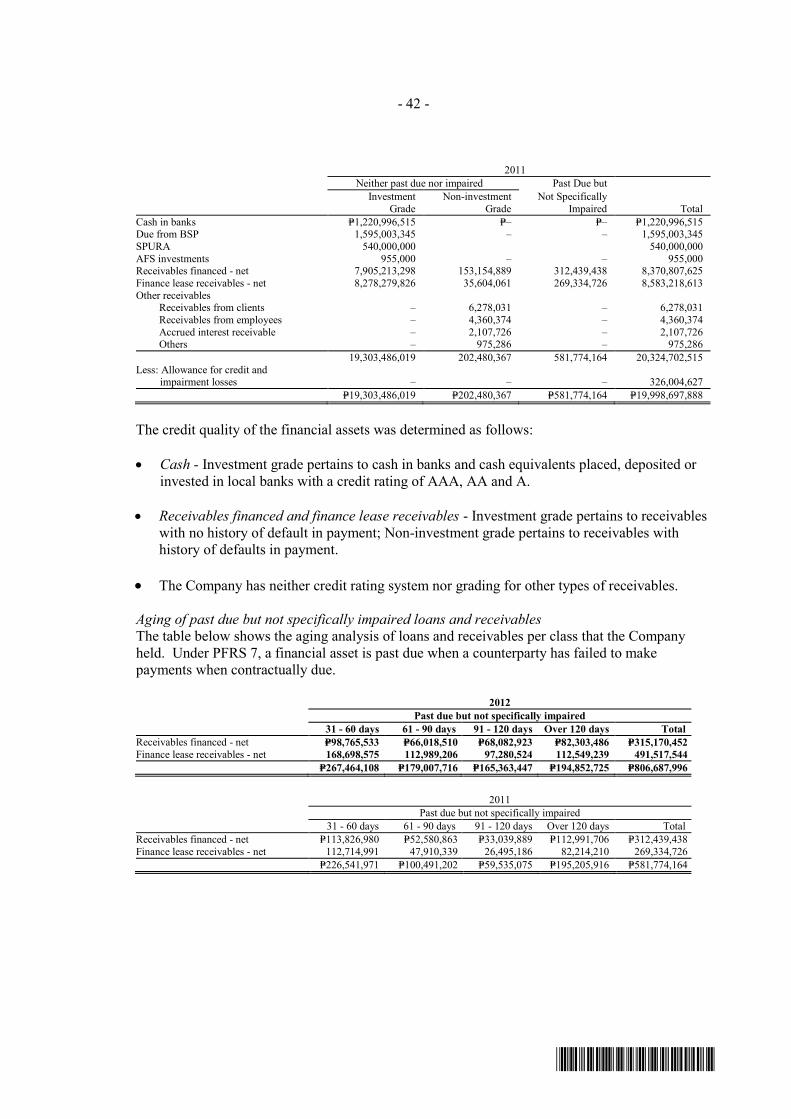
- 42 -
*SGVMC118066*
2011 Neither past due nor impaired Past Due but
Investment
Grade Non-investment
Grade Not Specifically
Impaired Total Cash in banks P=1,220,996,515 P=– P=– P=1,220,996,515 Due from BSP 1,595,003,345 – – 1,595,003,345 SPURA 540,000,000 540,000,000 AFS investments 955,000 – – 955,000 Receivables financed - net 7,905,213,298 153,154,889 312,439,438 8,370,807,625 Finance lease receivables - net 8,278,279,826 35,604,061 269,334,726 8,583,218,613 Other receivables
Receivables from clients – 6,278,031 – 6,278,031 Receivables from employees – 4,360,374 – 4,360,374 Accrued interest receivable – 2,107,726 – 2,107,726 Others – 975,286 – 975,286
19,303,486,019 202,480,367 581,774,164 20,324,702,515 Less: Allowance for credit and impairment losses – – – 326,004,627
P=19,303,486,019 P=202,480,367 P=581,774,164 P=19,998,697,888
The credit quality of the financial assets was determined as follows:
• Cash - Investment grade pertains to cash in banks and cash equivalents placed, deposited or
invested in local banks with a credit rating of AAA, AA and A.
• Receivables financed and finance lease receivables - Investment grade pertains to receivables with no history of default in payment; Non-investment grade pertains to receivables with history of defaults in payment.
• The Company has neither credit rating system nor grading for other types of receivables.
Aging of past due but not specifically impaired loans and receivables The table below shows the aging analysis of loans and receivables per class that the Company held. Under PFRS 7, a financial asset is past due when a counterparty has failed to make payments when contractually due.
2012 Past due but not specifically impaired 31 - 60 days 61 - 90 days 91 - 120 days Over 120 days Total Receivables financed - net P=98,765,533 P=66,018,510 P=68,082,923 P=82,303,486 P=315,170,452 Finance lease receivables - net 168,698,575 112,989,206 97,280,524 112,549,239 491,517,544 P=267,464,108 P=179,007,716 P=165,363,447 P=194,852,725 P=806,687,996
2011 Past due but not specifically impaired 31 - 60 days 61 - 90 days 91 - 120 days Over 120 days Total Receivables financed - net P=113,826,980 P=52,580,863 P=33,039,889 P=112,991,706 P=312,439,438 Finance lease receivables - net 112,714,991 47,910,339 26,495,186 82,214,210 269,334,726 P=226,541,971 P=100,491,202 P=59,535,075 P=195,205,916 P=581,774,164

- 43 -
*SGVMC118066*
Collateral and other credit enhancements
The Company holds collateral against loans and receivables in the form of chattel mortgages. Estimates of fair value are based on the value of collateral assessed at the time of borrowing and generally are not updated except when a loan is assessed to be impaired. The following table shows the fair value of collateral held against loans and receivables:
2012 2011 Against neither past due nor impaired P=20,401,934,000 P=21,791,950,219 Against past due but not specifically impaired 875,657,000 703,137,710 P=21,277,591,000 P=22,495,087,929
It is the Company’s policy to dispose assets acquired in an orderly fashion. The proceeds of the
sale of the foreclosed assets classified as assets held for sale are used to reduce or repay the outstanding claim.
Liquidity Risk Liquidity risk is the risk of encountering difficulty in raising funds to meet commitments associated with financial instruments.
Liquidity of the Company’s operations are managed with highest degree of accuracy, supported by sufficient, locally available, committed and uncommitted sources of funds for shorter periods and a sound and conservative funding plan with an appropriate internal authorization for longer periods. The funding structure is diversified as to financial instruments adopted, geographical markets approached and funding maturities in order to maintain stable access to low cost funds.
The Asset Liability Committee (ALCO) oversees the management of liquidity risks. The Company’s Treasury Department has the primary responsibility for managing the Company’s sources of funding, and is tasked with ensuring that the Company has adequate liquidity at all times. As part of this function, the Treasury Department prepares an annual funding plan that places the highest priority on liquidity and diversity of funding structure. The Department also prepares an annual contingency funding plan based on stress scenarios which include inability to access the debt market for an extended period. As such, monthly computation of Days until Alternative Funding key risk indicator and setting of appropriate limits provides management the means to adopt measures that will strengthen its liquidity position.
The Company’s principal source of funding are borrowings from international and domestic banks amounting to P=14.4 billion and P=15.5 billion as of March 31, 2012 and 2011, respectively, with maturities ranging from one month to five years, including bond issuances secured by stand-by letter of credit issued by an international bank. Borrowings are generally on a clean basis.
The Company maintains what it believes to be a sufficient cash level. In addition, the Company manages its liquidity by managing the maturity profile of its outstanding loans.
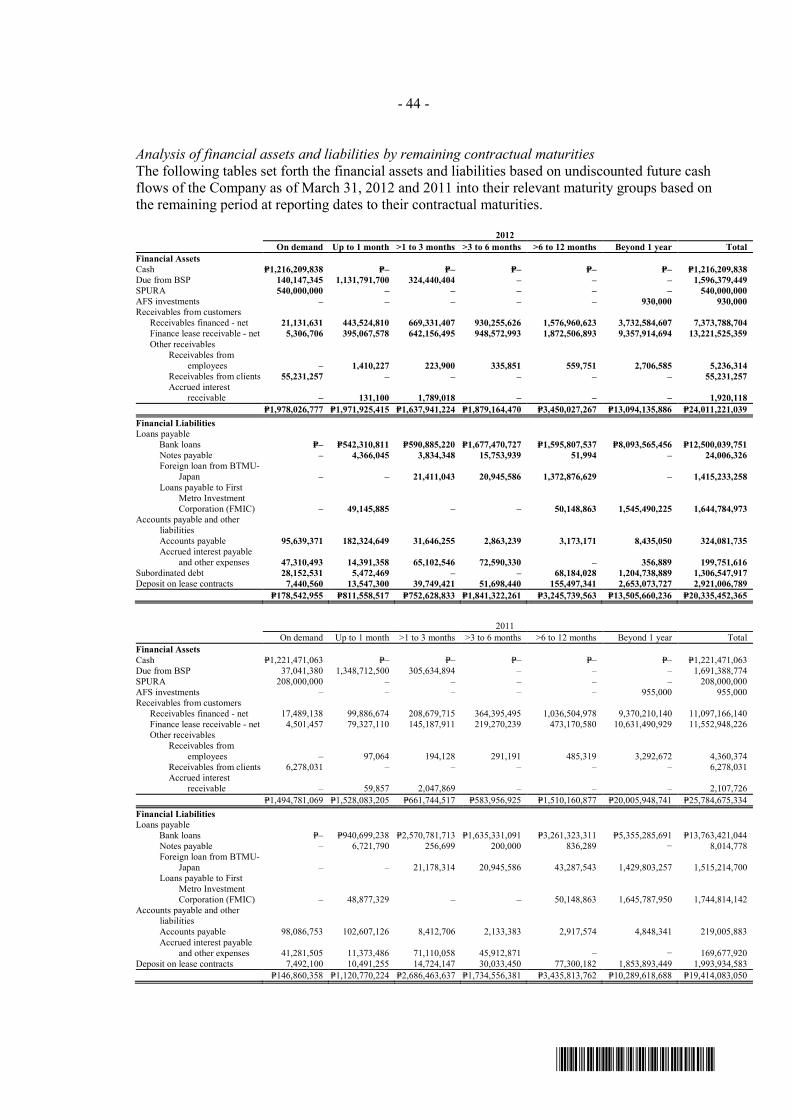
- 44 -
*SGVMC118066*
Analysis of financial assets and liabilities by remaining contractual maturities The following tables set forth the financial assets and liabilities based on undiscounted future cash flows of the Company as of March 31, 2012 and 2011 into their relevant maturity groups based on the remaining period at reporting dates to their contractual maturities.
2012
On demand Up to 1 month >1 to 3 months >3 to 6 months >6 to 12 months Beyond 1 year Total Financial Assets Cash P=1,216,209,838 P=– P=– P=– P=– P=– P=1,216,209,838 Due from BSP 140,147,345 1,131,791,700 324,440,404 – – – 1,596,379,449 SPURA 540,000,000 – – – – – 540,000,000 AFS investments – – – – – 930,000 930,000 Receivables from customers
Receivables financed - net 21,131,631 443,524,810 669,331,407 930,255,626 1,576,960,623 3,732,584,607 7,373,788,704 Finance lease receivable - net 5,306,706 395,067,578 642,156,495 948,572,993 1,872,506,893 9,357,914,694 13,221,525,359 Other receivables
Receivables from employees – 1,410,227 223,900 335,851 559,751 2,706,585 5,236,314
Receivables from clients 55,231,257 – – – – – 55,231,257 Accrued interest
receivable – 131,100 1,789,018 – – – 1,920,118 P=1,978,026,777 P=1,971,925,415 P=1,637,941,224 P=1,879,164,470 P=3,450,027,267 P=13,094,135,886 P=24,011,221,039 Financial Liabilities Loans payable
Bank loans P=– P=542,310,811 P=590,885,220 P=1,677,470,727 P=1,595,807,537 P=8,093,565,456 P=12,500,039,751 Notes payable – 4,366,045 3,834,348 15,753,939 51,994 – 24,006,326 Foreign loan from BTMU-
Japan – – 21,411,043 20,945,586 1,372,876,629 – 1,415,233,258 Loans payable to First
Metro Investment Corporation (FMIC) – 49,145,885 – – 50,148,863 1,545,490,225 1,644,784,973
Accounts payable and other liabilities
Accounts payable 95,639,371 182,324,649 31,646,255 2,863,239 3,173,171 8,435,050 324,081,735 Accrued interest payable
and other expenses 47,310,493 14,391,358 65,102,546 72,590,330 – 356,889 199,751,616 Subordinated debt 28,152,531 5,472,469 – – 68,184,028 1,204,738,889 1,306,547,917 Deposit on lease contracts 7,440,560 13,547,300 39,749,421 51,698,440 155,497,341 2,653,073,727 2,921,006,789 P=178,542,955 P=811,558,517 P=752,628,833 P=1,841,322,261 P=3,245,739,563 P=13,505,660,236 P=20,335,452,365
2011 On demand Up to 1 month >1 to 3 months >3 to 6 months >6 to 12 months Beyond 1 year Total Financial Assets Cash P=1,221,471,063 P=– P=– P=– P=– P=– P=1,221,471,063 Due from BSP 37,041,380 1,348,712,500 305,634,894 – – – 1,691,388,774 SPURA 208,000,000 – – – – – 208,000,000 AFS investments – – – – – 955,000 955,000 Receivables from customers
Receivables financed - net 17,489,138 99,886,674 208,679,715 364,395,495 1,036,504,978 9,370,210,140 11,097,166,140 Finance lease receivable - net 4,501,457 79,327,110 145,187,911 219,270,239 473,170,580 10,631,490,929 11,552,948,226 Other receivables
Receivables from employees – 97,064 194,128 291,191 485,319 3,292,672 4,360,374
Receivables from clients 6,278,031 – – – – – 6,278,031 Accrued interest
receivable – 59,857 2,047,869 – – – 2,107,726 P=1,494,781,069 P=1,528,083,205 P=661,744,517 P=583,956,925 P=1,510,160,877 P=20,005,948,741 P=25,784,675,334 Financial Liabilities Loans payable
Bank loans P=– P=940,699,238 P=2,570,781,713 P=1,635,331,091 P=3,261,323,311 P=5,355,285,691 P=13,763,421,044 Notes payable – 6,721,790 256,699 200,000 836,289 − 8,014,778 Foreign loan from BTMU-
Japan – – 21,178,314 20,945,586 43,287,543 1,429,803,257 1,515,214,700 Loans payable to First
Metro Investment Corporation (FMIC) – 48,877,329 – – 50,148,863 1,645,787,950 1,744,814,142
Accounts payable and other liabilities
Accounts payable 98,086,753 102,607,126 8,412,706 2,133,383 2,917,574 4,848,341 219,005,883 Accrued interest payable
and other expenses 41,281,505 11,373,486 71,110,058 45,912,871 – − 169,677,920 Deposit on lease contracts 7,492,100 10,491,255 14,724,147 30,033,450 77,300,182 1,853,893,449 1,993,934,583 P=146,860,358 P=1,120,770,224 P=2,686,463,637 P=1,734,556,381 P=3,435,813,762 P=10,289,618,688 P=19,414,083,050

- 45 -
*SGVMC118066*
The following table sets forth the undiscounted contractual future cash flows of the Company from the cross-currency interest rate swap including the foreign loan from BTMU-Japan, as of March 31, 2012 and 2011 based on the relevant maturity groups:
2012 On demand Up to 1 month >1 to 3 months >3 to 6 months >6 to 12 months Beyond 1 year Total Receive USD floating amount P=– P=– P=2,832,585 P=2,771,007 P=1,340,251,819 P=− P=1,345,855,411 Foreign loan from BTMU- Japan P=− P=− P=2,832,585 P=2,771,007 P=1,340,251,819 P=− P=1,345,855,411 Pay Php fixed amount – – 21,411,043 20,945,586 1,372,876,629 − 1,415,233,258 P=− P=− P=24,243,628 P=23,716,593 P=2,713,128,448 P=− P=2,761,088,669
2011 On demand Up to 1 month >1 to 3 months >3 to 6 months >6 to 12 months Beyond 1 year Total Receive USD floating amount P=– P=– P=2,415,763 P=2,253,867 P=7,254,231 P=1,362,378,239 P=1,374,302,100 Foreign loan from BTMU- Japan P=− P=− P=2,415,763 P=2,253,867 P=7,254,231 P=1,362,378,239 P=1,374,302,100 Pay Php fixed amount – – 21,178,314 20,945,586 43,287,543 1,429,803,257 1,515,214,700 P=− P=− P=23,594,077 P=23,199,453 P=50,541,774 P=2,792,181,496 P=2,889,516,800
Market Risk Market risk is exposure to changes in market rates that may adversely affect the Company value and ability to meet obligations as they mature. Market risks cover interest rate and foreign exchange risks.
Interest rate risk Interest rate risk arises from interest margin compression due to an adverse movement in the market interest rates. This risk applies only to accrual positions as the Company has no trading portfolio.
The ALCO establishes and oversees the Company’s interest rate risk as part of the market risk management program. In considering interest rate exposures, the Company measures its risk profile in terms of asset and debt/derivative notional size, asset yields and market rates, maturity profile, pre-payment and re-pricing characteristics. Interest rate risks exposures are evaluated using a variety of techniques and measures, each of which are based on projecting asset and liability cash flows under interest rate and market price scenarios.
Interest rate risk exposures are reported via portfolio hedge ratio. This tool highlights the level of gap in amounts in fixed rates of interest between assets and liabilities, as a measure of exposure to interest rate changes, the critical components of which are notional size, maturities and re-pricing profiles.
The Company also measures the potential impact of bps yield curve parallel shift on the expected earnings. This tool gives a measure of expected earnings at risk as a result of interest rate risk exposure.
The Company uses a variance-covariance methodology in the calculation of its Value at Risk (VaR). The methodology projects the decrease in portfolio value within a 30-day time horizon using a 95.0% confidence interval for fixed income exposures. Although VaR is an important tool for measuring market risk, the assumptions on which the model is based do give rise to some limitations including the following:
• a 95.0% confidence level does not reflect losses that may occur beyond this level. Even
without the model used there is a 5.0% probability that losses could exceed the VaR amount;

- 46 -
*SGVMC118066*
• the use of historical data as a basis for determining the possible range of future outcomes may
not always cover all possible scenarios, especially those of a severe and adverse market fluctuation.
The Company measures and monitors the VaR and profit and loss on a monthly basis and sets a maximum tolerance limit of 5.0% of equity.
The summary of the VaR position of the Company for fixed income exposures is as follows:
2012 2011 Fiscal year-end VaR P=37,145 P=41,600 Highest VaR 54,329 77,352 Average VaR 37,348 43,302 Lowest VaR 27,247 22,559
For the Company’s US$31.0 million loan subject to variable interest, the Company entered into a cross-currency interest rate swap, that effectively swap the USD-denominated floating rate loans into fixed peso rate loans (see Note 15).
Foreign currency risk Foreign currency risk is the risk that the value of a financial instrument will fluctuate as a result of changes in the value of foreign currencies which include volatility in exchange rates, correlations across currencies and changes in currency regime.
As a general rule, the Company is not allowed to have a forex position. All foreign borrowings must be fully hedged from inception until maturity. The Company’s foreign exchange risk results primarily from movements of the Philippine peso against the USD and the Japanese Yen (JPY) with respect to USD and JPY-denominated financial assets (such as cash and cash equivalents) and USD-denominated financial liabilities (such as loans payable and accounts payable and other liabilities).
As of March 31, 2012, the Company has outstanding USD-denominated loans amounting to US$31.0 million with BTMU-Japan. Also, as of that date, the Company has outstanding cross-currency interest rate swap on the USD-denominated loans and designated it as cash flow hedge (see Notes 12 and 15) to eliminate the variability in the cash flows due to interest rate and foreign currency risk.
The following table shows the details of the Company’s foreign currency-denominated monetary assets and liabilities:
2012 In USD In JPY Cash in bank $5,593 ¥1,568,934 Loans payable 31,000,000 −Accounts payable and other liabilities 1,771 −

- 47 -
*SGVMC118066*
2011 In USD In JPY Cash in bank $533 ¥1,568,934 Loans payable 31,000,000 − Accounts payable and other liabilities 13,633 −
The following table demonstrates the sensitivity to a reasonably possible change in the USD and JPY exchange rate, with all other variables held constant, on the Company’s income before tax, after taking into account the impact of the cross currency interest rate swap transaction (see Notes 10 and 12).
2012 Foreign currency appreciates (depreciates) USD JPY
5.0% P=8,201 P=40,926 (5.0%) (8,201) (40,926)
2011 Foreign currency appreciates (depreciates) USD JPY
5.0% (P=28,419) P=41,114 (5.0%) 28,419 (41,114)
26. Notes to Statements of Cash Flows
Noncash investing activities pertain to transfer of repossessed vehicles classified as assets held for sale to property and equipment amounting to P=11.2 million and P=12.9 million for the year ended March 31, 2012 and 2011, respectively.
28. Supplementary Information Required Under Revenue Regulations 19-2011 and 15-2010
Supplementary Information under RR No. 19-2011 On December 9, 2011, the Bureau of Internal Revenue issued RR No. 19-2011 which prescribes the new annual income tax forms that will be used for filing effective taxable year 2011. The Company reported the following gross receipts and expenses for the year ended March 31, 2012:
Gross Receipts Interest income P=1,681,753,792 Other income 93,929,070 P=1,775,682,862 Cost of Services Interest expense, fees & commission expenses 860,208,123 Compensation 16,312,674 Other direct expenses 6,356,603 P=882,877,400
(Forward)

- 48 -
*SGVMC118066*
Other Administrative Expenses Taxes and licenses P=105,433,757 Bad debts written off 91,992,750 Compensation and fringe benefits 49,485,297 Occupancy 43,333,295 Reversal of allowance on assets held for sale and that were sold during the year 33,210,787 Sales and marketing 30,985,799 Litigation 28,693,957 Depreciation and amortization 10,756,533 Management and professional fees 10,262,511 Representation and entertainment 9,035,499 Credit investigation 8,350,866 Transportation and travel 5,817,447 Miscellaneous 15,063,798 P=442,422,296
The details of Taxes and Licenses is as follows:
Amount Gross receipts tax P=89,823,490 Documentary stamps 10,649,892 Local taxes and licenses 3,497,906 Fringe benefit tax 1,176,075 Other taxes 286,394 P=105,433,757
Supplementary Information under RR No. 15-2010 The Company reported and/or paid the following types of taxes for the year ended March 31, 2012:
Gross Receipts Tax (GRT) The Company is subject to GRT on its gross income from Philippine sources. GRT is imposed on interest, commissions and discounts from lending activities at 5.00% or 1.00%, depending on the remaining maturities of instruments from which such receipts are derived, and at 7.00% on non-lending fees and commissions, trading and foreign exchange gains and other items constituting gross income.
Details of the Company’s income and GRT accounts in 2012 are as follows:
Gross Receipts Gross
Receipts Tax Income derived from lending activities P=1,846,943,743 P=92,215,514 Other income 15,669,047 1,096,833 P=1,862,612,790 P=93,312,347

- 49 -
*SGVMC118066*
Other Taxes and Licenses
For the year ended March 31, 2012, other taxes and licenses included in ‘Taxes and licenses’ account of the Company consist of:
Documentary stamps taxes P=10,649,892 Local taxes 3,497,906 Real property taxes − Others 1,474,913 P=15,622,711
Withholding Taxes
Total Remittances Balance Withholding taxes on compensation and benefits P=8,539,313 P=582,125 Expanded withholding taxes 20,987,831 2,045,329 Final withholding taxes 9,490,160 1,422,230 P=39,017,304 P=4,049,684