th annual citi virtual global property ceo conference
TRANSCRIPT
26th Annual CitiVirtual Global Property CEO Conference
March 8-11, 2021
Prologis Park Wroclaw III, Wroclaw, PolandPrologis Park Grande, Mexico City, Mexico
2
This presentation includes certain terms and non-GAAP financial measures that are not specifically defined herein. These terms and financial measures aredefined and, in the case of the non-GAAP financial measures, reconciled to the most directly comparable GAAP measure, in our fourth quarter Earnings Releaseand Supplemental Information that is available on our investor relations website at www.ir.prologis.com and on the SEC’s website at www.sec.gov.
The statements in this document that are not historical facts are forward-looking statements within the meaning of Section 27A of the Securities Act of 1933,as amended, and Section 21E of the Securities Exchange Act of 1934, as amended. These forward-looking statements are based on current expectations,estimates and projections about the industry and markets in which we operate as well as management's beliefs and assumptions. Such statements involveuncertainties that could significantly impact our financial results. Words such as "expects," "anticipates," "intends," "plans," "believes," "seeks," and"estimates," including variations of such words and similar expressions, are intended to identify such forward-looking statements, which generally are nothistorical in nature. All statements that address operating performance, events or developments that we expect or anticipate will occur in the future —including statements relating to rent and occupancy growth, development activity, contribution and disposition activity, general conditions in the geographicareas where we operate, our debt, capital structure and financial position, our ability to form new co-investment ventures and the availability of capital inexisting or new co-investment ventures — are forward-looking statements. These statements are not guarantees of future performance and involve certainrisks, uncertainties and assumptions that are difficult to predict. Although we believe the expectations reflected in any forward-looking statements are basedon reasonable assumptions, we can give no assurance that our expectations will be attained and, therefore, actual outcomes and results may differ materiallyfrom what is expressed or forecasted in such forward-looking statements. Some of the factors that may affect outcomes and results include, but are not limitedto: (i) national, international, regional and local economic and political climates; (ii) changes in global financial markets, interest rates and foreign currencyexchange rates; (iii) increased or unanticipated competition for our properties; (iv) risks associated with acquisitions, dispositions and development ofproperties; (v) maintenance of real estate investment trust status, tax structuring and changes in income tax laws and rates; (vi) availability of financing andcapital, the levels of debt that we maintain and our credit ratings; (vii) risks related to our investments in our co-investment ventures, including our ability toestablish new co-investment ventures; (viii) risks of doing business internationally, including currency risks; (ix) environmental uncertainties, including risks ofnatural disasters; (x) risk related to the current coronavirus pandemic, and (xi) those additional factors discussed in reports filed with the Securities andExchange Commission by us under the heading "Risk Factors." We undertake no duty to update any forward-looking statements appearing in this documentexcept as may be required by law.
This document shall not constitute an offer to sell or the solicitation of an offer to buy any securities, nor shall there be any sale of securities in any jurisdictionin which such offer, solicitation or sale would be unlawful prior to registration or qualification under the securities laws of any such jurisdiction. No offering ofsecurities shall be made except by means of a prospectus meeting the requirements of Section 10 of the U.S. Securities Act of 1933, as amended.
Forward-looking statements

3
Contents
01 Points of Focus 04
02 Why Logistics Real Estate 09
03 Why Prologis 18
04 Prologis ESG: Ahead of What’s Next 27
Prologis International Park of Commerce, Tracy, California

4
Points of Focus
01
Prologis I-17, Phoenix, ArizonaPrologis Park San Leandro, San Leandro, CaliforniaPrologis Park Torrance, Torrance, CaliforniaPrologis Park Dunstable, Dunstable, UK
5*This is a non-GAAP measure1. Prologis and its open-ended co-investment ventures
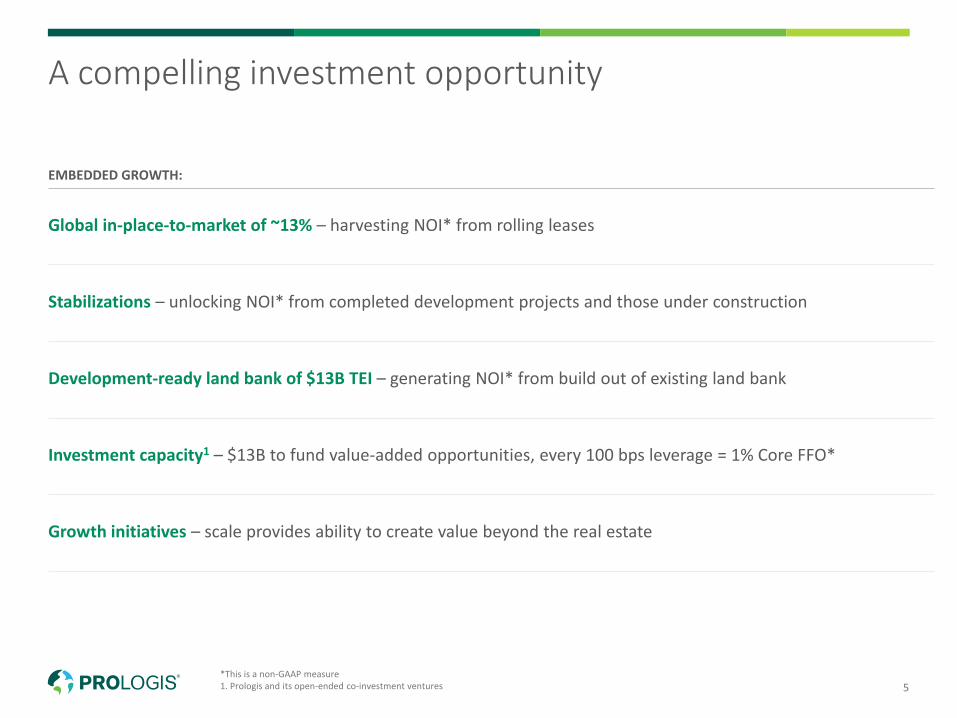
A compelling investment opportunity
EMBEDDED GROWTH:
Global in-place-to-market of ~13% – harvesting NOI* from rolling leases
Stabilizations – unlocking NOI* from completed development projects and those under construction
Development-ready land bank of $13B TEI – generating NOI* from build out of existing land bank
Investment capacity1 – $13B to fund value-added opportunities, every 100 bps leverage = 1% Core FFO*
Growth initiatives – scale provides ability to create value beyond the real estate
6
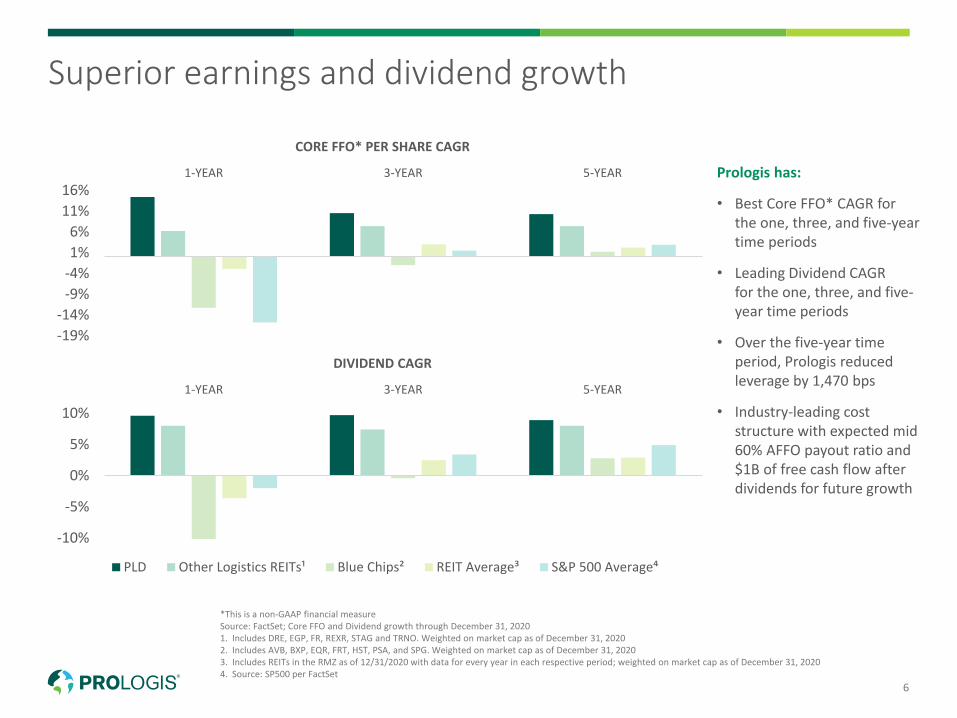
Prologis has:
• Best Core FFO* CAGR for the one, three, and five-year time periods
• Leading Dividend CAGR for the one, three, and five-year time periods
• Over the five-year time period, Prologis reduced leverage by 1,470 bps
• Industry-leading cost structure with expected mid 60% AFFO payout ratio and $1B of free cash flow after dividends for future growth
Superior earnings and dividend growth
*This is a non-GAAP financial measureSource: FactSet; Core FFO and Dividend growth through December 31, 20201. Includes DRE, EGP, FR, REXR, STAG and TRNO. Weighted on market cap as of December 31, 20202. Includes AVB, BXP, EQR, FRT, HST, PSA, and SPG. Weighted on market cap as of December 31, 20203. Includes REITs in the RMZ as of 12/31/2020 with data for every year in each respective period; weighted on market cap as of December 31, 20204. Source: SP500 per FactSet
-19%-14%
-9%-4%1%6%
11%16%
1-YEAR 3-YEAR 5-YEAR
CORE FFO* PER SHARE CAGR
-10%
-5%
0%
5%
10%1-YEAR 3-YEAR 5-YEAR
DIVIDEND CAGR
PLD Other Logistics REITs¹ Blue Chips² REIT Average³ S&P 500 Average⁴
7*Please see our Notes and Definitions in our Supplemental Report for further explanation.
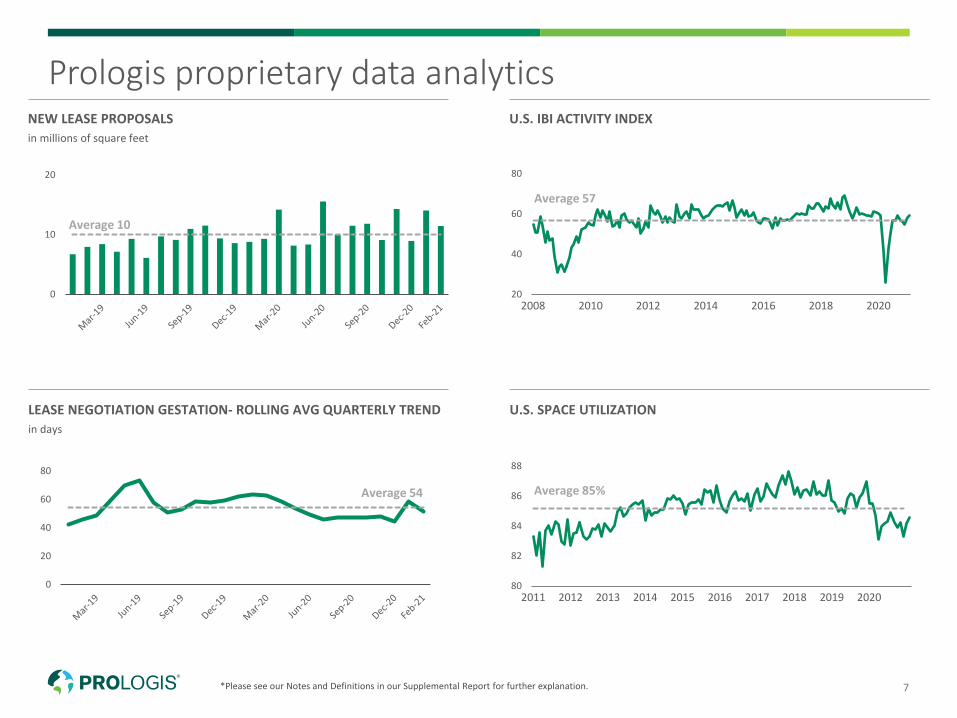
NEW LEASE PROPOSALSin millions of square feet
U.S. IBI ACTIVITY INDEX
LEASE NEGOTIATION GESTATION- ROLLING AVG QUARTERLY TRENDin days
U.S. SPACE UTILIZATION
0
10
20
Average 10
20
40
60
80
2008 2010 2012 2014 2016 2018 2020
Average 57
0
20
40
60
80
Average 54
80
82
84
86
88
2011 2012 2013 2014 2015 2016 2017 2018 2019 2020
Average 85%
Prologis proprietary data analytics
8
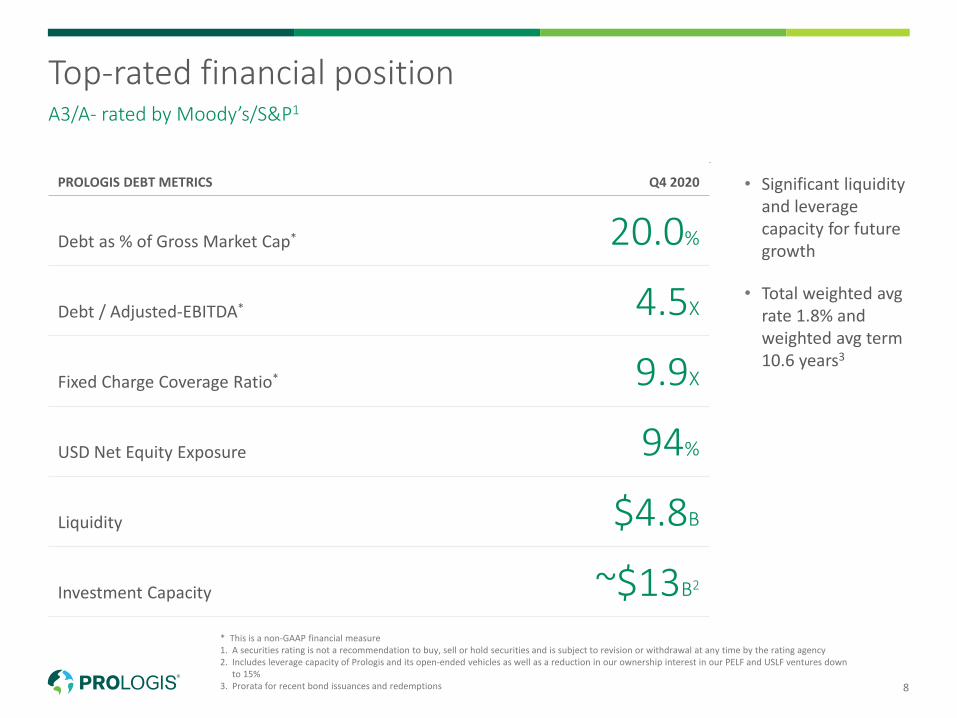
• Significant liquidity and leverage capacity for future growth
• Total weighted avg rate 1.8% and weighted avg term 10.6 years3
* This is a non-GAAP financial measure1. A securities rating is not a recommendation to buy, sell or hold securities and is subject to revision or withdrawal at any time by the rating agency2. Includes leverage capacity of Prologis and its open-ended vehicles as well as a reduction in our ownership interest in our PELF and USLF ventures down
to 15%3. Prorata for recent bond issuances and redemptions
Top-rated financial positionA3/A- rated by Moody’s/S&P1
PROLOGIS DEBT METRICS Q4 2020
Debt as % of Gross Market Cap* 20.0%
Debt / Adjusted-EBITDA* 4.5X
Fixed Charge Coverage Ratio* 9.9X
USD Net Equity Exposure 94%
Liquidity $4.8B
Investment Capacity ~$13B2

9
Why Logistics Real Estate
02
Tokyo, Japan
10Source: Prologis Research as of December 31, 2020Note: Graphics represent approximate share of logistics space occupied globally
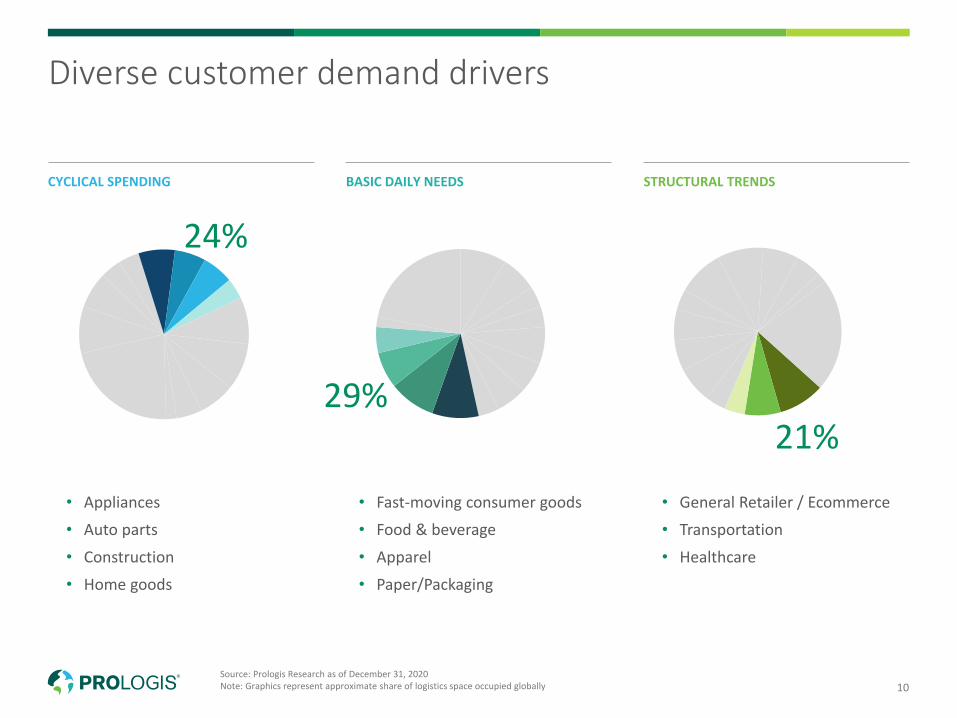
Diverse customer demand drivers
CYCLICAL SPENDING BASIC DAILY NEEDS STRUCTURAL TRENDS
• Appliances
• Auto parts
• Construction
• Home goods
• General Retailer / Ecommerce
• Transportation
• Healthcare
• Fast-moving consumer goods
• Food & beverage
• Apparel
• Paper/Packaging
24%
29%21%
11
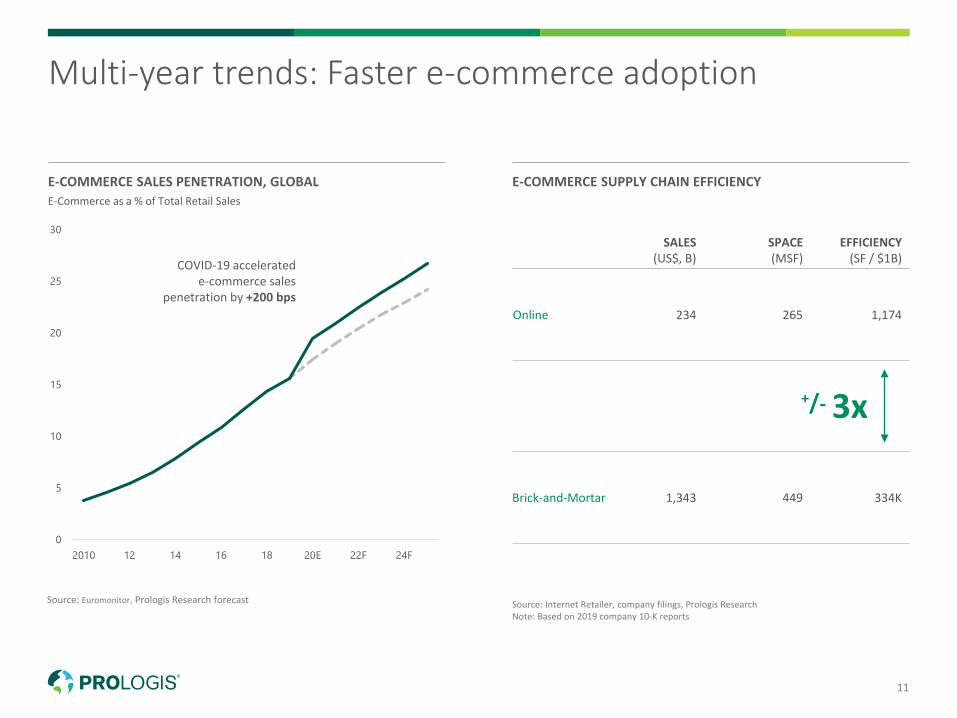
Multi-year trends: Faster e-commerce adoption
E-COMMERCE SUPPLY CHAIN EFFICIENCY
Source: Internet Retailer, company filings, Prologis ResearchNote: Based on 2019 company 10-K reports
SALES(US$, B)
SPACE(MSF)
EFFICIENCY(SF / $1B)
Online 234 265 1,174
Brick-and-Mortar 1,343 449 334K
3x+/-
Source: Euromonitor, Prologis Research forecast
0
5
10
15
20
25
30
2010 12 14 16 18 20E 22F 24F
COVID-19 accelerated e-commerce sales
penetration by +200 bps
E-Commerce as a % of Total Retail SalesE-COMMERCE SALES PENETRATION, GLOBAL
12
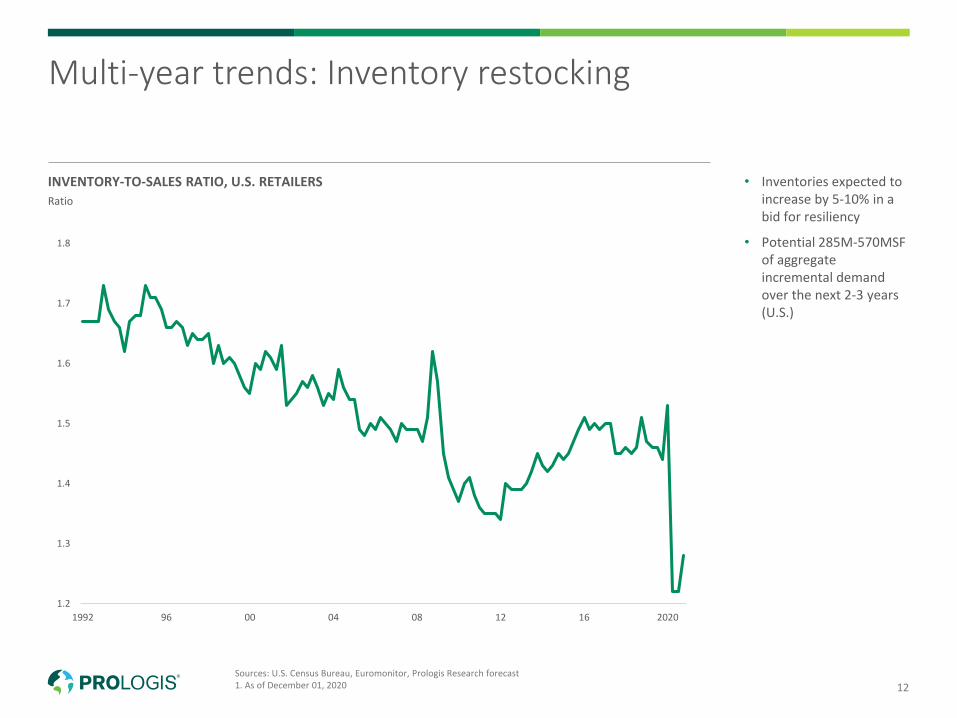
• Inventories expected to increase by 5-10% in a bid for resiliency
• Potential 285M-570MSF of aggregate incremental demand over the next 2-3 years (U.S.)
INVENTORY-TO-SALES RATIO, U.S. RETAILERS
Multi-year trends: Inventory restocking
Ratio
1.2
1.3
1.4
1.5
1.6
1.7
1.8
1992 96 00 04 08 12 16 2020
Sources: U.S. Census Bureau, Euromonitor, Prologis Research forecast1. As of December 01, 2020
13
85
0
10
20
30
40
50
60
70
80
90
1982 85 88 91 94 97 00 03 06 09 12 15 18
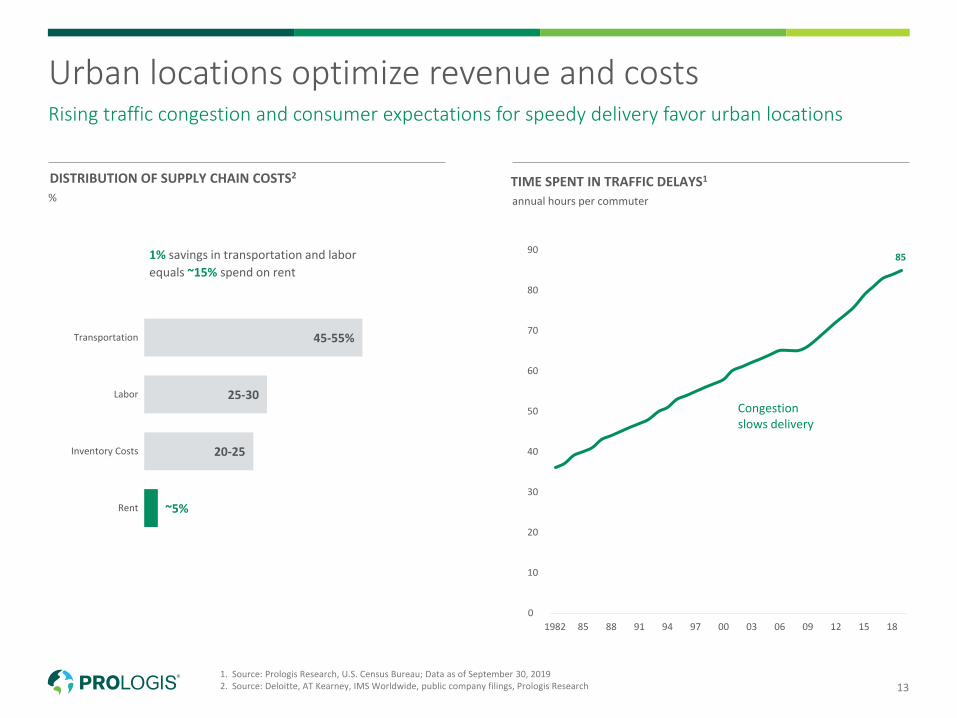
Congestion slows delivery
TIME SPENT IN TRAFFIC DELAYS1
%
1. Source: Prologis Research, U.S. Census Bureau; Data as of September 30, 20192. Source: Deloitte, AT Kearney, IMS Worldwide, public company filings, Prologis Research
Urban locations optimize revenue and costsRising traffic congestion and consumer expectations for speedy delivery favor urban locations
DISTRIBUTION OF SUPPLY CHAIN COSTS2
annual hours per commuter
1% savings in transportation and labor equals ~15% spend on rent
45-55%
25-30
20-25
~5%
Transportation
Labor
Inventory Costs
Rent
14
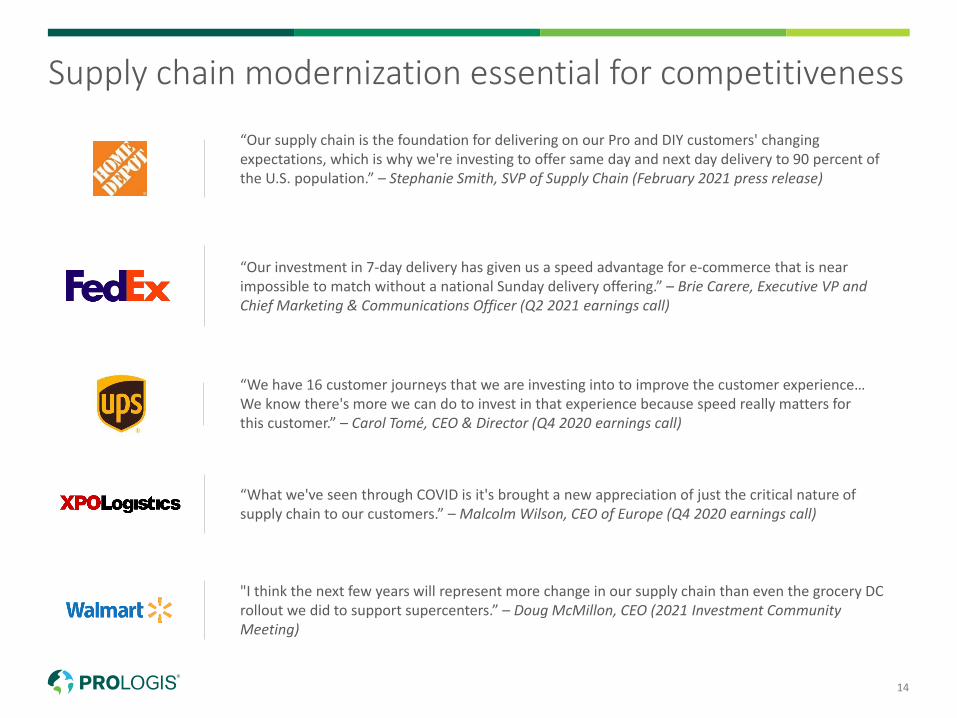
Supply chain modernization essential for competitiveness
“We have 16 customer journeys that we are investing into to improve the customer experience… We know there's more we can do to invest in that experience because speed really matters for this customer.” – Carol Tomé, CEO & Director (Q4 2020 earnings call)
“Our supply chain is the foundation for delivering on our Pro and DIY customers' changing expectations, which is why we're investing to offer same day and next day delivery to 90 percent of the U.S. population.” – Stephanie Smith, SVP of Supply Chain (February 2021 press release)
"I think the next few years will represent more change in our supply chain than even the grocery DC rollout we did to support supercenters.” – Doug McMillon, CEO (2021 Investment Community Meeting)
“What we've seen through COVID is it's brought a new appreciation of just the critical nature of supply chain to our customers.” – Malcolm Wilson, CEO of Europe (Q4 2020 earnings call)
“Our investment in 7-day delivery has given us a speed advantage for e-commerce that is near impossible to match without a national Sunday delivery offering.” – Brie Carere, Executive VP and Chief Marketing & Communications Officer (Q2 2021 earnings call)
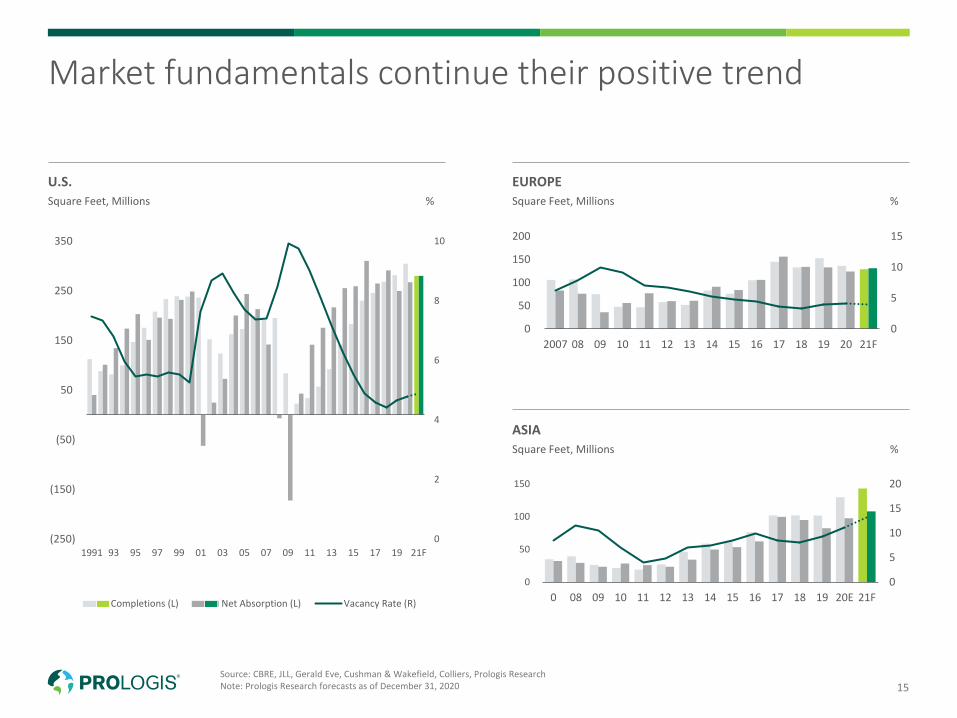
15Source: CBRE, JLL, Gerald Eve, Cushman & Wakefield, Colliers, Prologis Research Note: Prologis Research forecasts as of December 31, 2020
Market fundamentals continue their positive trend
U.S.Square Feet, Millions %
EUROPESquare Feet, Millions %
ASIASquare Feet, Millions %
0
5
10
15
0
50
100
150
200
2007 08 09 10 11 12 13 14 15 16 17 18 19 20 21F
0
5
10
15
20
0
50
100
150
0 08 09 10 11 12 13 14 15 16 17 18 19 20E 21F
0
2
4
6
8
10
(250)
(150)
(50)
50
150
250
350
1991 93 95 97 99 01 03 05 07 09 11 13 15 17 19 21F
Completions (L) Net Absorption (L) Vacancy Rate (R)
16
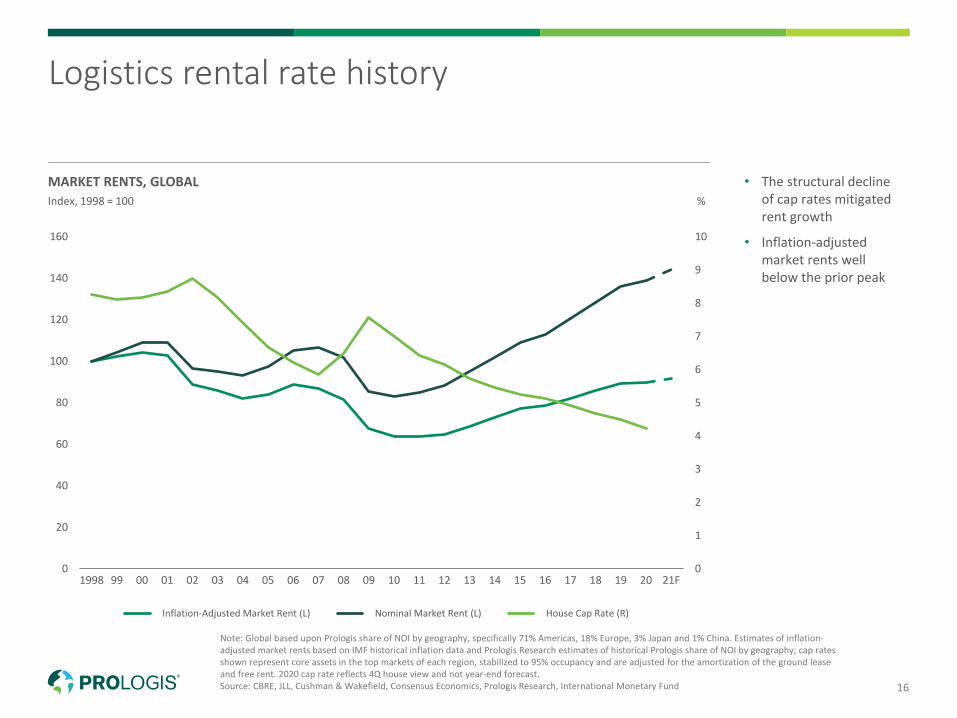
• The structural decline of cap rates mitigated rent growth
• Inflation-adjusted market rents well below the prior peak
Note: Global based upon Prologis share of NOI by geography, specifically 71% Americas, 18% Europe, 3% Japan and 1% China. Estimates of inflation-adjusted market rents based on IMF historical inflation data and Prologis Research estimates of historical Prologis share of NOI by geography; cap rates shown represent core assets in the top markets of each region, stabilized to 95% occupancy and are adjusted for the amortization of the ground lease and free rent. 2020 cap rate reflects 4Q house view and not year-end forecast.Source: CBRE, JLL, Cushman & Wakefield, Consensus Economics, Prologis Research, International Monetary Fund
MARKET RENTS, GLOBALIndex, 1998 = 100 %
Logistics rental rate history
0
1
2
3
4
5
6
7
8
9
10
0
20
40
60
80
100
120
140
160
1998 99 00 01 02 03 04 05 06 07 08 09 10 11 12 13 14 15 16 17 18 19 20 21F
Inflation-Adjusted Market Rent (L) Nominal Market Rent (L) House Cap Rate (R)
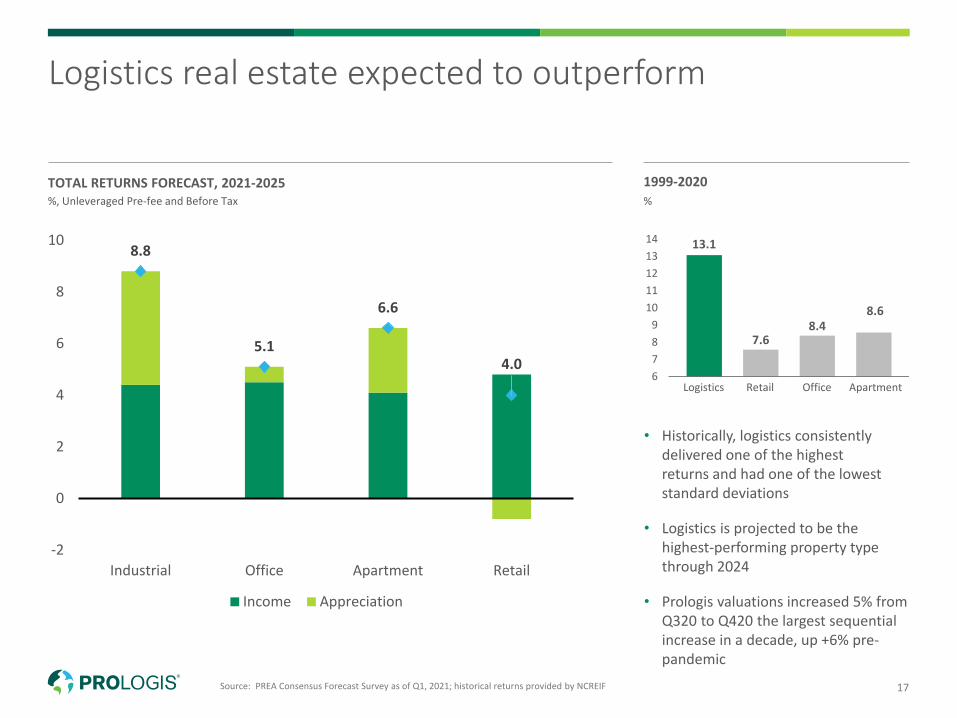
17Source: PREA Consensus Forecast Survey as of Q1, 2021; historical returns provided by NCREIF
TOTAL RETURNS FORECAST, 2021-2025%, Unleveraged Pre-fee and Before Tax
Logistics real estate expected to outperform
1999-2020%
• Historically, logistics consistently delivered one of the highest returns and had one of the lowest standard deviations
• Logistics is projected to be the highest-performing property type through 2024
• Prologis valuations increased 5% from Q320 to Q420 the largest sequential increase in a decade, up +6% pre-pandemic
13.1
7.68.4
8.6
6789
1011121314
Logistics Retail Office Apartment
8.8
5.1
6.6
4.0
-2
0
2
4
6
8
10
Industrial Office Apartment Retail
Income Appreciation

18
Why Prologis
03
Prologis Park South San Francisco, South San Francisco, California
19
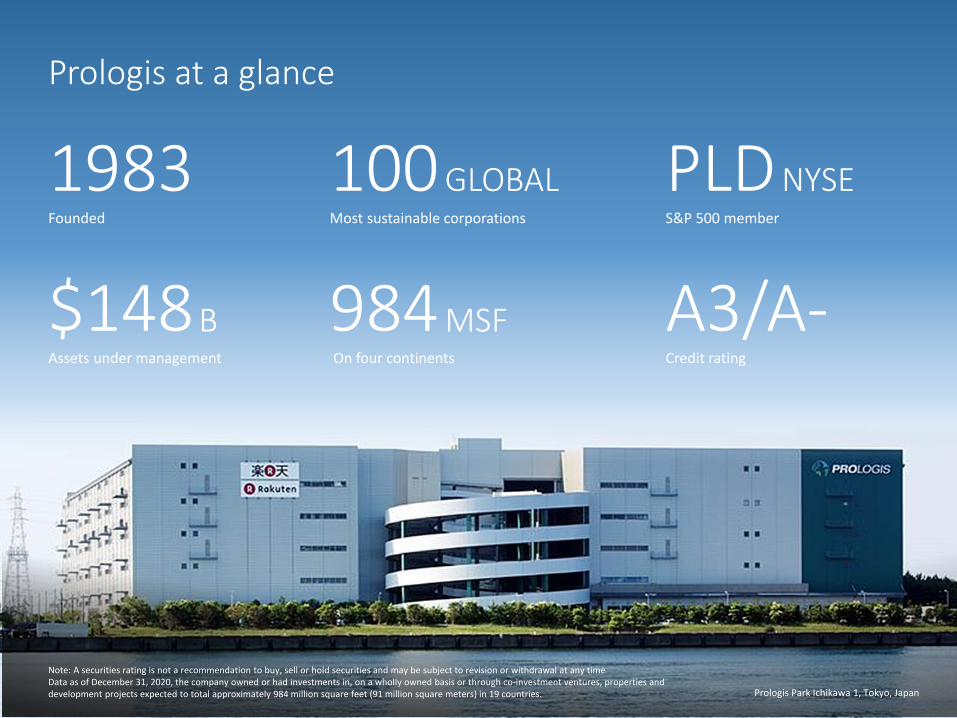
Prologis at a glance
1983 100GLOBAL
$148B 984MSF
PLDNYSE
A3/A-Founded Most sustainable corporations
Assets under management On four continents
S&P 500 member
Credit rating
Prologis Park Ichikawa 1, Tokyo, Japan
Note: A securities rating is not a recommendation to buy, sell or hold securities and may be subject to revision or withdrawal at any timeData as of December 31, 2020, the company owned or had investments in, on a wholly owned basis or through co-investment ventures, properties and development projects expected to total approximately 984 million square feet (91 million square meters) in 19 countries.
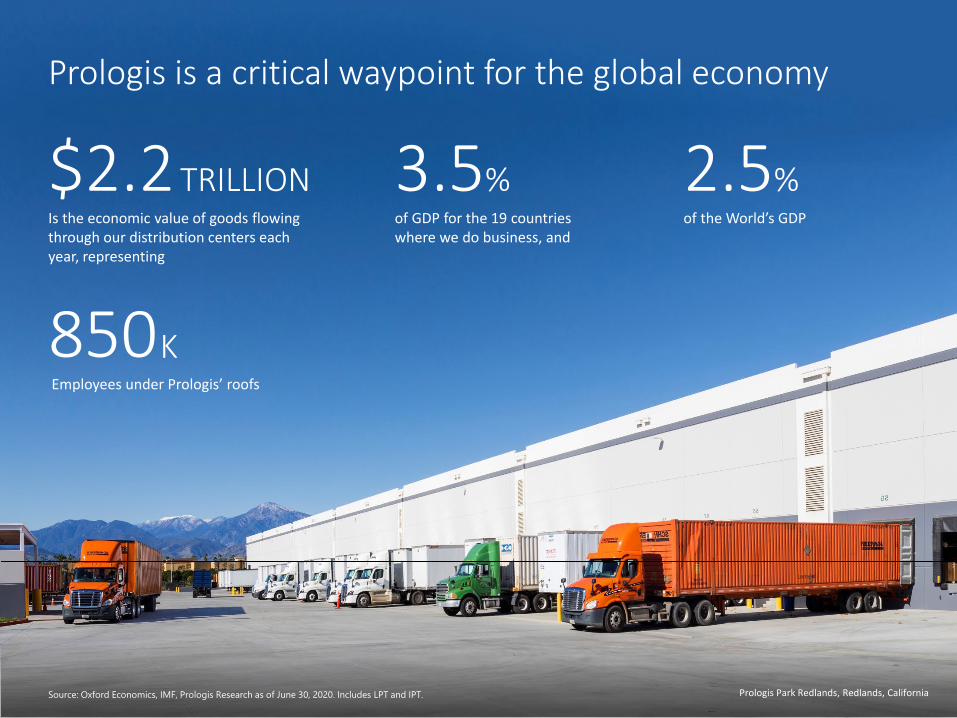
20Prologis Park Redlands, Redlands, CaliforniaSource: Oxford Economics, IMF, Prologis Research as of June 30, 2020. Includes LPT and IPT.
Prologis is a critical waypoint for the global economy
$2.2 3.5%TRILLION
850K
2.5%Is the economic value of goods flowing through our distribution centers each year, representing
of GDP for the 19 countries where we do business, and
Employees under Prologis’ roofs
of the World’s GDP
21
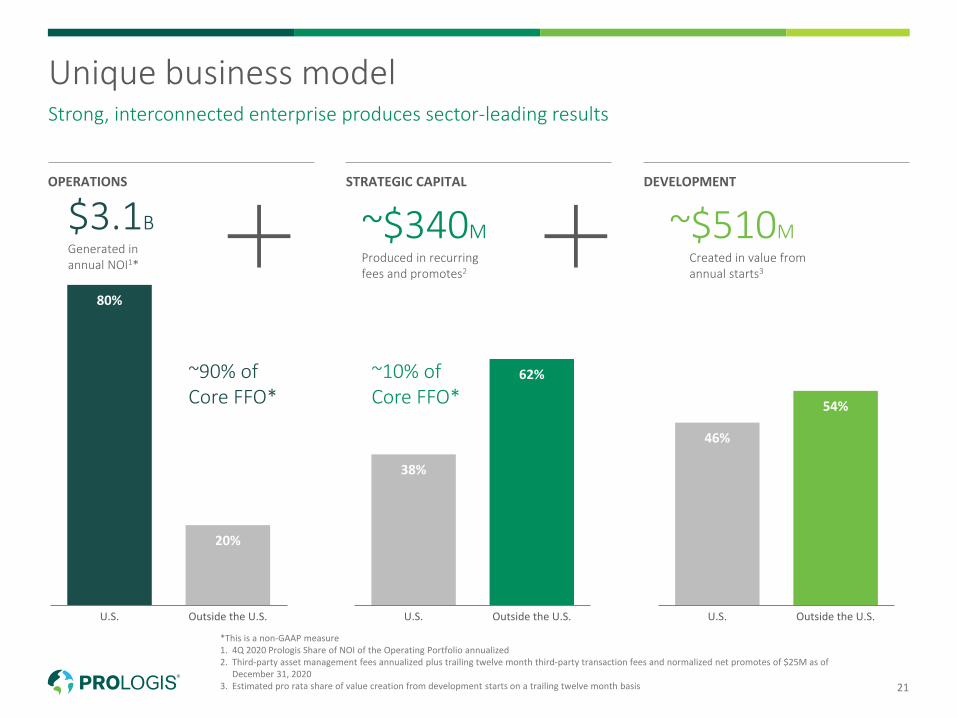
*This is a non-GAAP measure1. 4Q 2020 Prologis Share of NOI of the Operating Portfolio annualized2. Third-party asset management fees annualized plus trailing twelve month third-party transaction fees and normalized net promotes of $25M as of
December 31, 20203. Estimated pro rata share of value creation from development starts on a trailing twelve month basis
Unique business modelStrong, interconnected enterprise produces sector-leading results
OPERATIONS STRATEGIC CAPITAL DEVELOPMENT
80%
20%
U.S. Outside the U.S.
38%
62%
U.S. Outside the U.S.
46%
54%
U.S. Outside the U.S.
~90% of Core FFO*
~10% of Core FFO*
$3.1BGenerated in annual NOI1*
~$340MProduced in recurring fees and promotes2
~$510MCreated in value from annual starts3
22
$130M $130M$150M
$220M
$290M $285M
$365M
$477M
2013 14 15 16 17 18 19 2020
$18B $19B
$23B$25B
$32B$35B
$45B
$53B
2013 14 15 16 17 18 19 2020
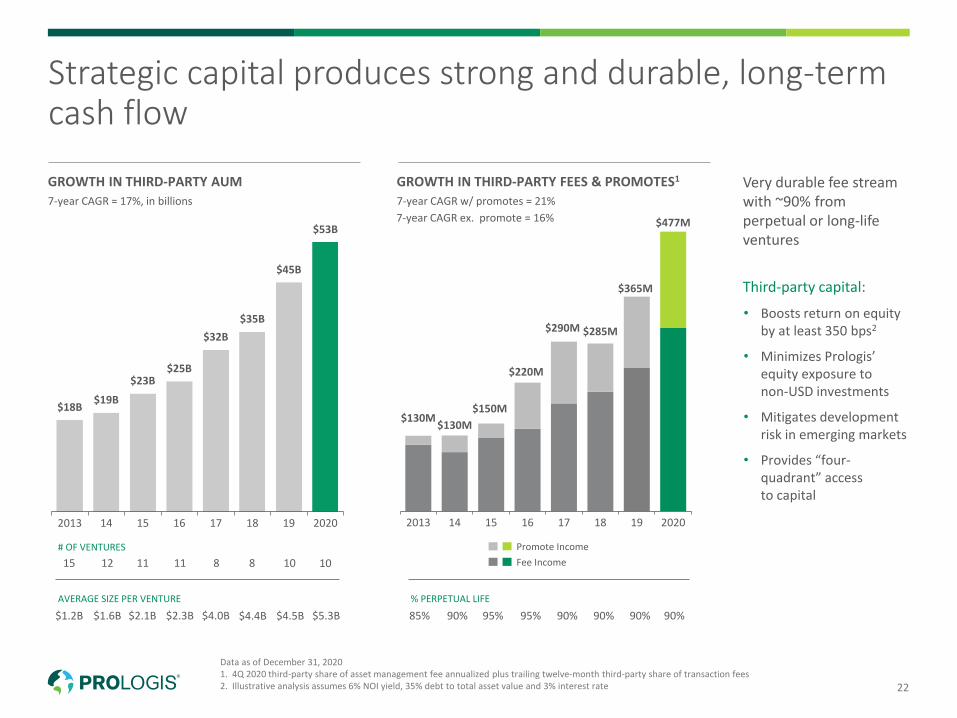
Data as of December 31, 20201. 4Q 2020 third-party share of asset management fee annualized plus trailing twelve-month third-party share of transaction fees 2. Illustrative analysis assumes 6% NOI yield, 35% debt to total asset value and 3% interest rate
Very durable fee stream with ~90% from perpetual or long-life ventures
Third-party capital:
• Boosts return on equity by at least 350 bps2
• Minimizes Prologis’ equity exposure to non-USD investments
• Mitigates development risk in emerging markets
• Provides “four-quadrant” access to capital
Strategic capital produces strong and durable, long-term cash flow
GROWTH IN THIRD-PARTY AUM7-year CAGR = 17%, in billions
GROWTH IN THIRD-PARTY FEES & PROMOTES1
7-year CAGR w/ promotes = 21%
# OF VENTURES15 12 11 11 8 8 10
AVERAGE SIZE PER VENTURE
$1.2B $1.6B $2.1B $2.3B $4.0B $4.4B $4.5B% PERPETUAL LIFE
85% 90% 95% 95% 90% 90% 90%
Fee IncomePromote Income
10
$5.3B 90%
7-year CAGR ex. promote = 16%
23
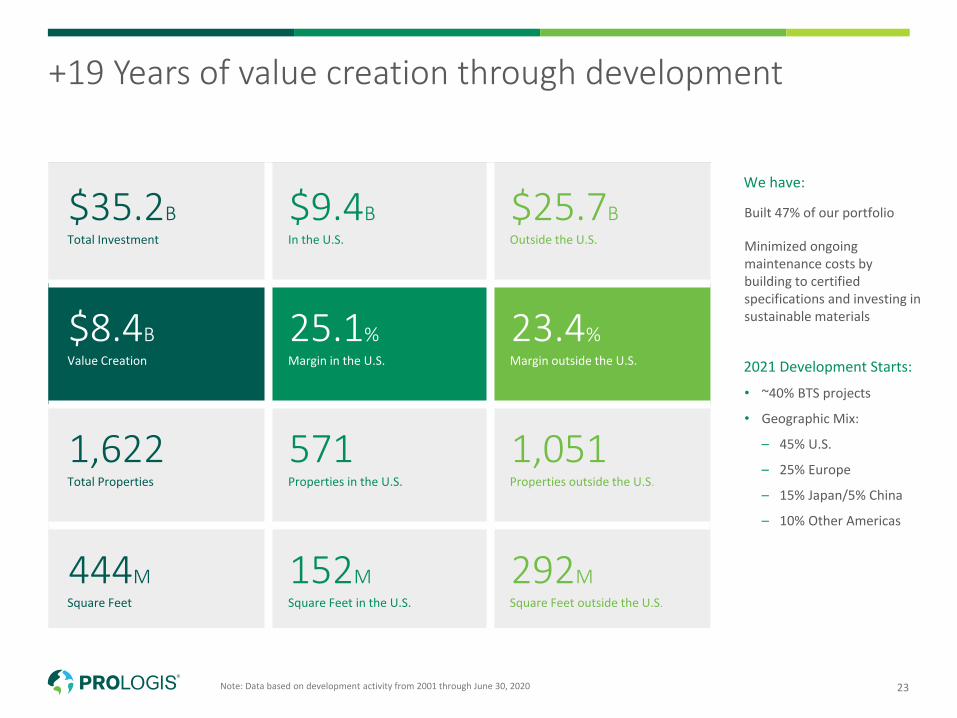
We have:
Built 47% of our portfolio
Minimized ongoing maintenance costs by building to certified specifications and investing in sustainable materials
2021 Development Starts:
• ~40% BTS projects
• Geographic Mix:
– 45% U.S.
– 25% Europe
– 15% Japan/5% China
– 10% Other Americas
Note: Data based on development activity from 2001 through June 30, 2020
+19 Years of value creation through development
$35.2BTotal Investment
$9.4BIn the U.S.
$25.7BOutside the U.S.
$8.4BValue Creation
25.1%Margin in the U.S.
23.4%Margin outside the U.S.
1,622Total Properties
571Properties in the U.S.
1,051Properties outside the U.S.
444MSquare Feet
152MSquare Feet in the U.S.
292MSquare Feet outside the U.S.

24
Real Estate
Labor Solutions
Transportation Solutions
Digital & Data Solutions
Revenue opportunity
$150M
Value Beyond the Real EstateCurrent and future opportunities
25
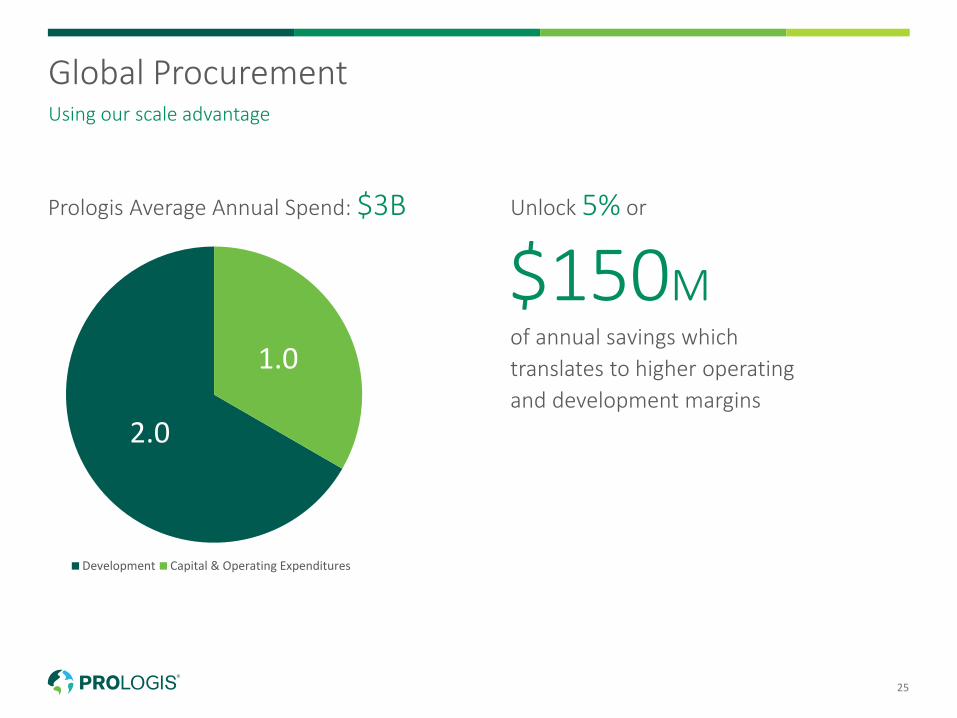
Global ProcurementUsing our scale advantage
Unlock 5% or
of annual savings which translates to higher operating and development margins
2.0
1.0
Development Capital & Operating Expenditures
Prologis Average Annual Spend: $3B
$150M
26
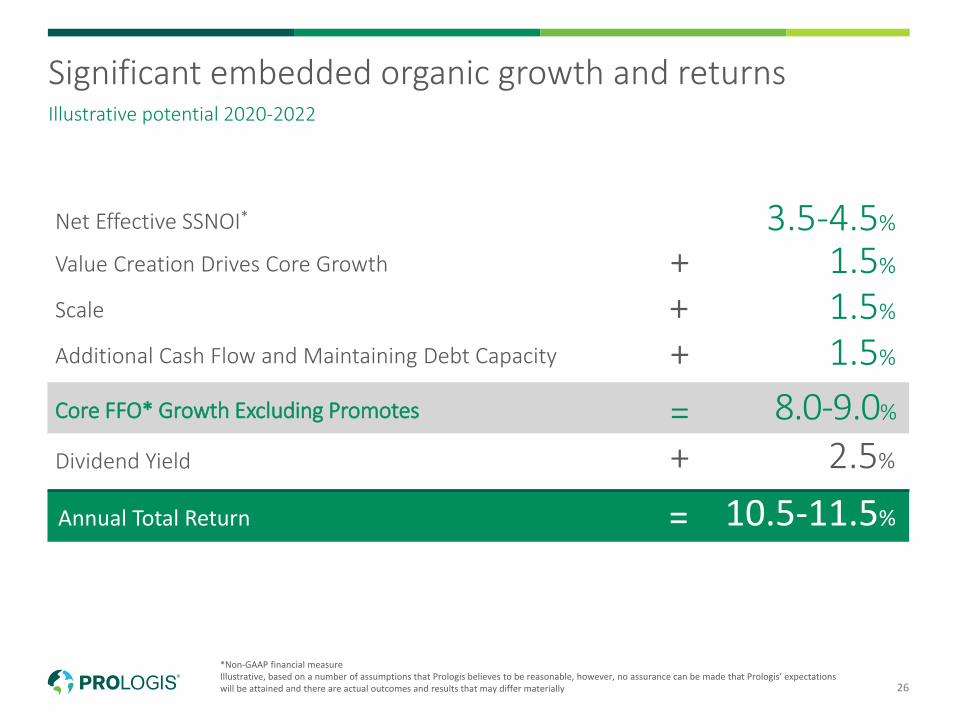
Significant embedded organic growth and returnsIllustrative potential 2020-2022
Annual Total Return 10.5-11.5%=
Net Effective SSNOI* 3.5-4.5%
Value Creation Drives Core Growth + 1.5%
Additional Cash Flow and Maintaining Debt Capacity + 1.5%
Scale + 1.5%
Core FFO* Growth Excluding Promotes 8.0-9.0%=2.5%+Dividend Yield
*Non-GAAP financial measureIllustrative, based on a number of assumptions that Prologis believes to be reasonable, however, no assurance can be made that Prologis’ expectations will be attained and there are actual outcomes and results that may differ materially

27
Prologis ESG: Ahead of What’s Next
Prologis RFI DIRFT DC, Rugby, UK
04
28
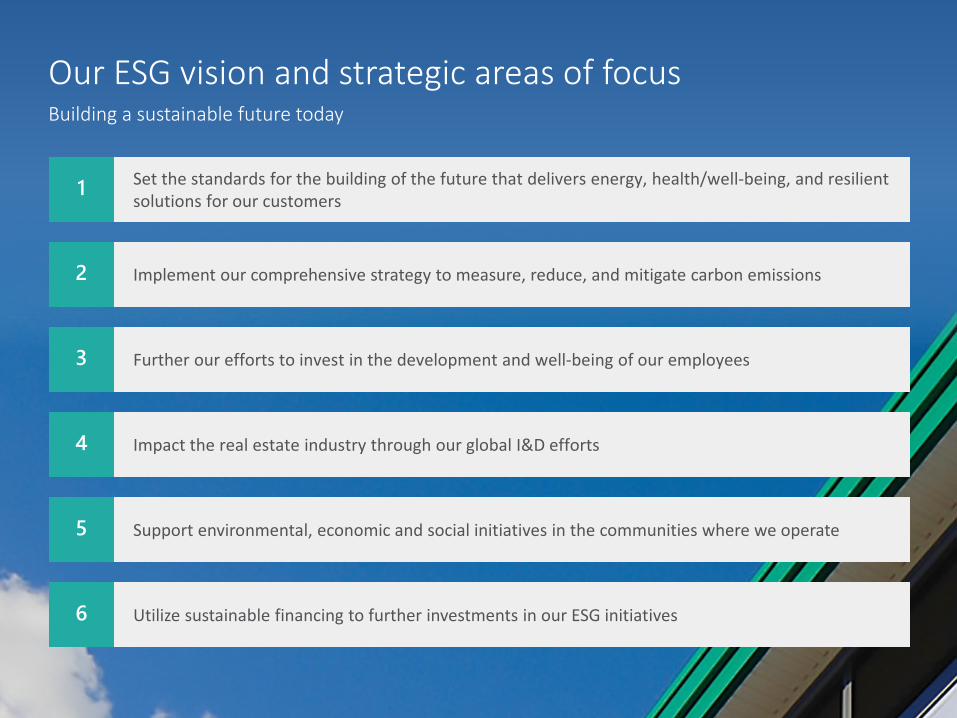
Our ESG vision and strategic areas of focusBuilding a sustainable future today
1 Set the standards for the building of the future that delivers energy, health/well-being, and resilient solutions for our customers
3 Further our efforts to invest in the development and well-being of our employees
4 Impact the real estate industry through our global I&D efforts
5 Support environmental, economic and social initiatives in the communities where we operate
2 Implement our comprehensive strategy to measure, reduce, and mitigate carbon emissions
6 Utilize sustainable financing to further investments in our ESG initiatives
29
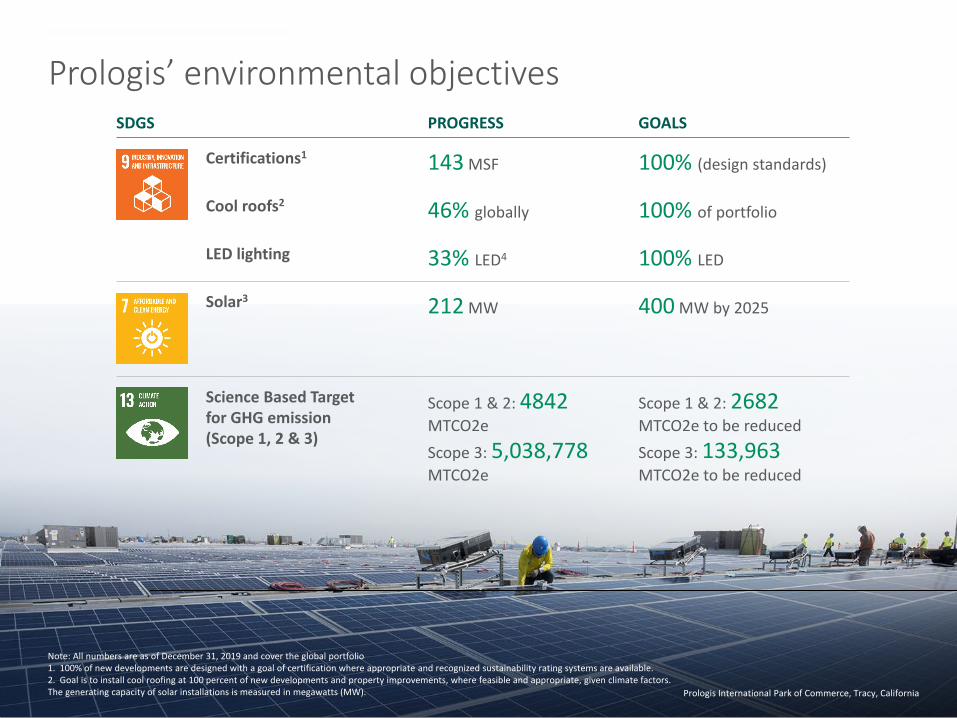
Prologis’ environmental objectives
Prologis International Park of Commerce, Tracy, California
Note: All numbers are as of December 31, 2019 and cover the global portfolio1. 100% of new developments are designed with a goal of certification where appropriate and recognized sustainability rating systems are available.2. Goal is to install cool roofing at 100 percent of new developments and property improvements, where feasible and appropriate, given climate factors.The generating capacity of solar installations is measured in megawatts (MW).
SDGS PROGRESS GOALS
Certifications1 143 MSF 100% (design standards)
Cool roofs2 46% globally 100% of portfolio
LED lighting 33% LED4 100% LED
Solar3 212 MW 400 MW by 2025
Science Based Target for GHG emission (Scope 1, 2 & 3)
Scope 1 & 2: 4842MTCO2eScope 3: 5,038,778MTCO2e
Scope 1 & 2: 2682 MTCO2e to be reducedScope 3: 133,963MTCO2e to be reduced
30
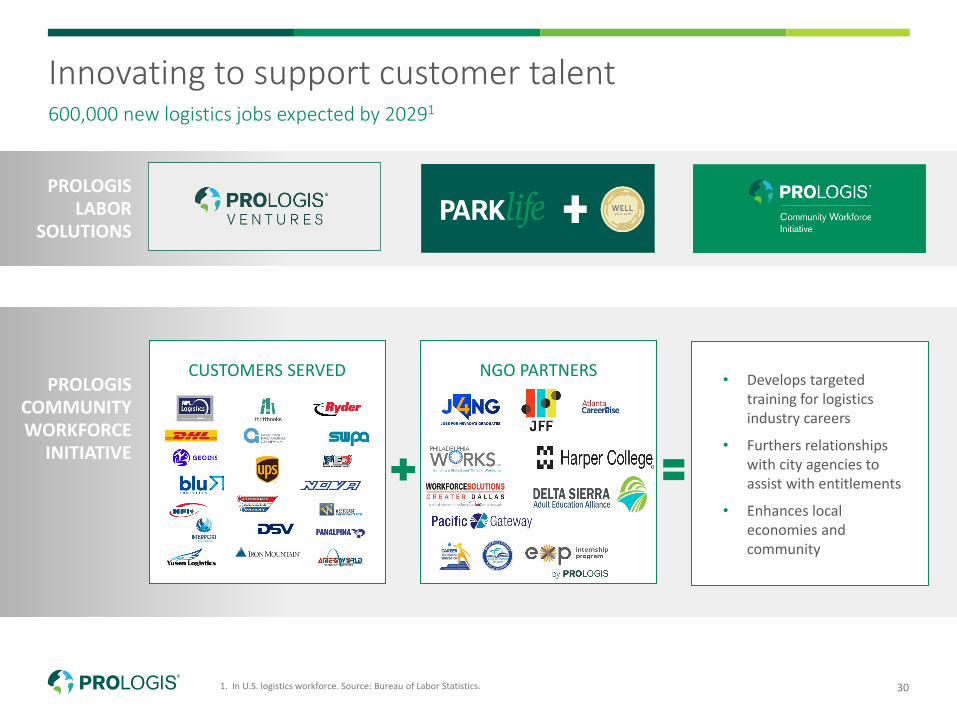
Innovating to support customer talent
1. In U.S. logistics workforce. Source: Bureau of Labor Statistics.
600,000 new logistics jobs expected by 20291
• Develops targeted training for logistics industry careers
• Furthers relationships with city agencies to assist with entitlements
• Enhances local economies and community
NGO PARTNERSCUSTOMERS SERVED
PROLOGISLABOR
SOLUTIONS
PROLOGISCOMMUNITY WORKFORCE
INITIATIVE
31
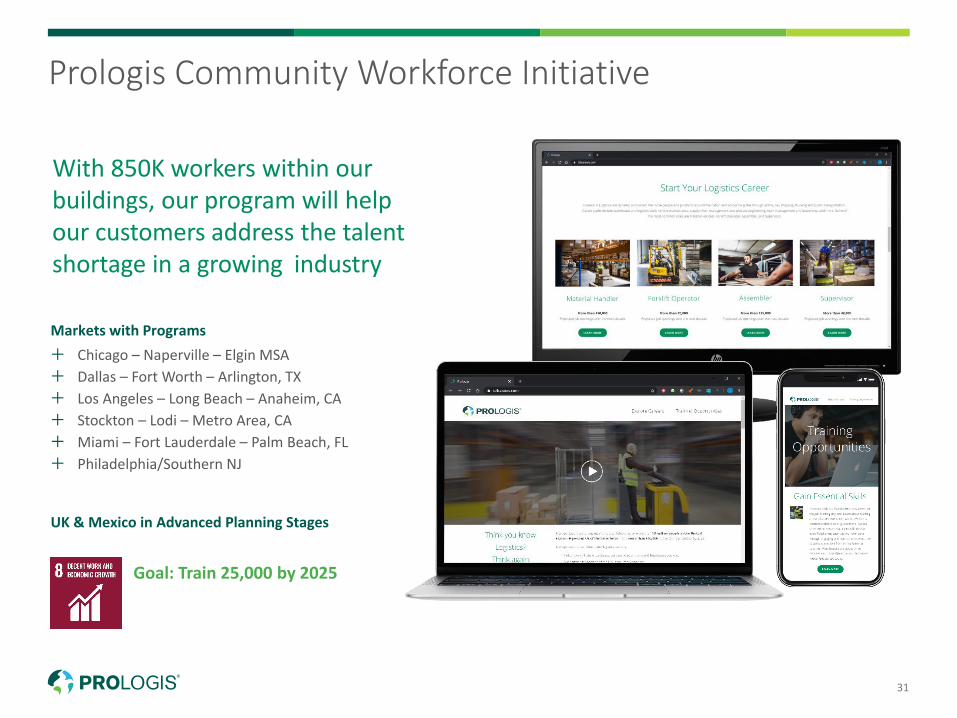
Prologis Community Workforce Initiative
With 850K workers within our buildings, our program will help our customers address the talent shortage in a growing industry
Markets with Programs Chicago – Naperville – Elgin MSA Dallas – Fort Worth – Arlington, TX Los Angeles – Long Beach – Anaheim, CA Stockton – Lodi – Metro Area, CA Miami – Fort Lauderdale – Palm Beach, FL Philadelphia/Southern NJ
UK & Mexico in Advanced Planning Stages
Goal: Train 25,000 by 2025

32
CDP “A” score For Prologis and its public funds ranks among the top 3% of global respondents
Leading by exampleRecognized for performance and transparency
Aligned with global reporting frameworks
Corporate Knights Global 100 Most Sustainable Corporations#15 in U.S.
GRESB – 2020 Regional Sector Leader in Asia and AmericasNPR and FIBRA recognized as regional leader for industrial; also received 10 out of 10 Green Stars for all funds
2020 World Index of Dow Jones Sustainability Index (DJSI) Recognizes Prologis and NPR in top 10% globally, FIBRA also recognized for ESG efforts and successes
Institutional Investor#1 Financially Material ESG Disclosures; #1 Communication of Strategy and Risk Management Amid COVID-19; #1 CEO, CFO and Investor Relations
Top Real Estate Company by SEIA’s 2019 Solar Means Business ReportRanked #3 for onsite installed solar capacity
MSCIAA Rating, among top 27% of Real Estate Management & Services constituents within MSCI ACWI Index