th chapt 8 final
TRANSCRIPT
8-1
CHAPTER 8
SHAKING TABLE STUDY OF SINGLE-STORY DRY-STACK MASONRY
HOUSE
8.1 Introduction
Hydraform system now is widely used in Africa, Asia and South America. A
significant part of these continents lie in earthquake zones. Earthquake activity in
the eastern and southern Africa region is characterised by the occurrence of
destructive earthquakes, which are controlled by the well-known regional tectonic
feature, the East Africa rift system. In eastern Africa Uganda and Tanzania are
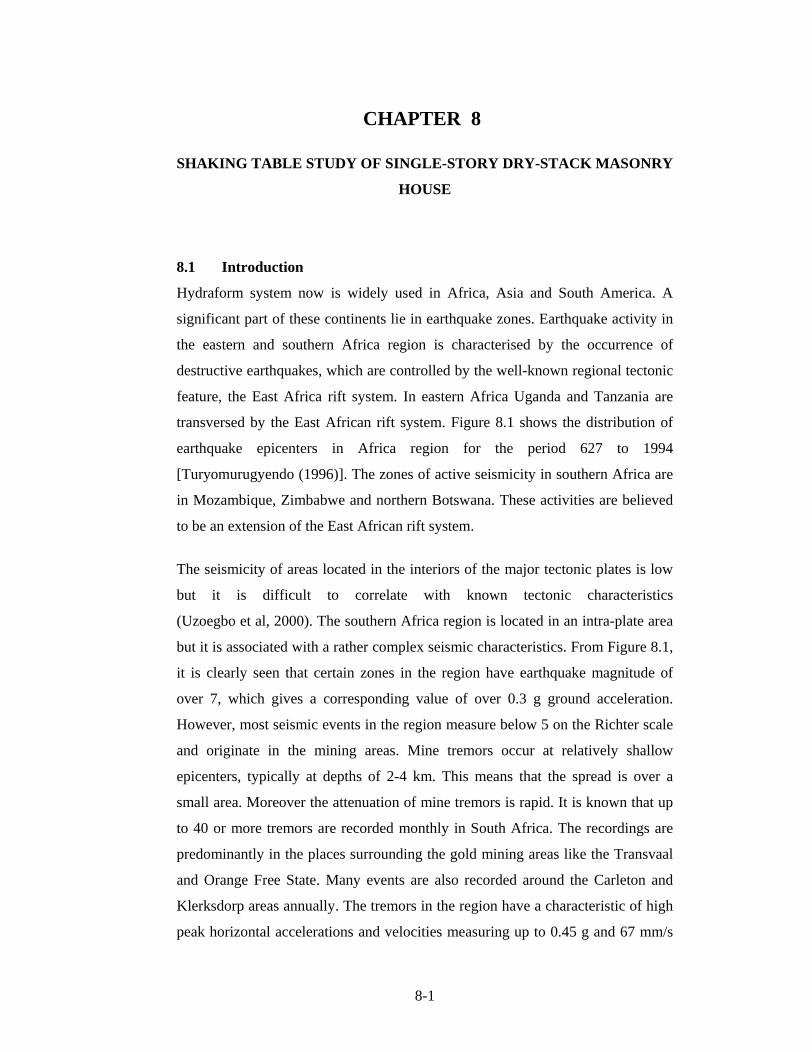
transversed by the East African rift system. Figure 8.1 shows the distribution of
earthquake epicenters in Africa region for the period 627 to 1994
[Turyomurugyendo (1996)]. The zones of active seismicity in southern Africa are
in Mozambique, Zimbabwe and northern Botswana. These activities are believed
to be an extension of the East African rift system.
The seismicity of areas located in the interiors of the major tectonic plates is low
but it is difficult to correlate with known tectonic characteristics
(Uzoegbo et al, 2000). The southern Africa region is located in an intra-plate area
but it is associated with a rather complex seismic characteristics. From Figure 8.1,
it is clearly seen that certain zones in the region have earthquake magnitude of
over 7, which gives a corresponding value of over 0.3 g ground acceleration.
However, most seismic events in the region measure below 5 on the Richter scale
and originate in the mining areas. Mine tremors occur at relatively shallow
epicenters, typically at depths of 2-4 km. This means that the spread is over a
small area. Moreover the attenuation of mine tremors is rapid. It is known that up
to 40 or more tremors are recorded monthly in South Africa. The recordings are
predominantly in the places surrounding the gold mining areas like the Transvaal
and Orange Free State. Many events are also recorded around the Carleton and
Klerksdorp areas annually. The tremors in the region have a characteristic of high
peak horizontal accelerations and velocities measuring up to 0.45 g and 67 mm/s

8-2
respectively. In Carletonville (1986) a peak acceleration of 0.45 g was measured.
This is even higher than the peak acceleration of 0.36 g obtained from the well-
known El Centro earthquake of 1940 recorded in USA. The difference between
the two seismic events is that while the El Centro Earthquake caused massive
damages to structures, the Carletonville tremor only caused minor damages and
cracking to structures located in the vicinity of the epicenter. Looking at other
characteristics of mine-induced tremors, they have high frequencies in the range
of 10 Hz to 50 Hz. This implies that mine tremors are not likely to produce
structural response from structures with low natural frequencies such as high-rise
buildings. A resonance, usually a response of large cyclic displacement amplitude,
is likely to occur when the excitation frequency is close to a natural frequency of
the structure. High-rise buildings do not respond to mine tremors because they
have low natural frequencies, typically less than 2 Hz. This means that single
story residential buildings are expected to respond to this type of excitation as
they fall in the high frequency range and hence the purpose for conducting the
shaking table study for the Hydraform system. Earthquakes of note, which
occurred in the 20th century in South Africa, are shown in Table 8.1.
Source NEIC-USA, 627-1994
Figure 8.1.Eathquakes in Africa continent
8-3
Table 8.1. Moderate earthquake occurred in 20th Century in South Africa Date Time Region Intensity/
magnitude
31/12/1932 08h32 Off Cape St.Lucia VIII/6.0-6.5
29/09/1969 22h03 Ceres/Tulbagh/Wolseley VIII-IX/6.3
08/12/1969 10h38 Welkom VII/5.5
07/03/1992 02h43 Carletonville VII/4.7
Source: Turyomurugyendo (1996)].
In the absence of standards for dry stacking, the experience from conventional
masonry will provide some guidelines in the development of the dry-stack seismic
system. Many researchers have reported the seismic performance of unreinforced
conventional masonry (Wesley, et al, 1986; Miha, et al, 1994; Petersen, at al,
2002; Pristley, at al, 1985; Minke, 2001; Martini, 1996; Jocelyn, 2001; Bolton,
1978).
The study was conducted to find if the normal Hydraform blocks and the normal
Hydraform construction system could resists the level of tremors in South Africa.
If so, is it adequate for resistance of tectonic activities, can the system be
improved for high intensity seismic zones. A full-scale single story dry-stack
interlocking block masonry building system was designed and tested on a shaking
table.
The test structure was subjected to a series of simulated earthquake ground
motions ranging from minor to severe. A conventional masonry test structure of
similar parameters was also constructed and tested for comparison. The tested
houses were monitored for peak acceleration [g], peak displacement [mm] and
mode of failure. Experimental data were captured and processed by computer
using continuous monitoring Software TLC CMSW 32 . The study was
conducted at SPOORNET laboratory in Johannesburg.

8-4
8.2 Object and Scope
The main objectives are to investigate the suitability of the Hydraform system for
the resistance of the level of seismic activities experienced in certain areas in
South Africa. The system would then be modified for design and construction in
more earthquake intense regions such as East and North Africa. The study
investigated the general structural behaviour of a single story unreinforced dry-
stack masonry house under seismic condition, the major structural weak points
were identified and strengthening alternative/methods were recommended.
8.3 Description of the Test Structures
8.3.1 House 1 Plain Dry-Stack Masonry
8.3.1.1 Wall construction details
House 1 was unreinforced dry-stack masonry (UDRM), constructed using
interlocking blocks without mortar or reinforcements except the starter course and
the lintel courses. The first test structure was viewed as an exploratory test for
providing the basic guideline in the identification of the weakest sections of
unreinforced dry-stack masonry under seismic load. The performance and mode
of failure of the structure forms basis for future modifications and strengthening
of the system. The test structures consisted of four walls, two with equal window
openings and two with equal door openings as shown in Figure 8.2. The
parameters of the structure are shown in Table 8.2.
a) East and North views b) West and North views
Figure 8.2: House 1 constructed on the shaking table
8-5
Table 8.2: House 1 parameters
External dimensions Doors Windows Remarks
Height
m
Width
m
Length
m
Height
m
Width
m
Height
m
Width
m
2.76 4.0 4.0 2.07 0.813 0.949 1022
Plain dry-stack,
lintel courses
in mortar
reinforced with
brick force
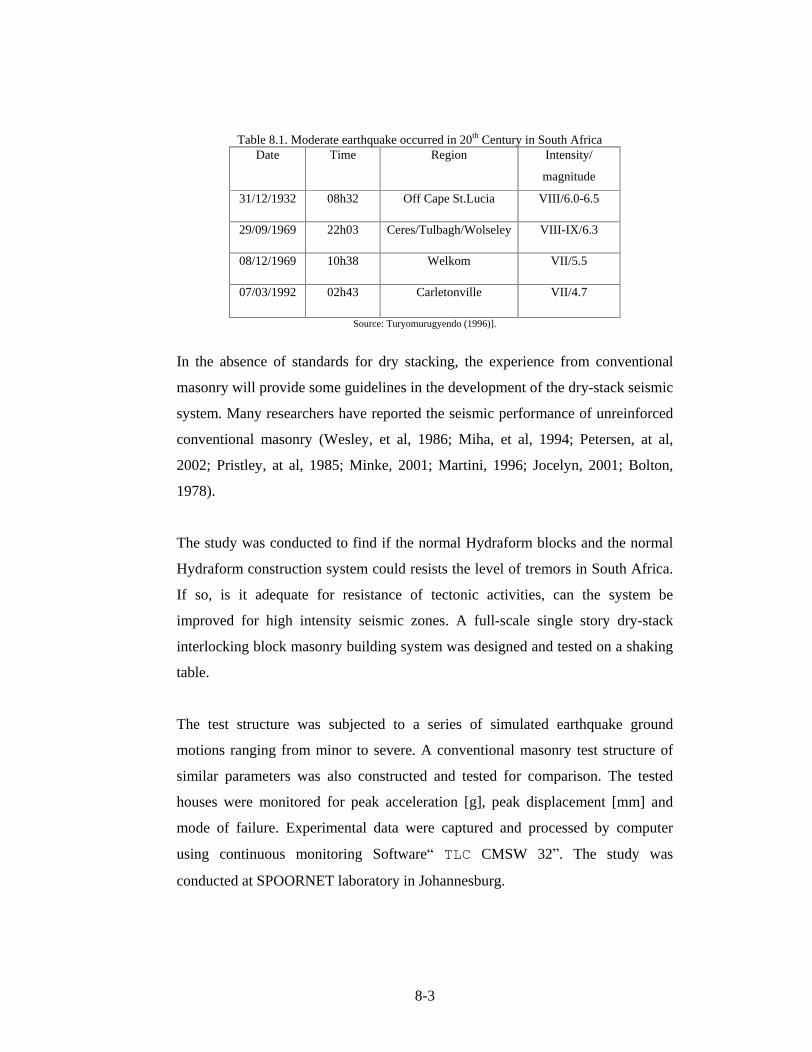
Single conduit seismic blocks (Figure 8.3a) and ordinary corner blocks (Fig.8.3b)
were used. The block compressive strength was 9 MPa. The compressive strength
was obtained by cutting 100 mm cubes from randomly sampled blocks and tested
for compression.
a) single conduit block b) ordinary corner block
Figure 8.3: Blocks for House 1
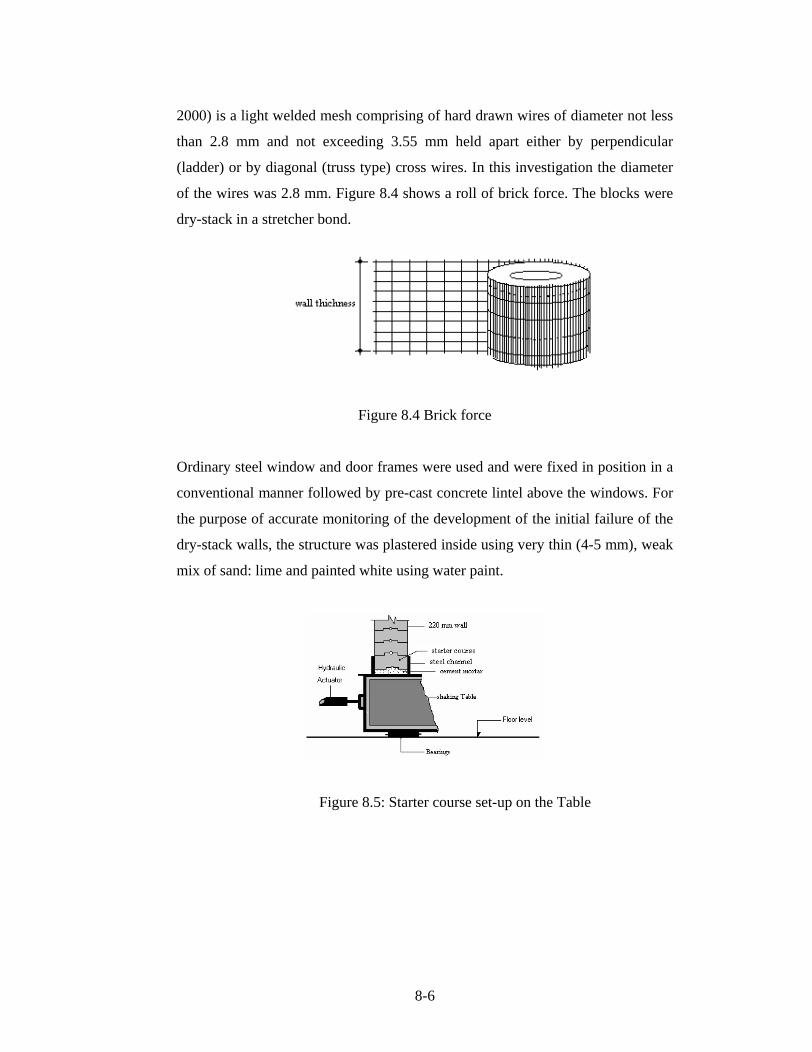
The Shaking table surface which forms part of the foundation of the test structure
is rigid therefore it was assumed that the tests would simulate only a very rigid
hard soil condition in the prototype. The foundation set-up (Fig. 8.5) was designed
to allow rocking and uplift but sliding was totally constrained. The starter course
was constructed on the Shaking Table in the 220 mm channel; the blocks were
laid in ordinary sand cement mortar class II and left for 3 days without load. The
channel was included in the table design to prevent sliding of the base of the
specimen during the test. Mid courses were dry-stacked, including the corners up
to the lintel level. The corners were plastered as shown in Figure 8.2. The top four
lintel courses were bonded using ordinary sand cement mortar class II, reinforced
with brick force and then plastered on both. Brick force by definition (Crofts,
8-6
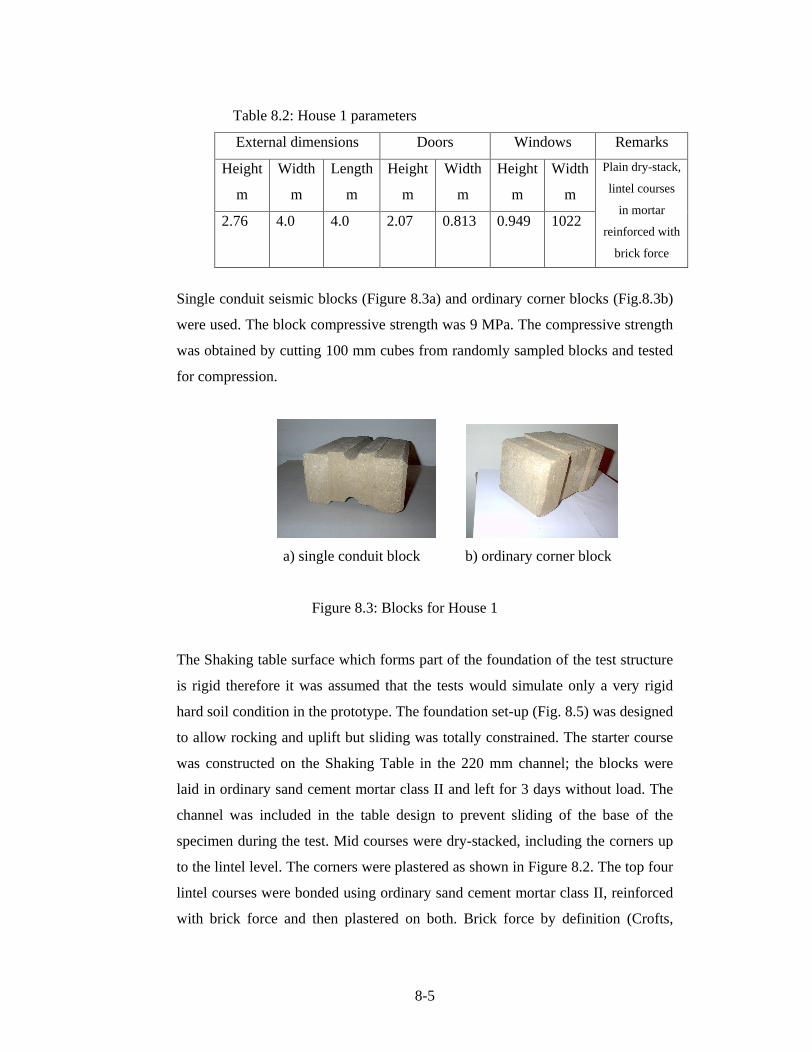
2000) is a light welded mesh comprising of hard drawn wires of diameter not less
than 2.8 mm and not exceeding 3.55 mm held apart either by perpendicular
(ladder) or by diagonal (truss type) cross wires. In this investigation the diameter
of the wires was 2.8 mm. Figure 8.4 shows a roll of brick force. The blocks were
dry-stack in a stretcher bond.
Figure 8.4 Brick force
Ordinary steel window and door frames were used and were fixed in position in a
conventional manner followed by pre-cast concrete lintel above the windows. For
the purpose of accurate monitoring of the development of the initial failure of the
dry-stack walls, the structure was plastered inside using very thin (4-5 mm), weak
mix of sand: lime and painted white using water paint.
Figure 8.5: Starter course set-up on the Table
8-7
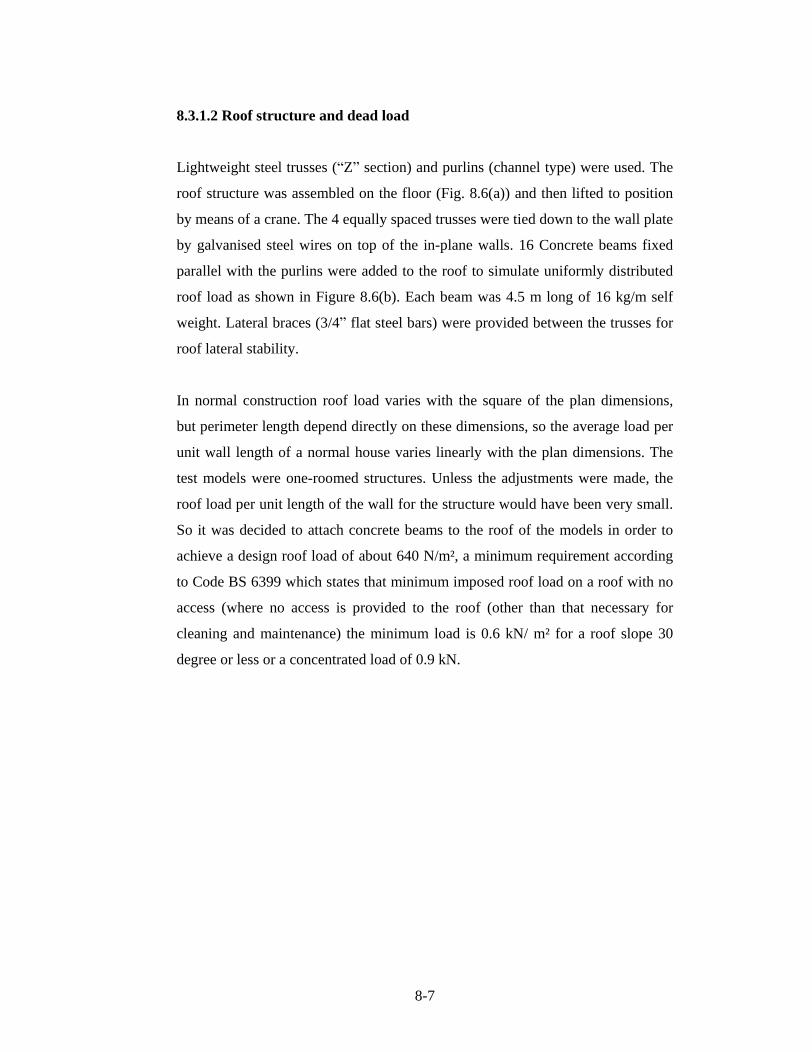
8.3.1.2 Roof structure and dead load
Lightweight steel trusses ( Z section) and purlins (channel type) were used. The
roof structure was assembled on the floor (Fig. 8.6(a)) and then lifted to position
by means of a crane. The 4 equally spaced trusses were tied down to the wall plate
by galvanised steel wires on top of the in-plane walls. 16 Concrete beams fixed
parallel with the purlins were added to the roof to simulate uniformly distributed
roof load as shown in Figure 8.6(b). Each beam was 4.5 m long of 16 kg/m self
weight. Lateral braces (3/4 flat steel bars) were provided between the trusses for
roof lateral stability.
In normal construction roof load varies with the square of the plan dimensions,
but perimeter length depend directly on these dimensions, so the average load per
unit wall length of a normal house varies linearly with the plan dimensions. The
test models were one-roomed structures. Unless the adjustments were made, the
roof load per unit length of the wall for the structure would have been very small.
So it was decided to attach concrete beams to the roof of the models in order to
achieve a design roof load of about 640 N/m², a minimum requirement according
to Code BS 6399 which states that minimum imposed roof load on a roof with no
access (where no access is provided to the roof (other than that necessary for
cleaning and maintenance) the minimum load is 0.6 kN/ m² for a roof slope 30
degree or less or a concentrated load of 0.9 kN.
8-8
a) assembling of the roof structure on the floor
b) additional dead load from concrete beams
Figure 8.6: Roof construction and dead load attachment
The structure was tested at the age of 3 month from the day the top courses were
laid
8.3.2 House 2 - Standard Conventional masonry House for comparisons
8.3.2.1 Wall construction details
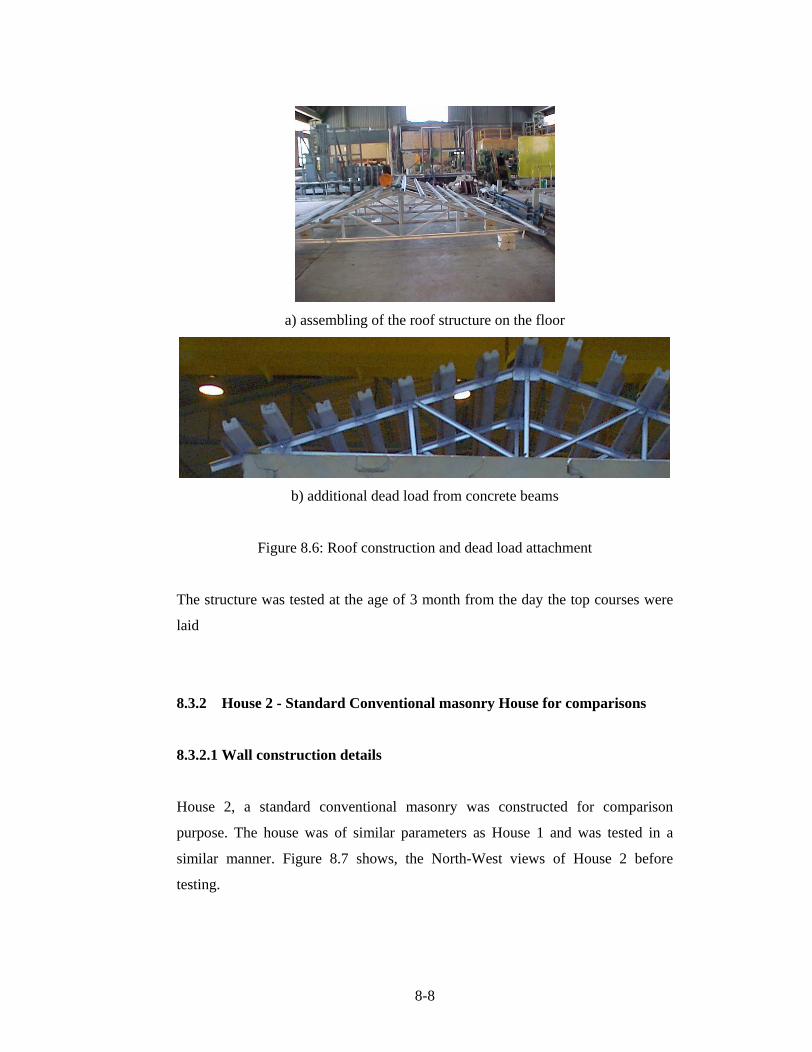
House 2, a standard conventional masonry was constructed for comparison
purpose. The house was of similar parameters as House 1 and was tested in a
similar manner. Figure 8.7 shows, the North-West views of House 2 before
testing.
8-9
Figure 8.7: House 2 before test
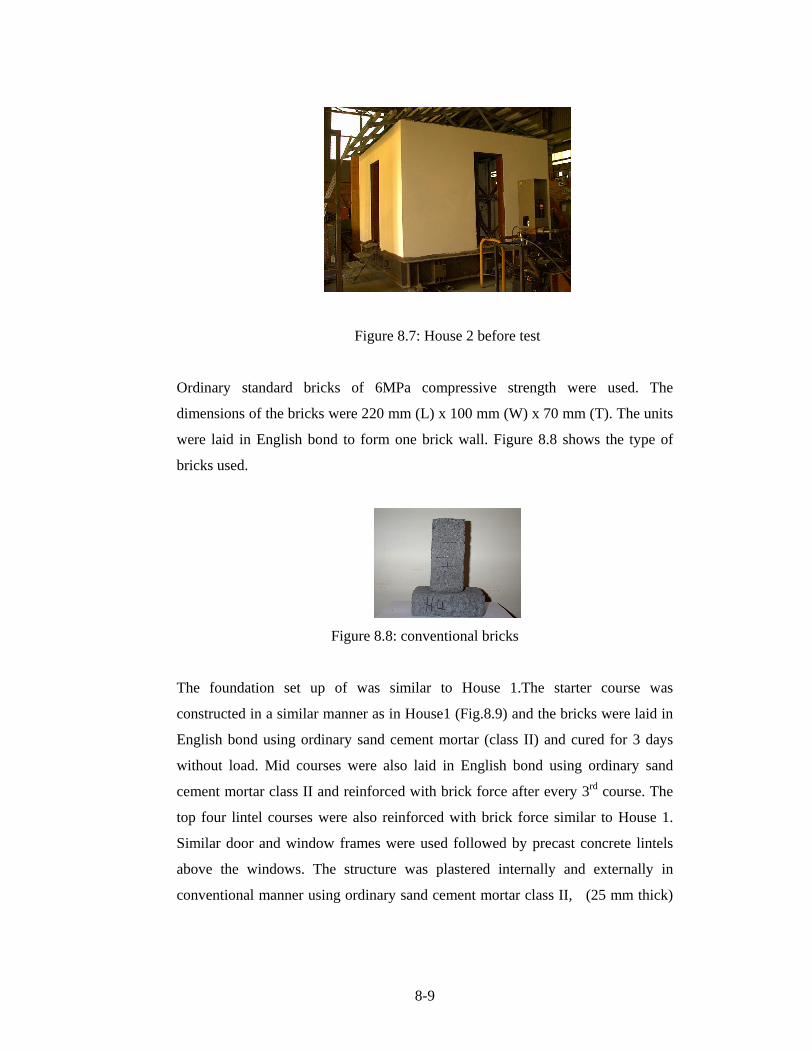
Ordinary standard bricks of 6MPa compressive strength were used. The
dimensions of the bricks were 220 mm (L) x 100 mm (W) x 70 mm (T). The units
were laid in English bond to form one brick wall. Figure 8.8 shows the type of
bricks used.
Figure 8.8: conventional bricks
The foundation set up of was similar to House 1.The starter course was
constructed in a similar manner as in House1 (Fig.8.9) and the bricks were laid in
English bond using ordinary sand cement mortar (class II) and cured for 3 days
without load. Mid courses were also laid in English bond using ordinary sand
cement mortar class II and reinforced with brick force after every 3rd course. The
top four lintel courses were also reinforced with brick force similar to House 1.
Similar door and window frames were used followed by precast concrete lintels
above the windows. The structure was plastered internally and externally in
conventional manner using ordinary sand cement mortar class II, (25 mm thick)

8-10
and painted white to allow good monitoring of the initial cracks. See Figure 8.10
below. The structure was tested at the age of about 3 months.
Figure 8.9 Starter course set-up
a) plastered b) painted
Figure 8.10: wall surface treatments
8.3.2.2 Roof structure
Light weight steel roof structure of similar materials as in House 1 was used, with
additional lateral bracing between the trusses to enhance its capacity against
lateral movements. Figure 8.11 shows the assembling of the roof structure on the
floor in the laboratory before lifted to position using a crane.

8-11
a) assembling of the roof structure b) lateral brace between the trusses
Figure 8.11: Fabrication of the roof structure
8.4 Test Facility
8.4.1 Earthquake Simulator
8.4.1.1 Introduction
Because of high cost of a purchasing a shaking table following the quotations
from different supplies from different countries, and limited research funds
available, it was decided to design and fabricate a shaking table locally. The
shaking table was jointly designed by the WITS University and MEGMET (Pty)
Ltd. Conceptual design of the Shaking Table was based on the experiments
carried in phase one of this project. The table was designed to accommodate
similar size of test models as in Phase I; full-scale, one roomed single story
structure. A steel table was fabricated, mounted on recirculating roller type linear
bearings giving single degree of freedom (SDOF), providing motion in one
horizontal direction.
The table was installed at Spoornet laboratory owned by South Africa railways
Corporation at Jeppestown Johannesburg, where better facilities were readily
available. The laboratory is equipped with 10 Tonnes overhead crane, powerful
8-12
MTS Hydraulic system, modern data acquisition and processing system. The
laboratory building also has adequate headroom to accommodate a full size
single-story house on a Shaking Table.
8.4.1.2 Shaking Table specifications
Size: 4 m x 4 m
Maximum payload: 20 tonnes
Maximum height of payload centre of gravity: 1.65 m
Maximum horizontal acceleration (20 tonne payload): 1.0g
Maximum horizontal displacement: ±75 mm
Operational frequency range: 0-10 Hz
Table mass: 8 Tons
8.4.1.3 Design of the Table
Different configuration of the platform structure were modelled by means of the
finite element technique and investigated for natural frequency of vibration. The
platform structure was modelled by means of shell elements; whilst the specimen
was modelled rigidly as a point mass element. The point mass was modelled to be
rigidly connected to four points on the table surface, in between the four linear
bearing mounting positions. This assumption allows for maximum flexibility
between the connection points and the bearings and is thus conservative. A
symmetric half of the structure was modelled.
The liner bearings were modelled (by means of constraints) to be free in the
direction of movement of the table and rigidly fixed in the two perpendicular
directions. The first natural frequency was calculated by means of linear vibration
analysis (eigen value analysis).
The analysis shows that the most stiffness /mass efficient structure is achieved by
means of a solid plate top, supported by series of criss-cross T-sections, as
8-13
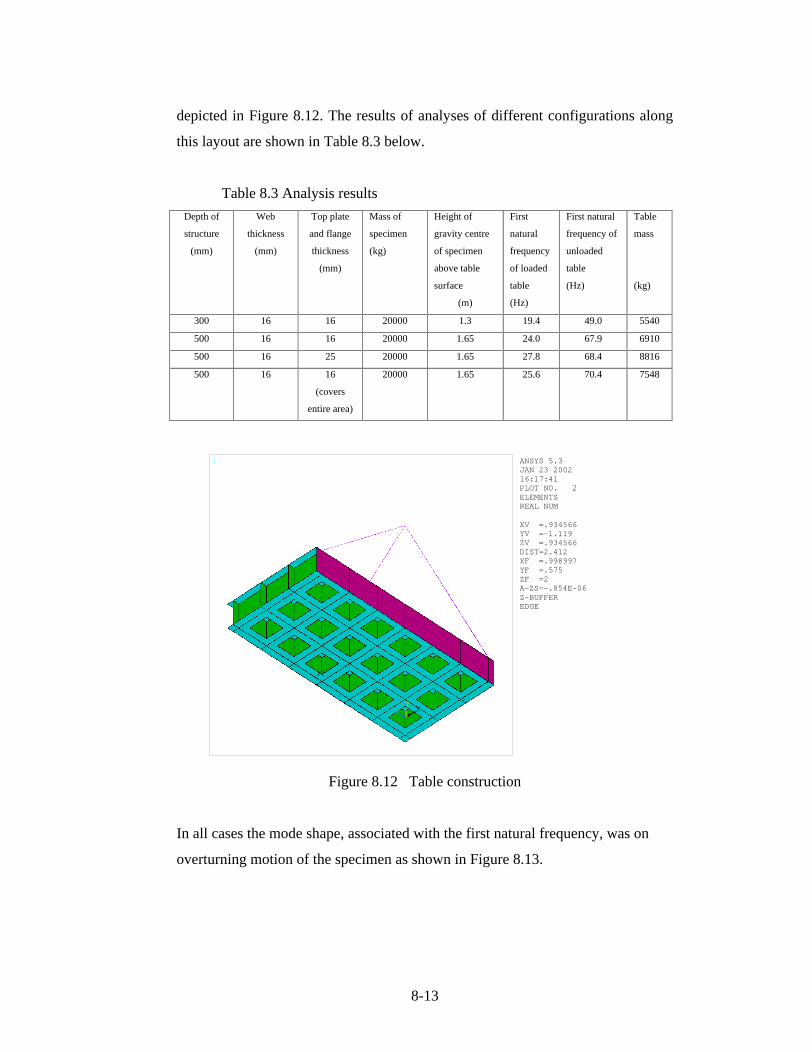
depicted in Figure 8.12. The results of analyses of different configurations along
this layout are shown in Table 8.3 below.
Table 8.3 Analysis results
Depth of
structure
(mm)
Web
thickness
(mm)
Top plate
and flange
thickness
(mm)
Mass of
specimen
(kg)
Height of
gravity centre
of specimen
above table
surface
(m)
First
natural
frequency
of loaded
table
(Hz)
First natural
frequency of
unloaded
table
(Hz)
Table
mass
(kg)
300 16 16 20000 1.3 19.4 49.0 5540
500 16 16 20000 1.65 24.0 67.9 6910
500 16 25 20000 1.65 27.8 68.4 8816
500 16 16
(covers
entire area)
20000 1.65 25.6 70.4 7548
ANSYS 5.3JAN 23 200216:17:41PLOT NO. 2ELEMENTSREAL NUM
1
11
XY
Z
XV =.934566YV =-1.119ZV =.934566DIST=2.412XF =.998997YF =.575ZF =2A-ZS=-.854E-06Z-BUFFEREDGE
Figure 8.12 Table construction
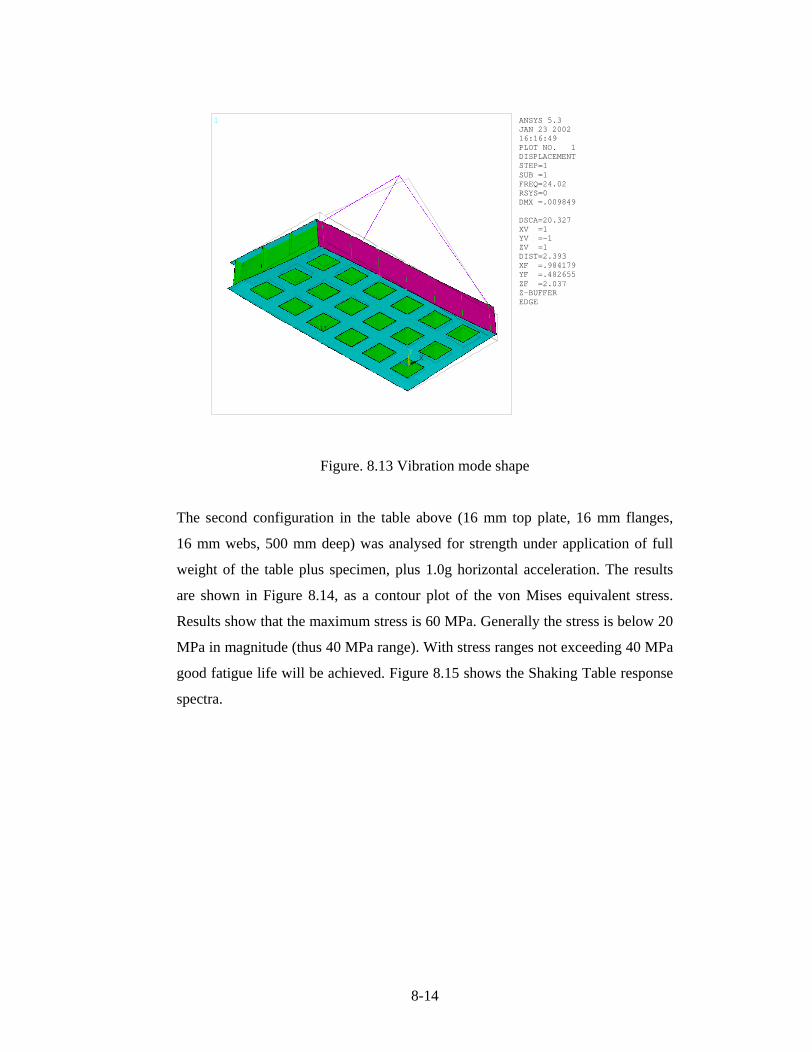
In all cases the mode shape, associated with the first natural frequency, was on
overturning motion of the specimen as shown in Figure 8.13.
8-14
ANSYS 5.3JAN 23 200216:16:49PLOT NO. 1DISPLACEMENTSTEP=1SUB =1FREQ=24.02RSYS=0DMX =.009849
1
11
XY
Z
DSCA=20.327XV =1YV =-1ZV =1DIST=2.393XF =.984179YF =.482655ZF =2.037Z-BUFFEREDGE
Figure. 8.13 Vibration mode shape
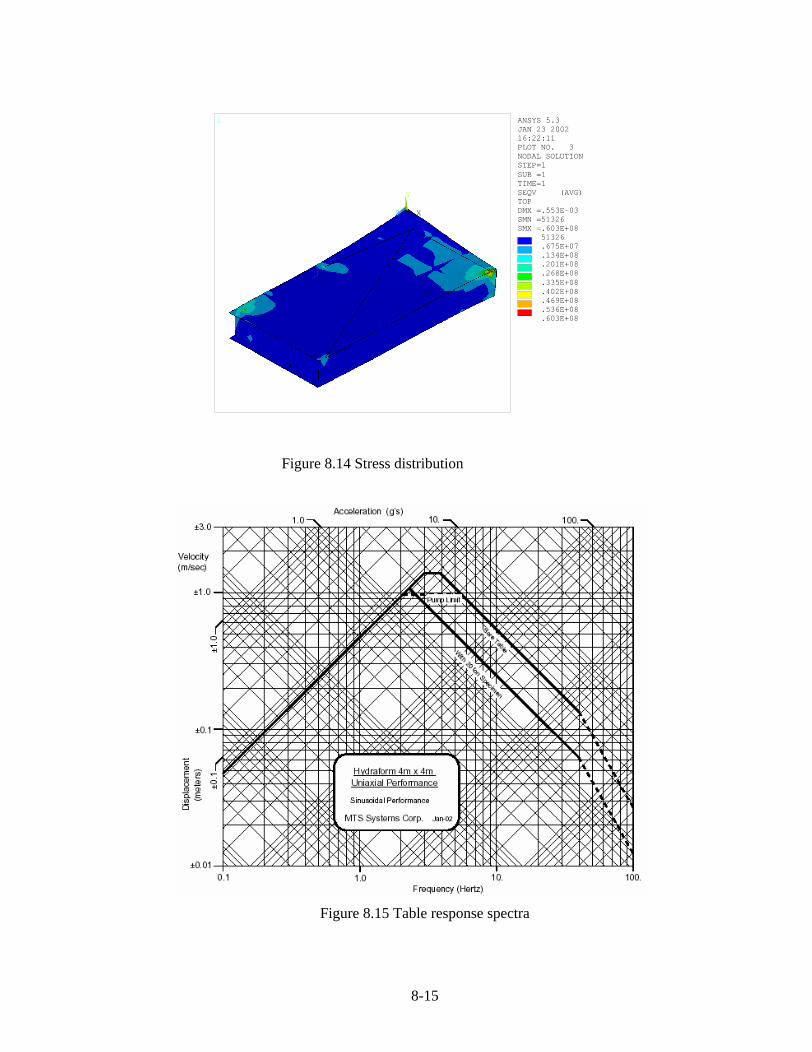
The second configuration in the table above (16 mm top plate, 16 mm flanges,
16 mm webs, 500 mm deep) was analysed for strength under application of full
weight of the table plus specimen, plus 1.0g horizontal acceleration. The results
are shown in Figure 8.14, as a contour plot of the von Mises equivalent stress.
Results show that the maximum stress is 60 MPa. Generally the stress is below 20
MPa in magnitude (thus 40 MPa range). With stress ranges not exceeding 40 MPa
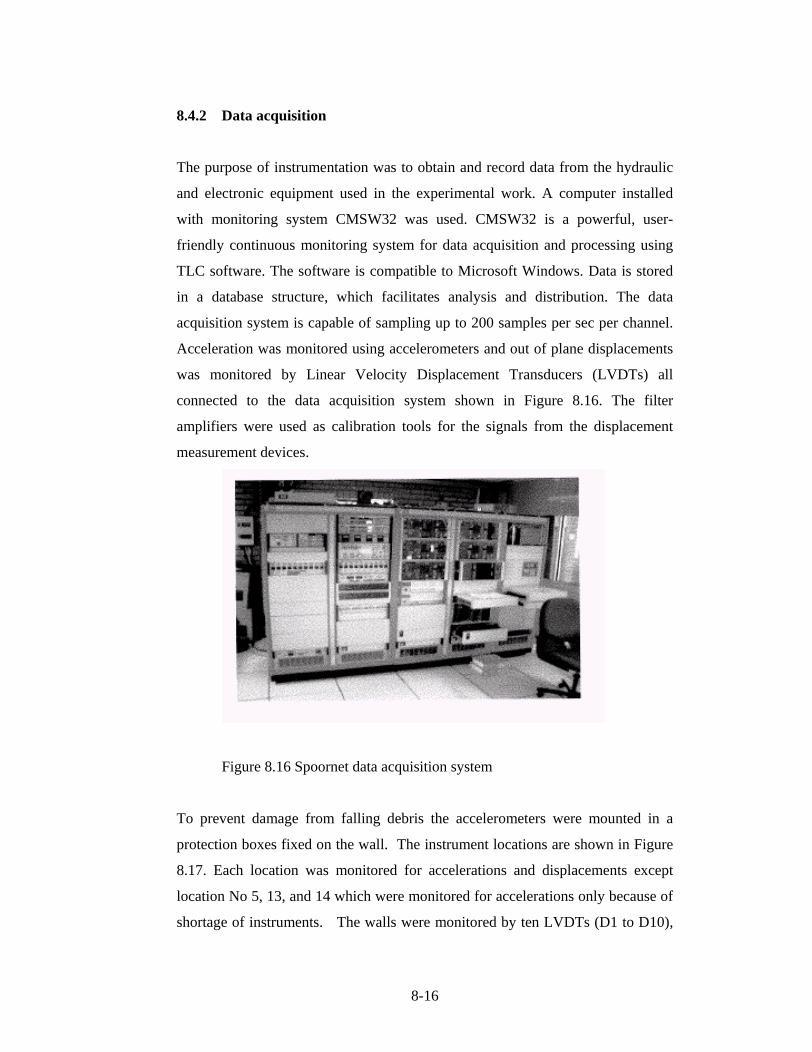
good fatigue life will be achieved. Figure 8.15 shows the Shaking Table response
spectra.
8-15
ANSYS 5.3JAN 23 200216:22:11PLOT NO. 3NODAL SOLUTIONSTEP=1SUB =1TIME=1SEQV (AVG)TOPDMX =.553E-03SMN =51326SMX =.603E+08
1
MN
MX11
X
Y
Z
51326.675E+07.134E+08.201E+08.268E+08.335E+08.402E+08.469E+08.536E+08.603E+08
Figure 8.14 Stress distribution
Figure 8.15 Table response spectra
8-16
8.4.2 Data acquisition
The purpose of instrumentation was to obtain and record data from the hydraulic
and electronic equipment used in the experimental work. A computer installed
with monitoring system CMSW32 was used. CMSW32 is a powerful, user-
friendly continuous monitoring system for data acquisition and processing using
TLC software. The software is compatible to Microsoft Windows. Data is stored
in a database structure, which facilitates analysis and distribution. The data
acquisition system is capable of sampling up to 200 samples per sec per channel.
Acceleration was monitored using accelerometers and out of plane displacements
was monitored by Linear Velocity Displacement Transducers (LVDTs) all
connected to the data acquisition system shown in Figure 8.16. The filter
amplifiers were used as calibration tools for the signals from the displacement
measurement devices.
Figure 8.16 Spoornet data acquisition system
To prevent damage from falling debris the accelerometers were mounted in a
protection boxes fixed on the wall. The instrument locations are shown in Figure
8.17. Each location was monitored for accelerations and displacements except
location No 5, 13, and 14 which were monitored for accelerations only because of
shortage of instruments. The walls were monitored by ten LVDTs (D1 to D10),

8-17
and fourteen accelerometers (N1 to N14) but because of shortage N11 was moved
to the roof. The instrumentation frame was monitored by two accelerometers (N15
& N16). The table was monitored by one accelerometer (Atable). The location of
the monitoring positions for the two test houses remained the same. The walls
were monitored at the top; at mid height and at the bottom. The mid height
monitoring points were located either 500 mm from the nearest corner or 500 mm
from the nearest opening. The bottom monitoring points were located on the out-
of-plane walls at the 3rd course from the Table floor. The roof was monitored with
only one accelerometer, placed at the ridge. The Table accelerations were
monitored by accelerometer fixed at base of the table near the actuator
connections, while the Table displacements were monitored via inbuilt LVDT in
the actuator.
Figure 8.17: Monitoring Positions of the Test structures
N12
N13N14
1413
D8
12
911
10 8
7 6
5
4
3
21
NORTHWall type B (W3)
Wal
l typ
e B (W
4)
Wall type A (W1)
Wal
l typ
e A
( W
2)
of table motion
Direction
INSTRUMENTATION - INSIDE THE HOUSE
Ngowi WITS 2004
WEST
EAST
SOUTH
N4
N5
D4
N3
D10
N9D9
N10
N7
N6
D6
D7
N8
N1
N2D2
D1
D12
Atable
D3
RC beams supported on the purlins equally distributed
4 Light weight steel trusses equally spaced
Roof accelerometer at the ridge [N11]
N1-N16 - AccelerometersAtable - Table accelerometerD1-D10 - LVDTs
8-18
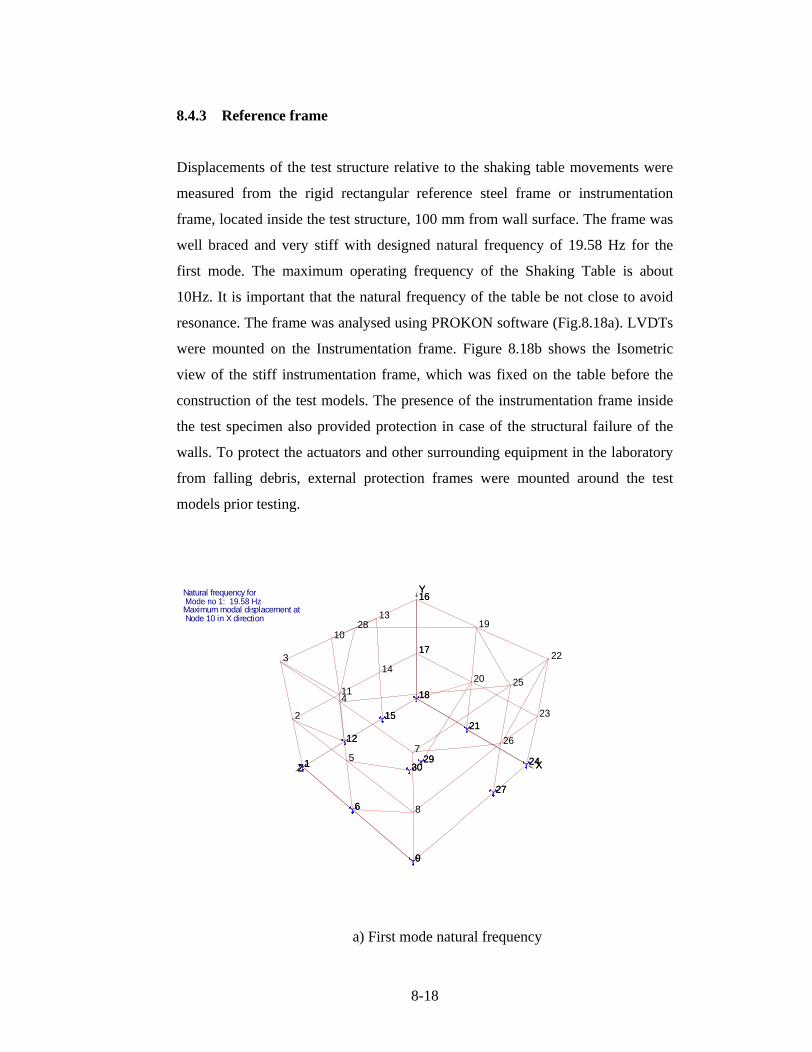
8.4.3 Reference frame
Displacements of the test structure relative to the shaking table movements were
measured from the rigid rectangular reference steel frame or instrumentation
frame, located inside the test structure, 100 mm from wall surface. The frame was
well braced and very stiff with designed natural frequency of 19.58 Hz for the
first mode. The maximum operating frequency of the Shaking Table is about
10Hz. It is important that the natural frequency of the table be not close to avoid
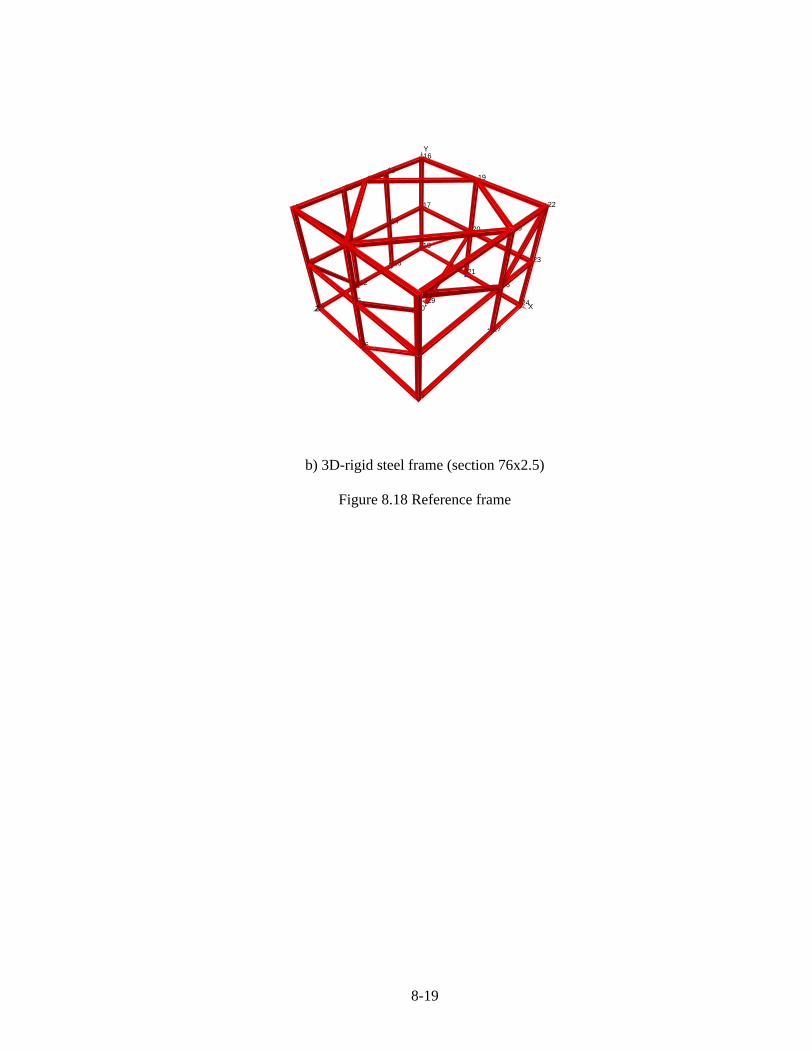
resonance. The frame was analysed using PROKON software (Fig.8.18a). LVDTs
were mounted on the Instrumentation frame. Figure 8.18b shows the Isometric
view of the stiff instrumentation frame, which was fixed on the table before the
construction of the test models. The presence of the instrumentation frame inside
the test specimen also provided protection in case of the structural failure of the
walls. To protect the actuators and other surrounding equipment in the laboratory
from falling debris, external protection frames were mounted around the test
models prior testing.
a) First mode natural frequency
Natural frequency for Mode no 1: 19.58 HzMaximum modal displacement at Node 10 in X direction
18
16
17
Y16
17
18
Y
21
19
20
21
24X
22
23
24X
15
13
14
15
28
29293030
27
25
26
27
12
10
11
12
1Z1
2
3
Z
6
4
5
6
9
7
8
9
8-19
b) 3D-rigid steel frame (section 76x2.5)
Figure 8.18 Reference frame
18
21
24
17
20
23
16
19
22
15
12
1
14
11
2
13
1028
3
30
6
295
4
27
9
26
8
25
7
Y
XZ
8-20
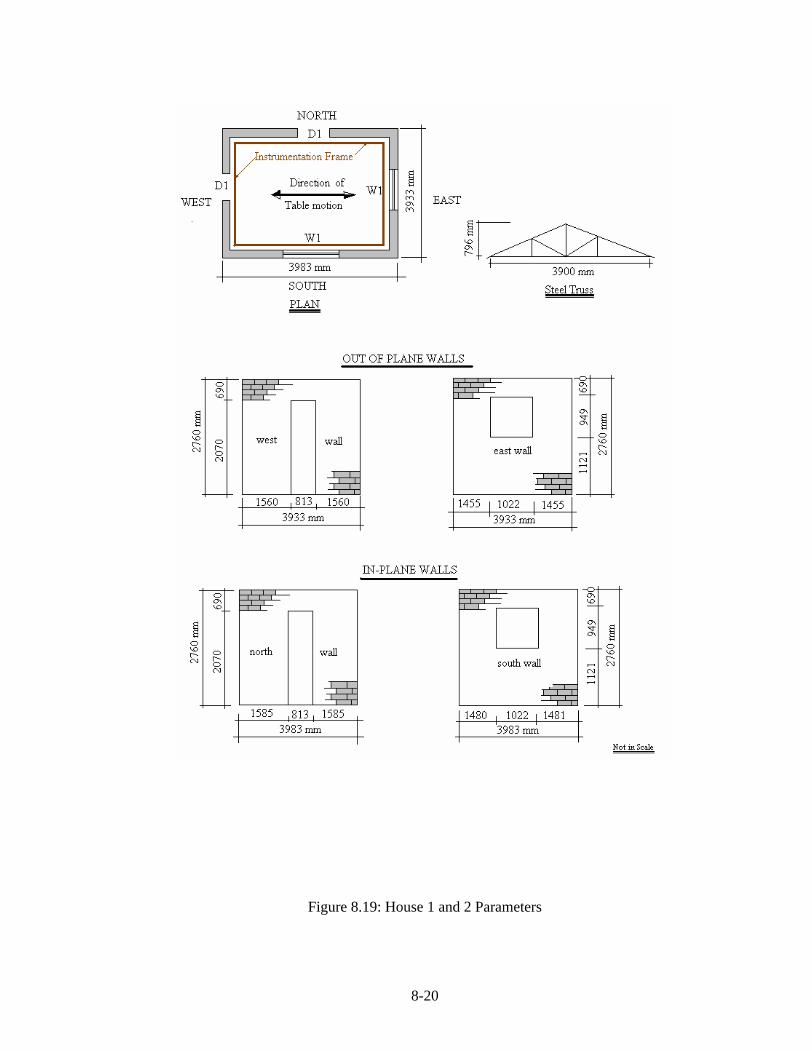
Figure 8.19: House 1 and 2 Parameters
8-21
8.5 Test Results
8.5.1 Introduction
The shaking table investigation was conducted to provide a basis for evaluation of
the structural behaviour of dry-stack masonry houses in a seismic condition.
Because of practical limitations in the implementation of typical details in the test
structures, only limited number of parameters could be included in the
investigation. The variables considered in the programme were the following;
i. Plain dry-stack walls
ii. Same base fixity for all specimens
iii. Roof orientation (remained unchanged with In-plane walls-load
bearing, out-of-plane walls non-load bearing in all tests)
iv. Standard conventional masonry system for comparison
The test structures were subjected to sinusoidal excitation. The sine sweep motion
used was of constant amplitude acceleration but varying frequency. In all tests the
table motions were applied sequentially, starting with very low intensity and
increasing until significant damage was observed. Because of this procedure the
structures were progressively damaged when subjected to the more intense
motions. Undoubtedly, the results obtained with these test structures may be
considered to be conservative in this regard.
There was interaction of the variables and consequently the determination of the
direct effect of a specific variable is difficult. One must therefore generalise in
order to bring out the more prominent features of the response characteristics. The
following section report accelerations and displacements recorded at various
positions on the test structure, mode of failure of the specimens and natural
frequency. Discussions and recommendations are also given.
8-22
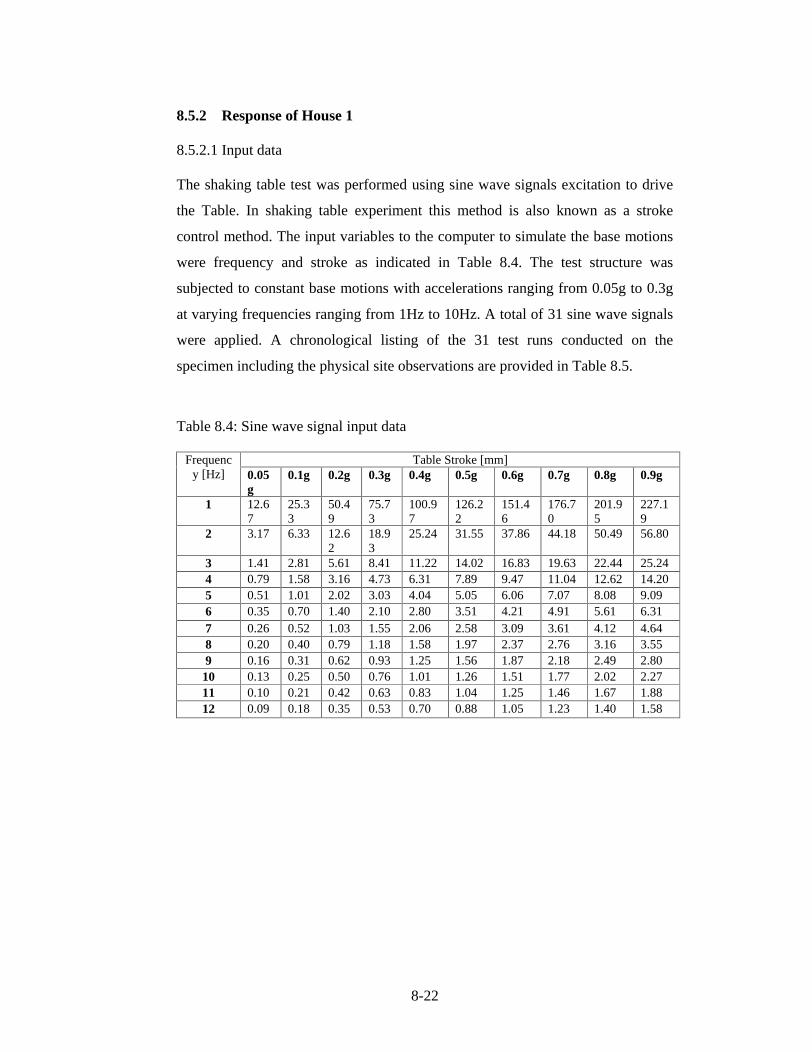
8.5.2 Response of House 1
8.5.2.1 Input data
The shaking table test was performed using sine wave signals excitation to drive
the Table. In shaking table experiment this method is also known as a stroke
control method. The input variables to the computer to simulate the base motions
were frequency and stroke as indicated in Table 8.4. The test structure was
subjected to constant base motions with accelerations ranging from 0.05g to 0.3g
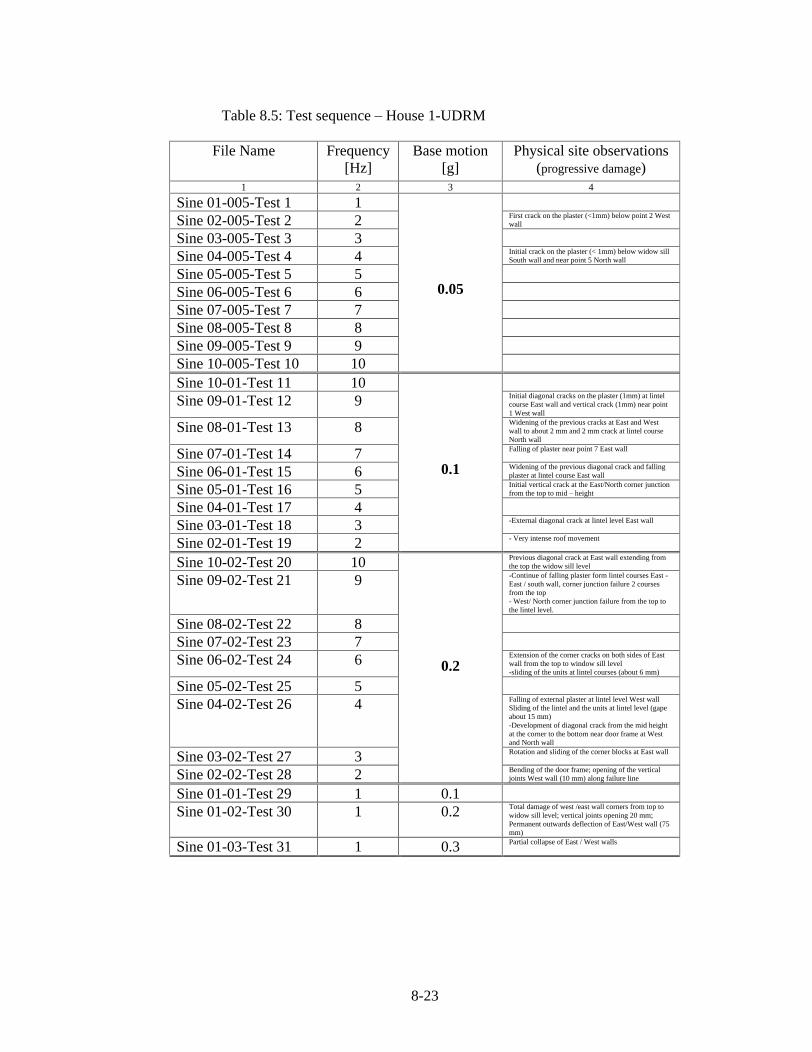
at varying frequencies ranging from 1Hz to 10Hz. A total of 31 sine wave signals
were applied. A chronological listing of the 31 test runs conducted on the
specimen including the physical site observations are provided in Table 8.5.
Table 8.4: Sine wave signal input data
Table Stroke [mm] Frequency [Hz] 0.05
g 0.1g 0.2g 0.3g 0.4g 0.5g 0.6g 0.7g 0.8g 0.9g
1 12.67
25.33
50.49
75.73
100.97
126.22
151.46
176.70
201.95
227.19
2 3.17 6.33 12.62
18.93
25.24 31.55 37.86 44.18 50.49 56.80
3 1.41 2.81 5.61 8.41 11.22 14.02 16.83 19.63 22.44 25.24 4 0.79 1.58 3.16 4.73 6.31 7.89 9.47 11.04 12.62 14.20 5 0.51 1.01 2.02 3.03 4.04 5.05 6.06 7.07 8.08 9.09 6 0.35 0.70 1.40 2.10 2.80 3.51 4.21 4.91 5.61 6.31 7 0.26 0.52 1.03 1.55 2.06 2.58 3.09 3.61 4.12 4.64 8 0.20 0.40 0.79 1.18 1.58 1.97 2.37 2.76 3.16 3.55 9 0.16 0.31 0.62 0.93 1.25 1.56 1.87 2.18 2.49 2.80 10 0.13 0.25 0.50 0.76 1.01 1.26 1.51 1.77 2.02 2.27 11 0.10 0.21 0.42 0.63 0.83 1.04 1.25 1.46 1.67 1.88 12 0.09 0.18 0.35 0.53 0.70 0.88 1.05 1.23 1.40 1.58
8-23
Table 8.5: Test sequence House 1-UDRM
File Name Frequency [Hz]
Base motion [g]
Physical site observations (progressive damage)
1 2 3 4
Sine 01-005-Test 1 1 Sine 02-005-Test 2 2 First crack on the plaster (<1mm) below point 2 West
wall
Sine 03-005-Test 3 3 Sine 04-005-Test 4 4 Initial crack on the plaster (< 1mm) below widow sill
South wall and near point 5 North wall
Sine 05-005-Test 5 5 Sine 06-005-Test 6 6 Sine 07-005-Test 7 7 Sine 08-005-Test 8 8 Sine 09-005-Test 9 9 Sine 10-005-Test 10 10
0.05
Sine 10-01-Test 11 10 Sine 09-01-Test 12 9 Initial diagonal cracks on the plaster (1mm) at lintel
course East wall and vertical crack (1mm) near point 1 West wall
Sine 08-01-Test 13 8 Widening of the previous cracks at East and West wall to about 2 mm and 2 mm crack at lintel course North wall
Sine 07-01-Test 14 7 Falling of plaster near point 7 East wall
Sine 06-01-Test 15 6 Widening of the previous diagonal crack and falling plaster at lintel course East wall
Sine 05-01-Test 16 5 Initial vertical crack at the East/North corner junction from the top to mid height
Sine 04-01-Test 17 4 Sine 03-01-Test 18 3 -External diagonal crack at lintel level East wall
Sine 02-01-Test 19 2
0.1
- Very intense roof movement
Sine 10-02-Test 20 10 Previous diagonal crack at East wall extending from the top the widow sill level
Sine 09-02-Test 21 9 -Continue of falling plaster form lintel courses East -East / south wall, corner junction failure 2 courses from the top - West/ North corner junction failure from the top to the lintel level.
Sine 08-02-Test 22 8 Sine 07-02-Test 23 7 Sine 06-02-Test 24 6 Extension of the corner cracks on both sides of East
wall from the top to window sill level -sliding of the units at lintel courses (about 6 mm)
Sine 05-02-Test 25 5 Sine 04-02-Test 26 4 Falling of external plaster at lintel level West wall
Sliding of the lintel and the units at lintel level (gape about 15 mm) -Development of diagonal crack from the mid height at the corner to the bottom near door frame at West and North wall
Sine 03-02-Test 27 3 Rotation and sliding of the corner blocks at East wall
Sine 02-02-Test 28 2
0.2
Bending of the door frame; opening of the vertical joints West wall (10 mm) along failure line
Sine 01-01-Test 29 1 0.1 Sine 01-02-Test 30 1 0.2 Total damage of west /east wall corners from top to
widow sill level; vertical joints opening 20 mm; Permanent outwards deflection of East/West wall (75 mm)
Sine 01-03-Test 31 1 0.3 Partial collapse of East / West walls

8-24
8.5.2.2 Response of the test structure.
The first series of tests (T1 - T10) was conducted using a constant base motion of
0.05 g with varying frequency range of 1Hz to 10Hz. Before testing the structure,
all the hairline cracks inside the structure were marked. The hairline cracking was
likely due to the shrinkage of the plaster during the curing period. The roof
structure was supported on in-plane walls (see Fig. 8.2 and 8.19), trusses oriented
perpendicular to the table motion. The out-of-plane walls were therefore non-load
bearing. The cracks on the plaster, caused by the base motions were initially
Figure 8.20: Initial failure West wall at 2Hz [0.05g]
a) South wall b) North wall
Figure 8.21 Initial failure at 4Hz [0.05g]
recorded at frequency of 2Hz and 4Hz on the mid sections of the West and North
walls. On the South wall the initial cracks were noted below the window sill.
Figure 8.20 and 8.21 shows these initial failures.
8-25
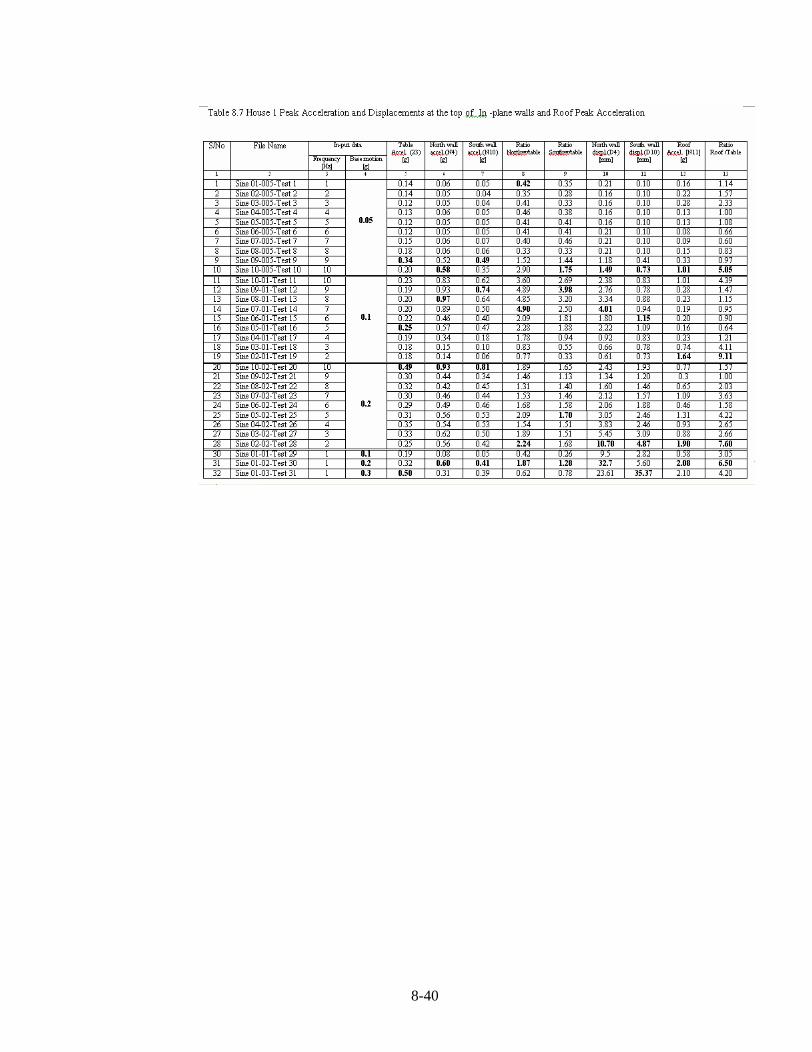
Peak displacement and acceleration recorded on the top of the out-of plane walls
and In-plane walls are presented in Table 8.6 and 8.7 below respectively. The
maximum displacement amplitudes were recorded at the top the walls at lower
frequencies. The displacements were of the order of 0.26 to 4.07 mm in out of
plane walls and 0.1 to 1.49 mm in In-plane walls. The recorded response
quantities for T2 and T4 are presented as time histories in Figure 8.42 and 43.
This should be studied in conjunction with Table 8.5.
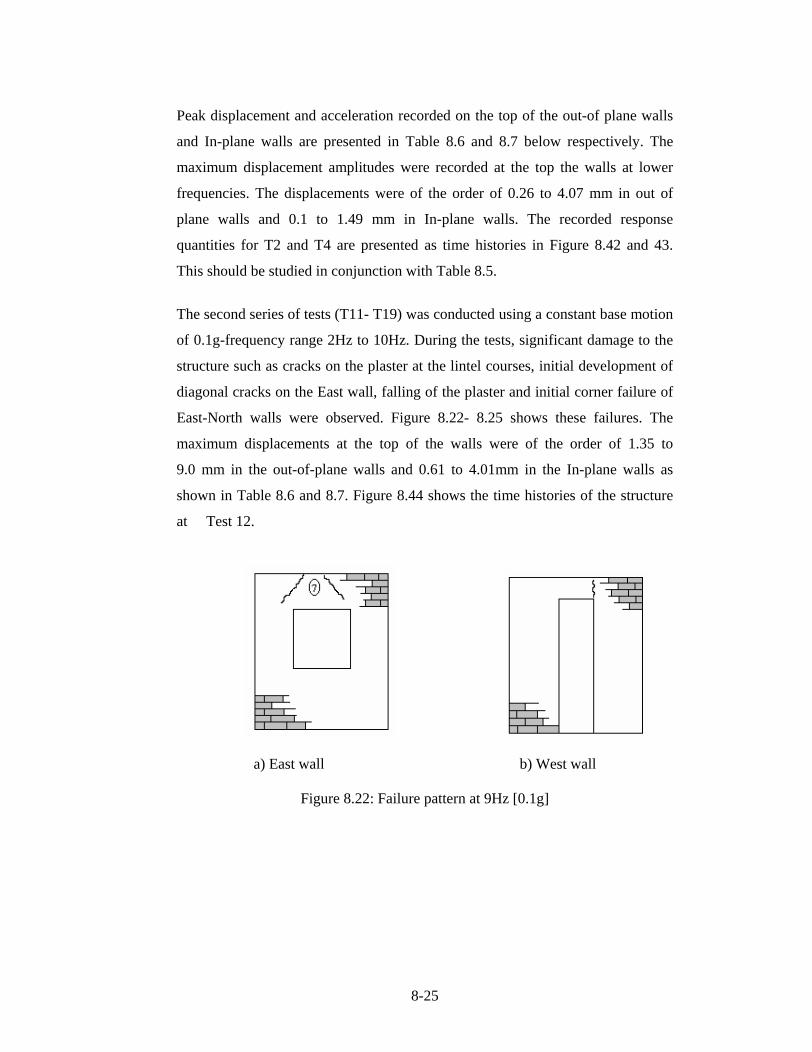
The second series of tests (T11- T19) was conducted using a constant base motion
of 0.1g-frequency range 2Hz to 10Hz. During the tests, significant damage to the
structure such as cracks on the plaster at the lintel courses, initial development of
diagonal cracks on the East wall, falling of the plaster and initial corner failure of
East-North walls were observed. Figure 8.22- 8.25 shows these failures. The
maximum displacements at the top of the walls were of the order of 1.35 to
9.0 mm in the out-of-plane walls and 0.61 to 4.01mm in the In-plane walls as
shown in Table 8.6 and 8.7. Figure 8.44 shows the time histories of the structure
at Test 12.
a) East wall b) West wall
Figure 8.22: Failure pattern at 9Hz [0.1g]
8-26
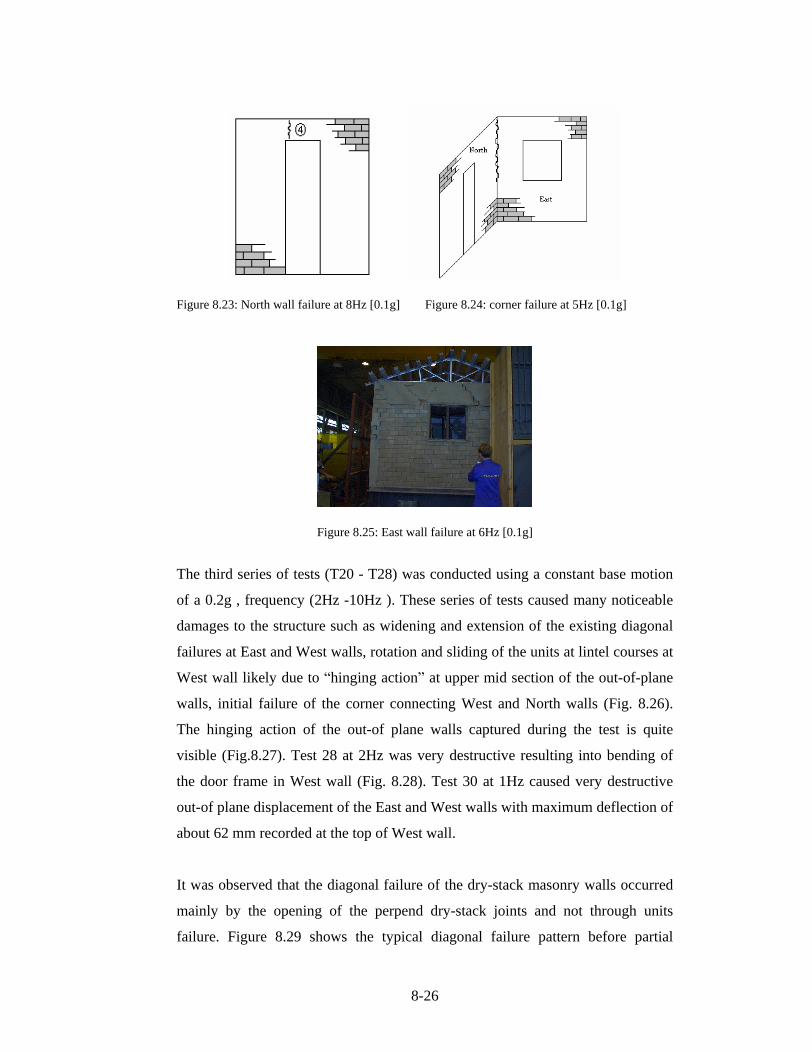
Figure 8.23: North wall failure at 8Hz [0.1g] Figure 8.24: corner failure at 5Hz [0.1g]
Figure 8.25: East wall failure at 6Hz [0.1g]
The third series of tests (T20 - T28) was conducted using a constant base motion
of a 0.2g , frequency (2Hz -10Hz ). These series of tests caused many noticeable
damages to the structure such as widening and extension of the existing diagonal
failures at East and West walls, rotation and sliding of the units at lintel courses at
West wall likely due to hinging action at upper mid section of the out-of-plane
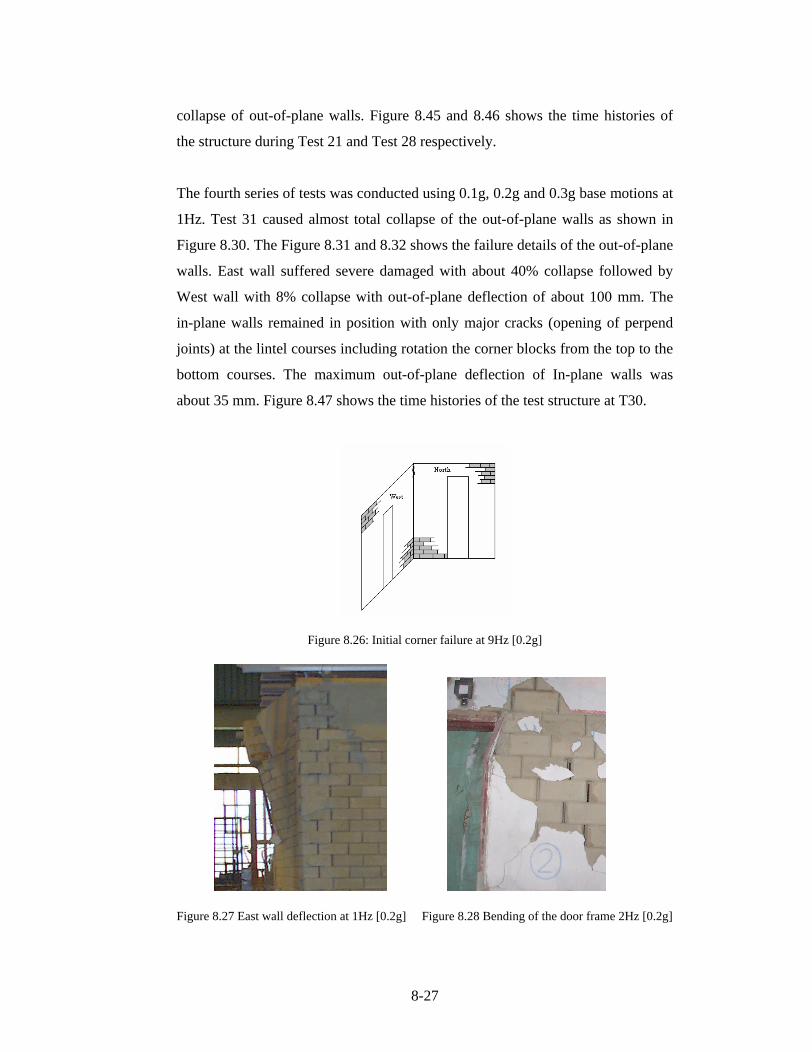
walls, initial failure of the corner connecting West and North walls (Fig. 8.26).
The hinging action of the out-of plane walls captured during the test is quite
visible (Fig.8.27). Test 28 at 2Hz was very destructive resulting into bending of
the door frame in West wall (Fig. 8.28). Test 30 at 1Hz caused very destructive
out-of plane displacement of the East and West walls with maximum deflection of
about 62 mm recorded at the top of West wall.
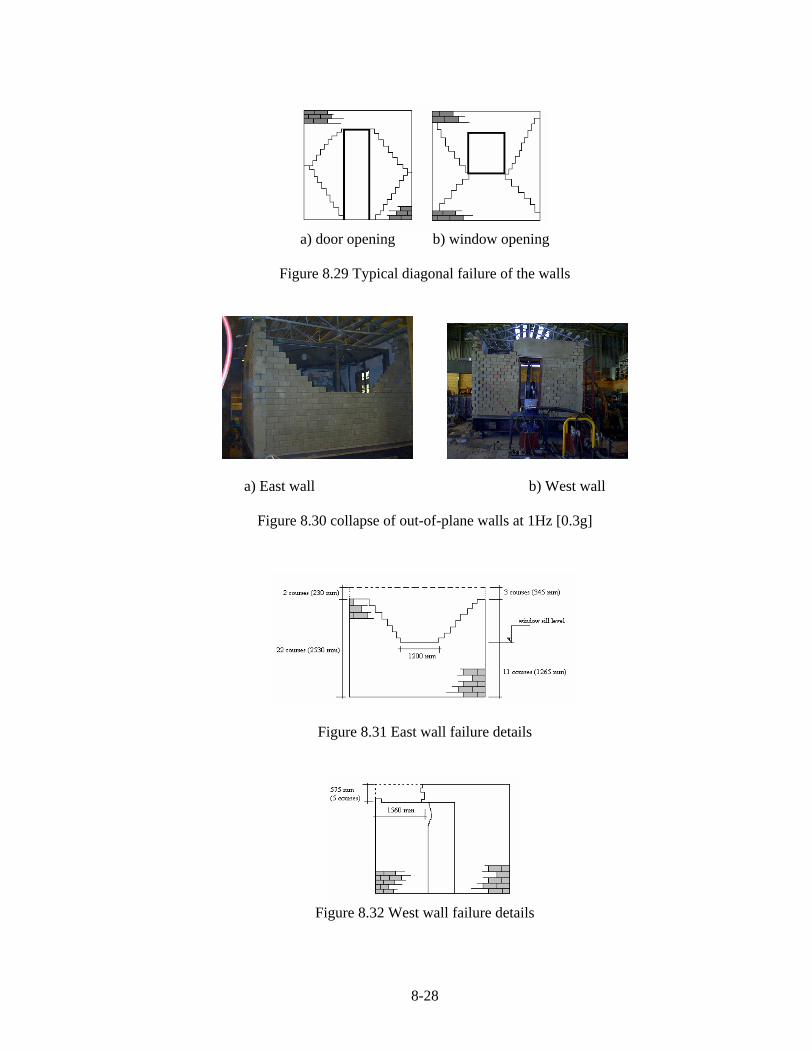
It was observed that the diagonal failure of the dry-stack masonry walls occurred
mainly by the opening of the perpend dry-stack joints and not through units
failure. Figure 8.29 shows the typical diagonal failure pattern before partial
8-27
collapse of out-of-plane walls. Figure 8.45 and 8.46 shows the time histories of
the structure during Test 21 and Test 28 respectively.
The fourth series of tests was conducted using 0.1g, 0.2g and 0.3g base motions at
1Hz. Test 31 caused almost total collapse of the out-of-plane walls as shown in
Figure 8.30. The Figure 8.31 and 8.32 shows the failure details of the out-of-plane
walls. East wall suffered severe damaged with about 40% collapse followed by
West wall with 8% collapse with out-of-plane deflection of about 100 mm. The
in-plane walls remained in position with only major cracks (opening of perpend
joints) at the lintel courses including rotation the corner blocks from the top to the
bottom courses. The maximum out-of-plane deflection of In-plane walls was
about 35 mm. Figure 8.47 shows the time histories of the test structure at T30.
Figure 8.26: Initial corner failure at 9Hz [0.2g]
Figure 8.27 East wall deflection at 1Hz [0.2g] Figure 8.28 Bending of the door frame 2Hz [0.2g]
8-28
a) door opening b) window opening
Figure 8.29 Typical diagonal failure of the walls
a) East wall b) West wall
Figure 8.30 collapse of out-of-plane walls at 1Hz [0.3g]
Figure 8.31 East wall failure details
Figure 8.32 West wall failure details
8-29
The dry stack masonry exhibited some flexibility and therefore exhibits some
vibratory response mechanism. The significant aspect of these mechanisms is that
the applied table motions were amplified by the structural response so that peak
acceleration recorded at the top of wall were much greater than input acceleration.
This phenomenon is well reflected in Table 8.6 and 8.7 columns 8, 9, and 13.
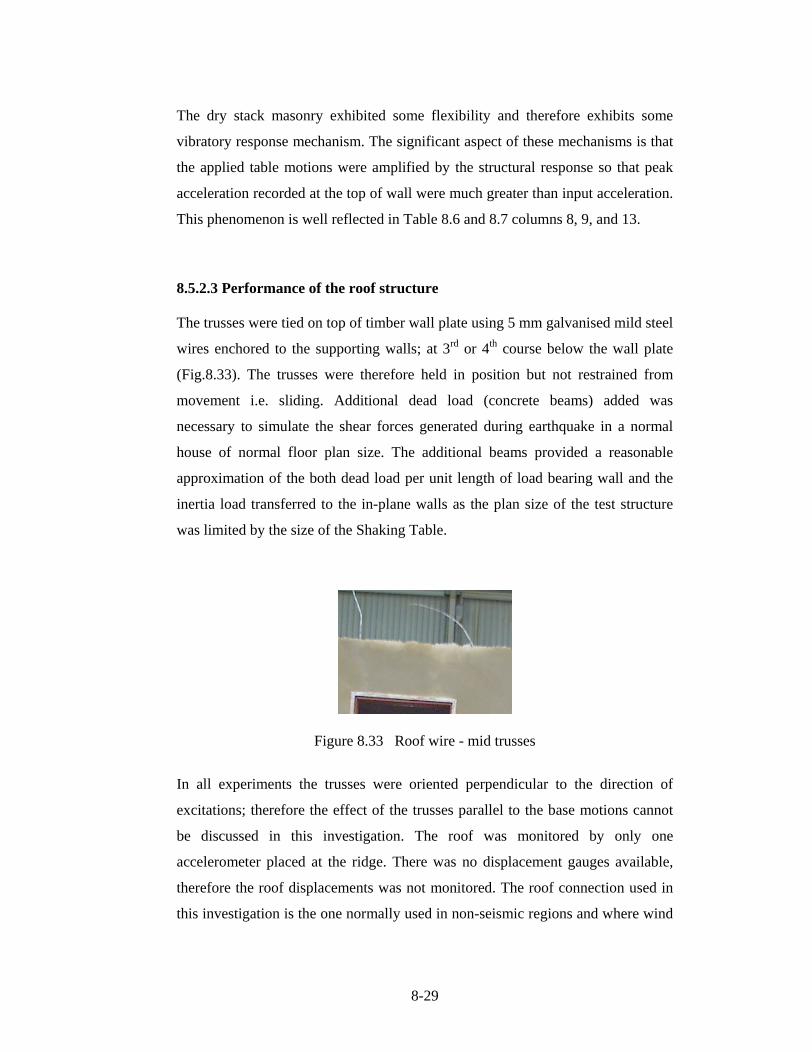
8.5.2.3 Performance of the roof structure
The trusses were tied on top of timber wall plate using 5 mm galvanised mild steel
wires enchored to the supporting walls; at 3rd or 4th course below the wall plate
(Fig.8.33). The trusses were therefore held in position but not restrained from
movement i.e. sliding. Additional dead load (concrete beams) added was
necessary to simulate the shear forces generated during earthquake in a normal
house of normal floor plan size. The additional beams provided a reasonable
approximation of the both dead load per unit length of load bearing wall and the
inertia load transferred to the in-plane walls as the plan size of the test structure
was limited by the size of the Shaking Table.
Figure 8.33 Roof wire - mid trusses
In all experiments the trusses were oriented perpendicular to the direction of
excitations; therefore the effect of the trusses parallel to the base motions cannot
be discussed in this investigation. The roof was monitored by only one
accelerometer placed at the ridge. There was no displacement gauges available,
therefore the roof displacements was not monitored. The roof connection used in
this investigation is the one normally used in non-seismic regions and where wind
8-30
load is considered to be normal for single story houses. Roof connection using
wires is considered to be technically and economically viable in low cost housing
projects; cheap and easy to install and structurally sound. In this investigation this
type of roof connection was assumed to simulate the worst scenario, and the
results obtained will in future be used in the development of appropriate roof
connection for seismic condition.
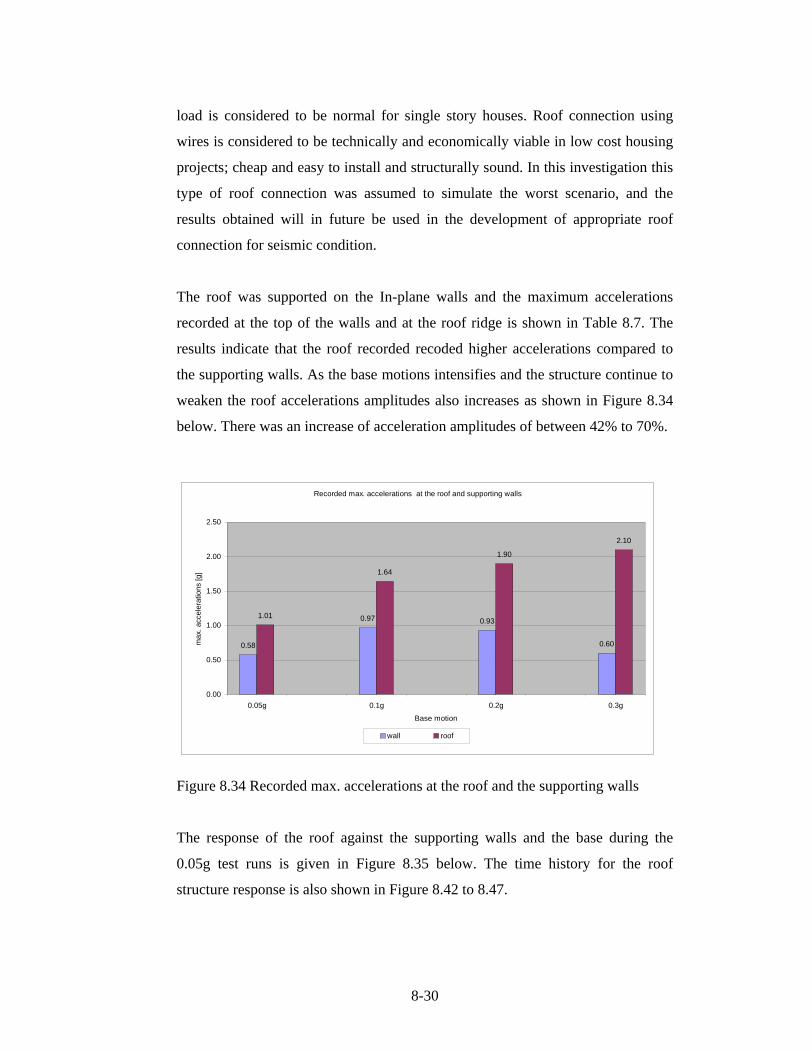
The roof was supported on the In-plane walls and the maximum accelerations
recorded at the top of the walls and at the roof ridge is shown in Table 8.7. The
results indicate that the roof recorded recoded higher accelerations compared to
the supporting walls. As the base motions intensifies and the structure continue to
weaken the roof accelerations amplitudes also increases as shown in Figure 8.34
below. There was an increase of acceleration amplitudes of between 42% to 70%.
Recorded max. accelerations at the roof and supporting walls
0.58
0.97 0.93
0.60
1.01
1.64
1.90
2.10
0.00
0.50
1.00
1.50
2.00
2.50
0.05g 0.1g 0.2g 0.3g
Base motion
max
. acc
eler
atio
ns [g
]
wall roof
Figure 8.34 Recorded max. accelerations at the roof and the supporting walls
The response of the roof against the supporting walls and the base during the
0.05g test runs is given in Figure 8.35 below. The time history for the roof
structure response is also shown in Figure 8.42 to 8.47.

8-31
Peak accelerations House 1 at 0.05g
0
0.2
0.4
0.6
0.8
1
1.2
0 1 2 3 4 5 6 7 8 9 10 11
Frequency [Hz]
peak
acc
eler
atio
n [g
]
Noth wall South wall Table roof
Figure 8.35 Roof response against the base and the supporting walls
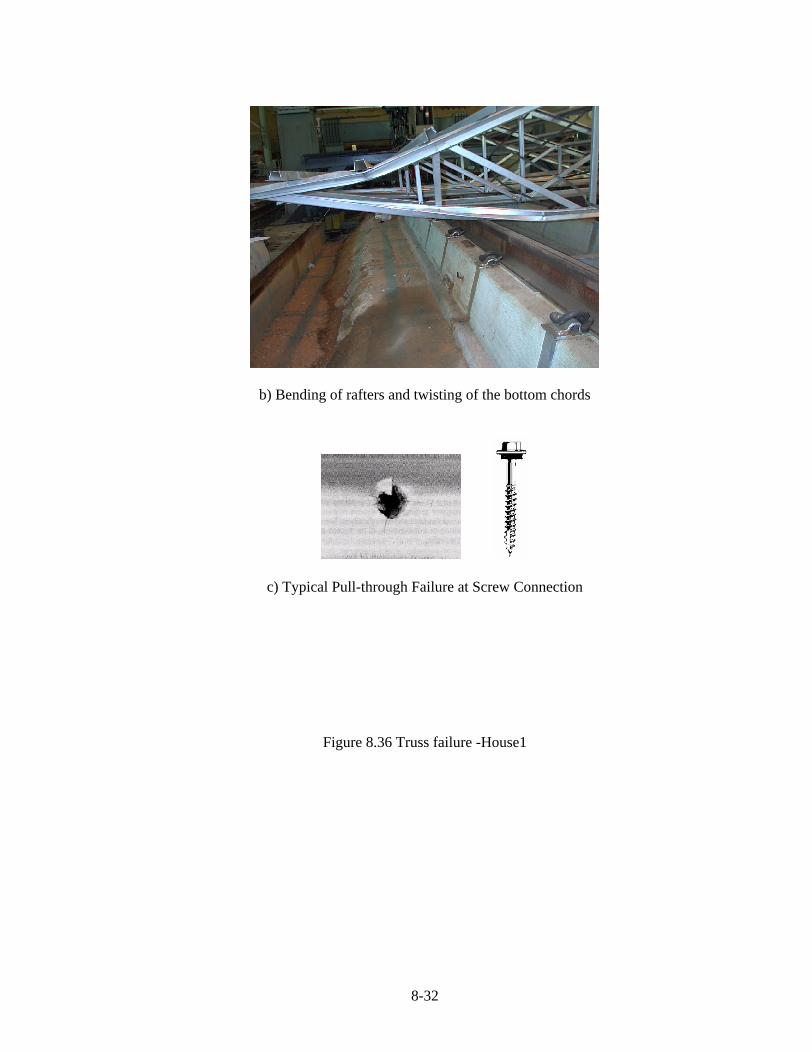
The roof structure was relatively flexible and bracing provided between the
trusses was not adequate. The roof failed by bending and twisting of the rafters
and the bottom cords of the trusses; buckling of the lateral braces and shear failure
of the connections where the screw threads were weakened due to fatigue as
shown in Figure 8.36 below.
a) Bending of the truss
8-32
b) Bending of rafters and twisting of the bottom chords
c) Typical Pull-through Failure at Screw Connection
Figure 8.36 Truss failure -House1
8-33
8.5.3 Natural frequency of the test structure - House 1
Normally in conventional masonry the magnitude of building response, that is the
acceleration, which it undergoes, depends primarily upon the frequencies of the
input ground motion and the building s natural frequency (Tena, 1992, Clough et
al, 1979). When these are near or equal to one another, the building s response
reaches peak level. In some circumstances, this dynamic amplification
effect
can increase the building acceleration to a value much greater than the
acceleration at the base of the building. This phenomenon was also observed in
dry-stack masonry tested as reflected in Table 8.6 and 8.7.
The relation between frequency f and period T is given by T = 1/ f. Fundamental
period T is an inherent property of a building, any alterations made to the building
will change its T. This phenomena was also observed in dry-stack masonry tests
as the structure continue to weaken due to structural damage the fundamental
frequency also changes and hence the period.
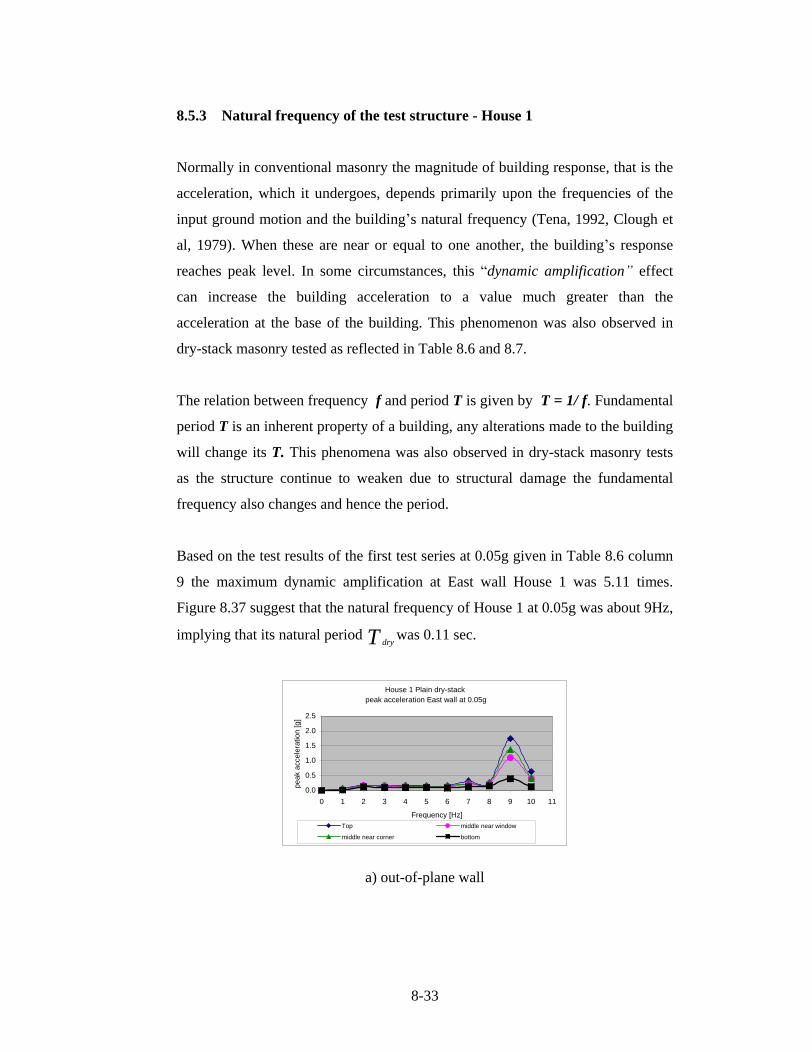
Based on the test results of the first test series at 0.05g given in Table 8.6 column
9 the maximum dynamic amplification at East wall House 1 was 5.11 times.
Figure 8.37 suggest that the natural frequency of House 1 at 0.05g was about 9Hz,
implying that its natural period T drywas 0.11 sec.
House 1 Plain dry-stack peak acceleration East wall at 0.05g
0.0
0.5
1.0
1.5
2.0
2.5
0 1 2 3 4 5 6 7 8 9 10 11
Frequency [Hz]
peak
acc
eler
atio
n [g
]
Top middle near window
middle near corner bottom
a) out-of-plane wall
8-34
House 1 Plain dry-stack
peak acceleration North wall at 0.05g
0.0
0.5
1.0
1.5
2.0
2.5
0 1 2 3 4 5 6 7 8 9 10 11
Frequency [Hz]
peak
acc
eler
atio
n [g
]
Top middle near corner middle near door
b) In-plane wall
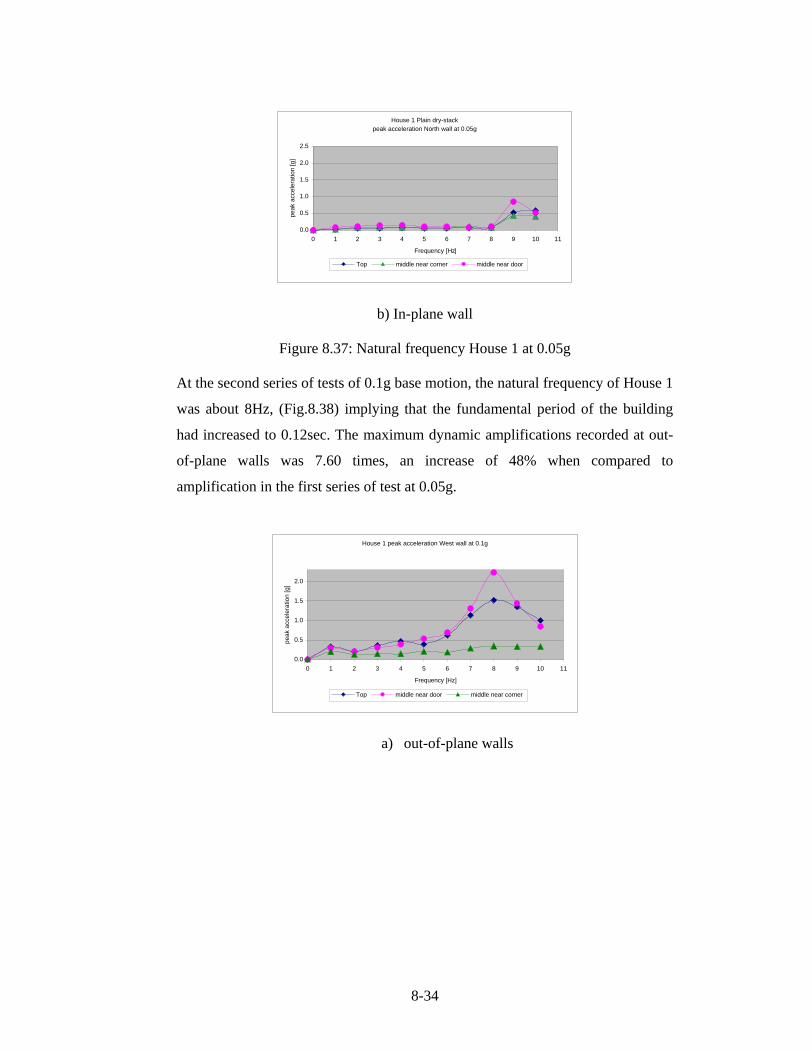
Figure 8.37: Natural frequency House 1 at 0.05g
At the second series of tests of 0.1g base motion, the natural frequency of House 1
was about 8Hz, (Fig.8.38) implying that the fundamental period of the building
had increased to 0.12sec. The maximum dynamic amplifications recorded at out-
of-plane walls was 7.60 times, an increase of 48% when compared to
amplification in the first series of test at 0.05g.
House 1 peak acceleration West wall at 0.1g
0.0
0.5
1.0
1.5
2.0
0 1 2 3 4 5 6 7 8 9 10 11
Frequency [Hz]
peak
acc
eler
atio
n [g
]
Top middle near door middle near corner
a) out-of-plane walls

8-35
House 1 North wall peak acceleration at 0.1g
0.0
0.5
1.0
1.5
2.0
0 1 2 3 4 5 6 7 8 9 10 11Frequency [Hz]
peak
acc
eler
atio
n [g
]
Top middle near corner middle nead door
b) In-plane walls
Figure 8.38: Natural frequency House 1 at 0.1g
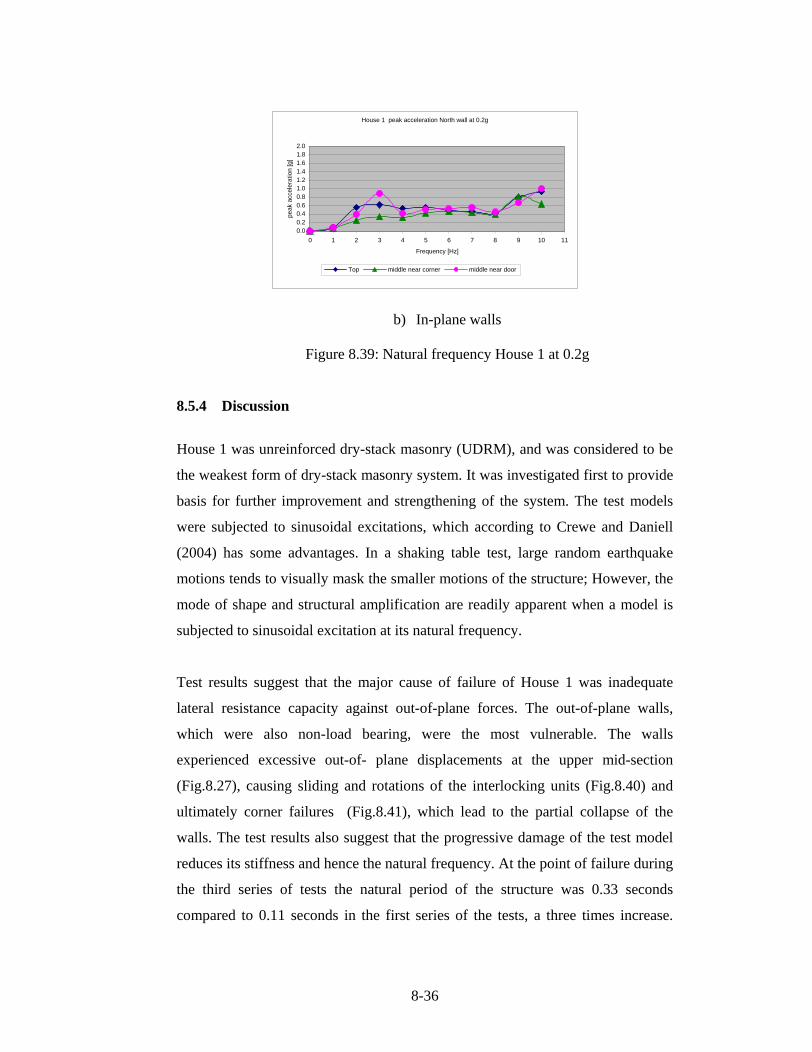
In the third series of tests at a constant base motion of 0.2g, the test structure
recorded almost random vibration at different levels (Fig. 8.39) likely due to the
progressive damages from the previous tests. From the test results the natural
frequency of House 1 at 0.2g could be estimated to be about 3Hz, implying that
the fundamental period was 0.33 seconds, three times the period of the structure at
0.05g the first test series. In the final experiments the maximum dynamic
amplifications was 8.37, which was recorded at West wall. This was an increase
of 63% compared to the first experiments before the test structure was damaged. .
House 1 peak acceleration East wall at 0.2g
0.0
0.2
0.4
0.6
0.8
1.0
1.2
1.4
1.6
1.8
2.0
0 1 2 3 4 5 6 7 8 9 10 11Frequency [Hz]
peak
acc
eler
atio
n [g
]
Top middle near window middle near corner bottom
a) out-of-plane walls
8-36
House 1 peak acceleration North wall at 0.2g
0.00.20.40.60.81.01.21.41.61.82.0
0 1 2 3 4 5 6 7 8 9 10 11
Frequency [Hz]
peak
acc
eler
atio
n [g
]
Top middle near corner middle near door
b) In-plane walls
Figure 8.39: Natural frequency House 1 at 0.2g
8.5.4 Discussion
House 1 was unreinforced dry-stack masonry (UDRM), and was considered to be
the weakest form of dry-stack masonry system. It was investigated first to provide
basis for further improvement and strengthening of the system. The test models
were subjected to sinusoidal excitations, which according to Crewe and Daniell
(2004) has some advantages. In a shaking table test, large random earthquake
motions tends to visually mask the smaller motions of the structure; However, the
mode of shape and structural amplification are readily apparent when a model is
subjected to sinusoidal excitation at its natural frequency.
Test results suggest that the major cause of failure of House 1 was inadequate
lateral resistance capacity against out-of-plane forces. The out-of-plane walls,
which were also non-load bearing, were the most vulnerable. The walls
experienced excessive out-of- plane displacements at the upper mid-section
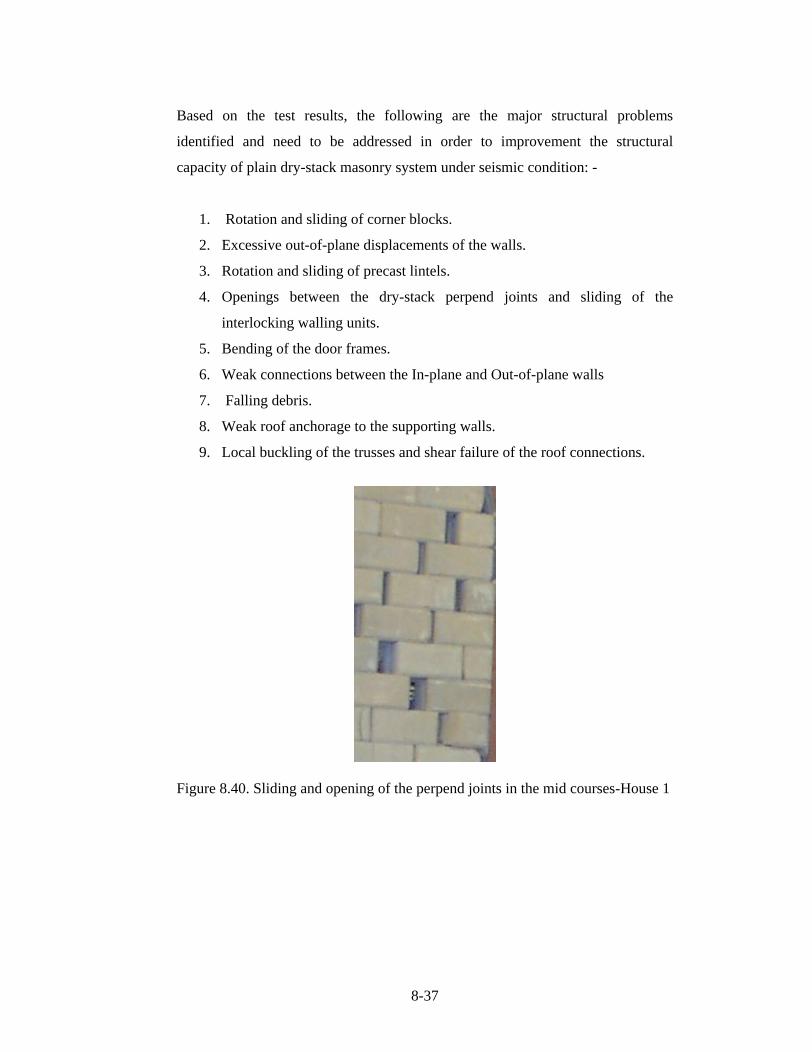
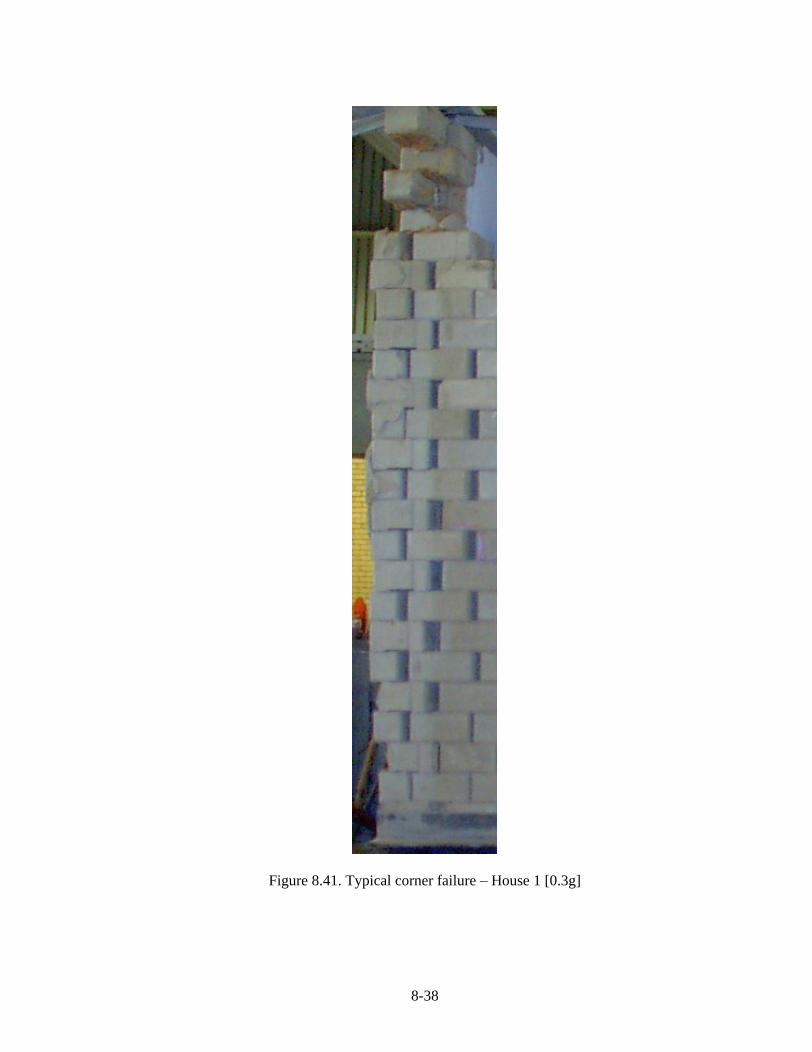
(Fig.8.27), causing sliding and rotations of the interlocking units (Fig.8.40) and
ultimately corner failures (Fig.8.41), which lead to the partial collapse of the
walls. The test results also suggest that the progressive damage of the test model
reduces its stiffness and hence the natural frequency. At the point of failure during
the third series of tests the natural period of the structure was 0.33 seconds
compared to 0.11 seconds in the first series of the tests, a three times increase.
8-37
Based on the test results, the following are the major structural problems
identified and need to be addressed in order to improvement the structural
capacity of plain dry-stack masonry system under seismic condition: -
1. Rotation and sliding of corner blocks.
2. Excessive out-of-plane displacements of the walls.
3. Rotation and sliding of precast lintels.
4. Openings between the dry-stack perpend joints and sliding of the
interlocking walling units.
5. Bending of the door frames.
6. Weak connections between the In-plane and Out-of-plane walls
7. Falling debris.
8. Weak roof anchorage to the supporting walls.
9. Local buckling of the trusses and shear failure of the roof connections.
Figure 8.40. Sliding and opening of the perpend joints in the mid courses-House 1
8-38
Figure 8.41. Typical corner failure House 1 [0.3g]

8-39
8-40
8-41
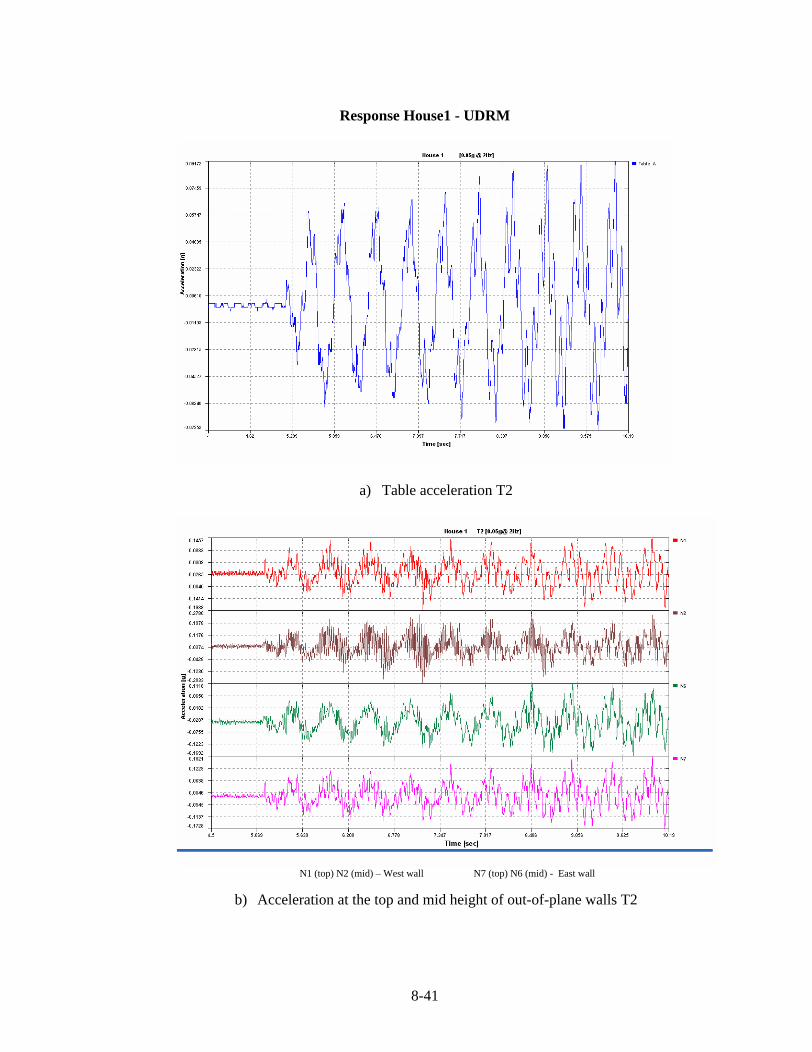
Response House1 - UDRM
a) Table acceleration T2
N1 (top) N2 (mid) West wall N7 (top) N6 (mid) - East wall
b) Acceleration at the top and mid height of out-of-plane walls T2
8-42
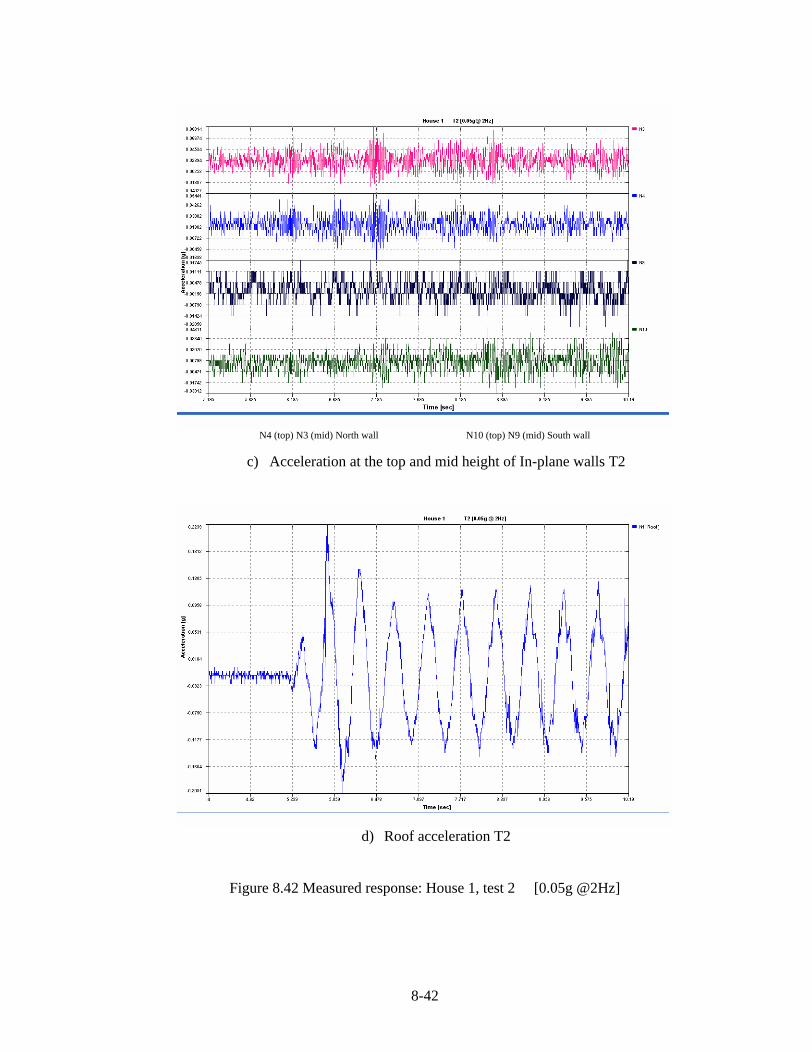
N4 (top) N3 (mid) North wall N10 (top) N9 (mid) South wall
c) Acceleration at the top and mid height of In-plane walls T2
d) Roof acceleration T2
Figure 8.42 Measured response: House 1, test 2 [0.05g @2Hz]
8-43
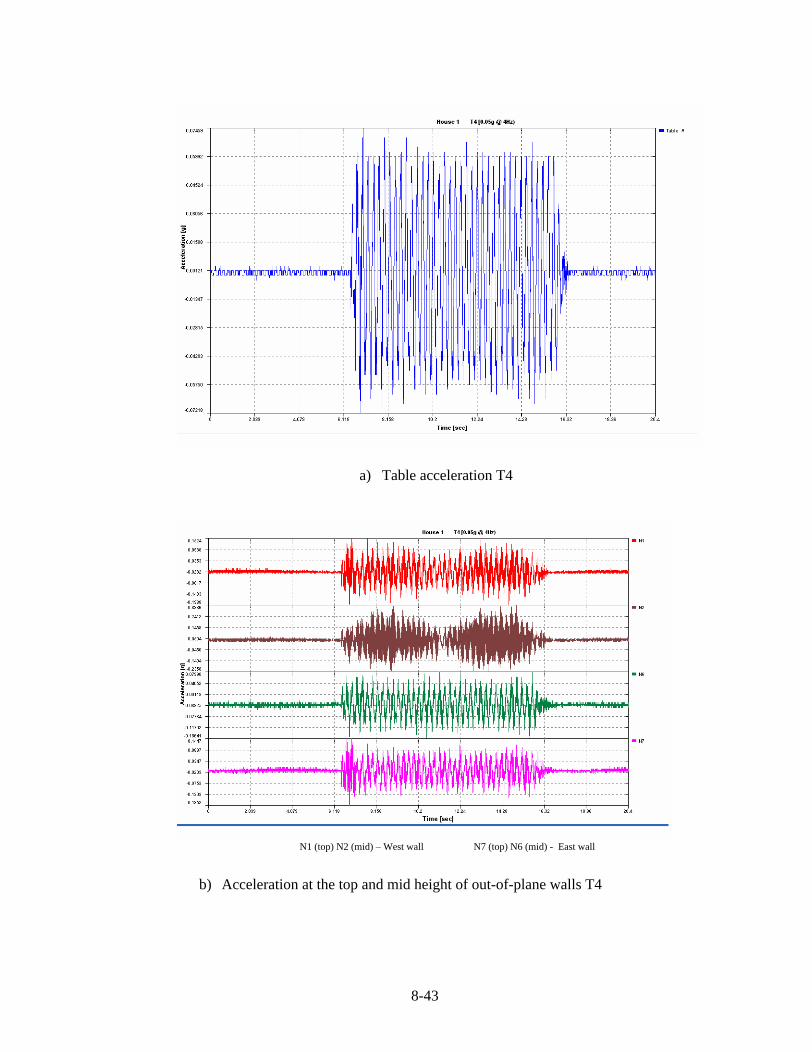
a) Table acceleration T4
N1 (top) N2 (mid) West wall N7 (top) N6 (mid) - East wall
b) Acceleration at the top and mid height of out-of-plane walls T4
8-44
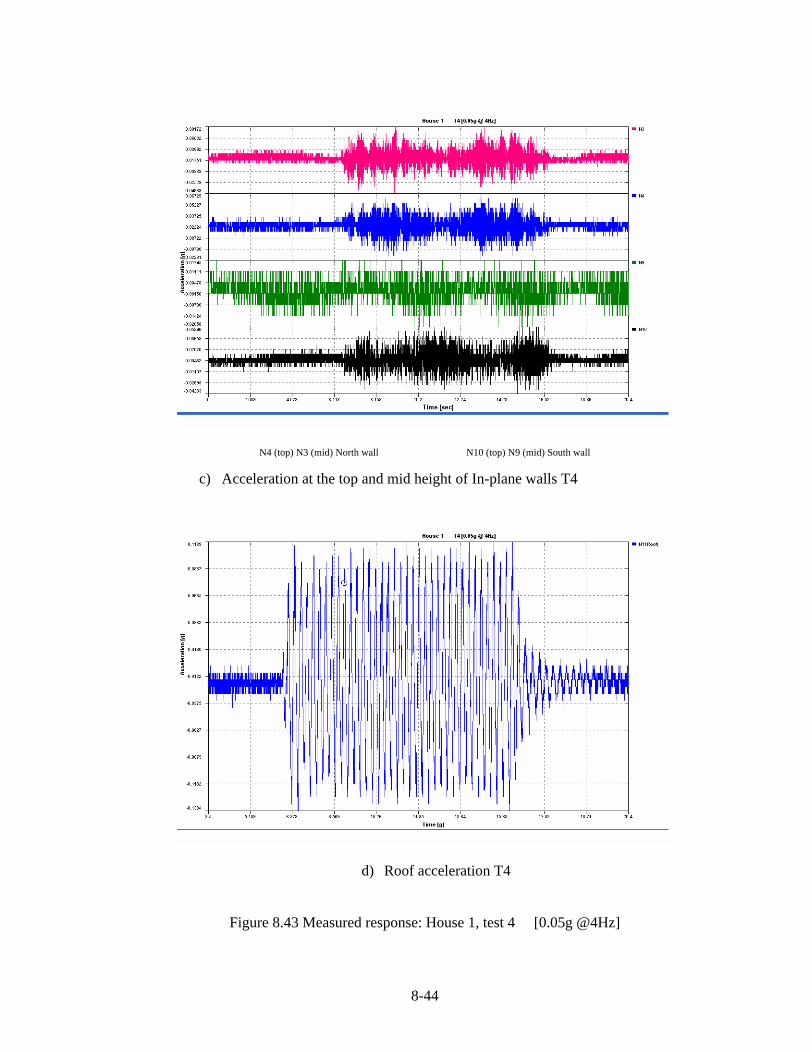
N4 (top) N3 (mid) North wall N10 (top) N9 (mid) South wall
c) Acceleration at the top and mid height of In-plane walls T4
d) Roof acceleration T4
Figure 8.43 Measured response: House 1, test 4 [0.05g @4Hz]
8-45
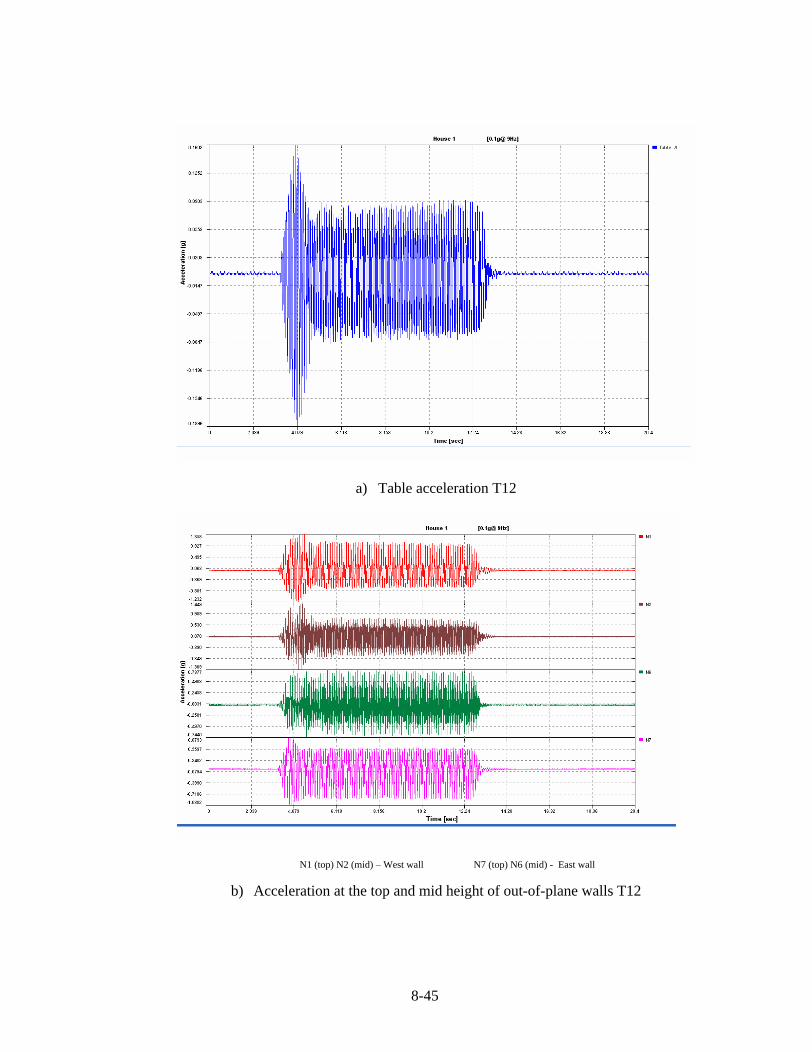
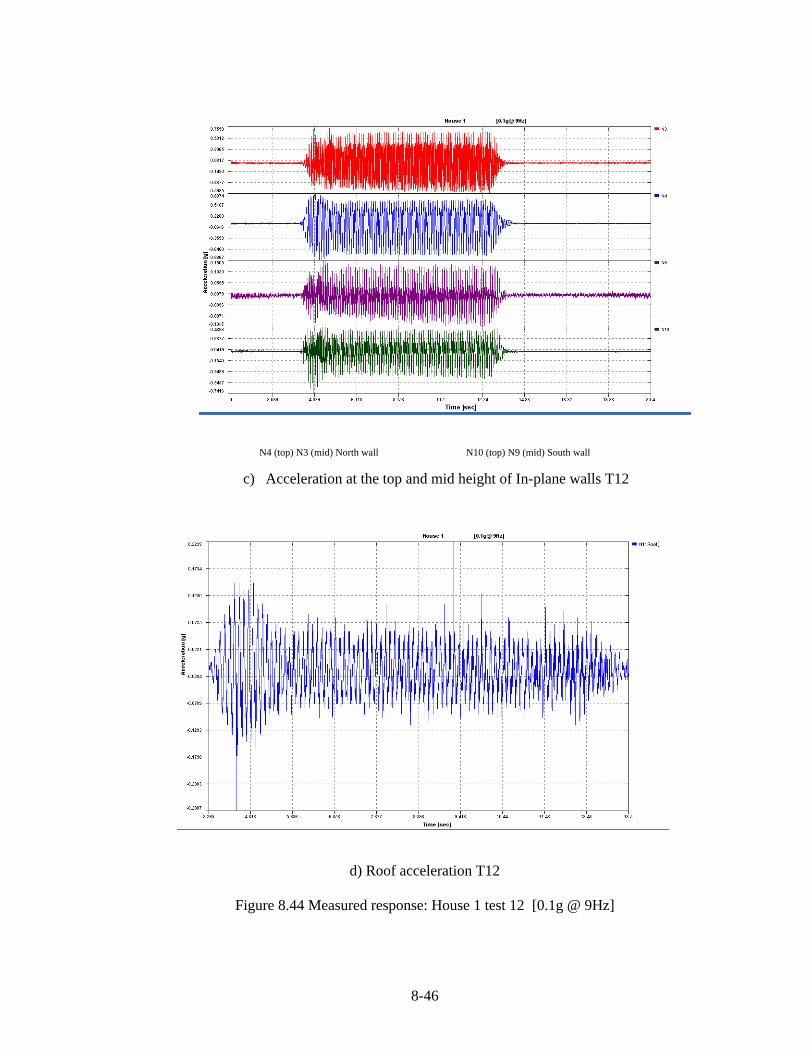
a) Table acceleration T12
N1 (top) N2 (mid) West wall N7 (top) N6 (mid) - East wall
b) Acceleration at the top and mid height of out-of-plane walls T12
8-46
N4 (top) N3 (mid) North wall N10 (top) N9 (mid) South wall
c) Acceleration at the top and mid height of In-plane walls T12
d) Roof acceleration T12
Figure 8.44 Measured response: House 1 test 12 [0.1g @ 9Hz]
8-47
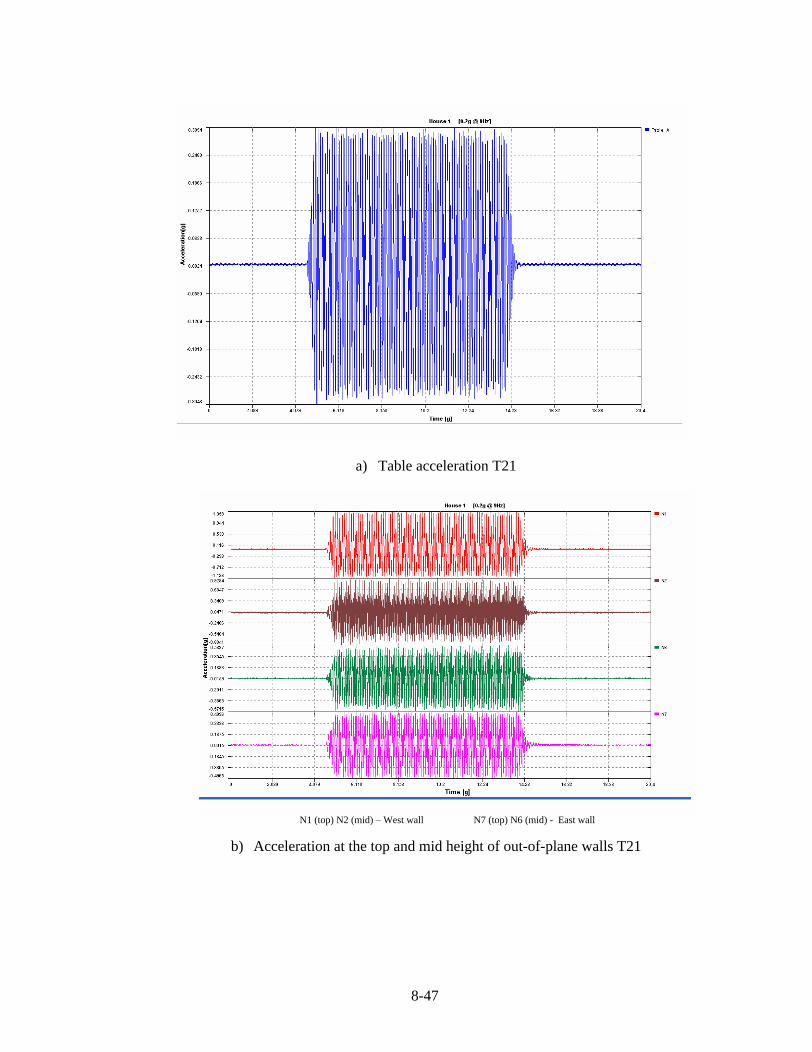
a) Table acceleration T21
N1 (top) N2 (mid) West wall N7 (top) N6 (mid) - East wall
b) Acceleration at the top and mid height of out-of-plane walls T21

8-48
N4 (top) N3 (mid) North wall N10 (top) N9 (mid) South wall
c) Acceleration at the top and mid height of In-plane walls T21
d) Roof acceleration T21
Figure 8.45 Measured response: House 1, test 21 [0.2g@ 9Hz]
8-49
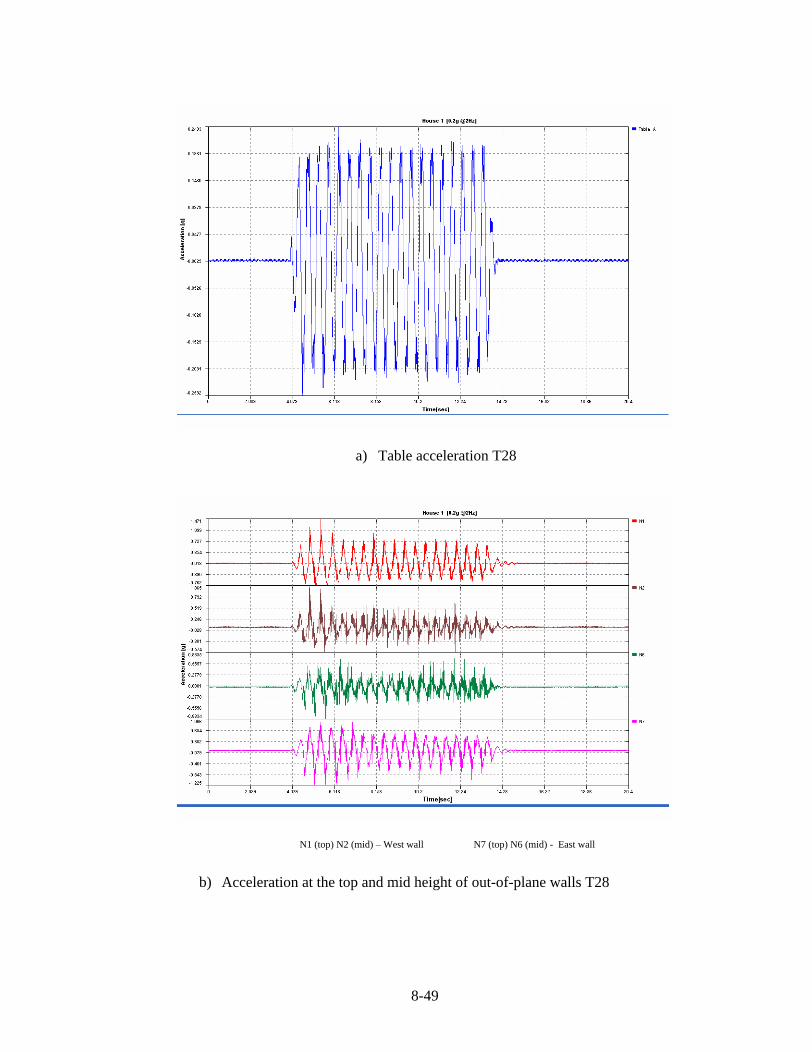
a) Table acceleration T28
N1 (top) N2 (mid) West wall N7 (top) N6 (mid) - East wall
b) Acceleration at the top and mid height of out-of-plane walls T28

8-50
N4 (top) N3 (mid) North wall N10 (top) N9 (mid) South wall
c) Acceleration at the top and mid height of In-plane walls T28
d) Roof acceleration T28
Figure 8.46 Measured response: House 1, test 28 [0.2g @ 2Hz]
8-51
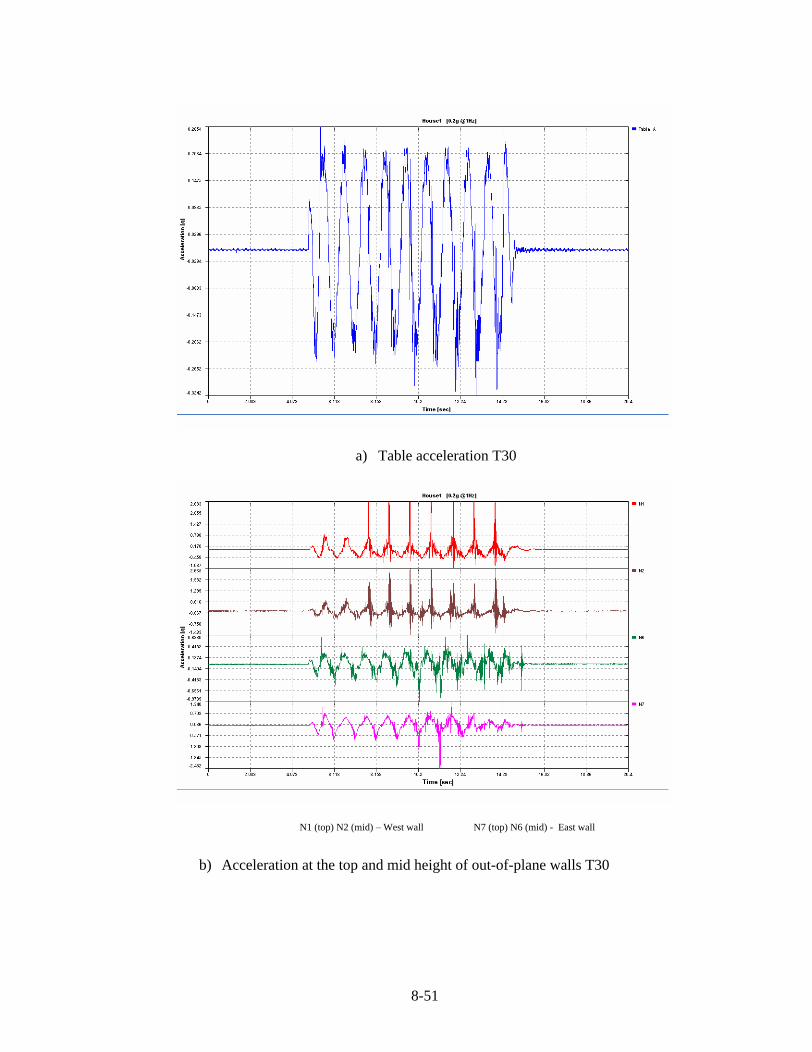
a) Table acceleration T30
N1 (top) N2 (mid) West wall N7 (top) N6 (mid) - East wall
b) Acceleration at the top and mid height of out-of-plane walls T30

8-52
N4 (top) N3 (mid) North wall N10 (top) N9 (mid) South wall
c) Acceleration at the top and mid height of In-plane walls T30
d) Roof acceleration T30
Figure 8.47 Measured response: House 1, test 30 [0.2g @ 1Hz]
8-53
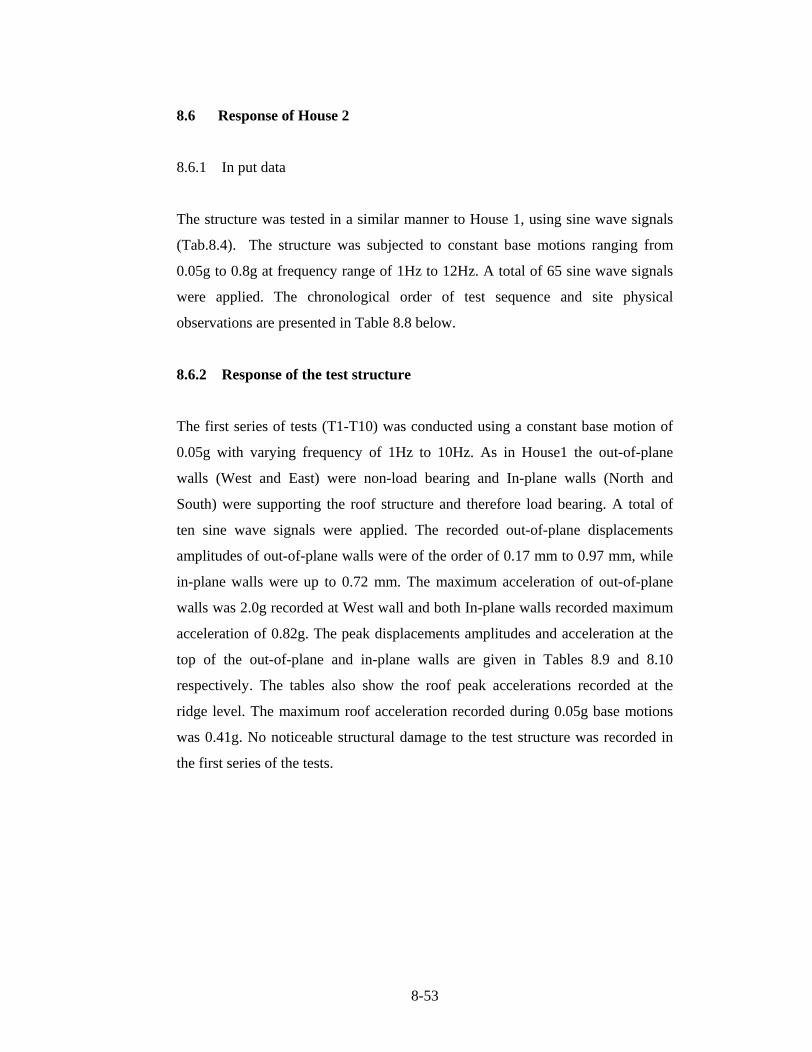
8.6 Response of House 2
8.6.1 In put data
The structure was tested in a similar manner to House 1, using sine wave signals
(Tab.8.4). The structure was subjected to constant base motions ranging from
0.05g to 0.8g at frequency range of 1Hz to 12Hz. A total of 65 sine wave signals
were applied. The chronological order of test sequence and site physical
observations are presented in Table 8.8 below.
8.6.2 Response of the test structure
The first series of tests (T1-T10) was conducted using a constant base motion of
0.05g with varying frequency of 1Hz to 10Hz. As in House1 the out-of-plane
walls (West and East) were non-load bearing and In-plane walls (North and
South) were supporting the roof structure and therefore load bearing. A total of
ten sine wave signals were applied. The recorded out-of-plane displacements
amplitudes of out-of-plane walls were of the order of 0.17 mm to 0.97 mm, while
in-plane walls were up to 0.72 mm. The maximum acceleration of out-of-plane
walls was 2.0g recorded at West wall and both In-plane walls recorded maximum
acceleration of 0.82g. The peak displacements amplitudes and acceleration at the
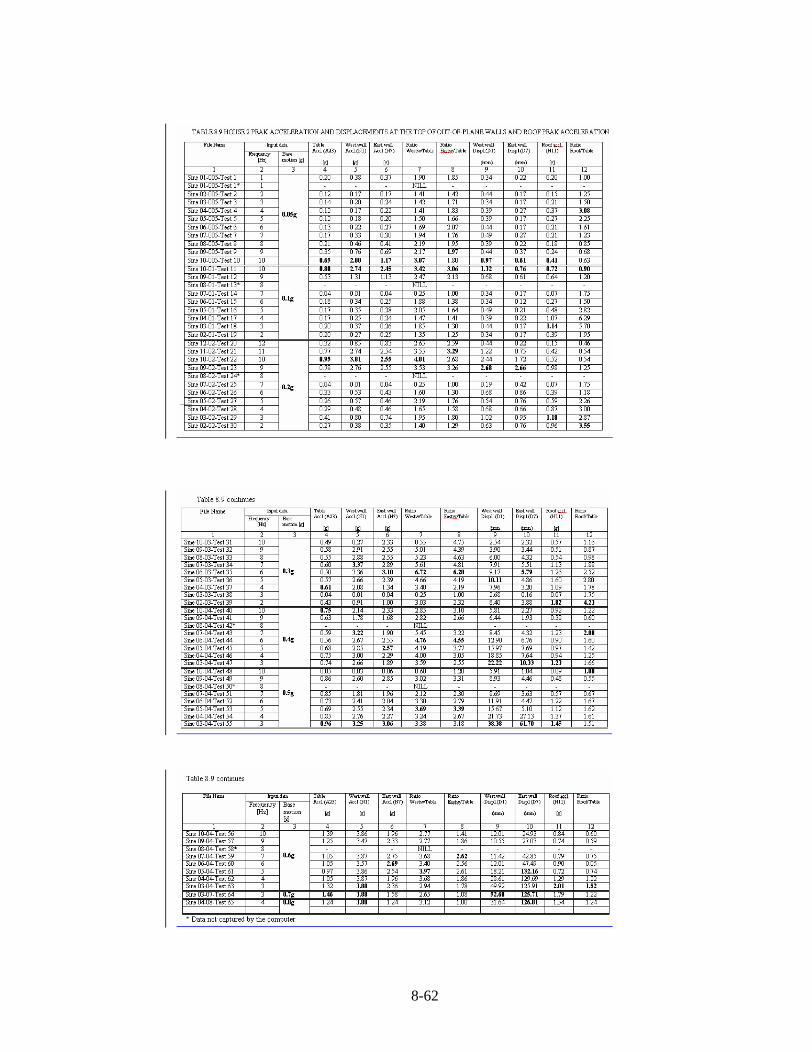
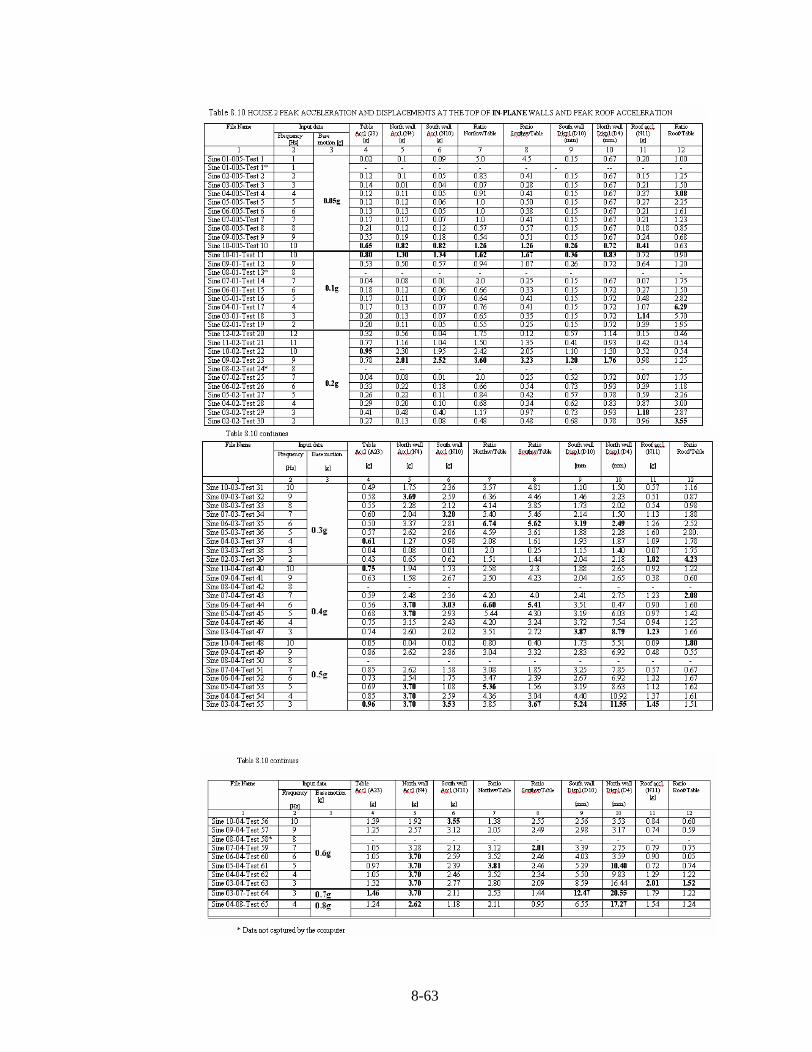
top of the out-of-plane and in-plane walls are given in Tables 8.9 and 8.10
respectively. The tables also show the roof peak accelerations recorded at the
ridge level. The maximum roof acceleration recorded during 0.05g base motions
was 0.41g. No noticeable structural damage to the test structure was recorded in
the first series of the tests.
8-54
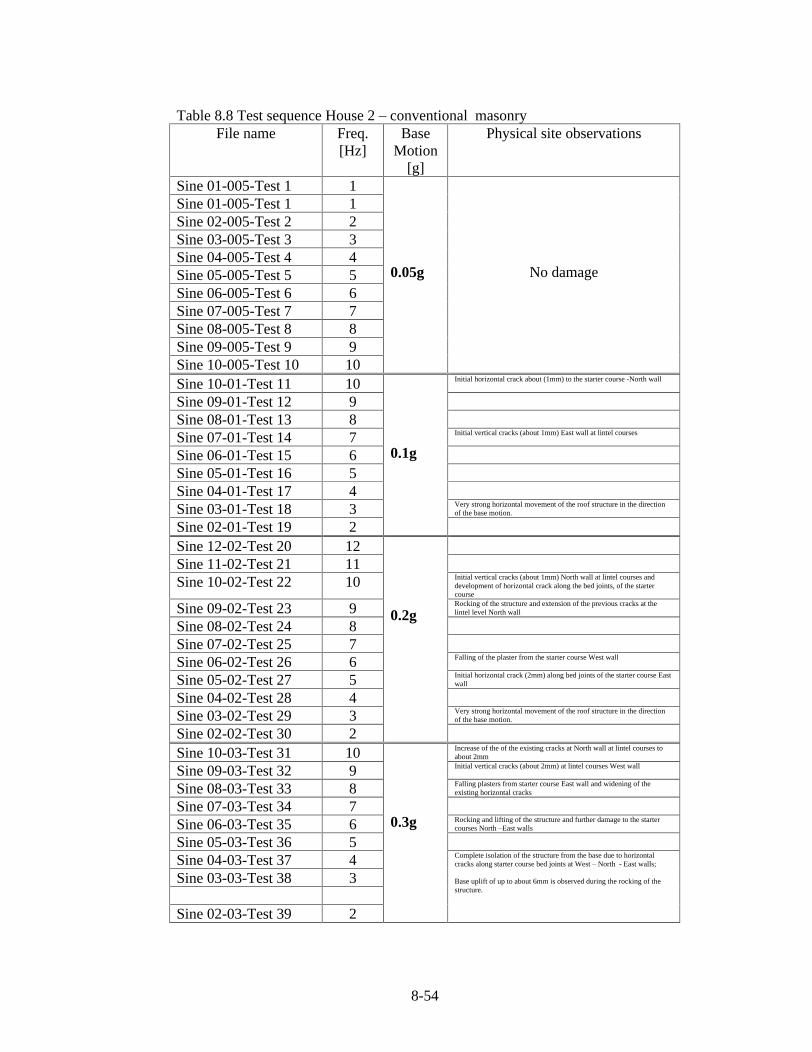
Table 8.8 Test sequence House 2 conventional masonry
File name Freq. [Hz]
Base Motion
[g]
Physical site observations
Sine 01-005-Test 1 1 Sine 01-005-Test 1 1 Sine 02-005-Test 2 2 Sine 03-005-Test 3 3 Sine 04-005-Test 4 4 Sine 05-005-Test 5 5 Sine 06-005-Test 6 6 Sine 07-005-Test 7 7 Sine 08-005-Test 8 8 Sine 09-005-Test 9 9 Sine 10-005-Test 10 10
0.05g No damage
Sine 10-01-Test 11 10 Initial horizontal crack about (1mm) to the starter course -North wall
Sine 09-01-Test 12 9 Sine 08-01-Test 13 8 Sine 07-01-Test 14 7 Initial vertical cracks (about 1mm) East wall at lintel courses
Sine 06-01-Test 15 6 Sine 05-01-Test 16 5 Sine 04-01-Test 17 4 Sine 03-01-Test 18 3 Very strong horizontal movement of the roof structure in the direction
of the base motion.
Sine 02-01-Test 19 2
0.1g
Sine 12-02-Test 20 12 Sine 11-02-Test 21 11 Sine 10-02-Test 22 10 Initial vertical cracks (about 1mm) North wall at lintel courses and
development of horizontal crack along the bed joints, of the starter course
Sine 09-02-Test 23 9 Rocking of the structure and extension of the previous cracks at the lintel level North wall
Sine 08-02-Test 24 8 Sine 07-02-Test 25 7 Sine 06-02-Test 26 6 Falling of the plaster from the starter course West wall
Sine 05-02-Test 27 5 Initial horizontal crack (2mm) along bed joints of the starter course East wall
Sine 04-02-Test 28 4 Sine 03-02-Test 29 3 Very strong horizontal movement of the roof structure in the direction
of the base motion.
Sine 02-02-Test 30 2
0.2g
Sine 10-03-Test 31 10 Increase of the of the existing cracks at North wall at lintel courses to about 2mm
Sine 09-03-Test 32 9 Initial vertical cracks (about 2mm) at lintel courses West wall
Sine 08-03-Test 33 8 Falling plasters from starter course East wall and widening of the existing horizontal cracks
Sine 07-03-Test 34 7 Sine 06-03-Test 35 6 Rocking and lifting of the structure and further damage to the starter
courses North East walls
Sine 05-03-Test 36 5 Sine 04-03-Test 37 4 Sine 03-03-Test 38 3
Sine 02-03-Test 39 2
0.3g
Complete isolation of the structure from the base due to horizontal cracks along starter course bed joints at West North - East walls;
Base uplift of up to about 6mm is observed during the rocking of the structure.
8-55
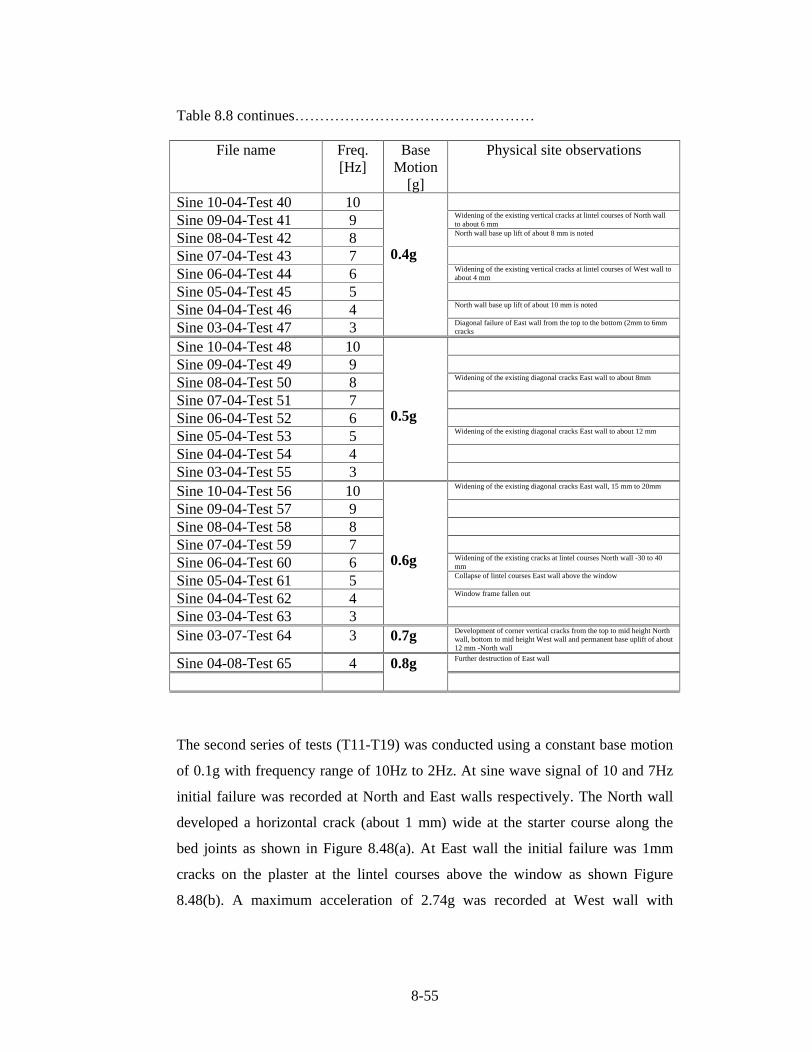
Table 8.8 continues
The second series of tests (T11-T19) was conducted using a constant base motion
of 0.1g with frequency range of 10Hz to 2Hz. At sine wave signal of 10 and 7Hz
initial failure was recorded at North and East walls respectively. The North wall
developed a horizontal crack (about 1 mm) wide at the starter course along the
bed joints as shown in Figure 8.48(a). At East wall the initial failure was 1mm
cracks on the plaster at the lintel courses above the window as shown Figure
8.48(b). A maximum acceleration of 2.74g was recorded at West wall with
File name Freq. [Hz]
Base Motion
[g]
Physical site observations
Sine 10-04-Test 40 10 Sine 09-04-Test 41 9 Widening of the existing vertical cracks at lintel courses of North wall
to about 6 mm
Sine 08-04-Test 42 8 North wall base up lift of about 8 mm is noted
Sine 07-04-Test 43 7 Sine 06-04-Test 44 6 Widening of the existing vertical cracks at lintel courses of West wall to
about 4 mm
Sine 05-04-Test 45 5 Sine 04-04-Test 46 4 North wall base up lift of about 10 mm is noted
Sine 03-04-Test 47 3
0.4g
Diagonal failure of East wall from the top to the bottom (2mm to 6mm cracks
Sine 10-04-Test 48 10 Sine 09-04-Test 49 9 Sine 08-04-Test 50 8 Widening of the existing diagonal cracks East wall to about 8mm
Sine 07-04-Test 51 7 Sine 06-04-Test 52 6 Sine 05-04-Test 53 5 Widening of the existing diagonal cracks East wall to about 12 mm
Sine 04-04-Test 54 4 Sine 03-04-Test 55 3
0.5g
Sine 10-04-Test 56 10 Widening of the existing diagonal cracks East wall, 15 mm to 20mm
Sine 09-04-Test 57 9 Sine 08-04-Test 58 8 Sine 07-04-Test 59 7 Sine 06-04-Test 60 6 Widening of the existing cracks at lintel courses North wall -30 to 40
mm
Sine 05-04-Test 61 5 Collapse of lintel courses East wall above the window
Sine 04-04-Test 62 4 Window frame fallen out
Sine 03-04-Test 63 3
0.6g
Sine 03-07-Test 64 3 0.7g Development of corner vertical cracks from the top to mid height North wall, bottom to mid height West wall and permanent base uplift of about 12 mm -North wall
Sine 04-08-Test 65 4 Further destruction of East wall
0.8g
8-56
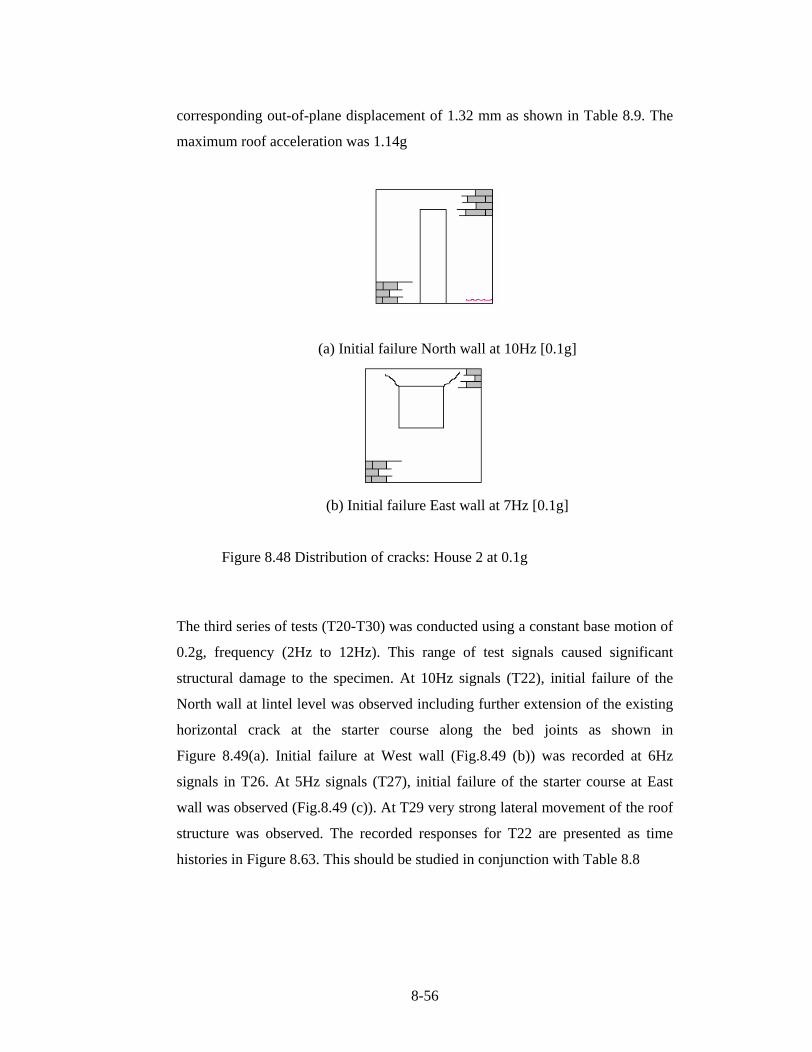
corresponding out-of-plane displacement of 1.32 mm as shown in Table 8.9. The
maximum roof acceleration was 1.14g
(a) Initial failure North wall at 10Hz [0.1g]
(b) Initial failure East wall at 7Hz [0.1g]
Figure 8.48 Distribution of cracks: House 2 at 0.1g
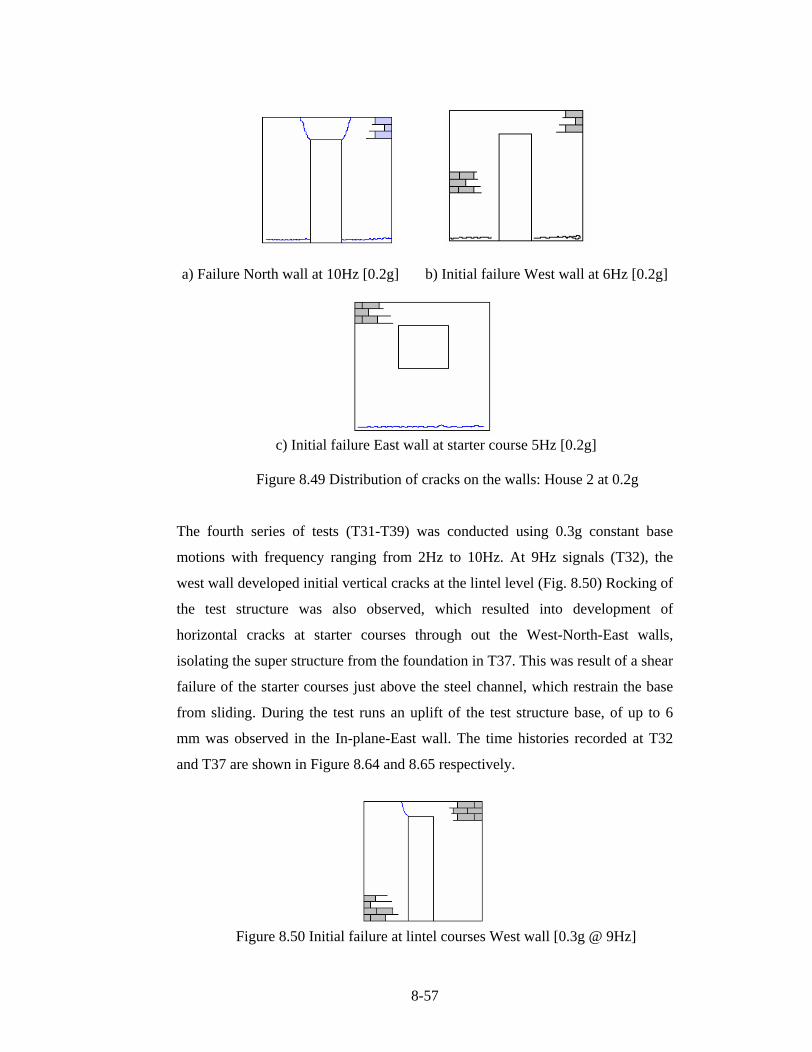
The third series of tests (T20-T30) was conducted using a constant base motion of
0.2g, frequency (2Hz to 12Hz). This range of test signals caused significant
structural damage to the specimen. At 10Hz signals (T22), initial failure of the
North wall at lintel level was observed including further extension of the existing
horizontal crack at the starter course along the bed joints as shown in
Figure 8.49(a). Initial failure at West wall (Fig.8.49 (b)) was recorded at 6Hz
signals in T26. At 5Hz signals (T27), initial failure of the starter course at East
wall was observed (Fig.8.49 (c)). At T29 very strong lateral movement of the roof
structure was observed. The recorded responses for T22 are presented as time
histories in Figure 8.63. This should be studied in conjunction with Table 8.8
8-57
a) Failure North wall at 10Hz [0.2g] b) Initial failure West wall at 6Hz [0.2g]
c) Initial failure East wall at starter course 5Hz [0.2g]
Figure 8.49 Distribution of cracks on the walls: House 2 at 0.2g
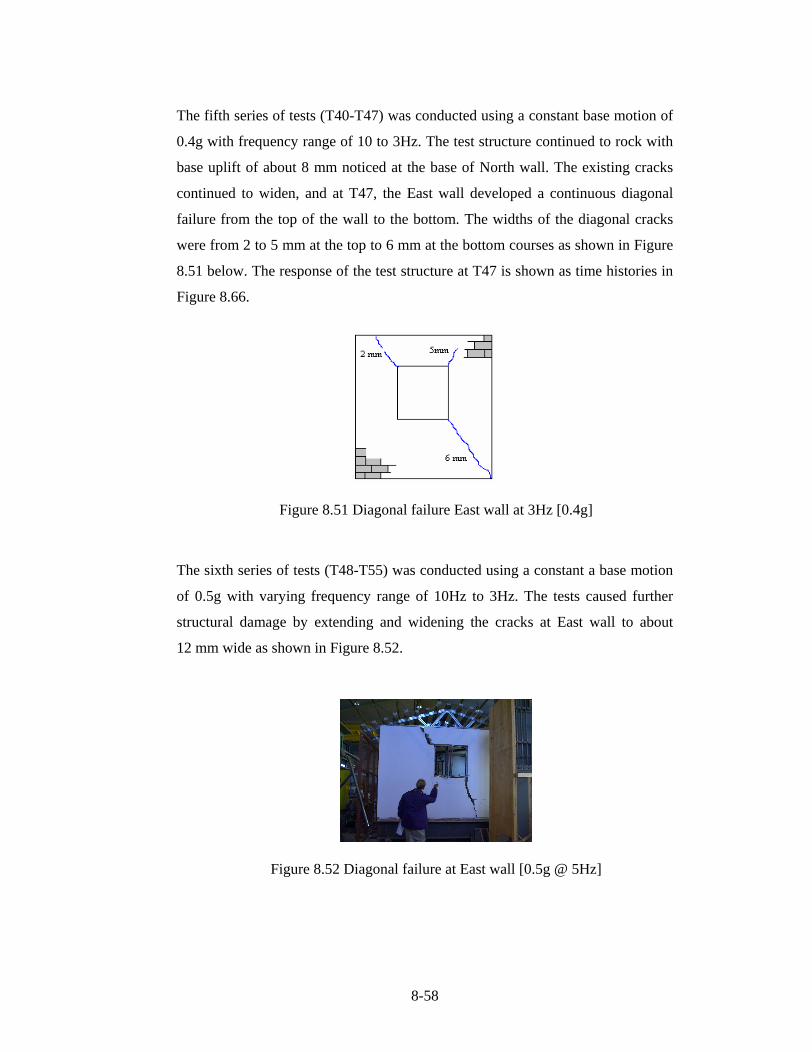
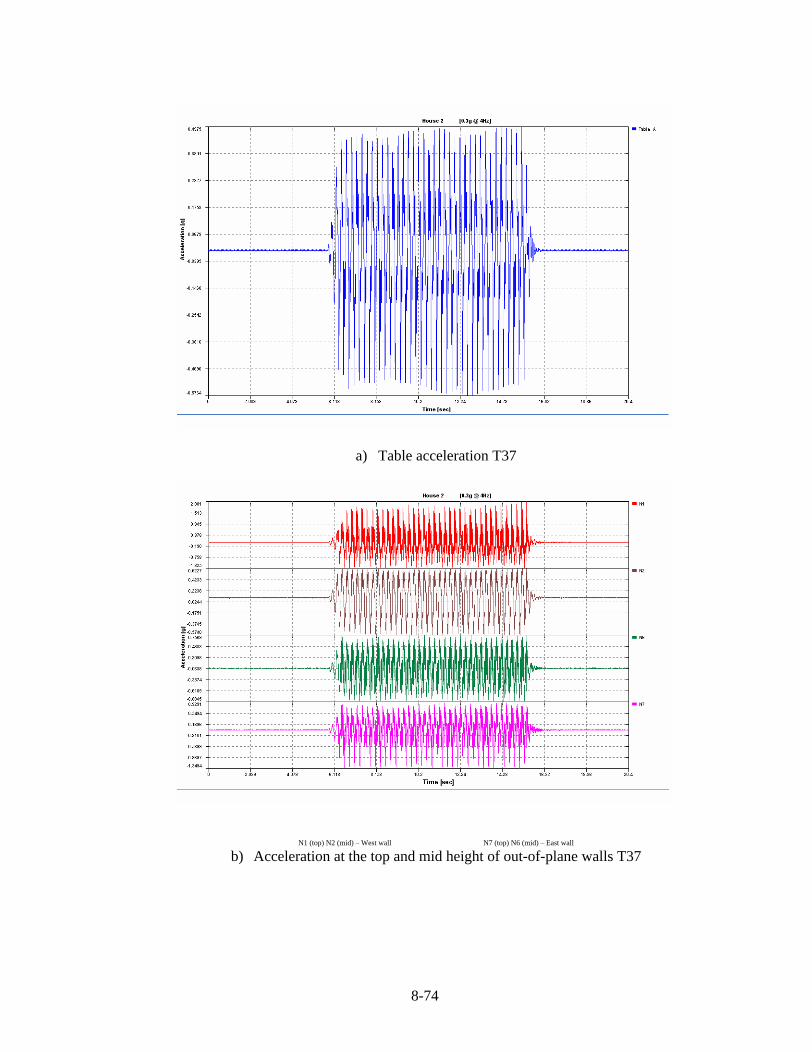
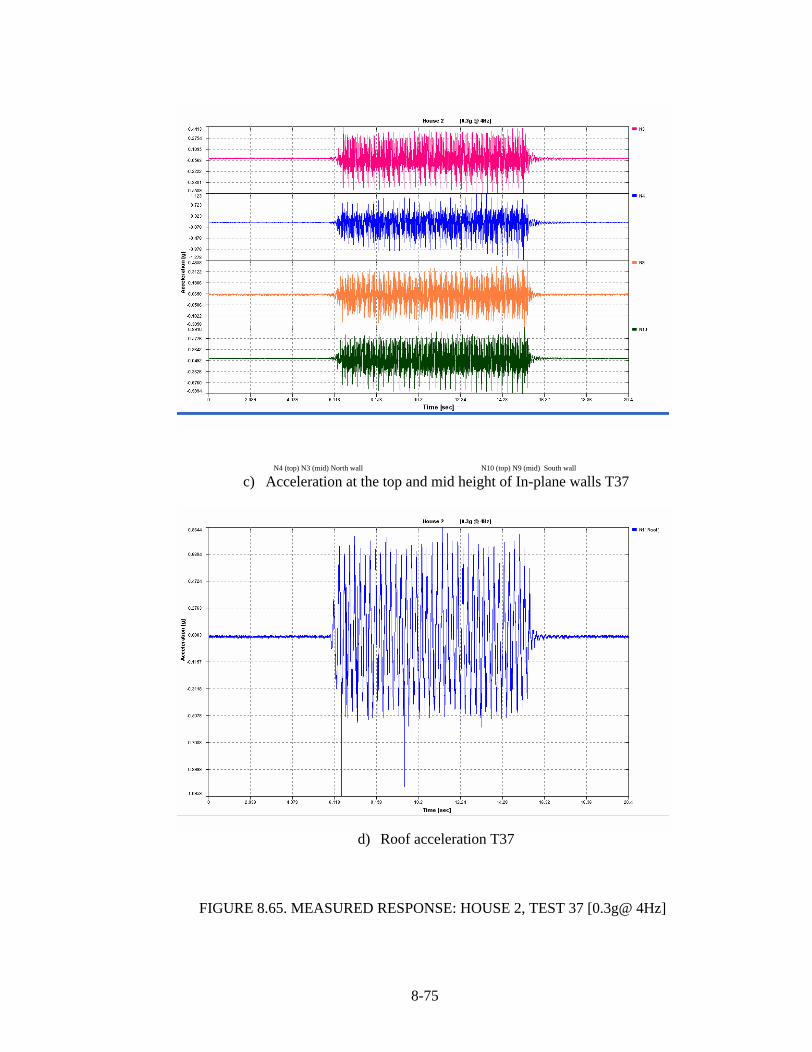
The fourth series of tests (T31-T39) was conducted using 0.3g constant base
motions with frequency ranging from 2Hz to 10Hz. At 9Hz signals (T32), the
west wall developed initial vertical cracks at the lintel level (Fig. 8.50) Rocking of
the test structure was also observed, which resulted into development of
horizontal cracks at starter courses through out the West-North-East walls,
isolating the super structure from the foundation in T37. This was result of a shear
failure of the starter courses just above the steel channel, which restrain the base
from sliding. During the test runs an uplift of the test structure base, of up to 6
mm was observed in the In-plane-East wall. The time histories recorded at T32
and T37 are shown in Figure 8.64 and 8.65 respectively.
Figure 8.50 Initial failure at lintel courses West wall [0.3g @ 9Hz]
8-58
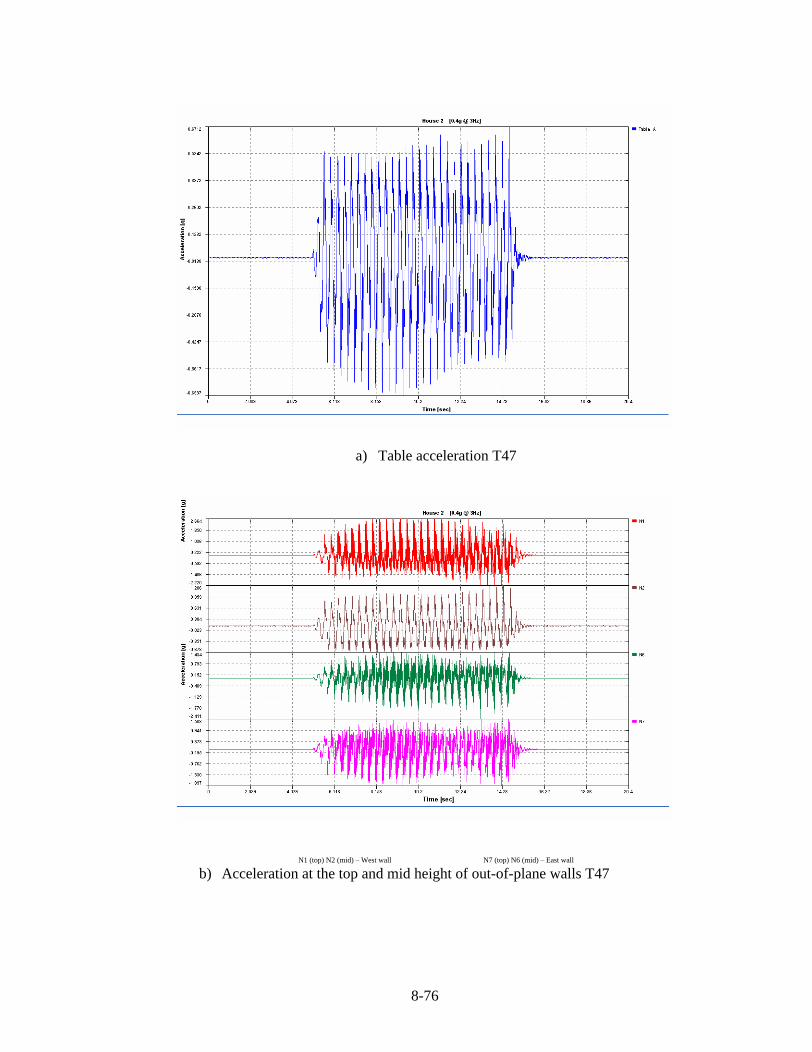
The fifth series of tests (T40-T47) was conducted using a constant base motion of
0.4g with frequency range of 10 to 3Hz. The test structure continued to rock with
base uplift of about 8 mm noticed at the base of North wall. The existing cracks
continued to widen, and at T47, the East wall developed a continuous diagonal
failure from the top of the wall to the bottom. The widths of the diagonal cracks
were from 2 to 5 mm at the top to 6 mm at the bottom courses as shown in Figure
8.51 below. The response of the test structure at T47 is shown as time histories in
Figure 8.66.
Figure 8.51 Diagonal failure East wall at 3Hz [0.4g]
The sixth series of tests (T48-T55) was conducted using a constant a base motion
of 0.5g with varying frequency range of 10Hz to 3Hz. The tests caused further
structural damage by extending and widening the cracks at East wall to about
12 mm wide as shown in Figure 8.52.
Figure 8.52 Diagonal failure at East wall [0.5g @ 5Hz]
8-59
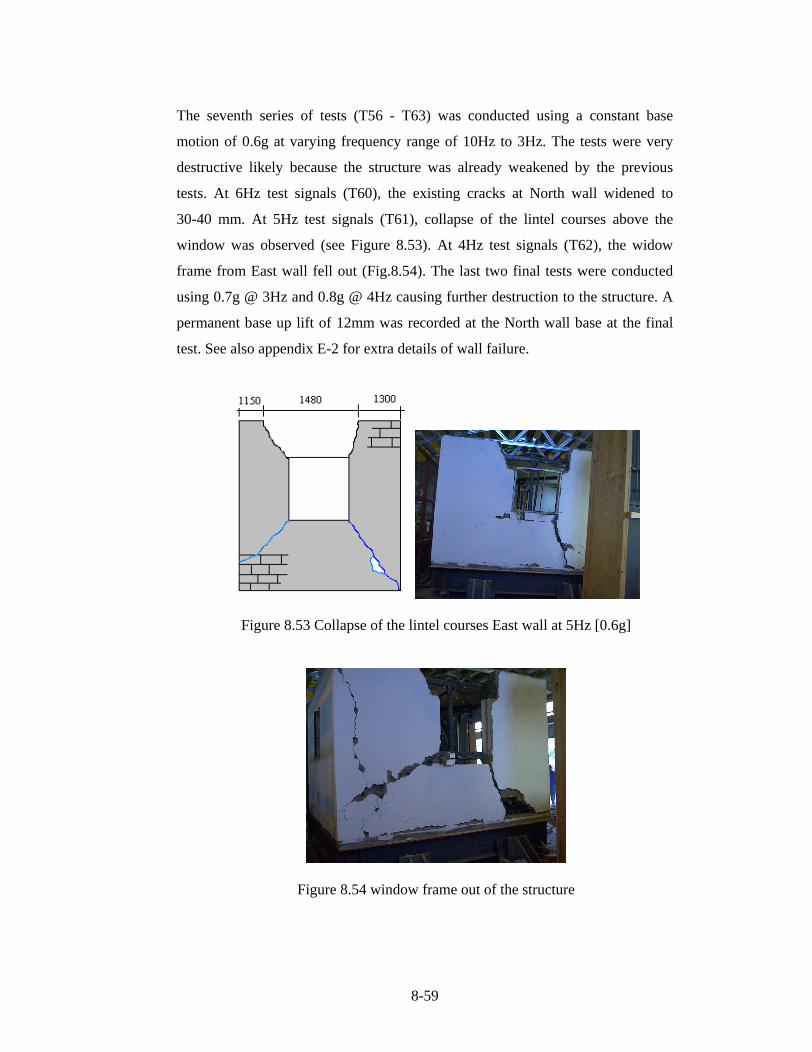
The seventh series of tests (T56 - T63) was conducted using a constant base
motion of 0.6g at varying frequency range of 10Hz to 3Hz. The tests were very
destructive likely because the structure was already weakened by the previous
tests. At 6Hz test signals (T60), the existing cracks at North wall widened to
30-40 mm. At 5Hz test signals (T61), collapse of the lintel courses above the
window was observed (see Figure 8.53). At 4Hz test signals (T62), the widow
frame from East wall fell out (Fig.8.54). The last two final tests were conducted
using 0.7g @ 3Hz and 0.8g @ 4Hz causing further destruction to the structure. A
permanent base up lift of 12mm was recorded at the North wall base at the final
test. See also appendix E-2 for extra details of wall failure.
Figure 8.53 Collapse of the lintel courses East wall at 5Hz [0.6g]
Figure 8.54 window frame out of the structure
8-60
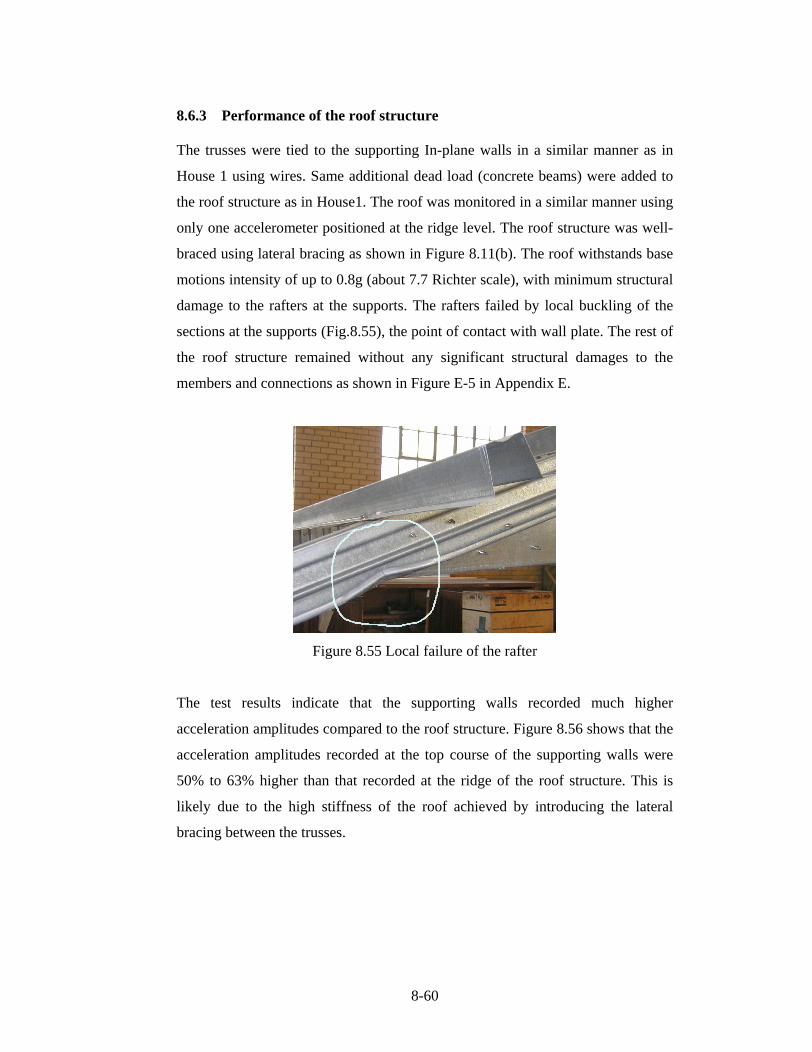
8.6.3 Performance of the roof structure
The trusses were tied to the supporting In-plane walls in a similar manner as in
House 1 using wires. Same additional dead load (concrete beams) were added to
the roof structure as in House1. The roof was monitored in a similar manner using
only one accelerometer positioned at the ridge level. The roof structure was well-
braced using lateral bracing as shown in Figure 8.11(b). The roof withstands base
motions intensity of up to 0.8g (about 7.7 Richter scale), with minimum structural
damage to the rafters at the supports. The rafters failed by local buckling of the
sections at the supports (Fig.8.55), the point of contact with wall plate. The rest of
the roof structure remained without any significant structural damages to the
members and connections as shown in Figure E-5 in Appendix E.
Figure 8.55 Local failure of the rafter
The test results indicate that the supporting walls recorded much higher
acceleration amplitudes compared to the roof structure. Figure 8.56 shows that the
acceleration amplitudes recorded at the top course of the supporting walls were
50% to 63% higher than that recorded at the ridge of the roof structure. This is
likely due to the high stiffness of the roof achieved by introducing the lateral
bracing between the trusses.

8-61
Recorded max. acceleartions at the roof and supporting walls
0.82
1.34
2.81
3.69 3.70 3.70 3.70 3.70
2.62
0.41
0.72
1.18
1.82
1.231.45
2.011.79
1.54
0.00
0.50
1.00
1.50
2.00
2.50
3.00
3.50
4.00
0.05g 0.1g 0.2g 0.3g 0.4g 0.5g 0.6g 0.7g 0.8g
Base motions [g]
max
. ace
lera
tions
[g]
wall at the top roof at the top
Figure 8.56 Recorded max. accelerations at the roof and supporting walls
The response of the roof structure and the supporting walls were almost in phase
except at 4Hz as shown in Figure 8.57 below.
peak acceleartions House 2 at 0.05g
0
0.1
0.2
0.3
0.4
0.5
0.6
0.7
0.8
0.9
0 1 2 3 4 5 6 7 8 9 10 11 12
Frequency [Hz]
peak
acc
eler
atio
n [g
]
north wall south wall roof Table
Figure 8.57 Natural frequency of the roof and supporting walls at 0.05g
8-62
8-63
8-64
8.6.3 Natural frequency of the test structure - House 2
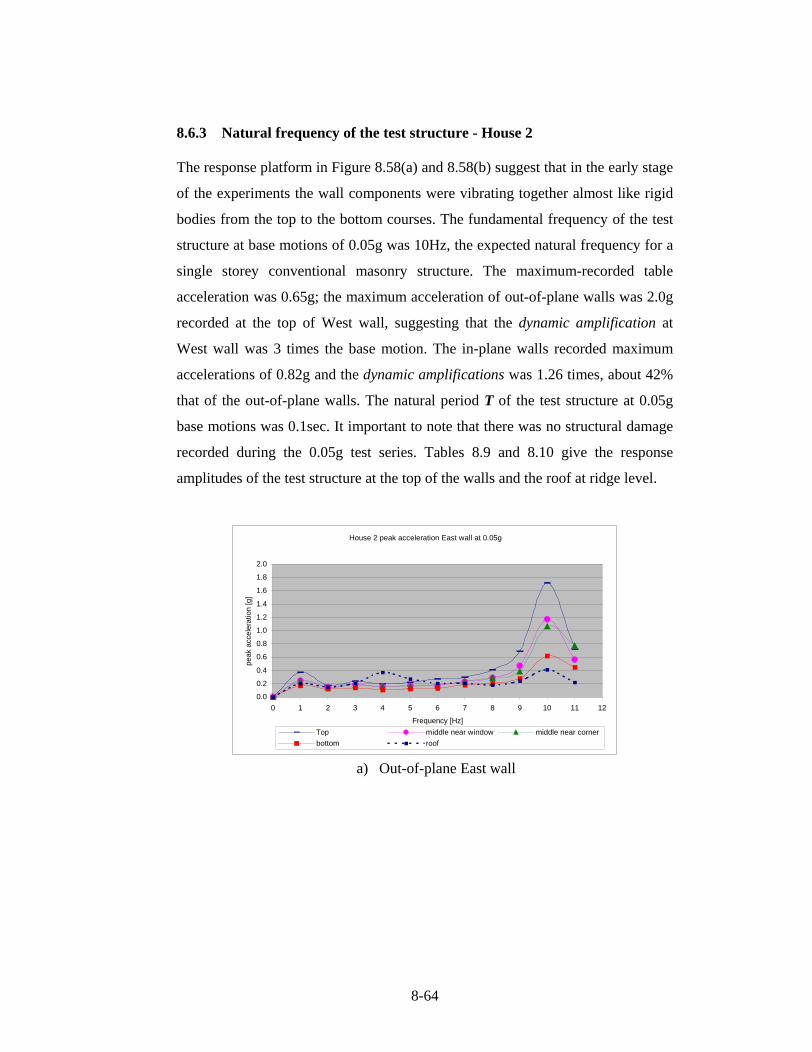
The response platform in Figure 8.58(a) and 8.58(b) suggest that in the early stage
of the experiments the wall components were vibrating together almost like rigid
bodies from the top to the bottom courses. The fundamental frequency of the test
structure at base motions of 0.05g was 10Hz, the expected natural frequency for a
single storey conventional masonry structure. The maximum-recorded table
acceleration was 0.65g; the maximum acceleration of out-of-plane walls was 2.0g
recorded at the top of West wall, suggesting that the dynamic amplification at
West wall was 3 times the base motion. The in-plane walls recorded maximum
accelerations of 0.82g and the dynamic amplifications was 1.26 times, about 42%
that of the out-of-plane walls. The natural period T of the test structure at 0.05g
base motions was 0.1sec. It important to note that there was no structural damage
recorded during the 0.05g test series. Tables 8.9 and 8.10 give the response
amplitudes of the test structure at the top of the walls and the roof at ridge level.
House 2 peak acceleration East wall at 0.05g
0.0
0.2
0.4
0.6
0.8
1.0
1.2
1.4
1.6
1.8
2.0
0 1 2 3 4 5 6 7 8 9 10 11 12
Frequency [Hz]
peak
acc
eler
atio
n [g
]
Top middle near window middle near corner
bottom roof
a) Out-of-plane East wall

8-65
House 2 peak acceleration North wall at 0.05g
0
0.1
0.2
0.3
0.4
0.5
0.6
0.7
0.8
0.9
0 1 2 3 4 5 6 7 8 9 10 11 12
Frequency [Hz]
peak
acc
eler
atio
ns [g
]
middle near corner Top middle near door
b) In-plane north wall
Figure 8.58 Natural frequencies House 2 at 0.05g
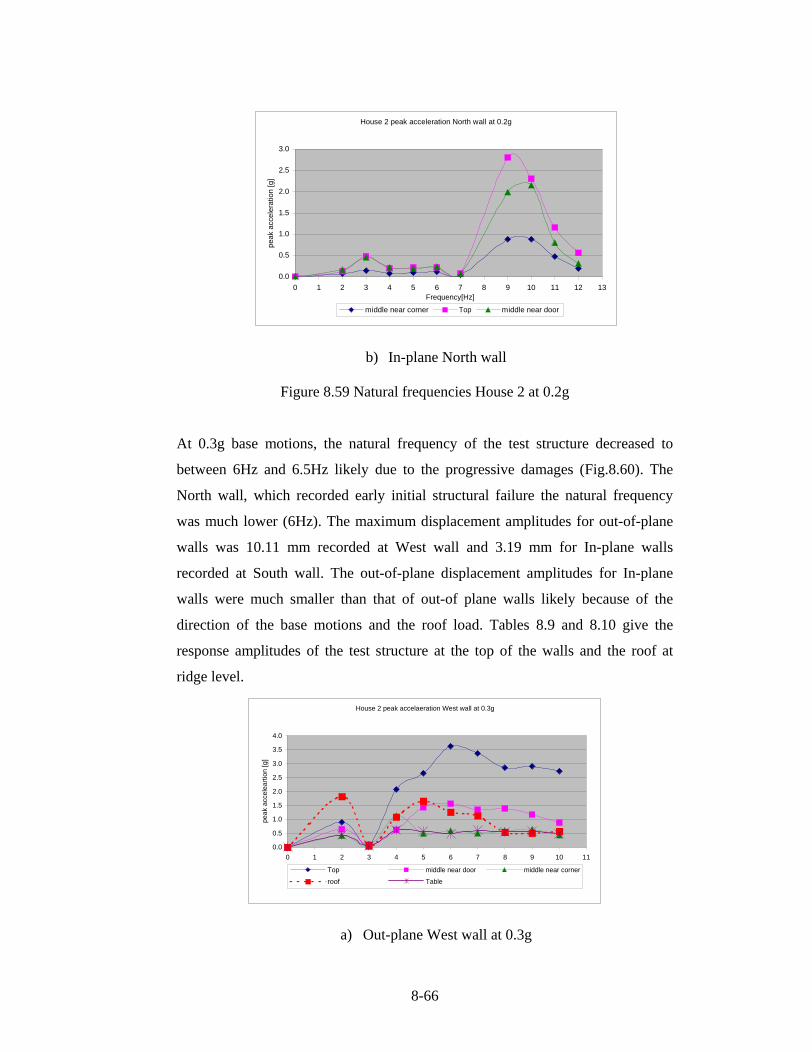
The natural frequency of the test structure at 0.2g base motions remained almost
unchanged (about 9.5 to 10Hz) as shown in Figure 8.59. This is likely because
there was no significant structural damage to the test structure during the 0.05g
and 0.1g test series. The out-of-plane wall maximum acceleration was 3.81g
recorded at West wall at maximum table acceleration of 0.95g, and therefore the
dynamic amplification of out-of-plane walls was about 4 times the base motion.
The maximum acceleration of In-plane walls was 2.81g recorded at the North
wall, suggesting that the dynamic amplification was about 3.6 times the base
motion.
House 2 peak acceleration West wall at 0.2g
0.0
0.5
1.0
1.5
2.0
2.5
3.0
3.5
4.0
4.5
0 1 2 3 4 5 6 7 8 9 10 11 12 13
Frequency [Hz]
peak
acc
elea
ratio
n [g
]
Top middle near door middle near corner roof Table
a) Out-of-plane West wall at 0.2g
8-66
House 2 peak acceleration North wall at 0.2g
0.0
0.5
1.0
1.5
2.0
2.5
3.0
0 1 2 3 4 5 6 7 8 9 10 11 12 13Frequency[Hz]
peak
acc
eler
atio
n [g
]
middle near corner Top middle near door
b) In-plane North wall
Figure 8.59 Natural frequencies House 2 at 0.2g
At 0.3g base motions, the natural frequency of the test structure decreased to
between 6Hz and 6.5Hz likely due to the progressive damages (Fig.8.60). The
North wall, which recorded early initial structural failure the natural frequency
was much lower (6Hz). The maximum displacement amplitudes for out-of-plane
walls was 10.11 mm recorded at West wall and 3.19 mm for In-plane walls
recorded at South wall. The out-of-plane displacement amplitudes for In-plane
walls were much smaller than that of out-of plane walls likely because of the
direction of the base motions and the roof load. Tables 8.9 and 8.10 give the
response amplitudes of the test structure at the top of the walls and the roof at
ridge level.
House 2 peak accelaeration West wall at 0.3g
0.0
0.5
1.0
1.5
2.0
2.5
3.0
3.5
4.0
0 1 2 3 4 5 6 7 8 9 10 11
Frequency [Hz]
peak
acc
elea
rtio
n [g
]
Top middle near door middle near corner
roof Table
a) Out-plane West wall at 0.3g

8-67
House 2 peak acceleration North wall at 0.3g
0.0
0.5
1.0
1.5
2.0
2.5
3.0
3.5
0 1 2 3 4 5 6 7 8 9 10 11
Frequency [Hz]
peak
acc
eler
atio
n [g
]
middle near corner Top middle near door
b) In-plane North wall
Figure 8.60 Natural frequency House 2 at 0.3g
At 0.4g base motions there was noticeable changes in the response pattern of the
test structure compared to the fist test series. Different positions respond
differently almost in a random manner (Fig.8.61). Depending on the location the
natural frequency of the structure was between 5.0 and 7Hz. The top courses
recorded much higher peak accelerations compared to the courses below the mid
section.
House 2 peak acceleration West wall at 0.4g
0.0
0.5
1.0
1.5
2.0
2.5
3.0
3.5
0 1 2 3 4 5 6 7 8 9 10 11
Frequency [Hz]
peak
acc
eler
atio
n [g
]
Top middle near corner middle near door roof
a) Out-of-plane West wall at 0.4g
8-68
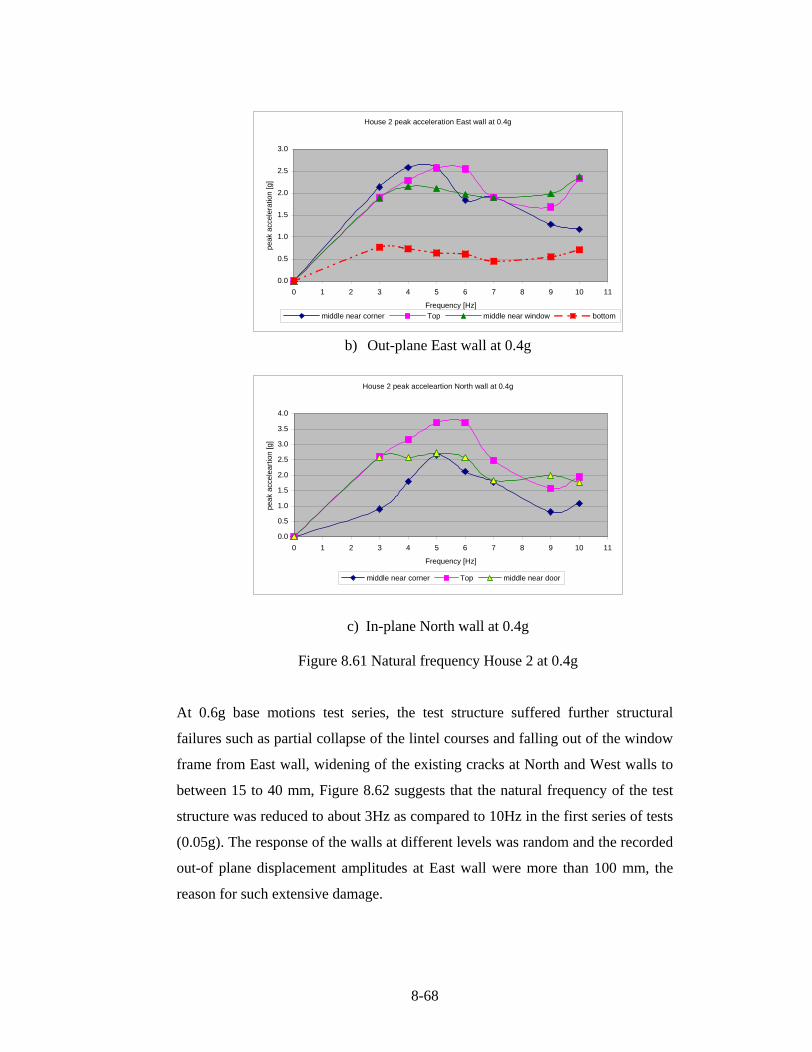
House 2 peak acceleration East wall at 0.4g
0.0
0.5
1.0
1.5
2.0
2.5
3.0
0 1 2 3 4 5 6 7 8 9 10 11
Frequency [Hz]
peak
acc
eler
atio
n [g
]
middle near corner Top middle near window bottom
b) Out-plane East wall at 0.4g
House 2 peak acceleartion North wall at 0.4g
0.0
0.5
1.0
1.5
2.0
2.5
3.0
3.5
4.0
0 1 2 3 4 5 6 7 8 9 10 11
Frequency [Hz]
peak
acc
elea
rtio
n [g
]
middle near corner Top middle near door
c) In-plane North wall at 0.4g
Figure 8.61 Natural frequency House 2 at 0.4g
At 0.6g base motions test series, the test structure suffered further structural
failures such as partial collapse of the lintel courses and falling out of the window
frame from East wall, widening of the existing cracks at North and West walls to
between 15 to 40 mm, Figure 8.62 suggests that the natural frequency of the test
structure was reduced to about 3Hz as compared to 10Hz in the first series of tests
(0.05g). The response of the walls at different levels was random and the recorded
out-of plane displacement amplitudes at East wall were more than 100 mm, the
reason for such extensive damage.
8-69
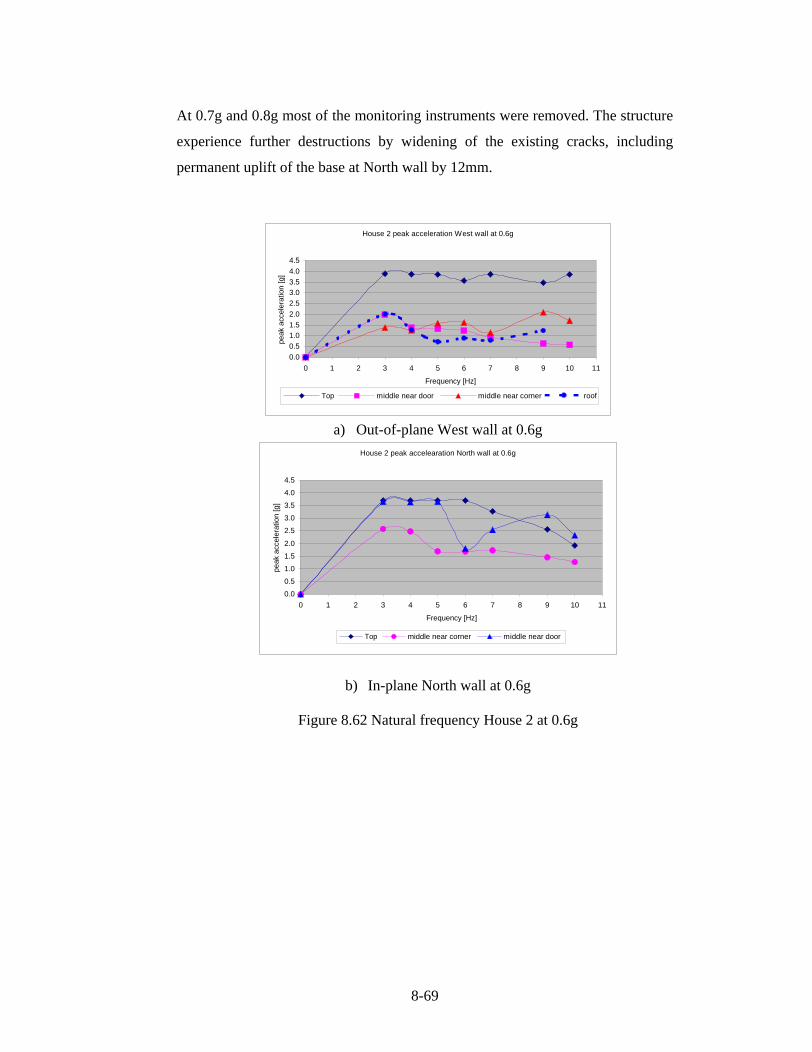
At 0.7g and 0.8g most of the monitoring instruments were removed. The structure
experience further destructions by widening of the existing cracks, including
permanent uplift of the base at North wall by 12mm.
House 2 peak acceleration West wall at 0.6g
0.0
0.51.01.52.0
2.53.03.54.0
4.5
0 1 2 3 4 5 6 7 8 9 10 11
Frequency [Hz]
peak
acc
eler
atio
n [g
]
Top middle near door middle near corner roof
a) Out-of-plane West wall at 0.6g
House 2 peak accelearation North wall at 0.6g
0.0
0.5
1.0
1.5
2.0
2.5
3.0
3.5
4.0
4.5
0 1 2 3 4 5 6 7 8 9 10 11
Frequency [Hz]
peak
acc
eler
atio
n [g
]
Top middle near corner middle near door
b) In-plane North wall at 0.6g
Figure 8.62 Natural frequency House 2 at 0.6g

8-70
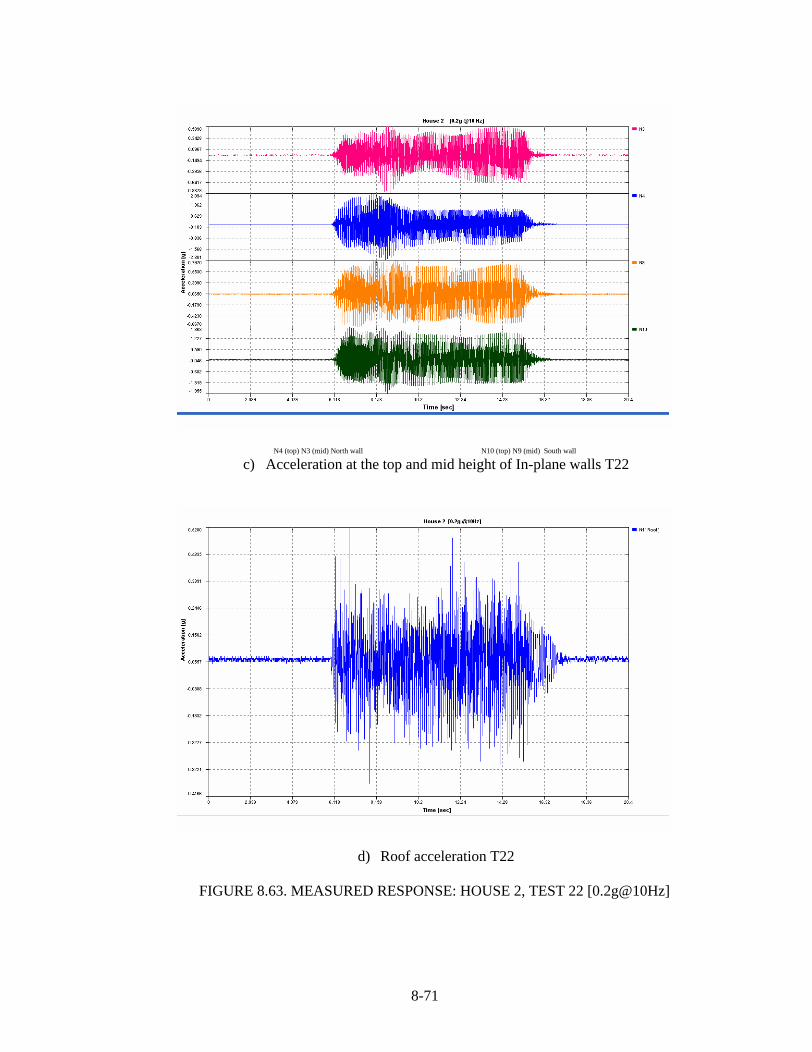
a) Table accelerations T22
N1 (top) N2 (mid) West wall N7 (top) N6 (mid) East wall
b) Acceleration at the top and mid height of out-of-plane walls T22
8-71
N4 (top) N3 (mid) North wall N10 (top) N9 (mid) South wall
c) Acceleration at the top and mid height of In-plane walls T22
d) Roof acceleration T22
FIGURE 8.63. MEASURED RESPONSE: HOUSE 2, TEST 22 [0.2g@10Hz]
8-72
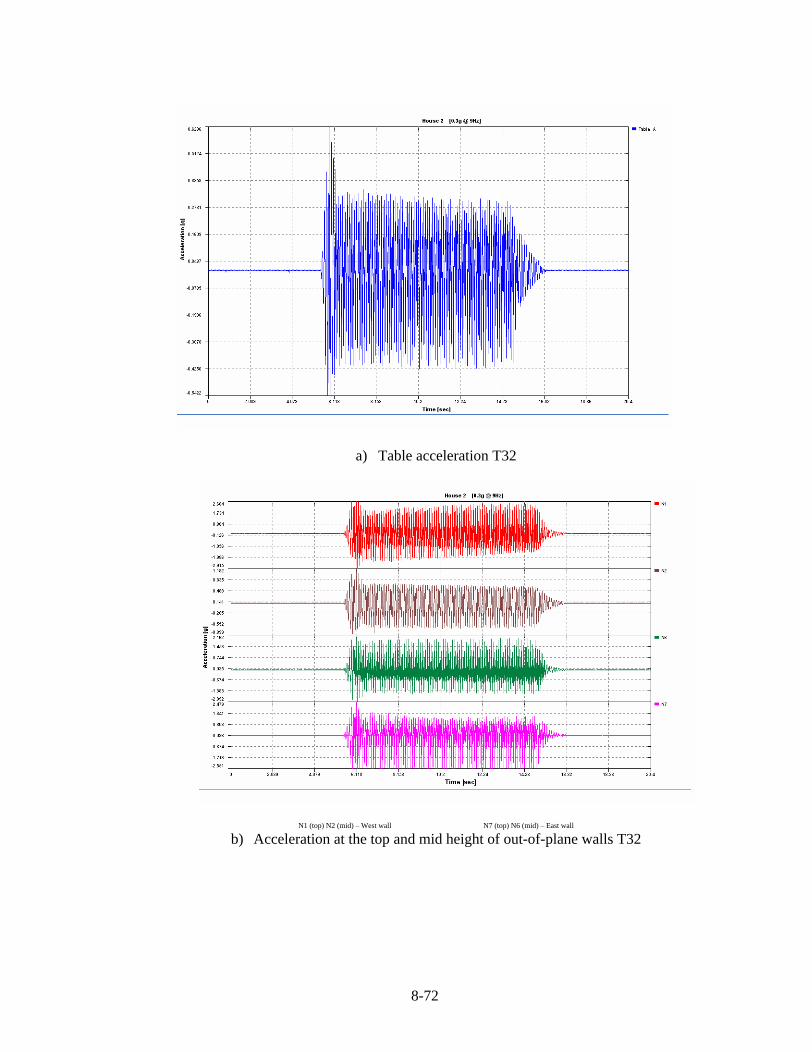
a) Table acceleration T32
N1 (top) N2 (mid) West wall N7 (top) N6 (mid) East wall
b) Acceleration at the top and mid height of out-of-plane walls T32
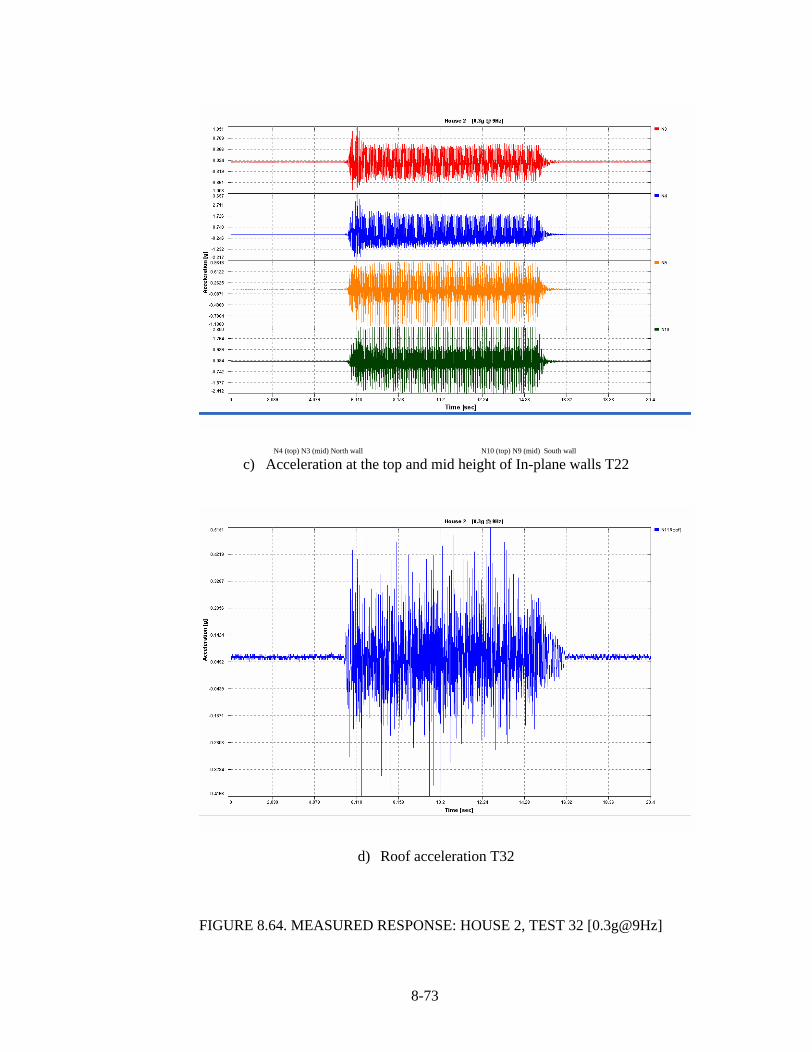
8-73
N4 (top) N3 (mid) North wall N10 (top) N9 (mid) South wall
c) Acceleration at the top and mid height of In-plane walls T22
d) Roof acceleration T32
FIGURE 8.64. MEASURED RESPONSE: HOUSE 2, TEST 32 [0.3g@9Hz]
8-74
a) Table acceleration T37
N1 (top) N2 (mid) West wall N7 (top) N6 (mid) East wall
b) Acceleration at the top and mid height of out-of-plane walls T37
8-75
N4 (top) N3 (mid) North wall N10 (top) N9 (mid) South wall
c) Acceleration at the top and mid height of In-plane walls T37
d) Roof acceleration T37
FIGURE 8.65. MEASURED RESPONSE: HOUSE 2, TEST 37 [0.3g@ 4Hz]
8-76
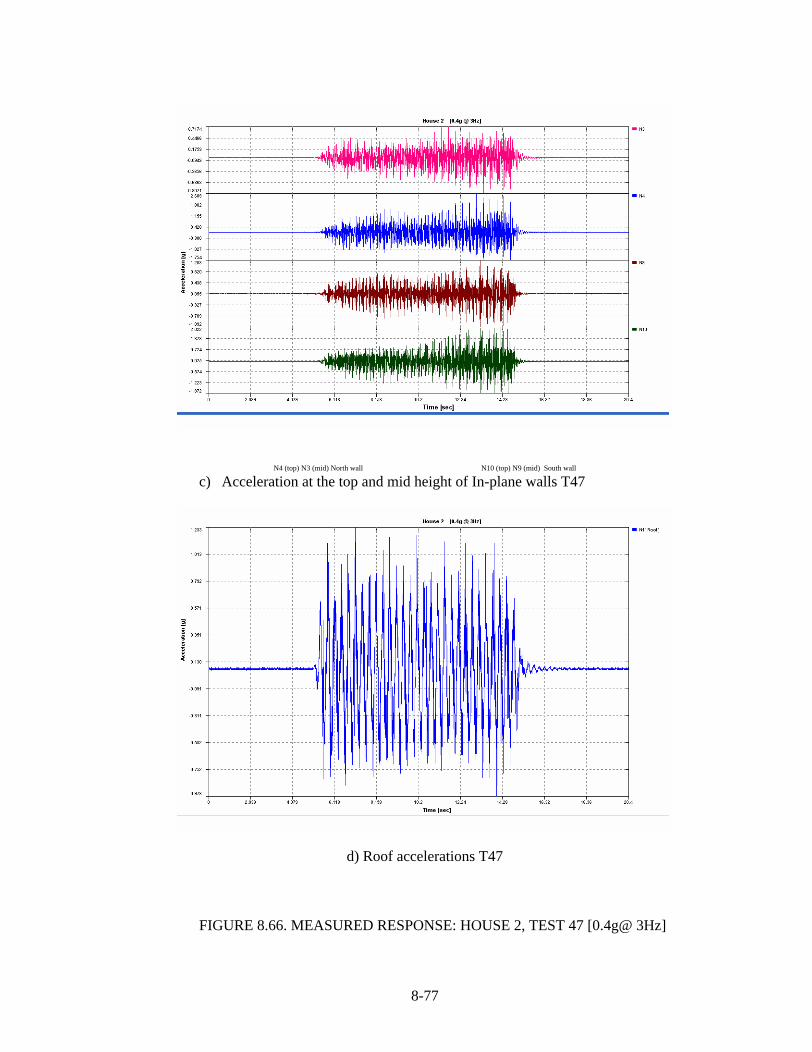
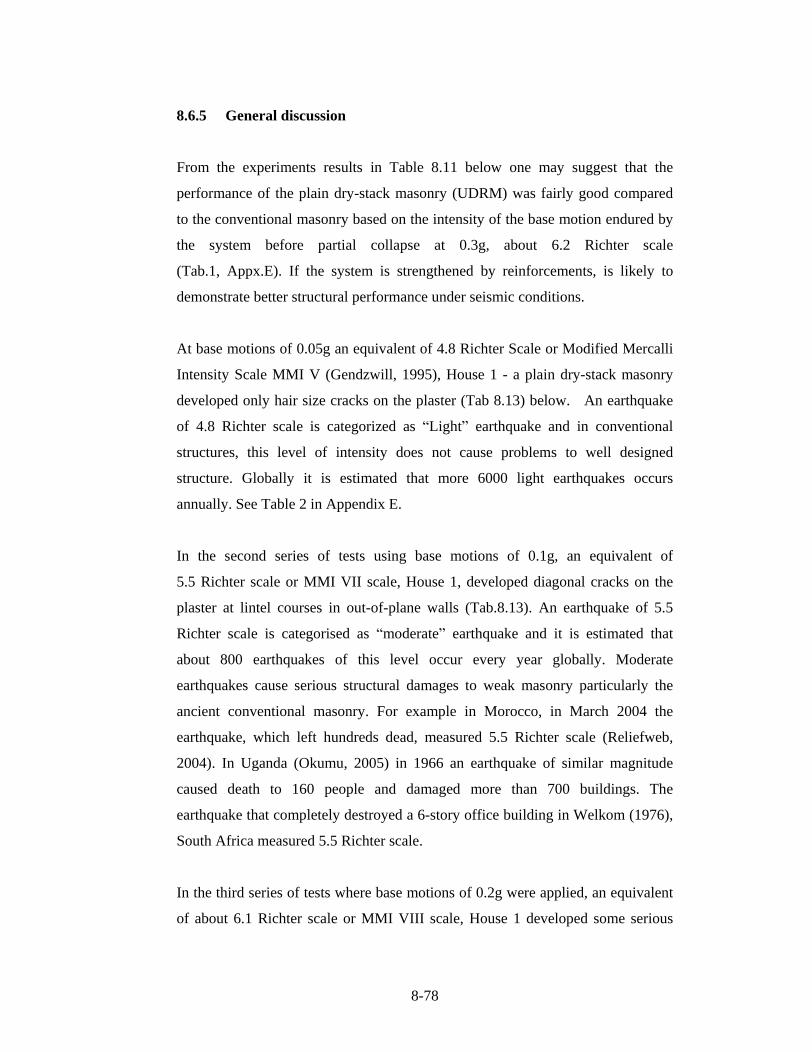
a) Table acceleration T47
N1 (top) N2 (mid) West wall N7 (top) N6 (mid) East wall
b) Acceleration at the top and mid height of out-of-plane walls T47
8-77
N4 (top) N3 (mid) North wall N10 (top) N9 (mid) South wall
c) Acceleration at the top and mid height of In-plane walls T47
d) Roof accelerations T47
FIGURE 8.66. MEASURED RESPONSE: HOUSE 2, TEST 47 [0.4g@ 3Hz]
8-78
8.6.5 General discussion
From the experiments results in Table 8.11 below one may suggest that the
performance of the plain dry-stack masonry (UDRM) was fairly good compared
to the conventional masonry based on the intensity of the base motion endured by
the system before partial collapse at 0.3g, about 6.2 Richter scale
(Tab.1, Appx.E). If the system is strengthened by reinforcements, is likely to
demonstrate better structural performance under seismic conditions.
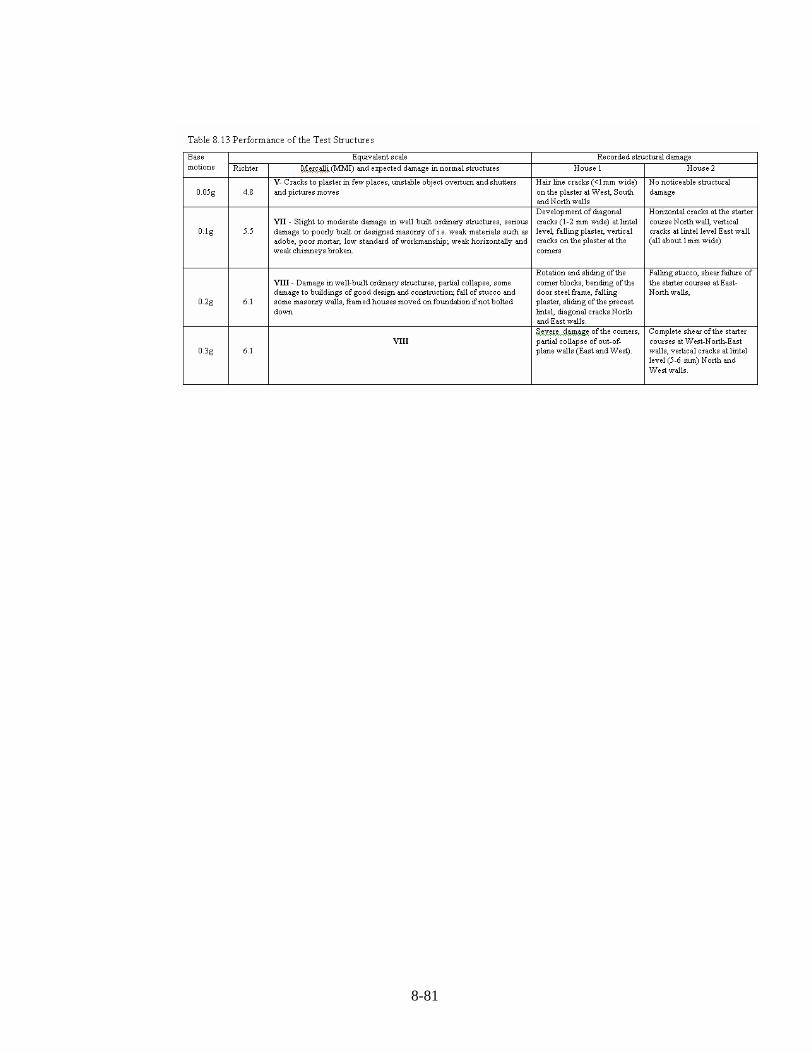
At base motions of 0.05g an equivalent of 4.8 Richter Scale or Modified Mercalli
Intensity Scale MMI V (Gendzwill, 1995), House 1 - a plain dry-stack masonry
developed only hair size cracks on the plaster (Tab 8.13) below. An earthquake
of 4.8 Richter scale is categorized as Light earthquake and in conventional
structures, this level of intensity does not cause problems to well designed
structure. Globally it is estimated that more 6000 light earthquakes occurs
annually. See Table 2 in Appendix E.
In the second series of tests using base motions of 0.1g, an equivalent of
5.5 Richter scale or MMI VII scale, House 1, developed diagonal cracks on the
plaster at lintel courses in out-of-plane walls (Tab.8.13). An earthquake of 5.5
Richter scale is categorised as moderate earthquake and it is estimated that
about 800 earthquakes of this level occur every year globally. Moderate
earthquakes cause serious structural damages to weak masonry particularly the
ancient conventional masonry. For example in Morocco, in March 2004 the
earthquake, which left hundreds dead, measured 5.5 Richter scale (Reliefweb,
2004). In Uganda (Okumu, 2005) in 1966 an earthquake of similar magnitude
caused death to 160 people and damaged more than 700 buildings. The
earthquake that completely destroyed a 6-story office building in Welkom (1976),
South Africa measured 5.5 Richter scale.
In the third series of tests where base motions of 0.2g were applied, an equivalent
of about 6.1 Richter scale or MMI VIII scale, House 1 developed some serious

8-79
structural failure at the corners including bending of the door frames (see
Tab.8.13). An earthquake of 6.1 Richter scale is categorised as strong
earthquake, very distractive to conventional masonry buildings and a cause of
death to thousands of people worldwide. It is estimated that about 120 strong
earthquakes occur each year globally. From Table 3 in Appendix E it show that
Tanzania had 4 strong earthquakes and South Africa 2 for the past 50 years
At 0.3g base motion, which is equivalent to 6.2 Richter scale or MMI VIII in
House 1 there was partial collapse of the out-of-plane walls and it was the end of
the tests for House 1. In House 2 there was total shear of the base of the test
structure resulting into isolation of the super structure and foundation.
At 0.6g base motion, which is equivalent to about 6.9 Richter scale or MMI IX in
House 2, there was partial collapse of the East wall; lintel and the window frame
at East wall were ripped off the wall. An earthquake of 6.9 Richter scale is
categorised as strong earthquake, which normally destroys most of masonry
buildings including well-built ordinary structures.
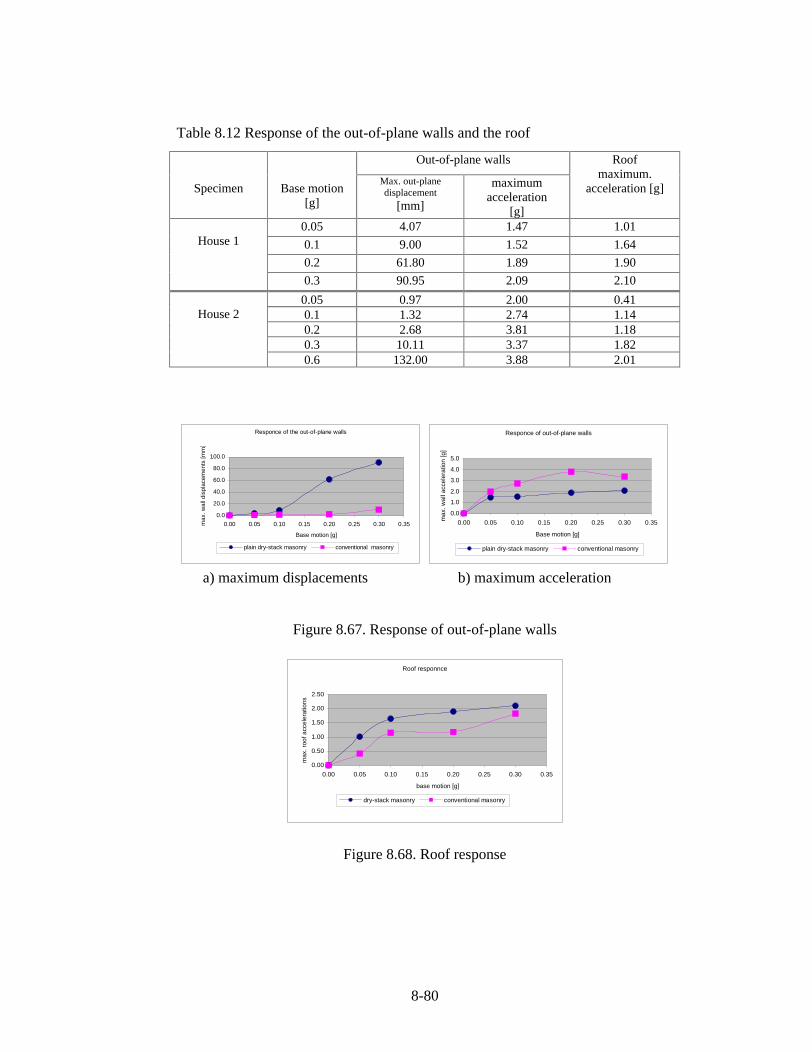
Test results from Table 8.12 and Figure 8.67 below indicate that under similar
base motion intensity the acceleration amplification in dry-stack masonry is lower
than in conventional masonry at higher out-of-plane displacements. This may be
attributed to the flexibility of UDRM. Figure 8.68 below shows that the roof
acceleration amplitudes in House 1 were slightly higher than of House 2 because
of roof flexibility in House 1. The roof rigidity in House 2 is attributed to proper
bracing of the trusses. In both houses test results indicates that the seismic
acceleration increase progressively from the bottom to the top courses.
Table 8.11 Structural damage of the walls at Total failure Out of plane walls In plane walls Base motion Test structure
West East North South
House 1 8% partial collapse
40% partial collapse
Corner failure
(Corner blocks rotation)
Corner failure
(Corner blocks rotation)
0.3g
(6.2 Richter scale)
House 2 major cracks at lintel courses
5% partial collapse
major cracks at lintel courses
Corner major cracks
0.6g
(6.9 Richter scale)
8-80
Table 8.12 Response of the out-of-plane walls and the roof
Responce of the out-of-plane walls
0.0
20.0
40.0
60.0
80.0
100.0
0.00 0.05 0.10 0.15 0.20 0.25 0.30 0.35
Base motion [g]
max
. wal
l dis
plac
emen
ts [m
m]
plain dry-stack masonry conventional masonry
Responce of out-of-plane walls
0.0
1.0
2.0
3.0
4.0
5.0
0.00 0.05 0.10 0.15 0.20 0.25 0.30 0.35
Base motion [g]
max
. wal
l acc
eler
atio
n [g
]
plain dry-stack masonry conventional masonry
a) maximum displacements b) maximum acceleration
Figure 8.67. Response of out-of-plane walls
Roof responnce
0.00
0.50
1.00
1.50
2.00
2.50
0.00 0.05 0.10 0.15 0.20 0.25 0.30 0.35
base motion [g]
max
. roo
f acc
eler
atio
ns
dry-stack masonry conventional masonry
Figure 8.68. Roof response
Out-of-plane walls
Specimen Base motion
[g]
Max. out-plane displacement
[mm]
maximum acceleration
[g]
Roof maximum.
acceleration [g]
0.05 4.07 1.47 1.01
0.1 9.00 1.52 1.64
0.2 61.80 1.89 1.90
House 1
0.3 90.95 2.09 2.10
0.05 0.97 2.00 0.41 0.1 1.32 2.74 1.14 0.2 2.68 3.81 1.18 0.3 10.11 3.37 1.82
House 2
0.6 132.00 3.88 2.01
8-81

8-82
8.6.6 Major observations from the study
The following are the major general observations from the study conducted: -
1. The Shaking Table surface is rigid; therefore it was assumed that the test
would simulate only a very hard soil condition in the prototype.
2. Table motions were applied sequentially, starting from very low to severe
intensity. Therefore the test models were in a weakened condition when
subjected to the more intense base motions.
3. In conventional masonry House 2, the In-plane walls undergo rigid-body
rocking associated with cracking and uplift at the base when the base
motions were above 0.2g (6.1Ricther scale).
4. The large racking (shear) distortions between the roof trusses, observed in
House 1, were significantly reduced in House 2 by introducing lateral
bracing between the two-middle trusses.
5. In House 1 the trusses were orientated perpendicular to Table motion. The
inertia forces from out-of-plane walls and the roof caused lateral bending
of the bottom chord of the trusses.
6. The motions of the UDRM test structure followed the shaking table
motions very closely, particularly at base motions below 0.2g, and the
distortions were generally proportional to, and in-phase with base
accelerations.
7. In UDRM test structure, the out-of-plane walls developed failure by
opening of the perpend dry-stack joints in the centre, two quarters of their
height and developed an out-of-plane hinging action . The failure is
attributed to sliding of the interlocking mid-blocks and rotation of corner
blocks.
8-83
8. In the UDRM test structure, the stiffness of the cracked walls was reduced
significantly compared with the un-cracked state, and the out-of-plane
period of vibration increased significantly.
9. In UDRM test structure, as the progressive damage of the walls increases;
their natural frequency continues to decrease and the degree of response of
the walls varied from one point to another depending on the extent of
damage.
10. House 2, which was reinforced with brick force after every third course,
developed shear at the base and at the lintel level above the openings due
to box action ; or rigid body rotation of the walls.
11. In both test structures the development of diagonal cracks extending from
the window corners was typical.
12. The footing attachment for the model walls was designed to permit both
rocking and up lift; only sliding was constrained.
13. The significant aspect of dry-stack masonry is that the out-of-plane
displacements did not cause failure to the wall by splitting of the units as
in conventional masonry, but rather the failure was by opening of the
vertical joints of the dry-stack interlocking blocks from pull and
bending action .
14. In UDRM test structure, as the base motion intensify, the corner blocks
connecting In-plane walls and Out-of-plane walls undergo rotation
which reduces the rigidity of the structure. The weak corners allow greater
out-of-plane displacements resulting into hinging action at the mid
upper section of the wall and ultimately partial collapse of the walls.
8-84
15. In order to transfer inertia forces developed at the roof level into the
supporting walls, the roof system should be adequately braced in both
orthogonal directions and should be adequately anchored into the
supporting walls.
8.6.7 Recommendations
For further improvement of the UDRM some recommendations are given in this
section. The recommendations are based on the test results focusing mainly on the
physical observations of the structural behaviour of the test model. The
recommendations address the major identified structural problems such as rotation
of the corner blocks and weak corner junctions which were the major causes of
corner failures; excessive out-of-plane displacement of the walls, the major cause
of partial collapse of the walls; bending of the door frames and falling debris.
The recommendations are in two categories. The first category utilise dry-stack
technology solutions, which were initially tested under static loading. In the
second category the solutions are based on the experience in conventional
masonry.
Category I: Dry-stack seismic system solutions
Based on the investigations conducted in Phase I and reported in chapter 7, two
methods are suggested to enhance the capacity of UDRM against seismic loading
as follows: -
i) Introduction of dry-stack lintel beam by constructing the top three or four lintel
courses using conduit dry-stack blocks reinforced with horizontal bars. The
horizontal reinforcements are carefully laid in mortar without interfering with the
interlocking mechanism and anchored to the cast in situ side columns (Fig 8.71
and 8.72c). The static test results of the system reported in chapter seven and
shown in Figure 7.7 indicate that the ultimate lateral resistance of the wall was
15.3 kPa at deflection of 100 mm. From series of tests conducted in Phase I on
8-85
dry-stack wall panels, 100 mm deflection is considered a failure point because as
the out-of-plane deflection of the wall approaches 100 mm due to hinging
action , the interlocking blocks slip out of the interlocking mechanism.
The Shaking Table results for House 1(UDRM) indicate that the peak
accelerations recorded at the top of out-of-plane walls before partial collapse was
2.68g. The magnitude of the Inertia force, which is the product of the mass of the
wall and peak accelerations acting in the direction opposing the acceleration
(Fig.8.69), was about 10 kPa. The partial collapse of out-of-plane walls occurred
at T30 at base motion intensity of 0.3g, suggesting that UDRM system tested will
not collapse if base motion intensity is below 0.3g.
The performance of the proposed seismic system under static load shows that at
lateral pressure of 10 kPa the maximum out-of-plane deflection of the wall was
about 60 mm <100 mm (Fig. 7.7). The performance is encouraging and therefore
the basis for detailed study of the system. It is important to note that the test
structure (Fig.7.6) discussed in chapter 7 was constructed using seismic block
type II (Fig.7.8) and in House I seismic block type I was used, therefore the
comparison made above is very conservative. In order to be able to predict
accurately the amount of reinforcements required for the side colums, it the
opinion of the author that the tests models should initially constructed and tested
first without vertical reinforcements to the side columns. The Shaking Table base
motion intensity should be increased in a sequential manner starting from minor to
very severe while monitoring and recording the mode of failure. The test results
obtained will then form a basis for providing the required amount of vertical
reinforcements.
ii) The second alternative to be investigated is by using the cellular corner blocks,
reinforced and grouted (Fig. 8.72(a)), eliminating the shuttering process. The
construction of the top three or four lintel courses is similar to alternative (i); the
only difference is that the grouted side column cross-section is limited by the
diameter of the block cell, which is 100 mm. Because of small cross section of the
8-86
cell in order to achieve high strength, concrete of high workability should be used
to allow proper compaction. The system should be tested in a similar manner as in
(i) to establish the amount of vertical reinforcements required. In both cases the
possibility of increasing the area of horizontal steel is limited by the size of the
(conduit) cell in the blocks. Experience from Phase I as reported in chapter 7 is
that the diameter of the horizontal bars should not exceed 10 mm to allow
adequate bonding mortar around the horizontal reinforcements. Therefore the
horizontal bars are limited to diameter 6 mm, 8 mm or 10 mm.
The suggested alternative (i) and (ii) should be tested against a test model with
conventional lintel ring beam (Fig. 8.70) for comparisons in order to establish the
advantages and disadvantages of the proposed dry-stack system.
Category II: Adopting experience in conventional masonry
Other proposed options to be investigated in future includes introduction of lintel
ring beam/band and sill ring beam/band as shown in Figure 8.73, introduction of
lintel and sill ring beams casted together with insitu side columns (Fig. 8.74), and
introduction of roof ring beam/band as shown in Figure 8.75. These are some of
options, which have been tested, in conventional masonry for low-rise buildings
in seismic zones in countries such as India Mexico and some of Latin America
countries.
Experience from conventional masonry suggests that the lintel ring beam ties
walls together and create a support for walls loaded along out-of-plane direction
from walls loaded in in-plane direction. The ring beam also reduces the
unsupported height of the walls and improves their stability in the weak direction.
During earthquake shaking, the ring beam will undergo bending and pulling
actions; therefore the main reinforcements should be anchored to the corners
properly. An introduction of conventional cast insitu side columns will enhance
connections between out-of-plane walls and in-plane walls.
In a seismic zone where large wind forces are expected, an introduction of roof
ring beam is suggested for investigations (Fig.8.75). A reinforced roof ring beam

8-87
is expected to provide proper anchorage of the roof structure where the dry-stack
lintel courses with horizontal reinforcements proves to be inadequate. Table 8.14
summarise the above recommendations.
The observations and recommendations given above are based on the test results
of only one UDRM test model and therefore should be considered conservative.
Testing of more than one test models of similar parameters and similar variables
will in future provide more accurate and conclusive results. High costs for setting
up the experiments was the main limiting factor in this investigation. It is the
opinion of the author that the information provided above will be used to provide
a guideline in the development of standard dry-stack system for different seismic
conditions.
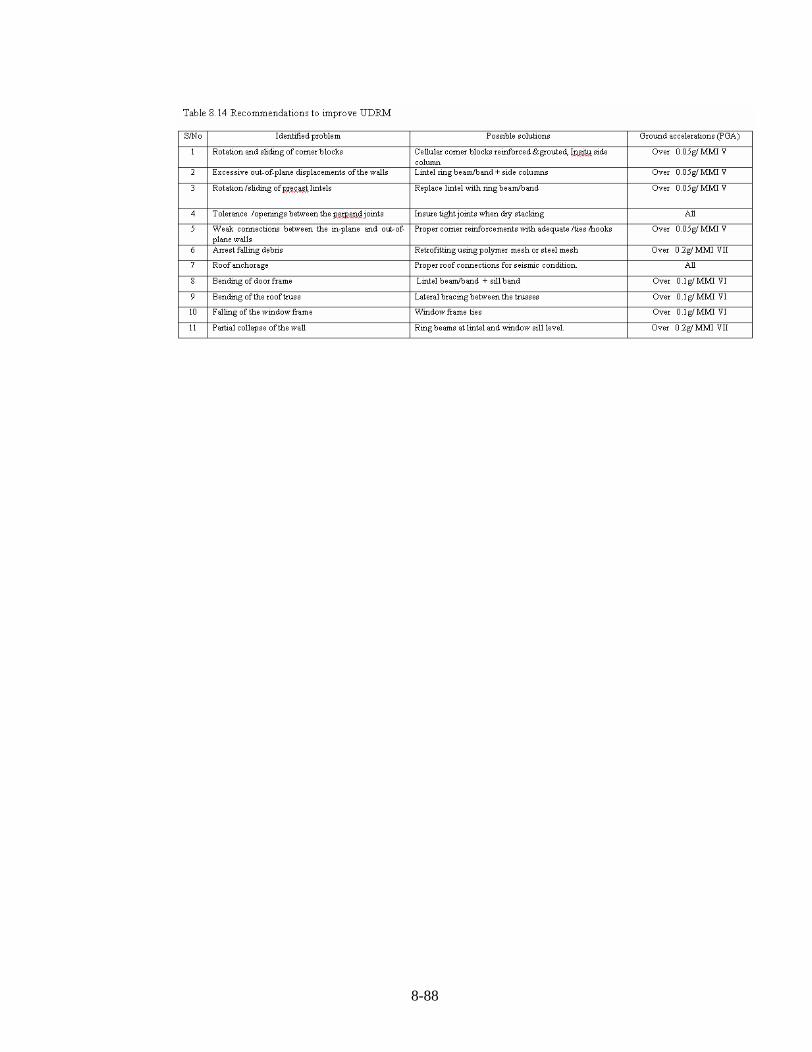
8-88
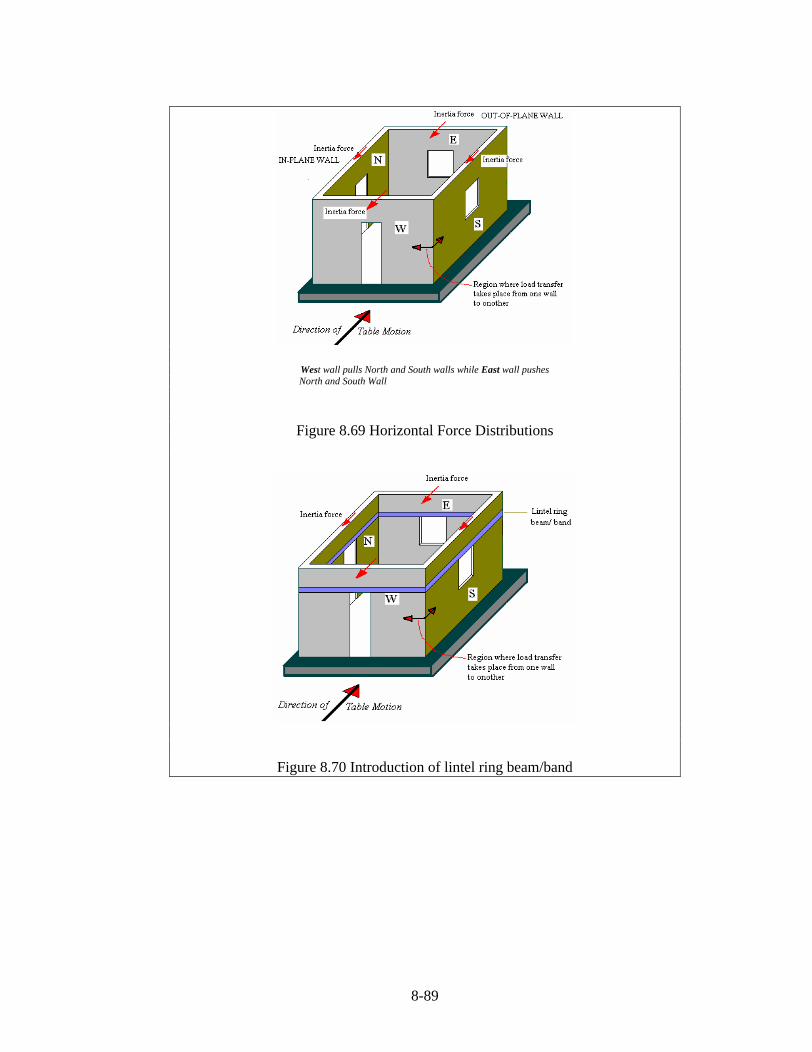
8-89
West wall pulls North and South walls while East wall pushes North and South Wall
Figure 8.69 Horizontal Force Distributions
Figure 8.70 Introduction of lintel ring beam/band
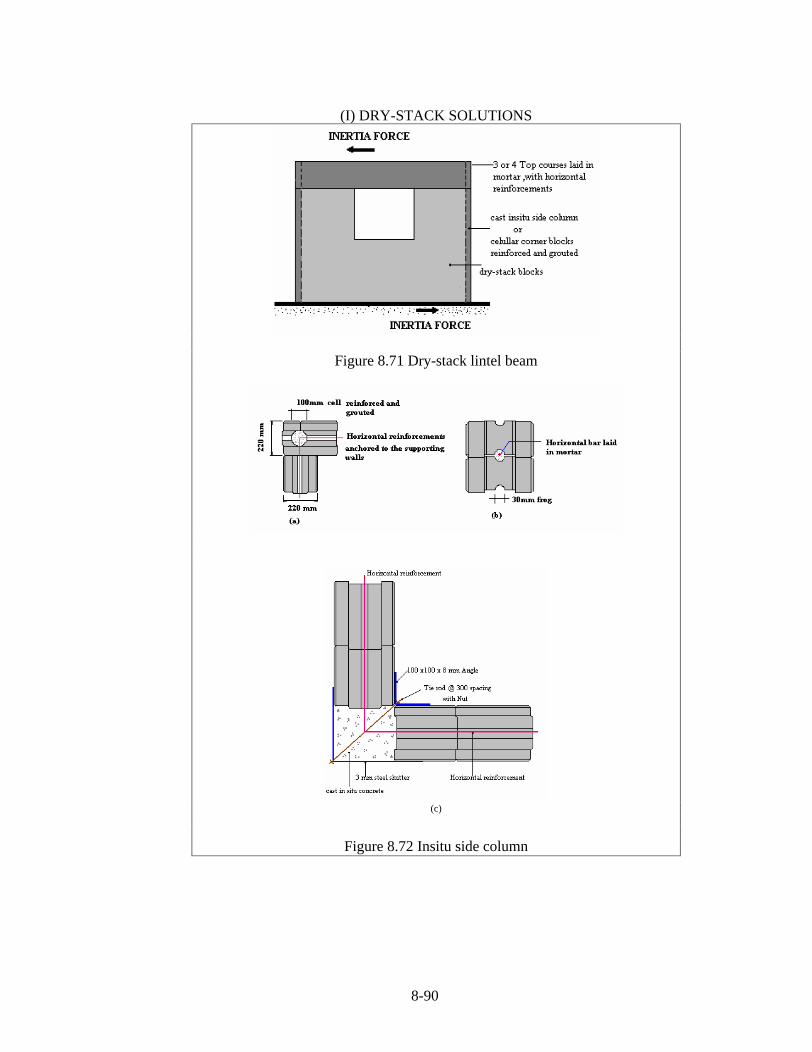
8-90
(I) DRY-STACK SOLUTIONS
Figure 8.71 Dry-stack lintel beam
(c)
Figure 8.72 Insitu side column
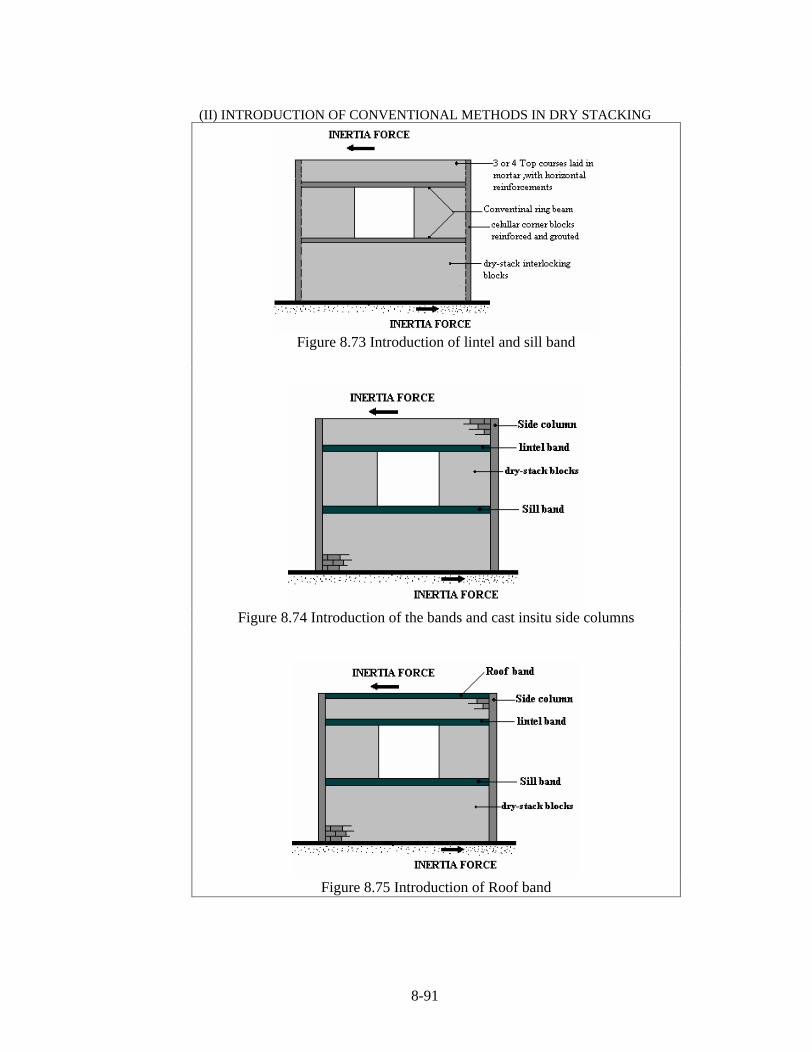
8-91
(II) INTRODUCTION OF CONVENTIONAL METHODS IN DRY STACKING
Figure 8.73 Introduction of lintel and sill band
Figure 8.74 Introduction of the bands and cast insitu side columns
Figure 8.75 Introduction of Roof band