th l technology sector scorecard · •cleantech methodology 87 102 112 pwc ... significantly when...
TRANSCRIPT
T h l
www.pwc.com
Technology Sector ScorecardQ4 d F ll 2011 R iQ4 and Full-year 2011 Review

Introduction
This quarterly global snapshot of activity in the technology sector highlights trends, business h ll d t iti I thi diti i b th Q d th f ll challenges and opportunities. In this edition we review both Q4 and the full-year 2011.
Technology companies weathered a difficult macroeconomic environment and on average posted historically strong profitability in the face of lower top line growth when compared to historical peaks. However, areas of growth in cloud, storage, mobile devices and big data experienced strong growth, in some cases offsetting a difficult environment for desktop PC and semiconductor companiessome cases offsetting a difficult environment for desktop PC and semiconductor companies.
While tech companies have begun 2012 with modest expectations, the second half of 2012 is expected to generate greater excitement with the roll out of several new technology products.
As always, I would like to acknowledge the efforts of Vaibhav Taneja, Stella Su, Dirk Tissera, SameerLadiwala, Steve Mack, Maricel Apuli and Vikram Khosla who contributed greatly in pulling this report together. The observations are the individual views of the authors. Should you have questions or comments, please contact us.
As a reminder, for a richer, interactive experience please visit the online tool: pwc.com/techscorecardd land explore.
Raman Chitkara Global Technology Leader
PwCTechnology Sector Scorecard
2
Contents
Year in review 4
Snapshot by subsector
• Communications
• Consumer Electronics
9
10
25
• EMS/Distributors
• Semiconductors
• Software & Internet
41
54
71
• Systems and PC Hardware
• CleanTech
Methodology
87
102
112
PwC technology territory leaders 113
PwCTechnology Sector Scorecard
3

Year in reviewYear in review
PwCTechnology Sector Scorecard
4

2011 review
Global tech sector posted mixed results Historically high profitability in the face of slower top line growth
• The fourth quarter continued what was a fairly strong year overall despite a host of concerns stemming from the increasingly difficult macroeconomic environment.
• On average, tech companies continued to post historically strong profitability even as top line growth was lower than historical peaks with some notable exceptions: cloud, storage, mobile devices and various software and services categories. These groups experienced strong growth, in some cases offsetting a difficult environment for desktop PC and semiconductor companies.
• On the heels of a slow second half of 2011, calendar 2012 has started with relatively modest expectations.
• The second half of 2012 is expected to generate greater excitement with the roll out of several new technology products.
• Cost focus continues to be a key driver of profitability as business models change. Low cost Cost focus continues to be a key driver of profitability as business models change. Low cost sourcing remains a priority for technology companies. In addition, the natural disasters in Japan and Thailand brought renewed focus to supply chain planning and efficiency as well as risk mitigation.
PwCTechnology Sector Scorecard
5

2011 review continued
• The shift away from traditional IT products to smartphones, tablets and ultrabook PCs is rapidly changing the competitive dynamics in the industry, favoring players with mobile offerings and platforms that connect various devices and applications In the fourth quarter we offerings and platforms that connect various devices and applications. In the fourth quarter we began to see a tiering of the mobile market with clear winners at the top and a second tier niche forming.
• Technology IPOs started the year at a promising note, with 53 IPOs completed during the first half of 2011 However the high volatility of capital markets during the summer significantly half of 2011. However, the high volatility of capital markets during the summer significantly slowed IPO activity. The fourth quarter witnessed a rebound with a 60% jump, but the total number of IPOs completed during the second half of 2011 aggregated to only 33 and fell significantly when compared to 2010 levels.1
• In the scramble for a place at the table in the tech growth markets there has been a host of In the scramble for a place at the table in the tech growth markets, there has been a host of activity in both intellectual property and M&A. Acquisition of IP, market share and innovative technologies has picked up. Coupled with the significant cash reserves on balance sheets, valuations are expected to get higher in 2012.
• Fourth quarter venture investment was strongest in software, social internet and clean tech. Fourth quarter venture investment was strongest in software, social internet and clean tech. Funding jumped 16% for internet companies in 2011 compared to 2010 and 40% of the dollars went to first time financings.2
PwCTechnology Sector Scorecard
6
1. IPOs with issue size greater than US$40 million2. PricewaterhouseCoopers/National Venture Capital Association MoneyTreeTM - Feb2012

2011 review continued
• The volume of venture-backed deals closed in 2011 in the U.S. was similar to 2010 (429 in 2011 versus 436 in 2010) with deal size increasing only slightly ($150 million versus $145 million).1
• Worldwide IT spending in 2012 is now slated to grow 3.7%, almost a full point decrease from earlier projections. But businesses continue to invest in software tools and applications, storage and network infrastructure, and mobile devices suggesting another year of steady IT market growth.2
PwCTechnology Sector Scorecard
7
1. PricewaterhouseCoopers/National Venture Capital Association MoneyTreeTM - Feb20122. Gartner press release - Jan 2012

U.S. Purchasing Manager’s Index (PMI) trends (2004-2011)60
.858
.656
.655
.353
.1 54.3 56
.055
.153
.92.
60 8 2.
90 .4 54
.6 58.2
56.2
54.4 57
.0 61.0
56.4
0 2.4
55
60
65
g g
49.4
49.5
47.3
45.3
5 5 5251
.50
.8 551
.
51.
51. 5 2
40
45
50
55
32.5 36.4
4
30
35
40
04 04 04 05 05 05 05 06 06 06 06 07 07 07 07 08 08 08 08 09 09 09 09 10 10 10 10 11 11 11 11
Recession Threshold (42.7)
2Q0
3Q0
4Q0
1Q0
2Q0
3Q0
4Q0
1Q0
2Q0
3Q0
4Q0
1Q0
2Q0
3Q0
4Q0
1Q0
2Q0
3Q0
4Q0
1Q0
2Q0
3Q0
4Q0
1Q1
2Q1
3Q1
4Q1
1Q 2Q 3Q 4Q
Quarter
The Purchasing Manager’s Index (PMI) recorded a high in Q1 2011 and then dropped to 51 in Q3. The last quarter saw the PMI recovering again. PMI rose further in January 2012 to 54
Source: ISM. IC Insights
Q3. The last quarter saw the PMI recovering again. PMI rose further in January 2012 to 54 but dropped again in February to 52.4.
PwCTechnology Sector Scorecard
8

Snapshot by subsectorSnapshot by subsector
PwCTechnology Sector Scorecard
9
Snapshot by subsectorSnapshot by subsector
Communications
PwCTechnology Sector Scorecard
10
Market analysisyCommunications
• Global sales of mobile devices increased by approximately 24.6 million units to 427.4 million units in Q4 2011 as compared to Q4 2010. The growth rate was lower compared to prior quarters and was i t d b l b l i f d t l 1impacted by global macroeconomic fundamentals.1
• Nokia lost approximately 8.2% market share, dropping to 26.6% in Q4 2011.1 The company incurred a net loss in the current quarter despite an increase in the average selling price (ASP). Volumes in the Devices and Service segment declined by 10.2 million units to 113.5 million units in Q4 2011 as compared to Q4 2010 Current quarter performance was adversely impacted by lower Smart Devices compared to Q4 2010. Current quarter performance was adversely impacted by lower Smart Devices volumes. This quarter was transformational for the company, owing to the introduction of new mobile and smartphones in the market.2 2012 will continue to be a year of transition, and may be impacted by uncertainties related to consumer demand; the timing and ramp-up related to new products, including Lumia devices; and pressure on margins owing to competition.2
• Cisco continued with its cost-cutting initiatives and reported good Q4 2011 results. The company plans to increase its M&A activity. Cisco reported an across-the-board revenue growth and increase in profit in the current quarter.3
• Motorola Solutions continued with its restructuring plans Q4 2011 results were impacted by the • Motorola Solutions continued with its restructuring plans. Q4 2011 results were impacted by the costs of restructuring its business, legal fees and amortization charges.4
1. Business Wire, IDC – Feb 20122. Nokia press release – Jan 2012
PwCTechnology Sector Scorecard
11
3. Crn.com – Feb 20124. Wirelessweek.com – Jan 2012
Market analysis continuedyCommunications
• Motorola Mobility earned revenue of $3.4 billion and recorded a net loss of $ 80 million in Q4 2011. The company experienced a fall in shipment of devices to 10.5 million units in Q4 2011 from 11.3
illi i i Q S h ib d d illi i i Q 1million units in Q4 2010. Smartphones contributed around 5.3 million units in Q4 2011.1
• Google Inc.'s $12.5 billion acquisition of Motorola Mobility Holdings Inc. received antitrust clearance from the U.S. Justice Department and the European Union, but regulators said they will monitor how Google and others use essential patents in the wireless industry. Google is still
iti tit t l f th t i h M t l d b i l Chi 2awaiting antitrust approval from other countries where Motorola does business, namely China.2
PwCTechnology Sector Scorecard
12
1. Techcrunch.com – Jan 20122. Reuters News – Feb 2012

Annual results of operations analysis f p yCommunications
Revenue and gross margin trends were as follows:
Revenues (in $ millions) – Communications Gross margin % – Communications
35,000
45,000
55,000
40.00%50.00%60.00%70.00%
5,000
15,000
25,000
Cisco Systems Inc Motorola Mobility H ldi I
Motorola S l ti I
Nokia Corp2011
0.00%10.00%20.00%30.00%
Cisco Systems Inc Motorola Mobility H ldi I
Motorola Solutions I
Nokia Corp2011
• Nokia’s total revenues declined by 4.5% from $55.9 billion in 2010 to $53.3 billion in 2011. The decline was primarily attributable to the fall in the net sales of Smart Devices and Mobile Phones. Though there was a significant volume growth in2011, the net sales and profitability of Nokia were adversely impacted by the rising competition from other smartphone platforms Nokia recently transitioned from the Symbian to the Windows platform with the launch of Lumia This coupled
Holdings Inc Solutions Inc
2010Holdings Inc Inc
2011
2010
platforms. Nokia recently transitioned from the Symbian to the Windows platform with the launch of Lumia. This, coupled with pricing actions owing to the competitive environment in both the smartphone and mobile phone markets, and Nokia’s absence in the growing dual-SIM phone market, resulted in the downward pressure on sales and profitability.
• Cisco’s revenues increased by 5.9% in 2011 over 2010, though its gross margin declined by 115 bps during the same period.
• Motorola Solutions witnessed a rise in annual revenue of 9.5%, while its gross margin increased by 30 bps in 2011. Motorola Solutions’ revenues increased due to a rise in demand in all regions for both the Enterprise and Government segments
PwCTechnology Sector Scorecard
13
Solutions revenues increased due to a rise in demand in all regions for both the Enterprise and Government segments.
• Motorola Mobility’s revenue was up by 14.0%, to $13.0 billion from $11.4 billion in 2010. Sales benefited from Motorola RAZR’s positive response in the market and strong performance in the Home business segment.

Annual results of operations analysis continuedf p yCommunications
R&D expenditure trends were as follows:
R&D expenses (in $ millions) – Communications R&D expenses (% of revenue) – Communications
4 0005,000 6,000 7,000 8,000
10 00%
15.00%
20.00%
-1,000 2,000 3,000 4,000
Cisco Systems Motorola Mobility Motorola Nokia Corp2011
0.00%
5.00%
10.00%
Cisco Systems I
Motorola Mobility H ldi I
Motorola S l ti I
Nokia Corp2011
• R&D expenditure as a percentage of revenue fell marginally for all companies except Nokia and Motorola Mobility.
• Nokia’s R&D spending increased by 0.6% y-o-y, primarily owing to higher expenditure in mobile phone research and development as a part of Nokia’s “next billion” strategy.
yInc
yHoldings Inc Solutions Inc
p2011
2010
Inc Holdings Inc Solutions Inc2011
2010
• Motorola Mobility’s R&D expenditure also rose by 3.2% in 2011, to $1.5 billion.
• Other companies reduced their R&D expenses primarily as a part of their cost-cutting strategy.
PwCTechnology Sector Scorecard
14

Annual results of operations analysis continued f p yCommunications
Net income trends were as follows:
Net income (in $ millions) – Communications
3 000
4,500
6,000
7,500
(1,500)
-
1,500
3,000
Cisco Systems Inc Motorola Mobility Holdings Inc Motorola Solutions Inc Nokia Corp
• Net income decreased for all the companies analyzed except Motorola Solutions, which grew by 82.9% in 2011 over 2010. The company’s higher annual revenues, coupled with lower interest expenses versus 2010, contributed to the increase in net income.
2011 2010
• Nokia’s net income decreased primarily due to its goodwill impairment of $1.4 billion in 2011.
• Motorola Mobility experienced an increase in operating expenses, especially in its SG&A, R&D expenditures and intangible amortization, which adversely impacted its net income.
PwCTechnology Sector Scorecard
15
Annual results of operations analysis continued f p yCommunications
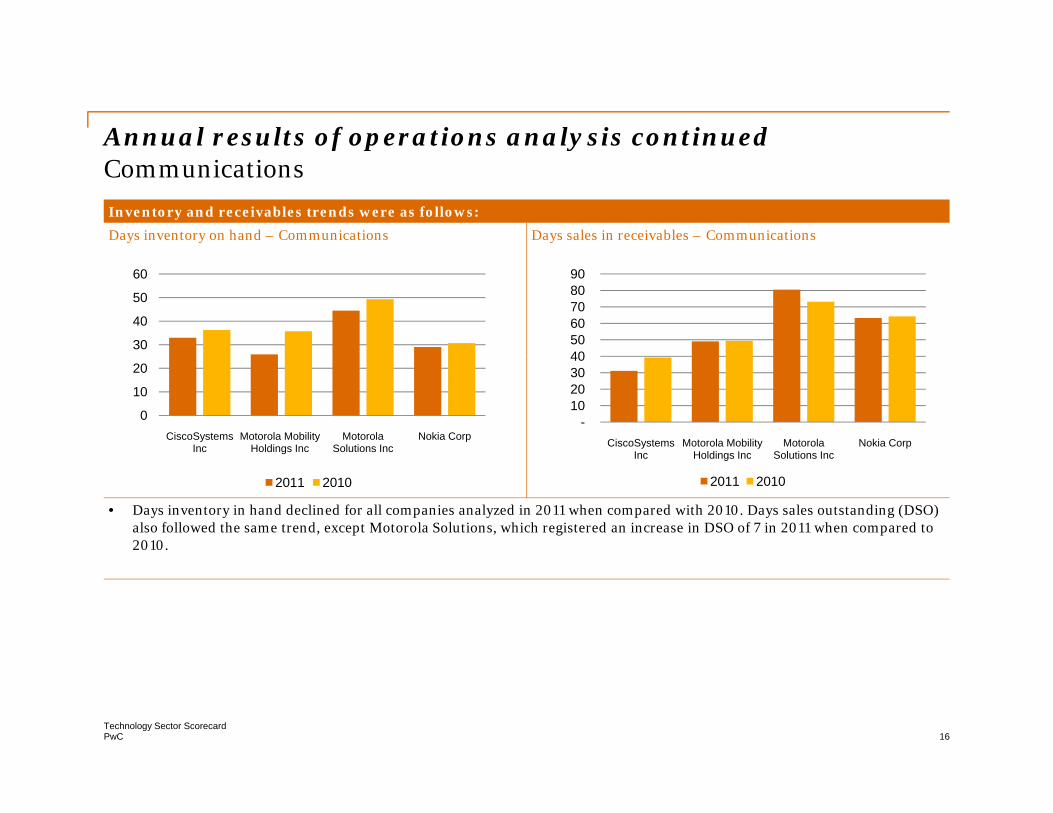
Inventory and receivables trends were as follows:
Days inventory on hand – Communications Days sales in receivables – Communications
30
40
50
60
4050 60 70 80 90
0
10
20
CiscoSystems Inc
Motorola Mobility Holdings Inc
Motorola Solutions Inc
Nokia Corp-
10 20 30 40
CiscoSystems Inc
Motorola Mobility Holdings Inc
Motorola Solutions Inc
Nokia Corp
• Days inventory in hand declined for all companies analyzed in 2011 when compared with 2010. Days sales outstanding (DSO) also followed the same trend, except Motorola Solutions, which registered an increase in DSO of 7 in 2011 when compared to 2010.
2011 2010
Inc Holdings Inc Solutions Inc
2011 2010
PwCTechnology Sector Scorecard
16
Annual results of operations analysis continuedf p yCommunications
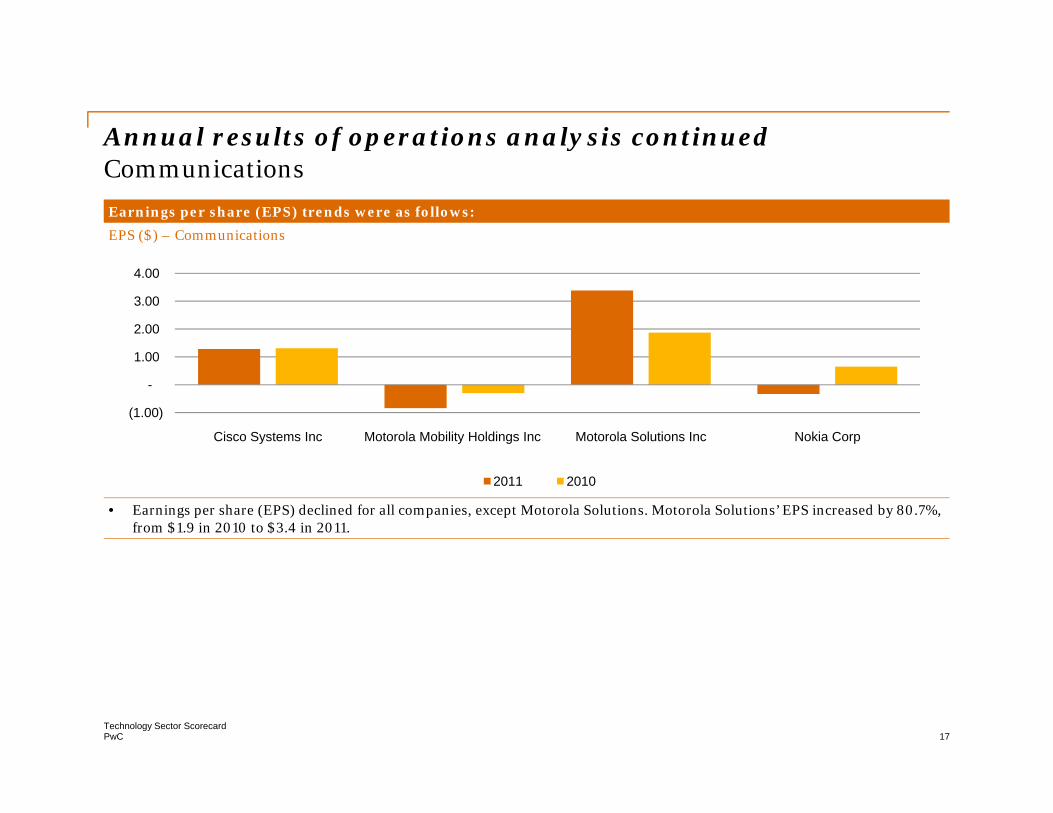
Earnings per share (EPS) trends were as follows:
EPS ($) – Communications
1 00
2.00
3.00
4.00
(1.00)
-
1.00
Cisco Systems Inc Motorola Mobility Holdings Inc Motorola Solutions Inc Nokia Corp
• Earnings per share (EPS) declined for all companies, except Motorola Solutions. Motorola Solutions’ EPS increased by 80.7%, from $1.9 in 2010 to $3.4 in 2011.
2011 2010
PwCTechnology Sector Scorecard
17

Q4 and Q3 performanceQ Q p fCommunications
Company Q4 2011Revenue Gross margin (%) Net income/(loss) EPS ($) Market capRevenue
($ millions)Gross margin (%) Net income/(loss)
($ millions)EPS ($) Market cap
($ millions)
Cisco Systems Inc 11,527 61.29% 2,182 0.40 105,037
Motorola Mobility Holdings Inc 3 436 24 85% (80) (0 27) 11 648Holdings Inc 3,436 24.85% (80) (0.27) 11,648
Motorola Solutions Inc 2,300 50.43% 184 0.56 14,757
Nokia Corp* 13,067 29.03% (1,405) (0.29) 17,883
*EUR to USD exchange rate used for Nokia is 1.306 USD/EUR.
Company Q3 2011Revenue
($ millions)Gross margin (%) Net income/(loss)
($ millions)EPS ($) Market cap
($ millions)
Cisco Systems Inc 11,256 61.21% 1,777 0.33 94,478
Motorola Mobility Holdings Inc 3,259 25.90% (32) (0.11) 11,315
Motorola Solutions Inc 2,105 50.36% 128 0.38 13,638
Nokia Corp* 12 303 27 94% (207) (0 03) 20 999
PwCTechnology Sector Scorecard
18
Nokia Corp* 12,303 27.94% (207) (0.03) 20,999
*EUR to USD exchange rate used for Nokia is 1.370 USD/EUR.

Q2 and Q1 performanceQ Q p fCommunications
Company Q2 2011Revenue
($ )Gross margin (%) Net income/(loss)
($ )EPS ($) Market cap
($ )($ millions) ($ millions) ($ millions)
Cisco Systems Inc 11,195 61.29% 1,232 0.22 87,838
Motorola Mobility Holdings Inc 3,337 25.89% (56) (0.19) 6,971
Motorola Solutions Inc 2,055 50.56% 349 1.00 15,954
Nokia Corp* 13,254 30.53% (703) (0.14) 24,709
*EUR to USD exchange rate used for Nokia is 1.429 USD/EUR.
Company Q1 2011Revenue
($ millions)Gross margin (%) Net income/(loss)
($ millions)EPS ($) Market cap
($ millions)
Cisco Systems Inc 10 866 61 28% 1 807 0 33 96 378Cisco Systems Inc 10,866 61.28% 1,807 0.33 96,378
Motorola Mobility Holdings Inc 3,032 24.90% (81) (0.27) 7,198
Motorola Solutions Inc 1,884 50.00% 497 1.44 15,074
Nokia Corp* 14,746 29.56% 328 0.13 61,883
PwCTechnology Sector Scorecard
19
p , ,
*EUR to USD exchange rate used for Nokia is 1.418 USD/EUR.

Quarterly results of operations analysis (Q4) Q y f p y (Q4)Communications
Revenue and gross margin trends were as follows:
Revenue (in $ millions) – Communications Gross margin % – Communications
20 000 70 00%
5 000
10,000
15,000
20,000
20 00%
30.00%
40.00%
50.00%
60.00%
70.00%
0
5,000
Q4 2010 Q1 2011 Q2 2011 Q3 2011 Q4 2011
Cisco Systems Inc Motorola Mobility Holdings Inc*
Motorola Solutions Inc* Nokia Corp
0.00%
10.00%
20.00%
Q4 2010 Q1 2011 Q2 2011 Q3 2011 Q4 2011
Cisco Systems Inc Motorola Mobility Holdings Inc*
Motorola Solutions Inc* Nokia Corp
• Cisco’s revenue for Q4 2011 increased by 10.8% to $11.5 billion versus $10.4 billion in 2010. The company is currently focused on improving gross margins, which remained flat sequentially in Q4 2011.
• Motorola Mobility’s Q4 2011 revenues were at $3.4 billion, up by 0.3% compared to Q4 2010 owing to higher revenues in the Mobile Devices segment. The company shipped 10.5 million mobile devices, which included 5.3 million smartphones in Q4
Motorola Solutions Inc* Nokia Corp Motorola Solutions Inc Nokia Corp
2011. Gross margins declined to 24.9% in Q4 2011 from 26.7% in Q4 2010.
• Nokia’s revenues in Q4 2011 declined by 21.7% versus Q4 2010. However, its performance on a quarter-over-quarter basis was positive – Q4 2011 revenue was 6.2% higher as compared to Q3 2011. The increase was attributable to the launch of the new phone model Lumia, which sold over 1 million units and to higher seasonal demand. Gross margin increased slightly on a quarter-over-quarter basis due to a margin increase in the Mobile Phones segment, which was offset by the decline in Smart Devices and low IPR royalty income
PwCTechnology Sector Scorecard
20
Devices and low IPR royalty income.
* Prior quarter financials (Q4 2010) for Motorola Mobility and Motorola Solutions are as per the 10K filed last quarter. The sharp variance in the revenues for Motorola Solutions isbecause Motorola Solutions’ prior quarter financials include Motorola Mobility’s results as “discontinued operations”.
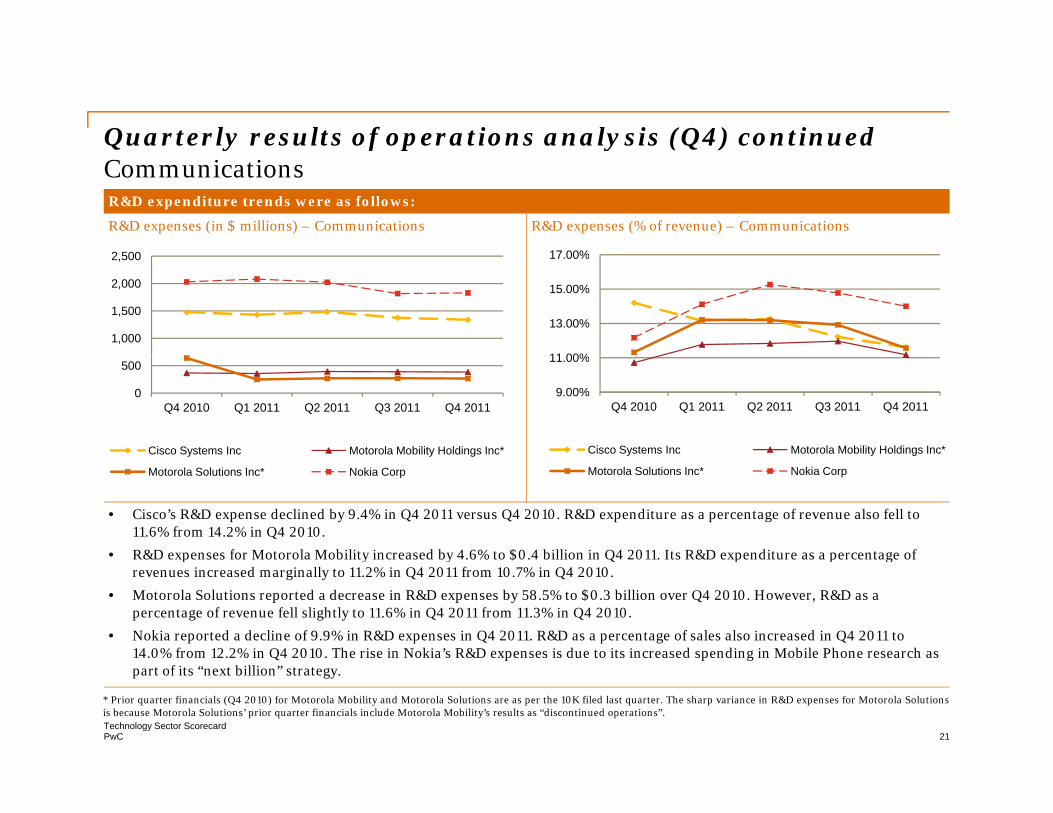
Quarterly results of operations analysis (Q4) continuedQ y f p y QCommunicationsR&D expenditure trends were as follows:
R&D expenses (in $ millions) – Communications R&D expenses (% of revenue) – Communications
2 500 17 00%
1,000
1,500
2,000
2,500
11 00%
13.00%
15.00%
17.00%
0
500
Q4 2010 Q1 2011 Q2 2011 Q3 2011 Q4 2011
Cisco Systems Inc Motorola Mobility Holdings Inc*
9.00%
11.00%
Q4 2010 Q1 2011 Q2 2011 Q3 2011 Q4 2011
Cisco Systems Inc Motorola Mobility Holdings Inc*
• Cisco’s R&D expense declined by 9.4% in Q4 2011 versus Q4 2010. R&D expenditure as a percentage of revenue also fell to 11.6% from 14.2% in Q4 2010.
• R&D expenses for Motorola Mobility increased by 4.6% to $0.4 billion in Q4 2011. Its R&D expenditure as a percentage of
Motorola Solutions Inc* Nokia Corp Motorola Solutions Inc* Nokia Corp
p y y 4 $ 4 Q4 p p grevenues increased marginally to 11.2% in Q4 2011 from 10.7% in Q4 2010.
• Motorola Solutions reported a decrease in R&D expenses by 58.5% to $0.3 billion over Q4 2010. However, R&D as a percentage of revenue fell slightly to 11.6% in Q4 2011 from 11.3% in Q4 2010.
• Nokia reported a decline of 9.9% in R&D expenses in Q4 2011. R&D as a percentage of sales also increased in Q4 2011 to 14.0% from 12.2% in Q4 2010. The rise in Nokia’s R&D expenses is due to its increased spending in Mobile Phone research as
PwCTechnology Sector Scorecard
21
part of its “next billion” strategy.
* Prior quarter financials (Q4 2010) for Motorola Mobility and Motorola Solutions are as per the 10K filed last quarter. The sharp variance in R&D expenses for Motorola Solutionsis because Motorola Solutions’ prior quarter financials include Motorola Mobility’s results as “discontinued operations”.

Quarterly results of operations analysis (Q4) continued Q y f p y QCommunicationsNet income trends were as follows:
Net income (in $ millions) – Communications
0
1,000
2,000
3,000
-2,000
-1,000
0
Q4 2010 Q1 2011 Q2 2011 Q3 2011 Q4 2011
Cisco Systems Inc Motorola Mobility Holdings Inc* Motorola Solutions Inc* Nokia Corp
• Cisco reported a robust increase in net income of 43.5% to $2.1 billion in Q4 2011 from $1.5 billion in Q4 2010. The rise wasprimarily attributible to lower operating expenses. Amortization of intangible assets was 52.2% lower than in Q4 2010. Lower R&D expenses and SG&A, along with lower interest expense and higher interest income, favorably contributed to the net income trend.
• Motorola Mobility incurred a a net loss of $80.0 million in Q4 2011 against a net income of $80 million in Q4 2010. Higher y g gcost of goods sold, SG&A and R&D expenses contributed to the decline in net income.
• Motorola Solutions reported a decline in net income of 37.2% to $184 million in Q4 2011 from $0.3 billion in Q4 2010. Lower earnings from discontinued operations and higher income tax expense resulted in the fall in net income.
• Nokia suffered a net loss of $1.4 billion in Q4 2011 from a net income of $0.9 billion in Q4 2010. In spite of an increase inaverage selling price (ASP), the company had an operating loss due to the goodwill impairment of $1.0 billion, which was
b i
PwCTechnology Sector Scorecard
22
absent in Q4 2010.
* Prior quarter financials (Q4 2010) for Motorola Mobility and Motorola Solutions are as per the 10K filed last quarter. The sharp variance in Net Income for Motorola Solutions isbecause Motorola Solutions’ prior quarter financials include Motorola Mobility’s results as “discontinued operations”.

Quarterly results of operations analysis (Q4) continued Q y f p y QCommunicationsInventory and receivables trends were as follows:
Days inventory on hand – Communications Days sales in receivables – Communications
60 80
30
45
60
40
60
80
0
15
Q4 2010 Q1 2011 Q2 2011 Q3 2011 Q4 2011
Cisco Systems Inc Motorola Mobility Holdings Inc
0
20
Q4 2010 Q1 2011 Q2 2011 Q3 2011 Q4 2011
Cisco Systems Inc Motorola Mobility Holdings Inc
• Cisco’s days inventory on hand decreased to 32 days in Q4 2011 from 35 days in Q4 2010. Receivable days declined to 30 days from 40 days in Q4 2010, as total receivables declined by 16.1% versus a rise in revenue of 10.8% in Q4 2011.
• Motorola Mobility’s inventory decreased to 24 days in Q4 2011 versus 28 days in Q3 2011. Receivable days declined by 2 days
y y g
Motorola Solutions Inc Nokia Corp
y y g
Motorola Solutions Inc Nokia Corp
to 47 days against Q3 2011.
• Motorola Solutions experienced a decline in inventory days to 40 days in Q4 2011 from 47 days in Q3 2011.
• Nokia’s days inventory increased by 5 days to 30 days in Q4 2011 as compared to Q4 2010.
PwCTechnology Sector Scorecard
23

Quarterly results of operations analysis (Q4) continuedQ y f p y QCommunicationsEPS (earnings per share) and P/E trends were as follows:
EPS ($) – Communications P/E – Communications
2 00
0.50
1.00
1.50
2.00
10 00
20.00
30.00
-0.50
0.00
Q4 2010 Q1 2011 Q2 2011 Q3 2011 Q4 2011Cisco Systems Inc Motorola Mobility Holdings Inc*
Motorola Solutions Inc* Nokia Corp
0.00
10.00
Q4 2010 Q1 2011 Q2 2011 Q3 2011 Q4 2011
Cisco Systems Inc Motorola Mobility Holdings Inc*
Motorola Solutions Inc* Nokia Corp
• Cisco’s EPS increased from $0.33 in Q3 2011 to $0.40 in Q4 2011 owing to a rise in net income by 22.8% against last quarter. Its price-earning (P/E) multiple decreased slightly to 15.2 in Q4 2011 from 15.3 in Q3 2011.
• A rise of 43.8% in net income over Q3 2011 contributed to an increase in EPS to $0.56 in Q4 2011 from$0.38 in Q3 2011 for Motorola Solutions The P/E multiple increased in Q4 2011 to 13 7 from 11 4 in Q3 2011
Motorola Solutions Inc Nokia Corp Motorola Solutions Inc Nokia Corp
Motorola Solutions. The P/E multiple increased in Q4 2011 to 13.7 from 11.4 in Q3 2011.
• Nokia had a negative EPS, which deteriorated as compared to Q3 2011 owing to a higher net loss in Q4 2011.
PwCTechnology Sector Scorecard
24
* Prior quarter financials (Q4 2010) for Motorola Mobility and Motorola Solutions are as per the 10K filed last quarter. The sharp variance in EPS for Motorola Solutions is becauseMotorola Solutions’ prior quarter financials include Motorola Mobility results as “discontinued operations”.
Snapshot by subsectorSnapshot by subsector
Consumer Electronics
PwCTechnology Sector Scorecard
25

Market analysisyConsumer Electronics• Lack of improvement in the employment and housing problems in the US, along with the sovereign
debt crisis in Europe, impacted the Consumer Electronics sector as a whole in 2011.
• Japanese Consumer Electronics companies, namely Canon, Sony and Toshiba, were hit due to the sharp appreciation of the yen, the earthquake in Japan and massive floods in Thailand, resulting in a slowdown of the economy.
• Apple Inc.’s net sales during this quarter increased $19.6 billion compared to the same quarter in 2011. This increase in net sales was driven by the launch of iPhone 4S, expanded distribution of the iPhone with new carriers, strong demand for iPad and higher sales from the iTunes store, partially offset by decreased sales of iPod.
• Analysts believe that Apple is well positioned to maintain momentum across key product lines driven by innovation in hardware, software and its services ecosystem. Analysts also think that for the iPhone business with continued backlog, as well as additional carrier expansion, share gains in the fast-growing smartphone segment will continue. In the case of the iPad, growth should be driven by a product refresh and a possible price cut.1
i hi h i i l h h i l i d b l h• Within the Consumer Business Unit, although Canon was negatively impacted by supply shortages caused by the earthquake and floods, efforts to ramp up production and boost sales in response to robust demand resulted in significant increases in year-on-year sales volumes for digital SLR cameras. With respect to inkjet printers, unit sales increased year on year, largely owing to growth in emerging markets.2
PwCTechnology Sector Scorecard
26
in emerging markets.
1. Credit Suisse - Jan 20122. Canon Inc.’s earnings release - Jan 2012
Market analysis continued
• In 2012, despite concerns over negative effects arising from stagnant economies mainly in Europe, Canon expects demands for products such as network digital MFDs and laser printers to realize solid growth While solid demand for digital SLR cameras is expected in all regions around the
yConsumer Electronics
solid growth. While solid demand for digital SLR cameras is expected in all regions around the globe, demand for compact digital cameras is projected to remain relatively unchanged in developed countries.1
• Philips’ fourth quarter results were impacted by weak European sales, postponement in deliveries of existing orders in the Healthcare sector and inventory correction actions and other operational existing orders in the Healthcare sector, and inventory correction actions and other operational issues in the Lighting business. These issues were partially offset by strong results in the Consumer Lifestyle growth businesses, which benefited from the early adoption of the Accelerate! change and performance improvement program.2
• Philips expects 2012 results to be affected by restructuring charges and one-time investments aimed Philips expects 2012 results to be affected by restructuring charges and one time investments aimed at improving their business performance trajectory as a part of the multi-year Accelerate! program. Excluding these additional charges, the company expects the underlying operating margins and capital efficiency in the sectors to improve in the latter part of 2012.2
• Sony Corporation’s operating profit was sharply down year on year mainly due to widening losses in Sony Corporation s operating profit was sharply down year on year mainly due to widening losses in the TV business, plus margin erosion in the digital camera, PC, component and professional solutions businesses owing to yen appreciation and the floods in Thailand.3
PwCTechnology Sector Scorecard
27
1. Canon Inc.’s earnings release - Jan 20122. Philips press release3. JP Morgan - Feb 2012
Market analysis continued
• Sony expects consolidated sales for the fiscal year ending March 31, 2012 to be ¥6,400 billion, slightly below their November forecast. This change is due to lower expected sales, mainly in the Consumer Electronics and Services segment resulting primarily from deterioration in the operating
yConsumer Electronics
Consumer Electronics and Services segment, resulting primarily from deterioration in the operating environment in developed countries.
• The consolidated sales of Toshiba Group were ¥4,353.9 billion, a year on year decrease of ¥315.7 billion. This was largely due to lower sales in the Digital Products and Electronic Devices segment.
• Toshiba’s Visual Product business, which includes LCD TVs, recorded a significant decrease in sales in Japan. The business saw the completion of the transition to terrestrial digital broadcasting, expiration of the eco-point stimulus program and price declines. The Storage Products business saw sales rise mainly due to a healthy performance by hard disk drives for mobile applications. However, the Semiconductor business saw a decrease in sales due to sharp yen appreciation the floods in the Semiconductor business saw a decrease in sales due to sharp yen appreciation, the floods in Thailand, price declines and a fall in demand for discrete semiconductors and system LSI.
PwCTechnology Sector Scorecard
28

Annual results of operations analysisf p yConsumer Electronics
Revenue and gross margin trends were as follows:
Revenues (in $ millions) – Consumer Electronics Gross margin % – Consumer Electronics
50 00%
60 000
80,000
100,000
120,000
30.00%
40.00%
50.00%
-
20,000
40,000
60,000
Apple Canon Inc Philips Sony Corp Toshiba0.00%
10.00%
20.00%
Apple Canon Inc Philips Sony Corp Toshiba
• Revenues for Consumer Electronics companies in 2011 exhibited a mixed trend when compared to 2010. Apple’s rise in revenue is directly attributable to the increased sales of iPhones, iPads and Mac computers. Canon’s revenue in the current year was lower by 4.0% in local currency (¥3,557.43 in 2011 vs. ¥3,706.90 in 2010), impacted by strong yen appreciation, earthquake and floods. Sales growth for Philips was lower when compared to last year due to weakness in European markets.
Apple Canon Inc Philips Sony Corp Toshiba2011 2010 2011 2010
q g p p y pRevenue for Sony decreased due to lower sales in Consumer Electronics & Services and Professional Device & Solutions segments. Toshiba’s revenue in 2011 was almost flat when compared to 2010.
• Gross margins for Consumer Electronics companies were largely consistent with the prior year, except for Apple whose gross margin increased by 365 bps. Apple’s increase in gross margin was largely driven by lower commodity and a mix of other product costs.
PwCTechnology Sector Scorecard
29

Annual results of operations analysis continuedf p yConsumer Electronics
R&D expenditure trends were as follows:
R&D expenses (in $ millions) – Consumer Electronics* R&D expenses (% of revenue) – Consumer Electronics*10 00%
2,000.00 2,500.00 3,000.00 3,500.00 4,000.00
4 00%
6.00%
8.00%
10.00%
-500.00
1,000.00 1,500.00
Apple Canon Inc Philips0.00%
2.00%
4.00%
Apple Canon Inc Philips
*Sony and Toshiba do not report R&D expense separately in public filings
• Research & Development (R&D) expenses for Consumer Electronics companies showed an upward trend when compared to last year. Apple showed the highest growth at 33.3% primarily due to an increase in headcount. R&D expenditure improved by 5.4% and 6.4% for Canon and Philips respectively. R&D as a percentage of revenue declined for Apple, due to a significant growth in the company’s net sales when compared to prior year while it remained consistent for Canon
2011 2010 2011 2010
growth in the company s net sales when compared to prior year, while it remained consistent for Canon.
PwCTechnology Sector Scorecard
30

Annual results of operations analysis continuedf p yConsumer Electronics
Net income trends were as follows:
Net income (in $ millions) – Consumer Electronics
20,000.00
30,000.00
40,000.00
(10,000.00)
-
10,000.00
Apple Canon Inc Philips Sony Corp Toshiba
• Net income for Consumer Electronics companies showed a mixed trend, as some were negatively impacted by the economic downturns in the US and Europe. Higher net income for Apple is directly attributable to higher net sales. Canon’s net income in local currency was in line with the prior year (¥248.63 in 2011 vs. ¥246.60). Lower net income for Philips was primarily due to lower sales in 2011 Sony’s net income declined due to decreased sales significant deterioration in the net income of
Apple Canon Inc Philips Sony Corp Toshiba
2011 2010
due to lower sales in 2011. Sony s net income declined due to decreased sales, significant deterioration in the net income ofaffiliated companies and a smaller benefit from foreign exchange gains. Toshiba recorded an increase of 8.3% in its net income compared to prior year.
PwCTechnology Sector Scorecard
31

Annual results of operations analysis continuedf p yConsumer Electronics
Inventory and receivables trends were as follows:
Days inventory on hand – Consumer Electronics Days sales in receivables – Consumer Electronics
50 60 70 80 90
100
40 50 60 70 80
-10 20 30 40
Apple Inc Canon Inc Philips Sony Corp Toshiba-
10 20 30
Apple Inc Canon Inc Philips Sony Corp Toshiba
• Days inventory on hand increased for Canon, Philips and Toshiba, while it declined for Apple and Sony. Despite an increase ininventories, Apple’s significant growth in sales in 2011 contributed to the decline in days inventory. Canon optimized its inventory levels to meet the growing demand and recorded the highest increase (20 days) in days inventory on hand.
Apple Inc Canon Inc Philips Sony Corp Toshiba
2011 2010
Apple Inc Canon Inc Philips Sony Corp Toshiba2011 2010
• Days sales in receivables also followed a mixed trend in 2011, with Philips and Toshiba registering an increase while Apple, Canon and Sony recorded declines. The largest increase was for Philips, whose DSO increased from 63 days in 2010 to 68 days in 2011.
PwCTechnology Sector Scorecard
32

Annual results of operations analysis continuedf p yConsumer Electronics
Earnings per share (EPS) trends were as follows:
EPS($) – Consumer Electronics
15.00 20.00 25.00 30.00 35.00 40.00
(10.00)(5.00)
-5.00
10.00
Apple Inc Canon Inc Philips Sony Corp Toshiba
• EPS increased for Consumer Electronics companies except for Philips and Sony which recorded negative EPS in 2011. Apple’s EPS grew from $ 17.91 in 2010 to $ 35.11 in 2011 on the back of strong demand for iPhones, iPads and Macs. Philips recorded negative EPS as a result of goodwill impairment charges, lower earnings and a loss from discontinued operations mainly related to disentanglement costs for the Television business Sony’s EPS was impacted by natural disasters in 2011 and hence
2011 2010
related to disentanglement costs for the Television business. Sony s EPS was impacted by natural disasters in 2011 and, hence, the company recorded negative EPS in all the four quarters. Canon and Toshiba registered a positive growth in EPS in 2011.
PwCTechnology Sector Scorecard
33

Q4 and Q3 performanceQ Q p fConsumer Electronics
Company Q4 2011
Revenue Gross Net income/(loss) EPS Market cap ($ millions) margin (%)
( )($ millions)
p($ millions)
Apple Inc 46,333 44.68% 13,064 13.87 377,547
Canon Inc 12,369 47.63% 788 0.70 529,155
Philips* 9 054 35 92% (219) (0 23) 19 402Philips* 9,054 35.92% (219) (0.23) 19,402
Sony Corp 23,370 30.74% (2038) (2.03) 18,105
Toshiba Corporation 18,479 22.10% (136) (0.03) 17,152
*EUR to USD exchange rate used for Philips is 1.349 USD/EUR.
Company Q3 2011
Revenue($ millions)
Grossmargin (%)
Net income/(loss)($ millions)
EPS Market cap ($ millions)
Apple Inc 28,270 40.25% 6,623 7.05 370,327pp , , ,
Canon Inc 11,908 49.35% 1,011 0.84 54,380
Philips* 7,633 38.30% 105 0.11 16,865
Sony Corp 20,454 33.84% (350) (0.35) 19,068
Toshiba Corporation 20,602 24.66% 288 0.07 17,448
PwCTechnology Sector Scorecard
34
*EUR to USD exchange rate used for Philips is 1.415 USD/EUR.

Q2 and Q1 performanceQ Q p fConsumer Electronics
Company Q2 2011
Revenue Gross Net income/(loss) EPS Market cap ($ millions) margin (%) ($ millions) ($ millions)
Apple Inc 28,571 41.73% 7,308 7.79 307,769
Canon Inc 10,328 50.03% 665 0.54 57,849
Philips* 7 496 39 19% (1 933) (2 00) 24 710Philips 7,496 39.19% (1,933) (2.00) 24,710
Sony Corp 18,456 34.88% (191) (0.19) 26,484
Toshiba Corporation 16,372 23.44% 5,802 - 22,361
*EUR to USD exchange rate used for Philips is 1.438 USD/EUR.
Company Q1 2011
Revenue($ millions)
Grossmargin (%)
Net income/(loss)($ millions)
EPS Market cap ($ millions)
Apple Inc 24,667 41.42% 5,987 6.40 324,043
Canon Inc 10,111 48.41% 668 0.54 53,254
Philips* 7,186 40.42% 187 0.19 30,477
Sony Corp 19,046 30.28% (4,684 ) (4.67) 31,944
Toshiba Corporation 20,830 23.51% 1,177 0.28 20,921
*EUR t USD h t d f Phili i 1 367 USD/EUR
PwCTechnology Sector Scorecard
35
*EUR to USD exchange rate used for Philips is 1.367 USD/EUR.
Quarterly results of operations analysis (Q4)Q y f p y QConsumer ElectronicsRevenue and gross margin trends were as follows:
Revenues (in $ millions) – Consumer Electronics Gross margin % – Consumer Electronics
20,000
30,000
40,000
50,000
40.00%
60.00%
80.00%
0
10,000
Q4 2010 Q1 2011 Q2 2011 Q3 2011 Q4 2011
Apple Inc Canon IncPhilips Sony Corp
0.00%
20.00%
Q4 2010 Q1 2011 Q2 2011 Q3 2011 Q4 2011
Apple Inc Canon IncPhilips Sony Corp
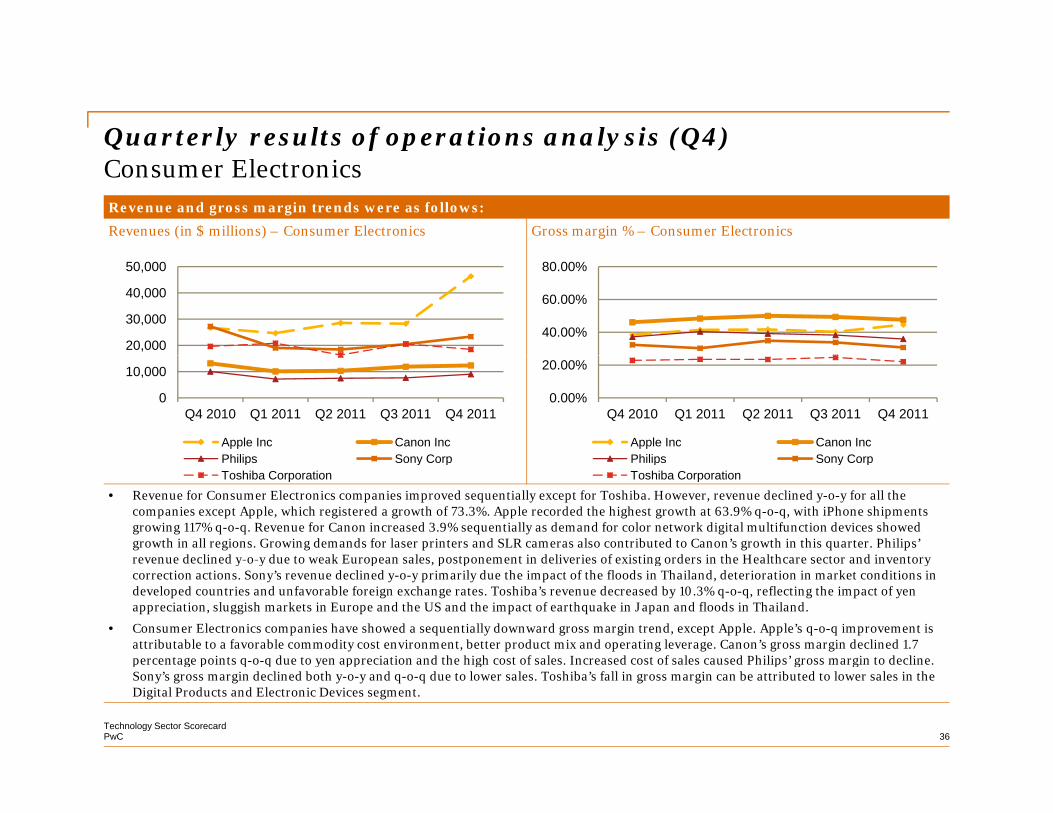
• Revenue for Consumer Electronics companies improved sequentially except for Toshiba. However, revenue declined y-o-y for all thecompanies except Apple, which registered a growth of 73.3%. Apple recorded the highest growth at 63.9% q-o-q, with iPhone shipments growing 117% q-o-q. Revenue for Canon increased 3.9% sequentially as demand for color network digital multifunction devices showed growth in all regions. Growing demands for laser printers and SLR cameras also contributed to Canon’s growth in this quarter. Philips’ revenue declined y-o-y due to weak European sales postponement in deliveries of existing orders in the Healthcare sector and inventory
Philips Sony CorpToshiba Corporation
Philips Sony CorpToshiba Corporation
revenue declined y o y due to weak European sales, postponement in deliveries of existing orders in the Healthcare sector and inventory correction actions. Sony’s revenue declined y-o-y primarily due the impact of the floods in Thailand, deterioration in market conditions in developed countries and unfavorable foreign exchange rates. Toshiba’s revenue decreased by 10.3% q-o-q, reflecting the impact of yen appreciation, sluggish markets in Europe and the US and the impact of earthquake in Japan and floods in Thailand.
• Consumer Electronics companies have showed a sequentially downward gross margin trend, except Apple. Apple’s q-o-q improvement is attributable to a favorable commodity cost environment, better product mix and operating leverage. Canon’s gross margin declined 1.7 percentage points q-o-q due to yen appreciation and the high cost of sales. Increased cost of sales caused Philips’ gross margin to decline.
PwCTechnology Sector Scorecard
36
percentage points q o q due to yen appreciation and the high cost of sales. Increased cost of sales caused Philips gross margin to decline. Sony’s gross margin declined both y-o-y and q-o-q due to lower sales. Toshiba’s fall in gross margin can be attributed to lower sales in the Digital Products and Electronic Devices segment.

Quarterly results of operations analysis (Q4) continuedQ y f p y QConsumer Electronics
R&D expenditure trends were as follows:
R&D expenses (in $ millions) – Consumer Electronics* R&D expenses (% of revenue) – Consumer Electronics*
400600800
1,0001,200
6.00%
9.00%
12.00%
15.00%
0200400
Q4 2010 Q1 2011 Q2 2011 Q3 2011 Q4 2011
Apple Inc Canon Inc Philips
0.00%
3.00%
Q4 2010 Q1 2011 Q2 2011 Q3 2011 Q4 2011
Apple Inc Canon Inc Philips
*Sony and Toshiba do not report R&D expense separately in public filings.
• R&D expenses for Consumer Electronics companies improved both q-o-q and y-o-y. Apple’s R&D expenses increased y-o-y primarily due to an increase in headcount and related expenses to support R&D activities. Canon’s R&D expense improved sequentially due to acceleration of production innovation activities. Philips’ R&D expenses improved by 10.0% this quarter due to increased investments in new product innovation and sales channels and increased headcount due to acquisitions
Apple Inc Canon Inc Philips Apple Inc Canon Inc Philips
due to increased investments in new product innovation and sales channels and increased headcount due to acquisitions.
• In this quarter R&D as a percentage of income declined by 65 bps for Apple, by 52 bps for Philips and remained almost flat for Canon. Apple’s R&D expenses as a percentage of revenue decreased due to the 63.9% y-o-y increase in net sales.
PwCTechnology Sector Scorecard
37

Quarterly results of operations analysis (Q4) continuedQ y f p y QConsumer Electronics
Net income trends were as follows:
Net income (in $ millions) – Consumer Electronics
4000
9000
14000
-6000
-1000
4000
Q4 2010 Q1 2011 Q2 2011 Q3 2011 Q4 2011
• Net income for Consumer Electronics companies in the analysis showed a negative trend in this quarter except for Apple which exhibited a significant rise of 97.3% q-o-q. Apple’s net income improved y-o-y due to 133%, 99% and 22% higher sales of iPhones, iPads and Mac computers respectively. Canon’s net income increased by 18.3% y-o-y due to a lower effective income tax rate
Apple Inc Canon Inc Philips Sony Corp Toshiba Corporation
income tax rate.
• Philips’ net income declined significantly y-o-y, largely attributable to lower earnings and a higher loss from discontinued operations. Sony’s y-o-y decline in net income resulted from lower sales of LCD televisions due to deteriorating market conditions in Japan, Europe and North America. Net income for Toshiba decreased compared to the same period last year due to lower sales of Digital Products and Electronic Devices, reflecting the impact of sharp yen appreciation, the March earthquake, the floods in Thailand and demand deterioration.
PwCTechnology Sector Scorecard
38
q

Quarterly results of operations analysis (Q4) continuedQ y f p y QConsumer Electronics
Inventory and receivables trends were as follows:
Days inventory on hand – Consumer Electronics Days sales in receivables – Consumer Electronics
406080
100120
406080
100120140
02040
Q4 2010 Q1 2011 Q2 2011 Q3 2011 Q4 2011
Apple Inc Canon IncPhilips Sony Corp
02040
Q4 2010 Q1 2011 Q2 2011 Q3 2011 Q4 2011
Apple Inc Canon IncPhilips Sony Corp
• Days inventory on hand declined significantly for Canon, Philips and Sony when compared to the previous quarter. The decline is directly attributable to lower inventories in the current quarter. Inventory for Philips declined across all sectors and Sony registered lower inventories due to valuation loss in its unprofitable TV business. Apple’s days inventory was in line withthe previous quarters while Toshiba had a sequential increase of six days
Philips Sony CorpToshiba Corporation
Philips Sony CorpToshiba Corporation
the previous quarters, while Toshiba had a sequential increase of six days.
• Days sales in receivables (DSO) increased sequentially for all companies except for Philips which registered a decline of 10 days. DSOs for Apple and Sony were in line with the previous quarter. Toshiba had the highest growth as its DSO increased from 57 days in the previous quarter to 64 days in the current quarter.
PwCTechnology Sector Scorecard
39

Quarterly results of operations analysis (Q4) continuedQ y f p y QConsumer Electronics
EPS and P/E trends were as follows:
EPS($) – Consumer Electronics P/E – Consumer Electronics
2.505.007.50
10.0012.5015.00
16
24
32
40
-5.00-2.500.00
Q4 2010 Q1 2011 Q2 2011 Q3 2011 Q4 2011
Apple Inc Canon IncPhili S C
0
8
Q4 2010 Q1 2011 Q2 2011 Q3 2011 Q4 2011
Apple Inc Canon IncPhilips Sony Corp
• EPS for Consumer Electronics companies registered significant movements, with Philips, Sony and Toshiba recording negative EPS of $0.23, $2.03 and $0.03 respectively. Philips’ negative EPS was due to its lower earnings and a higher loss from discontinued operations which included an after-tax loss related to the Television business. Sony’s EPS was impacted by the floods in Thailand which negatively affected digital cameras and camcorders Also the company recorded valuation losses
Philips Sony CorpToshiba Corporation
Philips Sony CorpToshiba Corporation
the floods in Thailand which negatively affected digital cameras and camcorders. Also, the company recorded valuation losses on S-LCD shares and an appraisal loss allowance for Sony Ericsson. Apple’s EPS almost doubled due to increased holiday sales and an additional week in the December quarter. EPS for Canon and Toshiba declined sequentially.
• Consumer Electronics companies recorded lower P/E this quarter, except for Toshiba, as stock prices did not show any significant upward trend. Analysts believe that the new iPad 3 and iPhone 5 will help maintain sales momentum for Apple in 2012 and lead to higher P/E in the coming quarters. Canon is expected to benefit from the growth potential of the SLR
PwCTechnology Sector Scorecard
40
g / g q p g pbusiness. Overall, P/E for the sector is expected to rise.

Snapshot by subsectorSnapshot by subsector
EMS/Distributors
PwCTechnology Sector Scorecard
41
Market analysis yEMS/Distributors
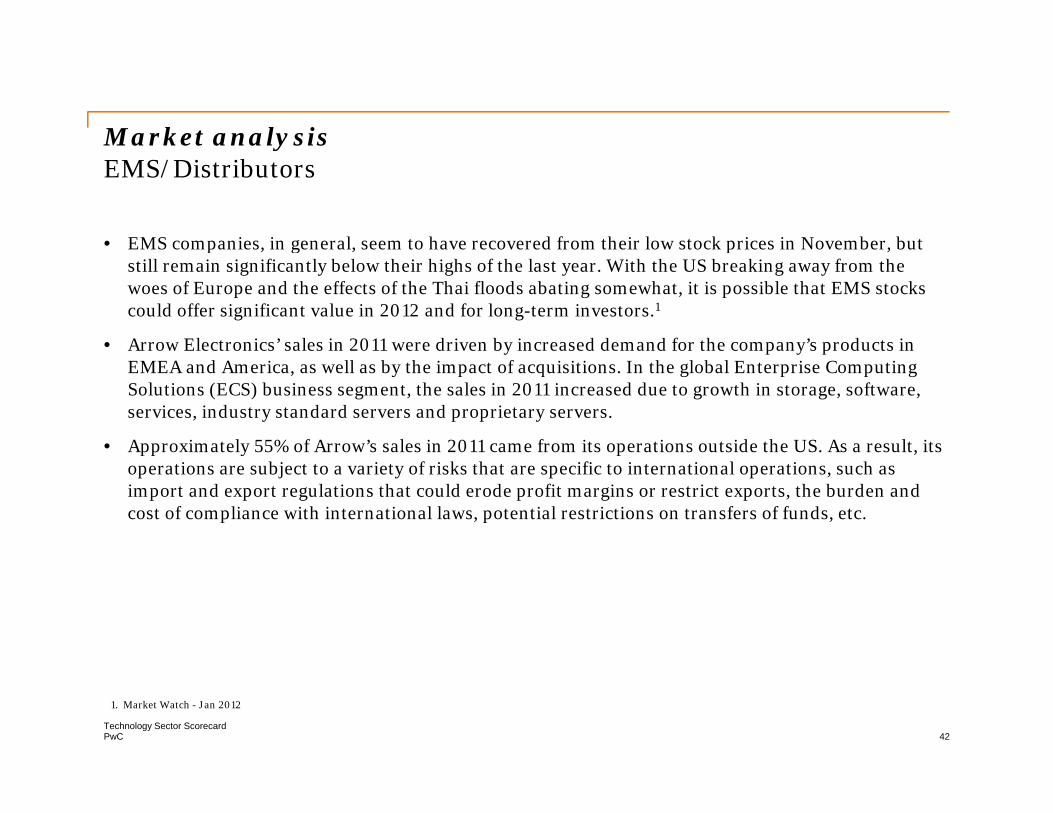
• EMS companies, in general, seem to have recovered from their low stock prices in November, but p g pstill remain significantly below their highs of the last year. With the US breaking away from the woes of Europe and the effects of the Thai floods abating somewhat, it is possible that EMS stocks could offer significant value in 2012 and for long-term investors.1
• Arrow Electronics’ sales in 2011 were driven by increased demand for the company’s products in EMEA and America, as well as by the impact of acquisitions. In the global Enterprise Computing Solutions (ECS) business segment, the sales in 2011 increased due to growth in storage, software, services, industry standard servers and proprietary servers.
• Approximately 55% of Arrow’s sales in 2011 came from its operations outside the US. As a result, its operations are subject to a variety of risks that are specific to international operations, such as import and export regulations that could erode profit margins or restrict exports, the burden and cost of compliance with international laws, potential restrictions on transfers of funds, etc.
PwCTechnology Sector Scorecard
42
1. Market Watch - Jan 2012
Market analysis continued yEMS/Distributors
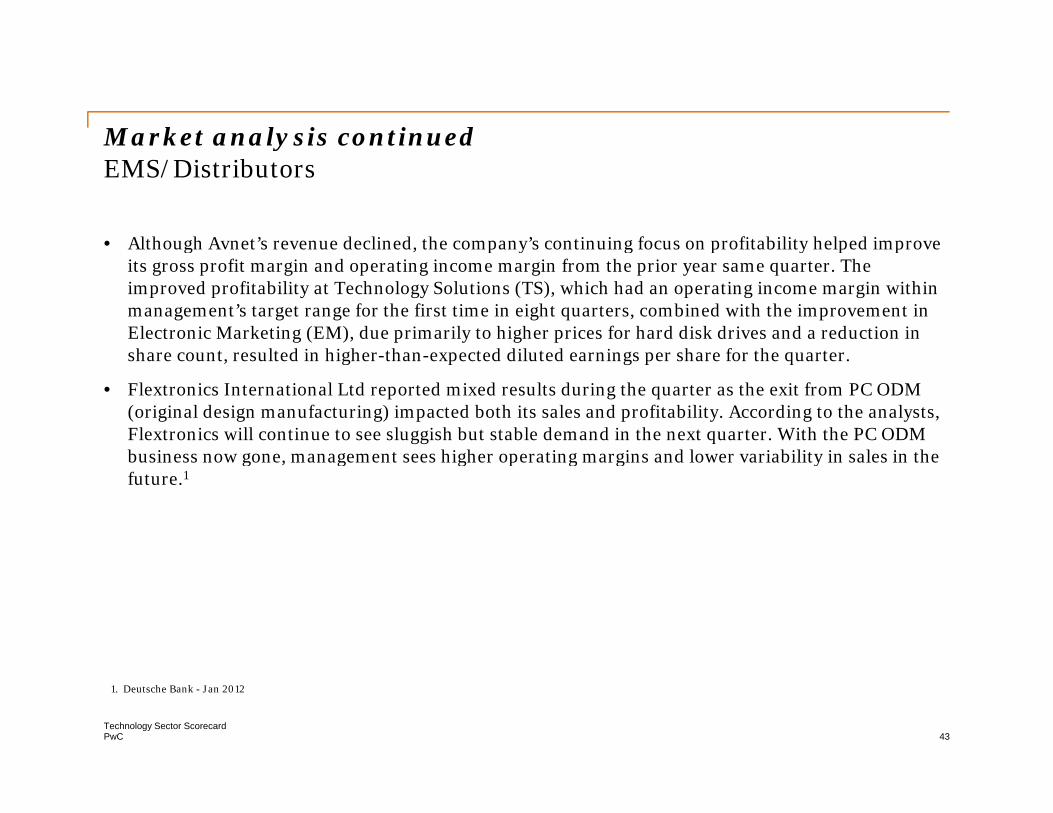
• Although Avnet’s revenue declined, the company’s continuing focus on profitability helped improve g p y g p y p pits gross profit margin and operating income margin from the prior year same quarter. The improved profitability at Technology Solutions (TS), which had an operating income margin within management’s target range for the first time in eight quarters, combined with the improvement in Electronic Marketing (EM), due primarily to higher prices for hard disk drives and a reduction in share count resulted in higher-than-expected diluted earnings per share for the quartershare count, resulted in higher-than-expected diluted earnings per share for the quarter.
• Flextronics International Ltd reported mixed results during the quarter as the exit from PC ODM (original design manufacturing) impacted both its sales and profitability. According to the analysts, Flextronics will continue to see sluggish but stable demand in the next quarter. With the PC ODM business now gone management sees higher operating margins and lower variability in sales in the business now gone, management sees higher operating margins and lower variability in sales in the future.1
PwCTechnology Sector Scorecard
43
1. Deutsche Bank - Jan 2012

Annual results of operations analysis f p yEMS/Distributors
Revenue and gross margin trends were as follows:
Revenues (in $ millions) – EMS/Distributors Gross margin % – EMS/Distributors
15,000 20,000 25,000 30,000 35,000
9.00%
12.00%
15.00%
-5,000
10,000 ,
Arrow Electronics Inc
Avnet Inc Flextronics International
0.00%
3.00%
6.00%
Arrow Electronics I
Avnet Inc Flextronics I t ti l
• Revenue for EMS companies improved in 2011 compared to 2010. The 14.1% increase in sales for Arrow was driven by an increase of 12.8% in the global components business segment sales and an increase of 17.2% in global ECS business segment sales, compared to last year. Avnet registered a 16.5% growth this year compared to last year due to the combination of acquisitions and organic growth Flextronics recorded revenue growth of 7 9% due to increased sales across all markets
Limited2011 2010
Inc International Limited2011 2010
acquisitions and organic growth. Flextronics recorded revenue growth of 7.9% due to increased sales across all markets.
• Gross margin increased for Arrow in 2011, but declined for Avnet and Flextronics. The increase in margin for Arrow was mainly due to improved pricing and a favorable mix towards higher-profit margin products in both global components and global ECS businesses. The gross margin of Flextronics decreased by 41 bps due to a higher mix of low-margin products and unfavorable manufacturing costs.
PwCTechnology Sector Scorecard
44
Annual results of operations analysis continued f p yEMS/Distributors
Net income trends were as follows:
Net income (in $ millions) – EMS/Distributors
300.00 400.00 500.00 600.00 700.00
-100.00 200.00
Arrow Electronics Inc Avnet Inc Flextronics International Limited
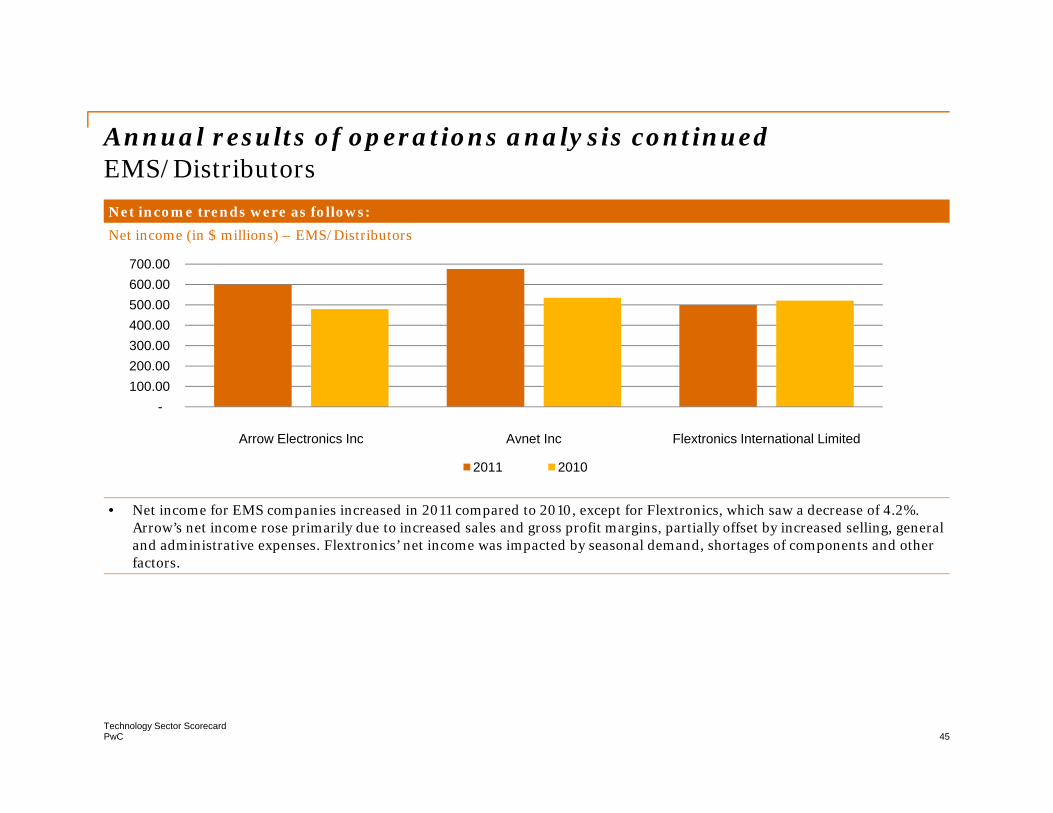
• Net income for EMS companies increased in 2011 compared to 2010, except for Flextronics, which saw a decrease of 4.2%. Arrow’s net income rose primarily due to increased sales and gross profit margins, partially offset by increased selling, general and administrative expenses. Flextronics’ net income was impacted by seasonal demand, shortages of components and other factors
2011 2010
factors.
PwCTechnology Sector Scorecard
45

Annual results of operations analysis continued f p yEMS/Distributors
Inventory and receivables trends were as follows:
Days inventory on hand – EMS/Distributors Days sales in receivables – EMS/Distributors
30.00
40.00
50.00
60.00
40.00 50.00 60.00 70.00 80.00 90.00
-
10.00
20.00
Arrow Electronics Inc
Avnet Inc Flextronics International
-10.00 20.00 30.00
Arrow Electronics Inc
Avnet Inc Flextronics International
• Days inventory on hand declined for EMS companies in 2011 compared to last year.
• Receivables also decreased for EMS companies in 2011.
Limited2011 2010
Limited2011 2010
PwCTechnology Sector Scorecard
46

Annual results of operations analysis continued f p yEMS/Distributors
Earnings per share (EPS) and market capitalization trends were as follows:
EPS – EMS/Distributors Market cap (in $ millions) – EMS/Distributors
4
5
6
4 000 00
5,000.00
6,000.00
7,000.00
0
1
2
3
1,000.00
2,000.00
3,000.00
4,000.00
Arrow Electronics Avnet Inc Flextronics
• EPS increased by 28.9% and 26.4% for Arrow and Avnet respectively, primarily due to higher net income and lower shares outstanding in 2011. EPS for Flextronics remained flat compared to last year, with lower income being offset by lower shares
Arrow Electronics Inc Avnet Inc Flextronics International Limited
2011 2010
Inc International Limited
2011 2010
outstanding.
• Market cap for Avnet and Flextronics showed a negative trend this year due to lower share prices compared to last year and the lower shares outstanding, while Arrow recorded a marginal increase of 6.4%.
PwCTechnology Sector Scorecard
47

Q4 and Q3 performanceQ Q p fEMS/Distributors
Company Q4 2011Company Q4 2011Revenue
($ millions)Gross
margin (%)Net income/(loss)
($ millions)EPS($) Market cap
($ millions)
Arrow Electronics Inc 5,440 13.69% 174 1.53 4,183
A t I 6 694 11 71% 147 0 98 4 506Avnet Inc 6,694 11.71% 147 0.98 4,506
Flextronics International Ltd 7,493 5.10% 102 0.14 4,037
Company Q3 2011Revenue
($ millions)Gross
margin (%)Net income/(loss)
($ millions)EPS($) Market cap
($ millions)
Arrow Electronics Inc 5,187 13.71% 132 1.15 3,104
Avnet Inc 6,426 11.73% 139 0.90 3,901
Flextronics International Ltd 8,044 4.67% 130 0.18 4,118
PwCTechnology Sector Scorecard
48

Q2 and Q1 performanceQ Q p fEMS/Distributors
Company Q2 2011Company Q2 2011Revenue
($ millions)Gross
margin (%)Net income/(loss)
($ millions)EPS($) Market cap
($ millions)
Arrow Electronics Inc 5,540 13.90% 156 1.33 5,252
A t I 6 912 11 93% 239 1 54 4 975Avnet Inc 6,912 11.93% 239 1.54 4,975
Flextronics International Ltd 7,548 5.30% 132 0.17 4,823
Company Q1 2011Revenue
($ millions)Gross
margin (%)Net income/(loss)
($ millions)EPS($) Market cap
($ millions)
Arrow Electronics Inc 5,223 13.83% 136 1.16 4,862
Avnet Inc 6,672 11.79% 151 0.98 5,201
Flextronics International Ltd 6,859 5.58% 135 0.17 5,797
PwCTechnology Sector Scorecard
49

Quarterly results of operations analysis (Q4) Q y f p y QEMS/DistributorsRevenue and gross margin trends were as follows:
Revenues (in $ millions) – EMS/Distributors Gross margin % – EMS/Distributors
4,000
6,000
8,000
10,000
5%
10%
15%
0
2,000
Q4 2010 Q1 2011 Q2 2011 Q3 2011 Q4 2011
Arrow Electronics IncAvnet Inc
0%
5%
Q4 2010 Q1 2011 Q2 2011 Q3 2011 Q4 2011
Arrow Electronics IncAvnet Inc
• Revenue increased for EMS companies, with Arrow and Avnet recording sequential growth of 4.8% and 4.2% respectively, while Flextronics’ revenue declined by 6.9% sequentially. Arrow Electronics’ revenue increased primarily due to increased sales in both the global components business segment and the global ECS business segment. Avnet’s revenue improved due to a rise in Electronic Marketing sales driven by growth in the American region Flextronics’ net sales declined due to decreased
Avnet IncFlextronics International Limited
Avnet IncFlextronics International Limited
a rise in Electronic Marketing sales, driven by growth in the American region. Flextronics net sales declined due to decreased sales in the High Velocity Solutions market, as a result of the exit from the ODM personal computing business in the current quarter.
• Gross margin remained almost flat sequentially for Arrow and Avnet. Flextronics’ gross margin improved due to lower cost of sales in this quarter.
PwCTechnology Sector Scorecard
50
Quarterly results of operations analysis (Q4) continued Q y f p y QEMS/DistributorsNet income trends were as follows:
Net income (in $ millions) – EMS/Distributors
100
150
200
250
0
50
100
Q4 2010 Q1 2011 Q2 2011 Q3 2011 Q4 2011
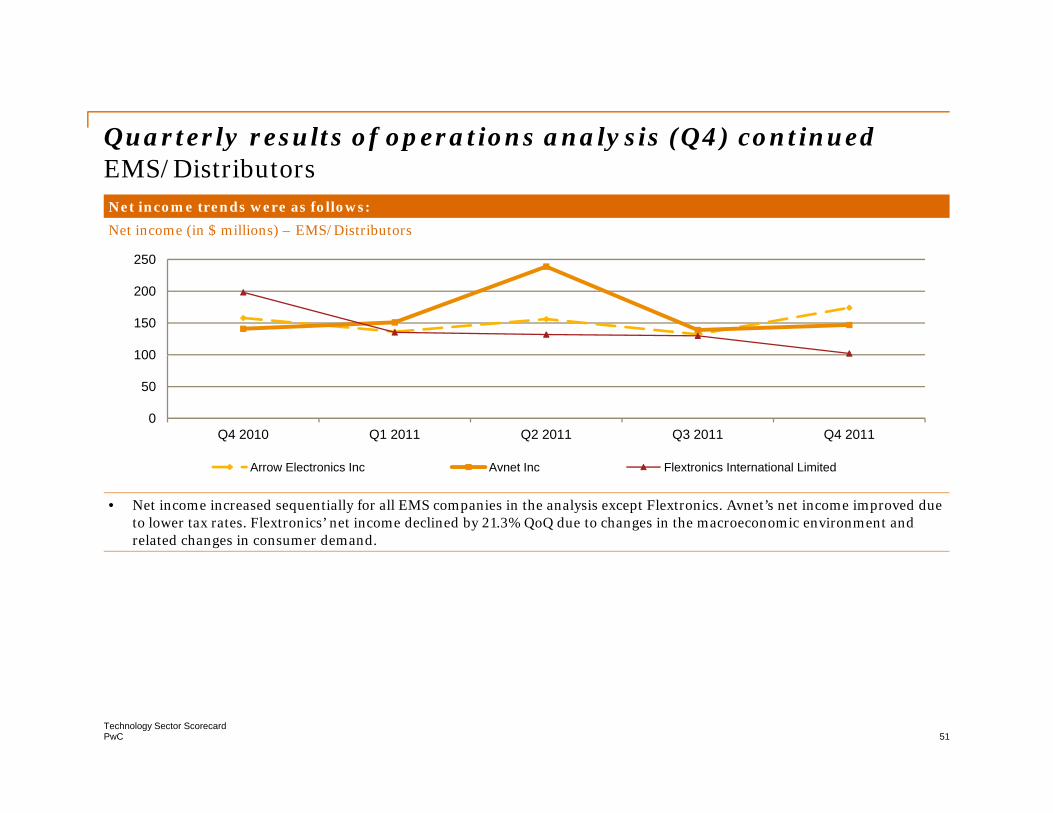
• Net income increased sequentially for all EMS companies in the analysis except Flextronics. Avnet’s net income improved due to lower tax rates. Flextronics’ net income declined by 21.3% QoQ due to changes in the macroeconomic environment and related changes in consumer demand.
Arrow Electronics Inc Avnet Inc Flextronics International Limited
PwCTechnology Sector Scorecard
51

Quarterly results of operations analysis (Q4) continued Q y f p y QEMS/DistributorsInventory and receivables trends were as follows:
Days inventory on hand – EMS/Distributors Days sales in receivables – EMS/Distributors
15
30
45
60
20
40
60
80
0
15
Q4 2010 Q1 2011 Q2 2011 Q3 2011 Q4 2011
Arrow Electronics IncAvnet Inc
0
20
Q4 2010 Q1 2011 Q2 2011 Q3 2011 Q4 2011
Arrow Electronics IncAvnet Inc
• Days inventory on hand decreased sequentially for Arrow Electronics from 44 days to 38 days and for Avnet from 42 days to 38 days. Days inventory on hand remained flat sequentially for Flextronics.
• Days sales in receivables (DSO) for EMS companies in the analysis almost remained flat QoQ for Avnet and Flextronics. Arro registered a marginal increase in DSO from 72 da s in the pre io s q arter to 74 da s in the c rrent q arter d e to
Flextronics International Limited Flextronics International Limited
Arrow registered a marginal increase in DSO, from 72 days in the previous quarter to 74 days in the current quarter, due to higher sales.
PwCTechnology Sector Scorecard
52

Quarterly results of operations analysis (Q4) continued Q y f p y QEMS/Distributors Earnings per share (EPS) and market capitalization trends were as follows:
EPS($) – EMS/Distributors Market cap (in $ millions) – EMS/Distributors
1.00
1.50
2.00
3 000
4,500
6,000
7,500
0.00
0.50
Q4 2010 Q1 2011 Q2 2011 Q3 2011 Q4 2011
Arrow Electronics Inc
0
1,500
3,000
Q4 2010 Q1 2011 Q2 2011 Q3 2011 Q4 2011
Arrow Electronics Inc
• EPS for Arrow increased sequentially by 33.0%, primarily due to higher revenues and lower operating expenses. Improved profitability at Technology Solutions, higher prices for hard disk drives and a lower share count were the factors behind A t’ hi h EPS i thi q t Fl t i ’ EPS d li d b 22 2% d t l t i
Avnet IncFlextronics International Limited
Avnet IncFlextronics International Limited
Avnet’s higher EPS in this quarter. Flextronics’ EPS declined by 22.2% due to lower net income.
• Avnet and Arrow registered increased market share in this quarter due to higher share prices.
PwCTechnology Sector Scorecard
53

Snapshot by subsectorSnapshot by subsector
Semiconductors
PwCTechnology Sector Scorecard
54

Market analysisySemiconductors
• Worldwide semiconductor sales for 2011 reached a record $299.5 billion, a year-on-year increase of 0.4% from the $298.3 billion recorded in 2010. In 2011, the industry saw strong d d i l ifi ll th t l t i d t t d demand in several areas; specifically the optoelectronic, sensor and actuator, and microprocessor markets showed strong y-o-y growth.1
• Worldwide semiconductor revenue is forecast to reach $309 billion in 2012, a 2.2% increase from 2011, according to Gartner, Inc. With continuing concern over the future of the euro zone
ff ti th l b l th i hi h d f t i t G t id th t th fl d affecting the global economy, there is a high degree of uncertainty. Gartner said that the floods that hit Thailand this year resulted in a hard-disk drive (HDD) shortage that has slowed the PC market even further and estimates that the supply chain disruption meant that the PC production will be limited by HDD availability over the next few quarters until the HDD industry can resume full production.2y p
• Worldwide semiconductor capital equipment spending is expected to total $51.7 billion in 2012, a 19.5% decline from projected 2011 spending of $64.2 billion, according to Gartner, Inc. The impact of the sluggish macro economy, high inventories and a slowing PC industry — due to both weak demand and the flooding in Thailand — will temper the outlook for 2012.2
PwCTechnology Sector Scorecard
55
1. Semiconductor Industry Association - Dec 20112. Gartner - Dec 2011

Market analysis continuedySemiconductors
• 2011 was by far Intel’s most profitable year. Revenue of $54.0 billion was up 24% from a year ago and was their second year in a row with revenue growing over 20%. PC Client Group grew 17% y-o-y and was their second year in a row with revenue growing over 20%. PC Client Group grew 17% y o y on continued strength in emerging markets, as rising incomes increased the affordability of personal computers, and on strength from the enterprise market segment. The server market segment was particularly strong, with Intel’s Data Center Group growing 17% year over year. The strength of the product portfolio drove a richer mix of products, resulting in an increase in average selling prices in I t l’ li t d b iIntel’s client and server businesses.
• Applied Materials generated orders of $2.01 billion and net sales of $2.19 billion during the quarter ended January 2012. Applied completed the acquisition of Varian Semiconductor Equipment Associates, Inc. during the quarter. Global demand for mobile devices has driven a third consecutive
f t it l i t t b i d t t l di t lid d t year of strong capital investment by semiconductor customers, leading to solid order momentum and an improved outlook overall for Applied’s second quarter. The company also returned substantial capital to stockholders, paying $104 million in cash dividends and using $200 million to repurchase common stock.
TSMC announced consolidated revenue of US$14 54 billion and net income of US$4 6 billion for • TSMC announced consolidated revenue of US$14.54 billion and net income of US$4.6 billion for full-year 2011. Compared to the previous year, the results represent a 9% increase in revenue, but an 11% decrease in net income. 28-nanometer process technology accounted for 2% of total wafer revenues, 40-nanometer was 27%, and 65-nanometer accounted for 30%. These advanced technologies accounted for 59% of total wafer revenues. Although the outlook of the global economy
PwCTechnology Sector Scorecard
56
remains uncertain, TSMC expects the demand for wafers to be stronger than seasonal for the first quarter.

Market analysis continuedySemiconductors
• Texas Instruments (TI) reported a revenue was $13.73 billion, net income of $2.24 billion and earnings per share (EPS) of $1.88 for the full year ended 2011. The company strengthened the core earnings per share (EPS) of $1.88 for the full year ended 2011. The company strengthened the core businesses of Analog, Embedded Processing and Wireless. Although the year started strong, global economic uncertainty and the earthquake in Japan impacted TI. Despite these challenges, it successfully completed the acquisition of National, gaining share in the Analog and Embedded Processing markets. TI continued to wind down their baseband operations. It announced fourth-
t f $3 42 billi d t i f $298 illi R i th t t quarter revenue of $3.42 billion and net income of $298 million. Revenue in the current quarter was higher than expected across all major product lines, reinforcing the belief that the economy is at the bottom of this downturn. The company has stated that in 2012 it will exit from the baseband market, and thus further focus on Analog, Embedded Processing and Wireless. TI closed its acquisition of National Semiconductor on September 23, 2011, and it began to consolidate the q p gresults of the acquired operations into TI's Analog segment under the name Silicon Valley Analog.
• Qualcomm reported another record quarter, with revenues of $4.68 billion, up 40% y-o-y and 14% sequentially. Earnings and MSM shipments reached all-time highs, driven by an industry-leading chipset portfolio and the continued strong demand for smartphones around the world. Broad licensing partnerships and an extensive chipset road map, led by integrated Snapdragon processors, position the company well for strong growth in fiscal 2012. It continues to invest in innovative wireless technologies, products and services.
PwCTechnology Sector Scorecard
57
Geographic revenue analysis (Q4)
Three Months’ Moving Average Sales – Geographic segmentation
Geographic revenue (in $ billions) and % growth – Semiconductors
Semiconductors
10 0%-8.0%-6.0%-4.0%-2.0%0.0%
68
10121416
-16.0%-14.0%-12.0%-10.0%
0246
Americas Europe Japan Asia Pacific
Jul / Aug / Sept ($ bn) Oct / Nov / Dec ($ bn) % Change (RHS)
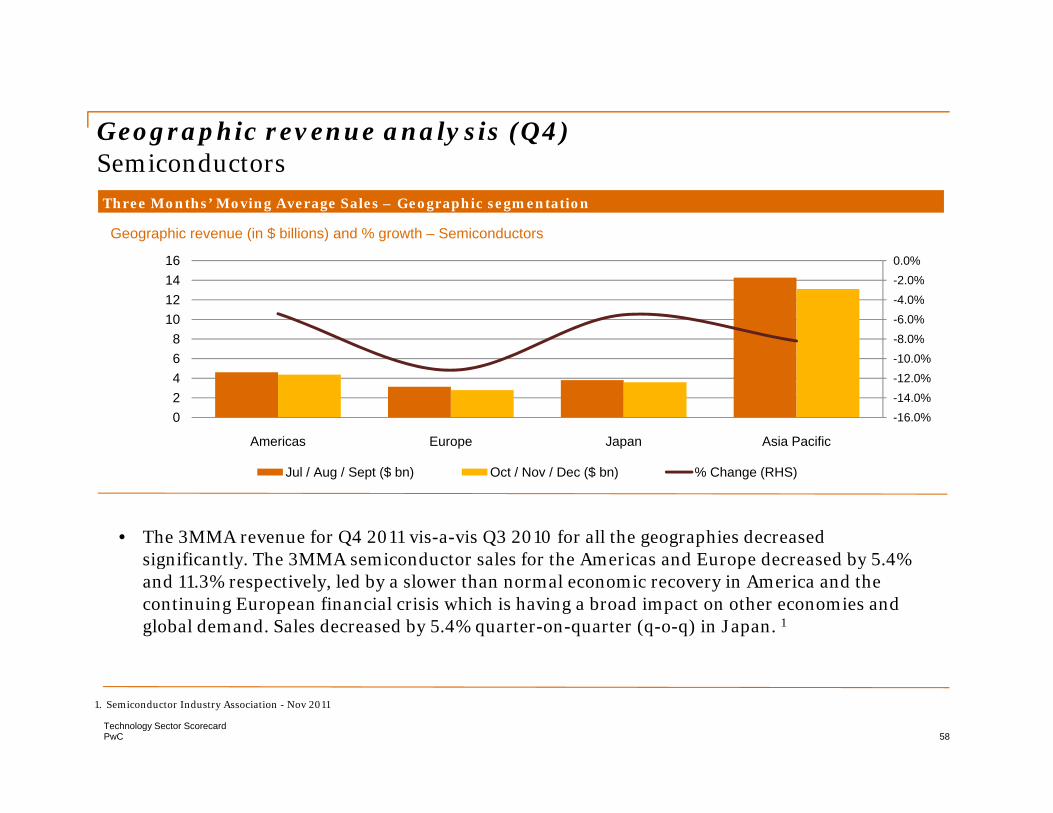
• The 3MMA revenue for Q4 2011 vis-a-vis Q3 2010 for all the geographies decreased significantly The 3MMA semiconductor sales for the Americas and Europe decreased by 5 4% significantly. The 3MMA semiconductor sales for the Americas and Europe decreased by 5.4% and 11.3% respectively, led by a slower than normal economic recovery in America and the continuing European financial crisis which is having a broad impact on other economies and global demand. Sales decreased by 5.4% quarter-on-quarter (q-o-q) in Japan. 1
PwCTechnology Sector Scorecard
58
1. Semiconductor Industry Association - Nov 2011

Annual results of operations analysis f p ySemiconductors
Revenue and gross margin trends were as follows:
Revenues (in $ millions) – Semiconductors Gross margin % – Semiconductors
25 00030,000 35,000 40,000 45,000 50,000 55,000 60,000
30 00%
40.00%
50.00%
60.00%
70.00%
-5,000
10,000 15,000 20,000 25,000
Intel Applied M t i l
TI TSMC Qualcomm
0.00%
10.00%
20.00%
30.00%
Intel Applied M t i l
TI TSMC Qualcomm
• Revenue for Semiconductor companies was higher in 2011 when compared to 2010 except Applied Materials and Texas Instruments (TI). Qualcomm’s annual revenue increased sharply by 39.7%, driven by an increased chipset portfolio and the continued strong demand for smartphones. Intel’s net revenue for 2011 increased to $54 billion, a rise of 23.8%, compared to 2010 led by 64% higher demand reported by Other Intel Architecture segment TSMC’s revenue increased by 9 2% led by
Materials
2011 2010 20102
Materials
2011 2010
2010, led by 64% higher demand reported by Other Intel Architecture segment. TSMC s revenue increased by 9.2%, led by higher demand in the communications segment. Applied Materials’ and TI’s revenues decreased by 3.5% and 1.6% respectively.
• All companies within the industry, except Applied Materials, witnessed lower gross margin percentages in 2011 compared with 2010 as cost of sales increased due to supply-chain issues impacting the industry. Raw materials costs increased in 2011 due to the natural disasters which impacted supplier companies.
PwCTechnology Sector Scorecard
59
p pp p

Annual results of operations analysis continuedf p ySemiconductors
R&D expenditure trends were as follows:
R&D expenses (in $ millions) – Semiconductors R&D expenses (% of revenue) – Semiconductors9 000
4,0005,000 6,000 7,000 8,000 9,000
9.00%
12.00%
15.00%
18.00%
-1,000 2,000 3,000 4,000
Intel Applied M t i l
TI TSMC Qualcomm
0.00%
3.00%
6.00%
Intel Applied Materials
TI TSMC Qualcomm
• R&D expenses increased for all the companies in the sector compared to last year as companies increased their spending for newer technologies. Intel’s and Qualcomm’s R&D spending increased by 26.9% and 33.5% respectively in 2011 compared to 2010 This was led by increased spending on R&D for new products and also by acquisition-related increases in R&D
Materials2011 2010 2011 2010
2010. This was led by increased spending on R&D for new products and also by acquisition-related increases in R&D expenditure. The R&D expenditure for TSMC and TI increased y-o-y by 21.8% and 9.2% respectively. Applied Materials’ R&D expenditure was relatively flat y-o-y.
• R&D as a percentage of revenue was stable for all the companies, with a marginal increase y-o-y with the exception of Qualcomm.
PwCTechnology Sector Scorecard
60
Annual results of operations analysis continued f p ySemiconductorsNet income trends were as follows:
Net income (in $ millions) – Semiconductors
4 0006,000 8,000
10,000 12,000 14,000
-2,000 4,000
Intel Applied Materials TI TSMC Qualcomm
2011 2010
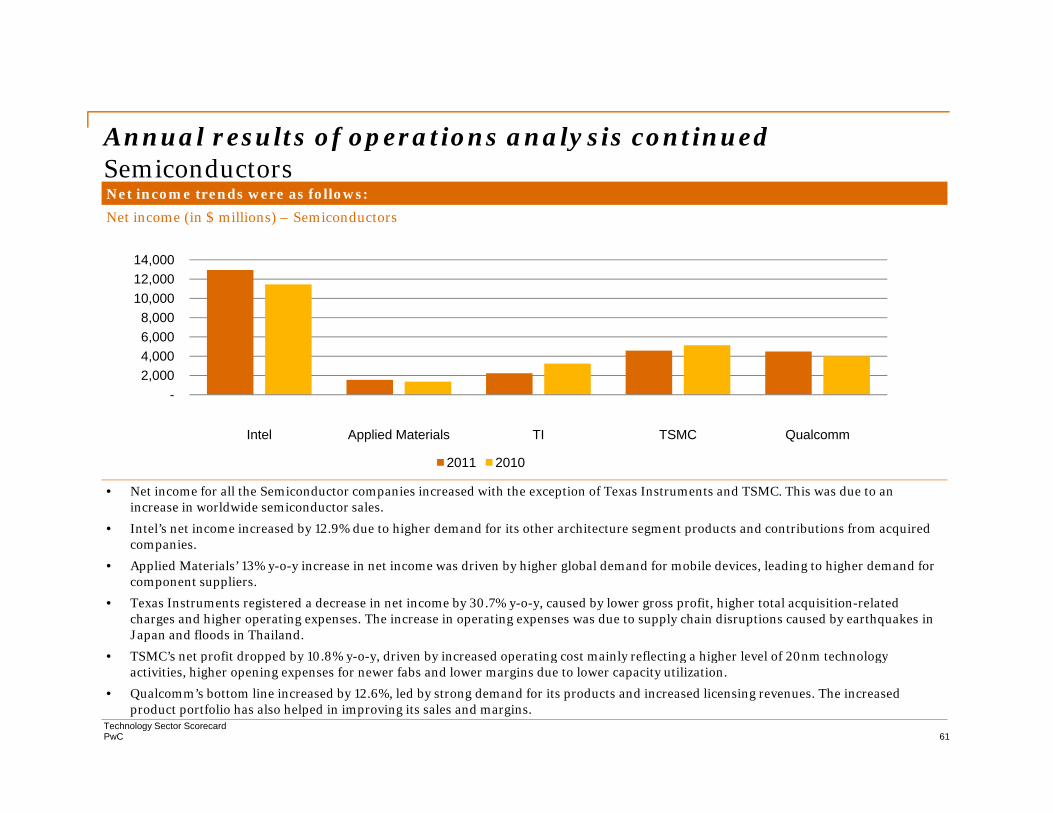
• Net income for all the Semiconductor companies increased with the exception of Texas Instruments and TSMC. This was due to anincrease in worldwide semiconductor sales.
• Intel’s net income increased by 12.9% due to higher demand for its other architecture segment products and contributions from acquired companies.
li d i l ’ i i i d i b hi h l b l d d f bil d i l di hi h d d f
2011 2010
• Applied Materials’ 13% y-o-y increase in net income was driven by higher global demand for mobile devices, leading to higher demand for component suppliers.
• Texas Instruments registered a decrease in net income by 30.7% y-o-y, caused by lower gross profit, higher total acquisition-related charges and higher operating expenses. The increase in operating expenses was due to supply chain disruptions caused by earthquakes in Japan and floods in Thailand.
• TSMC’s net profit dropped by 10.8% y-o-y, driven by increased operating cost mainly reflecting a higher level of 20nm technology
PwCTechnology Sector Scorecard
61
p pp y y y y p g y g g gyactivities, higher opening expenses for newer fabs and lower margins due to lower capacity utilization.
• Qualcomm’s bottom line increased by 12.6%, led by strong demand for its products and increased licensing revenues. The increasedproduct portfolio has also helped in improving its sales and margins.

Annual results of operations analysis continued f p ySemiconductors
Inventory and receivables trends were as follows:
Days inventory on hand – Semiconductors Days sales in receivables – Semiconductors
60.00
90.00
120.00
40.00 50.00 60.00 70.00 80.00
-
30.00
Intel Applied TI TSMC Qualcomm
-10.00 20.00 30.00
Intel Applied TI TSMC Qualcomm
• Days inventory on hand declined for all companies except Applied Materials and Texas Instruments. The increase in DOI for Applied Materials and TI was due to slower demand as companies in the supply chain decided to clear off their inventory pileup.
ppMaterials
Q
2011 2010
ppMaterials
2011 2010
• DSO increased marginally for all companies except Applied Materials and TSMC, which had declines of 11 and 5 days respectively.
PwCTechnology Sector Scorecard
62

Annual results of operations analysis continued f p ySemiconductors
Earnings per share (EPS) trends were as follows:
EPS – Semiconductors
2.00
3.00
-
1.00
I t l A li d M t i l TI TSMC Q l
• EPS increased for all Semiconductor companies in 2011 as compared to 2010 except Texas Instruments and TSMC whose EPS declined by 29% and 10% respectively. Intel’s, Applied Materials’ and Qualcomm’s EPS increased by 19%, 14% and 9% respectively EPS was impacted by the same factors as net income as discussed two slides previously Other than net income
Intel Applied Materials TI TSMC Qualcomm2011 2010
respectively. EPS was impacted by the same factors as net income, as discussed two slides previously. Other than net income,the increase in EPS was also due to aggressive repurchasing activities by Intel, Applied Materials and Qualcomm.
PwCTechnology Sector Scorecard
63
Q4 and Q3 performance Q Q p fSemiconductors
Company Q4 2011Revenue Gross Net income/(loss) EPS ($) Market capRevenue
($ millions)Gross
margin (%)Net income/(loss)
($ millions)EPS ($) Market cap
($ millions)
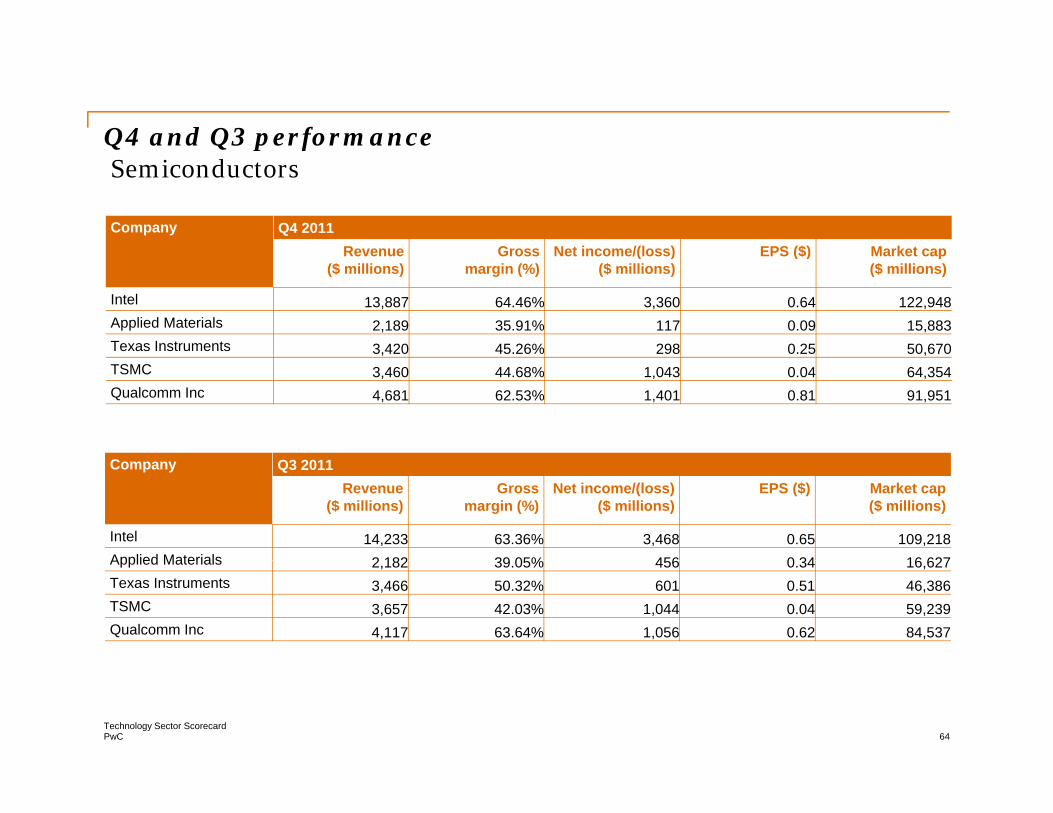
Intel 13,887 64.46% 3,360 0.64 122,948 Applied Materials 2,189 35.91% 117 0.09 15,883Texas Instruments 3,420 45.26% 298 0.25 50,670, ,TSMC 3,460 44.68% 1,043 0.04 64,354 Qualcomm Inc 4,681 62.53% 1,401 0.81 91,951
Company Q3 2011Revenue
($ millions)Gross
margin (%)Net income/(loss)
($ millions)EPS ($) Market cap
($ millions)
Intel 14,233 63.36% 3,468 0.65 109,218 Applied Materials 2 182 39 05% 456 0 34 16 627Applied Materials 2,182 39.05% 456 0.34 16,627 Texas Instruments 3,466 50.32% 601 0.51 46,386 TSMC 3,657 42.03% 1,044 0.04 59,239 Qualcomm Inc 4,117 63.64% 1,056 0.62 84,537
PwCTechnology Sector Scorecard
64

Q2 and Q1 performanceQ Q p fSemiconductors
Company Q2 2011Revenue Gross Net income/(loss) EPS ($) Market capRevenue
($ millions)Gross
margin (%)Net income/(loss)
($ millions)EPS ($) Market cap
($ millions)
Intel 13,032 60.64% 2,954 0.54 118,384Applied Materials 2,787 42.48% 476 0.36 14,972Texas Instruments 3,458 50.69% 672 0.56 58,3433,458 50.69% 672 0.56 58,343TSMC 3,829 46.02% 1,248 0.05 64,084Qualcomm Inc 3,623 64.73% 1,035 0.61 91,816
Company Q1 2011Revenue
($ millions)Gross
margin (%)Net income/(loss)
($ millions)EPS ($) Market cap
($ millions)
Intel 12,847 61.38% 3,160 0.56 107,513Applied Materials 2 862 41 54% 489 0 37 20 711Applied Materials 2,862 41.54% 489 0.37 20,711Texas Instruments 3,392 50.94% 666 0.56 40,332TSMC 3,597 49.04% 1,243 0.05 67,122Qualcomm Inc 3,875 64.83% 995 0.60 87,249
PwCTechnology Sector Scorecard
65
Quarterly results of operations analysis (Q4) Q y f p y QSemiconductorsRevenue and gross margin trends were as follows:
Revenues (in $ millions) – Semiconductors Gross margin % – Semiconductors
100%16 000
40%
60%
80%
100%
4 0006,0008,000
10,00012,00014,00016,000
0%
20%
Q4 2010 Q1 2011 Q2 2011 Q3 2011 Q4 2011Intel Applied MaterialsTexas Instruments TSMCQ l
02,0004,000
Q4 2010 Q1 2011 Q2 2011 Q3 2011 Q4 2011
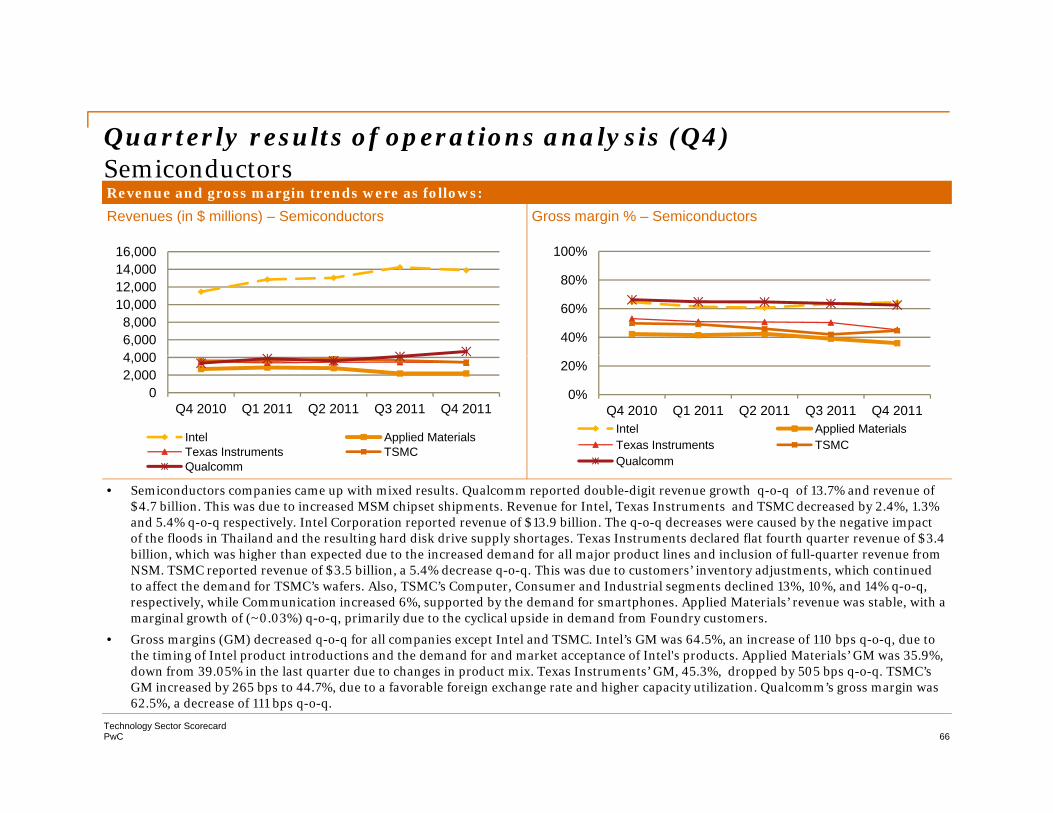
Intel Applied MaterialsTexas Instruments TSMC
• Semiconductors companies came up with mixed results. Qualcomm reported double-digit revenue growth q-o-q of 13.7% and revenue of $4.7 billion. This was due to increased MSM chipset shipments. Revenue for Intel, Texas Instruments and TSMC decreased by 2.4%, 1.3% and 5.4% q-o-q respectively. Intel Corporation reported revenue of $13.9 billion. The q-o-q decreases were caused by the negative impact of the floods in Thailand and the resulting hard disk drive supply shortages. Texas Instruments declared flat fourth quarter revenue of $3.4 billion, which was higher than expected due to the increased demand for all major product lines and inclusion of full-quarter revenue from
QualcommQualcomm
, g p j p qNSM. TSMC reported revenue of $3.5 billion, a 5.4% decrease q-o-q. This was due to customers’ inventory adjustments, which continued to affect the demand for TSMC’s wafers. Also, TSMC’s Computer, Consumer and Industrial segments declined 13%, 10%, and 14% q-o-q, respectively, while Communication increased 6%, supported by the demand for smartphones. Applied Materials’ revenue was stable, with a marginal growth of (~0.03%) q-o-q, primarily due to the cyclical upside in demand from Foundry customers.
• Gross margins (GM) decreased q-o-q for all companies except Intel and TSMC. Intel’s GM was 64.5%, an increase of 110 bps q-o-q, due to the timing of Intel product introductions and the demand for and market acceptance of Intel's products. Applied Materials’ GM was 35.9%,
PwCTechnology Sector Scorecard
66
down from 39.05% in the last quarter due to changes in product mix. Texas Instruments’ GM, 45.3%, dropped by 505 bps q-o-q. TSMC’s GM increased by 265 bps to 44.7%, due to a favorable foreign exchange rate and higher capacity utilization. Qualcomm’s gross margin was 62.5%, a decrease of 111 bps q-o-q.
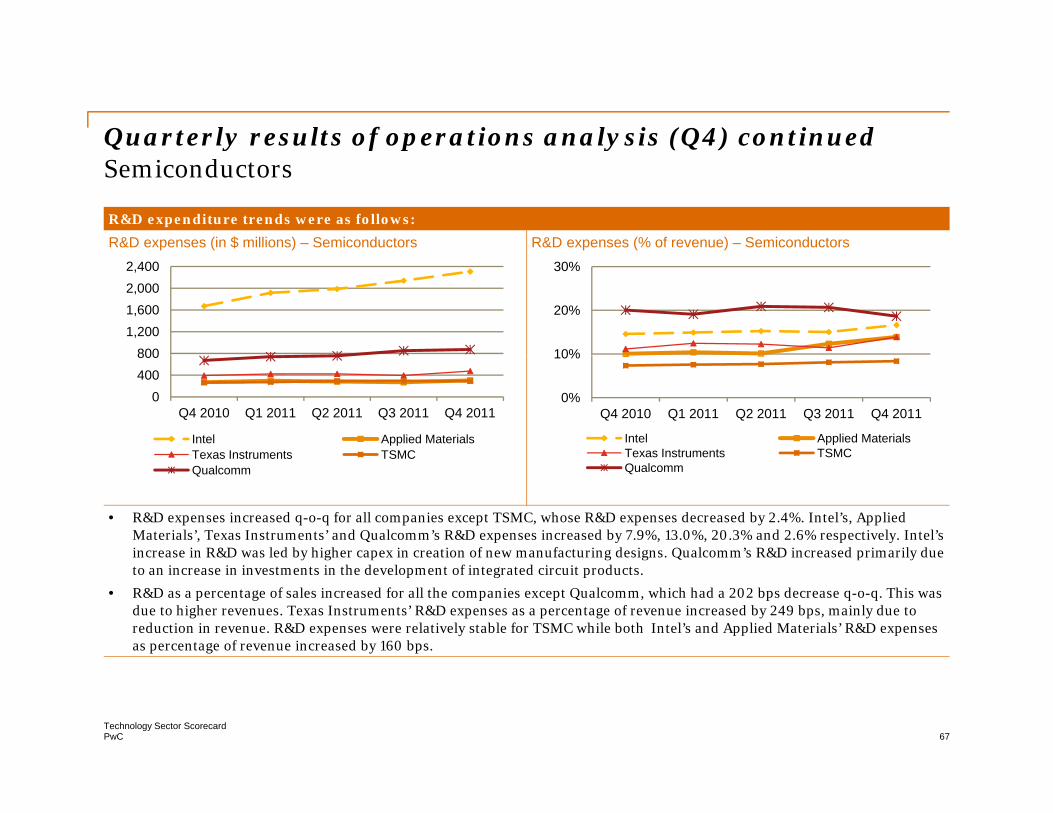
Quarterly results of operations analysis (Q4) continued Q y f p y QSemiconductors
R&D expenditure trends were as follows:
R&D expenses (in $ millions) – Semiconductors R&D expenses (% of revenue) – Semiconductors
8001,2001,6002,0002,400
10%
20%
30%
0400800
Q4 2010 Q1 2011 Q2 2011 Q3 2011 Q4 2011
Intel Applied MaterialsTexas Instruments TSMC
0%
10%
Q4 2010 Q1 2011 Q2 2011 Q3 2011 Q4 2011
Intel Applied MaterialsTexas Instruments TSMC
• R&D expenses increased q-o-q for all companies except TSMC, whose R&D expenses decreased by 2.4%. Intel’s, Applied Materials’, Texas Instruments’ and Qualcomm’s R&D expenses increased by 7.9%, 13.0%, 20.3% and 2.6% respectively. Intel’s increase in R&D was led by higher capex in creation of new manufacturing designs. Qualcomm’s R&D increased primarily due
Texas Instruments TSMCQualcomm Qualcomm
to an increase in investments in the development of integrated circuit products.
• R&D as a percentage of sales increased for all the companies except Qualcomm, which had a 202 bps decrease q-o-q. This was due to higher revenues. Texas Instruments’ R&D expenses as a percentage of revenue increased by 249 bps, mainly due to reduction in revenue. R&D expenses were relatively stable for TSMC while both Intel’s and Applied Materials’ R&D expenses as percentage of revenue increased by 160 bps.
PwCTechnology Sector Scorecard
67

Quarterly results of operations analysis (Q4) continuedQ y f p y QSemiconductorsNet income trends were as follows:
Net income (in $ millions) – Semiconductors4 000
0
1,000
2,000
3,000
4,000
I t l’ t i d d b 3 1% d t i t f d f d it d i t d t
-1,000
0
Q4 2010 Q1 2011 Q2 2011 Q3 2011 Q4 2011
Intel Applied Materials Texas Instruments TSMC Qualcomm
• Intel’s net income decreased by 3.1% q-o-q due to impacts of deferred revenue write-down, associated costs, amortization of acquisition-related intangibles and other acquisition-related accounting impacts.
• Applied Materials’ net income decreased sharply by 74.3% q-o-q. This was due to $153 million of acquisition-related costs for the acquisition of Varian Semiconductor Equipment Associates.
• Texas Instruments reported a 50.4% decrease in net income sequentially, and a 68.4% decrease y-o-y. Net income was adversely affected by its acquisition of National Semiconductor. Total acquisition-related charges in the fourth quarter were $256 million.
• TSMC net income was stable q-o-q, but fell sharply by 22.2% y-o-y, due to higher cost of goods sold and R&D expenses.
• The net income of Qualcomm grew 32.7% q-o-q, led by higher MSM shipments.
PwCTechnology Sector Scorecard
68
g q q y g p

Quarterly results of operations analysis (Q4) continuedQ y f p y QSemiconductors
Inventory and receivables trends were as follows:
Days inventory on hand – Semiconductors Days sales in receivables – Semiconductors
406080
100120
203040506070
02040
Q4 2010 Q1 2011 Q2 2011 Q3 2011 Q4 2011
Intel Applied MaterialsTexas Instruments TSMC
01020
Q4 2010 Q1 2011 Q2 2011 Q3 2011 Q4 2011
Intel Applied MaterialsTexas Instruments TSMC
• Days inventory on hand (DOI) decreased sequentially for all the companies, except Intel and TSMC, where the DOI increased by 9.3% and 8.0% respectively. Intel’s DOI increased due to lower global microprocessor, PC and server processor shipments. TSMC’s DOI increased due to declines in sales, resulting in higher inventory at the end of the quarter. The decrease in DOI of
d l d d l l d b d d f d
Texas Instruments TSMCQualcomm
Texas Instruments TSMCQualcomm
Texas Instruments (TI) and Qualcomm was 17 and 9 days respectively. It was led by strong demand recovery for TI and continued growth in sales for Qualcomm supported by a surge in demand for smartphones.
• Days sales in receivable/outstanding (DSO) decreased for all companies except Applied Materials. Texas Instruments’ and Qualcomm’s DSO decreased by 12.2% and 8.3% respectively. Qualcomm’s DSO decreased due to a sharp increase in revenue compared to a relatively marginal increase in receivables. TI’s DSO decreased because of lower receivables in 4Q 11 compared to 3Q 11. DSO for Intel and TSMC decreased by 2.1% and 4% respectively. Applied Materials’ DSO increased by 2.5%, due to
PwCTechnology Sector Scorecard
69
to 3Q 11. DSO for Intel and TSMC decreased by 2.1% and 4% respectively. Applied Materials DSO increased by 2.5%, due to lower revenues and relatively flat receivables q-o-q.

Quarterly results of operations analysis (Q4) continued S i dSemiconductors
Earnings per share (EPS) and price/earning ratio (P/E) trends were as follows:
EPS ($)– Semiconductors Price earning ratio - Semiconductors 1.00 25.00
0.00
0.25
0.50
0.75
5 00
10.00
15.00
20.00
-0.50
-0.25
Q4 2010 Q1 2011 Q2 2011 Q3 2011 Q4 2011
Intel Applied MaterialsTexas Instruments TSMCQualcomm
0.00
5.00
Q4 2010 Q1 2011 Q2 2011 Q3 2011 Q4 2011
Intel Applied MaterialsTexas Instruments TSMCQualcomm
• Intel’s and TSMC’s EPS was relatively flat, with Intel’s EPS at 64 cents vis-à-vis 65 cents last quarter and TSMC’s 4 cents, which was the same as last quarter. Applied Materials’ EPS decreased from 34 cents to 9 cents (-73.5%), impacted by lower revenues and a sharp increase in operating cost due to acquisition-related charges. Texas Instruments' EPS dropped by 51%, from 51 cents to 25 cents. This was due to higher R&D expenses and acquisition-related charges. Qualcomm’s EPS increased
Qualcomm Qualcomm
g p q gby 30%, from 62 cents to 81 cents q-o-q, led by strong demand for its products and higher license income.
• All the companies tracked in this sector except Intel and Applied Materials are currently trading at a higher P/E compared tothe Semiconductor industry average P/E of 12.6x*. Intel and Applied Materials are trading at 10.2x and 10.4x respectively due to reporting of numbers much below market expectations. Texas Instruments is trading at a P/E of 15.5x, a sharp jump from the last quarter, as the investors and analysts believe that the company stock prices have bottomed out and post merger therewill be an improvement in gross and operating margins Qualcomm’s P/E improved marginally to 20 7x based on the positive
PwCTechnology Sector Scorecard
70
will be an improvement in gross and operating margins. Qualcomm s P/E improved marginally to 20.7x, based on the positive results for the last few quarters and expected growth in bottom line in the coming quarters, led by end user demand in the form of tablets and smartphones.
* Industry Average P/E – Capital IQ.

Snapshot by subsectorSnapshot by subsectorSoftware & Internet
PwCTechnology Sector Scorecard
71

Market analysis
• Worldwide master data management (MDM) software revenue will reach US$1.9 billion in 2012, a 21% increase from 2011, according to Gartner, Inc. The market is forecast to reach US$3.2 billion by
ySoftware & Internet
, g , $3 y2015.1
• During the nine-week holiday period ended December 31, 2011, Kindle unit sales, including both the Kindle Fire and e-reader devices, increased 177% over the same period last year. Additionally, the Amazon Appstore for Android customers nearly tripled in the fourth quarter compared to the third pp y p q pquarter.
• eBay had strong full-year and quarter-end results despite the intra-quarter depreciation of the Euro, which negatively impacted cross-border trade for both PayPal and Marketplaces. Analysts’ believe eBay’s strong results will be consistent in future as operating leverage at PayPal is expected to drive y g p g g y pmargins and augment top line growth, while Marketplace business will register at least mid-single-digit annual revenue growth.2
• Aggregate paid clicks on Google websites and Google Network Members’ websites increased approximately 25% from 2010 to 2011. Average cost-per-click on Google websites and Google Network Members’ websites increased approximately 3% from 2010 to 2011.
PwCTechnology Sector Scorecard
72
1. Gartner press release - Jan 20122. Credit Suisse - Jan 2012

Market analysis continued
• Analysts believe that fears of irrelevance of Windows in a post-PC world has led to the underperformance of Microsoft’s stock. However, Microsoft’s initiatives to bridge the competitive
ySoftware & Internet
d p o o o o o o , o o o b dg o pgap in the cloud/tablet/smartphone space with Windows 8, Windows Phone 7 and Azure will enable MSFT to remain competitive in a post-PC era and will help change the investor perception on the stock.1
• Oracle posted uncharacteristic weakness across all segments and geographies. Outside of the p g g g pseverely contracting macro environment of the last recession, analysts believe that it is rare to see such low growth rates for all geographic regions. Also, as sales cycles were elongated due to customers requiring additional approvals for expected deals, numerous deals have been pushed into the next quarter and hence analysts believe that the next quarter numbers could actually be conservative 2conservative.2
• SAP performed exceptionally well in 2011, clearly exceeding its guidance for revenue and profit. This record strong top line results, along with double-digit software revenue growth in all regions, resulted in a record cash flow.
• Despite foreign exchange fluctuations, Symantec reported solid December quarter results, with revenue and EPS exceeding expectations, driven by improved execution across products and geographies combined with a significantly large number of deals in the quarter. Specifically, Symantec signed 135 transactions over US$1 million (versus 56 in the previous quarter and 118 in the year ago quarter) 3
PwCTechnology Sector Scorecard
73
the year ago quarter).3
1. Deutsche Bank, - Jan 20122. Credit Suisse - Dec 20113. Credit Suisse - Jan 2012
Market analysis continued
• Yahoo! Inc reported a slow year, led by weakness in display ads and in-line search. Analysts believe that fundamentally, business is deteriorating entering 2012 and it seems like Yahoo! is falling
ySoftware & Internet
y, g g gbehind in desktop display, mobile/tablet Internet consumption and usage/revenue growth. Thus a reinvestment is needed.1
• Yahoo! announced its plans to acquire online-advertising technology company Interclick Inc. in a deal valued at roughly $270 million. The acquisition is meant to help solve what has been a chronic g y $ 7 q pproblem for Yahoo: digital-ad sellers buying up ad space on Yahoo! websites and selling it to advertisers for a much higher price. Yahoo! has thus been losing out on tens of millions of dollars in revenue a year or more. 2
PwCTechnology Sector Scorecard
74
1. Deutsche Bank - Jan 20122. The Wall Street Journal - Nov 2011
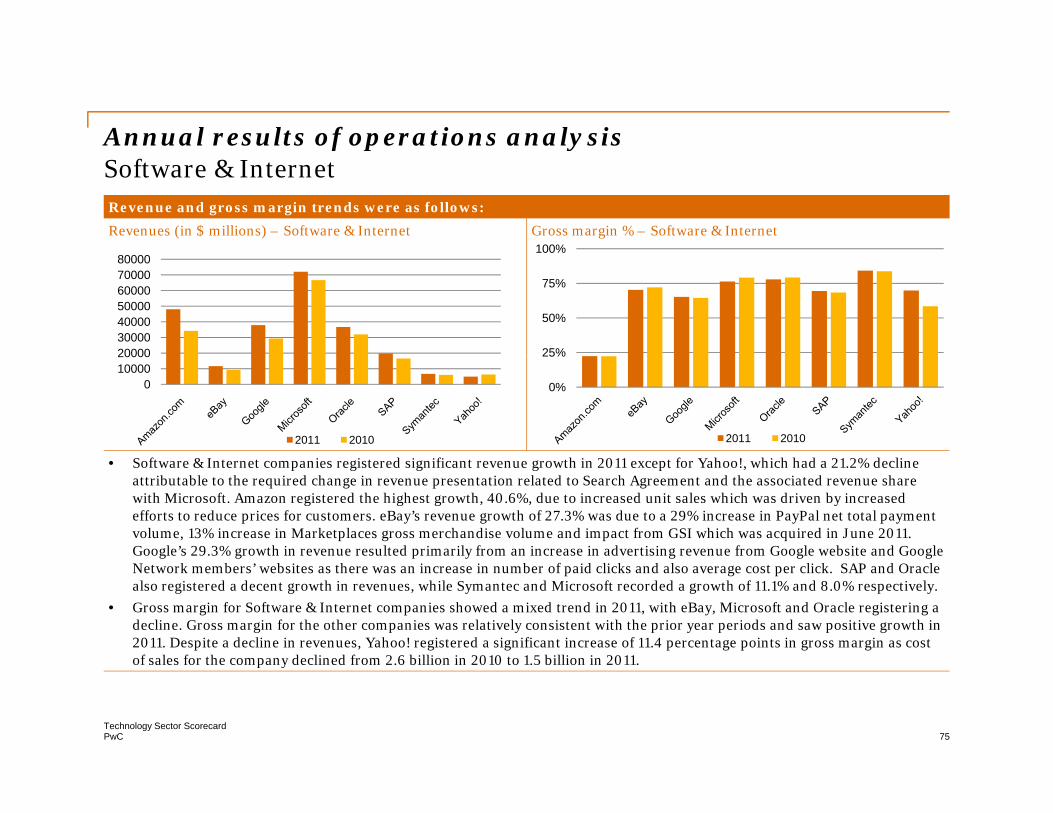
Annual results of operations analysis
Revenue and gross margin trends were as follows:
Revenues (in $ millions) – Software & Internet Gross margin % – Software & Internet
f p ySoftware & Internet
100%
20000300004000050000600007000080000
25%
50%
75%
%
S f & I i i d i ifi h i f Y h ! hi h h d % d li
01000020000
2011 2010
0%
25%
2011 2010
• Software & Internet companies registered significant revenue growth in 2011 except for Yahoo!, which had a 21.2% decline attributable to the required change in revenue presentation related to Search Agreement and the associated revenue share with Microsoft. Amazon registered the highest growth, 40.6%, due to increased unit sales which was driven by increased efforts to reduce prices for customers. eBay’s revenue growth of 27.3% was due to a 29% increase in PayPal net total payment volume, 13% increase in Marketplaces gross merchandise volume and impact from GSI which was acquired in June 2011. Google’s 29.3% growth in revenue resulted primarily from an increase in advertising revenue from Google website and Google Network members’ websites as there was an increase in number of paid clicks and also average cost per click. SAP and Oracle also registered a decent growth in revenues, while Symantec and Microsoft recorded a growth of 11.1% and 8.0% respectively.
• Gross margin for Software & Internet companies showed a mixed trend in 2011, with eBay, Microsoft and Oracle registering a decline. Gross margin for the other companies was relatively consistent with the prior year periods and saw positive growth in 2011. Despite a decline in revenues, Yahoo! registered a significant increase of 11.4 percentage points in gross margin as cost of sales for the company declined from 2.6 billion in 2010 to 1.5 billion in 2011.
PwCTechnology Sector Scorecard
75
of sales for the company declined from 2.6 billion in 2010 to 1.5 billion in 2011.
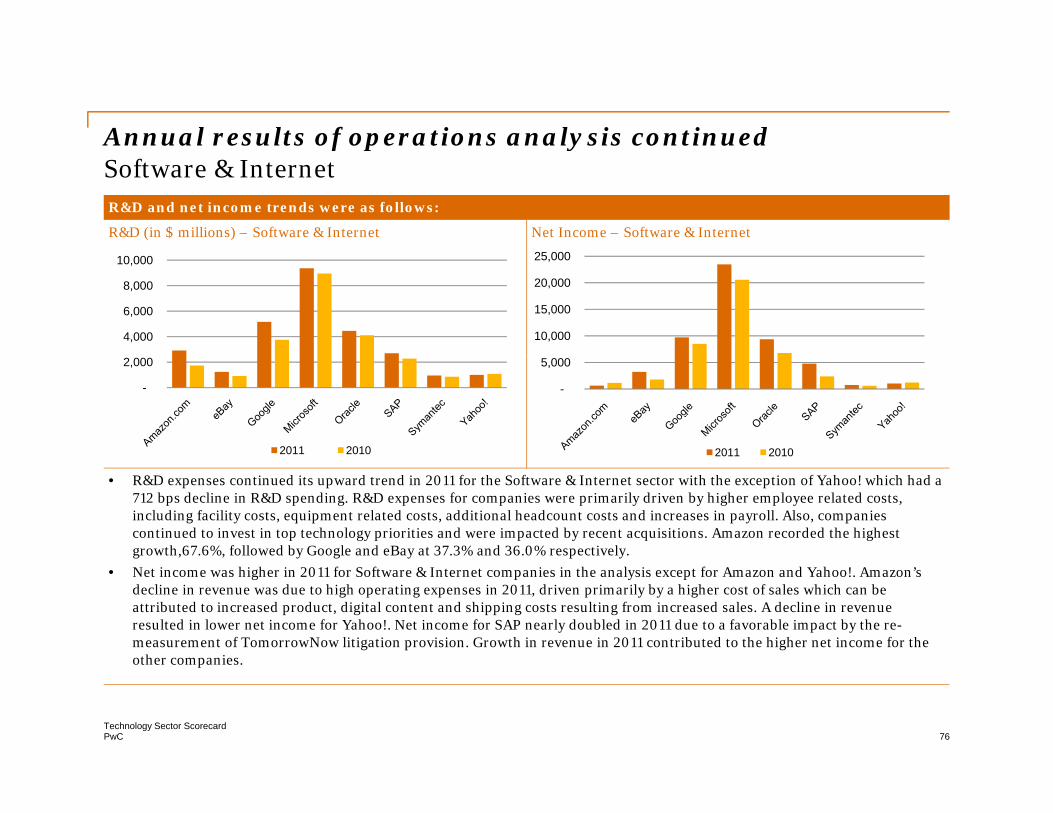
Annual results of operations analysis continued
R&D and net income trends were as follows:
R&D (in $ millions) – Software & Internet Net Income – Software & Internet
f p ySoftware & Internet
25 000
4,000
6,000
8,000
10,000
10,000
15,000
20,000
25,000
-
2,000
2011 2010
-
5,000
2011 2010
• R&D expenses continued its upward trend in 2011 for the Software & Internet sector with the exception of Yahoo! which had a 712 bps decline in R&D spending. R&D expenses for companies were primarily driven by higher employee related costs, including facility costs, equipment related costs, additional headcount costs and increases in payroll. Also, companies continued to invest in top technology priorities and were impacted by recent acquisitions. Amazon recorded the highest growth,67.6%, followed by Google and eBay at 37.3% and 36.0% respectively.
• Net income was higher in 2011 for Software & Internet companies in the analysis except for Amazon and Yahoo!. Amazon’s decline in revenue was due to high operating expenses in 2011, driven primarily by a higher cost of sales which can be attributed to increased product, digital content and shipping costs resulting from increased sales. A decline in revenue resulted in lower net income for Yahoo!. Net income for SAP nearly doubled in 2011 due to a favorable impact by the re-measurement of TomorrowNow litigation provision. Growth in revenue in 2011 contributed to the higher net income for the other companies.
PwCTechnology Sector Scorecard
76
other companies.

Annual results of operations analysis continued f p ySoftware & InternetReceivable trends were as follows:
Days sales in receivables (DSO) – Software & Internet
240.00
320.00
400.00
-
80.00
160.00
Amazon com eBay Google Microsoft Oracle SAP Symantec Yahoo!
• Receivables showed a positive trend for all companies in 2011, but days sales in receivables (DSO) increased only for Amazon,eBay and Yahoo!. The other companies registered marginal declines in DSO, while the largest increase was for eBay, from 156 days in 2010 to 190 days in 2011.
Amazon.com eBay Google Microsoft Oracle SAP Symantec Yahoo!
2011 2010
PwCTechnology Sector Scorecard
77
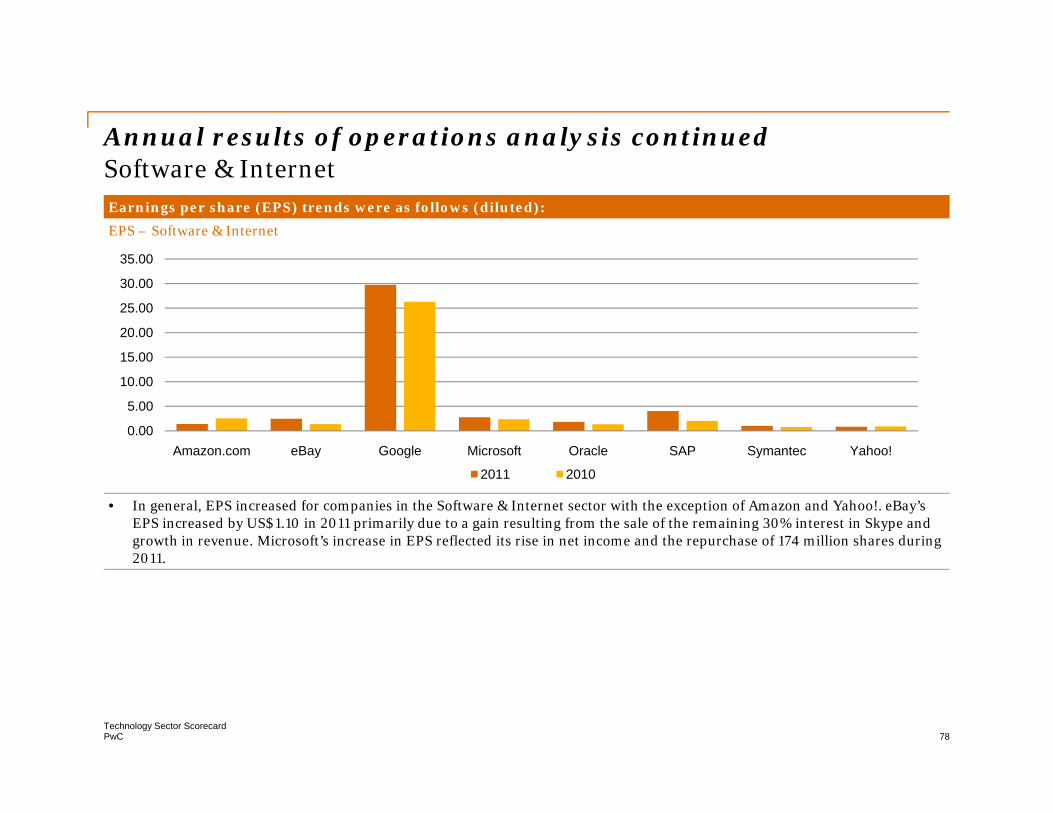
Annual results of operations analysis continued f p ySoftware & InternetEarnings per share (EPS) trends were as follows (diluted):
EPS – Software & Internet
15 00
20.00
25.00
30.00
35.00
0.00
5.00
10.00
15.00
Amazon.com eBay Google Microsoft Oracle SAP Symantec Yahoo!
• In general, EPS increased for companies in the Software & Internet sector with the exception of Amazon and Yahoo!. eBay’s EPS increased by US$1.10 in 2011 primarily due to a gain resulting from the sale of the remaining 30% interest in Skype and growth in revenue. Microsoft’s increase in EPS reflected its rise in net income and the repurchase of 174 million shares during 2011
y g y
2011 2010
2011.
PwCTechnology Sector Scorecard
78
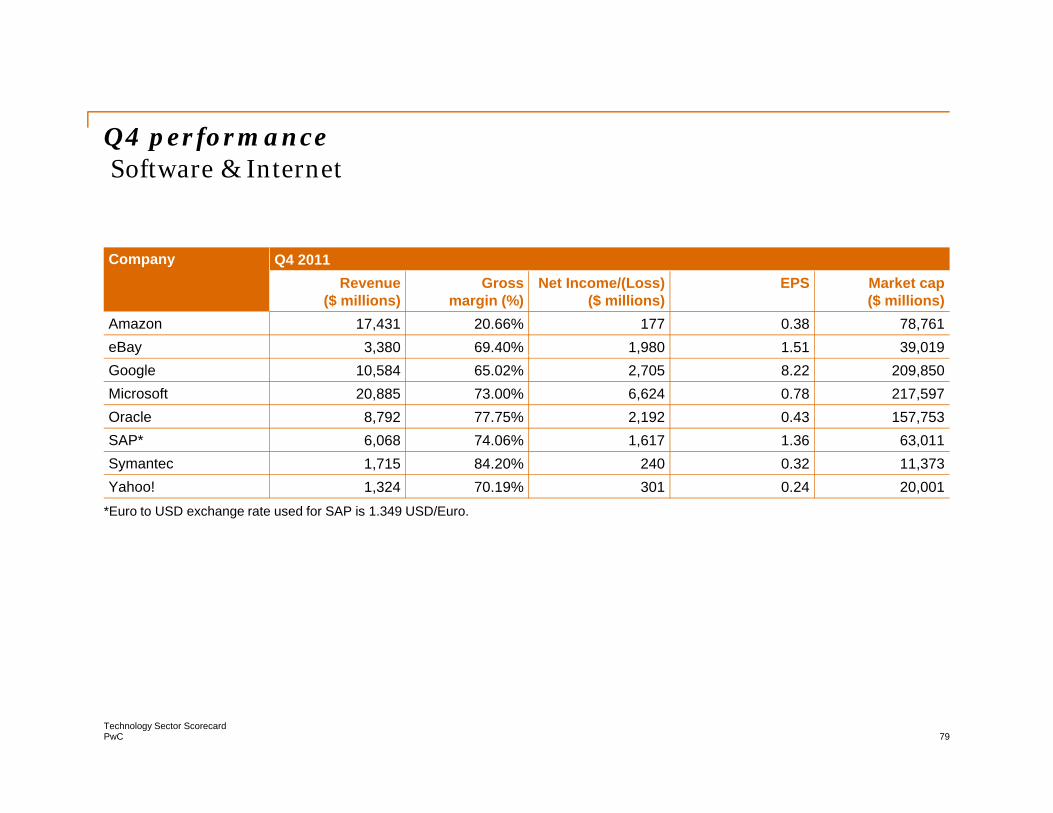
Q4 performanceQ p fSoftware & Internet
Company Q4 2011Revenue
($ millions)Gross
margin (%)Net Income/(Loss)
($ millions)EPS Market cap
($ millions)Amazon 17,431 20.66% 177 0.38 78,761eBay 3,380 69.40% 1,980 1.51 39,019Google 10,584 65.02% 2,705 8.22 209,850Microsoft 20,885 73.00% 6,624 0.78 217,597Oracle 8,792 77.75% 2,192 0.43 157,753SAP* 6,068 74.06% 1,617 1.36 63,011S %Symantec 1,715 84.20% 240 0.32 11,373Yahoo! 1,324 70.19% 301 0.24 20,001
*Euro to USD exchange rate used for SAP is 1.349 USD/Euro.
PwCTechnology Sector Scorecard
79

Q3 performanceQ p fSoftware & Internet
Company Q3 2011Revenue
($ millions)Gross
margin (%)Net Income/(Loss)
($ millions)EPS Market cap
($ millions)Amazon 10,876 23.46% 63 0.14 98,385eBay 2,966 68.99% 491 0.37 38,061Google 9,720 65.25% 2,729 8.33 166,748Microsoft 17,372 78.26% 5,738 0.68 209,325Oracle 8,374 76.26% 1,840 0.36 141,782SAP* 4,824 69.20% 1,770 1.49 60,220S %Symantec 1,681 84.24% 182 0.24 12,016Yahoo! 1,217 70.47% 293 0.23 16,327
*Euro to USD exchange rate used for SAP is 1.415 USD/Euro.
PwCTechnology Sector Scorecard
80

Q2 performanceQ p fSoftware & Internet
Company Q2 2011Revenue
($ millions)Gross
margin (%)Net Income/(Loss)
($ millions)EPS Market cap
($ millions)Amazon 9,913 24.09% 191 0.41 92,838eBay 2,760 71.98% 283 0.22 41,577Google 9,026 64.86% 2,505 7.68 163,393Microsoft 17,367 78.65% 5,874 0.69 217,776Oracle 10,774 79.89% 3,209 0.62 173,427SAP* 4,745 68.09% 844 0.70 72,152S %Symantec 1,653 84.33% 172 0.22 14,982Yahoo! 1,229 69.80% 237 0.18 19,278
*Euro to USD exchange rate used for SAP is 1.438 USD/Euro.
PwCTechnology Sector Scorecard
81

Q1 performanceQ p fSoftware & Internet
Company Q1 2011Revenue
($ millions)Gross
margin (%)Net Income/(Loss)
($ millions)EPS Market cap
($ millions)Amazon 9,857 22.82% 201 0.44 81,419 eBay 2,546 71.36% 476 0.36 40,279 Google 8,575 65.76% 1,798 5.51 189,011 Microsoft 16,428 76.28% 5,232 0.61 214,063 Oracle 8,764 77.04% 2,116 0.41 166,507 SAP* 4,134 64.55% 551 0.46 72.932 S %Symantec 1,673 83.86% 168 0.22 14,090 Yahoo! 1,214 68.92% 223 0.17 21,771
*Euro to USD exchange rate used for SAP is 1.367 USD/Euro.
PwCTechnology Sector Scorecard
82

Quarterly results of operations analysis (Q4)Q y f p y QSoftware & Internet
Revenue and gross margin trends were as follows:
Revenues (in $ millions) – Software & Internet Gross margin % – Software & Internet100%25 000
20%
40%
60%
80%
100%
5,000
10,000
15,000
20,000
25,000
0%Q4 2010 Q1 2011 Q2 2011 Q3 2011 Q4 2011
Amazon eBay GoogleMicrosoft Oracle SAPSymantec Yahoo!
0
,
Q4 2010 Q1 2011 Q2 2011 Q3 2011 Q4 2011
Amazon eBay GoogleMicrosoft Oracle SAPSymantec Yahoo!
• Revenue for all Software & Internet companies in the analysis improved both sequentially and y-o-y except for Yahoo! which recorded a negative y-o-y growth. Sales for most of the companies were positively impacted by the year-end holiday season. Amazon’s q-o-q revenue growth of 60.3% and y-o-y growth of 34.6% was affected by seasonality, which resulted in higher sales volume in the fourth quarter. eBay’s revenue grew by 35.5% y-o-y as GSI’s (which was acquired in June 2011) revenue increased disproportionately in the fourth quarter due to an increase in consumer purchases and advertising to consumers by businesses. Google benefited from both seasonal fluctuations in internet usage and traditional retail seasonality. Microsoft’s Entertainment and Device Division recorded high demand during the fourth quarter holiday shopping season Also the 4 7% y o y growth in revenue was due to strong sales in Server and Tools products Xbox 360 quarter holiday shopping season. Also the 4.7% y-o-y growth in revenue was due to strong sales in Server and Tools products, Xbox 360 and 2010 Microsoft Office. Oracle’s y-o-y growth in revenue was due to an increase in software business revenues resulting from growth in software license updates and product support revenues and new software license revenues. Symantec’s 6.9% y-o-y growth was due to an increase in Content, subscription, and maintenance revenues. SAP and Yahoo! registered a 25.8% and 8.8% sequential gain.
• Gross margin for Microsoft declined both sequentially and y-o-y due to higher costs associated with higher volumes of Xbox 360 consoles sold, increased Xbox royalty costs, payments made to Nokia related to joint strategic initiatives and increased costs associated with online offering including traffic acquisition costs Oracle registered an increase of 289 bps in y-o-y gross margin due to a decline in hardware
PwCTechnology Sector Scorecard
83
offering, including traffic acquisition costs. Oracle registered an increase of 289 bps in y-o-y gross margin due to a decline in hardware systems product costs. Gross margin for Amazon declined by 280 bps sequentially, while SAP had a 486 bps increase. Gross margin for eBay, Google, Symantec and Yahoo! was consistent with the prior quarters.

Quarterly results of operations analysis (Q4) continued Q y f p y QSoftware & Internet
R&D expenditure and net income trends were as follows:
R&D expenses (in $ millions) – Software & Internet Net income (in $ millions) – Software & Internet
3000
5000
7000
1,000
1,500
2,000
2,500
-1000
1000
Q4 2010 Q1 2011 Q2 2011 Q3 2011 Q4 2011
Amazon eBay GoogleMicrosoft Oracle SAP
0
500
Q4 2010 Q1 2011 Q2 2011 Q3 2011 Q4 2011
Amazon eBay GoogleMicrosoft Oracle SAP
• R&D expenses for Software & Internet companies increased y-o-y except for Oracle and Yahoo!. The increase was primarily due to higher employee related expenses and investments in technology priorities. A decline in Oracle’s R&D expenses was primarily due to decreases in certain legal costs and variable compensation expenses. Yahoo! registered a decline of 620 bps in y-o-y R&D expense.
• Net income increased sequentially for all companies except for SAP and Google whose net income declined by 8 6% and 0 9% respectively
Microsoft Oracle SAPSymantec Yahoo!
Microsoft Oracle SAPSymantec Yahoo!
• Net income increased sequentially for all companies except for SAP and Google whose net income declined by 8.6% and 0.9% respectively. eBay’s net income more than doubled when compared to the same period last year due to record revenues and high interest and other income. SAP also recorded significant y-o-y growth primarily due to the absence of provision for TomorrowNow litigation which was present last year. Symantec and Oracle registered y-o-y increases of 81.8% and 17.2% respectively, which is attributable to their growth in revenue. Despite high revenues, net income for Amazon declined by 57.5% y-o-y in the current quarter due to high operating expenses primarily driven by increased product and shipping costs. Microsoft and Yahoo! also registered marginal y-o-y decline in net income in the current quarter.
PwCTechnology Sector Scorecard
84
q

Quarterly results of operations analysis (Q4) continuedQ y f p y QSoftware & Internet
Receivables trends were as follows:
Days sales in receivables (DSO) – Software & Internet
6090
120150180
03060
Q4 2010 Q1 2011 Q2 2011 Q3 2011 Q4 2011
Amazon eBay Google Microsoft Oracle SAP Symantec Yahoo!
• Receivables and days sales in receivables (DSO) increased when compared to the last quarter for all Software & Internet companies in the analysis except for Google, which had a decline of 0.6 days in DSO. Oracle’s DSO declined when compared to its fiscal year end in May 2011 due to collection of large software license and software support balances which were outstanding as of May 2011 outstanding as of May 2011.
PwCTechnology Sector Scorecard
85
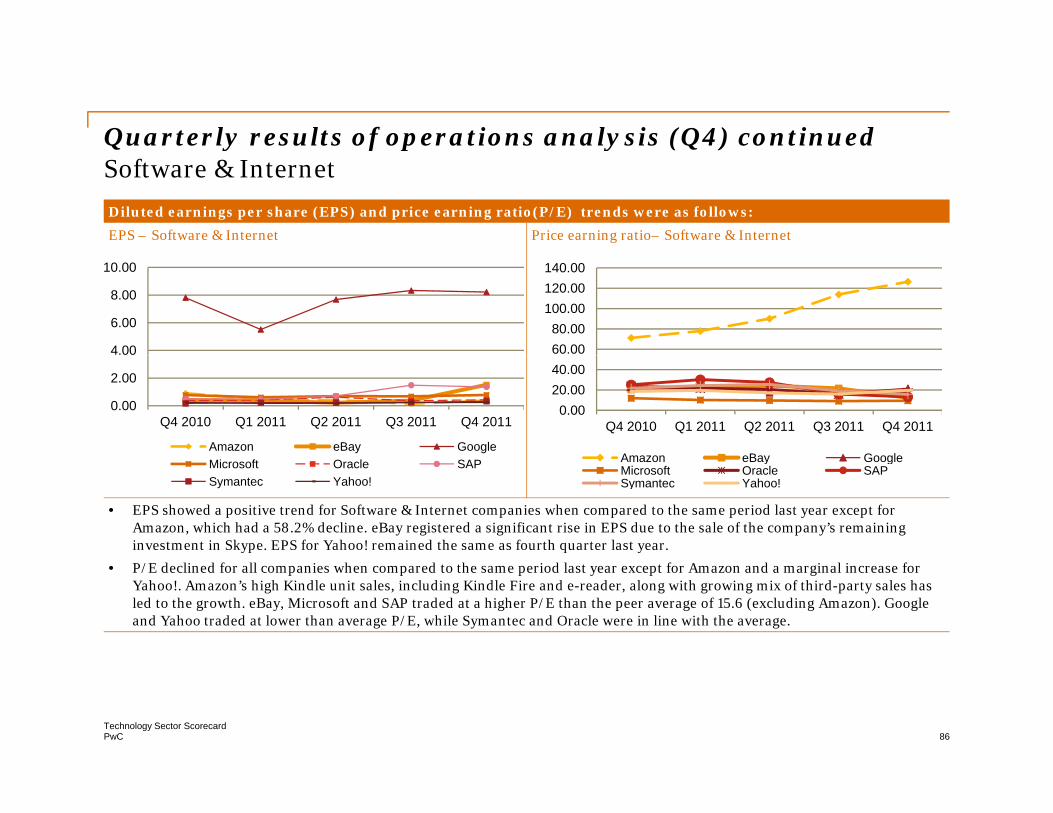
Quarterly results of operations analysis (Q4) continued Q y f p y QSoftware & Internet
Diluted earnings per share (EPS) and price earning ratio(P/E) trends were as follows:
EPS – Software & Internet Price earning ratio– Software & Internet
4.00
6.00
8.00
10.00
60.0080.00
100.00120.00140.00
0.00
2.00
Q4 2010 Q1 2011 Q2 2011 Q3 2011 Q4 2011
Amazon eBay Google
0.0020.0040.00
Q4 2010 Q1 2011 Q2 2011 Q3 2011 Q4 2011
Amazon eBay Google
• EPS showed a positive trend for Software & Internet companies when compared to the same period last year except for Amazon, which had a 58.2% decline. eBay registered a significant rise in EPS due to the sale of the company’s remaining investment in Skype. EPS for Yahoo! remained the same as fourth quarter last year.
Microsoft Oracle SAPSymantec Yahoo!
Amazon eBay GoogleMicrosoft Oracle SAPSymantec Yahoo!
• P/E declined for all companies when compared to the same period last year except for Amazon and a marginal increase for Yahoo!. Amazon’s high Kindle unit sales, including Kindle Fire and e-reader, along with growing mix of third-party sales has led to the growth. eBay, Microsoft and SAP traded at a higher P/E than the peer average of 15.6 (excluding Amazon). Google and Yahoo traded at lower than average P/E, while Symantec and Oracle were in line with the average.
PwCTechnology Sector Scorecard
86

Snapshot by subsectorSnapshot by subsector
Systems and PC Hardware
PwCTechnology Sector Scorecard
87

Market analysis ySystems and PC Hardware
• After two quarters of positive growth, worldwide PC shipments totaled 92.2 million units in the f h f % d li f h f h f Thi d l fourth quarter of 2011, a 1.4% decline from the fourth quarter of 2010. This was due to low consumer PC demand, which resulted in weak holiday PC shipments.1
• Analysts believe growth is limited for Dell due to its lower margin businesses and Hard Disk Drive (HDD) supply constraints. They also expect operating margins to decline to 7.7% in FY13 due to an
i i i i t i PC l d ith th b i d D ll d t IP aggressive pricing environment in PCs coupled with the server business and Dell-owned storage IP (two higher margin contributors) posting slower growth. Also, the transformation to a higher margin business requires investments in SG&A and R&D over the longer term.2
• Throughout 2011, EMC strengthened its technology leadership and services expertise in cloud ti d bi d t d d it titi l d d i d k t h N computing and big data, advanced its competitive lead and gained market share. Numerous
strategic initiatives contributed to these achievements, including sustained aggressive investment in research and development, totaling 11% of annual consolidated 2011 revenue.3
• Analysts believe that EMC will continue to broaden its reach, through organic growth, acquisitions d t hi Thi ill ll th t l it l di t i t h d and partnerships. This will allow the company to leverage its leading enterprise storage share and
its assets in virtualization, security, management and analytics as well as solidify its position as a leading data center infrastructure vendor in future.2
PwCTechnology Sector Scorecard
88
1. Gartner press release - Jan 20122. Credit Suisse - Feb 20123. EMC press release - Jan 2012

Market analysis continuedySystems and PC Hardware
• Hewlett-Packard (HP) retained its No. 1 position in PC shipments in the fourth quarter of 2011, despite a shipment decline of 16.2% year over year due to aggressive pricing from competitors and p p y y gg p g pweak consumer PC demand in the holiday season. HP led the industry in full-year 2011 as well, capturing 17.2% of the total market.1
• Analysts feel that HP must fight major battles in all its business units (with a relatively meager R&D budget) and there is no visibility on whether the company will attain sustainable growth. g ) y p y gRevamping the Services business will be the slowest as it is poorly positioned and requires investment in sales and services capability to move up the value chain. Challenges for the PC business segment include weak consumer demand, tablet substitution, HDD issues for at least another quarter, European exposure and more formidable competition. Also, the IPG (Imaging and Printing group) segment is in secular decline due to sharply lower supplies revenue declining unit Printing group) segment is in secular decline due to sharply lower supplies revenue, declining unit sales and a shrinking installed base.2
• IBM delivered outstanding results in all the four strategic initiatives for the quarter and the year, as it continued to realize the benefit of its long-term investments in growth markets, business analytics Smarter Planet solutions and cloud 3 Analysts expect IBM to continue benefiting from a analytics, Smarter Planet solutions and cloud.3 Analysts expect IBM to continue benefiting from a favorable product mix and EM growth.4
1. Gartner press release - Jan 2012
PwCTechnology Sector Scorecard
89
2. JP Morgan - Feb 20123. Press release - Jan 20124. Deutsche Bank - Jan 2012
Market analysis continuedySystems and PC Hardware
• IBM noted double-digit growth in outsourcing, transactional and maintenance businesses as well as broad-based strength in growth markets this quarter. Analysts feel that the key drivers of services g g q y ygrowth in 2012 will be: i) backlog ; ii) sales in the existing accounts; and iii) new contract signings.1
• The fourth quarter of 2011 was the 11th quarter in a row that Lenovo Group grew faster than the industry as a whole. For the ninth quarter in a row, the company grew faster than any of the top four PC manufacturers, attributable to Lenovo’s continued focus on balanced growth across all , ggeographies, customer segments and product lines.2
• Lenovo recorded its highest-ever worldwide market share of 14.0%, and its highest-ever market share in China at 35.3%, an increase of 3.7 and 3.1 share points year-over-year respectively in the fourth calendar quarter of 2011.2q
• Analysts are of the opinion that investors will contemplate whether or not the combined ACS-Xerox model can deliver sustained revenue, margin and cash flow growth. While both ACS and Xerox are well-run businesses, each faces its own set of secular challenges. Analysts believe that imaging/printing is a low priority in IT budgets, which means that in tough macro times the sector is likely to be hurt by spending cuts. In services, there is a downward trend related to renewals and discounting, which was seen in Xerox’s fourth quarter results.3
1 Credit Suisse - Jan 2012
PwCTechnology Sector Scorecard
90
1. Credit Suisse - Jan 2012 2. Lenovo press release - Feb 20123. JP Morgan - Jan 2012

Annual results of operations analysisSystems and PC HardwareRevenue and gross margin trends were as follows:
Revenues (in $ millions) – Systems and PC Hardware Gross margin % – Systems and PC Hardware
80,000
100,000
120,000
140,000
30 00%
40.00%
50.00%
60.00%
70.00%
-
20,000
40,000
60,000
Dell EMC HP IBM Lenovo Xerox0.00%
10.00%
20.00%
30.00%
Dell EMC HP IBM Lenovo Xerox
• Revenue for Systems and PC Hardware companies was higher in 2011 compared to 2010 except for HP ,whose revenue declined by 1.7% y-o-y. Lenovo recorded the highest growth of 28.2% in this sector due to an increase in unit shipments and its PC market share. Dell’s revenue was in line with last year. EMC’s growth of 17.6% was attributed primarily to the introduction of new products and products from EMC's Isilon, Data Domain and Avamar portfolios. IBM’s growth of 7.1% was led by solid Software and Services results. Services revenue for IBM grew by 9% due to strong demand for WebSphere, Tivoli and Info Management. Xerox’s 4.6% growth in revenue was driven by
2011 2010 2011 2010
g y 9 g p , g 4 g yincreased revenues in their Services segments, which grew by 12%, reflecting strong performance in BPO and DO services.
• Gross margin showed an improvement in 2011 except for HP and Xerox, which registered declines of 1.3 and 1.7 percentage points respectively. Dell had the highest increase, 3.7 percentage points, due to decreasing component costs, improving pricing discipline, better sales and supply chain execution in the products segment. The increase in the gross margin for EMC in 2011 compared to 2010 was attributable to the VMware Virtual Infrastructure segment, which increased the overall gross margins by 140 bps, and the Information Storage segment, which increased the overall gross margins by 124 bps. IBM’s gross margin was in line with the previous year. Lenovo
PwCTechnology Sector Scorecard
91
g g g g y p g g p ybenefited from the Group’s effective margin management, strong unit shipments growth, increased mix of the Think branded products and key component price benefits. Xerox’s decline was driven by the ramping of new services contracts, impact of lower contract renewals, transaction currency and mix of higher services revenue, which is a lower margin segment.

Annual results of operations analysis continuedf p ySystems and PC Hardware
R&D expenditure trends were as follows:
R&D expenses (in $ millions) – Systems and PC Hardware R&D expenses (% of revenue) – Systems and PC Hardware
4,000
5,000
6,000
7,000
6.00%
8.00%
10.00%
12.00%
-
1,000
2,000
3,000
Dell EMC HP IBM Lenovo Xerox0.00%
2.00%
4.00%
Dell EMC HP IBM Lenovo Xerox
• R&D expenses showed a positive trend in 2011 for all companies except for Xerox. EMC’s R&D expenses increased by $261.8 million in 2011 primarily due to an increase in personnel-related costs, including stock-based compensation, cost of facilities, depreciation expenses and travel costs. IBM’s R&D expenses improved by 3.8 percentage points. Lenovo registered the highest growth in R&D expenses,43.1%, in 2011. R&D expenses for Xerox were lower by US$60 million in 2011, reflecting the impact of restructuring and productivity i t
2011 2010 2011 2010
improvements.
• R&D expenses as a percentage of revenue for System and PC Hardware companies were in line with the prior year. R&D as a percentage of revenue for Xerox had a marginal decline of 42 bps due to lower spending and also because of a positive mix impact of the continued growth in Services revenue, which historically has a lower R&D as a percentage of revenue.
PwCTechnology Sector Scorecard
92

Annual results of operations analysis continuedf p ySystems and PC Hardware
Inventory and receivables trends were as follows:
Days inventory on hand – Systems and PC Hardware Days sales in receivables – Systems and PC Hardware
30
40
50
5060 70 80 90
100 110
-
10
20
Dell EMC HP IBM Lenovo Xerox-
10 20 30 40 50
Dell EMC HP IBM Lenovo Xerox
• Days inventory on hand increased marginally for all companies in 2011 compared to 2010 except for Xerox.
• Receivables declined marginally across all the companies in the analysis, except for Lenovo whose DSO increased by 8 days .
Dell EMC HP IBM Lenovo Xerox
2011 2010
Dell EMC HP IBM Lenovo Xerox
2011 2010
PwCTechnology Sector Scorecard
93

Annual results of operations analysis continued f p ySystems and PC Hardware
Earnings per share (EPS) and market capitalization trends were as follows:
EPS ($) – Systems and PC Hardware Market cap (in $ millions) – Systems and PC Hardware
9 00
12.00
15.00
200,000
250,000
300,000
0 00
3.00
6.00
9.00
-
50,000
100,000
150,000
• EPS increased for all the companies in 2011 compared to 2010 except for HP. Dell’s EPS increased by 35% due to higher net income. EPS for Xerox increased significantly in 2011 primarily attributable to an increase in revenue and a favorable tax rate.
0.00
Dell EMC HP IBM Lenovo Xerox2011 2010
Dell EMC HP IBM Lenovo Xerox2011 2010
• Market cap for Dell, IBM and Lenovo improved in 2011 when compared to 2010. HP’s market cap registered a significant fall and EMC and Xerox also recorded declines.
PwCTechnology Sector Scorecard
94

Q4 & Q3 performance Q Q p fSystems and PC Hardware
Company Q4 2011
Revenue($ millions)
Grossmargin (%)
Net income/(loss) ($ millions)
EPS ($) Market cap ($ millions)($ millions) margin (%) ($ millions) ($ millions)
Dell 16,031 21.12% 764 0.43 31,435EMC 5,574 63.21% 832 0.38 44,133HP 30,036 22.38% 1,468 0.73 55,40030,036 22.38% 1,468 0.73 55,400IBM 29,486 49.93% 5,490 4.62 213,301Lenovo 8,372 11.40% 153 0.01 135,807Xerox 5,964 33.17% 375 0.26 10,645
Company Q3 2011
Revenue($ millions)
Grossmargin (%)
Net income/(loss) ($ millions)
EPS ($) Market cap ($ millions)
Dell 15,365 22.58% 893 0.49 29,756 EMC 4,980 61.57% 606 0.27 42,819 HP 32,122 21.14% 239 0.12 52,873 IBM 26,157 46.54% 3,839 3.19 212,576 L
PwCTechnology Sector Scorecard
95
Lenovo 7,786 12.17% 145 0.01 136,644 Xerox 5,583 33.75% 320 0.22 9,668
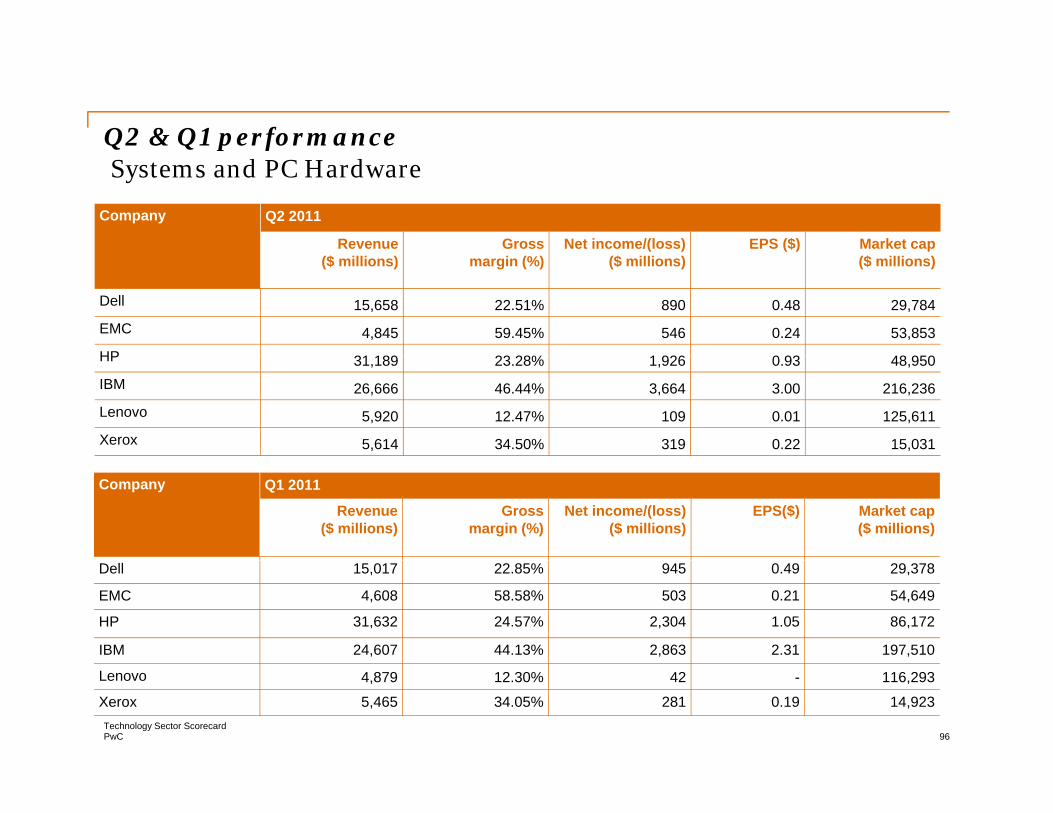
Q2 & Q1 performanceQ Q p fSystems and PC Hardware
Company Q2 2011
Revenue Gross Net income/(loss) EPS ($) Market cap ($ millions) margin (%) ($ millions) ($ millions)
Dell 15,658 22.51% 890 0.48 29,784EMC 4,845 59.45% 546 0.24 53,853HP 31 189 23 28% 1 926 0 93 48 950HP 31,189 23.28% 1,926 0.93 48,950IBM 26,666 46.44% 3,664 3.00 216,236Lenovo 5,920 12.47% 109 0.01 125,611Xerox 5,614 34.50% 319 0.22 15,031
Company Q1 2011
Revenue($ millions)
Grossmargin (%)
Net income/(loss) ($ millions)
EPS($) Market cap ($ millions)
Dell 15,017 22.85% 945 0.49 29,378
EMC 4,608 58.58% 503 0.21 54,649
HP 31,632 24.57% 2,304 1.05 86,172
IBM 24,607 44.13% 2,863 2.31 197,510
PwCTechnology Sector Scorecard
96
Lenovo 4,879 12.30% 42 - 116,293
Xerox 5,465 34.05% 281 0.19 14,923

Quarterly results of operations analysis (Q4)Q y f p y QSystems and PC HardwareRevenue and gross margin trends were as follows:
Revenues (in $ millions) – Systems and PC Hardware Gross margin % – Systems and PC Hardware
16,000
24,000
32,000
40,000
30%
45%
60%
75%
0
8,000
Q4 2010 Q1 2011 Q2 2011 Q3 2011 Q4 2011
Dell EMC HP
0%
15%
Q4 2010 Q1 2011 Q2 2011 Q3 2011 Q4 2011
Dell EMC HP
• Revenues for System & PC Hardware companies registered a sequential increase except for HP, whose revenues declined both q-o-q and y-o-y. Dell’s growth in revenue was marked by the company’s further expansion as an enterprise solutions and services provider. Dell Services revenue grew 12% to $2.2 billion and represented 14% of Dell’s business. EMC’s revenue improved by 14% y-o-y, with revenue from Information Storage, Symmetrix storage product and VMware increasing by 12%, 11% and 27% respectively. Revenues for HP were down by 7.0% y-o-y due to a decline of 4.0% in its commercial businesses and a decline of 23.0% in its consumer businesses (within
IBM Lenovo Xerox IBM Lenovo Xerox
personal systems group and imaging & printing group). Lenovo had record highs in quarterly sales, which grew by 44.1% y-o-y. Theincreased sales were attributed to growth of the Laptop PC business by 30%, desktop PC by 32% and feature phone shipment by 26%.Xerox’s y-o-y revenue was flat, at US$6 billion. Although its revenue from services business was up 6%, the revenue from its technology business was down 5%.
• Gross margin showed a mixed trend. Gross margin for EMC grew y-o-y by 254 bps, while it declined for HP and Xerox by 206 bps and 144 bps respectively. Dell’s gross margin declined by 146 bps sequentially due to HDD supply constraints, negative mix, soft Public results and i k d f i h G i f IBM i d b b l f i d ff
PwCTechnology Sector Scorecard
97
inventory work down from previous-gen phones. Gross margin for IBM improved by 339 bps q-o-q as a result of a continued effort to reduce costs, improve productivity and drive mix towards higher services offerings. The decline in Xerox’s margin was driven by the ramping of new services contracts, the impact of lower contract renewals from prior periods and the higher mix of Services revenue.
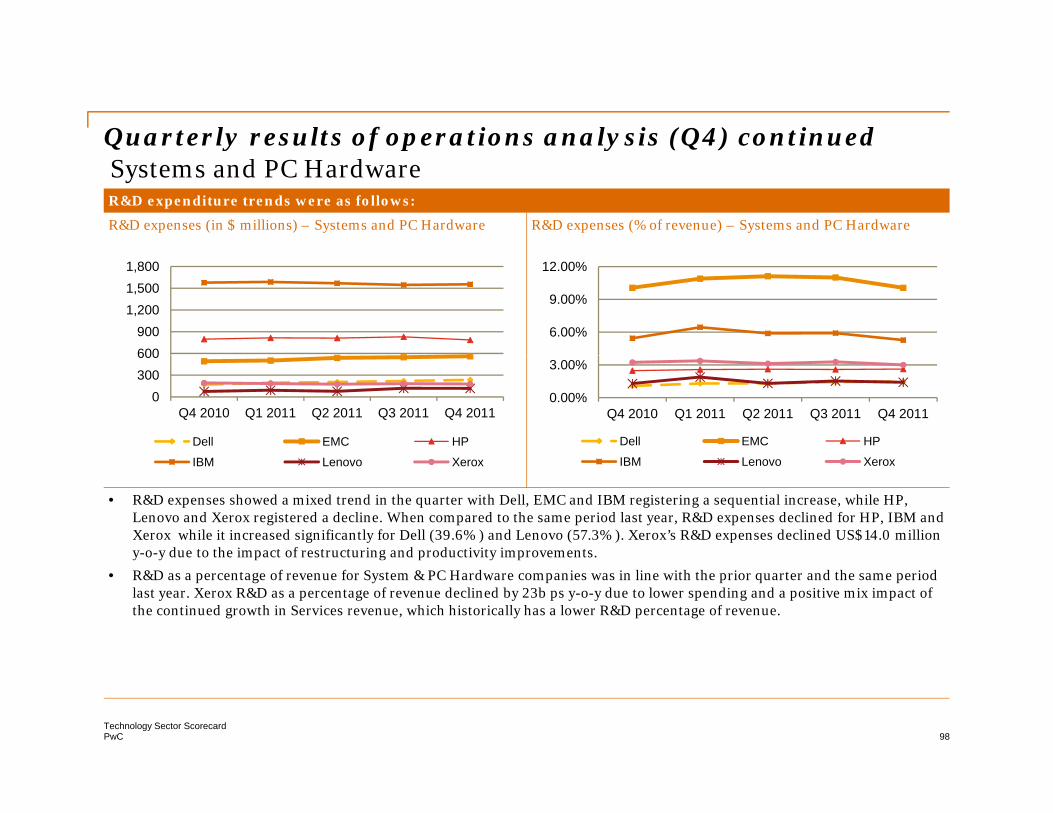
Quarterly results of operations analysis (Q4) continued Q y f p y QSystems and PC HardwareR&D expenditure trends were as follows:
R&D expenses (in $ millions) – Systems and PC Hardware R&D expenses (% of revenue) – Systems and PC Hardware
600900
1,2001,5001,800
6.00%
9.00%
12.00%
0300600
Q4 2010 Q1 2011 Q2 2011 Q3 2011 Q4 2011
Dell EMC HP
IBM L X
0.00%
3.00%
Q4 2010 Q1 2011 Q2 2011 Q3 2011 Q4 2011
Dell EMC HP
IBM L X
• R&D expenses showed a mixed trend in the quarter with Dell, EMC and IBM registering a sequential increase, while HP, Lenovo and Xerox registered a decline. When compared to the same period last year, R&D expenses declined for HP, IBM and Xerox while it increased significantly for Dell (39.6% ) and Lenovo (57.3% ). Xerox’s R&D expenses declined US$14.0 million y-o-y due to the impact of restructuring and productivity improvements.
IBM Lenovo Xerox IBM Lenovo Xerox
• R&D as a percentage of revenue for System & PC Hardware companies was in line with the prior quarter and the same period last year. Xerox R&D as a percentage of revenue declined by 23b ps y-o-y due to lower spending and a positive mix impact of the continued growth in Services revenue, which historically has a lower R&D percentage of revenue.
PwCTechnology Sector Scorecard
98

Quarterly results of operations analysis (Q4) continuedQ y f p y QSystems and PC Hardware
Inventory and receivable trends were as follows:
Days inventory on hand – Systems and PC Hardware Days sales in receivables – Systems and PC Hardware
30
40
50
60
70
95
120
0
10
20
Q4 2010 Q1 2011 Q2 2011 Q3 2011 Q4 201120
45
Q4 2010 Q1 2011 Q2 2011 Q3 2011 Q4 2011
• Days inventory on hand declined sequentially for all the companies in the analysis except for HP, which had a marginal increase of 1 day in the current quarter. When compared to the same period last year, the companies showed an upward trend. EMC recorded the highest y-o-y increase from 40 days in Q4 2010 to 44 days in Q4 2011.
Dell EMC HPIBM Lenovo Xerox
Dell EMC HPIBM Lenovo Xerox
• Days sales in receivables (DSO) declined sequentially for all companies except for IBM which had an increase of 4 days in DSO. Xerox had the largest decline and its DSO decreased from 48 days in Q3 2011 to 39 days in the current quarter. Dell and Xerox had a y-o-y decline of 3 days and HP and IBM had an increase of 3 days.
PwCTechnology Sector Scorecard
99

Quarterly results of operations analysis (Q4) continuedQ y f p y QSystems and PC HardwareEPS and market capitalization trends were as follows:
EPS ($)– Systems and PC Hardware Market cap (in $ millions) – Systems and PC Hardware
5 00 250 000
2.00
3.00
4.00
5.00
100,000
150,000
200,000
250,000
-1.00
0.00
1.00
Q4 2010 Q1 2011 Q2 2011 Q3 2011 Q4 2011
-
50,000
,
Q4 2010 Q1 2011 Q2 2011 Q3 2011 Q4 2011
Dell EMC HP
• EPS increased sequentially for all companies in the analysis except for Dell. EPS for HP had a significant increase q-o-q , but declined by 37.6% when compared to the same period last year. The decline in HP’s EPS was due to lower revenues and lower earnings from operations in the current quarter. EPS for Xerox more than doubled this quarter compared to last year due to lower operating expenses as the company benefited from its previously undertaken productivity and restructuring measures.
Dell EMC HPIBM Lenovo Xerox
Dell EMC HPIBM Lenovo Xerox
p g p p y p y p y g
• Market capitalization for Systems and PC Hardware companies improved sequentially except for Lenovo, which registered a marginal decline due to lower share prices.
PwCTechnology Sector Scorecard
100

Quarterly results of operations analysis (Q4) continuedQ y f p y QSystems and PC Hardware
Price/Earning ratio trends were as follows:
Price/Earning multiples – Systems and PC Hardware
200 0250.0 300.0 350.0 400.0 450.0 500.0
15.00
20.00
25.00
30.00
35.00
-50.0 100.0 150.0 200.0
0.00
5.00
10.00
15.00
Q4 2010 Q1 2011 Q2 2011 Q3 2011 Q4 2011
• The Price/Earning (P/E) multiple contracted sequentially for all the companies in the analysis except for Dell and HP. IBM’s P/E declined by 1.9% q-o-q. Analysts had a retain price target of $175 for IBM as well as a neutral rating, given its decelerating revenue growth in both Hardware and Software, and record margins in Services.
Lenovo (BAR)* Dell Inc EMC Corp. HP IBM Xerox
• Investors are skeptical on the growth potential for HP and Dell as their market share continues to fall and hence they recorded lower than average P/E(12.35, calculated excluding Lenovo).
PwCTechnology Sector Scorecard
101
* P/E ratio of Lenovo is shown in bar chart as it is significantly higher than the rest of the companies.

Snapshot by subsectorSnapshot by subsectorCleanTech
PwCTechnology Sector Scorecard
102
Market analysis yCleanTech
• It is believed that there will be sufficient late-stage capital in the next few years to feed the ’06-’08 “baby boom” of CleanTech start-ups, but there may be a corresponding dearth of seed money. Compared with VC overall the two are performing about the same on an interim basis and Compared with VC overall, the two are performing about the same on an interim basis and CleanTech investment has actually over-delivered on IPOs. 1
• A 23% Q-o-Q rise in the Q4’11 European photovoltaic market has created short-term optimism in the industry, which has been amplified by the slowdown in module price decline over the past month However the Q4’11 demand boom will accelerate the tightening of PV incentive policies that month. However, the Q4 11 demand boom will accelerate the tightening of PV incentive policies that is gripping Europe, most notably in the key German market and most recently in Spain with the announcement of a moratorium on new renewable energy plants.2
• First Solar announced or completed the sale of four of the world's largest solar projects under construction — Agua Caliente Desert Sunlight Antelope Valley Solar Ranch One and Topaz The construction — Agua Caliente, Desert Sunlight, Antelope Valley Solar Ranch One and Topaz. The company also reduced the average module manufacturing cost to $0.73 per watt, down $0.02 from the fourth quarter of 2010.
• SunPower Corp. expects R&D activities to increase as they emphasize continued improvement of solar cell efficiency and LCOE performance through enhancement of existing products solar cell efficiency and LCOE performance through enhancement of existing products, development of new products and reduction of manufacturing cost and complexity. The company is further working with its suppliers and partners along all steps of the value chain to reduce costs by improving manufacturing technologies and expanding economies of scale.
PwCTechnology Sector Scorecard
103
1. gigaom.com - Dec 20112. Solarbuzz - Jan 2011

Annual results of operations analysis f p yCleanTechRevenue and gross margin trends were as follows:
Revenues (in $ millions) – CleanTech Gross margin % – CleanTech
4,000 60 00%
2,000
3,000
30.00%
45.00%
60.00%
-
1,000
First Solar Sunpower Suntech Power*
0.00%
15.00%
First Solar Sunpower Suntech Power*
• First Solar net sales increased by 8% y-o-y in 2011. The marginal increase was due to lower demand of systems segment products. During 2011, the majority of First Solar’s systems business sales (systems business , through which the company provides PV solar power system, which includes project development, EPC services, O&M services and project finance, when required) were generated in North America. Lower demand from Europe adversely affected both revenue and production
ili i f Fi S l S P i d b % d i b h i d d f h US Th
2011 2010 2011 2010
utilization rates for First Solar. SunPower revenue increased by 4% y-o-y, driven by growth in demand from the US. The revenue for Suntech Power increased by 36% in 3Q end LTM basis.
• Gross margin was down for First Solar primarily due to lower module average selling prices and decreased government subsidies. Margin was also subject to competitive pressures. SunPower’s gross margin decreased significantly, from 22.9% in 2010 to 9.9% in 2011, due to lower average selling prices for solar power products and the types of projects in progress. Product mix, actual manufacturing costs and the utilization rate of solar cell manufacturing facilities also led to margin
PwCTechnology Sector Scorecard
104
oduct , actua a u actu g costs a d t e ut at o ate o so a ce a u actu g ac t es a so ed to a g pressures. Suntech Power’s gross margins also dropped from 19.5% to 13.2%.
*Suntech annual numbers were derived as LTM from the 3Q end for both 2011 and 2010.

Annual results of operations analysis continuedf p yCleanTech
R&D expenditure trends were as follows:
R&D expenses (in $ millions) – CleanTech R&D expenses (% of revenue) – CleanTech
90
120
150
3 00%
4.00%
5.00%
6.00%
-
30
60
0.00%
1.00%
2.00%
3.00%
• First Solar’s sharp increase in R&D expenses was led by the depreciation charged to R&D expenditure for the acquisition of equipment for general use in further process developments. The majority of research and development expenses are
ib bl h Thi i l h d i f d l f l d l hi h
First Solar Sunpower Suntech Power*
2011 2010
First Solar Sunpower Suntech Power*
2011 2010
attributable to the components segment. This segment involves the design, manufacture and sale of solar modules which convert sunlight into electricity. R&D expenses for SunPower increased to $57.8 million from $49.1 million in 2010. The overall increase in investment in R&D period over period resulted primarily from costs related to the improvement of current-generation solar cell manufacturing technology, the development of next-generation solar cells, solar panels, trackers and rooftop systems and the development of systems performance monitoring products.
• R&D as a percentage of revenue in 2011 increased for all companies vis-a-vis 2010. This was caused by lower revenues,
PwCTechnology Sector Scorecard
105
R&D as a percentage of revenue in 2011 increased for all companies vis a vis 2010. This was caused by lower revenues, compounded with higher R&D expenses to catch up to the rapid change in technology.
*Suntech annual numbers were derived as LTM from the 3Q end for both 2011 and 2010.

Annual results of operations analysis continued f p yCleanTech
Inventory and receivables trends were as follows:
Days inventory on hand – CleanTech Days sales in receivables – CleanTech
60 70 80 90
100 110
6070 80 90
100 110 120
-10 20 30 40 50
-10 20 30 40 50 60
• First Solar’s Days inventory on hand increased by 43 days due to lower sales in 2011 compared to 2010. Lower demand from Germany and the rest of Europe was a major cause of concern. SunPower recorded higher inventories in 2011, which was in line with its growth in production. Limitedcompetition among suppliers, requiring the company in some instances to enter into long term firm commitment to supply agreements resulted in excess inventory
First Solar Sunpower Suntech Power*2011 2010
First Solar Sunpower Suntech Power*2011 2010
into long-term, firm commitment to supply agreements, resulted in excess inventory .
• Days sales outstanding/receivables (DSO) increased significantly for First Solar and Suntech Power in 2011 vis-à-vis 2010. SunPower's DSO was relatively flat at 60.76 days.
*Suntech annual numbers were derived as LTM from the 3Q end for both 2011 and 2010.
PwCTechnology Sector Scorecard
106
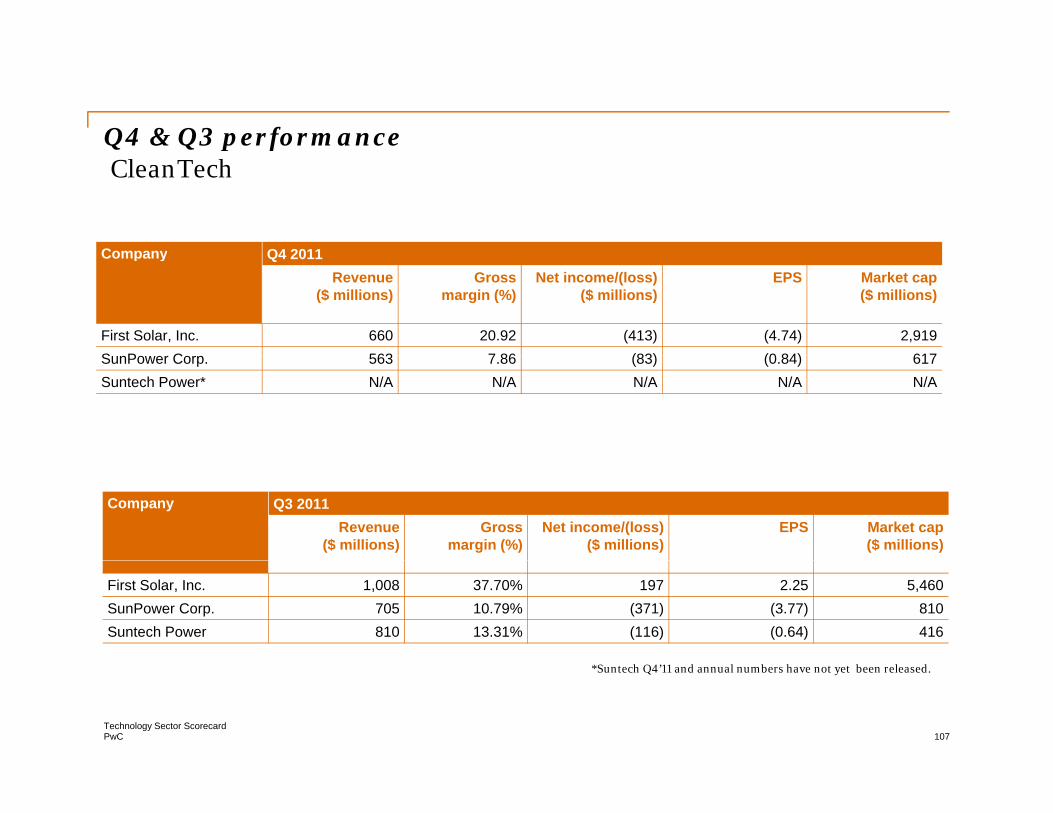
Q4 & Q3 performanceQ Q p fCleanTech
Company Q4 2011Company Q4 2011Revenue
($ millions)Gross
margin (%)Net income/(loss)
($ millions)EPS Market cap
($ millions)
First Solar, Inc. 660 20.92 (413) (4.74) 2,919S P C 563 7 86 (83) (0 84) 617SunPower Corp. 563 7.86 (83) (0.84) 617Suntech Power* N/A N/A N/A N/A N/A
Company Q3 2011Revenue
($ millions)Gross
margin (%)Net income/(loss)
($ millions)EPS Market cap
($ millions)
First Solar, Inc. 1,008 37.70% 197 2.25 5,460SunPower Corp. 705 10.79% (371) (3.77) 810Suntech Power 810 13.31% (116) (0.64) 416
PwCTechnology Sector Scorecard
107
*Suntech Q4’11 and annual numbers have not yet been released.

Q2 & Q1 performanceQ Q p fCleanTech
Company Q2 2011Company Q2 2011Revenue
($ millions)Gross
margin (%)Net income/(loss)
($ millions)EPS Market cap
($ millions)
First Solar, Inc. 533 36.56% 61 0.70 11,414SunPower Corp 592 3 26% (148) (1 51) 1 516SunPower Corp. 592 3.26% (148) (1.51) 1,516Suntech Power 831 4.06% (260) (1.44) 1,418
Company Q1 2011Revenue
($ millions)Gross
margin (%)Net income/(loss)
($ millions)EPS Market cap
($ millions)
First Solar, Inc. 567 45.77% 116 1.33 13,843SunPower Corp. 451 19.61% (2) (0.02) 1,728Suntech Power 877 19.03% 32 0.17 1,776
PwCTechnology Sector Scorecard
108
.

Quarterly results of operations analysis (Q4)
Revenue and gross margin trends were as follows:
Revenues (in $ millions) – CleanTech Gross margin % – CleanTech
Q y f p y QCleanTech
1 250 60 00%
500
750
1,000
1,250
30.00%
45.00%
60.00%
0
250
Q4 2010 Q1 2011 Q2 2011 Q3 2011 Q4 20110.00%
15.00%
Q4 2010 Q1 2011 Q2 2011 Q3 2011 Q4 2011
• Revenues for First Solar dropped sharply by 34.3% q-o-q, primarily due to the timing of revenue recognition in the systems business and lower volume for module-only sales. The revenue for SunPower Corp also decreased by 20.13%, due to significantly lower revenues from the Utility and Power Plant segment. Revenues for both the companies were impacted by
First Solar, Inc. SunPower Corp. Suntech Power* First Solar, Inc. SunPower Corp. Suntech Power*
g y y g p p ylower average selling price. Foreign exchange translation adjustments also led to reporting of lower revenue numbers for both the companies.
• Gross margin declined by 27.7 percentage points y-o-y for First Solar. This was primarily due to a decline in module ASP, higher costs of sales and diminishing subsidies. SunPower’s gross margin decreased by 17.5 percentage points y-o-y. This was due to the decrease of gross margin across all segments, led by a significant drop in Utility and Power Plant segment. Gross margin also declined due to reduced ASPs of solar products and increased mix of lower margin third party panels
PwCTechnology Sector Scorecard
109
margin also declined due to reduced ASPs of solar products and increased mix of lower margin third-party panels.
*Suntech Q4’11 and annual numbers have not yet been released.
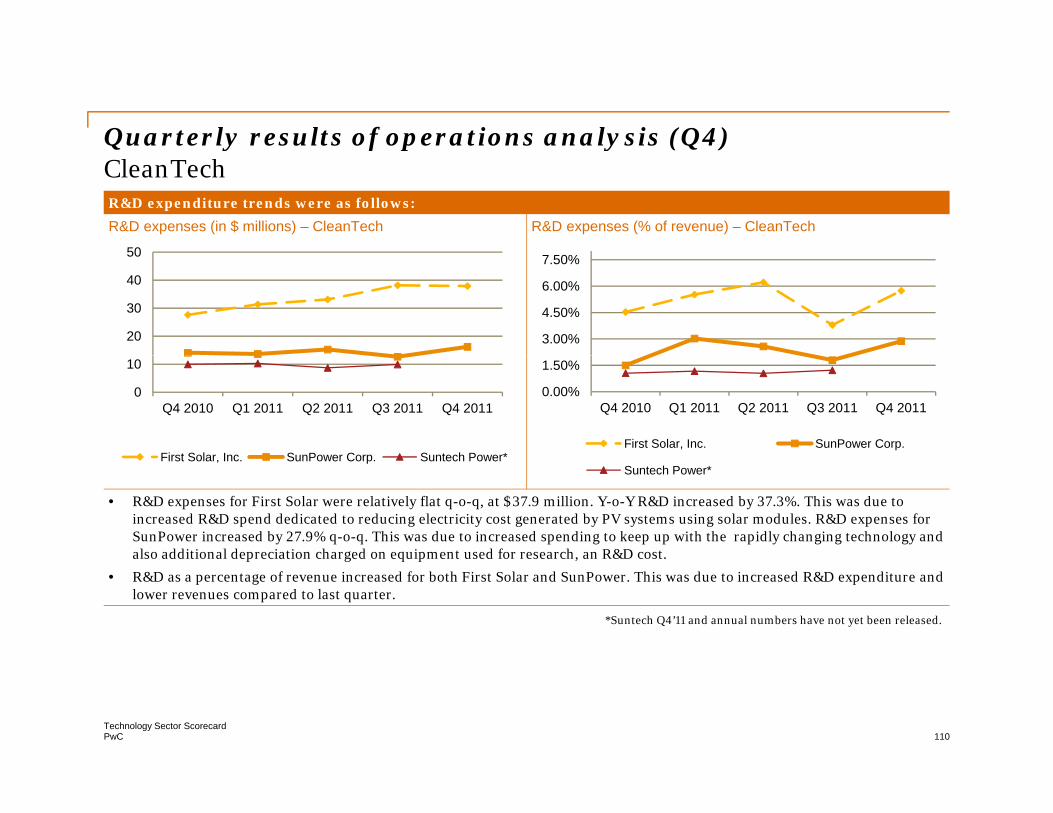
Quarterly results of operations analysis (Q4) Q y f p y QCleanTechR&D expenditure trends were as follows:
R&D expenses (in $ millions) – CleanTech R&D expenses (% of revenue) – CleanTech
50
20
30
40
50
3.00%
4.50%
6.00%
7.50%
0
10
Q4 2010 Q1 2011 Q2 2011 Q3 2011 Q4 2011
First Solar Inc SunPower Corp Suntech Power*
0.00%
1.50%
Q4 2010 Q1 2011 Q2 2011 Q3 2011 Q4 2011
First Solar, Inc. SunPower Corp.
• R&D expenses for First Solar were relatively flat q-o-q, at $37.9 million. Y-o-Y R&D increased by 37.3%. This was due to increased R&D spend dedicated to reducing electricity cost generated by PV systems using solar modules. R&D expenses for SunPower increased by 27.9% q-o-q. This was due to increased spending to keep up with the rapidly changing technology and also additional depreciation charged on equipment used for research, an R&D cost.
First Solar, Inc. SunPower Corp. Suntech PowerSuntech Power*
p g q p ,
• R&D as a percentage of revenue increased for both First Solar and SunPower. This was due to increased R&D expenditure and lower revenues compared to last quarter.
*Suntech Q4’11 and annual numbers have not yet been released.
PwCTechnology Sector Scorecard
110
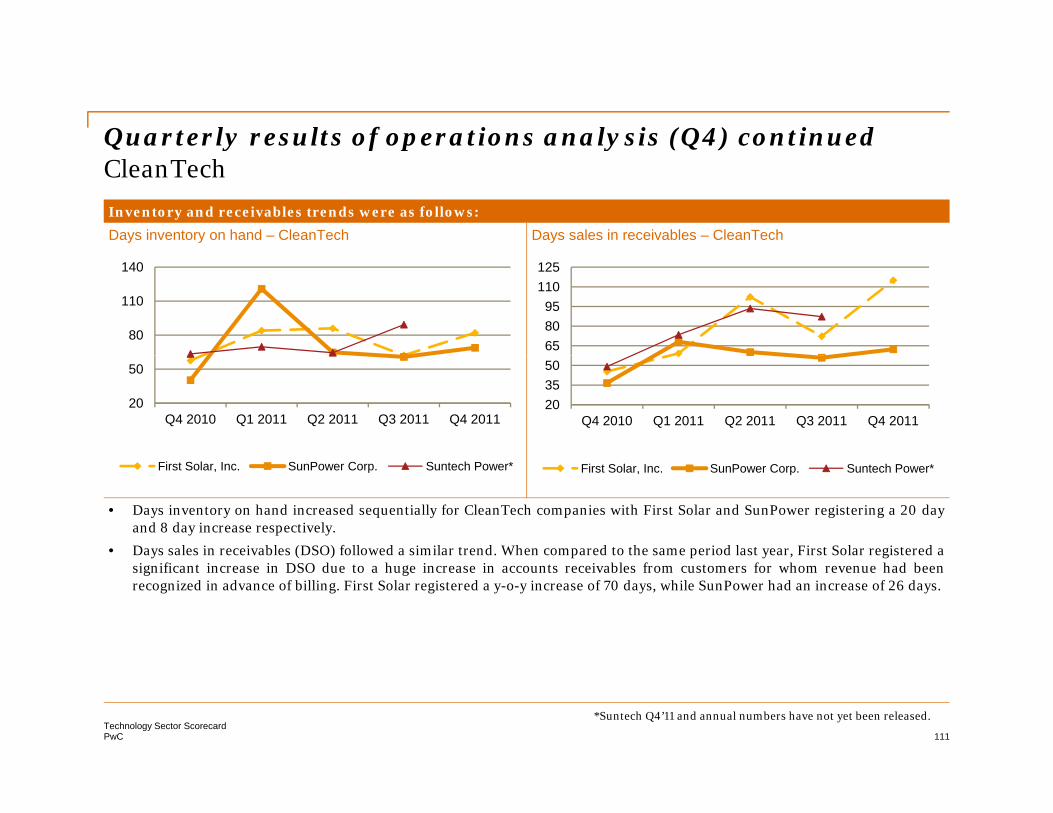
Quarterly results of operations analysis (Q4) continuedQ y f p y QCleanTech
Inventory and receivables trends were as follows:
Days inventory on hand – CleanTech Days sales in receivables – CleanTech
80
110
140
658095
110125
20
50
Q4 2010 Q1 2011 Q2 2011 Q3 2011 Q4 2011203550
Q4 2010 Q1 2011 Q2 2011 Q3 2011 Q4 2011
• Days inventory on hand increased sequentially for CleanTech companies with First Solar and SunPower registering a 20 dayand 8 day increase respectively.
• Days sales in receivables (DSO) followed a similar trend. When compared to the same period last year, First Solar registered a
First Solar, Inc. SunPower Corp. Suntech Power* First Solar, Inc. SunPower Corp. Suntech Power*
significant increase in DSO due to a huge increase in accounts receivables from customers for whom revenue had beenrecognized in advance of billing. First Solar registered a y-o-y increase of 70 days, while SunPower had an increase of 26 days.
PwCTechnology Sector Scorecard
111
*Suntech Q4’11 and annual numbers have not yet been released.

Methodologygy
• We analyzed a selection of the largest technology companies included in h S&P i d l i
We analyzed technology companies that operate predominantly within the following sectors:
the S&P 500 index, a selection of large international technology companies that regularly report financial results and a selection of promising CleanTech companies.
• Communications
• Consumer Electronics
• EMS/Distributors
• Semiconductorsp
• In order to present the information by calendar year or calendar quarter, the financial information for companies with non-calendar years or quarters was i l d d i h l d
• Software & Internet
• Systems and PC Hardware
• CleanTech
included in the nearest calendar year or quarter.
PwCTechnology Sector Scorecard
112
Technology industry leadersRaman ChitkaraGlobal Technology LeaderPhone: +1 408 817 3746Email: [email protected]
Rod Dring – Australia Werner Ballhaus – Germany Greg Unsworth – SingaporePhone: 61 2 8266 7865Email: [email protected]
Phone: 49 211 981 5848Email: [email protected]
Phone: 65 6236 3738Email: [email protected]
Estela Vieira – Brazil Hari Rajagopalachari – India Douglas Mahony – UAEj g p g yPhone: 55 1 3674 3802Email: [email protected]
Phone: 91 80 4079 002Email: [email protected]
Phone: 97 1 43043151 Email: [email protected]
Christopher Dulny– Canada Akihiko Nakamura– Japan Jass Sarai – UKPhone: +416 869 2355 Phone: 81 3 5427 6555 Phone: 44 0 1895 52 2206Email: [email protected] Email: [email protected] Email: [email protected]
Alison Wong – China Hoonsoo Yoon – Korea Tom Archer– USPhone: 86 21 2323 2551Email: [email protected]
Phone: 82 2 709 0201Email: [email protected]
Phone: 1 408 817 3836Email: [email protected]
Xavier Cauchois – France Ilja Linnemeijer– The NetherlandsPhone: 33 1 5657 10 33Email: [email protected]
Phone: 31 88 792 4956Email: [email protected]
PwCTechnology Sector Scorecard
113
For questions or comments, please contact:
Raman Chitkara Jan AkersGl b l T h l L d Gl b l T h l M k tiGlobal Technology LeaderPhone: +1 408 817 3746Email: [email protected]
Global Technology MarketingPhone: +1 408 817 4449Email: [email protected]
PwCTechnology Sector Scorecard
114

We exercised reasonable professional care and diligence in the collection, processing and reporting of this information. However, the data used is from third-party sources and PricewaterhouseCoopers has not independently verified, validated or audited the data. PricewaterhouseCoopers makes no representations or warranties with respect to the accuracy of the information, nor whether it is suitable for the purposes to which it is put by users.
PricewaterhouseCoopers shall not be liable to any user of this report or to any other person or entity for any inaccuracy of this information or any errors or omissions in its content, regardless of the cause of such inaccuracy, error or omission. Furthermore, in no event shall PricewaterhouseCoopers be liable for consequential, incidental or punitive damages to any person or entity for any matter relating to this information.
© 2012 PricewaterhouseCoopers LLP. All rights reserved. In this document, “PwC” refers to PricewaterhouseCoopers LLP, which is a member firm of PricewaterhouseCoopers International Limited, each member firm of which is a separate legal entity.